owever, the pandemic hasn’t proven to be the financial
TRANSCRIPT
FUNDING AND ACHIEVEMENT SUBCOMMITTEE
June 9, 2021
Docket Item #: 3.0
Docket Item:
Financial Outlook – Averting Disaster
Summary:
The pandemic did not turn out to be the widely feared financial disaster anticipated a year ago. It
disproportionally affected lower-income and underrepresented populations. Community colleges saw
steep enrollment drops while universities lost relatively few. State and local funding proved more
resilient than expected with federal revenue providing much needed support. However, the lingering
effects are only now taking shape.
Docket Material:
Early on during the pandemic, heavy financial losses and college closures were forecasted. Many
stakeholders were predicting various scenarios from minimal disruption to doomsday. These included
massive student refunds, substantial added expenditures, double-digit declines in tax, tuition and other
revenues, and the potential for students to second-guess their higher education plans altogether.
However, the pandemic hasn’t proven to be the financial disaster that was widely anticipated. Why is
that? How did higher education elude disaster and will the pandemic have a lasting impact on the
institutions?
Some of the prophecies were not entirely off base.
During an average year, eight to fourteen institutions close around the nation. Eleven shut down in
2020. Many institutions suffered revenue losses averaging 14%.1 Also, higher education employment
fell by 13%, wiping out more than a decade of employment increases according to US Department of
Labor data.2
1 Gardner, Lee. Why Doomsday Hasn’t Happened. The Chronicle of Higher Education. May 11, 2021. 2 Bauman, Dan. A Brutal Tally: Higher Ed Lost 650,000 Jobs Last Year. The Chronicle of Higher Education. February 5, 2021.

FUNDING AND ACHIEVEMENT SUBCOMMITTEE
June 9, 2021
Docket Item #3.0
2
How did institutions of higher education cope financially?
The federal government provided billions in relief while state and local revenues, mostly
property taxes, showed unexpected strength.
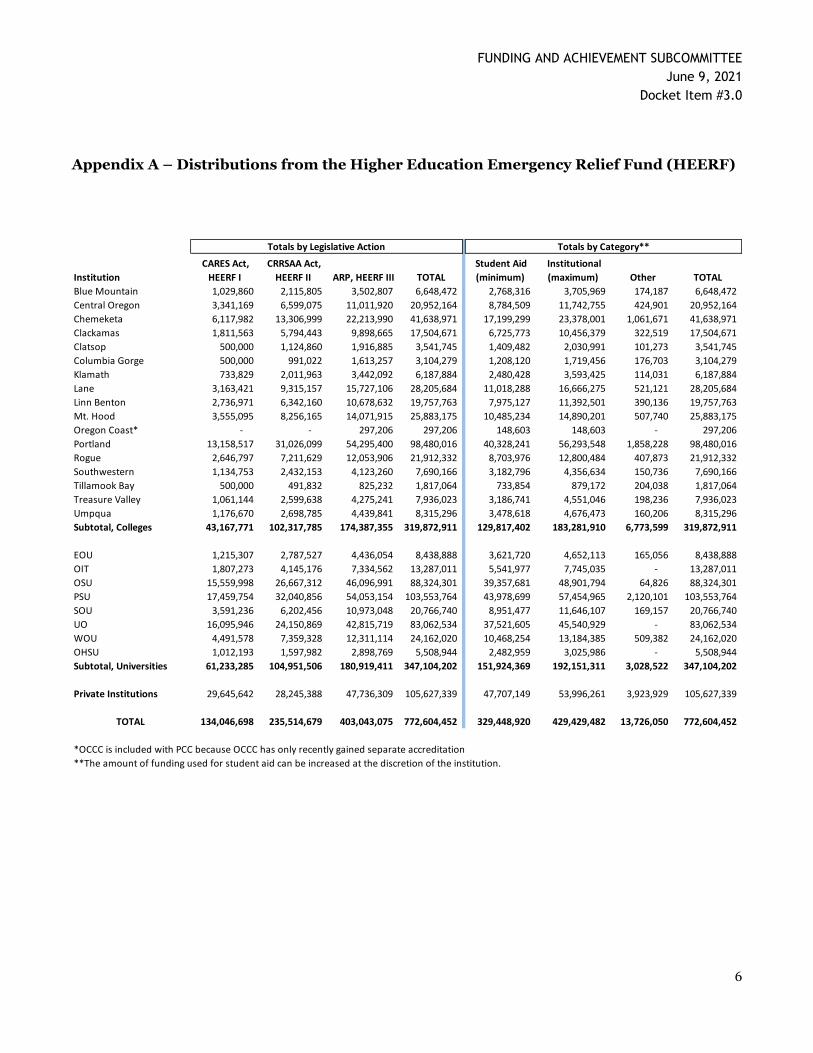
Oregon institutions will receive $772.6 million in federal higher education emergency relief funding. Of
that amount, a minimum $329.5 million is reserved for emergency student aid. A summary of
distributions by institution is included in appendix A, with a recap of the frequently asked questions
document published by the US Department of Education on May 11, 2021 included in appendix B.
During the 2019-21 biennium, the Legislature was able to avoid dramatic cuts to institutional support
funding with only minor cuts to state programs. The May 2021 economic and revenue forecast shows
robust revenues and healthy reserves. Gross general fund revenues for the 2019-21 biennium are
projected to be $2 billion more than at the close of the 2019 regular session.3 Finally, net assessed
property values increased 4.5% year over year in Oregon in line with historical trends.4
Institutions that did not cut jobs or programs made do through a combination of federal
revenue, spending cuts, hiring freezes, furloughs or pay cuts.
Oregon institutions have shared their experiences during a number of panel discussions held during
recent F&A subcommittee meetings. A recap of the pandemic financial monitoring work is included in
appendix C. A summary of the conversation during the most recent panel held during the April 2021
meeting is included in appendix D.
As noted in the table below, the public institutions reported a financial impact of $570.2 million related
to the pandemic, or approximately 12% of annual revenues. Of that total, 80% is related to lost or
foregone revenue. The majority of that relates to auxiliary revenue, particularly at the universities.
Pandemic Financial Impact
(Amounts in $ millions) Public Universities Community Colleges Totals
Direct, additional expenses 80.6 32.6 113.2
Lost/foregone revenue 366.9 90.0 456.9
Total Impact $447.5 $122.6 $570.1
3 Oregon Economic and Revenue Forecast, May 2021. Volume XLI, No 2. Released May 19, 2021. Oregon Department of Administrative Services. 4 Oregon Property Tax Statistics, FY2019-20. Oregon Department of Revenue.
FUNDING AND ACHIEVEMENT SUBCOMMITTEE
June 9, 2021
Docket Item #3.0
3
The most frequently used tools to respond were furloughs, cost cutting, voluntary salary reductions,
hiring freezes, and similar measures. Layoffs did occur. Those took place predominantly in auxiliary
operations, although some adjunct faculty contracts were not renewed. Many institutions sharpened
their focus on managing liquidity as needed.
Full remote instruction did not depress enrollment significantly at some institutions for
continuing students. However, community colleges did not fare as well, with some seeing
drastic enrollment declines, especially in workforce training programs.
According to the National Student Clearinghouse Research Center (2020), colleges and universities,
nationally, experienced significant reductions in enrollments, particularly among first-time students.
From fall 2019 to fall 2020, higher education experienced a 13.1% drop in freshman enrollment (over
327,500 students). The decline was greatest at community colleges, which experienced a 21% decrease
(over 207,200 students).
Enrollments in two-year colleges have been on a downward trend since 2011, and it is not clear to what
extent enrollments will recover. Oregon Fall 2020 enrollment for the community colleges was down
23% year over year and only 4% at the public universities. The declines were most dramatic for
workforce training programs.
What’s the outlook going forward?
The pandemic is likely to affect higher education for years to come even after the public health crisis has
passed. Researchers are projecting nationally that losses in state and local appropriations are likely to
be about half of the magnitude of losses experienced during the Great Recession.
Further, researchers find that most public colleges and universities will experience moderate,
cumulative losses of less than 25% of 2019 revenue over the next five years.5 This could be due to a lag
in enrollment recovery as new students evaluate their plans or the recovery in auxiliary activities as
campus operations return to full capacity over time.
Most institutions are now planning on something for the fall that looks like a normal student
experience. Even so, more turbulence may lie ahead. This is due to existing enrollment and affordability
challenges, institutional budget pressures, and student competition.
5 Kelchen, R., Ritter, D., and Webber, D. The Lingering Fiscal Effects of the COVID-19 Pandemic on Higher Education. Consumer Finance Institute, Federal Reserve Bank of Philadelphia. May 2021.

FUNDING AND ACHIEVEMENT SUBCOMMITTEE
June 9, 2021
Docket Item #3.0
4
Institutions that had trouble mustering enough net tuition revenue before the pandemic
may find it continually difficult to do so as a result of enrollment pressures. From right
after the great recession through 2019, total enrollment for the public universities overall declined 1%
with only two experiencing enrollment increases. The decline at the community colleges has been even
more precipitous, with total enrollment declining more than 15%. A static, or only slightly changing,
number of high school graduates forecasted will not provide a robust pipeline for enrollment recovery.
Affordability will continue to be a barrier for many families. Before the pandemic, 44% of
students were unable to meet expenses with expected resources including family contributions, student
earnings, and grant aid. As a result of the pandemic, students and their families will struggle to afford
the cost of attendance until their economic situations improve. Especially for those disproportionally
affected since the financial burden of college remains much greater for low-income families.
Institutions will likely face significant budget pressures. It will be challenging for institutions
to support students through graduation if they are struggling to close structural budget gaps without
streamlining operations. With tuition and fees charges having increased 60% at Oregon institutions
since 2010, the ability to keep raising tuition is questionable. Further complicating the matter is a
“buyer’s market” for students could reduce the institutions’ pricing power also constraining their ability
to raise tuition.
Additional challenges could arise if institutions are forced to make substantial cuts to programs and
services. Research shows that increased spending improves student outcomes.6 Reduced spending on
student support services could lower completion rates and potentially exacerbate existing equity gaps.
With tuition constrained, institutions will likely rely more heavily on state funding. Public education
and higher education are two of the largest components of discretionary spending in the state budget. It
is likely many states will be placing a priority on public education funding over the next few years to
make up for the lost year during the pandemic. That could translate to flat or declining state funding for
higher education as a result, especially if the economic recovery is sidetracked in some way.
Stiff competition for students will intensify. The number of annual high school graduates in
Oregon is expected to grow by about 7%, compared to 2019, to around 44,600 peaking in 2026. It is
then expected to decline 4%, compared to 2019, to around 39,800 in 2036.7 These projections suggest
6 Deming, D.J. and Walters, C.R. The Impact of Price Caps and Spending Cuts on US Postsecondary Attainment. National Bureau of Economic Research Working Paper 23736, 2017. 7 Western Interstate Commission for Higher Education, Knocking at the College Door: Projections of High School Graduates, 2020, www.knocking.wiche.edu.
FUNDING AND ACHIEVEMENT SUBCOMMITTEE
June 9, 2021
Docket Item #3.0
5
there are demographic headwinds on the horizon with a less robust pipeline to support the same level of
enrollment going forward.
Non-resident student enrollment might also be an issue. Based on fall 2020, fourth-week enrollment,
38% of students enrolled in the public universities are non-residents. Oregon is a net importer of
students8 where more students are coming into the state than leaving to attend school elsewhere.
How the pandemic affects these enrollments long-term is uncertain. Especially in conjunction with
other policies that could affect student choice. An example is if those institutions with the highest
percentage of non-resident enrollments focus on resident enrollment instead. Doing so could shift
enrollment among the universities. Altered remission policies might also affect student choice.
Another policy that may impact the competition for students is the federal proposal for free community
college. This could affect student choice and shift enrollment among the two and four-year sectors.
More efficient transfer pathways and financial aid policy changes might do so as well.
Staff Recommendation:
No recommendation, discussion only.
8 U.S. Department of Education, National Center for Education Statistics, Integrated Postsecondary Education Data System (IPEDS), Spring 2019, Fall Enrollment Component.
FUNDING AND ACHIEVEMENT SUBCOMMITTEE
June 9, 2021
Docket Item #3.0
6
Appendix A – Distributions from the Higher Education Emergency Relief Fund (HEERF)
Institution
CARES Act,
HEERF I
CRRSAA Act,
HEERF II ARP, HEERF III TOTAL
Student Aid
(minimum)
Institutional
(maximum) Other TOTAL
Blue Mountain 1,029,860 2,115,805 3,502,807 6,648,472 2,768,316 3,705,969 174,187 6,648,472
Central Oregon 3,341,169 6,599,075 11,011,920 20,952,164 8,784,509 11,742,755 424,901 20,952,164
Chemeketa 6,117,982 13,306,999 22,213,990 41,638,971 17,199,299 23,378,001 1,061,671 41,638,971
Clackamas 1,811,563 5,794,443 9,898,665 17,504,671 6,725,773 10,456,379 322,519 17,504,671
Clatsop 500,000 1,124,860 1,916,885 3,541,745 1,409,482 2,030,991 101,273 3,541,745
Columbia Gorge 500,000 991,022 1,613,257 3,104,279 1,208,120 1,719,456 176,703 3,104,279
Klamath 733,829 2,011,963 3,442,092 6,187,884 2,480,428 3,593,425 114,031 6,187,884
Lane 3,163,421 9,315,157 15,727,106 28,205,684 11,018,288 16,666,275 521,121 28,205,684
Linn Benton 2,736,971 6,342,160 10,678,632 19,757,763 7,975,127 11,392,501 390,136 19,757,763
Mt. Hood 3,555,095 8,256,165 14,071,915 25,883,175 10,485,234 14,890,201 507,740 25,883,175
Oregon Coast* - - 297,206 297,206 148,603 148,603 - 297,206
Portland 13,158,517 31,026,099 54,295,400 98,480,016 40,328,241 56,293,548 1,858,228 98,480,016
Rogue 2,646,797 7,211,629 12,053,906 21,912,332 8,703,976 12,800,484 407,873 21,912,332
Southwestern 1,134,753 2,432,153 4,123,260 7,690,166 3,182,796 4,356,634 150,736 7,690,166
Tillamook Bay 500,000 491,832 825,232 1,817,064 733,854 879,172 204,038 1,817,064
Treasure Valley 1,061,144 2,599,638 4,275,241 7,936,023 3,186,741 4,551,046 198,236 7,936,023
Umpqua 1,176,670 2,698,785 4,439,841 8,315,296 3,478,618 4,676,473 160,206 8,315,296
Subtotal, Colleges 43,167,771 102,317,785 174,387,355 319,872,911 129,817,402 183,281,910 6,773,599 319,872,911
EOU 1,215,307 2,787,527 4,436,054 8,438,888 3,621,720 4,652,113 165,056 8,438,888
OIT 1,807,273 4,145,176 7,334,562 13,287,011 5,541,977 7,745,035 - 13,287,011
OSU 15,559,998 26,667,312 46,096,991 88,324,301 39,357,681 48,901,794 64,826 88,324,301
PSU 17,459,754 32,040,856 54,053,154 103,553,764 43,978,699 57,454,965 2,120,101 103,553,764
SOU 3,591,236 6,202,456 10,973,048 20,766,740 8,951,477 11,646,107 169,157 20,766,740
UO 16,095,946 24,150,869 42,815,719 83,062,534 37,521,605 45,540,929 - 83,062,534
WOU 4,491,578 7,359,328 12,311,114 24,162,020 10,468,254 13,184,385 509,382 24,162,020
OHSU 1,012,193 1,597,982 2,898,769 5,508,944 2,482,959 3,025,986 - 5,508,944
Subtotal, Universities 61,233,285 104,951,506 180,919,411 347,104,202 151,924,369 192,151,311 3,028,522 347,104,202
Private Institutions 29,645,642 28,245,388 47,736,309 105,627,339 47,707,149 53,996,261 3,923,929 105,627,339
TOTAL 134,046,698 235,514,679 403,043,075 772,604,452 329,448,920 429,429,482 13,726,050 772,604,452
*OCCC is included with PCC because OCCC has only recently gained separate accreditation
**The amount of funding used for student aid can be increased at the discretion of the institution.
Totals by Category**Totals by Legislative Action

FUNDING AND ACHIEVEMENT SUBCOMMITTEE
June 9, 2021
Docket Item #3.0
7
Appendix B – Highlights of Frequently Asked Questions (FAQ) Published May 11, 2021
The full FAQ document for the American Rescue Plan (ARP) HEERF III can be found on the US DOE
website at: https://www2.ed.gov/about/offices/list/ope/arp.html.
Summary
At least half of an institution’s allocation must be used to make emergency financial aid grants to
students (the Student Aid Portion); the remainder may be used for institutional purposes (Institutional
Portion).
New required uses of grant funds: The ARP has two new required uses of Institutional Portion
grant funds. If the Institutional Portion is not used entirely for emergency financial grants to students, a
portion of funds must be used to: (a) implement evidence-based practices to monitor and suppress
coronavirus in accordance with public health guidelines; and (b) conduct direct outreach to financial
aid applicants about the opportunity to receive a financial aid adjustment due to the recent
unemployment of a family member or independent student, or other circumstances.
Which students are eligible to receive emergency financial aid?
Any individual who is or was enrolled at an eligible institution on or after March 13, 2020, the date of
the declaration of the national emergency due to the coronavirus. Students are no longer required to be
eligible for Title IV student financial aid in order to receive HEERF grants. Undocumented and
international students are now eligible as well as students studying abroad.
Institutions are required to prioritize students with exceptional need. US DOE encourages institutions
to prioritize domestic students, especially undergraduates. Domestic students include citizens,
permanent residents, refugees, asylum seekers, DACA recipients, other DREAMers, and similar
undocumented students.
How may students use their emergency financial aid grants?
For any component of their cost of attendance or for emergency costs that arise due to the coronavirus
such as tuition, food, housing, health care, or child care. Students determine how they may use their
emergency financial aid grant within the allowable uses. The emergency financial aid grant is not
taxable income, not counted in the EFC, and not included in the student’s financial aid award package.

FUNDING AND ACHIEVEMENT SUBCOMMITTEE
June 9, 2021
Docket Item #3.0
8
What are the allowable uses of funds for institutional purposes?
Defraying expenses associated with coronavirus including lost revenue, reimbursement for expenses
already incurred, and technology costs associated with a transition to distance education which could
include faculty and staff trainings and payroll. Institutions may also use this funding for making
additional emergency financial aid grants to students and for discharging student debt.
Institutions are not allowed to use this funding for marketing or recruitment, endowments, capital
outlays, senior administrator or executive salaries, benefits or bonuses, or construction including the
purchase of real property.
Quarterly reporting is required. The institutions are required to provide US DOE with quarterly
reporting on the spending and use of funds. They are also required to communicate the application and
use of the student aid portion via websites created for this purpose. Links are included below:
Blue Mountain Community College
Central Oregon Community College
Chemeketa Community College
Clackamas Community College
Clatsop Community College
Columbia Gorge Community College
Eastern Oregon University
Klamath Community College
Lane Community College
Linn-Benton Community College
Mount Hood Community College
Oregon Health & Science University
Oregon Institute of Technology
Oregon State University
Portland Community College
Portland State University
Rogue Community College
Southern Oregon University
Southwestern Oregon Community College District
Tillamook Bay Community College
Treasure Valley Community College
Umpqua Community College
University of Oregon
Western Oregon University

FUNDING AND ACHIEVEMENT SUBCOMMITTEE
June 9, 2021
Docket Item #3.0
9
Appendix C – Summary of Pandemic Financial Monitoring
August 2020 – Commission directed staff to develop a process for assessing financial conditions at
public universities and notifying the Governor, legislators, and other parties that it believes State action
is warranted in order to stabilize one or more institution.
Developed process which included additional reporting through the fall and early spring.
September 2020 – Set expectation that if a university’s Board of Trustees has exercised all
reasonable options at its disposal for managing a fiscal crisis – including but not limited to a declaration
of financial exigency or its equivalent – and still finds itself in significant budgetary distress, staff will
recommend that the Commission advocate with the Governor and Legislature for emergency support.
Laid out warning signs of chronic financial distress.
October 2020 – held panel discussion with institutions to discuss impact of pandemic, assumptions
for budget planning, enrollment insights for fall term, and other challenges.
Panel included representatives from public universities, community colleges and private institutions.
December 2020 – provided an update on financial situation including fall enrollment and projected
FY2021 E&G outlook.
February 2021 – released 2021 Financial Conditions Analysis report which includes FY2020
information from audited, annual financial reports. This report focuses on the public universities.
April 2021 – held panel discussion with institutions regarding federal funding and how it impacts the
financial outlook including a discussion of how the emergency student financial aid is being applied.
Panel included representatives from public universities and community colleges.
FUNDING AND ACHIEVEMENT SUBCOMMITTEE
June 9, 2021
Docket Item #3.0
10
Appendix D – Notes from Financial Outlook Panel Discussion, April 2021
Clackamas Community College
The first round of federal funding from the CARES act provided support for 1,800 students,
approximately $500 per student, title IV only. This money was quick to get to students; however, it was
hard to target who needed it most. Also missing a large part of demographics when only looking at
financial aid eligible students. The foundation came through with extra funds for DACA students and
others who were not eligible for the federal funds.
The second round, CRRSAA went out earlier this week. 5,200 students received anywhere from $50-
525, anybody that was taking credit bearing courses as well as ESOL and GED programs were eligible
for this round of funding.
Enrollment is down 25% through the last three terms, consistent with what we saw at the start of the
pandemic but worse than our enrollment declines prior to that point.
The next round of funding is estimated to be significantly more. The American Rescue Plan Act (ARPA),
is headcount-based rather than FTE. These funds will be used to try and do more for all students, not
just financial aid students. The focus with the latest funds will be on decreasing student cost, such as fee
reductions, free textbooks, etc. All of these are one-time funds, so they are not going to affect long term
financial issues or ongoing costs.
Staff is considering how to best use these funds to potentially reverse enrollment declines. The
requirements limit using these funds for promotional costs, but they can be used to help pay for the
costs of shifting face-to-face instruction to remote instruction. Staff is planning to use federal funds to
reimburse indirect costs so the focus can remain on driving enrollment up.
Rogue Community College
Rogue has received $2.5M between CARES and CRRSAA. CARES funding automatically went out to
financial aid eligible students. The college came up with an extra $150,000 for students who weren’t
eligible for CARES. CRRSAA funds are being distributed on an application basis.
Enrollment is down 27%, and there is an assumption that students with large balances in their student
accounts are not returning because they believe these balances will not allow them to return. To address
that issue, $1.5M of institutional funds will be used for students to apply up to $2,000 each towards
their account balance if they return to school. The rest of the $7.3M in institutional funds will be used to
backfill revenue losses as a result of enrollment declines.

FUNDING AND ACHIEVEMENT SUBCOMMITTEE
June 9, 2021
Docket Item #3.0
11
CRRSAA funds will help stabilize revenue losses. Funding will also be used for training faculty to help
them be better prepared for delivering remote instruction. The college has also purchased computers
and hotspots for students as well as new software programs designed to better conduct business at a
distance.
Fires have impacted enrollment directly as well as due to loss of housing and the housing shortage in
the region. Housing issues are a bigger long-term threat.
Oregon Community College Association
There has been an average of 20% FTE decline among the colleges. Comparing this decline to the great
recession, where enrollment went up and funding went down. Community Colleges can’t use federal
funding for outreach or marketing, but may be able to use state funding for that, to encourage
enrollment.
University of Oregon
Total one-time COVID costs and lost revenues at University of Oregon is $209M. Although this is
campus specific, trends are probably similar amongst all Oregon public universities.
The biggest enrollment decline was incoming freshman. Pre-pandemic enrollment was on track to
increase. This decline in first year students will affect the E&G budget for the next 3-4 years. Due to
many reduced expenditures, this year’s E&G budget doesn’t look as bad as expected. CARES and
CRRSAA provided $37M for students and $45M institutional. Budget deficit not as high as feared but
will grow due to increased costs of reopening campus and continuing impact of enrollment losses.
Federal funds help but they do not cover the gaps. $9.2M in federal funds sent out to students plus over
$1M that was raised by the university. Distributions were based on an application process with the
intent to spread out student support across the year rather than all at once. An average of $1,459 per
student. The university provided quarantine dorms on campus, as well as provided funds to students
who had to go to a hotel or another location to quarantine.
Expecting more from the ARPA. The application process will continue, but will be fast tracked in order
to get money in the hands of students. Pell and financial aid eligible students will automatically receive
funds.
Institutional funds have been used primarily on auxiliary. A large chunk was used to refund student
housing and rec center fees, as well as to pay for sanitation, PPE, plexiglass, and other COVID expenses.

FUNDING AND ACHIEVEMENT SUBCOMMITTEE
June 9, 2021
Docket Item #3.0
12
UO also has a COVID testing program, testing housing students every week, as well as off campus
students as needed and community members where capacity exists. Thus far the program has been
funded by donations but will be using federal funds soon.
Student behavior during COVID is very hard to predict. Applications are up, but that might not be a
reliable way to predict enrollment. The plan is to be cautious with allocating all funds, take care of extra
costs first, and then deal with a budget gap and lost revenue later when more information/data is
available.
Southern Oregon University
Staff stressed the importance of controlling operating costs in light of this experience so SOU
aggressively cut costs including a 20% furlough of most SOU staff under workshare. $3M structural
deficit so they’ve been doing cost control for a while. Labor is big cost, using unemployment benefits to
help manage that.
$8.8M of student aid has been distributed with approximately $3,000 awarded per student. An
application process is being used to help fine-tune need and to ensure audit compliance. Pell criteria is
a basis for federal funds; however, there has also been institutional aid available for other students.
Projected lost revenue through next fall is down about $21M. Will continue to offset that. Not a healthy
reserve (one month’s worth of payroll). Funds pulled into E&G then transferred/allocated to other
funds (auxiliary, etc.). Athletics- important to SOU.
Hotspots and laptop computers have been purchased for students. Focusing on increasing reserves
from 8% to 15% and may use federal dollars to help get there. SOU is focusing on increasing non-
traditional forms of learning to drive enrollment and is working hard on equity issues as well. Focus on
fixing and improving tech infrastructure.
Some funds were focused on wildfire aid to students directly impacted. Used housing to deal with
wildfire displacements as well as the pandemic quarantine. Improved/rebuilt IT fiber that was
destroyed during the fire.