owasco lake new york water quality ... - people…people.hws.edu/halfman/data/owascoreports/2011...
TRANSCRIPT

Halfman et al., Owasco Lake: Water Quality & Nutrient Sources, 2011 - 1 Finger Lakes Institute, Hobart & William Smith Colleges
OWASCO LAKE, NEW YORK: WATER QUALITY & NUTRIENT SOURCES, A 2011 UPDATE.
John D. Halfman, Emily G. Cummings (WS’12) and Maggie M. Stewart (WS’12)
Department of Geoscience & Environmental Studies Program Finger Lakes Institute
Hobart and William Smith Colleges Geneva, NY 14456 [email protected]
12/30/2011
INTRODUCTION A 2005 water quality survey of the seven easternmost Finger Lakes, under the direction of Dr. John Halfman, Finger Lakes Institute, Hobart and William Smith Colleges, determined that Owasco, Honeoye and Seneca Lakes had the worst water quality, whereas Skaneateles, Canandaigua and Keuka Lakes had the best water quality and Cayuga fell in between these end-members (Fig. 1, Halfman and Bush, 2006). The preliminary report noted a correlation between the ranking and a qualitative assessment of water quality protection legislation. Subsequent analysis determined that this ranking more likely reflected other factors, for example, the degree of water quality legislation implementation, land use activities, and/or the impact of recent exotics like Dreissena species, the filter-feeding zebra and quagga mussels, or cercopagis, a carnivorous zooplankton, commonly know as the spiny water flea. The report prompted additional research on Owasco Lake.
Owasco Lake is one of the smaller Finger Lakes but it is still critical to the local health, well-being and economy of the surrounding region. It provides drinking water to ~44,000 people in Cayuga County supplying Class AA water to City of Auburn, Towns of Owasco, Sennett, Fleming, Aurelius, Springport, Brutus, Throop, Montezuma, Mentz, Port Byron, and other lakeshore residents with total permitted withdrawals of 16 million gallons of water per day. The lake is also essential for the economic and social structure of the region supporting an agricultural and tourism based economy. Finally, Owasco
has the largest watershed surface area to lake volume ratio (17:1) of the 11 Finger Lakes. The large ratio plays a critical role in the lake’s short water residence time of 1 to 3 years and its ability to respond quickly to internal and external stresses (Callinan, 2001). It suggests that the lake is quickly influenced by runoff and associated pollutant threats from the watershed, but also will respond more quickly to remediation efforts to improve water quality in the lake.
Fig. 1. The 2005 water ranking of seven Finger Lakes (Halfman and Bush, 2006).
Halfman et al., Owasco Lake: Water Quality & Nutrient Sources, 2011 - 2 Finger Lakes Institute, Hobart & William Smith Colleges
Funding from the Fred L. Emerson Foundation, Auburn, NY, and New York State secured by New York Senator Michael Nozzolio enabled a detailed investigation of Owasco Lake and its watershed in the summers of 2006 and 2007. This research enabled an expansion of the Finger Lakes sampling scheme to include 11 lake and 7 stream sites within the Owasco watershed during these two field seasons. The objectives were to: establish consistent and comprehensive monitoring to document spatial and temporal trends in nutrient concentrations and other water quality parameters in the lake; bring particular focus to the extent and source of nutrients from the watershed to the lake and associated watershed-lake interactions; and, promote the development of effective and comprehensive watershed management policies to initiate the remediation of Owasco Lake.
The conclusions of the 2006 and 2007 research (Halfman et al., 2007) were: (1) Owasco Lake is a borderline oligotrophic – mesotrophic ecosystem. None of the water quality parameters are life threatening at the present time. (2) The lake was impaired at the southern end, especially during and just after precipitation events and during years with more precipitation. The southern end degradation was interpreted to reflect, and is consistent with, the delivery of point and non-point sources of nutrients and suspended sediments from the Owasco Inlet. (3) The nutrients and suspended sediments originated from a wastewater treatment facility, and non-point sources including onsite wastewater (septic) systems, agricultural activities (both animal and crop agriculture), soil erosion, stream bank erosion, fertilized lawns, roadside ditches and construction activities. (4) The lake, and especially the southern end of the lake, was less impaired in 2007 than in 2006. The improvement was due to a combination of a DEC mandated reduction in phosphorus loading by the Groton Wastewater Treatment facility, adoption of best management practices in the watershed, establishment and follow through on recommendations by the newly established Watershed Inspector, and most importantly, significantly lower rainfall in 2007, and thus lower runoff of nutrients and suspended sediments to the lake. (5) The study indicated that Owasco Lake was less impaired when nutrient loading from the watershed to the lake was significantly reduced. Thus, future efforts to reduce the sources of nutrient and sediment loading should improve water quality in the lake.
A 2010 watershed update discussed water quality data from 2008 and 2009, and stream data from the fall of 2009 through the spring of 2010 (Halfman and O’Neill, 2010). The focus of the report was on the 2009 and 2010 data from streams collected and analyzed through support from the Owasco Watershed Lake Association (OWLA) and the Town of Fleming. Dr. Joe Wasileski, President, OWLA, made this opportunity possible. The data indicated that Owasco Lake was still a borderline oligotrophic – mesotrophic ecosystem. None of the water quality parameters were life threatening at the present time. Point sources like wastewater treatment facilities, and non-point sources like on-site wastewater (septic) facilities, agricultural activities (both animal and crop agriculture), soil erosion, stream bank erosion, fertilized lawns, roadside ditches and construction activities contributed nutrients to the lake from the watershed. The measured concentration data and calculated nutrient and sediment fluxes revealed that runoff from major precipitation/runoff events and the two largest watersheds, Dutch Hollow Brook and the Owasco Inlet, are significant in the nutrient budget for the lake. Additional steps should be taken and/or intensified to reduce the nutrient flux to the lake and improve water quality in the lake. Without it, water quality will continue to decline, especially in years of high rainfall.

Halfman et al., Owasco Lake: Water Quality & Nutrient Sources, 2011 - 3 Finger Lakes Institute, Hobart & William Smith Colleges
Here, we report on our 2011 study that investigated water quality of the lake, nutrient sources in the Dutch Hollow Brook and Owasco Inlet, seasonal-scale variability in nutrient loads from both watersheds, and precipitation/runoff event vs. base flow variability on nutrient loads from Dutch Hollow Brook to the lake. This study built on our earlier work and made possible through the support of Cayuga County Legislature and Owasco Watershed Lake Association. OWLA financial support was underwritten by local foundations. The ultimate goal was to formulate recommendations that would reduce the flow of nutrients into the lake and eventually improve water quality in the lake built on this detailed scientific analysis of the watershed.
METHODS Owasco Lake: The 2011 lake survey sampled Sites 1 and 2 on a bi-monthly basis (Table 1, Fig. 2). The specific survey dates were: 4/8, 4/22, 5/5, 5/17, 5/31, 6/14, 6/28, 7/12, 7/26, 8/16, 8/23, 9/5, 9/19, 10/11, 10/17 & 10/31, and spanned the spring, summer and fall seasons. These two sites were sampled since the first study in 2005 as part of the Finger Lakes water quality survey by the Finger Lakes Institute, and they were shown to be representative of the open water limnology in Owasco Lake. The 2011 survey was however twice as frequent and started two months earlier and ended one month later, than the typical late May through early October annual surveys and enabled a seasonal comparison of the data.
The field and laboratory methods were identical to our earlier research. A CTD water quality profile, secchi disk depth, horizontal and vertical plankton tows (80-μm mesh), and
surface and bottom water samples were collected at each site. The CTD electronically gathers water column profiles of temperature (°C), conductivity (specific conductance, μS/cm), dissolved oxygen (mg/L), pH, turbidity (NTUs), photosynthetically active radiation (PAR, μE/cm2-s), and fluorescence (chlorophyll-a, μg/L) using a SeaBird SBE-25 CTD. The CTD was lowered from the surface to ~1m above the lake floor, collecting data every 0.5 seconds (~0.2 meters) along the downcast. The plankton were preserved in an alcohol-formalin solution until identification and enumeration back in the laboratory. Water samples were analyzed onsite for temperature (°C), conductivity (specific conductance, μS/cm), pH and alkalinity (mg/L, CaCO3) using hand-held probes and field titration kits, and analyzed back in the laboratory for total phosphate (μg/L, P), dissolved phosphate (SRP, μg/L, P), nitrate (mg/L, N), chlorophyll-a, total suspended solids (mg/L) and major ion (mg/L, Na+, K+, Ca2+, Mg2+, Cl-, SO4
2-) concentrations. Water samples were stored at 4°C until analysis.
Stream Segment Analysis of Dutch Hollow Brook & Owasco Inlet: Segment analysis delineates point and non-point sources and is facilitated by sampling multiple sites along a major stream and its major tributaries. The segment analysis concept is simple. The concentration of any pollutant increases downstream from the source. Thus, if the concentration of a pollutant increases between any two adjacent sites, then the source of that pollutant is somewhere between those two sites. Calculating fluxes quantifies the relationship and typically differentiates if the upstream source(s) impact(s) loading to the lake.
Table 1. Site locations and water depths. Site Name Latitude Longitude Water Depth
Site 1 42° 52.4’ N 76° 31.35’ W 34 m Site 2 42° 49.15’ N 76° 30.45’ W 52 m

Halfman et al., Owasco Lake: Water Quality & Nutrient Sources, 2011 - 4 Finger Lakes Institute, Hobart & William Smith Colleges
Fig. 2. The 2011 lake and stream sites. Dutch Hollow Brook drains the second largest area (77 km2) in the Owasco
watershed. The Owasco Inlet drains the largest area (299 km2) in the Owasco watershed.

Halfman et al., Owasco Lake: Water Quality & Nutrient Sources, 2011 - 5 Finger Lakes Institute, Hobart & William Smith Colleges
Stream samples were collected bi-monthly along each stream and at selected tributaries to Dutch Hollow Brook and Owasco Inlet (Fig. 3). The survey dates were: 3/5, 3/11, 4/9, 4/23, 5/7, 5/18, 6/1, 6/15, 6/29, 7/13, 7/27, 8/25, 9/4, 9/18, 10/16 & 10/30. The sample scheme assessed nutrient and suspended sediment sources and their impact on the lake, and seasonal variability in nutrient loading to the lake. Dutch Hollow Brook and Owasco Inlet were chosen because they drain the largest areas within the Owasco watershed and contain a significant percentage of agricultural land use activities.
Larger watersheds typically deliver more nutrients and suspended sediments to a lake. Streams that drain agriculturally-rich watersheds, deliver proportionally more nutrients, suspended sediments, herbicides and pesticides to a lake. Dutch Hollow Brook drains the 2nd largest area (77 km2) in the Owasco watershed (523 km2) and drains an agriculturally-rich landscape (64% agricultural, 33% forested) of both crop agronomy and animal husbandry. The Owasco Inlet drains the largest portion (299 km2) of the Owasco watershed, includes a mixture of agricultural (46%) and forested (49%) landscapes, and contains two municipal wastewater treatment facilities.
Dutch Hollow Brook was sampled at five successive upstream sites (Figs. 2 & 3). Proceeding upstream, sites were located at Rt 38A, Barski Rd, North St, Benton Rd, and near Old State Rd. Three unnamed tributaries were also sampled just upstream from where the tributary joined Dutch Hollow Brook. Barski Trib joined just downstream of the Barski Rd site and drained agriculturally-rich land to the north. Southern Trib joined between the North St site and the Benson Rd site. It drained the agriculturally-rich land to the south. Benson Trib joined between the Southern tributary confluence and the Benson Rd site. It drained a large farm.
Owasco Inlet was sampled at seven successive upstream sites (Figs. 2 & 3). Proceeding upstream along Rt 38, sites were located just down stream of Moravia on Rt 38, Auburn St in Moravia, VFW fairgrounds, Rounds Ln, Suckerport Ln, County Line, and just upstream of Groton (near Spring St). The site selection bracketed two municipal wastewater treatment facilities. The Groton facility is located between the Groton and County Line sites. The Moravia facility is located between the VFW and Aurora sites. Three major tributaries, Mill, Fillmore and Hemlock Creeks, were also sampled just upstream from where these tributaries joined Owasco Inlet. Mill Creek joined the Inlet between the Rt 38 and Aurora sites, Fillmore Creek just down stream of the VFW site, and Hemlock Creek between Suckerport Ln and County Line sites. Of these three tributaries, Fillmore Creek is the smallest and most forested (16 km2, 70% forested, 29% agricultural), Hemlock Creek is the most agricultural (47 km2, 57% forested, 41% agricultural), and Mill Creek is the largest with a near even split of agricultural and forested land (77 km2, 51% forested, 47% agricultural).
Stream discharge (the volume of water per unit time flowing past a site) was calculated for each site on each visit from measured stream width, depth and velocity data (using a 30 m tape, wading rod and Marsh-McBirney flow meter). Both velocity and depth were measured at five or ten equally distributed locations across and aligned perpendicular to stream flow. The velocity was measured at ~60% of the depth from the top. Ten segments were utilized when the stream was wide or more accuracy was necessary, e.g., some of the Inlet sites and Dutch Hollow 38A site. Stream discharge (water volume per unit time) is critical to calculate the flux (loading) of any substance (e.g., phosphates, nitrates, suspended solids, etc.).

Halfman et al., Owasco Lake: Water Quality & Nutrient Sources, 2011 - 6 Finger Lakes Institute, Hobart & William Smith Colleges
Fig. 3. Sites along Dutch Hollow Brook and Owasco Inlet watersheds, the land use in each watershed are shown.

Halfman et al., Owasco Lake: Water Quality & Nutrient Sources, 2011 - 7 Finger Lakes Institute, Hobart & William Smith Colleges
Water samples were measured onsite for temperature, conductivity, dissolved oxygen, pH and alkalinity using hand-held probes or field titration kits. Water samples were also collected and transported back to the laboratory and analyzed for total phosphate, dissolved phosphate, nitrate and total suspended solid concentrations following identical methods.
Runoff/Event Flow versus Base-Flow Variability: Two stream states are critical to characterize and sample: peak flow (storm runoff or event flow) and base flow (groundwater supported). When it rains, runoff quickly adds water to a stream, which swells to a peak discharge (or perhaps a flood) a few hours to a day or more after the rainstorm. The response takes longer for larger watersheds and/or larger precipitation events. Following the rainstorm, peak flow recedes and runoff dissipates but at a slower rate than the initial increase. The post runoff flow is also fed by rejuvenated near-surface groundwater flow. When the runoff and near-surface groundwater is depleted, the stream typically continues to flow at a lower discharge, fed by groundwater inputs. This final groundwater fed state is the base flow.
The distinction between event and base flow is necessary because they influence the transport of point and non-point source materials, thus provides a means to identify the source and quantifying its impact. Event flow delivers non-point source materials to the stream that are eroded by the runoff over the landscape. Their stream concentrations increase significantly (10 to 1,000 fold) above base flow concentrations during an event. Typical non-point source materials include agricultural and lawn care fertilizers, herbicides and pesticides, and concentrated animal feedlot (CAFO) wastes from farm lots and manure spread on fields. Base flow samples however, highlight point source materials like effluent from wastewater treatment plants, septic systems and materials transported to the stream by groundwater, especially during low flow. Finally, the total annual flux from the largest runoff events throughout the year typically exceeds the flux from base flow.
An automated water sampler and stage, temperature and conductivity data loggers were installed at the Rt 38A site in Dutch Hollow Brook to investigate the impact of runoff events vs. base flow on the delivery of nutrients and suspended sediments to the lake. Duplicate In-Situ Aqua Troll 200 data loggers (Fig. 4a) recorded stream stage (height), temperature and specific conductance every hour from 6/9 (immediately after delivery) to 11/4 to identify runoff events and enable the estimation of stream discharge at this site. A Teledyne ISCO automated water sampler (Fig. 4b), called “R2D2” by the team, collected 1-L of water every eight hours from 6/9 (immediately after delivery) to 10/30 to sample runoff and base flow conditions. The collected water samples were transported back to the lab for analysis once a week. Unfortunately, the deployment missed the early spring rains, and associated larger spring flows.
Laboratory Analyses: Laboratory analyses for nutrient, chlorophyll-a, and total suspended solid concentrations followed standard limnological techniques (Wetzel and Likens, 2000). Once back in the lab, sample water was filtered through pre-weighed, 0.45 μm glass-fiber filters. The filter and residue were dried at 80°C for at least 24 hours. The weight gain and filtered volume determined the total suspended sediment concentration. Lake water was also filtered through a Gelman HA 0.45 μm membrane filter. The filtered residue was kept frozen until chlorophyll analysis after acetone extraction by spectrophotometer. The filtrate was stored at 4°C until dissolved phosphate, nitrate and dissolved silica colorimetric analyses by spectrophotometer. A third, unfiltered water sample was analyzed for total phosphates by spectrophotometer after

Halfman et al., Owasco Lake: Water Quality & Nutrient Sources, 2011 - 8 Finger Lakes Institute, Hobart & William Smith Colleges
digestion of any organic-rich particulates in hot (100ºC) persulfate for 1 hour. Laboratory precision was determined by analyzing replicate tests on the same water sample on a number of occasions resulting in the following mean standard deviations: total suspended solids ±0.2 mg/L, phosphate ±0.1 μg/L, silica ±5 μg/L, and nitrate ±0.1 mg/L. For the plankton enumerations, over 100 individuals were identified to genus level and reported as date averaged relative percentages. Major ions concentrations were measured on filtered (0.45 μm) water samples by Dionex DX-120 ion chromatograph with a precision of ±1.0 mg/L.
LAKE RESULTS & DISCUSSION Lake CTD Profiles: The 2011 water temperature profiles were, for the most part, typical for any spring through fall transition (Fig. 5). The first three profiles, 4/8, 4/22 and 5/5, revealed isothermal conditions, i.e., uniform temperatures throughout the water column, at ~2.5, 4 and 5.7ºC. When the lake is isothermal, the lake mixes vertically throughout the water column (i.e., spring or fall overturn). Profiles from previous years were not early enough in the spring (5/20 earliest) to reveal spring isothermal (overturn) conditions. Subsequent 2011 profiles revealed warmer surface waters (epilimnion) over the cold and subsequently isolated bottom waters (hypolimnion). The water masses were then seasonally segregated by density. Epilimnetic temperatures ranged from 10ºC in mid-May to over 25ºC in the summer (up to 26ºC on 7/26), and cooled to 12.5ºC by the end of the survey (10/31). Starting on 5/5, hypolimnetic temperatures remained a uniform 5 to 6ºC. The epilimnion and hypolimnion were slightly warmer (by 1 to 2ºC) in 2011, 2010 and 2009 than previous years and the change may be related to global warming, annual climatic variability or the distribution of the sample dates.
A thermocline, the depth in the water column that separates the warmer, less dense, surface-water epilimnion from the colder, more dense, bottom-water hypolimnion and defined by the largest decrease in water temperature with water depth, was typically observed at 10 to 15 meters at both sites on every summer survey date. Its mean depth is controlled by the size of storm waves that mix the epilimnion. Any changes in its depth from site to site or day to day can be attributed to internal seiche activity, the periodic, see-saw like, oscillation of the thermocline set up by strong axial wind events, or fall cooling. During the fall decay of the epilimnion, the thermocline deepened as revealed by the October profiles until the lake eventually turns isothermal (not observed).
Fig. 4a. An In Situ Aqua Troll 200 data logger. It logged stream height (proportional to stream discharge), temperature and specific conductance of the stream on an hourly interval.
Fig. 4b. Servicing “R2D2” the Teledyne ISCO automated water sampler. It automatically collected 1-liter samples at an 8-hr sample interval and was serviced weekly. A data logger PVC housing is in the stream behind Halfman.

Halfman et al., Owasco Lake: Water Quality & Nutrient Sources, 2011 - 9 Finger Lakes Institute, Hobart & William Smith Colleges
Epilimnetic conductivity data (reported as specific conductance, a parameter proportional to water salinity) ranged from 290 to 340 μS/cm, and decreased from the early spring high through the summer and fall seasons. The hypolimnetic specific conductance data were ~340 μS/cm and remained relatively uniform over time and depth except for a slight, ~5 μS/cm, increase near lake floor in the fall (Fig. 5). The source of the dissolved ions was most likely from the natural weathering of soils, tills and bedrock and human sources like road salt. The ions are brought to the lake by runoff and/or groundwater flow. The epilimnetic salinity decline through the year probably is due to the dilution of the epilimnion with less saline rainfall and rainfall induced runoff over time. The observed decrease of ~50 μS/cm is larger than previous years when the decrease was typically 25 μS/cm or less, and reflects more rainfall in 2011. The hypolimnion concentrations were similar in previous years.
Dissolved oxygen (DO) concentrations ranged from just over 10 mg/L in the cold spring down to 4 mg/L in the upper and lower hypolimnion by late summer and into the fall (Fig. 5). DO concentrations respond to three forcing functions: water temperature, colder water dissolves more oxygen than warmer water; photosynthesis, algal photosynthesis adds oxygen primarily to the epilimnion; and, respiration, bacterial respiration consumes oxygen and their consumption impacts the isolated hypolimnion. The primary oxygen source is diffusion from the atmosphere to the epilimnion, thus the hypolimnion is isolated from additional oxygen inputs throughout the summer stratified season.
The epilimnetic DO concentrations decreased as water temperatures increased, but typically remained at or near 100% saturation. However, DO was progressively depleted below saturation just below the thermocline and just above the lake floor as the summer season progressed. The decrease reflected bacterial respiration and decomposition of dead algae. Hypolimnetic DO at 80 to 20% of saturation suggests a mesotrophic lake. The low hypolimnion concentrations observed in 2011 were near the 4 mg/L (~30 to 40% saturation) threshold for respiratory stress in sensitive organisms.
Photosynthetic available radiation (PAR), or light, decreased exponentially with water depth from a maximum intensity of 100 to a few 1,000 μE/cm2-s at the surface to 1% of surface light intensities at water depths of 5 to 15 m, a depth still within the epilimnion (Fig. 5). The availability of light is critical for algal photosynthesis. The 1% surface light depth represents the minimum amount of light required for algae to photosynthesize enough biomass to survive. The observed decrease in light reflects the normal exponential absorption and conversion of longer wavelengths of light (infrared, red, orange, yellow) to heat, and scattering of shorter wavelengths of light (ultraviolet, violet, blue) back to the atmosphere. Many of the profiles revealed a marked decrease in light at 2 or 3 meters. It corresponded to the sensor passing through the shadow of the boat. The range in surface intensities reflected the season, the extent of cloud cover, and the turbidity of the water (suspended sediment and/or algal density) on the survey date. The 2011 PAR data are similar to earlier years.

Halfman et al., Owasco Lake: Water Quality & Nutrient Sources, 2011 - 10 Finger Lakes Institute, Hobart & William Smith Colleges
Fig. 5. Owasco 2011 CTD profiles from Sites 1 & 2. The PAR (light) data are plotted on an exponential scale, so that
exponential changes with water depth appear as straight lines.

Halfman et al., Owasco Lake: Water Quality & Nutrient Sources, 2011 - 11 Finger Lakes Institute, Hobart & William Smith Colleges
Fluorescence profiles (algal concentrations) revealed algal peaks within the epilimnion during the summer months (Fig. 5). Peak concentrations were up to 5 μg/L (or mg/m3), but more typically between 1 and 4 μg/L in 2011, with slightly larger mean peak concentrations in 2011 than earlier years, typically no larger than 4 μg/L in earlier years. Hypolimnetic concentrations were consistently below 1 μg/L. The two earliest sample dates revealed uniform (well mixed, isothermal) profiles at ~1.5 and 2 μg/L. Spring isothermal conditions, i.e., spring overturn, uniformly mixed the algae throughout the water column, whereas the subsequent stratified conditions allowed the algae to concentrate in the sunlit epilimnion. Except for the occasional intense bloom, algal peak concentrations remained below 4 μg/L, the threshold between an oligotrophic and mesotrophic lake. Mesotrophic lakes require concentrations above 4 μg/L, eutrophic lake over 10 μg/L.
The 2011 turbidity profiles revealed typical suspended sediment and algal sources for suspended sediments. Uniform or nearly uniform turbidities were observed down to the lake floor at Site 1 and down to just above (5 to 10 m) the lake floor at Site 2 (Fig. 5). The concentrations ranged from 0.5 to 2.5 NTUs. The largest concentrations were detected after a major runoff event, 5/5, when the lake was isothermal. Occasionally the turbidities would increase to 1.5 NTUs in the epilimnion and paralleled peaks in fluorescence. These epilimnion turbidity peaks probably detected algae. The well mixed, early spring, turbidities were larger than those detected later in the summer during 2011, probably reflecting the impact of snow melt and runoff events and/or nearshore sediment erosion by waves during storms in the spring. The 2011 summer profiles were similar to those collected in previous years.
Benthic nepheloid layers (bottom-water turbid zones extending from a few meters above to the lake floor) were detected at Site 2. A fluorescence peak was not observed at this depth, indicating that the source of the benthic turbidity was inorganic particles. The sediments were probably the result of runoff events and/or erosion of nearshore/shallow water sediments by waves and currents during high winds and brought to the deepest lake floor by density currents and/or settling. These nepheloid layers were less prevalent in 2007 & 2008 than 2009 and 2010 and most prevalent in 2011, and the change probably reflected a change in sediment inputs from streams and erosion by waves. The spring of 2011 was particularly wet and runoff delivered a large amount of sediment to the lake.
Nutrient, Chlorophyll, TSS and Secchi Data: The 2011 secchi disk, chlorophyll, nutrient and suspended sediment data indicated that the lake was not a health threat, as the nitrate concentrations were far below the 10 mg/L MCL established by the EPA (Table 2, Fig. 6). Neither was it impaired, as the total phosphate concentrations were typically below the 20 mg/L threshold for total phosphate (TP) established by the DEC. The 5/17 TP data provided the only exception with a TP date-averaged concentration of 21.7 μg/L. A few additional observations were noteworthy. First, the dissolved phosphate to nitrate ratio in the lake, the nutrients available for algal uptake, averaged 1:2,700 and never lower than 1:65 for all samples in 2011. The P:N ratio required by algae is 1:7 (Redfield Ratio). The difference indicates that phosphate was always the limiting nutrient throughout the year. Thus, its availability limits continual algal growth, and algae never “run out” of nitrogen. Second, variability was observed in every parameters from one survey date to the next (Fig. 6). Secchi disk depths were shallowest and total phosphates, chlorophyll and total suspended solids were largest during July. It suggests a significant bloom in the mid-summer months, perhaps stimulated by runoff, internal seiche

Halfman et al., Owasco Lake: Water Quality & Nutrient Sources, 2011 - 12 Finger Lakes Institute, Hobart & William Smith Colleges
activity and/or grazing of herbaceous zooplankton by cercopagis (carnivorous spiny water flea). Third, dissolved nutrient concentrations revealed a small increase between the epilimnion and hypolimnion, e.g., annual mean surface and bottom water concentrations for soluble reactive phosphate were 0.1 and 0.4 μg/L, nitrate 0.6 and 0.9 mg/L, silica 735 and 1300 μg/L, and chlorophyll-a 1.6 and 0.6 μg/L, respectively, and reflected the seasonal progression of algal uptake of nutrients and their growth in the epilimnion, and algal decomposition and nutrient release by bacteria in the hypolimnion.
Annual mean nutrient concentrations revealed small changes from 2005 through 2010 that for the most part persisted through 2011 (Fig. 6). Total phosphate concentrations increased slightly in 2011 (7 or 8 to 14 μg/L), dissolved phosphate concentrations decreased slightly from 2008 to 2009 and decrease some more in 2010 only to increase in 2011 (0.9 to 0.8 to 0.7 and back to 0.8 μg/L), chlorophyll-a and TSS concentrations were larger in 2009 and 2010 than 2011 (3.9 and 3.7 to 1.9 μg/L; 1.9 and 1.9 to 1.6 mg/L), and secchi disk depths increased from 2009 to 2011 (3.2 to 3.7 to 3.9m) (Table 2, Fig. 6). These trends were consistent with increased algal productivity from 2008 to 2009 through 2010. However, the changes were small and within the scatter of the individual data. It suggests that the open water limnology has remained similar since 2005, and any year to year annual changes were smaller than day to day change.
Owasco Trophic Status: Annual mean secchi disk depths, hypolimnetic oxygen saturation and total phosphate concentrations were within the mesotrophic range however, chlorophyll and nitrate concentrations were in the oligotrophic range (Tables 2 & 3, Fig. 6). Thus Owasco Lake remains borderline oligotrophic-mesotrophic.
Table 3. Concentration ranges for Oligotrophic (low productivity), Mesotrophic (mid-range productivity), and Eutrophic (high productivity) lakes. The bold entries highlight Owasco Lake’s 2011 mean values.
Trophic Status Secchi Depth Total Nitrogen Total Phosphate Chlorophyll a Oxygen (m) (N, mg/L, ppm) (P, μg/L, ppb) (μg/L, ppb) (% saturation)
Oligotrophic > 4 < 2 < 10 < 4 > 80 Mesotrophic 2 to 4 2 to 5 10 to 20 4 to 10 10 to 80
Eutrophic < 2 > 5 > 20 (> 30) > 10 < 10 Plankton Data: The phytoplankton (algal) species in Owasco Lake were dominated by diatoms, primarily Flagillaria, with smaller numbers of Tabellaria, Rhizoselenia, Synedra and Asterionella (Table 4, Fig. 7). Other phytoplankton species included the dinoflagellate Dinobryon, with some Ceratium and Coalcium. The seasonal succession moved from Asterionella to Flagillaria to Dinobryon back to Flagillaria. Zooplankton species were dominated by rotifers, with some cladocerans. Zebra and quagga mussel larvae were detected in the plankton tows, as well as cercopagis, the spiny water flea.
In the past few years, Blue green species have increased in abundance, with Mycrocystis representing up to 40% of the plankton during obvious blooms. They were most abundant in the later part of the past three summer seasons. The onset of Mycrocystis is disturbing, because it dominates eutrophic systems. Blue greens contain gas vacuoles that enable them to float at or near the surface of the lake and thus allow them to outcompete other algal species for the available light in a very productive, algal-rich and turbid lake. Although not important in Owasco Lake, they can also fix nitrogen from the atmosphere, if nitrogen is scarce, i.e., the

Halfman et al., Owasco Lake: Water Quality & Nutrient Sources, 2011 - 13 Finger Lakes Institute, Hobart & William Smith Colleges
limiting nutrient. The resulting surface-water scum of blue-green algae is unpleasant, as it is unsightly, occasionally smells, and some species of blue greens are toxic to humans. Unfortunately, only detailed and expensive analyses differentiate between the various Mycrocystis species.
Owasco Averaged Secchi Depths
0
1
2
3
4
5
6
2005
2006
2007
2008
2009
2010
2011
4/8/
114/
22/1
15/
5/11
5/17
/11
5/31
/11
6/14
/11
6/28
/11
7/12
/11
7/26
/11
8/16
/11
8/23
/11
9/5/
119/
19/1
110
/1/1
110
/17/
1110
/31/
11
Dep
th (m
)
Daily AverageAnnual Averages
Owasco Averaged Total Suspended Solids
0.00.51.01.52.02.53.03.54.04.5
2005
2006
2007
2008
2009
2010
2011
4/8/
114/
22/1
15/
5/11
5/17
/11
5/31
/11
6/14
/11
6/28
/11
7/12
/11
7/26
/11
8/16
/11
8/23
/11
9/5/
119/
19/1
110
/1/1
110
/17/
1110
/31/
11
Surf
ace
TSS
(mg/
L)
Annual Averages Daily Average
Owasco Averaged Total Phosphates
0
5
10
15
20
25
2005
2006
2007
2008
2009
2010
2011
4/8/
114/
22/1
15/
5/11
5/17
/11
5/31
/11
6/14
/11
6/28
/11
7/12
/11
7/26
/11
8/16
/11
8/23
/11
9/5/
119/
19/1
110
/1/1
110
/17/
1110
/31/
11Surf
ace
Phos
phat
es (T
P ug
/L) Annual Averages Daily Average
Owasco Averaged Dissolved Phosphates
0.00.20.40.60.81.01.21.41.6
2005
2006
2007
2008
2009
2010
2011
4/8/
114/
22/1
15/
5/11
5/17
/11
5/31
/11
6/14
/11
6/28
/11
7/12
/11
7/26
/11
8/16
/11
8/23
/11
9/5/
119/
19/1
110
/1/1
110
/17/
1110
/31/
11Surf
ace
Phos
phat
es (S
RP,
ug/
L) Annual Averages Daily Average
Owasco Averaged Chlorophyll
0
1
2
3
4
5
2005
2006
2007
2008
2009
2010
2011
4/8/
114/
22/1
15/
5/11
5/17
/11
5/31
/11
6/14
/11
6/28
/11
7/12
/11
7/26
/11
8/16
/11
8/23
/11
9/5/
119/
19/1
110
/1/1
110
/17/
1110
/31/
11Surf
ace
Chl
orop
hyll-
a (u
g/L) Annual Averages Daily Average
Owasco Averaged Nitrates
0.0
0.2
0.4
0.6
0.8
1.0
1.2
2005
2006
2007
2008
2009
2010
2011
4/8/
114/
22/1
15/
5/11
5/17
/11
5/31
/11
6/14
/11
6/28
/11
7/12
/11
7/26
/11
8/16
/11
8/23
/11
9/5/
119/
19/1
110
/1/1
110
/17/
1110
/31/
11
Surf
ace
Nitr
ate
(mg/
L)
Annual Averages Daily Average
Fig. 6. Annual averaged surface water data (blue bars, dark blue for 2011), and date average surface water data from each 2011 survey date (yellow bars). The dissolved phosphate concentration for 8/23 was 4.9 μg/L.

Halfman et al., Owasco Lake: Water Quality & Nutrient Sources, 2011 - 14 Finger Lakes Institute, Hobart & William Smith Colleges
Major Ions: The major ions were still dominated by bicarbonate (HCO3-) measured as
alkalinity), and calcium (Ca2+) with lesser amounts of magnesium (Mg2+) and sodium (Na+) reflecting the weathering of carbonate-rich bedrock and soils. It suggests that whiting events, the precipitation of carbonate during algal blooms on hot, calm, summer days, occurred in Owasco Lake, further degrading water clarity and quality. When it happens, the lake turns a milky green color. Carbonates are detected in the sediment and confirm the precipitation of calcite in the water column.
2011 Plankton
0102030405060708090
100
Frag
illaria
Tabe
llaria
Aste
rione
lla
Syne
dra
Rhi
zose
leni
a
Din
obry
on
Cer
atiu
m
Coa
lciu
m
Kera
tella
Poly
arth
ra
Mon
osty
la
Cla
doce
ran
Anab
aena
Myc
rocy
stis
Plan
kton
Cou
nt (%
)
4/8/11
4/22/11
5/5/11
5/17/11
5/31/11
6/14/11
6/28/11
7/12/11
7/26/11
8/16/11
8/23/11
9/5/11
9/19/11
10/1/11
10/31/11
2010 Plankton
0102030405060708090
100
Frag
illaria
Tabe
llaria
Aste
rione
lla
Syne
dra
Rhi
zose
leni
a
Din
obry
on
Cer
atiu
m
Coa
lciu
m
Kera
tella
Poly
arth
ra
Mon
osty
la
Cla
doce
ran
Anab
aena
Myc
rocy
stis
Pla
nkto
n C
ount
(%)
5/19/10
6/22/10
7/20/10
7/30/10
8/6/10
8/17/10
8/28/10
10/2/10
2009 Plankton
0102030405060708090
100
Frag
illaria
Tabe
llaria
Aste
rione
lla
Syne
dra
Rhi
zose
leni
a
Din
obry
on
Cer
atiu
m
Coa
lciu
m
Kera
tella
Poly
arth
ra
Mon
osty
la
Cla
doce
ran
Anab
aena
Myc
rocy
stis
Pla
nkto
n C
ount
(%)
5/29/09
6/24/09
7/22/09
8/18/09
9/26/09
2008 Plankton
0102030405060708090
100
Frag
illaria
Tabe
llaria
Aste
rione
lla
Syne
dra
Rhi
zose
leni
a
Din
obry
on
Cer
atiu
m
Coa
lciu
m
Kera
tella
Poly
arth
ra
Mon
osty
la
Cla
doce
ran
Anab
aena
Myc
rocy
stis
Pla
nkto
n C
ount
(%)
5/30/08
6/27/08
7/18/08
8/25/08
10/4/08
2007 Plankton
0102030405060708090
100
Frag
illaria
Tabe
llaria
Aste
rione
lla
Syne
dra
Rhi
zose
leni
a
Din
obry
on
Cer
atiu
m
Coa
lciu
m
Kera
tella
Poly
arth
ra
Mon
osty
la
Cla
doce
ran
Anab
aena
Myc
rocy
stis
Pla
nkto
n C
ount
(%)
5/25/07
7/23/07
8/20/07
9/3/07
9/24/07
2006 Plankton
0102030405060708090
100
Frag
illaria
Tabe
llaria
Aste
rione
lla
Syne
dra
Rhi
zose
leni
a
Din
obry
on
Cer
atiu
m
Coa
lciu
m
Kera
tella
Poly
arth
ra
Mon
osty
la
Cla
doce
ran
Anab
aena
Myc
rocy
stis
Pla
nkto
n C
ount
(%)
5/24/06
6/19/06
6/27/06
7/17/06
9/1/06
9/30/06
Fig. 7. Date averaged plankton data for the past 6 years.

Halfman et al., Owasco Lake: Water Quality & Nutrient Sources, 2011 - 15 Finger Lakes Institute, Hobart & William Smith Colleges
COMPARISON TO OTHER FINGER LAKES Skaneateles, Otisco and Owasco Lake CTD Comparison: The seasonal progression of cold to warm to cool epilimnion over a colder hypolimnion from the spring to fall seasons was also observed in Skaneateles and Otisco Lakes (Fig. 8). The small variability between lakes is attributed to the difference in maximum depths and volumes of each lake. The deeper and larger Skaneateles was colder, and the shallower Otisco was warmer than the Owasco Lake both in the epilimnion and hypolimnion. The larger Skaneateles kept its epilimnion cooler in the summer with the same input of sunlight. The hypolimnetic differences probably reflected the depth and duration of surface mixing by winds and surface currents before the onset of stratification. This in turn is related to the maximum water depth of the lake. The shallower Otisco could be well mixed (Isothermal) further into the summer, thus the entire water column got warmer before the onset of stratification and the isolation of the epilimnion from the hypolimnion.
Otisco was slightly more saline, and Skaneateles slightly less saline, than Owasco (Fig. 8), but the differences were small, less than 0.05 ppt (estimated at ~0.13 ppt in Skaneateles to ~0.18 ppt in Otisco Lake). The small variability probably reflected minor differences in the weathering and erosion of the underlying bedrock, glacial till and soils and/or the use of road salts in these three watersheds. The specific conductance comparison also revealed an epilimnetic decrease in salinity through the summer stratified season (Fig. 8). The decline was smallest in Skaneateles and largest in Owasco Lake. These differences probably reflected both the size of the lakes, and the volume to watershed area ratios. Similar inputs of less saline rainwater would have a greater dilution effect on the smaller Otisco than the larger Skaneateles. Owasco with the largest watershed to lake surface area ratio would experience a larger delivery of less saline water to dilute a relatively small epilimnion. Thus, Owasco Lake experienced the largest dilution of the epilimnion from similar precipitation events.
Skaneateles dissolved oxygen (DO) concentrations were saturated or close to saturation throughout the water column (Fig. 8). In contract, Otisco hypolimnetic DO concentrations were depleted to anoxic conditions by mid-June, and Owasco hypolimnetic DO depletions were between these extremes. The difference reflected their relative size and the amount of algal productivity, which dictates the extent of bacterial decomposition and consumption of oxygen in the hypolimnion between these three lakes. The largest DO concentration and hypolimnion volume is found in Skaneateles. It is also the least productive lake. Thus it has the smallest depletion on hypolimnetic DO. Otisco, the most productive and smallest lake, had the largest demands and smallest amount of available DO in the hypolimnion, thus turned anoxic.
The fluorescence profiles revealed more algae in Otisco (from 1 to 4 μg/L, or mg/m3, with peaks up to 7 μg/L) than Owasco (0.5 to 4 μg/L with peaks up to 5 μg/L) and both lakes had considerably more algae than Skaneateles (consistently below 1 to 2 μg/L, Fig. 8). The water depth of the algal peak was well above the thermocline in Otisco (except for one profile) just above the thermocline in Owasco, and below the thermocline in Skaneateles. Less algae in Skaneateles allows for deeper light penetration as confirmed by the PAR profiles and smaller algal peaks at deeper depths. The concentrations and depth ranges indicate that these three lakes span a range of trophic (algal productivity) states from the less productive oligotrophic Skaneateles to the intermediate, boarderline oligotrophic-mesotrophic Owasco, to a more productive Otisco.

Halfman et al., Owasco Lake: Water Quality & Nutrient Sources, 2011 - 16 Finger Lakes Institute, Hobart & William Smith Colleges
The turbidity profiles also revealed small differences between the three lakes (Fig. 8). Turbidities were smaller in Skaneateles, and progressively larger in Owasco and Otisco, from below 1 to above 1 and nearly 2 NTUs, respectively. The difference parallels the change in fluorescence results, suggesting that the bulk of the turbidity in the epilimnion is due to algae. Benthic nepheloid layers were not as well developed in Skaneateles and Otisco Lakes as Owasco Lake. This may also be attributed to differences in lake volume to watershed area, with more sediment laden runoff impacting Owasco.
Fig. 8. 2011 CTD Profiles from Owasco (top), Skaneateles (middle) and Otisco (bottom) Lakes. The PAR (light) data
are plotted on an exponential scale, so that exponential changes with water depth appear as straight lines.
In summary, the biologically related CTD parameters, fluorescence, dissolved oxygen, and PAR (light penetration), revealed the borderline oligotrophic-mesotrophic state of Owasco was between the Skaneateles and Otisco end members. It indicates that smaller lakes become eutrophic more easily than larger lakes. It also reflects the significant effort to reduce nutrient loading to Skaneateles from its watershed. Thus, Skaneateles remains oligotrophic, and as a consequence, is one of a handful of surface water supplies in the US that delivers drinking water without filtration.

Halfman et al., Owasco Lake: Water Quality & Nutrient Sources, 2011 - 17 Finger Lakes Institute, Hobart & William Smith Colleges
Finger Lake Water Quality Ranks: Water quality in Owasco Lake was still one of the worst of the eight easternmost Finger Lakes since 2005 (Table 5, Figs. 9 & 10). Owasco was similar to Cayuga and slightly worse that Otisco and Seneca. Honeoye was the worst lake in the survey. Canandaigua, Keuka and Skaneateles Lakes revealed the best water quality. These ranks were based on annual average secchi disk depths, and surface water concentrations of chlorophyll-a, total and dissolved phosphate, nitrate and total suspended sediment. Bacteria counts were included in the initial 2005 ranking but not measured since, and excluded from this 2005 through 2011 tabulation. The omission of bacteria data in the ranking modified Owasco’s rank from the worst lake in 2005 to one of the worst lakes.
Seven Years of Ranking
0
5
10
15
20
25
Hon
oeye
Can
andi
agua
Keu
ka
Sen
eca
Cay
uga
Ow
asco
Ska
neat
eles
Otis
co
Wat
er Q
ualit
y R
elat
ive
Ran
k (5
3 M
ax)
Bes
t <
====
> W
orst 2005
200620072008200920102011
Fig. 9. Annual Water Quality Ranks for the eight easternmost Finger Lakes. The dashed purple line is the boundary between typical oligotrophic and mesotrophic lakes based on “ranking” the boundary values (Table 3).
The change in water quality between lakes is due to a number of factors. As discussed earlier, the degree of water quality protection legislation and its implementation are important. For example, the Skaneateles, Canandaigua and Keuka watersheds have adopted a number of stringent regulations that protect and maintain the pristine nature of their lakes. The effort appeared to work in Canandaigua and Keuka Lakes, as water quality improved over the past until last year (a wet year). In contrast, water quality in Skaneateles over the past 4 years appeared to get worse until last year but these changes are small. A previous Owasco Lake report highlighted that the percentage of agricultural land and changes in precipitation from year to year influences these ranks. Other factors like population, watershed size and lake volume has minimal influence.
Oligotrophic
Mesotrophic

Halfman et al., Owasco Lake: Water Quality & Nutrient Sources, 2011 - 18 Finger Lakes Institute, Hobart & William Smith Colleges
The analysis identified an important silver lining. If nutrient loading decreases in any year, then water quality improves! Evidence for year-to-year improvement in water quality is observed in the ongoing nutrient reduction campaigns in Keuka and Canandaigua Lakes. Thus, hope exists to improve water quality in the other Finger Lakes and achieve the ultimate goal to preserve,
2005 - 2011 Mean Secchi Disk Depths
0123456789
10
Hon
eoye
Can
anda
igua
Keu
ka
Sen
eca
Cay
uga
Ow
asco
Ska
neat
eles
Otis
co
Avea
ge S
ecch
i Dep
th (m
)
2005200620072008200920102011
2005 - 2011 Mean Total Suspended Solids
0
1
2
3
4
Hon
eoye
Can
anda
igua
Keu
ka
Sen
eca
Cay
uga
Ow
asco
Skan
eate
les
Otis
co
Ave
rage
TS
S (m
g/L ) 2005 Surface
2006 Surface2007 Surface2008 Surface2009 Surface2010 Surface2011 Surface2005 Bottom2006 Bottom2007 Bottom2008 Bottom2009 Bottom2010 Bottom2011 Bottom
2006 - 2011 Mean Total Phosphates
0
5
10
15
20
25
Hon
eoye
Can
anda
igua
Keu
ka
Sen
eca
Cay
uga
Ow
asco
Ska
neat
eles
Otis
co
Pho
spha
te (T
P, u
g/L,
P)
2005 No Data2006 Surface2007 Surface2008 Surface2009 Surface2010 Surface2011 Surface2005 No Data2006 Bottom2007 Bottom2008 Bottom2009 Bottom2010 Bottom2011 Bottom
2005 - 2011 Mean Phosphate
02468
10121416
Hon
eoye
Can
anda
igua
Keuk
a
Sen
eca
Cay
uga
Ow
asco
Ska
neat
eles
Otis
co
Aver
age
Phos
phat
e (S
RP,
ug/
L, P
)
2005 Surface2006 Surface2007 Surface2008 Surface2009 Surface2010 Surface2011 Surface2005 Bottom2006 Bottom2007 Bottom2008 Bottom2009 Bottom2010 Bottom2011 Bottom
2005 - 2011 Mean Chlorophyll-a
05
10152025303540
Hon
eoye
Can
anda
igua
Keu
ka
Sen
eca
Cay
uga
Ow
asco
Ska
neat
eles
Otis
coAve
rage
Chl
orop
hyll-
a (u
g/L
2005 Surface2006 Surface2007 Surface2008 Surface2009 Surface2010 Surface2011 Surface2005 Bottom2006 Bottom2007 Bottom2008 Bottom2009 Bottom2010 Bottom2011 Bottom
2005 - 2011 Mean Nitrate
0.0
0.5
1.0
1.5
Hon
eoye
Can
anda
igua
Keu
ka
Sene
ca
Cay
uga
Ow
asco
Ska
neat
eles
Otis
co
Ave
rage
Nitr
ate
(mg/
L, N
)
2005 Surface2006 Surface2007 Surface2008 Surface2009 Surface2010 Surface2011 Surface2005 Bottom2006 Bottom2007 Bottom2008 Bottom2009 Bottom2010 Bottom2011 Bottom
Fig. 10. Annual mean surface and bottom water data from the Finger Lake survey.
The values plotted utilize data from sample dates in Owasco that were near the dates of the Finger Lakes surveys.

Halfman et al., Owasco Lake: Water Quality & Nutrient Sources, 2011 - 19 Finger Lakes Institute, Hobart & William Smith Colleges
protect and promote these lakes for future generations. Unfortunately, the opposite is also true. If nutrient loading continues then water quality in the lake will continue to degrade. For example, Seneca Lake has undergone a steady decline in water quality over the past decade, despite a thriving crop of zebra and quagga mussels.
Exotic species like zebra and quagga mussels, Asian clams and/or cercopagis, the spiny water flea, may play a water quality role as well. Zebra and quagga mussels filter feed on plankton. Thus, they effectively remove algae and other plankton from the lake, and thus “improve” water clarity and water quality. In contrast, Asian clams “pump” phosphorus into the water column from the sediments promoting algal growth and degrading water quality. The spiny water flea also causes plankton blooms by feeding on herbaceous (plant eating) zooplankton and thus decreasing algal predation.
STREAM RESULTS & DISCUSSION Stream Discharge: Site averaged stream discharge in 2011 ranged from 0 (dry) in the smallest tributaries during the dry summer to 8.4 m3/s at Rt 38 in Moravia in the early wet spring (Table 6, Figs. 11 & 12). Stream discharge was too large to safely measure by hand on a number of early spring dates, 3/5, 3/11, 4/23 (Fig. 12). The USGS gauge data on Owasco Inlet and its correlation with discharge data at Dutch Hollow Brook enabled discharge estimates for the Rts 38A and 38 downstream sites at Dutch Hollow Brook and Owasco Inlet (Fig. 11). Mean and individual discharge measurements were larger at those sites with a larger drainage basin upstream from the site on any given sample day (Fig. 13, r2 = 0.98). For example, the discharge was larger at Owasco Inlet than Dutch Hollow Brook with a 2011 average discharge of 8.4 and 2.5 m3/s, respectively, and parallel their watershed areas. The mean discharge of the smaller Fillmore (17 km2), Hemlock (47 km2) to larger Mill Creeks (78 km2) were 0.5, 0.7 and 1.6 m3/s, respectively.
Within Dutch Hollow Brook, discharge at each downstream site equaled or was slightly more than the sum of the discharges at the next upstream site and any tributaries entering between the downstream and upstream sites. For example, the sum of the mean annual discharges at the Southern Trib, Benson Trib and Benson Rd sites was similar to the discharge at North St. Along
2011 Stream Discharge Annual Average Flow
0123456789
Dut
chBa
rski
Trib
Bars
ki R
dN
orth
Sout
hBe
nson
B. T
ribO
ld S
tate
Inle
tM
ill C
rAu
rora
Fillm
ore
VWF
Rou
nds
LnSu
cker
port
Hem
lock
Cou
nty
Gro
ton
Dis
char
ge (m
3 /s)
2011 Stream Discharge Annual Average Flow
w ithout spring f loods
0
1
2
3
4
5
Dut
chBa
rski
Trib
Bars
ki R
dN
orth
Sout
hBe
nson
B. T
ribO
ld S
tate
Inle
tM
ill C
rAu
rora
Fillm
ore
VWF
Rou
nds
LnSu
cker
port
Hem
lock
Cou
nty
Gro
ton
Dis
char
ge (m
3 /s)
Fig. 11. 2011 site averaged stream discharge. Dutch
Hollow sites are in purple, Owasco Inlet sites in pink, and tributary sites are stippled. Sites are arranged
downstream to upstream.
Fig. 12. 2011 site average discharge without the 3/5, 3/11 & 4/23 spring floods.

Halfman et al., Owasco Lake: Water Quality & Nutrient Sources, 2011 - 20 Finger Lakes Institute, Hobart & William Smith Colleges
the Owasco Inlet, tributary inputs typically accounted for downstream discharges as well. The sum of the mean discharge at Country Line and Hemlock Creek was close to the discharge at Suckerport Lane, the downstream increase perhaps also reflecting the contributions from other minor creeks flowing into the Inlet along this segment. The mean discharge at Suckerport Lane, Rounds Lane and VWF, the next three downstream sites, were similar. The next downstream segment from Aurora Rd to Rt 38 was a notable exception. The average annual discharge observed at Rt 38 was smaller than the combined discharge at Mill Creek, a tributary to Owasco Inlet, and the Aurora St discharge, the next upstream site. Annual averages indicate that approximately 0.8 m3/s of water was lost to the ground along this stream segment. Perhaps this segment of stream intercepts unique glacial geology at the head of the Owasco Flats and is a major groundwater source to the wetland. A small portion of the loss could be groundwater withdrawals at the municipal well field that supplies ~0.2 m3/s to Moravia (Eileen O’Connor, personal communication, 2011).
Seasonal variability in discharge was observed (Fig. 14). Spring rains and snow melt generated the largest discharges in the early spring (3/5, 5/7 & 4/23). Discharges decreased from mid-May through the summer months (5/18 to 8/25), two tributaries to dryness, except for brief increases that corresponded to notable rainfall events. The Barski Rd tributary and Fillmore Creek were dry on 7/13, 7/27, 8/25, and 9/4. Discharges increased in the Fall (9/4 to 10/4) but did not exceed flows measured in the early spring. The seasonal change in flow paralleled the change in precipitation (Fig. 15). Precipitation in March, April and May was above the climatic normal whereas June and July were below
normal. Rainfall increased in September, the rainiest month of the field season, and declined to near average amounts in October.
Differences to Earlier Years: Annual mean stream discharge was larger in 2011 than previous years (Fig. 16). The major differences were two fold, the 2011 discharge data included measurements during the early spring and late fall (March, April, and October) when flows were relatively high compared to the summer, and 2011 had more rainfall during the eight-month field season than the earlier years (except for 2006). The “normal” rainfall for the March through October, during the eight-month period is 25.9 inches, but was 32.1” in 2006, 15.7” in 2007, 16.4” in 2008, 19.6” in 2009, 15.76” in 2010 and 25.8” in 2011 (National Weather Service, Ithaca Airport) (Fig. 17). Increased seasonal water losses due to increased summertime evaporation and plant evapotranspiration also contributed to the smaller summer discharges by intercepting groundwater flow that otherwise support base flow of the stream.
Stream Concentration Data: Total phosphate (TP) concentrations ranged from near zero to over 190 μg/L, and averaged 21 μg/L in Dutch Hollow Brook, and from near zero to 130 μg/L, and averaged 24 μg/L in Owasco Inlet (Table 6, Fig. 18). Water samples were only collected from the Rts 38A and 38 sites, near the terminus of Dutch Hollow Brook and Owasco Inlet, in March due to the high flows. The maximum values were much larger than previous data at these two sites due to the early spring sampling and heavy spring runoff. Variability was observed
Discharge vs. Watershed Area
R2 = 0.980123456789
0 50 100 150 200 250 300
Basin Area (km2)
Annu
al D
isch
arge
(m3 /s
)
Fig. 13. Discharge vs. basin size.

Halfman et al., Owasco Lake: Water Quality & Nutrient Sources, 2011 - 21 Finger Lakes Institute, Hobart & William Smith Colleges
between sample dates at each site and between sites on the same sample date. TP concentrations were largest at each site during the 3/5, 3/11 and 4/23 floods along Dutch Hollow Brook and Owasco Inlet. The detailed 8-hour sampling at Dutch Hollow Brook substantiates the precipitation, thus discharge, and TP concentration correlations (see next section). Runoff of soils and other phosphate-rich particles from agricultural landscapes and stream bank erosion are major non-point sources in Dutch Hollow Brook.
Barski Trib and Benson Trib to Dutch Hollow Brook revealed the largest mean TP concentrations in this drainage, 25 and 35 μg/L, respectively, whereas the upstream Benson Rd and Old State Rd sites along Dutch Hollow Brook revealed the smallest mean TP concentrations (10 and 14 μg/L). The difference corresponded to land use activities upstream from the sample sites. For example, the presence of upstream agricultural land, concentrated animal operations, exposed stream banks, and other non-point sources were associated with the larger concentrations.
Similar trends were also detected in the dissolved phosphate (SRP) and conductivity concentrations, and to a lesser degree total suspended solids (TSS) and nitrate concentrations in Dutch Hollow Brook. SRP, TSS and nitrate concentrations were larger after the spring floods than the other sample dates. SRP concentrations were largest at Barski Trib and Benson Trib than other sites, and smallest at Benson Rd and Old State Rd sites along Dutch Hollow Brook. Nitrate concentration patterns were slightly different. The largest concentrations were detected at the Southern Trib and Benson Trib sites, again reflecting the agricultural land use upstream in these drainages and the input of nitrate-rich groundwater.
Differences between phosphates and nitrates are to be expected. Phosphates bind to particles, and are typically remain in the soil. Phosphates only move when the soil particles move, unless the soil particles are saturated with phosphate. Thus, phosphates enter streams during runoff events. Nitrates on the other hand are significantly more water soluble, dissolve readily into surface and groundwater systems, and are easily flushed from the landscape. Thus, nitrates enter streams during runoff events and groundwater flow. The nitrate mobility versus the phosphate “stickiness” is why most farmers fertilize with nitrates and not phosphates, and phosphate-free lawn care products are suitable for homeowner lawn fertilizers. It is also a major reason why
2011 DischargeSeasonal Average Flow
0
5
10
15
20
Dutch Hollow Inlet Moravia
Dis
char
ge (m
3/s)
Spring
Summer
Fall
2011 Precipitation at Ithaca Airport
0
2
4
6
8
10
12
Mar
ch
Apr
il
May
June
July
Aug
ust
Sep
tem
ber
Oct
ober
Prec
ipita
tion
(inch
es)
2011 Precipitation Normal Precipitation Fig. 14. Seasonal averaged stream discharge for the Rts.
38A and 38 sites, the terminal sites on Dutch Hollow Brook and Owasco Inlet, respectively.
Fig. 15. Monthly 2011 and “normal” precipitation totals for the Ithaca Airport.

Halfman et al., Owasco Lake: Water Quality & Nutrient Sources, 2011 - 22 Finger Lakes Institute, Hobart & William Smith Colleges
most temperate lakes are phosphate limited. The TSS concentrations did not reveal consistent spatial trends. Their concentrations were typically larger at the faster moving streams.
In contrast, the largest mean TP and SRP concentrations in Owasco Inlet were observed at the Aurora (35 & 23 μg/L) and County Line (53 and 38 μg/L) sites, especially late in the summer during low flow conditions. These sites were immediately downstream from the Moravia and Groton wastewater treatment facilities, respectively, and indicate that both facilities were point sources of phosphate to the Inlet. Presumably, phosphates released in the effluent by the facilities impacted the stream, were not diluted as much, and resulted in larger concentrations during low flow in the summer months. Their release of phosphate changed over time as well. The TP and SRP concentrations decreased downstream from these sites, and suggested that less concentrated tributary inputs diluted the Owasco Inlet phosphate concentrations farther downstream. The smallest TP and SRP concentrations in the Owasco Inlet watershed were detected at Mill, Fillmore and Hemlock Creeks (TP of 13, 10, 14 μg/L, respectively). Both Mill and especially Fillmore, drain the least amount of agricultural land in this watershed.
Total suspended solids (TTS) and nitrate concentrations had different trends. TSS concentrations increased progressively farther downstream along Owasco Inlet, and were smallest at the three tributaries, Mill, Fillmore and Hemlock Creeks. Perhaps stream bank erosion and other sediment sources were important along the main channel of the Inlet. Nitrates were largest at Hemlock Creek, perhaps reflecting the agriculturally rich landscapes upstream. TSS and nitrates were again smallest in Fillmore, a forested watershed, and smaller in Mill, a watershed with lesser amounts of agricultural land than Hemlock Creek.
Stream Fluxes: The largest fluxes were detected during the largest discharge events in the early spring of 2011 (Fig. 19). This is not surprising. The spring floods also had the largest concentrations. The Owasco Inlet provided significantly larger fluxes of nutrients and sediments to the lake than Dutch Hollow Brook (TP 7.5 vs. 1.7 kg/day; SRP 5.0 vs. 0.9 kg/day; TSS 2,000 vs. 520 kg/day; N 299 vs. 102 kg/day or lower, respectively). The difference can be attributed to the difference in basin size, more specifically, the basin size and stream discharge correlation. The similar or slightly smaller concentrations of nutrients and suspended sediments combined with the largest discharge of water down the Inlet resulted in the largest fluxes to the lake.
Stream Discharge Annual Average
0123456789
Dutch Hollow Inlet Moravia
Dis
char
ge (m
3 /s) 2006
2007
2009
2010
2011*
*estimated spring f lood data
Precipitation Totals, Ithaca Airport 2006-2011
0
5
10
15
20
25
30
35
Normal 2006 2007 2008 2009 2010 2011
Pre
cipi
tatio
n (in
ches
)
8 Month Field-Seaon Rainfall Early Spring Rainfall Fig. 16. Annual average stream discharge for the Rts. 38A
and 38 sites. Stream data were not collected in 2008.
Fig. 17. Annual precipitation totals during the 8-month, March – October, field season at the Ithaca
Airport.

Halfman et al., Owasco Lake: Water Quality & Nutrient Sources, 2011 - 23 Finger Lakes Institute, Hobart & William Smith Colleges
No one segment along Dutch Hollow Brook provided significantly more nutrients or suspended sediments than any other segment. Nutrient fluxes steadily increased from the headwaters to the terminus of the stream. No one tributary added a significantly larger flux of nutrients either. For example, the Benson Trib site revealed the largest concentrations of phosphates. However, it also revealed the smallest flux of phosphates due to its relatively small discharge. Thus, no segment of this stream was the “primary” source of nutrients and suspended sediments. Instead, Dutch Hollow Brook gained nutrients along its entire course, a conclusion consistent with the pervasive nature of non-point sources including agricultural land, animal feedlot operations, golf courses, suburban homes and other fertilizer dependent or fertilize producing non-point sources throughout the watershed. The implications are noteworthy. To clean Dutch Hollow Brook’s non-point sources will be more challenging than a point source like Groton’s wastewater treatment facility because remediation must be applied throughout the entire watershed, impacting and garnering cooperation from everyone in the watershed.
In contrast, the increase in nutrient and suspended sediment fluxes along Owasco Inlet increased in steps. The largest steps were detected between the Groton and County Line sites, and between the VFW and Aurora sites. The annual mean increase in TP was 2.0 kg/day from Groton to County Line, and 2.3 kg/day from VFW to Aurora, after deducting Fillmore’s insignificant contribution. SRP increases were 1.6 and 2.0 kg/day, TSS 276 and 525 kg/day, and nitrates 18 and 77 kg/day, respectively. Increases at both segments were surprising because the Moravia plant was know for minimal nutrient fluxes (below its TP limits of 0.9 kg/day) in the past, and
2011 Total Phosphate Annual Average Concentration
0
10
20
30
40
50
60
Dut
chBa
rski
Trib
Bars
ki R
dN
orth
Sout
hBe
nson
B. T
ribO
ld S
tate
Inle
tM
ill C
rAu
rora
Fillm
ore
VWF
Rou
nds
LnSu
cker
port
Hem
lock
Cou
nty
Gro
ton
Avg
Lake
TP (u
g/L,
P)
2011 Dissolved Phosphate Annual Average Concentration
05
1015202530354045
Dut
chBa
rski
Trib
Bars
ki R
dN
orth
Sout
hBe
nson
B. T
ribO
ld S
tate
Inle
tM
ill C
rAu
rora
Fillm
ore
VWF
Rou
nds
LnSu
cker
port
Hem
lock
Cou
nty
Gro
ton
Avg
Lake
SRP
(ug/
L, P
)
2011 Nitrates
Annual Average Concentration
0.00.20.40.60.81.01.21.41.61.8
Dut
chBa
rski
Trib
Bars
ki R
dN
orth
Sout
hBe
nson
B. T
ribO
ld S
tate
Inle
tM
ill C
rAu
rora
Fillm
ore
VWF
Rou
nds
LnSu
cker
port
Hem
lock
Cou
nty
Gro
ton
Avg
Lake
Nitr
ate
(mg/
L, N
)
2011 Total Suspended Solids Annual Average Concentration
05
10152025303540
Dut
chBa
rski
Trib
Bars
ki R
dN
orth
Sout
hBe
nson
B. T
ribO
ld S
tate
Inle
tM
ill C
rAu
rora
Fillm
ore
VWF
Rou
nds
LnSu
cker
port
Hem
lock
Cou
nty
Gro
ton
Avg
Lake
TSS
(mg/
L)
Fig. 18. Site averaged stream and average lake (blue) nutrient and suspended sediment concentrations. Dutch Hollow sites are
in purple, Owasco Inlet sites in pink, and tributary sites are stippled. Sites are arranged downstream to upstream.

Halfman et al., Owasco Lake: Water Quality & Nutrient Sources, 2011 - 24 Finger Lakes Institute, Hobart & William Smith Colleges
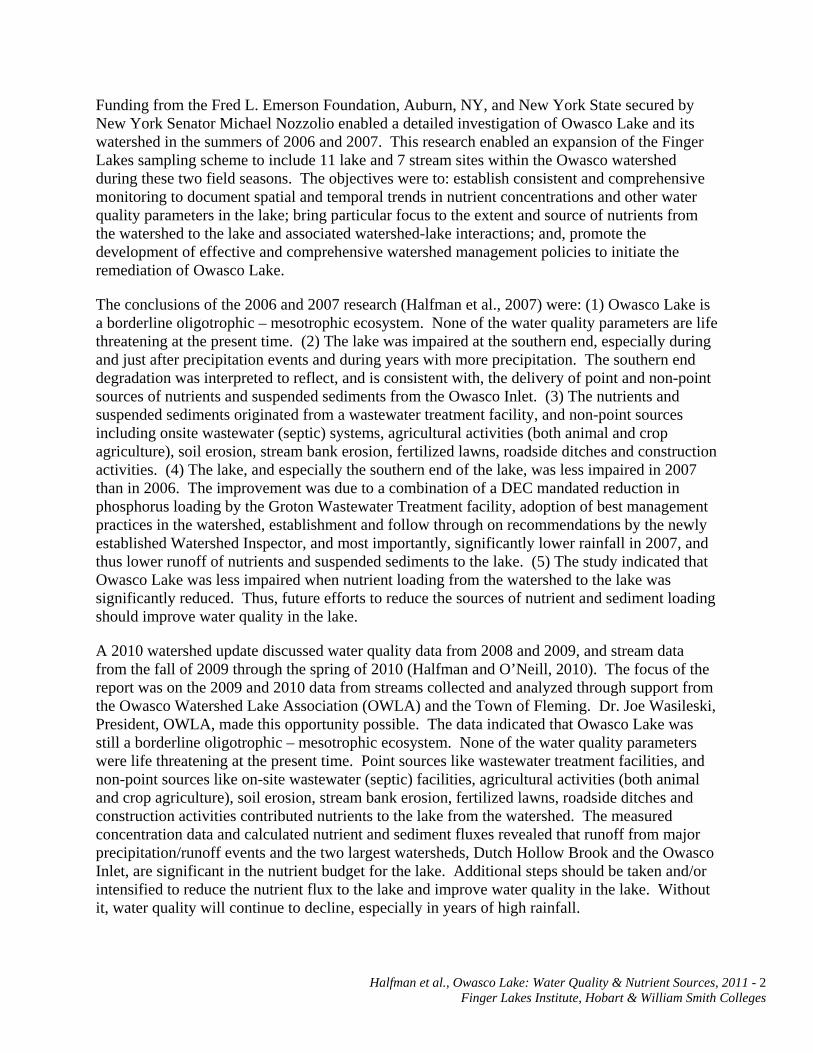
the Groton facility was recently mandated by NYS-DEC to reduce its nutrient loads to 0.9 kg/day from as high as 5 kg/day in 2003). The Groton effluent was below its 0.9 kg/day limit for phosphorus from 2008 through the summer of 2011, except for one month in 2010, but averaged 1.4 kg/day since June 2011 (Bruce Natale, personal communication, http://epa-echo.gov/echo/, Fig. 20). Groton’s effluent provided most of the measured Groton to County Line increase in stream flux. The Moravia facility was consistently below its 0.9 kg/day limit but data since late summer was not available. Thus the facility contributed ~50% of the measured increase from VFW to Aurora, and additional source (or sources) were necessary. Since these fluxes persist downstream, these two nutrient point sources impact water quality in the lake, especially its southern end. The facilities should be held to their DEC mandated limits to minimize the impact of their phosphorus loading to the lake as they have until recently at Groton. Further reductions might be cost prohibitive.
The two wastewater facilities only provided for a portion of the nutrients and suspended sediments flowing down Owasco Inlet. The average wastewater input was 1.3 kg/day through 2011 and only 17% of the total phosphorus flux of 7.5 kg/day flowing past the Rt 38 site in Moravia. Similar trends were detected for SRP, TSS and nitrates. Thus, other non-point sources including agriculture, on-site (septic), stream bank erosion, lawn fertilizer, roadside ditches, and construction activities must be remediated to reduce the phosphorus loading by the Inlet.
2011 Total Phosphate Annual Average Flux
w ithout spring f loods
012345678
Dut
chBa
rski
Trib
Bars
ki R
dN
orth
Sout
hBe
nson
B. T
ribO
ld S
tate
Inle
tM
ill C
rAu
rora
Fillm
ore
VWF
Rou
nds
LnSu
cker
port
Hem
lock
Cou
nty
Gro
ton
TP (k
g/da
y, P
)
2011 Dissolved Phosphate Annual Average Flux
w ithout spring floods
0
1
2
3
4
5
6
Dut
chBa
rski
Trib
Bars
ki R
dN
orth
Sout
hBe
nson
B. T
ribO
ld S
tate
Inle
tM
ill C
rAu
rora
Fillm
ore
VWF
Rou
nds
LnSu
cker
port
Hem
lock
Cou
nty
Gro
ton
SRP
(kg/
day,
P)
2011 Nitrates Annual Average Flux
w ithout spring f loods
0
50100
150200
250300
350
Dut
chBa
rski
Trib
Bars
ki R
dN
orth
Sout
hBe
nson
B. T
ribO
ld S
tate
Inle
tM
ill C
rAu
rora
Fillm
ore
VWF
Rou
nds
LnSu
cker
port
Hem
lock
Cou
nty
Gro
ton
Nitr
ate
(kg/
day,
N)
2011 Total Suspended Solids Annual Average Flux
w ithout spring floods
0
500
1,000
1,500
2,000
2,500
Dut
chBa
rski
Trib
Bars
ki R
dN
orth
Sout
hBe
nson
B. T
ribO
ld S
tate
Inle
tM
ill C
rAu
rora
Fillm
ore
VWF
Rou
nds
LnSu
cker
port
Hem
lock
Cou
nty
Gro
ton
TSS
(kg/
day)
Fig. 19. Site averaged nutrient and suspended sediment fluxes. Dutch Hollow sites are in purple, Owasco Inlet sites in pink,
and tributary sites are stippled. Sites are arranged downstream to upstream.
Halfman et al., Owasco Lake: Water Quality & Nutrient Sources, 2011 - 25 Finger Lakes Institute, Hobart & William Smith Colleges
The earlier data indicated that both Dutch Hollow Brook and Owasco Inlet contributed the largest fluxes of materials into the lake. Phosphate concentrations in these two streams are larger than the mean lake concentration. As a result, these streams add phosphorus to the lake. Since phosphate is a limiting nutrient, the phosphate loading therefore fertilizes the algae, increases algal productivity, and impairs water quality. The fluxes from these two streams were larger in 2011, so they probably still dominate the delivery of phosphorus to the lake.
In summary, the stream segment analyses detected both point and non-point sources of nutrients in the Owasco watershed. Non-point sources were especially important during major runoff events, and impacted the Dutch Hollow Brook watershed. Nutrient loading was still apparent from the Groton and Moravia WWT facilities in 2011 but their contribution was only a small percentage of the total load. Non-point sources should also be addressed in the Inlet watershed.
Seasonal and Longer-Term Variability: The concentration and flux of materials changed seasonally (Fig. 21). Total and dissolved phosphate and nitrate concentrations were larger in the spring than the summer and rebounded in the fall. Two exceptions were observed in the Owasco Inlet. Phosphate concentrations were larger in the fall than the summer and spring, and nitrate concentrations were smaller in the fall than the summer. Total suspended solids revealed the largest seasonal changes. The average spring TSS concentrations were 80 to 90 mg/L in Dutch Hollow and Owasco Inlet, respectively, whereas the summer
and fall averages fell under 5 mg/L in both streams. Spring rains and snowmelt over bare and saturated ground yielded the largest quantities of suspended nutrients and sediments to the lake.
The seasonal differences were more pronounced in the seasonal fluxes. TP, SRP, nitrates and TSS fluxes were largest in the spring and smallest in the summer. When concentrations and discharges had consistent or nearly consistent spring, summer fall patterns, then their fluxes would exaggerate the differences. The seasonal change in TSS was significantly more exaggerated than the other variables. It implies that annual fluxes calculated for earlier reports most likely underestimated the actual fluxes in those years because the pre-2011 field seasons lacked early spring and late fall data.
Groton and Moravia WWT FacilityPhosporus Loadings
0
0.5
1
1.5
2
2.5
Jul-0
8
Nov
-08
Mar
-09
Jul-0
9
Nov
-09
Mar
-10
Jul-1
0
Nov
-10
Mar
-11
Jul-1
1
Phos
poru
s (k
g/da
y)
MoraviaGroton
Fig. 20. Phosphate loading from the Groton and Moravia municipal wastewater treatment facilities (Bruce Natale, personal
communication, EPA website). The dotted line is the 0.9 kg/day daily discharge limit by the facilities.

Halfman et al., Owasco Lake: Water Quality & Nutrient Sources, 2011 - 26 Finger Lakes Institute, Hobart & William Smith Colleges
2011 Total PhosphateSeasonal Average Concentration
05
1015202530354045
Dutch Hollow Inlet Moravia
TP (u
g/L,
P)
Spring
Summer
Fall
2011 Total PhosphateSeasonal Average Flux
010
2030
4050
6070
Dutch Hollow Inlet Moravia
TP (k
g/da
y, P
)
Spring
Summer
Fall
2011 Dissolved Phosphate
Seasonal Average Concentration
0
5
10
15
20
Dutch Hollow Inlet Moravia
SRP
(ug/
L, P
)
Spring
Summer
Fall
2011 Dissolved PhosphateSeasonal Average Flux
0
5
10
15
20
25
Dutch Hollow Inlet Moravia
SRP
(kg/
day,
P)
Spring
Summer
Fall
2011 NitratesSeasonal Average Concentration
0.00.20.40.60.81.01.21.41.6
Dutch Hollow Inlet Moravia
Nitr
ate
(mg/
L, N
)
Spring
Summer
Fall
2011 NitratesSeasonal Average Flux
0
200
400
600
800
1000
Dutch Hollow Inlet Moravia
Nitr
ate
(kg/
day,
N)
Spring
Summer
Fall
2011 Total Suspended SolidsSeasonal Average Concentration
0
20
40
60
80
100
Dutch Hollow Inlet Moravia
TSS
(mg/
L) Spring
Summer
Fall
2011 Total Suspended SolidsSeasonal Average Flux
020,00040,00060,000
80,000100,000120,000140,000
Dutch Hollow Inlet Moravia
TSS
(kg/
day) Spring
Summer
Fall
Fig. 21. Seasonal average concentrations (left) and fluxes (right).

Halfman et al., Owasco Lake: Water Quality & Nutrient Sources, 2011 - 27 Finger Lakes Institute, Hobart & William Smith Colleges
Total Phosphate Annual Average Concentration
0
10
20
30
40
50
60
Dutch Hollow Inlet Moravia
TP (u
g/L,
P) 2006
2007
2009
2010
2011
Total PhosphateAverage Annual Flux
0
5
10
15
20
25
30
Dutch Hollow Inlet Moravia
TP (k
g/da
y, P
) 2006
2007
2009
2010
2011
Dissolved Phosphate
Annual Average Concentration
0
5
10
15
20
25
30
35
Dutch Hollow Inlet Moravia
SRP
(ug/
L, P
) 2006
2007
2009
2010
2011
Dissolved PhosphateAverage Annual Flux
0
2
4
6
8
10
12
Dutch Hollow Inlet Moravia
SRP
(kg/
day,
P) 2006
2007
2009
2010
2011
Nitrates
Annual Average Concentration
0.00.20.40.60.81.01.21.41.61.8
Dutch Hollow Inlet Moravia
Nitr
ate
(mg/
L, N
) 2006
2007
2009
2010
2011
NitrateAverage Annual Flux
050
100150
200250
300350
400
Dutch Hollow Inlet Moravia
Nitr
ate
(kg/
day,
N)
2006
2007
2009
2010
2011
Total Suspended Solids Annual Average Concentration
05
101520
2530
3540
Dutch Hollow Inlet Moravia
TSS
(mg/
L)
2006
2007
2009
2010
2011
Total Suspended SolidsAverage Annual Flux
05000
100001500020000
2500030000
3500040000
Dutch Hollow Inlet Moravia
TSS
(kg/
day)
2006
2007
2009
2010
2011
Fig. 22. Annual average concentrations (left) and fluxes (right).

Halfman et al., Owasco Lake: Water Quality & Nutrient Sources, 2011 - 28 Finger Lakes Institute, Hobart & William Smith Colleges
EVENT SAMPLING AT DUTCH HOLLOW BROOK Detailed Sampling of Dutch Hollow Brook: The data loggers and ISCO sampler investigated higher resolution, event-scale variability. The data logger stage data revealed textbook perfect responses to precipitation events (Fig. 23). The stage rapidly increased during rainstorms and peaked just after the bulk of the runoff. Larger precipitation events induced taller and longer duration peaks in stage. The increase in stage was from 5 cm from a few tenths of an inch of rain to more than 100 cm from a three inch rain on 9/7. The rise in stage was probably larger on this day but the flood dislodged the data logger housing from the stream bed at the 100 cm mark, and some data were lost. Once the rain stopped and the bulk of the runoff passed, the stage slowly declined back to base flow conditions. The slow decline reflected contributions from the waning runoff and rejuvenated near-surface groundwater flow. Each increase in stage through the 2011 field season corresponded to a precipitation event, although not all precipitation events induced a stream response, especially in the summer. The low flow, shallow pools along the stream and thick vegetation in the summer perhaps retarded the stream response. The stream was primarily in “base flow” mode, not “event” mode.
Dutch Hollow Brook - Rt 38A Site - Data Logger Data
0
10
20
30
40
50
60
70
6/6
6/16
6/26 7/
6
7/16
7/26 8/
5
8/15
8/25 9/
4
9/14
9/24
10/4
10/1
4
10/2
4
Date (2011)
Stag
e (c
m) &
Pre
cipi
tatio
n (m
m)
Stage (cm) Precipitation (mm)
Fig. 23. Data logger stage from Dutch Hollow Brook. Precipitation data was from NY-CY-8, a station within the watershed and part of the Community Collaborative Rain, Hail and Snow Network (CoCoRaHS). On 9/7, the
data logger housing was dislodged form the stream bed, and was replaced a few days later.
The data logger also recorded water temperature and specific conductance (Figs. 24 – 27). The temperatures rose from ~15°C in the early summer to over 35°C by late July back down to 5°C by the end of October as expected (Fig. 24). Water temperature fluctuated by 3°C up to 14°C each day (the “noise” in the record, Fig. 25). The lowest temperature was typically in the early morning around 8 or 9 am, and the warmest temperature was typically in the late afternoon, around 4 or 5 pm. This noise was largest during the summer. The change in temperature may have been artificially intensified by the deployment of the data loggers inside a white PVC pipe.

Halfman et al., Owasco Lake: Water Quality & Nutrient Sources, 2011 - 29 Finger Lakes Institute, Hobart & William Smith Colleges
However, similar fluctuations were observed when one data logger was deployed outside a PVC enclosure late in the season.
Specific conductance declined from ~500 μS/cm in the early summer to 420 μS/cm mid-summer (Fig. 26). During events, stream salinity typically decreased rapidly by 150 to 200 μS/cm, then immediately increased to pre-rain or slightly larger values after the event before slowly declining over time until the next event. It suggests that the rain and associated runoff diluted the stream and initiated a rejuvenated near-surface groundwater flow. Once the dilute surface runoff stopped, near-surface groundwater flow delivered more saline water to the stream until base flow slowly decreased and stabilized the salinity. Like stream temperatures, salinity also had a daily cycle (Fig. 27). The smallest salinity, by ~50 μS/cm, was in the late afternoon, 4 or 5 pm, and largest in the morning, 8 or 9 am. Perhaps water chemistry was impacted by the daylight uptake of water by photosynthesis and its nighttime release by respiration. Unfortunately, no daily signal was observed in the stage data.
The ISCO autosampler revealed significant response to events throughout the deployment (Fig. 28). TSS increased dramatically from 10 or less mg/L during base flow to at least 150 mg/L during an event, and rose to a maximum of over 1,500 mg/L in the largest event (3” of rain on 9/7). These large TSS concentrations were restricted the runoff portion of the storm event, and declined quickly during the return to base flow. It indicates that runoff events transported soil
Dutch Hollow Brook - Rt 38A Site - Data Logger Data
0
10
20
30
40
50
60
70
6/6
6/16
6/26 7/
6
7/16
7/26 8/
5
8/15
8/25 9/
4
9/14
9/24
10/4
10/1
4
10/2
4
Date (2011)
Stag
e (c
m)
0
5
10
15
20
25
30
35
Wat
er T
empe
ratu
re (
o C)
Stage Temperature
Dutch Hollow Brook - Rt 38A Site - Data Logger Data
010203040506070
7/6
7/7
7/8
7/9
7/10
7/11
7/12
7/13
7/14
7/15
7/16
Date (2011)
Stag
e (c
m)
05101520253035
Wat
er T
empe
ratu
re (
o C)
Stage Temperature
Fig. 24. Data logger water temperature data. Fig. 25. Daily fluctuations in water temperature.
Dutch Hollow Brook - Rt 38A Site - Data Logger Data
0
10
20
30
40
50
60
70
6/6
6/16
6/26 7/
67/
16
7/26 8/
5
8/15
8/25 9/
49/
14
9/24
10/4
10/1
4
10/2
4
Date (2011)
Stag
e (c
m)
300
350
400
450
500
550
600
650
Sp C
ondu
ctan
ce (u
S/cm
)
Stage Specific Conductance
Dutch Hollow Brook - Rt 38A Site - Data Logger Data
010203040506070
7/6
7/7
7/8
7/9
7/10
7/11
7/12
7/13
7/14
7/15
7/16
Date (2011)
Stag
e (c
m)
300350400450500550600650
Sp C
ondu
ctan
ce (u
S/cm
)
Stage Specific Conductance
Fig. 26. Data logger salinity data. Fig. 27. Daily fluctuations in water salinity.

Halfman et al., Owasco Lake: Water Quality & Nutrient Sources, 2011 - 30 Finger Lakes Institute, Hobart & William Smith Colleges
particles to and impaired water quality in the stream. Occasionally small events did not transport sediments to the stream, especially in the middle of the summer. It suggests that summer stands of vegetation, if available, may have retarded the movement of soil particles to the stream. Alternatively, the low flow conditions may have allowed the suspended particles to settle out in localized pools in the stream before it reached the 38A site.
The observation hints at two remediation processes to reduce TSS impairments. Buffer strips of vegetation alongside each stream course, where the vegetation reduces the velocity of the runoff and allows particles to settle out instead of entering the stream. Alternatively, installation of gully plugs and retention ponds in low lying areas as they could provide time for the suspended sediment to settle out before the runoff spills into the nearby stream.
Total and dissolved phosphates revealed similar event responses. TP and SRP concentrations increase significantly from mean base flow concentrations of 40 and 10 μg/L, respectively, to mean event concentrations of 95 and 64 μg/L, and maximum event concentrations of 250 and 250 μg/L, respectively. The data reveal a direct linkage to and the importance of runoff events for phosphorus loading to the lake. Thus, the remediation steps to reduce phosphate loading would be similar to remediating suspended sediment loadings, i.e., reduce the erosion of soil from runoff events.
Total PhosphatesAutosampler (8 hr samples)
0
50
100
150
200
250
6/6
6/26
7/16 8/
5
8/25
9/14
10/4
10/2
4
Date (2011)
TP (u
g/L,
P)
0
10
20
30
40
50St
age
(cm
)
Total Phosphate (µg/L, TP) Stage (cm) Precipitation (mm)
Dissolved PhosphatesAutosampler (8 hr samples)
0
50
100
150
200
250
6/6
6/26
7/16 8/
5
8/25
9/14
10/4
10/2
4
Date (2011)
SRP
(ug/
L, P
)
0
10
20
30
40
50
Stag
e (c
m)
Phosphate SRP (ppb or ug/L, P) Stage (cm) Precipitation (mm) Total Suspended Solids
Autosampler (8 hr samples)
050
100150200250300350400450500
6/6
6/16
6/26 7/
6
7/16
7/26 8/
5
8/15
8/25 9/
4
9/14
9/24
10/4
10/1
4
10/2
4
Date (2011)
TSS
(mg/
L)
0
10
20
30
40
50
Stag
e (c
m)
TSS (mg/L) Stage (cm) Precipitation (mm)
NitratesAutosampler (8 hr samples)
0
1
2
3
6/6
6/26
7/16 8/
5
8/25
9/14
10/4
10/2
4
Date (2011)
Nitr
ate
(mg/
L, N
)
0
10
20
30
40
50
Stag
e (c
m)
Nitrate (mg/L, N) Stage (cm) Precipitation (mm)
Fig. 28. Autosampler nutrient and suspended sediment concentrations.

Halfman et al., Owasco Lake: Water Quality & Nutrient Sources, 2011 - 31 Finger Lakes Institute, Hobart & William Smith Colleges
Nitrate concentrations revealed a slightly different event response pattern. Events still provided larger nitrate concentrations than base flow concentrations with mean concentrations of 2.5 and 1.2 mg/L, respectively. The event/peak concentration however was not dramatically larger than the base flow concentrations as it was for the TSS, TP and SRP data. The increase to the peak concentration and subsequent decline to base flow conditions were slower as well. It indicates that the runoff provided a considerable quantity of nitrates to the stream, however the rejuvenated near-surface groundwater flow provided nitrates as well, just after the runoff events. Because nitrates are water soluble and not bound to particles, they can enter a stream by runoff and groundwater routes.
Flux calculations for the autosampler data required estimating the stream discharge for every autosampler sample. The discharges were estimated in two parts (Fig. 29). First, the Dutch Hollow mean daily stage data were correlated to the USGS mean daily discharge estimates at the Inlet (Site ID: 04235299, r2 = 0.78). Then, the bi-monthly Dutch Hollow discharge data were correlated to the USGS Owasco Inlet mean daily USGS Inlet discharge (r2 = 0.98). The result transformed hourly stage data into discharge data for Dutch Hollow Brook. A similar but not as robust correlation was observed if the Dutch Hollow stage data were directly compared to the Dutch Hollow bi-monthly discharge data and provided similar results (r2 = 0.77).
Dutch Hollow Stage & Owasco Inlet Flow
y = 2.3813x + 13.274R2 = 0.78
0
10
20
30
40
50
60
70
80
0 5 10 15 20 25
Owasco Inlet Q (m3/s)
Dutc
h H
ollo
w S
tage
(cm
)
Stream Comparison
020406080
100120140160180200
4/3
4/18 5/3
5/18 6/2
6/17 7/2
7/17 8/1
8/16
8/31
9/15
9/30
10/1
5
10/3
0
Dutc
h H
ollo
w S
tage
(cm
)
05101520253035404550
Ow
asco
Inle
t Dis
harg
e, Q
(m3 /s
)
DH Data Logger Sample Dates Ow asco Inlet Flow
Dutch Hollow Data Logger Calibration
y = 0.2888xR2 = 0.99
0
2
4
6
8
10
12
14
16
18
0 10 20 30 40 50 60USGS Owasco Inlet Q (m3/s)
Mea
sure
d D
utch
Hol
low
Q (m
3 /s)
Measured Q vs Stage at Dutch Hollow
y = 0.1079x - 1.2464R2 = 0.77
0
1
2
3
4
5
6
0 10 20 30 40 50 60
Dutch Hollow Stage (cm)
Mea
sure
d Du
tch
Hol
low
Q (m
3 /s)
Fig. 29. Estimation of Dutch Hollow Brook 8-hour autosampler discharges from Dutch Hollow Brook stage, bi-monthly discharge
and daily USGS discharge data from Owasco Inlet (Station ID 04235299) .

Halfman et al., Owasco Lake: Water Quality & Nutrient Sources, 2011 - 32 Finger Lakes Institute, Hobart & William Smith Colleges
The fluxes of TSS, TP, SRP and nitrates were very event dependent (Fig. 30). TSS fluxes averaged 25,000 kg/day during events but only 115 kg/day during base flow conditions, where events were defined as any sample with a minimum TSS flux of 500 kg/day. TP and SRP averaged 7 and 4.6 kg/day during events but only 0.4 and 0.1 kg/day during base flow. During the entire 2011 field season, Dutch Hollow provided 1,200,000 kg of sediment to the lake during events, but only 10,000 kg during base flow conditions. In a similar light, 348 kg of TP and 230 kg of SRP were delivered to the lake during events compared to 41 and 9 kg during base flow over the course of the study. The significant difference between events and base flow dictate once again the importance to reduce the delivery of nutrient and sediments by runoff events.
The ISCO samples also indicated that bi-weekly or monthly grab samples may incorrectly estimate fluxes down a stream. If the periodic grab sampled collected event (or base flow) samples, then fluxes would be grossly over (or under) estimated. In 2011, the autosampler estimated that the mean flux of sediments was 8,700 kg/day, total phosphates 2.7 kg/day, dissolved phosphates 1.7 kg/day, and nitrates 76 kg/day. The bi-monthly sampling over the same time period estimated a mean flux of sediments was 520 kg/day, total phosphates 1.7 kg/day, dissolved phosphates 0.9 kg/day, and nitrates 102 kg/day. If the spring flood were
Total Phosphate Autosampler Flux
0
5
10
15
20
25
30
6/6
6/16
6/26 7/
67/
167/
26 8/5
8/15
8/25 9/
49/
149/
2410
/410
/14
10/2
4
Date (2011)
TP (k
g/da
y, P
)
0
10
20
30
40
50
Stag
e (c
m)
TP Flux Stage (cm) Precipitation (mm)
Dissolved Silica Autosampler Flux
0100200300400500600700800900
6/6
6/16
6/26 7/
67/
167/
26 8/5
8/15
8/25 9/
49/
149/
2410
/410
/14
10/2
4
Date (2011)
Silic
a (k
g/da
y)0
10
20
30
40
50
Stag
e (c
m)
Silica Flux Stage (cm) Precipitation (mm)
Total Suspended Solids Autosampler Flux
0
5000
10000
15000
20000
6/6
6/16
6/26 7/
67/
167/
26 8/5
8/15
8/25 9/
49/
149/
2410
/410
/14
10/2
4
Date (2011)
TSS
(kg/
day)
0
10
20
30
40
50
Stag
e (c
m)
TSS Flux Stage (cm) Precipitation (mm)
Nitrate Autosampler Flux
0
100
200
300
400
500
600
6/6
6/16
6/26 7/
67/
167/
26 8/5
8/15
8/25 9/
49/
149/
2410
/410
/14
10/2
4
Date (2011)
Nitr
ate
(kg/
day,
N)
0
10
20
30
40
50
Stag
e (c
m)
Nitrate Flux Stage (cm) Precipitation (mm)
Fig. 30. Autosampler nutrient and suspended sediment fluxes.

Halfman et al., Owasco Lake: Water Quality & Nutrient Sources, 2011 - 33 Finger Lakes Institute, Hobart & William Smith Colleges
included, then the bi-monthly sampling estimated annual fluxes of 28,000 kg/day for TSS, 11.2 kg/day for TP, 2.4 kg/day for SRP, and 198 kg/day for nitrates.
The higher frequency sampling by the autosampler provided the best estimate of the flux during its deployment, unfortunately deployment was delayed until June and missed the spring flow. The 2011 bi-monthly data appeared to underestimate the nutrient and sediment loading to the lake because not enough samples were collected during events. However, the direct sampling and autosampler fluxes in 2011 were close, i.e., same order of magnitude, so the earlier data were smaller but probably in the correct ballpark. Finally, these differences suggest that both Dutch Hollow Brook and Owasco Inlet should be sampled by autosampler over the entire early spring to late fall field season to estimate annual fluxes in the future. The detailed analyses were very labor intensive and more expensive, but worth the extra effort and cost because the autosampler provided more accurate data due to its higher frequency and ability to resolve event and base flow inputs. The autosampler data also provided greater insight into the timing and mechanism for the delivery of nutrients and sediments to the lake.
PHOSPHATE BUDGET: Phosphorus is critical to the health and water quality of Owasco Lake because it limits algal growth. For example, reductions in stream inputs from 2006 to 2007 improved water quality in the southern end of the lake. However, the stream inputs are only one part of the equation. A complete budget must also include additional inputs like atmospheric loading, lakeshore fertilizers and lakeshore septic systems. Outputs must be calculated as well and include the outflow of phosphorus-rich materials through the Owasco Outlet and their burial into the sediments (Fig. 31). To determine the net change in phosphorus, all of the inputs and outputs must be compared. Phosphorus will increase in the lake, if inputs exceed outputs, decrease if inputs are less than outputs, or remaining the same if inputs to equal outputs from the lake. To improve water quality, inputs must be smaller than outputs.
Fig. 31. The phosphorus budget: Sources and sinks for phosphorus in Owasco Lake. Water quality improves if inputs are less than outputs, especially stream inputs.

Halfman et al., Owasco Lake: Water Quality & Nutrient Sources, 2011 - 34 Finger Lakes Institute, Hobart & William Smith Colleges
The Inputs: The autosampler estimated a mean phosphate flux of 2.7 kg/day from Dutch Hollow Brook but the autosampler missed the spring floods. After including the spring fluxes from the bi-monthly sampling, Dutch Hollow Brook delivered, on average, 12 kg/day. Owasco Inlet delivered 28 kg/day based on the available 2011 bi-monthly data. A proportional extrapolation of these two streams to the entire Owasco Lake watershed (using surface areas), determined that 15.4 metric tons of phosphorus was added to the lake in 2011. The 2011 annual stream load was larger than the 2006 and 2007 estimates of 1.5 to 5 metric tons/day, respectively. But 2011 was a relatively wet year, and included early spring and late fall samples. In comparison, the 2011 summer only annual load from the watershed was 4 metric tons.
A second input was the deposition of phosphorus from the atmosphere. The National Atmospheric Deposition Program site in Ithaca, NY, (Site: NY67) reported an annual average phosphate concentration in rainfall between 3 and 4 μg/L in 2009 and 2010, respectively (http://nadp.isws.illinois.edu/). 2011 data were not available. This equates to a mean annual deposition rate of 4.5 mg/m2, or 0.0045 metric tons/km2. New Jersey, Connecticut and Minnesota reported annual loads of 0.004 to 0.025 metric tons/km2 of phosphorus. Thus the atmospheric load to the entire lake is less than 0.1 metric tons/year, and significantly less than stream inputs.
A third input was septic systems from lakefront properties within 300 feet of the shoreline. Any septic contributions from properties along streams were included in the stream data, and properties farther away than 300 ft have negligible inputs because phosphorus binds to solid particles. Estimates of the phosphorus loadings from lakeshore septic systems assumed a mean phosphorus concentration in the tanks (~10 mg/L), mean water use by each property (~200 L/capita/day), the number of days each lakeshore dwelling is occupied (~240 days/year) balancing seasonal (280) and permanent (325) use, and the number of lakeshore properties on septic systems (605, Eileen O’Connor, personal communication). Thus, the approximate septic loading to Owasco Lake from lakeshore properties is estimated at 0.7 kg TP/capita/year. Assuming 605 lakefront properties utilizing septic systems and 3 people per property, the total loading is less than 1 metric ton per year. This load is probably an over-estimate because the Watershed Inspector and Cayuga County Health Department have kept septic systems in compliance with the law and septic failures are the best way to leak phosphates into a nearby lake. For example, the per capita estimate assumed a 10% failure rate whereas Cayuga County’s inspection system has a 2% failure rate or less. This loading is larger than atmospheric estimates but significantly smaller than stream inputs. It does highlight that septic inspections and their upgrades when justified should be continued to reduce this loading to the lake.
Input from lakeshore fertilizer use is too tenuous to even estimate at this time.
The total 2011 estimated influx is then 15.4 plus 0.1 plus 1 or 16.5 metric tons/year.
The Outputs: Phosphorus is lost from the lake through the Outlet in the form of algae, organic-rich dissolved compounds, organic particulates, and other occasional larger organisms (e.g., fish). Approximately 2.4 metric tons of phosphorus flows out the Outlet each year assuming an annual mean total phosphate concentration of 12 μg/L (everything but the occasional fish or log), and the 2011 mean daily discharge of 6.4 m3/s (USGS Owasco Outlet flow data, Site ID 04235440). Similar fluxes out the Outlet were determined for 2006 and 2007. Both are probably

Halfman et al., Owasco Lake: Water Quality & Nutrient Sources, 2011 - 35 Finger Lakes Institute, Hobart & William Smith Colleges
over estimates because total phosphate concentrations and Outlet flow decrease in the winter months.
Burial in the sediments is another mechanism to remove phosphorus from the lake. Unfortunately, limited sediment data are available to make an accurate calculation. Total phosphates were measured in a short, dated box core (Brown et al., in revision). Extrapolating the mean phosphate content, mean sedimentation rates, and assuming sediment density and porosity values over the entire deepwater portion of the lake estimated a flux of a few metric tons of phosphorus each year. A similar estimate was determined using organic matter contents in dated piston cores (Halfman et al., 2008). Clearly more work is required to firm up this estimate, as it is risky to base the flux on only a few sediment cores. The risk is similar to estimating annual stream fluxes based on a few grab samples instead of a detailed autosampler analyses.
The total 2011 estimated efflux is then 2.4 plus 2 or 4.4 metric tons/year.
The Net Flux: Owasco Lake gained 16.5 minus 4.4 or roughly 12 metric tons each year. This net flux mass is larger than the 8 metric tons of phosphorus currently in the lake, assuming a mean lake total phosphate concentration of 10 μg/L and a lake volume of 781 x 106 m3. If this input persists, it suggests that the lake could easily become impaired (TP concentration > 20 μg/L).
In conclusion, a phosphorus mass balance is difficult to estimate because some of the inputs and outputs are tenuous at this time. The largest uncertainties are the sediment efflux and some of the septic system assumptions. The available data however suggest that phosphorus inputs were larger than outputs in 2011, and placed the lake in positive phosphorus balance. Streams were the primary source of phosphorus to the lake providing nearly 95% of the total influx, and streams gained the majority of their phosphorus during runoff events. Thus, nutrient reduction efforts must focus on the streams, and the major event related source from streams is non-point sources, i.e., agricultural areas. If the reductions occur, the lake may attain a negative balance, and water quality will improve. However the financial burden to install the remediation practices cannot be dumped on the farmer. Water quality is a watershed-wide issue. Everyone benefits from a cleaner lake. Thus everyone should help support the remediation effort.
RECENT EFFORTS IN THE CONESUS WATERSHED A recent study investigated the impact of Best Management Practices (BMPs) on the delivery of nutrients and suspended sediments to Conesus Lake from its agriculturally-rich watershed. The parallels to Owasco Lake are intriguing so the outcomes of the study are highlighted below.
BMPs in the Conesus Watershed: Dr. Joseph Makarewicz, SUNY Brockport, and his research team working in conjunction with Cornell Cooperative Extension offices, County Soil and Water offices, Watershed Inspector office, and most importantly the farming community, evaluated the linkages between watershed improvements and downstream outcomes through the use of various BMPs that retained soils, nitrates, organic nitrogen and phosphorus on the landscape. They established a variety of BMPs in several agriculturally dominated (> 70% agricultural land use) watersheds while monitoring two additional “control” watersheds, one draining predominately agricultural land with no BMPs and the other predominately forested watershed. The implemented BMPs included manure management (e.g., no winter spreading, injection instead of

Halfman et al., Owasco Lake: Water Quality & Nutrient Sources, 2011 - 36 Finger Lakes Institute, Hobart & William Smith Colleges
spreading, lagoons), fertilizer reductions, crop rotating to increase soybean and alfalfa planting, barnyard drainage, grass and other vegetative buffer strips, winter cover or minimum tillage, subsurface drainage tiles, terracing, sedimentation basins (gully plugs), and fencing animals from streams. All of the watersheds were continually and extensively monitored for stream discharge, suspended sediment, nitrate, total phosphate and soluble reactive phosphate concentrations for five years on a weekly basis. The sampling was increased to hourly samples during runoff events. Their findings were published in a special volume of the Journal of Great Lakes Research (Volume 35 Supplement 1), and supported through grants from the US Department of Agriculture with local matching funds.
Makarewicz and his colleagues highlighted the following results:
• Before the implementation of the BMPs, the streams discharge, and nutrient and suspended sediment flux were event responsive. Over 80% of the nutrient and sediment loss from the watershed occurred within the six largest major precipitation events.
• The BMPs implemented in the Conesus Lake watersheds induced significant reductions in the delivery of nutrients and sediments to the lake.
• The Great Gully watershed, where BMPs impacted the largest percentage of the watershed revealed the greatest reduction in the delivery of nutrients and suspended sediments to the lake (~50% less sediments, 30% less nitrates, 50% less total phosphates and 60% less dissolved phosphates, Fig. 32).
Total Suspended Solids (Flux/Area)
0.000.050.100.150.200.250.30
GraywoodGully
Sand PointGully
NorthMcMillan
Creek
TSS
(kg/
d/ha
) WY 1
WY 2
WY 3
WY 4
WY 5
Nitrate (Flux/Area)
0.000.050.100.150.200.250.30
GraywoodGully
Sand PointGully
NorthMcMillan
Creek
Nitr
ate
(kg
N/d
/ha)
WY 1
WY 2
WY 3
WY 4
WY 5
Total Phosphate (Flux/Area)
0.00000.00050.00100.00150.00200.00250.0030
GraywoodGully
SandPoint Gully
NorthMcMillan
Creek
TP (k
g P/
d/ha
)
WY 1
WY 2
WY 3
WY 4
WY 5
Soluble Phosphate (Flux/Area)
00.0010.0020.0030.0040.0050.006
GraywoodGully
Sand PointGully
NorthMcMillan
Creek
SRP
(kg
P/d/
ha)
WY 1
WY 2
WY 3
WY 4
WY 5
Fig. 32. Mean daily flux of suspended nutrients and sediments per unit area from two Conesus Lake watersheds.
Graywood Gully watershed, an agriculturally-rich watershed (>70%) was subjected to a series of BMPs during year 1 that precipitated the observed reductions in nutrient and sediment loadings. North McMillan Creek was a forested
watershed, and used as the control.

Halfman et al., Owasco Lake: Water Quality & Nutrient Sources, 2011 - 37 Finger Lakes Institute, Hobart & William Smith Colleges
• These reductions yielded a parallel reduction in metaphyton (plankton, 72% reduction), macrophytes (rooted nearshore plants, 30 to 50% reduction) and microbial communities (25% reduction) in nearshore regions of Conesus Lake adjacent to the tributaries with BMPs.
• The nutrient and sediment reductions at Great Gully however, did not decrease to the smaller loadings / hectare from the forested watershed, North McMillian Creek. Even after five years, this agricultural watershed still delivered more nutrients and sediments to the lake than the non-agricultural, forested, watershed.
• Agricultural watersheds with minimal BMPs implementation did not reveal significant changes in nutrient and suspended sediment loads. Thus, the BMPs had an impact on nutrient and sediment delivery to the lake.
In conclusion, BMPs effectively and significantly reduced nutrient and suspended sediments loads to and improve water quality in Conesus Lake. Similar programs should be implemented in the Owasco Watershed. Critical for its success however is the availability of funding to make these BMP improvements. The financial burden however cannot be placed solely on the farmer.
CONCLUSIONS & RECOMMENDATIONS: This report confirms and expands on earlier findings. As previously observed, Owasco Lake is a borderline oligotrophic – mesotrophic lake with more parameters leaning towards a mesotrophic system in 2010 and 2011 than before.
As discussed in earlier reports, the variety of the pollutant sources in the Owasco watershed suggests a multifaceted approach to remediate water quality in Owasco Lake. The approaches include but are not limited to the utilization of a watershed inspector, increase use of agricultural BMPs, reduce nutrient loading by nutrient point sources like municipal wastewater treatment facilities, the conversion of the Owasco Inlet floodplain to a wetland, and education and outreach at all levels. All of these remediation efforts were recently initiated and/or already proposed for the watershed. This is good, and this important work should be continued into the future. All of them should help improve water quality in the lake. Without it, water quality would decline over time.
The 2011 survey substantiated earlier findings and uncovered a number of new conclusions.
• Segment analysis highlighted the importance of non-point sources throughout the Dutch Hollow Brook watershed.
• Segment analysis also highlighted the importance of both point and non-point sources in the Owasco Inlet. It revealed that both the Moravia and Groton facilities impacted water quality along the Inlet, however their combined impact was less than the inputs from other sources, and asking them to reduce their daily load limits further might be cost prohibitive.
• Seasonal sampling revealed significant spring and fall loads compared to the summer months, especially for phosphates and suspended sediments. It suggests that earlier, pre-2011, nutrient fluxes under-estimated the annual load to the lake.
• The event survey at Dutch Hollow Brook highlighted the dominance of runoff events from non-point sources to the delivery of phosphates and suspended sediments to the lake and facilitated a more robust estimate of stream fluxes to the lake.

Halfman et al., Owasco Lake: Water Quality & Nutrient Sources, 2011 - 38 Finger Lakes Institute, Hobart & William Smith Colleges
• The event survey should be performed throughout the spring, summer and fall seasons in both the Dutch Hollow and Owasco Inlet watersheds.
• A phosphate budget for Owasco Lake suggested that the inputs of phosphorus from the streams, atmosphere and septic systems along the lakeshore are larger than the losses out the Owasco Outlet and burial into the deepwater sediments.
• Streams contributed the largest flux and the amount of phosphorus to the lake. The annual influx exceeded the total amount currently in the lake. Thus, efforts must be initiated to significantly reduce this input to improve water quality in the lake.
• Septic inspections and more stringent upgrades when justifiable should continue along the lakeshore and near major streams.
• Finally, BMPs installed in the Conesus watershed significantly reduced nutrient and suspended sediment loading from agriculturally-rich watersheds. Similar BMPs should be implemented in the Owasco watershed to reduce the input of phosphates from non-point sources to the lake, while at the same time monitoring downstream of BMPs and other remediation projects to assess their effectiveness. However the financial burden to install the BMPs cannot be placed solely on the farmer. Water quality is a watershed-wide issue. Everyone benefits from a cleaner lake. Thus everyone should help support the remediation effort.
ACKNOWLEDGEMENTS The 2011 research was supported by Cayuga County Legislature and Owasco Lake Watershed Association through the hard work and persistence of Dr. Joe Wasileski, with financial support to OWLA by the DE French and SW Metcalf Foundations. We thank members of the Cayuga County Planning Department, Cayuga County Water Quality Management Agency, Owasco Lake Watershed Management Council, Cayuga County Health Department, Owasco Watershed Lake Association, the Institute for the Application of Geospatial Data, and NYS Department of Environmental Conservation for their help, and numerous individuals, specifically, Senator Mike Nozzolio, Barbara Halfman, Dr. Joe Wasileski, Cayuga County Council Chair Peter Tortorici, Jessica Miles, Eileen O-Connor, Bruce Natale, Ron Podolak, John Klink, Bill Graney, and David Eckhardt. Additional thanks are extended to the following students who helped with the 2011 fieldwork: Ethan Black, Trevor Blum, Kyle Bunce, Laura Carver-Dionne, Molly George, Phil Hackett, Chad Hecht, Abby Kent, Sam Knopka, Haleigh Marshall, Lucy Melara, Mohamed Mounir and Taylor Weber.

Halfman et al., Owasco Lake: Water Quality & Nutrient Sources, 2011 - 39 Finger Lakes Institute, Hobart & William Smith Colleges
Table 2. 2011 Lake Data.

Halfman et al., Owasco Lake: Water Quality & Nutrient Sources, 2011 - 40 Finger Lakes Institute, Hobart & William Smith Colleges
Table 4. Date Averaged Plankton Data, 2006 through 2011.

Halfman et al., Owasco Lake: Water Quality & Nutrient Sources, 2011 - 41 Finger Lakes Institute, Hobart & William Smith Colleges
Table 5: Annual Mean 2011 Lake Data from the Finger Lake Survey.

Halfman et al., Owasco Lake: Water Quality & Nutrient Sources, 2011 - 42 Finger Lakes Institute, Hobart & William Smith Colleges
Table 6. 2011 Stream Data.

Halfman et al., Owasco Lake: Water Quality & Nutrient Sources, 2011 - 43 Finger Lakes Institute, Hobart & William Smith Colleges
Table 6. 2011 Stream Data (continued)

Halfman et al., Owasco Lake: Water Quality & Nutrient Sources, 2011 - 44 Finger Lakes Institute, Hobart & William Smith Colleges
Table 6. 2011 Stream Data (continued).