overview-the-current-status-of-global--us-tobacco-regulation316 (1)
TRANSCRIPT

The Current Political-Economy of Nicotine &Economy of Nicotine & Tobacco in the US and
Around the WorldF ll D lFarrell DelmanDarryl JaysonDarryl Jayson
Chris MollTMA’s 99th Annual Meeting & Conference
M 20 2014
Chris Moll
@TMA_org conference.tma.org
May 20, 2014Williamsburg, Virginia
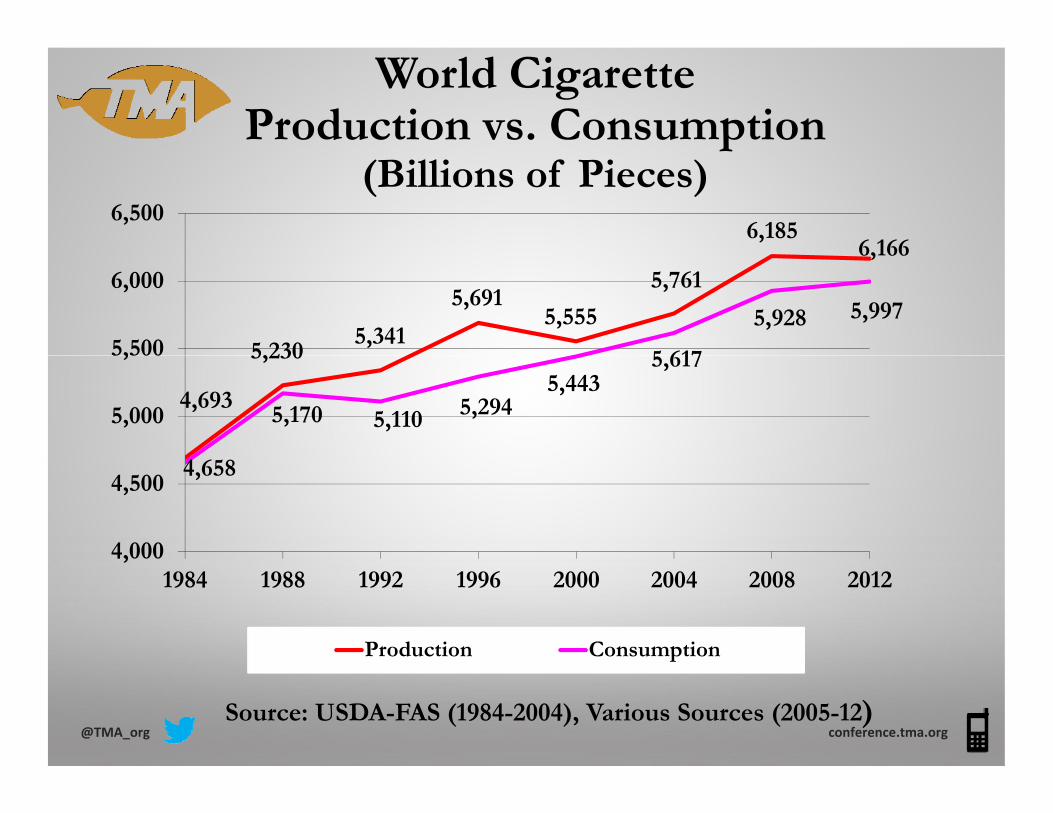
World CigaretteProduction vs. Consumptionp
(Billions of Pieces)6,185
6,166
6,500
5,2305,341
5,6915,555
5,7616,166
5 617
5,928 5,997
5,500
6,000
4,693
5,230
5,170 5,110 5,2945,443
5,617
5,000
5,500
4,658
4,000
4,500
,1984 1988 1992 1996 2000 2004 2008 2012
Production Consumption
@TMA_org conference.tma.orgSource: USDA-FAS (1984-2004), Various Sources (2005-12)

Global Smuggling Estimate(Billions of Pieces)( o s o eces)
700
800659.49 678.57
715.81669.39 666.68
500
600
700
510.15
659.49588.58 611.99
669.39 666.68
200
300
400 340.39
0
100
1993 1997 2000 2003 2005 2007 2009 2011 2013
Total World Smuggling
Note: Smuggling figures include counterfeit units
@TMA_org conference.tma.org
Note: Smuggling figures include counterfeit units.Source: TMA Estimates from various sources
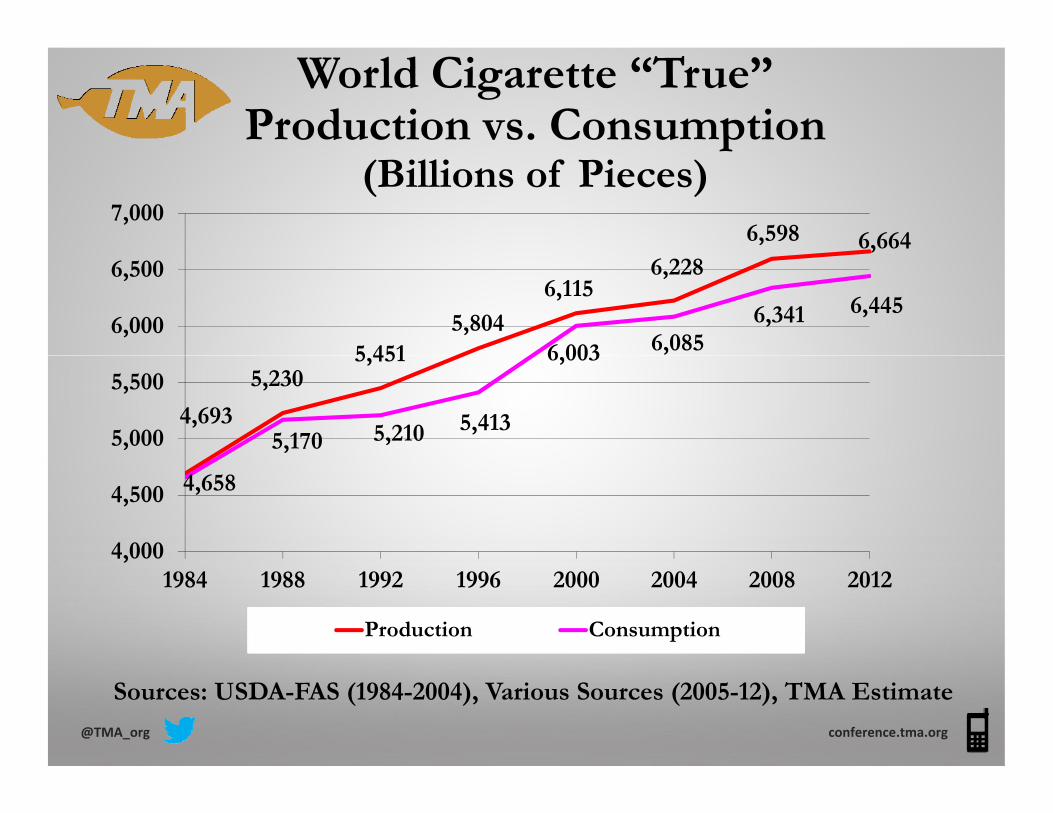
World Cigarette “True”Production vs. Consumptionp
(Billions of Pieces)6,598 6,664
7,000
5 4515,804
6,1156,228
6 003 6,0856,341 6,445
6,000
6,500
4,693
5,2305,451
5,170 5,210 5,413
6,003
5,000
5,500
4,658
4,000
4,500
,1984 1988 1992 1996 2000 2004 2008 2012
Production Consumption
@TMA_org conference.tma.org
Sources: USDA-FAS (1984-2004), Various Sources (2005-12), TMA Estimate

World CigaretteProduction vs. Consumptionp
(Billions of Pieces)6,185
6,166
6,500
5,2305,341
5,6915,555
5,7616,166
5 617
5,928 5,997
5,500
6,000
4,693
5,230
5,170 5,110 5,2945,443
5,617
5,000
5,500
4,658
4,000
4,500
,1984 1988 1992 1996 2000 2004 2008 2012
Production Consumption
@TMA_org conference.tma.orgSource: USDA-FAS (1984-2004), Various Sources (2005-12)

World (excluding China)Cigarette Prod. vs. Cons.g
(Billions of Pieces)5,000
3 991 3 980
4,500
3,6303,685 3,697
3,9913,878 3,887 3,980
3,6553,772 3,758 3 7323 500
4,000
3,595 3,613 3,488 3,635, , 3,732
3,506
3,000
3,500
,1984 1988 1992 1996 2000 2004 2008 2012
Production Consumption
@TMA_org conference.tma.orgSource: USDA-FAS (1984-2004), Various Sources (2005-12)
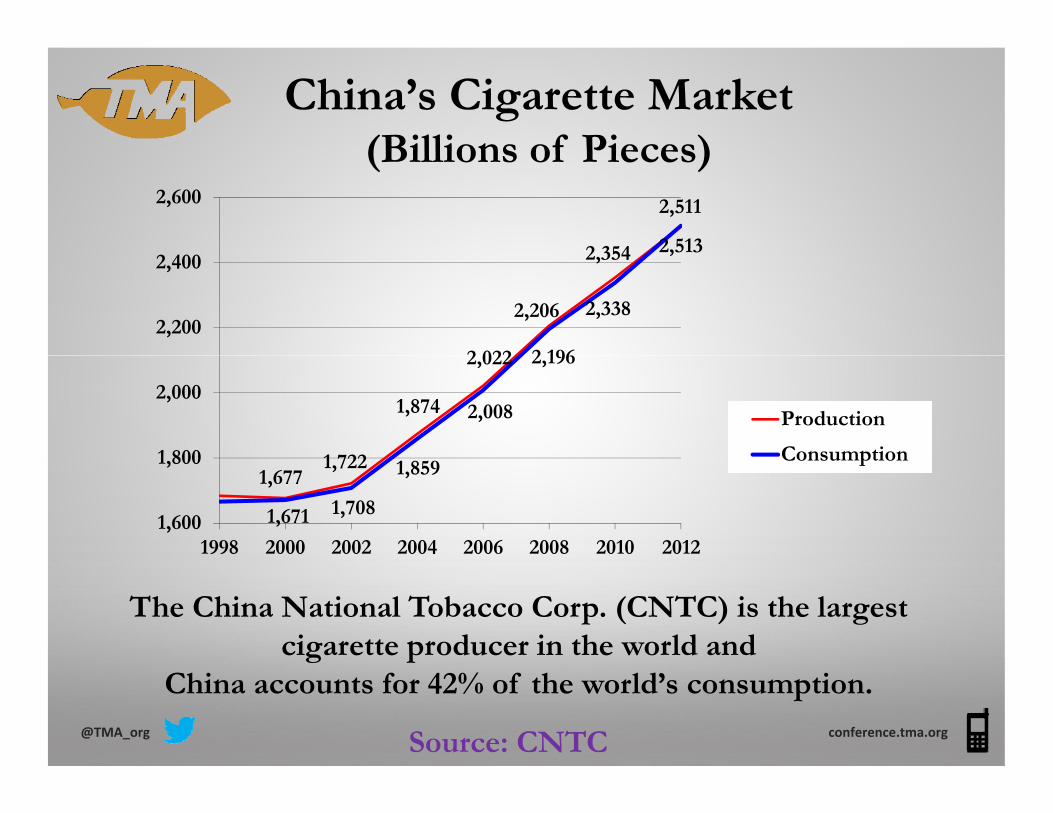
China’s Cigarette Market(Billions of Pieces)(Billions of Pieces)
2 354
2,511
2,513
2,600
2 022
2,206
2,354
2 196
2,338
,
2,200
2,400
1 722
1,874
2,022
2,008
2,196
1 800
2,000Production
Consumption1,677
1,722
1,671 1,708
1,859
1,600
1,800
1998 2000 2002 2004 2006 2008 2010 2012
Consumption
The China National Tobacco Corp. (CNTC) is the largest cigarette producer in the world and
@TMA_org conference.tma.org
China accounts for 42% of the world’s consumption.
Source: CNTC
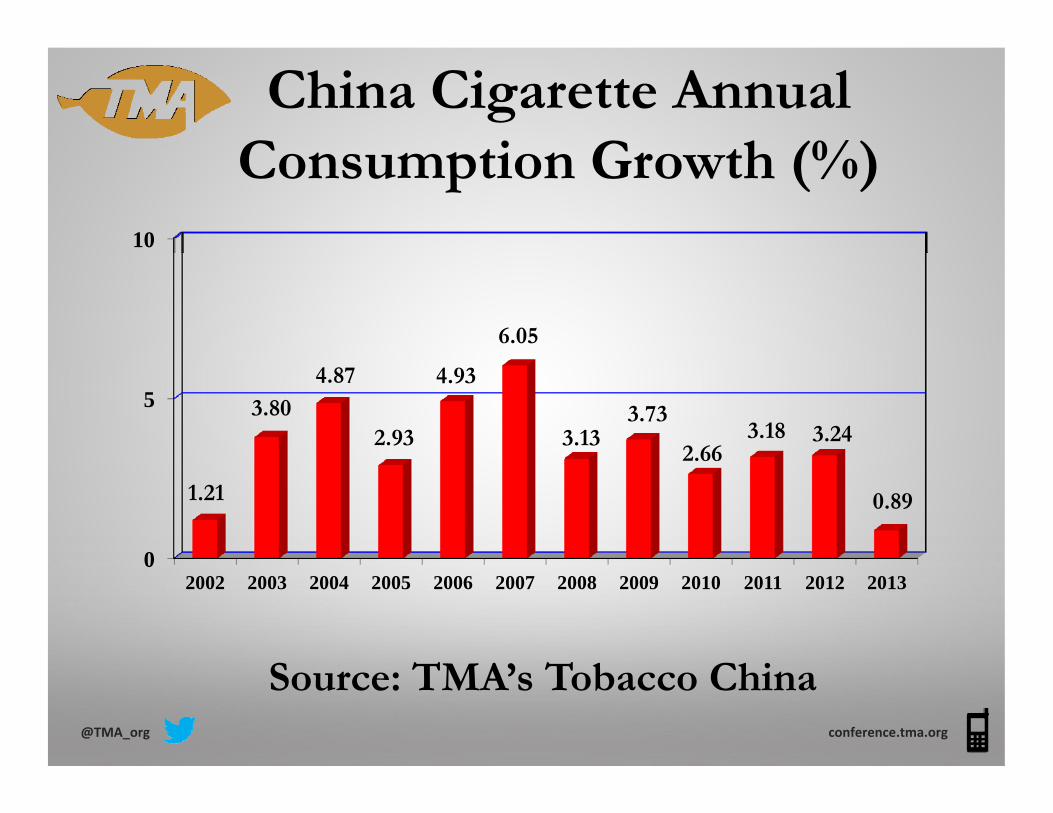
China Cigarette AnnualC ti G th (%)Consumption Growth (%)
10
6.05
5 3.804.87
2.93
4.93
3.133.73
2.663.18 3.24
0
1.21
2.66
0.89
S T A T b Chi
02002 2003 2004 2005 2006 2007 2008 2009 2010 2011 2012 2013
@TMA_org conference.tma.org
Source: TMA’s Tobacco China

China’s Cigarette Market & Forecast(Billions of Pieces)(Billions of Pieces)
2,513 2,510
2,600
2 196
2,338
, ,2,490
2,200
2,400
2,008
2,196
1 800
2,000Production
Consumption
1,6711,708
1,859
1,600
1,800
1998 2000 2002 2004 2006 2008 2010 2012 2014 2016 2018
Consumption
The China National Tobacco Corp. (CNTC) is the largest cigarette producer in the world and
@TMA_org conference.tma.org
China accounts for 42% of the world’s consumption.Source: CNTC, TMA Estimate

China vs. Rest-of-World Cigarette Consumption ForecastsConsumption Forecasts
(Billions of Pieces)3 500 3 387
3 000
3,500 3,387 3,3673,320 3,287
3,253
2 500
3,000
2,510 2,500 2,485 2,470 2,450
2 000
2,500 , 2,450
2,0002014 2015 2016 2017 2018
China Cig. Consumption World minus China Cig. Consumption
@TMA_org conference.tma.orgSource: TMA Estimates
g p g p
China2014 Expectations:
• Export Growth
L Ci G h• Large e-Cig Growth
M k O i d R f• Market-Oriented Reforms
• More Brand Integration• More Brand Integration
• Tobacco control expansion• Tobacco control expansionconference.tma.org@TMA_org

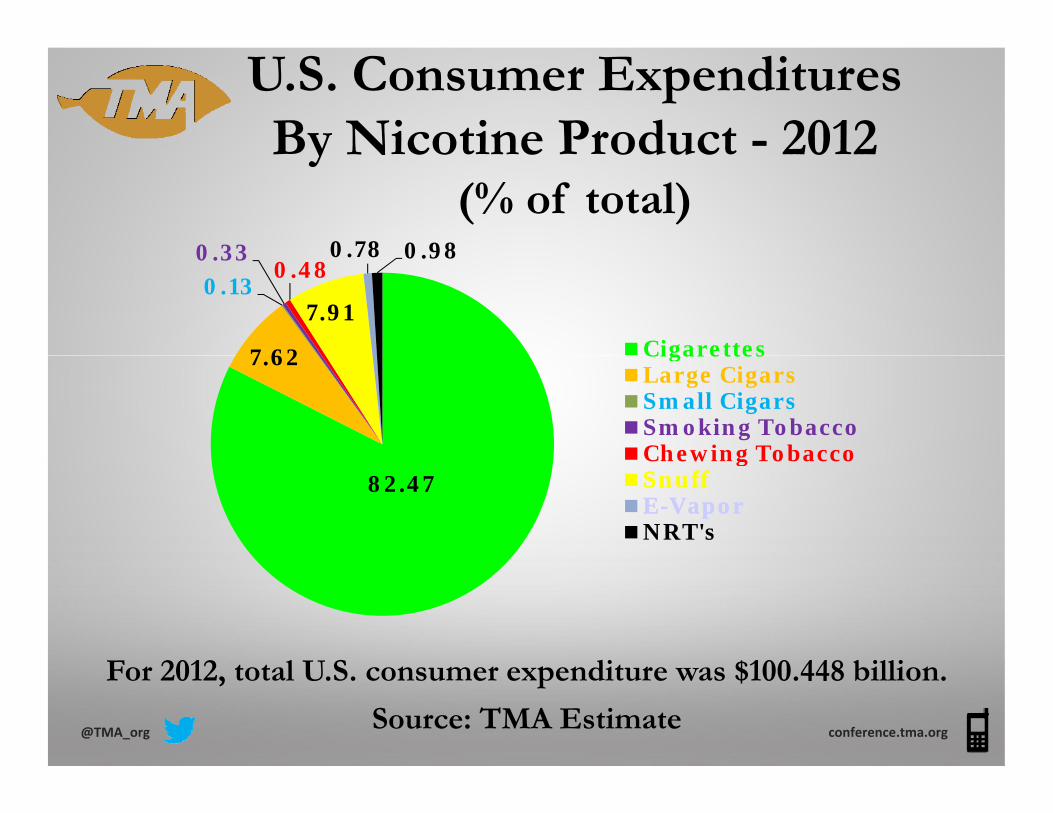
U.S. Consumer ExpendituresBy Nicotine Product - 2012By Nicotine Product 2012
(% of total expenditures)0 33 0.78 0 98
7 62
0.130.33
0.48
7.91
0.78 0.98
Cigarettes7.62 CigarettesLarge CigarsSmall CigarsSmoking TobaccoChewing Tobacco
82.47Chewing TobaccoSnuffSnuffEE--VaporVaporNRT's
F 2012 l U S di $100 448 billi
@TMA_org conference.tma.org
For 2012, total U.S. consumer expenditure was $100.448 billion.
Source: TMA Estimate
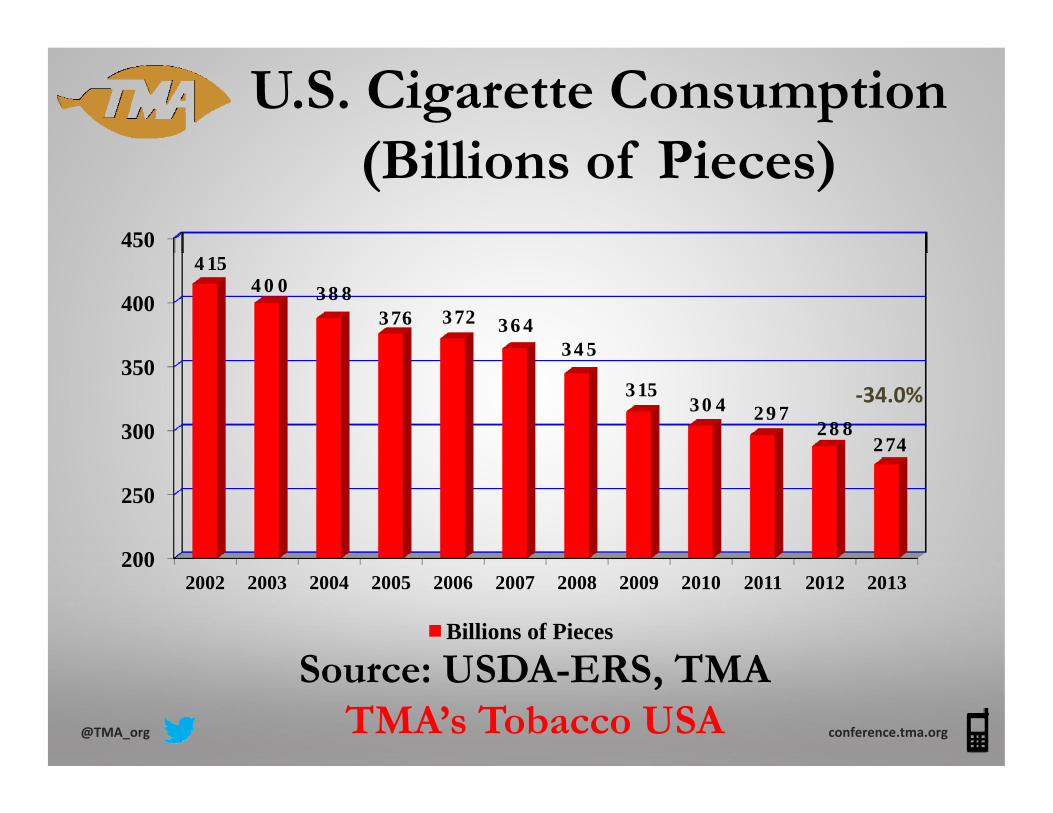
U.S. Cigarette Consumption(Billi f Pi )(Billions of Pieces)
450
400
415400 388
376 372 364345
300
350345
315304 297
288274
‐34.0%
200
250
S USDA ERS TMA
2002002 2003 2004 2005 2006 2007 2008 2009 2010 2011 2012 2013
Billions of Pieces
@TMA_org conference.tma.org
Source: USDA-ERS, TMATMA’s Tobacco USA

Cigarette Price Hikes (2002-14)On January 1 2002 the manufacturer’s price for a 20 piece packOn January 1, 2002, the manufacturer’s price for a 20-piece pack
of premium cigarettes was $2.68 including FET.April 2002 $2.76 (+8¢) 39¢ FETD mb r 2006 $2 86 (+10¢) 39¢ FETDecember 2006 $2.86 (+10¢) 39¢ FETSeptember 2007 $2.91 (+5¢) 39¢ FETMay 2008 $3.00 (+9¢) 39¢ FETDecember 2008 $3.05 (+5¢) 39¢ FETDecember 2008 $3.05 (+5¢) 39¢ FETFebruary 2009 $3.14 (+5¢) 39¢ FETMarch 2009 $3.85 (+71¢) 100.33¢ FETOctober 2009 $3.91 (+6¢) 100.33¢ FET( )May 2010 $3.99 (+8¢) 100.33¢ FETDecember 2010 $4.07 (+8¢) 100.33¢ FETJuly 2011 $4.16 (+9¢) 100.33¢ FETDecember 2011 $4.21 (+5¢) 100.33¢ FETJune 2012 $4.27 (+6¢) 100.33¢ FETDecember 2012 $4.33 (+6¢) 100.33¢ FETJ 2013 $4 39 (+6¢) 100 33¢ FETJune 2013 $4.39 (+6¢) 100.33¢ FETDecember 2013 $4.46 (+7¢) 100.33¢ FETMay 2014 $4.52 (+6¢) 100.33¢ FET

NPM Market Share (%)
1010
6.45
8.17 8.037.39
6.295 82 6.10
53.73
3.39
4.36
5.825.11
6.10
5.06
2.52 2.35
02000 2001 2002 2003 2004 2005 2006 2007 2008 2009 2010 2011 2012 2013
@TMA_org conference.tma.orgSource: Price Waterhouse Cooper
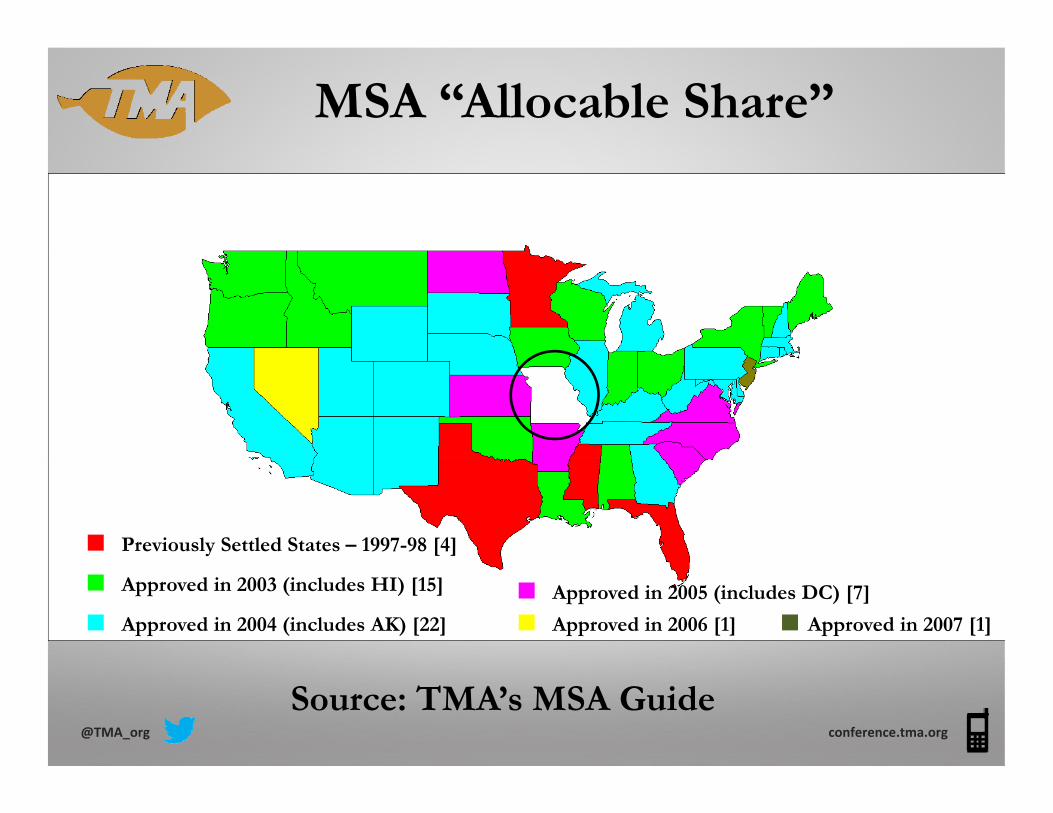
MSA “Allocable Share”
Previously Settled States – 1997-98 [4]
Approved in 2003 (includes HI) [15]
Approved in 2004 (includes AK) [22]
Approved in 2005 (includes DC) [7]
Approved in 2006 [1] Approved in 2007 [1]
@TMA_org conference.tma.org
Source: TMA’s MSA Guide

State Cigarette Excise Tax Increases (2002-13)( )
# of States Avg. Tax Inc. Wgt. Tax
2002 21 43.00¢ 61.15¢
2003 17 34.94¢ 72.85¢
2004 7 39.07¢ 78.02¢
2005 12 60.38¢ 92.22¢2005 12 60.38¢ 92.22¢
2006 5 24.50¢ 94.54¢
2007 10 62.50¢ 107.25¢
2008 8 73.75¢ 119.74¢
2009 15 52.23¢ 132.52¢
2010 6 87.58¢ 145.36¢2010 6 87.58¢ 145.36¢
2011 4 33.50¢ 147.48¢
2012 2 52.00¢ 149.87¢
2013 2 130.00¢ 152.50¢
2014 (as of 5/20) 1 13.00¢ 152.60¢

U.S. Cigarette Annual C ti D li (%)Consumption Decline (%)
108 70 SCHIP8.70 SCHIP
?
5
2 35
3.613.00 3.09
2 15
5.22
3.49
2 303.03
4.86?
0
2.35
1.06
2.15 2.30
S USDA ERS TMA
02002 2003 2004 2005 2006 2007 2008 2009 2010 2011 2012 2013
Billions of Pieces
@TMA_org conference.tma.org
Source: USDA-ERS, TMATMA’s Tobacco USA

Cigarette Brand Market Share(%)(%)
50
30
40
32.3
37.7 38.2 41.0 40.6
20
3024.4
9 8 11.6
0
10
1992 1996 2000 2004 2008 2012
4.8 6.1 7.68.0 9.8 11.6
4.1 4.6 5.4 5.8 6.7 7.4
1992 1996 2000 2004 2008 2012
Marlboro Newport Camel
Source: Maxwell Consumer Report@TMA_org conference.tma.org
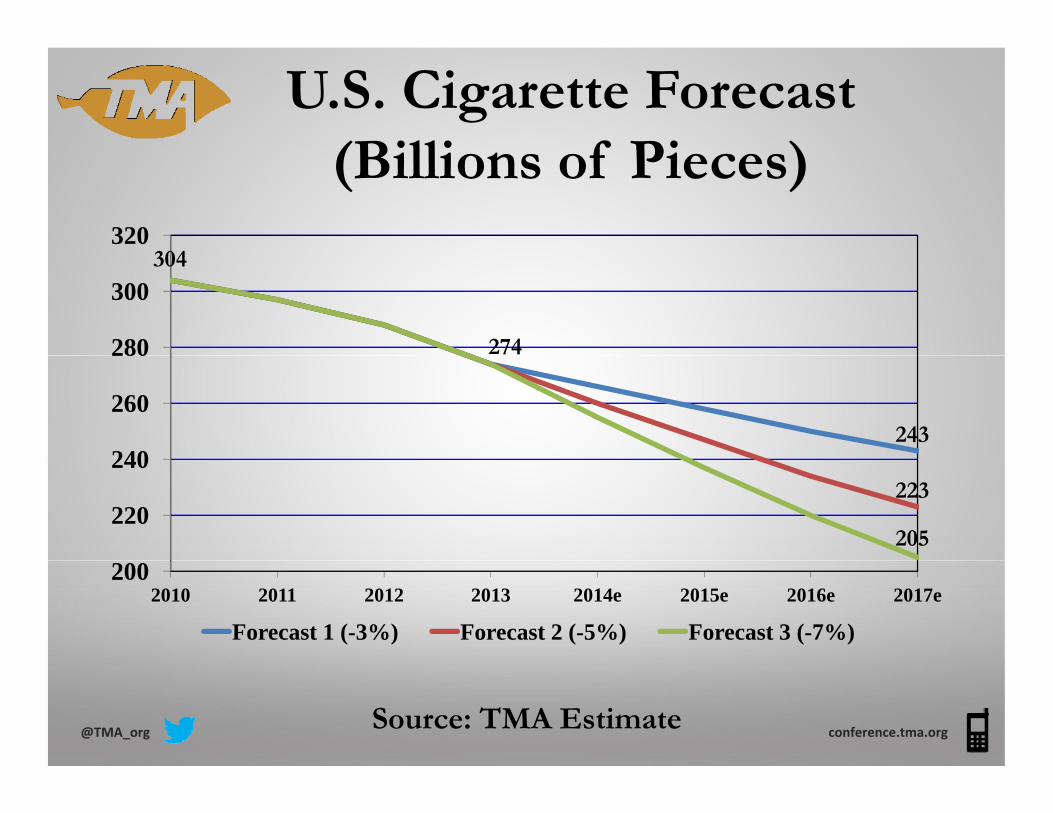
U.S. Cigarette Forecast(Billi f Pi )(Billions of Pieces)
320304
280
300304
274
240
260
280
243
220
240223
205
2002010 2011 2012 2013 2014e 2015e 2016e 2017e
Forecast 1 (-3%) Forecast 2 (-5%) Forecast 3 (-7%)
@TMA_org conference.tma.orgSource: TMA Estimate

U.S. Large Cigars(Billi f Pi )(Billions of Pieces)
15
109.79
12.36 13.03 13.0412.44
SCHIP
54.94 4.88
5.30 5.55 5.76
0
5
02004 2005 2006 2007 2008 2009 2010 2011 2012 2013
Production Sales
@TMA_org conference.tma.orgSource: US-TTB

U.S. Little Cigars(Billi f Pi )(Billions of Pieces)
10
5
2 70
3.774.16
4.775.47
SCHIP
0
2.702.15
0.98 0.80 0.75 0.67
02004 2005 2006 2007 2008 2009 2010 2011 2012 2013
Production Sales
@TMA_org conference.tma.orgSource: US-TTB

U.S. Roll-Your-Own Tobacco(Billions of Pieces [converted])(Billions of Pieces [converted])
10
5 756.34 6.06 5.97
6.766.15
5
5.75
3.82
3.072.41 2 27
SCHIP
0
2.41 2.27
02004 2005 2006 2007 2008 2009 2010 2011 2012 2013
Production Sales
@TMA_org conference.tma.orgSource: USDA-AMS1 cigarette = 0.0325 ounces of RYO
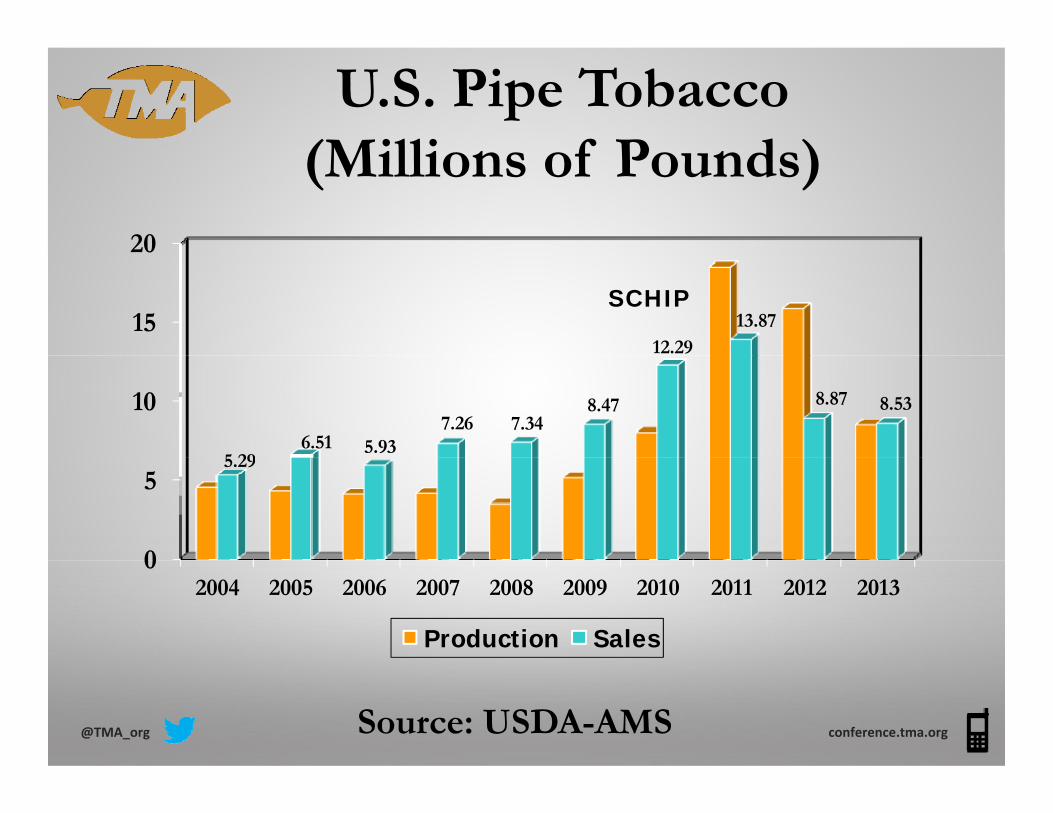
U.S. Pipe Tobacco(Milli f P d )(Millions of Pounds)
20
1512.29
13.87SCHIP
10
5 296.51 5.93
7.26 7.348.47 8.87 8.53
0
55.29
02004 2005 2006 2007 2008 2009 2010 2011 2012 2013
Production Sales
@TMA_org conference.tma.orgSource: USDA-AMS
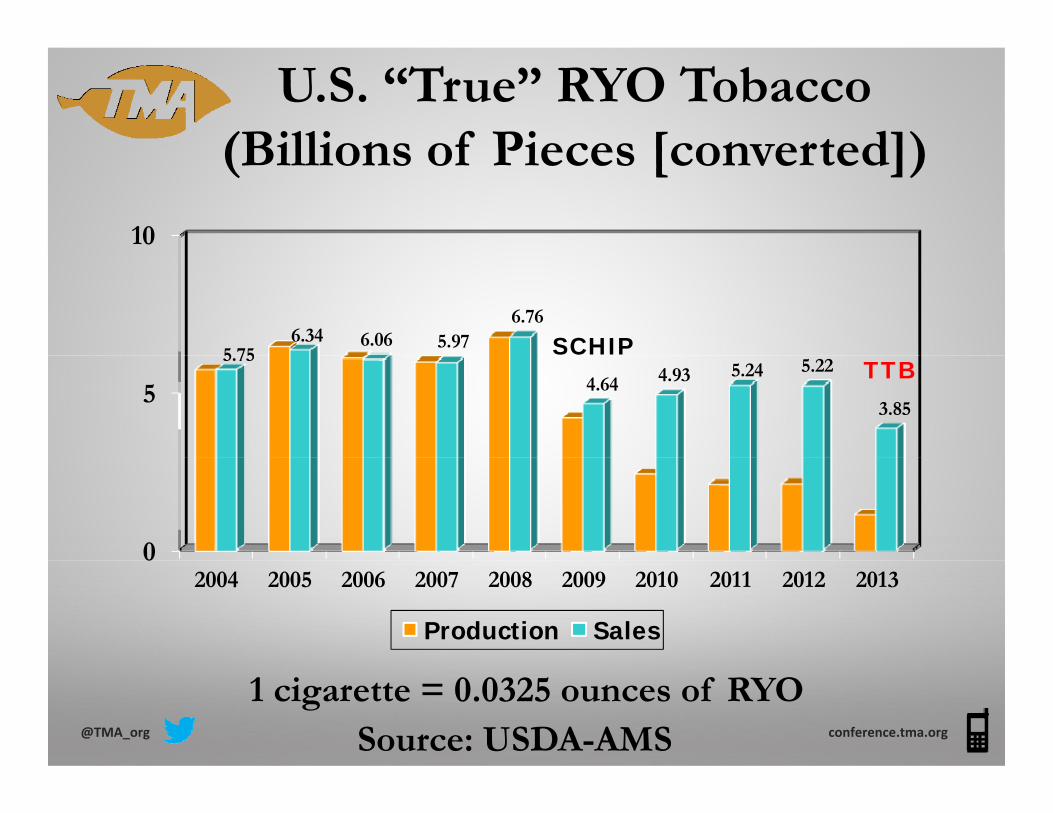
U.S. “True” RYO Tobacco(Billions of Pieces [converted])(Billions of Pieces [converted])
10
5 756.34 6.06 5.97
6.76
SCHIP
5
5.75
4.64 4.93 5.24 5.22
3.85
TTB
002004 2005 2006 2007 2008 2009 2010 2011 2012 2013
Production Sales
@TMA_org conference.tma.orgSource: USDA-AMS1 cigarette = 0.0325 ounces of RYO
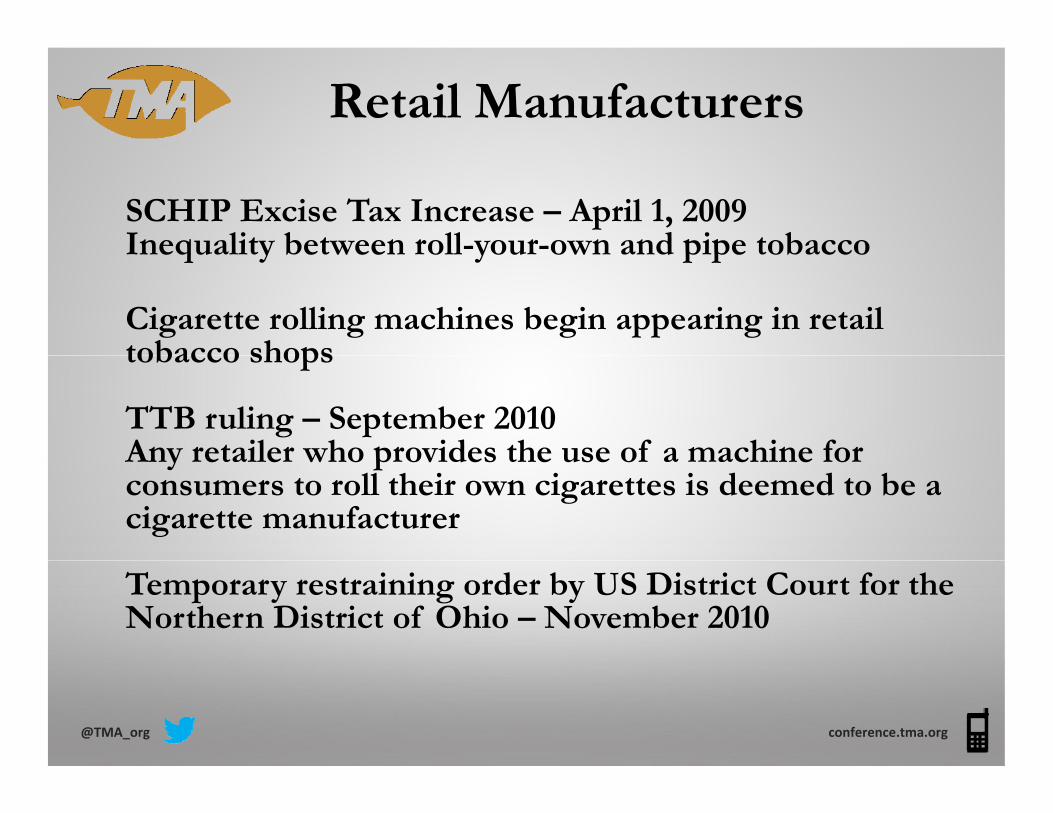
Retail Manufacturers
SCHIP Excise Tax Increase – April 1, 2009Inequality between roll-your-own and pipe tobaccoInequality between roll your own and pipe tobacco
Cigarette rolling machines begin appearing in retail tobacco shopstobacco shops
TTB ruling – September 2010Any retailer who provides the use of a machine forAny retailer who provides the use of a machine for consumers to roll their own cigarettes is deemed to be a cigarette manufacturer
Temporary restraining order by US District Court for the Northern District of Ohio – November 2010
@TMA_org conference.tma.org
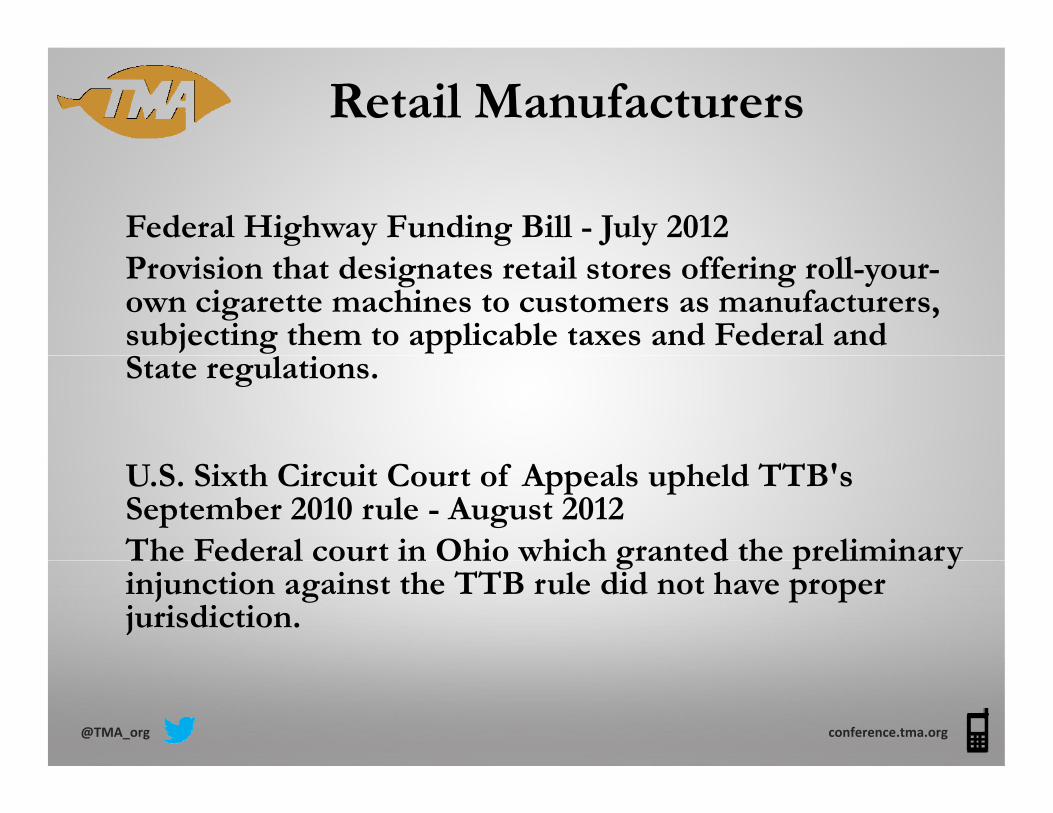
Retail Manufacturers
Federal Highway Funding Bill - July 2012Provision that designates retail stores offering roll-your-own cigarette machines to customers as manufacturers, subjecting them to applicable taxes and Federal and State regulations.
U.S. Sixth Circuit Court of Appeals upheld TTB's September 2010 rule - August 2012The Federal court in Ohio which granted the preliminaryThe Federal court in Ohio which granted the preliminary injunction against the TTB rule did not have proper jurisdiction.
@TMA_org conference.tma.org
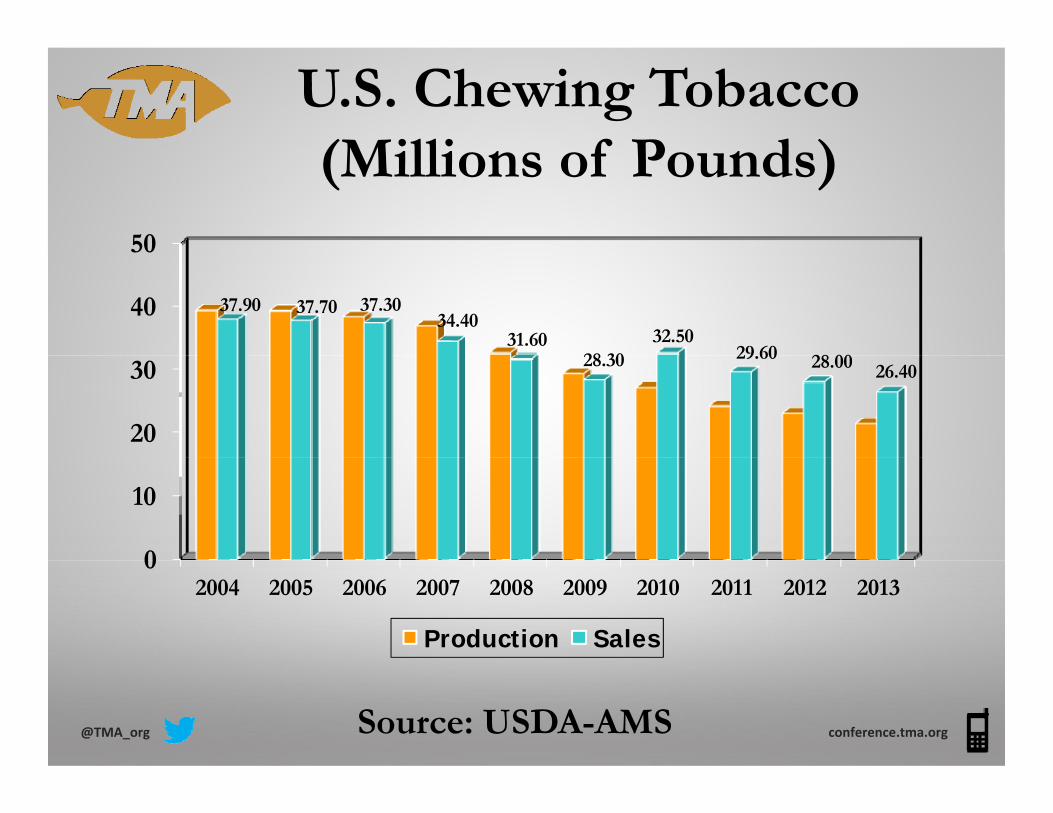
U.S. Chewing Tobacco(Milli f P d )(Millions of Pounds)
50
40 37.90 37.70 37.3034.40
31.6028 30
32.5029 60 28 00
20
30 28.30 29.60 28.00 26.40
0
10
02004 2005 2006 2007 2008 2009 2010 2011 2012 2013
Production Sales
@TMA_org conference.tma.orgSource: USDA-AMS
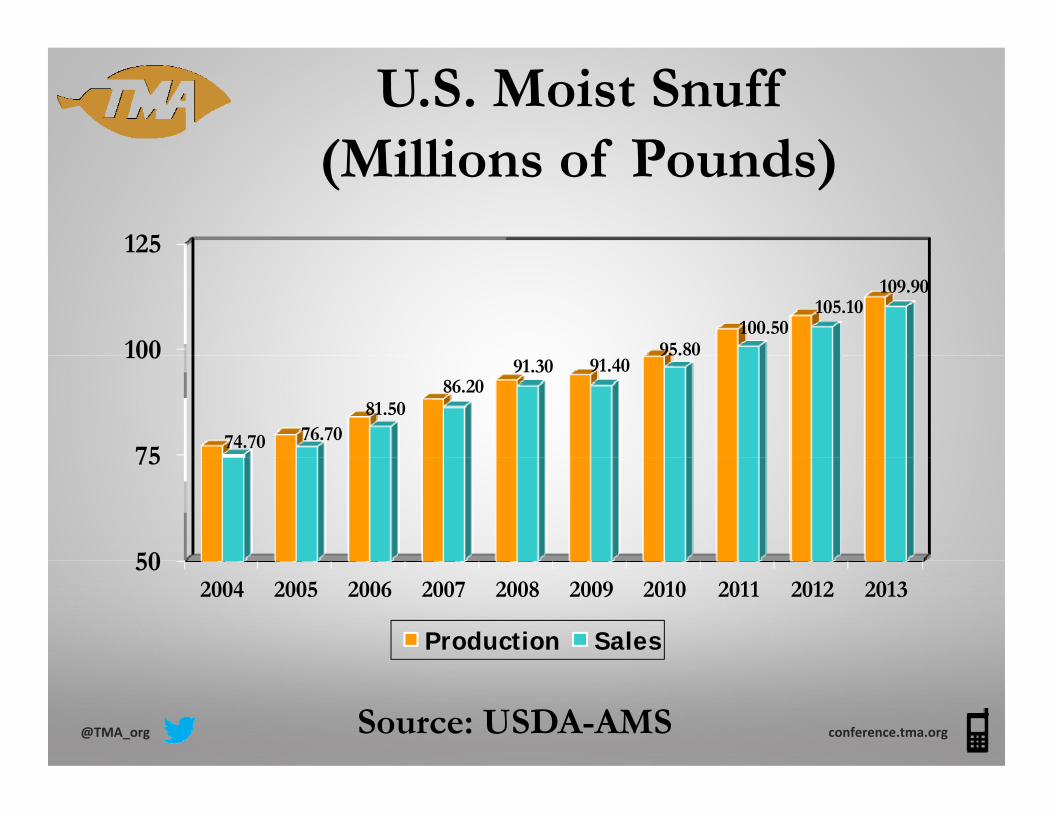
U.S. Moist Snuff(Milli f P d )(Millions of Pounds)
125
100 95.80100.50
105.10109.90
75
100
74.70 76.7081.50
86.2091.30 91.40
95.80
50
75
502004 2005 2006 2007 2008 2009 2010 2011 2012 2013
Production Sales
@TMA_org conference.tma.orgSource: USDA-AMS

Tobacco ProductPer Capita ConsumptionPer Capita Consumption
(Pounds)5
4
5
2
3
1
2
01992 1996 2000 2004 2008 2012
Cigarettes Cigars Smoking Tob. Chewing Tob. Snuff
Source: Various News Sources@TMA_org conference.tma.org
U.S. Consumer ExpendituresBy Nicotine Product - 2012By Nicotine Product 2012
(% of total)0 33 0.78 0 98
7 62
0.130.33
0.48
7.91
0.78 0.98
Cigarettes7.62 CigarettesLarge CigarsSmall CigarsSmoking TobaccoChewing Tobacco
82.47Chewing TobaccoSnuffSnuffEE--VaporVaporNRT's
F 2012 l U S di $100 448 billi
@TMA_org conference.tma.org
For 2012, total U.S. consumer expenditure was $100.448 billion.
Source: TMA Estimate

U.S. Consumer ExpendituresEstimates By Nicotine Product 2020Estimates By Nicotine Product - 2020
(% of total)1 50
0.3910.16
1.50
Cigarettes
8.200.060.16
0.399.06
CigarettesLarge CigarsSmall CigarsSmoking TobaccoChewing Tobacco
70.47Chewing TobaccoSnuffSnuffEE--VaporVaporNRT's
F 2020 t t l U S dit i ti t d t $92 74 billi
@TMA_org conference.tma.org
For 2020, total U.S. consumer expenditure is estimated at $92.74 billion.
Source: TMA Estimate

Types of E-VaporDisposable E-Cigarettes
Rechargeable E-Cigarettes/Kits
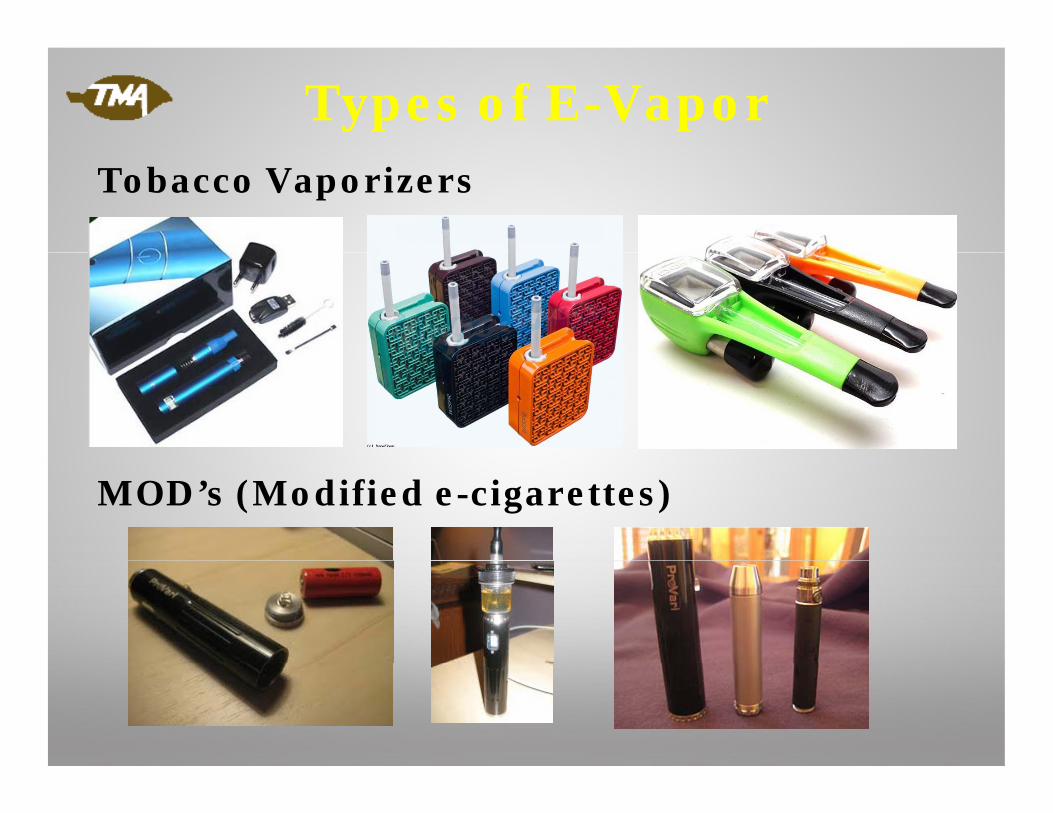
Types of E-VaporTobacco Vaporizers
MOD’s (Modified e-cigarettes)
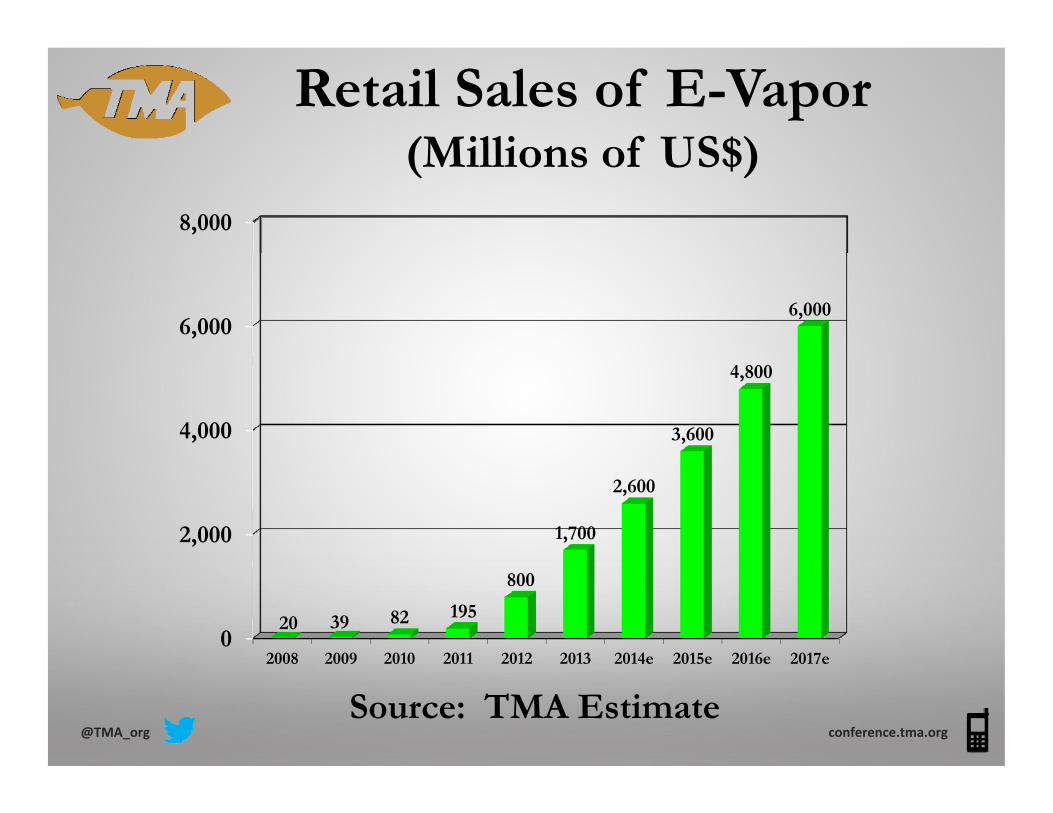
Retail Sales of E-Vapor(Millions of US$)(Millions of US$)
8,000
6,0006,000
4,000 3,600
4,800
2,000 1,700
2,600
02008 2009 2010 2011 2012 2013 2014e 2015e 2016e 2017e
20 39 82 195
800
@TMA_org conference.tma.orgSource: TMA Estimate
2008 2009 2010 2011 2012 2013 2014e 2015e 2016e 2017e
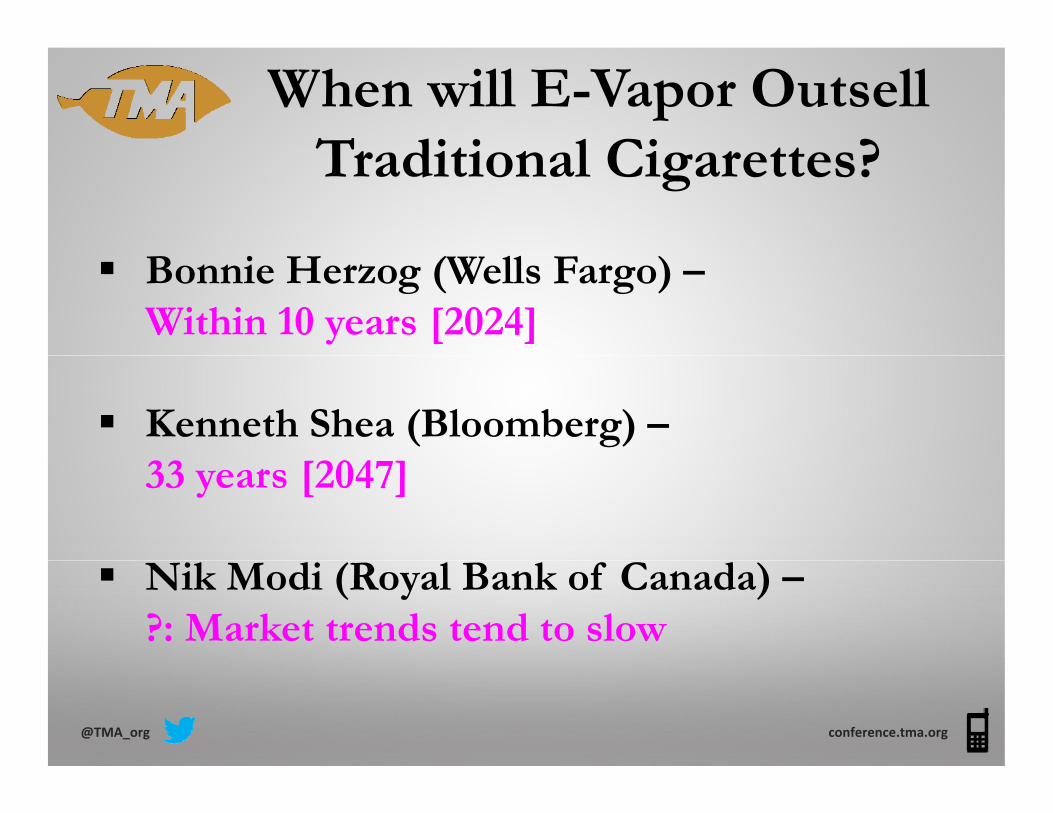
When will E-Vapor OutsellT diti l Ci tt ?Traditional Cigarettes?
Bonnie Herzog (Wells Fargo) –Within 10 years [2024]
Kenneth Shea (Bloomberg) –33 years [2047]
Nik Modi (Royal Bank of Canada) –?: Market trends tend to slow
@TMA_org conference.tma.org

E-Vapor Product LifestyleFrom Disposable E-Cigarette …to Rechargeable E-Cigarette …g g
to Tobacco Vaporizers …to Mods
Some e-cigarette makers believe that the product’s life-cycle evolution will cause the
@TMA_org conference.tma.org
p ydisposable market to disappear within 5 years.

Product Price Comparison
Premium Cigarettes Disposable E-Cig Personal Vaporizer
lPremium Cigarettes E‐Cigarette Personal Vaporizer
Price $6.20 per pack of 20 (Nat. Avg.)
$4 12 per pack
$5‐10 per disposable
$2+ per cartomizer
$30+ per kitE‐Liquid ‐ $(4‐10)/10 ml
Battery/tank replacement:$4‐12 per pack (range)
$2+ per cartomizer ‐rechargeable
Battery/tank replacement:$20 per month
Smoking Amount
20 cigarettes(200 puffs)
240‐300 puffs(24‐30 cigarettes)
About 7,500 puffs(≈ 750 cigarettes)Amount (200 puffs) (24 30 cigarettes) ( 750 cigarettes)
Cost per Puff
3.1 cents 2.778 cents (disposable)1.296 cents (rechargeable)
0.080 cents

Sales of NRT’s(Milli f US$)(Millions of US$)
1,500
1,300
1,0001,000
1,0601,120
1,1801,240
1,300
,000
500
02012 2013 2014e 2015e 2016e 2017e
@TMA_org conference.tma.orgSources: The Mintel Report, TMA Estimate
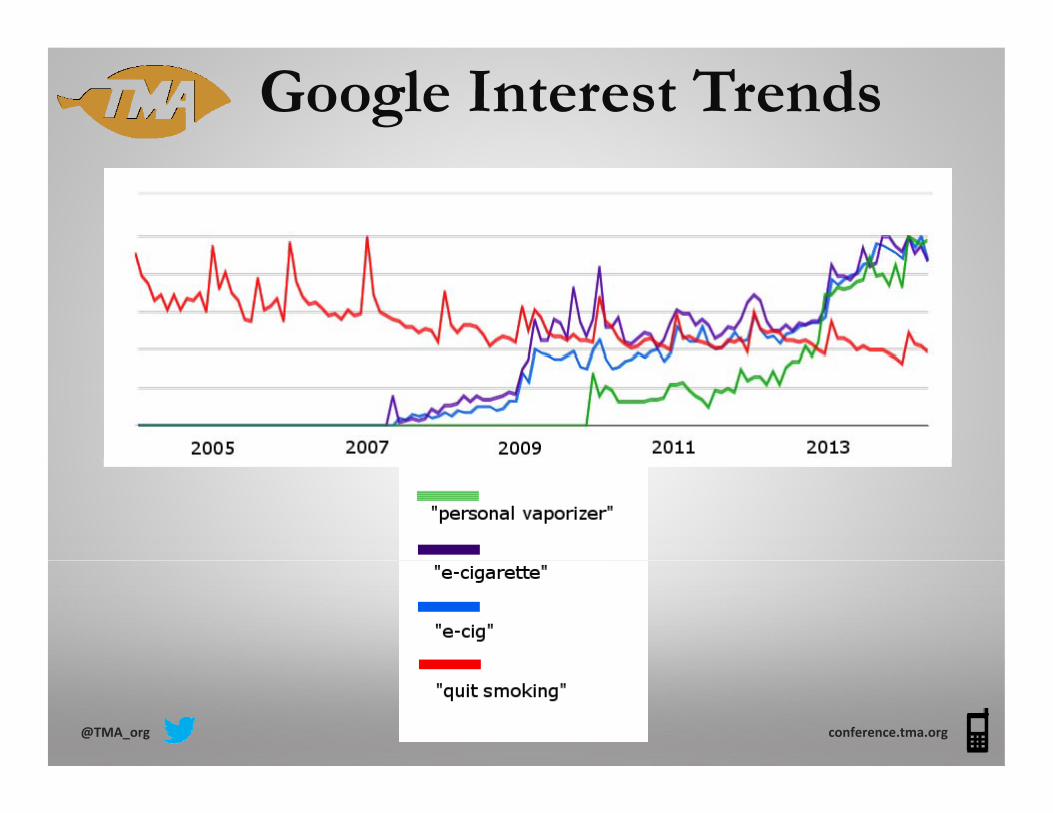
Google Interest Trends
@TMA_org conference.tma.org

U.S. Cigarette C ti D li (%)Consumption Decline (%)
108 70 SCHIP8.70 SCHIP
E-Cig
5
2 35
3.613.00 3.09
2 15
5.22
3.49
2 303.03
4.86
g
0
2.35
1.06
2.15 2.30
S USDA ERS TMA
02002 2003 2004 2005 2006 2007 2008 2009 2010 2011 2012 2013
@TMA_org conference.tma.org
Source: USDA-ERS, TMATMA’s Tobacco USA
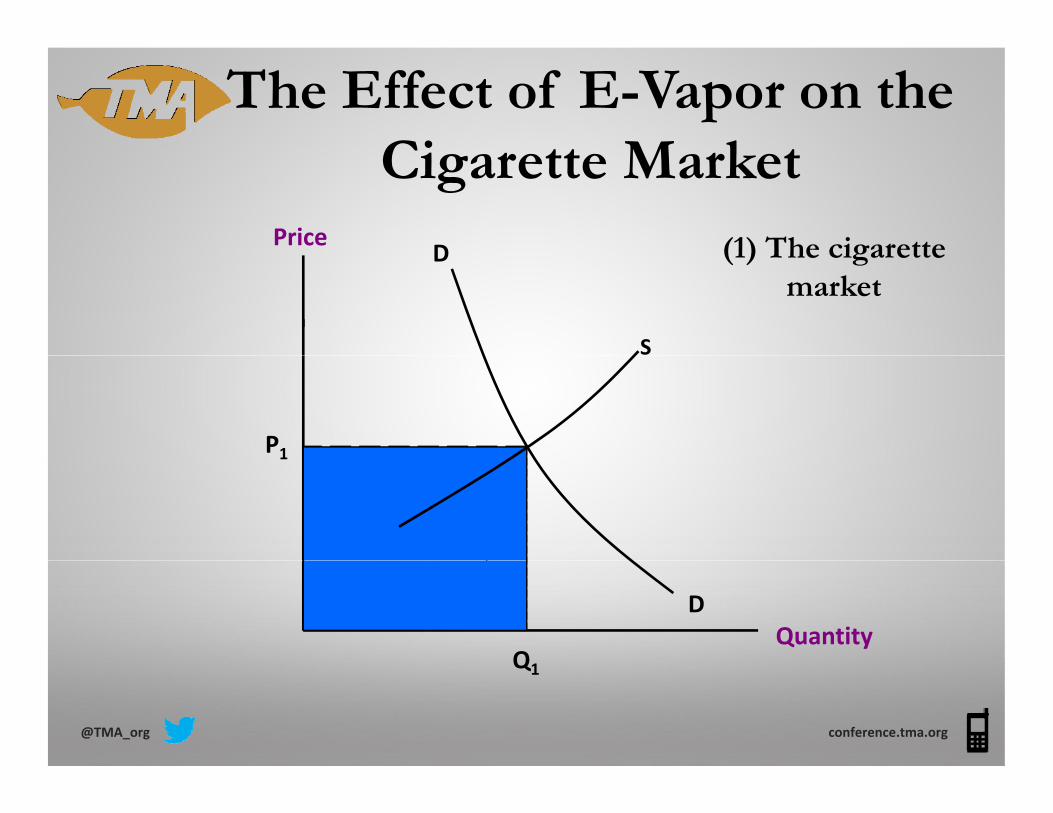
The Effect of E-Vapor on the Ci tt M k t
Price D
Cigarette Market(1) The cigarette
S
D (1) The cigarette market
P11
QuantityD
Q
@TMA_org conference.tma.org
Q1
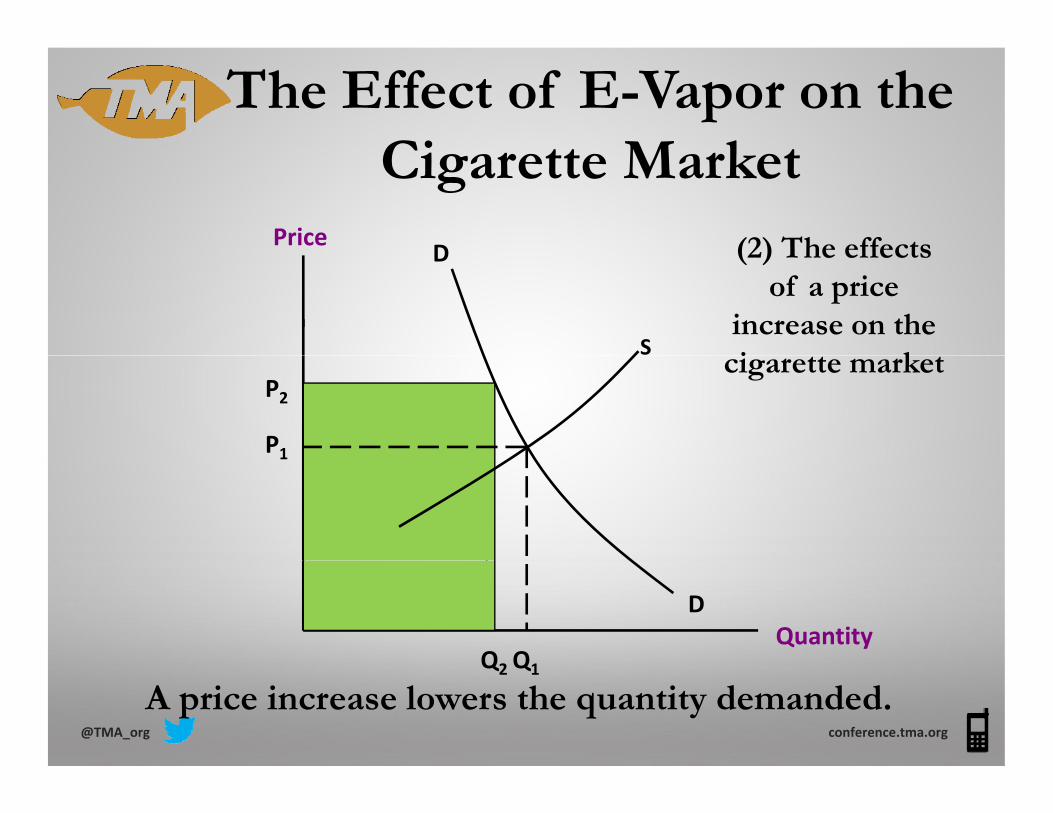
The Effect of E-Vapor on the Ci tt M k t
Price D
Cigarette Market(2) The effects
S
D (2) The effects of a price
increase on the i k
P1
P2cigarette market
1
QuantityD
@TMA_org conference.tma.org
Q1Q2
A price increase lowers the quantity demanded.

The Effect of E-Vapor on the Ci tt M k t
Price D
Cigarette Market(2) The effects
S
D (2) The effects of a price
increase on the i k
P1
P2cigarette market
Added revenue
1
QuantityD
Lost revenue
@TMA_org conference.tma.org
Q1Q2
A price increase lowers the quantity demanded.
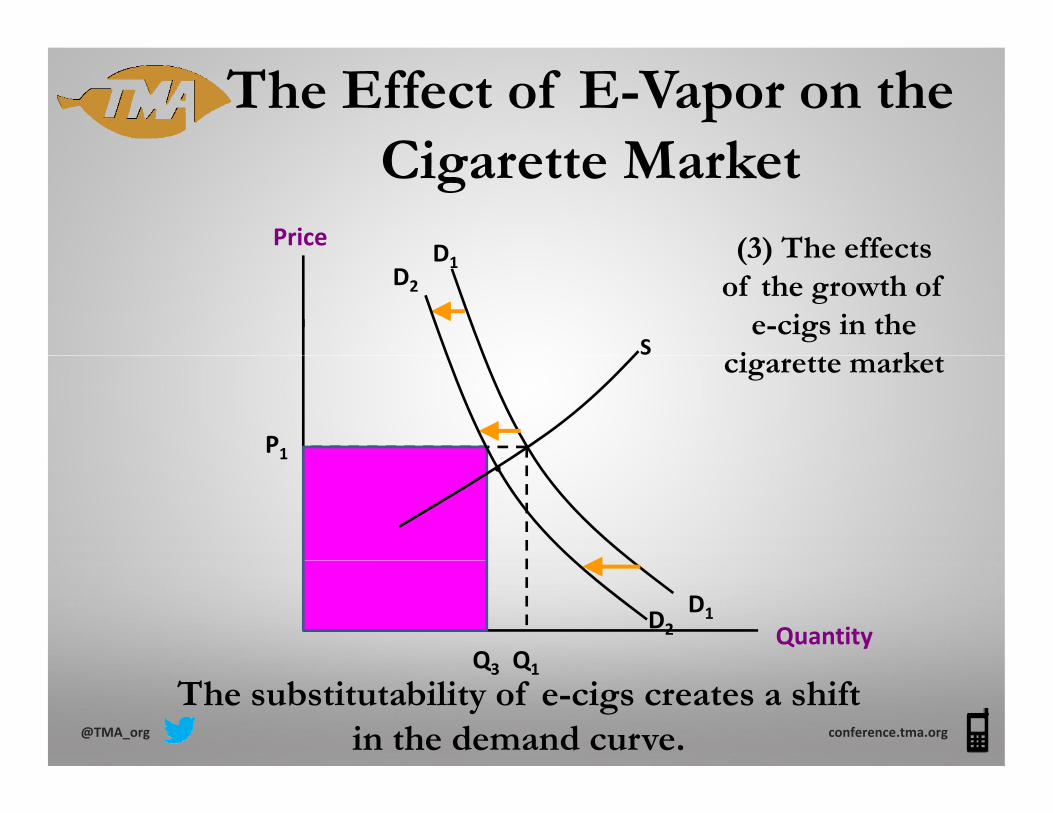
The Effect of E-Vapor on the Ci tt M k t
Price D
Cigarette Market(3) The effects
S
D1D2
(3) The effects of the growth of
e-cigs in the i k
P1
cigarette market
1
QuantityD1
QQD2
@TMA_org conference.tma.org
Q1Q3
The substitutability of e-cigs creates a shiftin the demand curve.
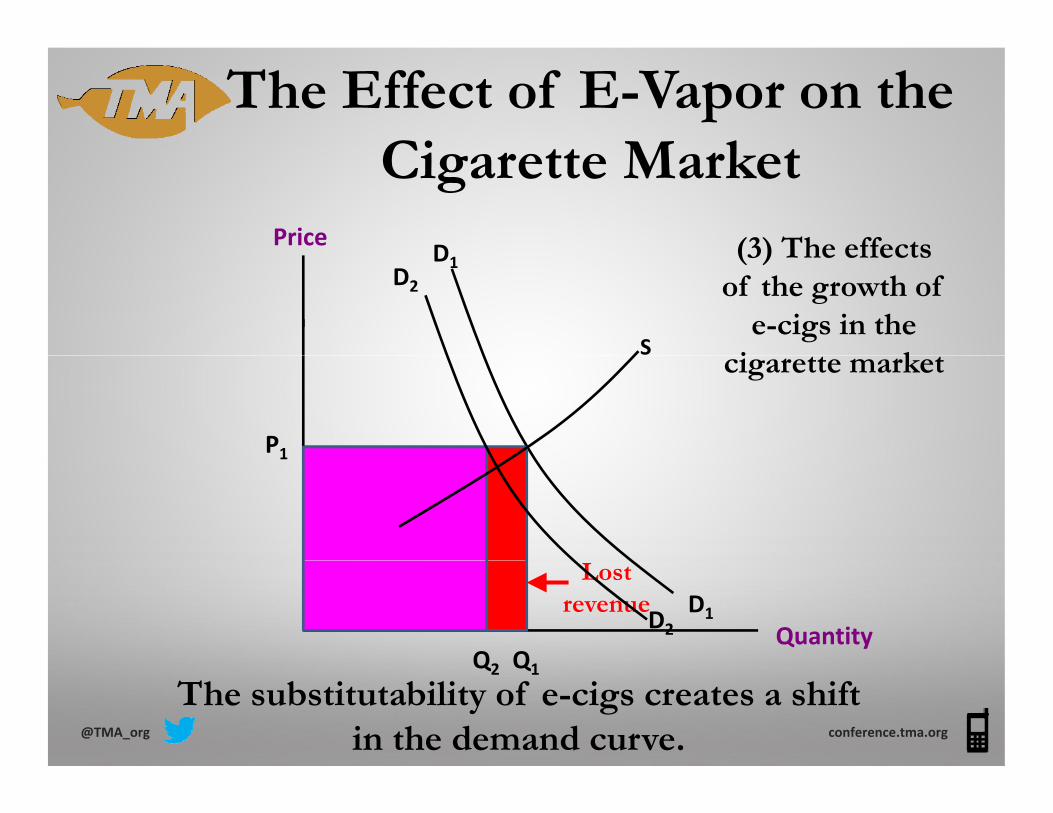
The Effect of E-Vapor on the Ci tt M k t
Price D
Cigarette Market(3) The effects
S
D1D2
(3) The effects of the growth of
e-cigs in the i k
P1
cigarette market
1
QuantityD1
QQD2
Lost revenue
@TMA_org conference.tma.org
Q1Q2
The substitutability of e-cigs creates a shiftin the demand curve.
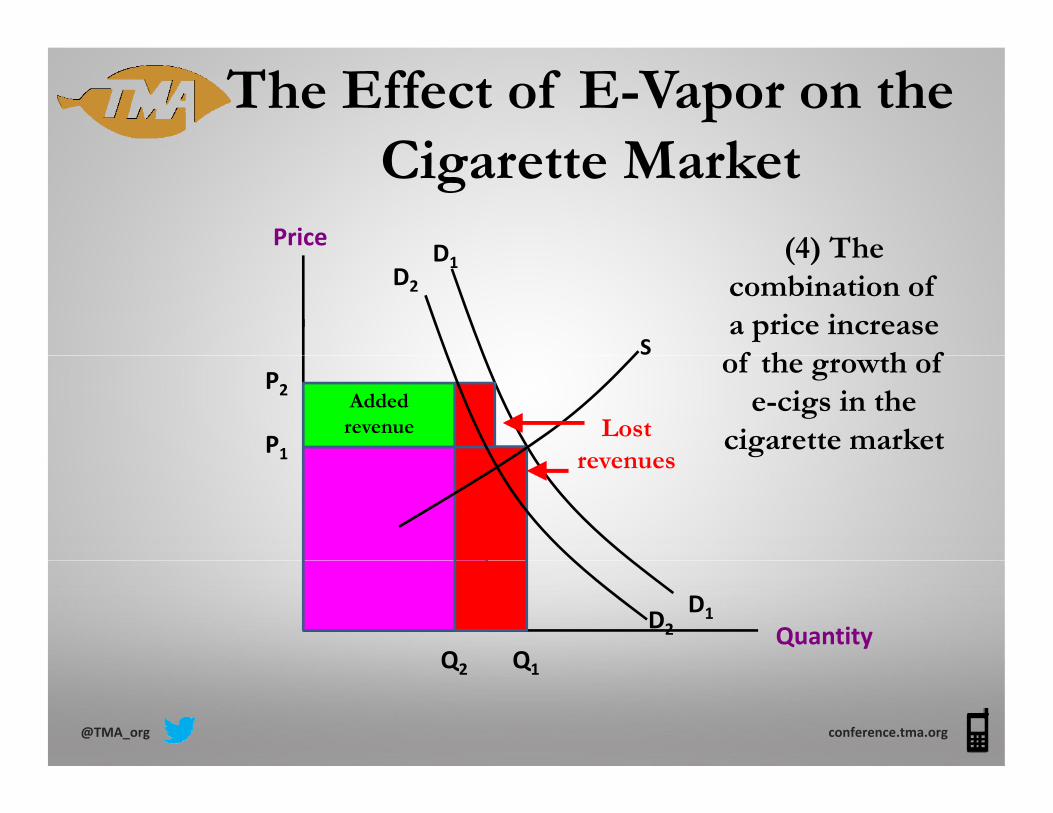
The Effect of E-Vapor on the Ci tt M k t
Price D
Cigarette Market(4) The
S
D1D2
(4) The combination of a price increase f h h f
P1
of the growth of e-cigs in the
cigarette market Lost revenues
P2Added
revenue1
revenues
QuantityD1
QQD2
@TMA_org conference.tma.org
Q1Q2
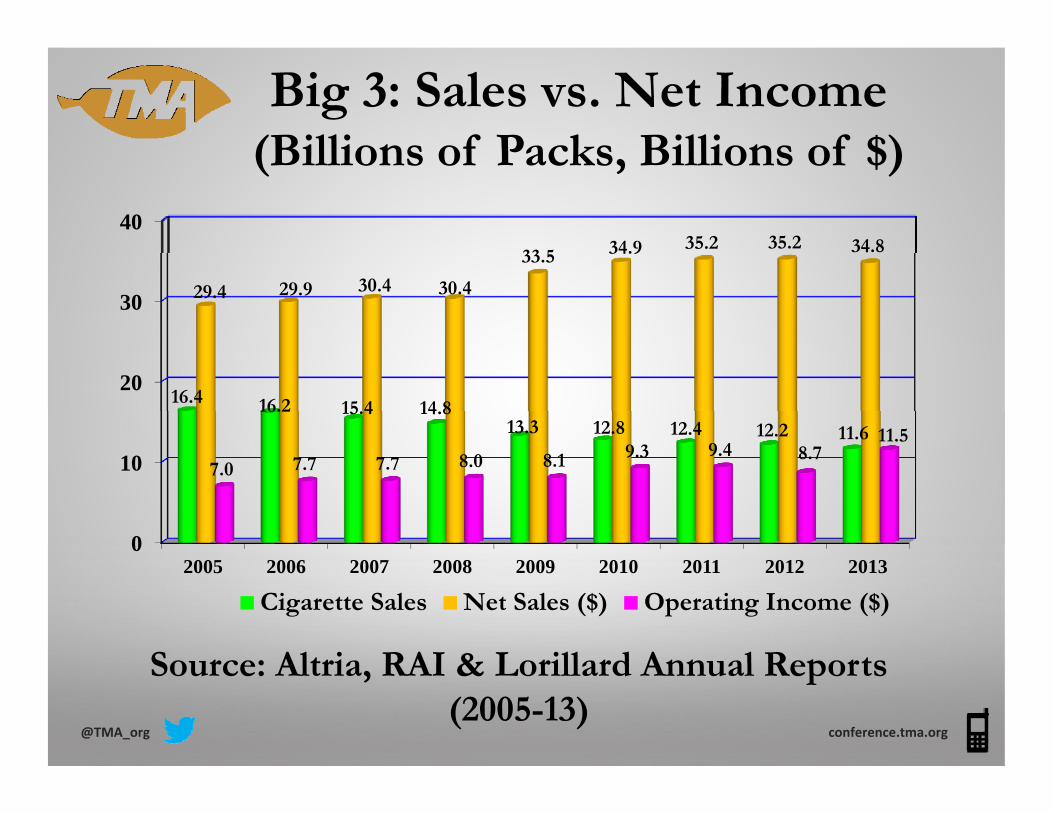
Big 3: Sales vs. Net Income(Billions of Packs Billions of $)(Billions of Packs, Billions of $)
4033 5 34.9 35.2 35.2 34.8
30 29.4 29.9 30.4 30.4
33.5 34.9
10
2016.4 16.2 15.4 14.8
13.3 12.8 12.4 12.2 11.6
7 7 7 7 8 0 8 1 9.3 9.4 8.711.5
0
10
2005 2006 2007 2008 2009 2010 2011 2012 2013
7.0 7.7 7.7 8.0 8.1 8.7
2005 2006 2007 2008 2009 2010 2011 2012 2013
Cigarette Sales Net Sales ($) Operating Income ($)
Source: Altria RAI & Lorillard Annual ReportsSource: Altria, RAI & Lorillard Annual Reports(2005-13)
@TMA_org conference.tma.org
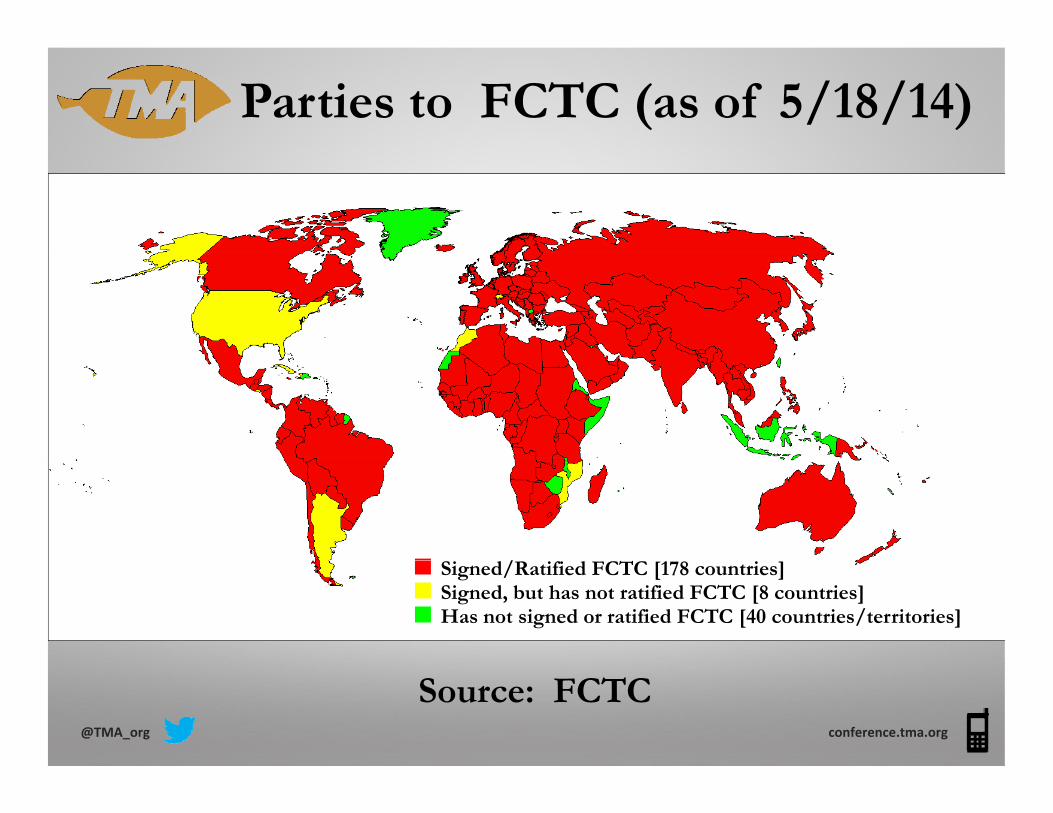
Parties to FCTC (as of 5/18/14)
/Signed/Ratified FCTC [178 countries]Signed, but has not ratified FCTC [8 countries]Has not signed or ratified FCTC [40 countries/territories]
@TMA_org conference.tma.org
Source: FCTC

FCTC: Current Key Issues
Conference of the Parties 6 (COP6) will be held in Moscow from October 13-18, 2014.
A decision to recommend a ban on ingredients, flavorings and additives in the manufacture of tobacco products will be made at COP6products will be made at COP6.
“The Protocol to Eliminate Illicit Trade in Tobacco P d ” ill h i Fi M i f h P i iProducts” will have its First Meeting of the Parties in Moscow from October 20-22, 2014, following COP6.
Internal WHO documents indicate that WHO officials wish to classify e-cigs as tobacco products under FCTC
@TMA_org conference.tma.org
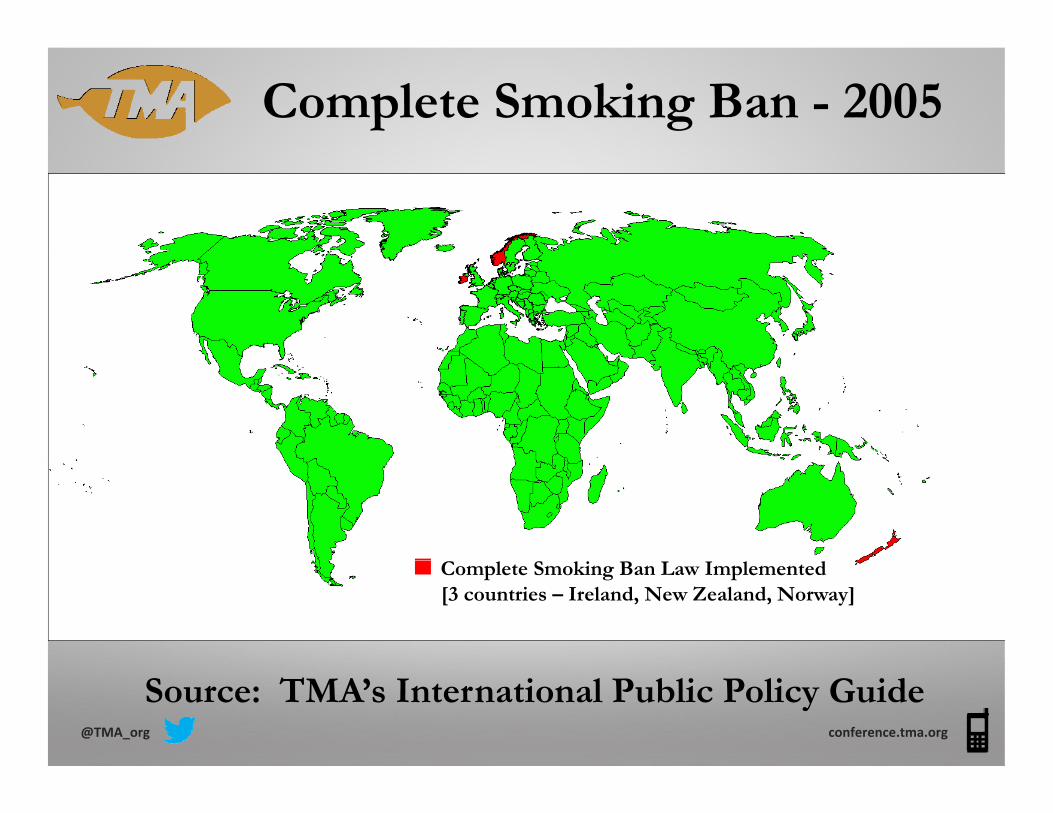
Complete Smoking Ban - 2005
Complete Smoking Ban Law Implemented[3 countries – Ireland, New Zealand, Norway]
@TMA_org conference.tma.org
Source: TMA’s International Public Policy Guide
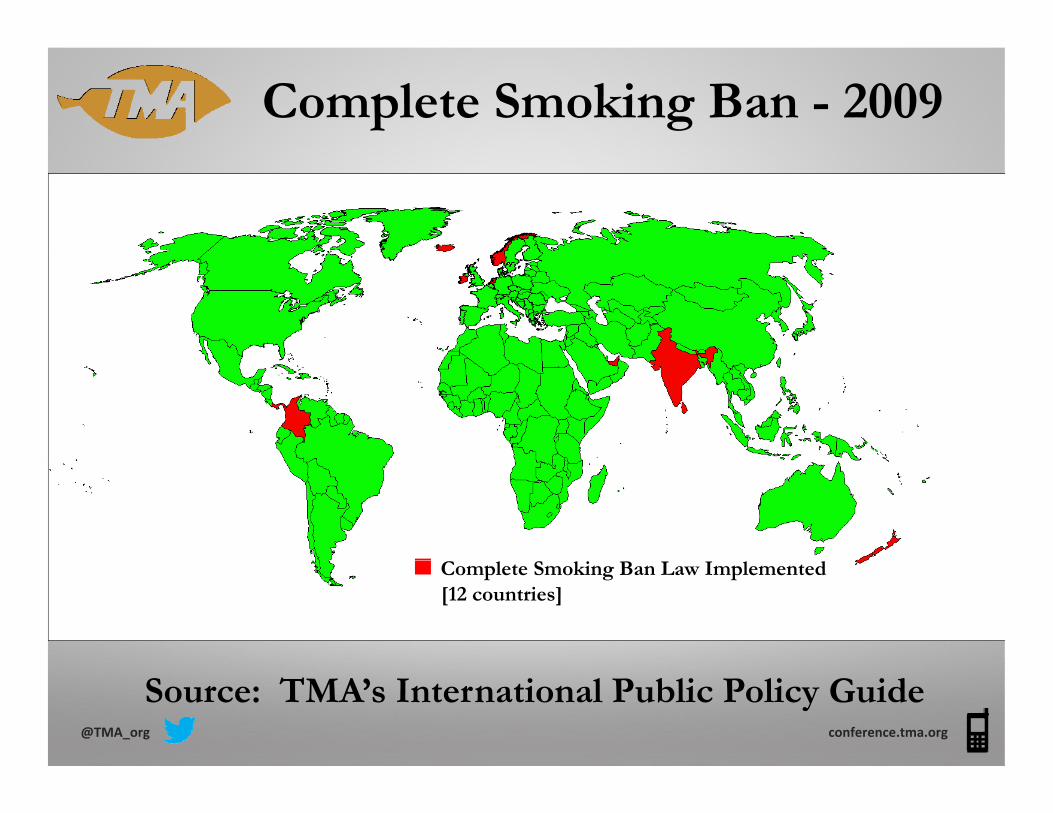
Complete Smoking Ban - 2009
Complete Smoking Ban Law Implemented[12 countries]
@TMA_org conference.tma.org
Source: TMA’s International Public Policy Guide
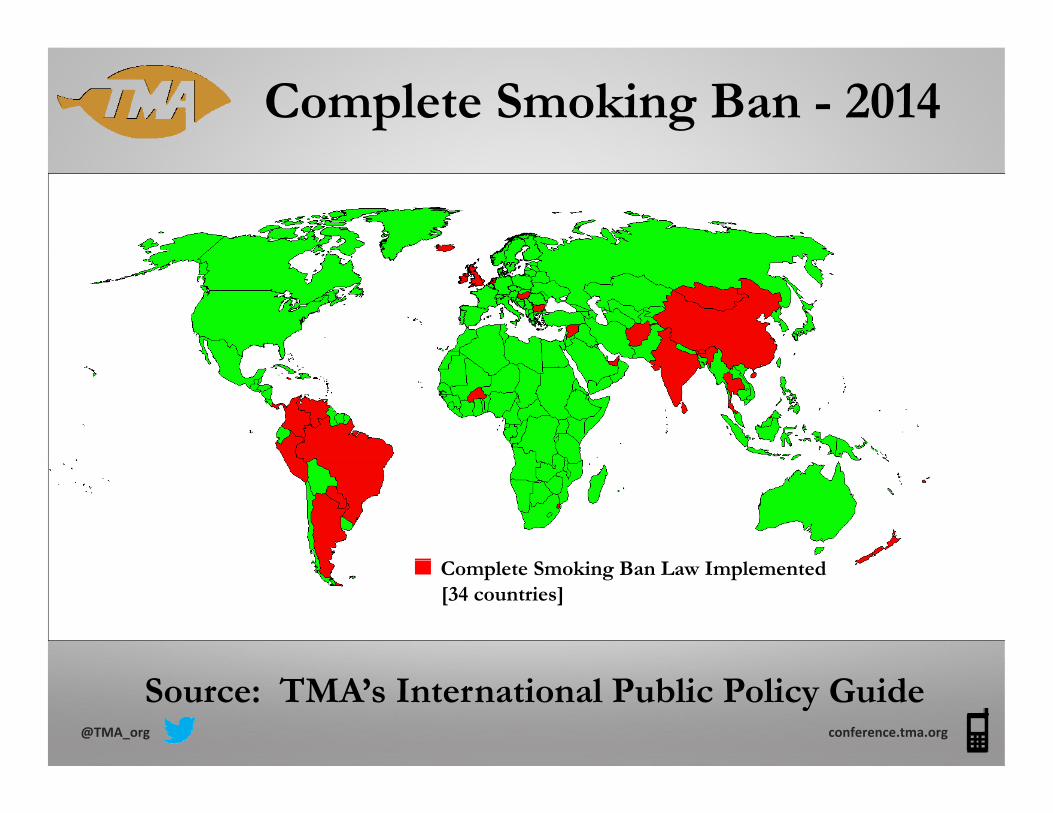
Complete Smoking Ban - 2014
Complete Smoking Ban Law Implemented[34 countries]
@TMA_org conference.tma.org
Source: TMA’s International Public Policy Guide
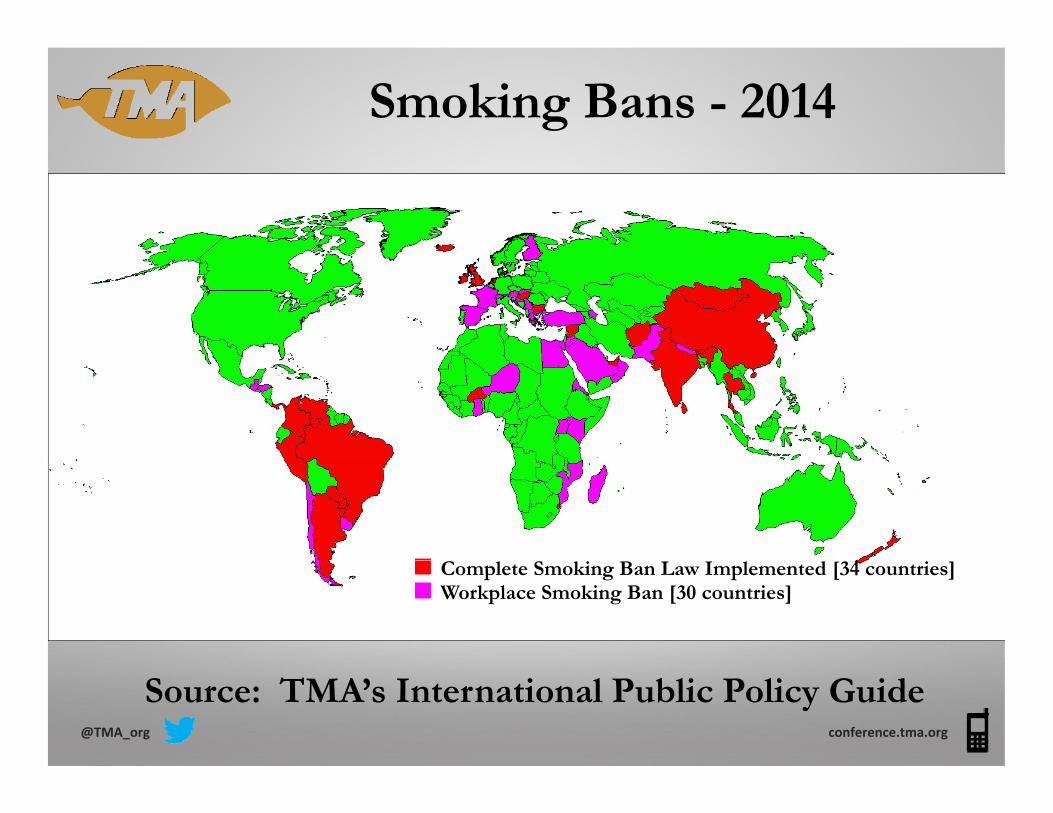
Smoking Bans - 2014
Complete Smoking Ban Law Implemented [34 countries]Workplace Smoking Ban [30 countries]
@TMA_org conference.tma.org
Source: TMA’s International Public Policy Guide
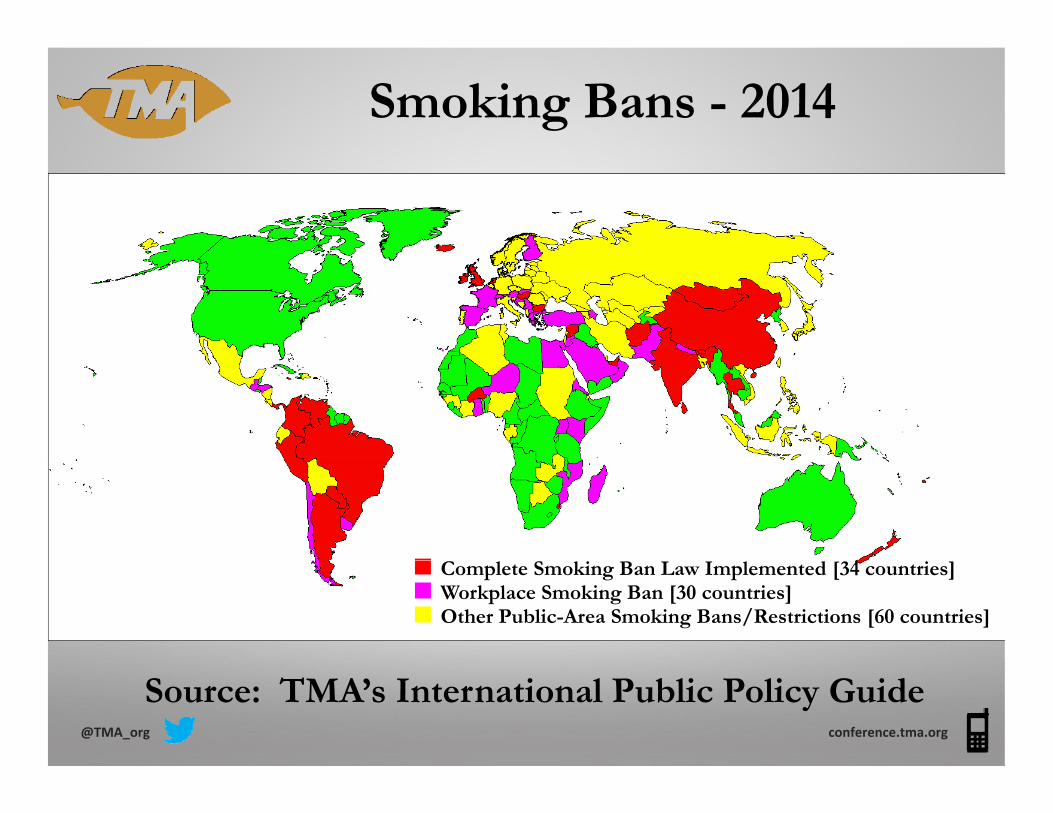
Smoking Bans - 2014
Complete Smoking Ban Law Implemented [34 countries]Workplace Smoking Ban [30 countries]Other Public-Area Smoking Bans/Restrictions [60 countries]
@TMA_org conference.tma.org
Source: TMA’s International Public Policy Guide
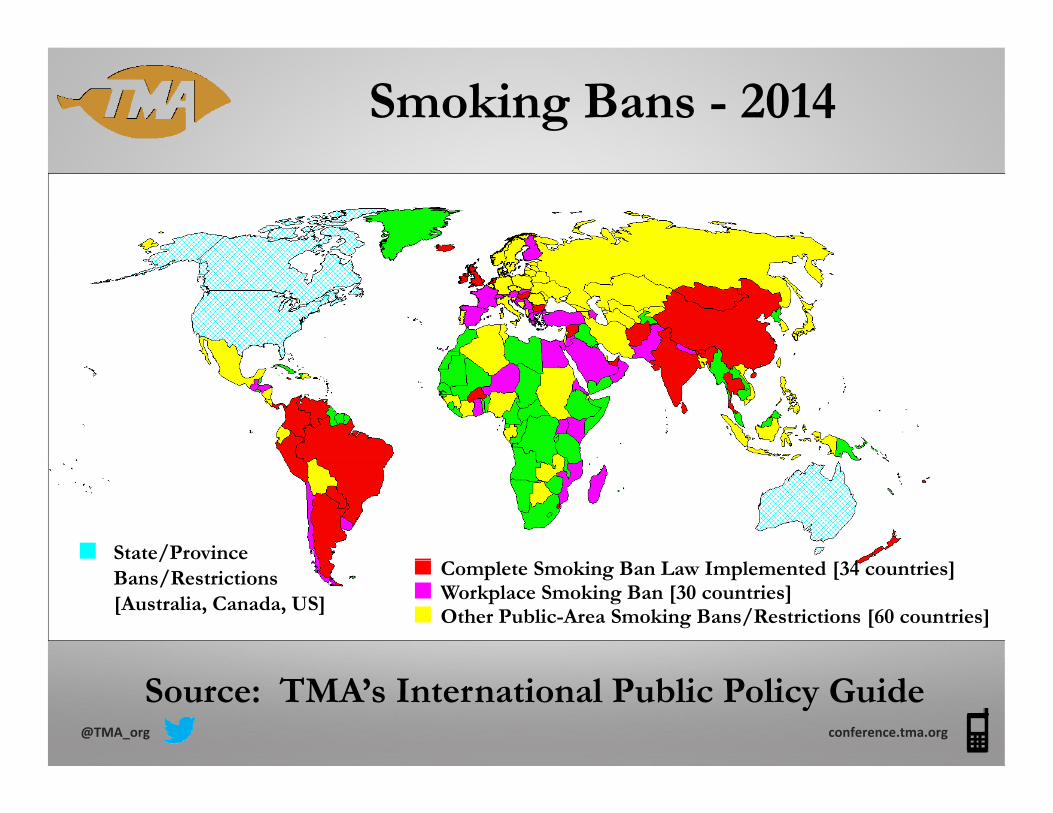
Smoking Bans - 2014
State/Province Complete Smoking Ban Law Implemented [34 countries]Workplace Smoking Ban [30 countries]Other Public-Area Smoking Bans/Restrictions [60 countries]
/Bans/Restrictions[Australia, Canada, US]
@TMA_org conference.tma.org
Source: TMA’s International Public Policy Guide
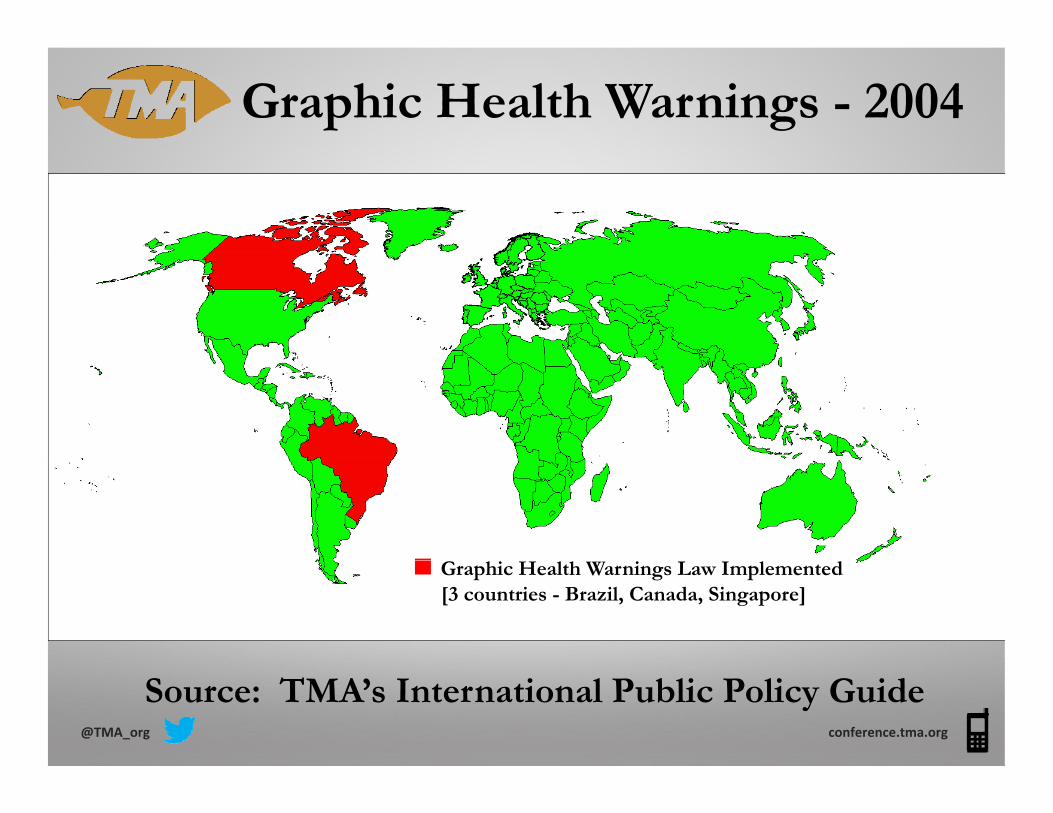
Graphic Health Warnings - 2004
Graphic Health Warnings Law Implemented[3 countries - Brazil, Canada, Singapore]
@TMA_org conference.tma.org
Source: TMA’s International Public Policy Guide
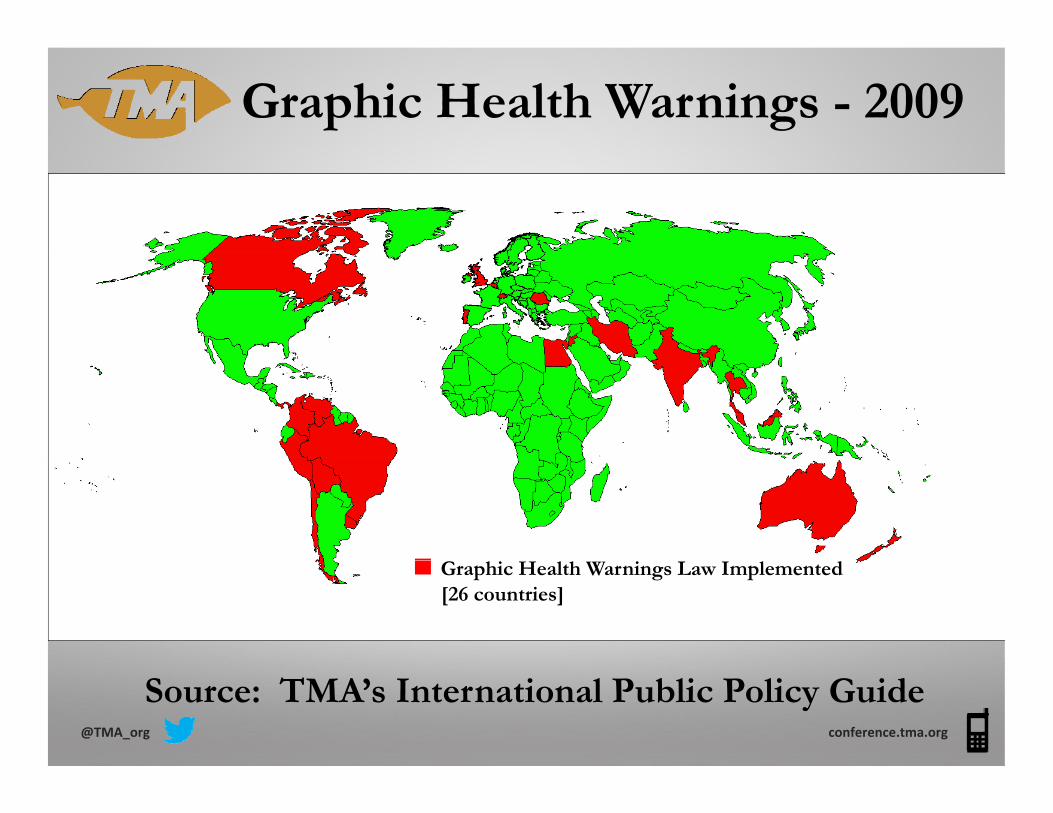
Graphic Health Warnings - 2009
Graphic Health Warnings Law Implemented[26 countries]
@TMA_org conference.tma.org
Source: TMA’s International Public Policy Guide
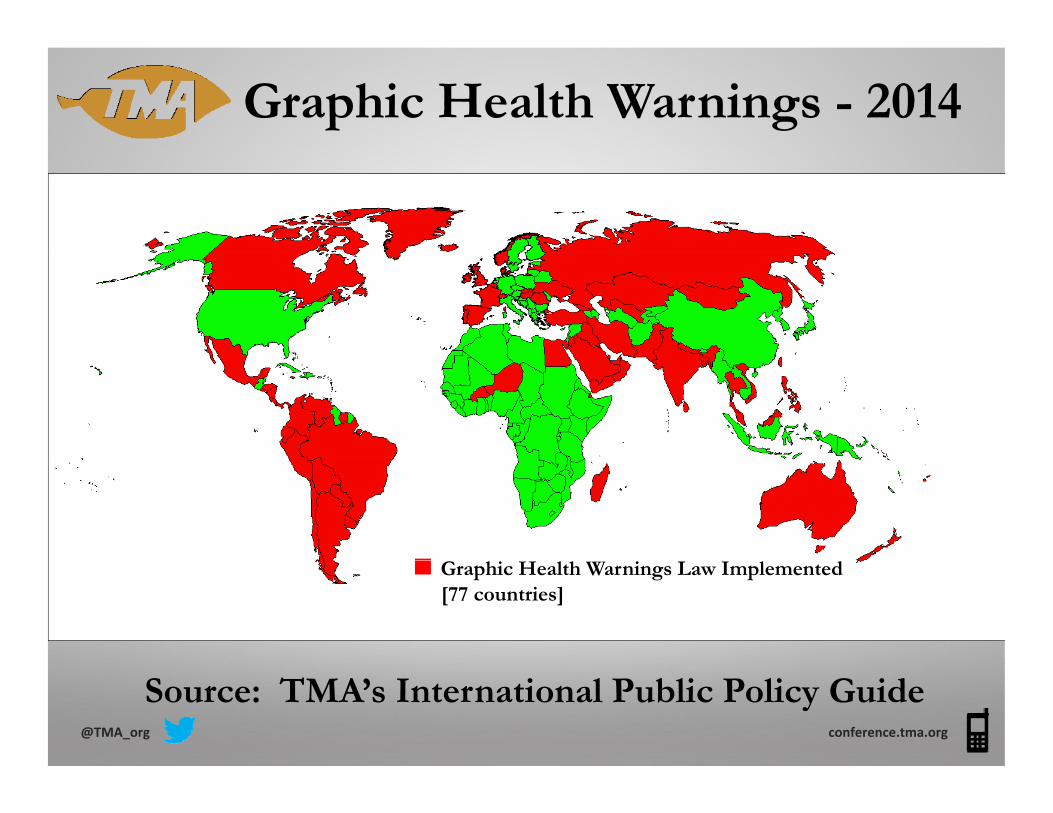
Graphic Health Warnings - 2014
Graphic Health Warnings Law Implemented[77 countries]
@TMA_org conference.tma.org
Source: TMA’s International Public Policy Guide
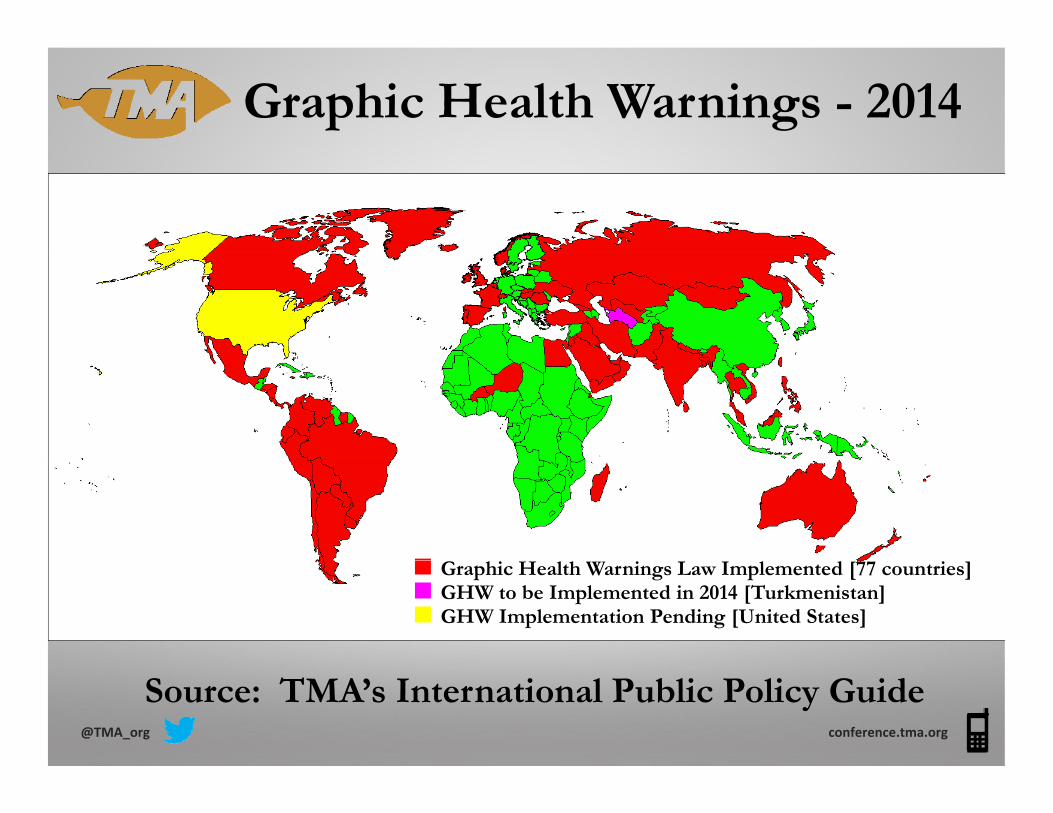
Graphic Health Warnings - 2014
Graphic Health Warnings Law Implemented [77 countries]GHW to be Implemented in 2014 [Turkmenistan]GHW Implementation Pending [United States]
@TMA_org conference.tma.org
Source: TMA’s International Public Policy Guide

Plain Packaging – 2014
Plain Packaging Law Implemented [Australia]
Plain Packaging Legislation Introduced [6 countries]
@TMA_org conference.tma.org
Source: TMA’s International Public Policy Guide

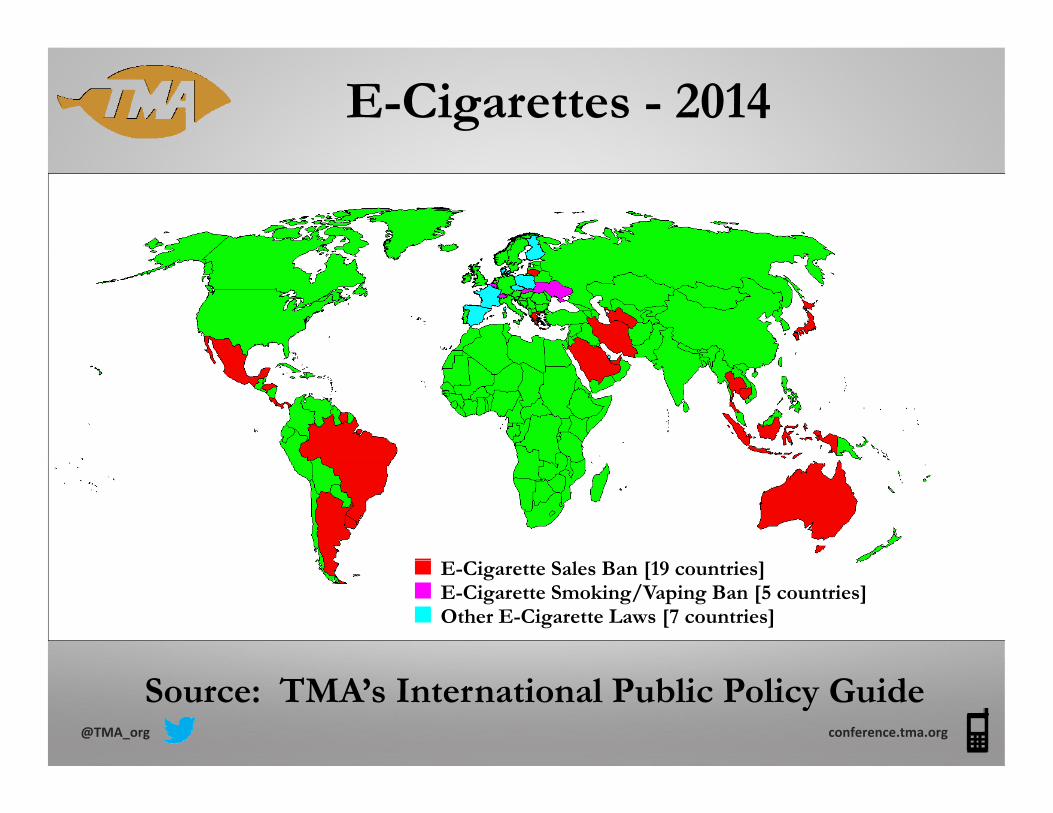
E-Cigarettes - 2014
E-Cigarette Sales Ban [19 countries]
@TMA_org conference.tma.org
Source: TMA’s International Public Policy Guide
E-Cigarettes - 2014
E-Cigarette Sales Ban [19 countries]E-Cigarette Smoking/Vaping Ban [5 countries]Other E-Cigarette Laws [7 countries]
@TMA_org conference.tma.org
Source: TMA’s International Public Policy Guide

E-Cigarettes - 2014
E-Cigarette Proposals [15 countries]E-Cigarette Sales Ban [19 countries]
Other E-Cigarette Laws [7 countries]E-Cigarette Smoking/Vaping Ban [5 countries]
@TMA_org conference.tma.org
Source: TMA’s International Public Policy Guide

The EUTobacco Products Directive
• Graphic Health Warnings
• E-Cig Regulation
• Flavor Ban (menthol in 2020)
• Track & Trace
@TMA_org conference.tma.org
ChinaTobacco Control
• Restrictions on Government OfficialsOfficials
• Considering Indoor Smoking g gBan
• WHO Urging Graphic WarningsWarnings
conference.tma.org@TMA_org
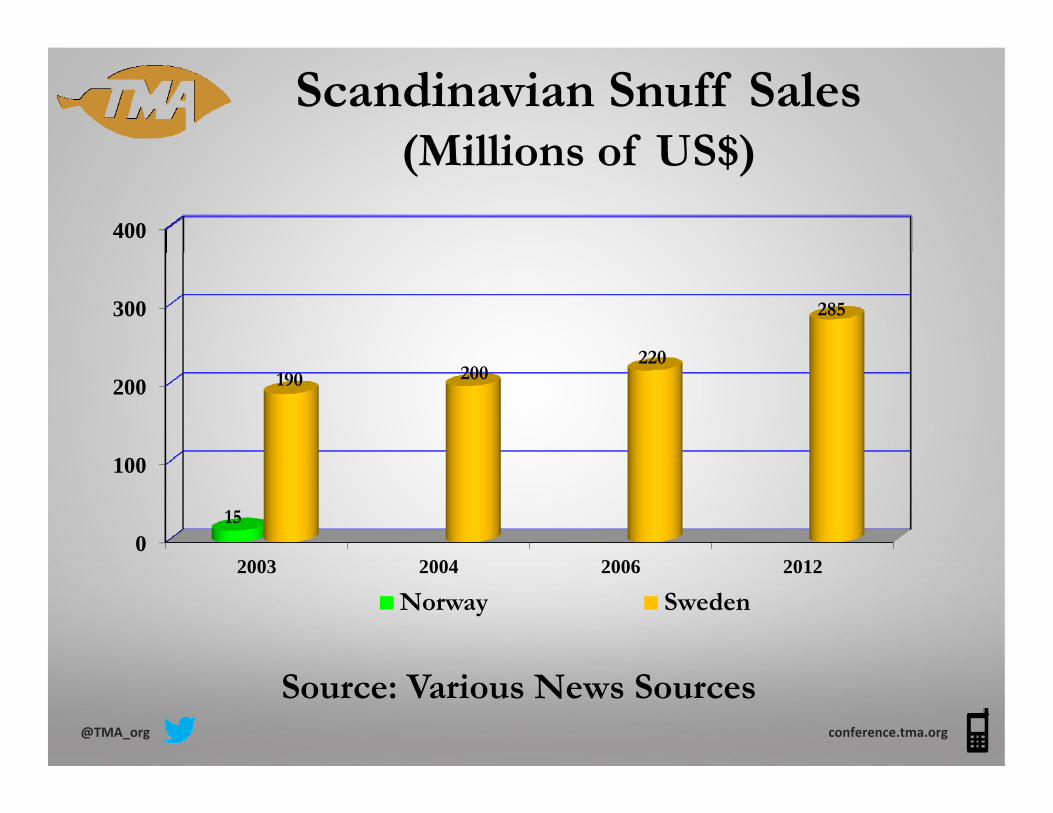
Scandinavian Snuff Sales(Millions of US$)(Millions of US$)
400
300
220
285
100
200 190 200220
0
100
2003 2004 2006 2012
15
2003 2004 2006 2012
Norway Sweden
Source: Various News Sources@TMA_org conference.tma.org
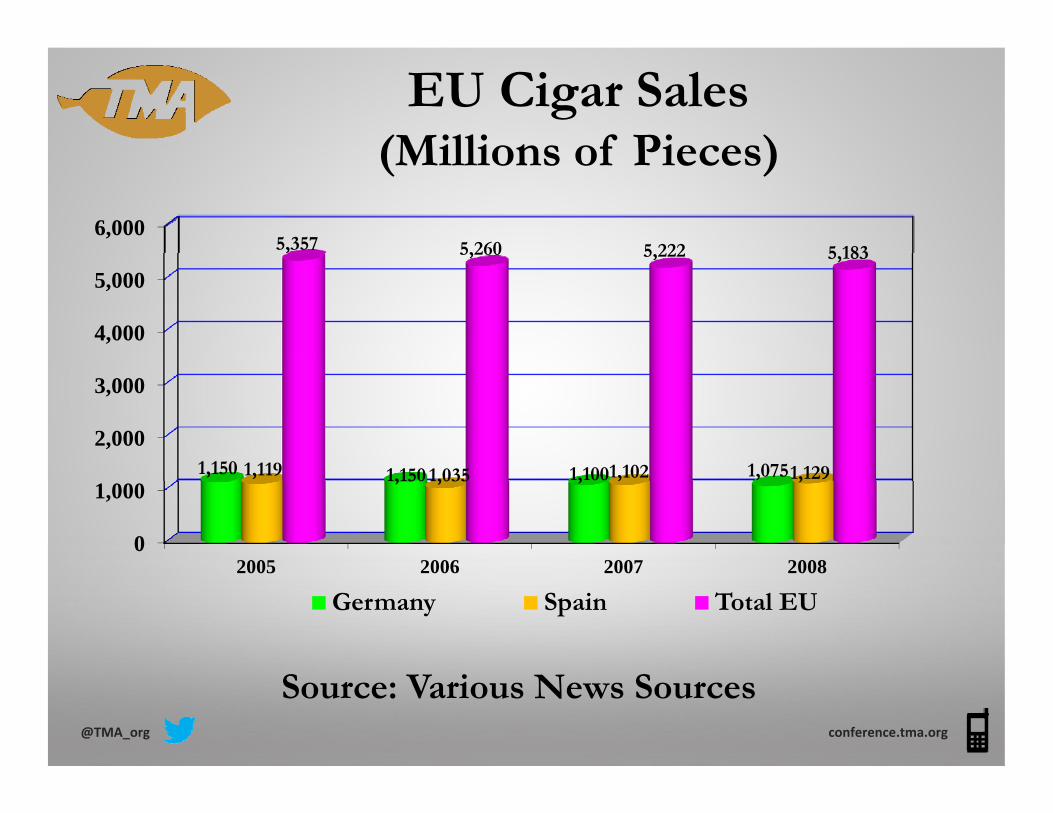
EU Cigar Sales(Millions of Pieces)(Millions of Pieces)
6,0005,357 5,260 5 222 5 183
4,000
5,000
, 5,260 5,222 5,183
2,000
3,000
0
1,000
2005 2006 2007 2008
1,150 1,150 1,100 1,0751,119 1,035 1,102 1,129
2005 2006 2007 2008
Germany Spain Total EU
Source: Various News Sources@TMA_org conference.tma.org
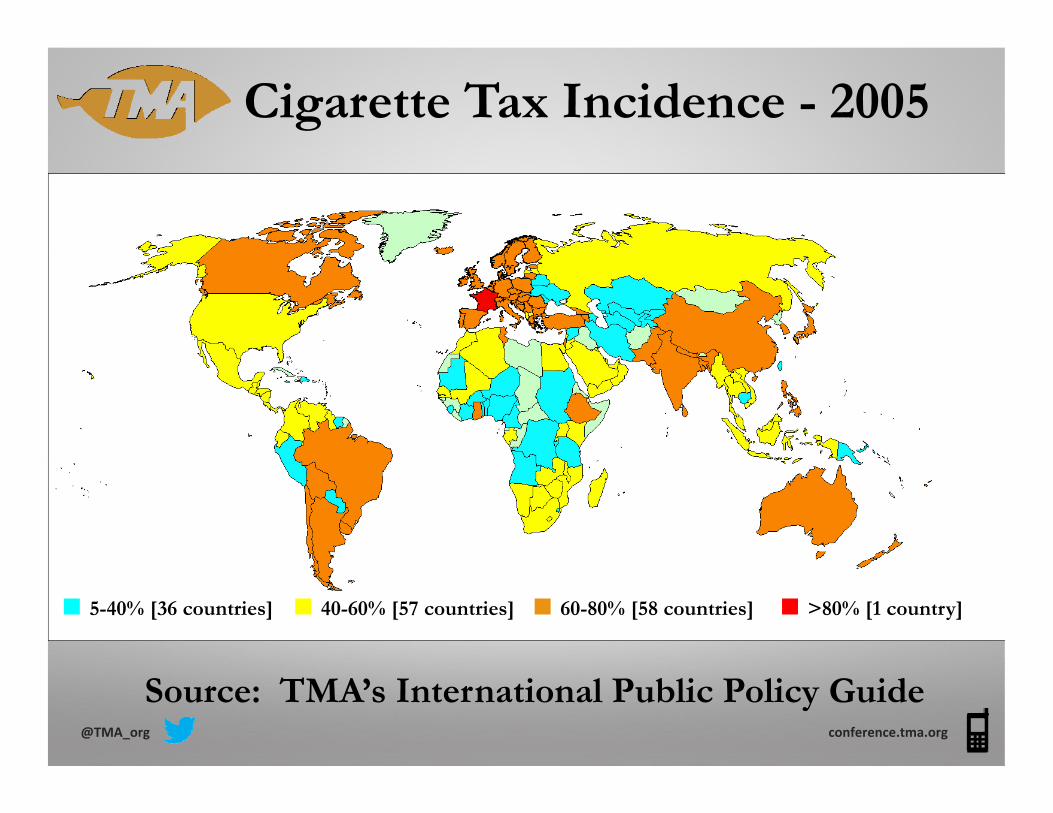
Cigarette Tax Incidence - 2005
5-40% [36 countries] 40-60% [57 countries] 60-80% [58 countries] >80% [1 country]
@TMA_org conference.tma.org
Source: TMA’s International Public Policy Guide
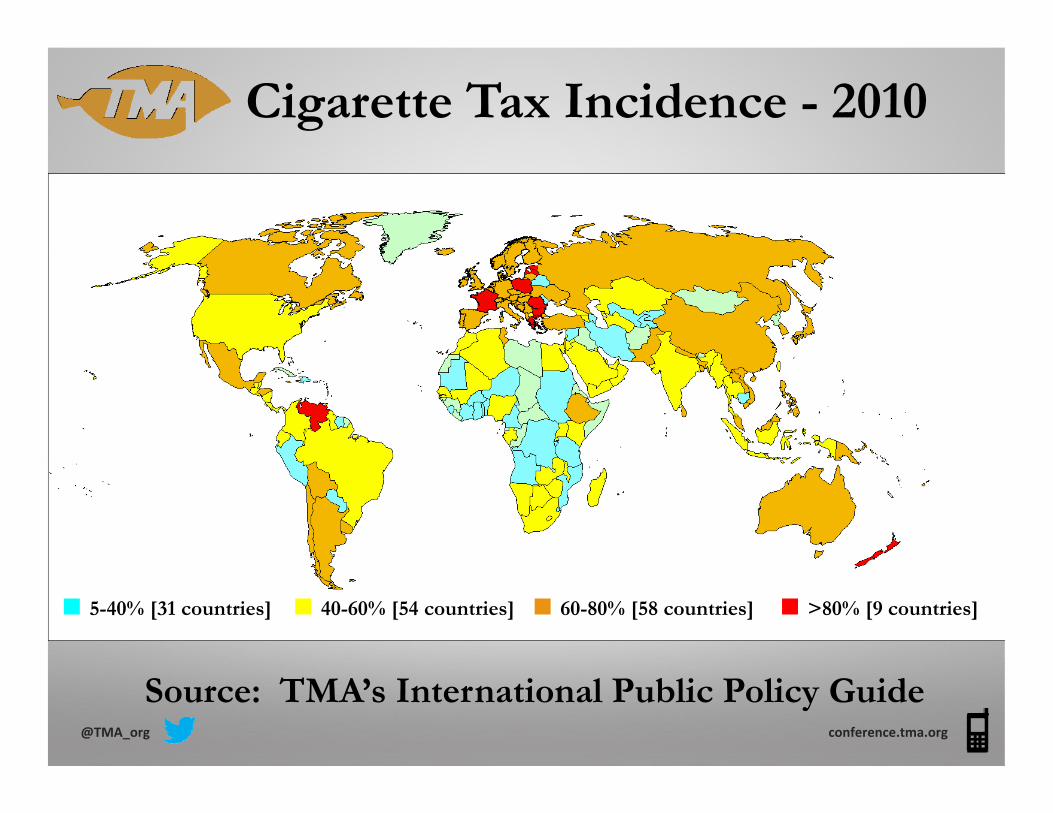
Cigarette Tax Incidence - 2010
5-40% [31 countries] 40-60% [54 countries] 60-80% [58 countries] >80% [9 countries]
@TMA_org conference.tma.org
Source: TMA’s International Public Policy Guide
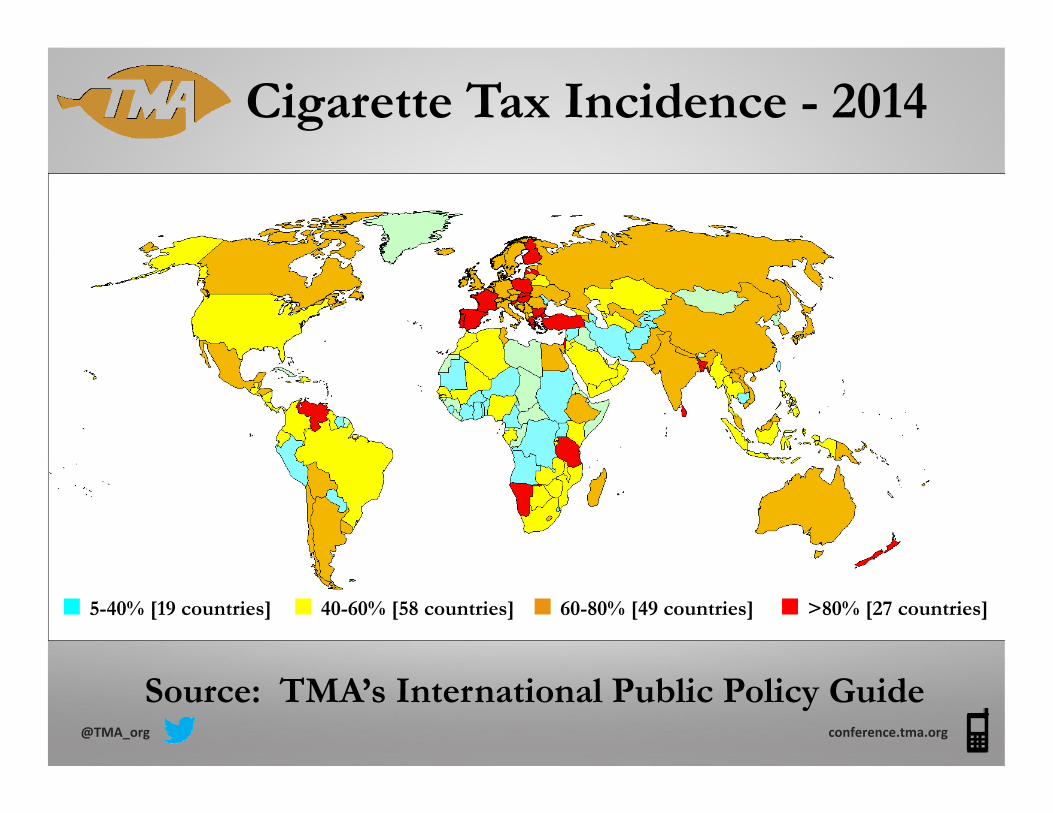
Cigarette Tax Incidence - 2014
5-40% [19 countries] 40-60% [58 countries] 60-80% [49 countries] >80% [27 countries]
@TMA_org conference.tma.org
Source: TMA’s International Public Policy Guide
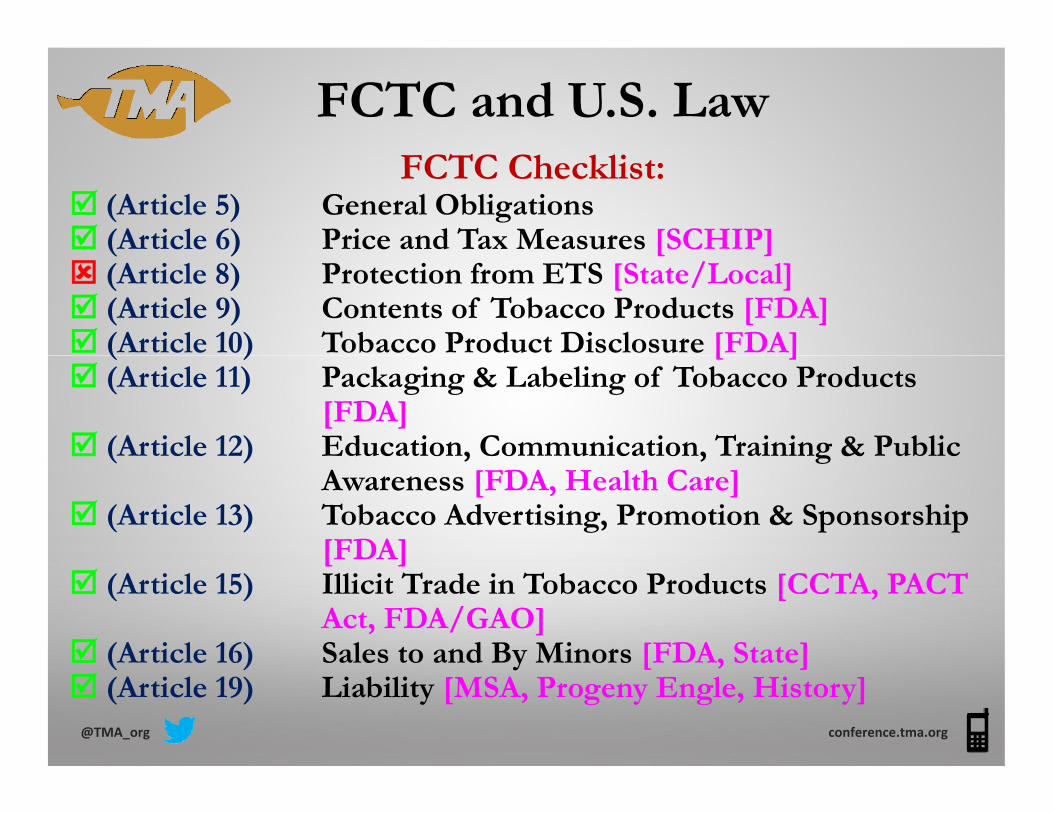
FCTC and U.S. LawFCTC Checklist:
(Article 5) General Obligations (Article 6) Price and Tax Measures [SCHIP]( ) [ ] (Article 8) Protection from ETS [State/Local] (Article 9) Contents of Tobacco Products [FDA] (Article 10) Tobacco Product Disclosure [FDA]( ) [ ] (Article 11) Packaging & Labeling of Tobacco Products
[FDA] (Article 12) Education, Communication, Training & Public ( ) , , g
Awareness [FDA, Health Care] (Article 13) Tobacco Advertising, Promotion & Sponsorship
[FDA][ ] (Article 15) Illicit Trade in Tobacco Products [CCTA, PACT
Act, FDA/GAO] (Article 16) Sales to and By Minors [FDA, State]
@TMA_org conference.tma.org
( ) y [ , ] (Article 19) Liability [MSA, Progeny Engle, History]
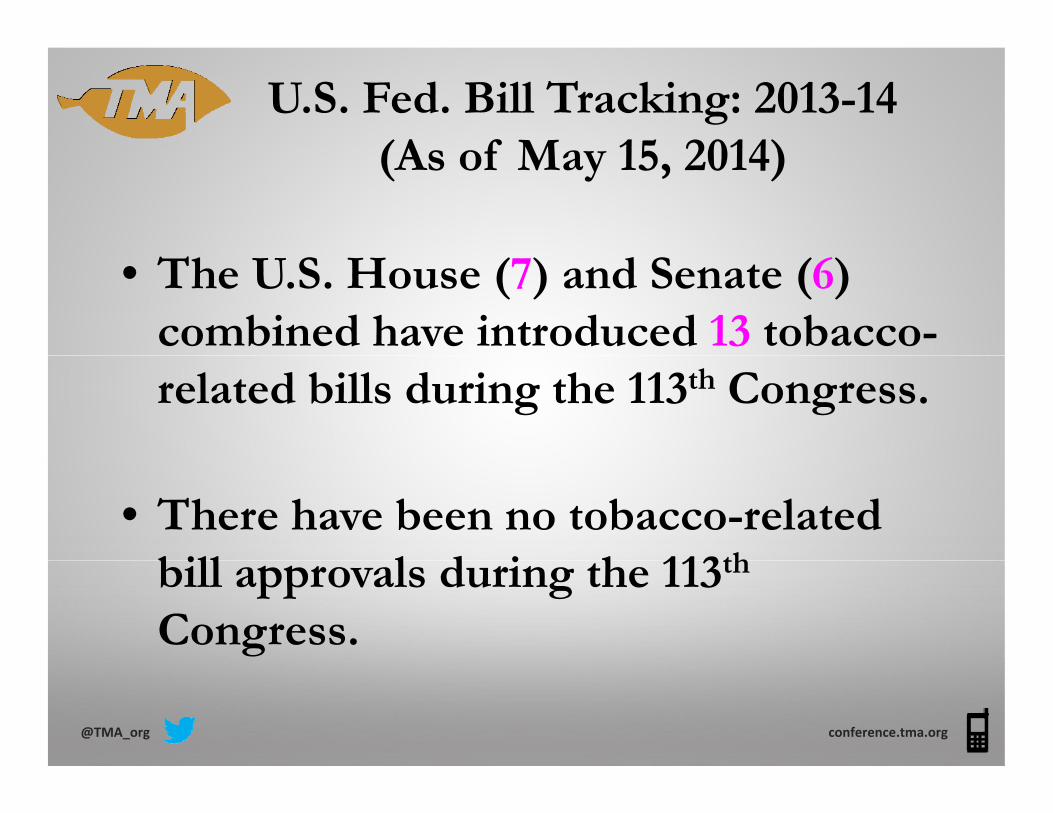
U.S. Fed. Bill Tracking: 2013-14(As of Ma 15 2014)(As of May 15, 2014)
• The U.S. House (7) and Senate (6) combined have introduced 13 tobacco-related bills during the 113th Congress.
• There have been no tobacco-related bill l d i h 113thbill approvals during the 113th
Congress.
@TMA_org conference.tma.org

U.S. Fed. Bill Tracking: 2013-14(As of Ma 15 2014)(As of May 15, 2014)
• The 7 U S House bills include:The 7 U.S. House bills include:Prohibition of E-Cig Marketing to Minors“STOP Act” ProposalpExcise Tax IncreasePremium Cigar Exemption to FDA-CTP
• The 6 U.S. Senate bills include:Prohibition E Cig Marketing to MinorsProhibition E-Cig Marketing to MinorsExcise Tax Increase (2 bills)Premium Cigar Exemption to FDA-CTP
@TMA_org conference.tma.org
g p

State Legislative Tracking – 2014(As of Ma 15 2014)(As of May 15, 2014)
• St t h i t d d 572 t b• States have introduced 572 tobacco-related bills (compared to 1,021 in full
2013 d 667 i f ll 2012)year 2013 and 667 in full year 2012).
• States have enacted 98 tobacco-related bills (compared to 240 in full year 2013 and 187 in full year 2012.
@TMA_org conference.tma.org
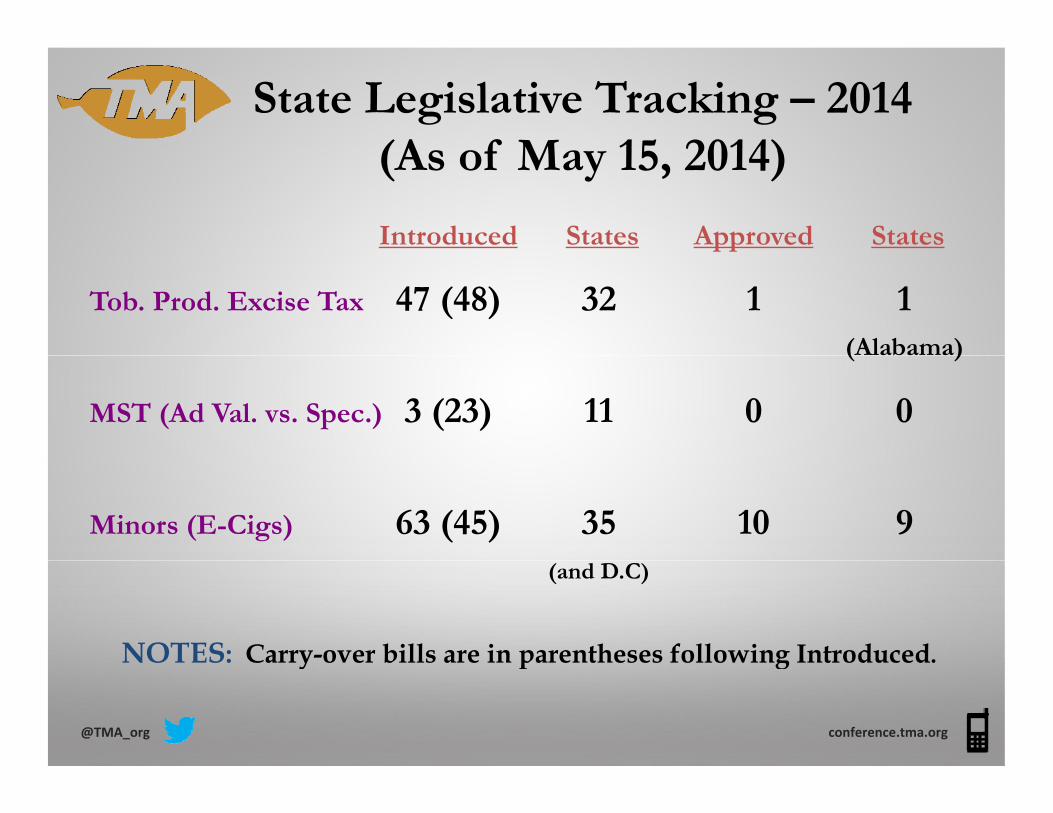
State Legislative Tracking – 2014(As of Ma 15 2014)(As of May 15, 2014)
Introduced States Approved States
Tob. Prod. Excise Tax 47 (48) 32 1 1(Alabama)( )
MST (Ad Val. vs. Spec.) 3 (23) 11 0 0
Minors (E-Cigs) 63 (45) 35 10 9(and D.C)
NOTES: Carry-over bills are in parentheses following Introduced.
@TMA_org conference.tma.org
y p g

Cigarette Excise Tax Legislation ( f 5/18/14)(as of 5/18/14)
No Legislation Introduced [30 States]
Legislation Introduced [20 States including Hawaii]
Legislation Passed Both Houses [VT]
@TMA_org conference.tma.org
Source: TMA’s Legislative Tracking

State Legislative Bill Type Approvals:E-Vapor (2009-14)E Vapor (2009 14)
# of # of Ban on SmokingApprovals States Minors Restrictions Definition OtherApprovals States Minors Restrictions Definition Other
2009 1 1 1 1 1 0
2010 4 4 3 0 4 1*2010 4 4 3 0 4 1
2011 2 2 2 0 2 0
2012 6 6 4 2 5 2
2013 16 14 13 2 14 4
2014 11 79 10 1 10 0
Total 38 30 31 6 34 7
* Effective August 1, 2010, Minnesota redefined “tobacco products” to
@TMA_org conference.tma.org
include e-cigarettes (95% of WSP).
2014 figures through May 15th

FDA-CTP AchievementsFlavored cigarette ban goes into effect(September 22, 2009)
Ci f b i li f ll ddi i bCigarette manufacturers submit list of all additives by brand/subbrand/quantity [e-submitter tool] (December 22, 2009)( )
Descriptor (“light”, “mild”, “low”) ban on cigarettes goes into effect (June 22, 2010)g (J )
“Substantial equivalence” registration[30 brands reviewed in 2013 – 17 approved, 13 rejected[ pp , j
4 brands reviewed in 2014 – 4 taken off market]
CTP coordinates with States concerning tobacco
@TMA_org conference.tma.org
CTP coordinates with States concerning tobacco retailer inspections to prevent sales to minors.

FDA-CTP “Deeming Regulations”(April 24 2014)(April 24, 2014)
Would extend the CTP’s authority to cover additional tobacco products such as:p• e-cigarettes/vapor/e-liquid, provided nicotine is derived from
tobacco• all cigars with the possible exception of hand-madeall cigars with the possible exception of hand made
“premium cigars” weighing 6 lbs. or more per 1,000 made with long-filler and 100% cigar binder and sold for $10 or more per piece at retailp p
• pipe tobacco• nicotine gels• waterpipe or hookah tobacco• waterpipe or hookah tobacco• dissolvables• components or parts such as a flavored hookah charcoal but
not accessories such as hookah charcoal burners cases for
@TMA_org conference.tma.org
not accessories such as hookah charcoal burners, cases for carrying tobacco, etc.
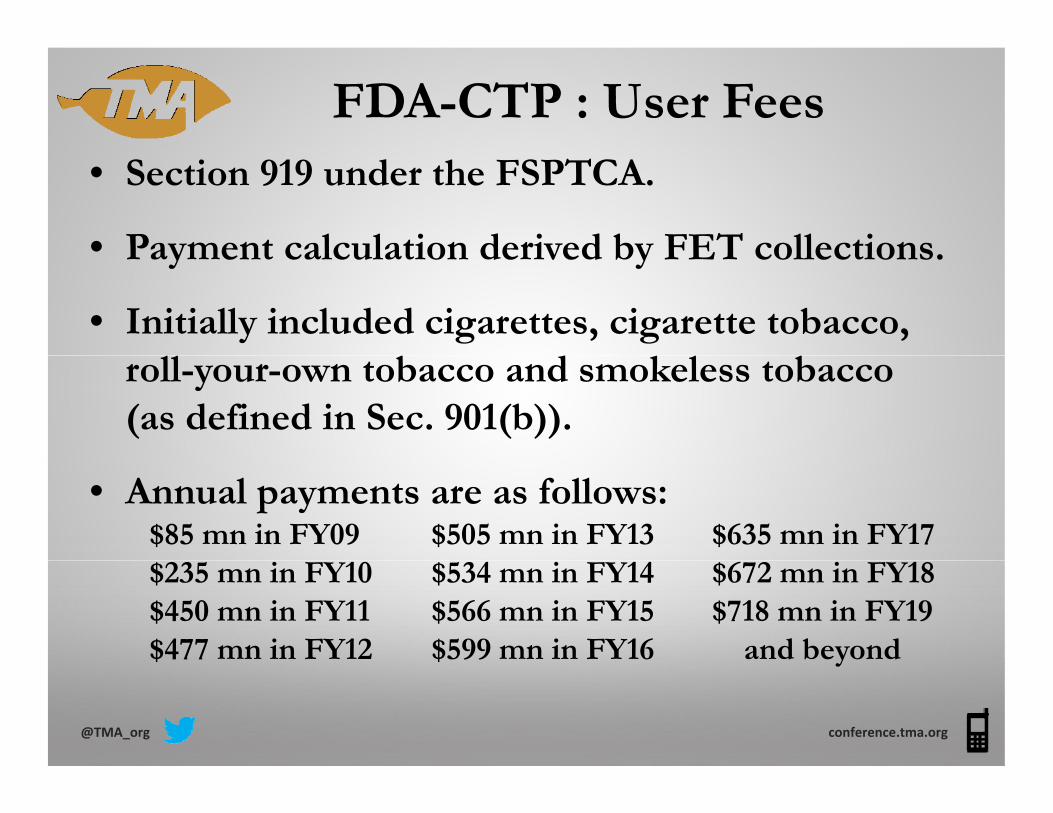
FDA-CTP : User Fees• Section 919 under the FSPTCA.
• Payment calculation derived by FET collectionsPayment calculation derived by FET collections.
• Initially included cigarettes, cigarette tobacco, droll-your-own tobacco and smokeless tobacco
(as defined in Sec. 901(b)).
• Annual payments are as follows:$85 mn in FY09 $505 mn in FY13 $635 mn in FY17$235 mn in FY10 $534 mn in FY14 $672 mn in FY18$450 mn in FY11 $566 mn in FY15 $718 mn in FY19$477 mn in FY12 $599 mn in FY16 and beyond
@TMA_org conference.tma.org
y
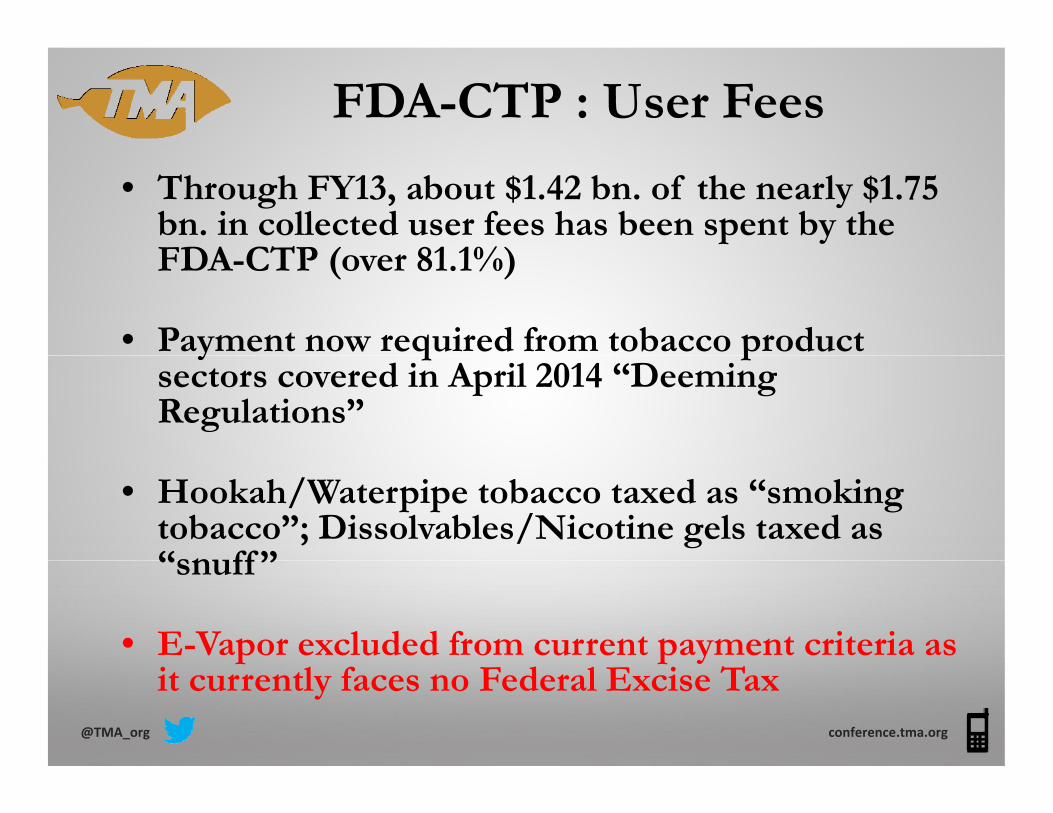
FDA-CTP : User Fees
• Through FY13, about $1.42 bn. of the nearly $1.75 bn. in collected user fees has been spent by the FDA CTP ( 81 1%)FDA-CTP (over 81.1%)
• Payment now required from tobacco product y q psectors covered in April 2014 “Deeming Regulations”
• Hookah/Waterpipe tobacco taxed as “smoking tobacco”; Dissolvables/Nicotine gels taxed as “snuff ”“snuff ”
• E-Vapor excluded from current payment criteria as
@TMA_org conference.tma.org
p p yit currently faces no Federal Excise Tax

Ongoing FDA-CTP Activities
Graphic Health Warning on cigarette packs(Scheduled Implementation Date: September 22, 2012)( p p , )
Ruling on menthol cigarettes(Based on TPSAC report & Public Comments)(Based on TPSAC report & Public Comments)
“Substantial equivalence” report decisions(A i l 4 500 SE ill di )(Approximately 4,500 SE reports still pending)
A list of HPHC’s in tobacco products including smokeA list of HPHC s in tobacco products, including smoke constituents, by brand and sub-brand is to be published in a format that is “understandable and not misleading to the public ”
@TMA_org conference.tma.org
misleading to the public.
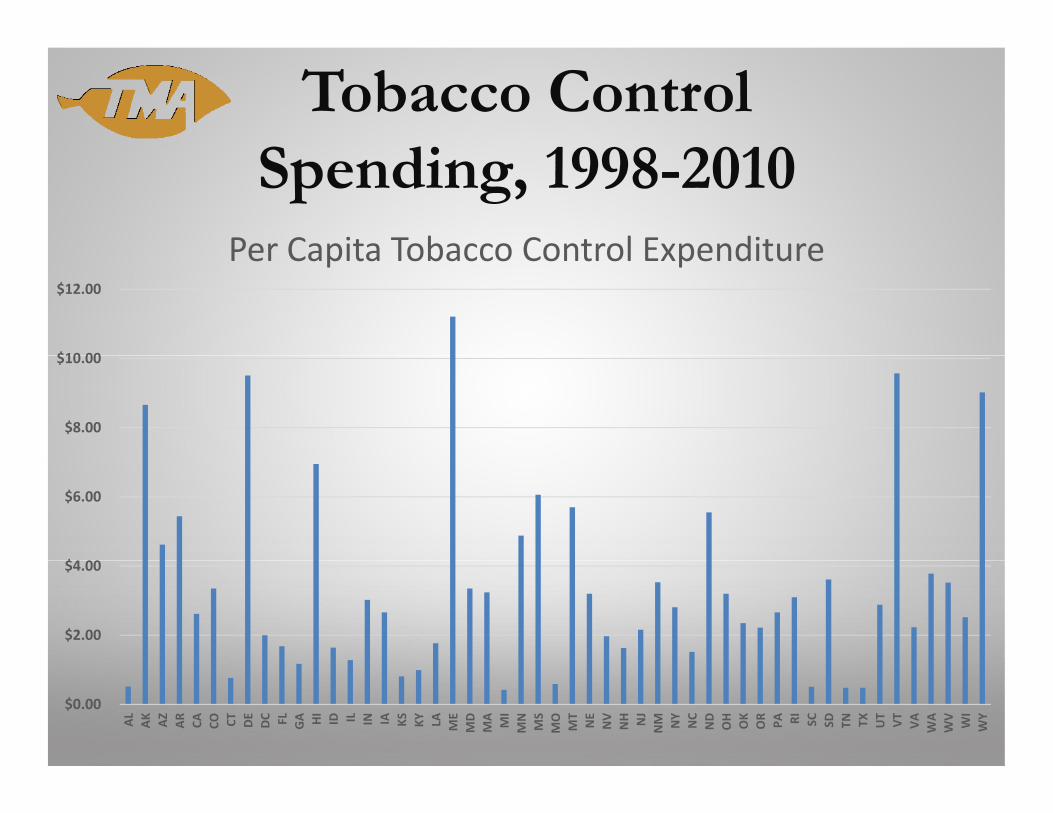
Tobacco ControlS di 1998 2010Spending, 1998-2010
Per Capita Tobacco Control Expenditure
$10 00
$12.00
Per Capita Tobacco Control Expenditure
$8.00
$10.00
$4 00
$6.00
$2.00
$4.00
$0.00
AL AK AZ AR CA CO CT DE
DC FL GA HI
ID IL IN IA KS KY LA ME
MD
MA MI
MN
MS
MO
MT
NE
NV
NH NJ
NM NY
NC
ND
OH OK
OR PA RI SC SD TN TX UT VT VA WA
WV WI
WY

Smoking PrevalenceB R iBy Region
●0‐11% ●11‐13% ●13‐15% ●15‐17% ●17‐19% ●19‐21% ●21+%
1998
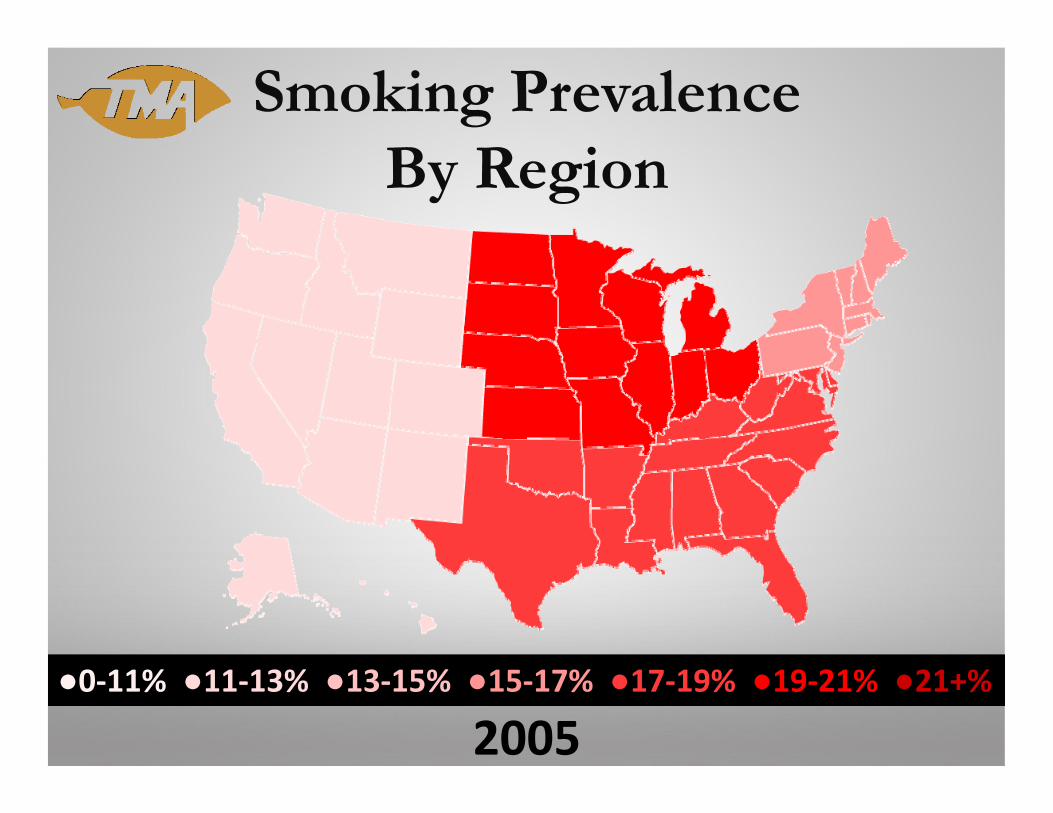
Smoking PrevalenceB R iBy Region
●0‐11% ●11‐13% ●13‐15% ●15‐17% ●17‐19% ●19‐21% ●21+%
2005
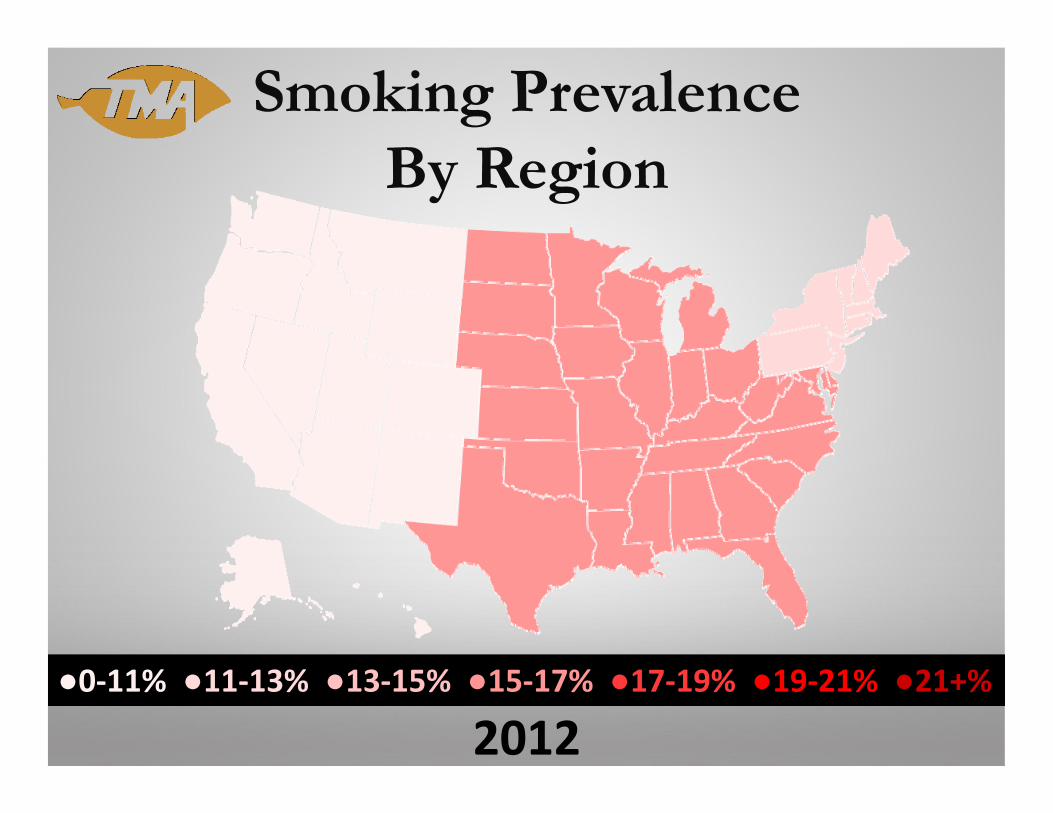
Smoking PrevalenceB R iBy Region
●0‐11% ●11‐13% ●13‐15% ●15‐17% ●17‐19% ●19‐21% ●21+%
2012
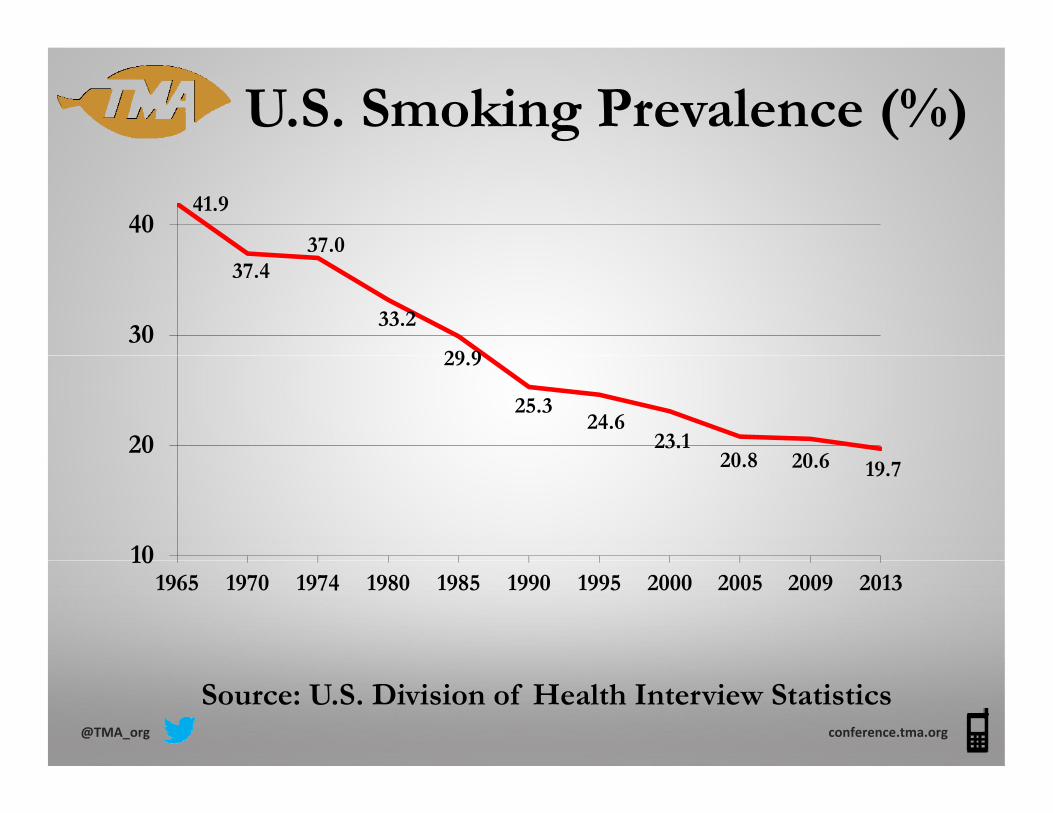
U.S. Smoking Prevalence (%)
41.9
37.040
37.4
33.2
29 930
29.9
25.324.6
23.120 8 20 6
2020.8 20.6 19.7
10101965 1970 1974 1980 1985 1990 1995 2000 2005 2009 2013
Source: U.S. Division of Health Interview Statistics@TMA_org conference.tma.org
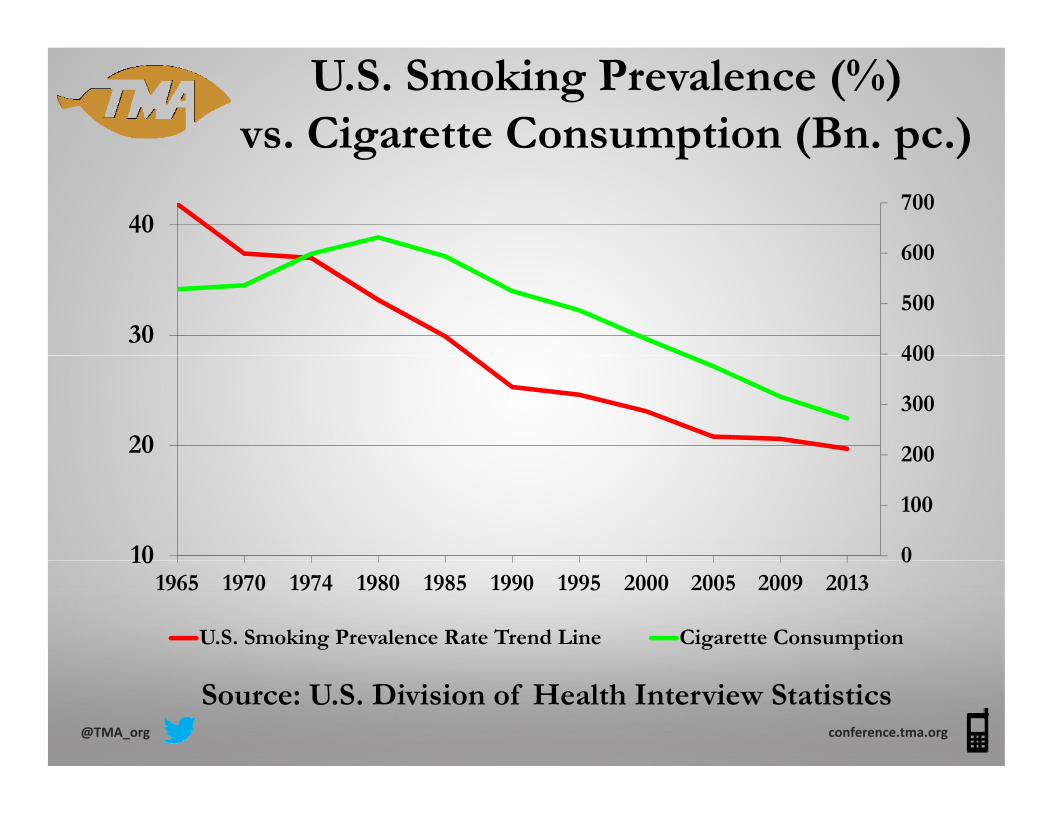
U.S. Smoking Prevalence (%)vs. Cigarette Consumption (Bn. pc.)g p ( p )
600
70040
400
500
600
30
200
300
400
20
0
100
200
10 0101965 1970 1974 1980 1985 1990 1995 2000 2005 2009 2013
U.S. Smoking Prevalence Rate Trend Line Cigarette Consumption
Source: U.S. Division of Health Interview Statistics@TMA_org conference.tma.org