overview of the first nine months of...
TRANSCRIPT


OVERVIEW OF THE FIRST NINE MONTHS OF 2013/14
Q3 2013/14
While the first quarter of 2014 marked a
promising start to the year for the fashion
industry, which reported growth rates of
approx. 3% compared to the first three
months of the previous year, the ensuing
months were rather disillusioning.
With like-for-like sales up by 5.2%, GERRY
WEBER International AG clearly
outperformed the German market as a whole
in the first half of the financial year 2013/14
(1 November 2013 – 30 April 2014).
For the months of our third quarter (May to
July), TW Testclub, an independent panel of
trade magazine Textilwirtschaft, reports for
the textile sector 2% growth in May, followed
by sharp year-on-year declines of -7% and -
8%, respectively for June and July.
The GERRY WEBER Group still clearly
outperformed the market as a whole in the
third quarter, when like-for-like Retail sales
remained stable compared to the third
quarter of the previous year.
In spite of these stable like-for-like Retail
sales in Q3 2013/14 and the additional
expansion-related 12.7% increase in the
GERRY WEBER International AG Interim Report Q3 2013/14
1

Retail segment’s sales revenues to EUR
104.9 million (Q3 previous year: EUR 93.1
million), total Group sales revenues (Retail
and Wholesale) remained almost constant,
down by -0.9% to EUR 187.2 million
compared to the prior year quarter. Sales
revenues in the Wholesale segment
amounted to EUR 82.3 million in Q3 2013/14
EUR (Q3 previous year: EUR 95.8 million).
The GERRY WEBER Group was
nevertheless able to increase its gross
margin by approx. 260 basis points to 59.4%
on almost comparable sales. This clearly
reflects the company’s improved profitability.
While third-quarter EBITDA remained almost
constant at EUR 22.7 million compared to Q3
2012/13 (EUR 22.6 million), EBIT declined
from EUR 17.4 million in the third quarter of
the previous year to EUR 16.0 million due to
increased depreciation/amortisation (EUR
6.7 million).
9M 2013/14
Profitable growth and, hence, improved profit
margins are primary objectives pursued by
the GERRY WEBER Group. This was
achieved in the first nine months of 2013/14,
when the gross margin increased from
53.8% to 56.4% and the EBIT margin
climbed from 10.2% to 10.9%.
The improved profitability is even more
remarkable as sales revenues in the first
nine months of the current financial year rose
Q3 2013/14 Q3 2012/13 9M 2013/14 9M 2012/13
in EUR million 01.05.14 - 31.07.14 01.05.13 - 31.07.13 01.11.13 - 31.07.14 01.11.12 - 31.07.13
Sales 187.2 189.0 600.0 592.8
Wholesale 82.3 95.8 306.4 333.1
Retail 104.9 93.2 293.6 259.7
Earnings key figures
EBITDA 22.7 22.6 84.5 76.1
EBITDA margin 12.1% 12.0% 14.1% 12.8%
EBIT 16.0 17.4 65.5 60.7
EBIT margin 8.5% 9.2% 10.9% 10.2%
EBT 14.9 16.7 61.7 58.5
EBT margin 7.9% 8.9% 10.3% 9.9%
Net income of the period 10.4 11.5 43.1 40.8
GERRY WEBER International AG Interim Report Q3 2013/14
2

moderately by 1.2% to EUR 600.0 million
(previous year: EUR 592.8 million). The
increase is attributable not only to the Retail
segment‘s like-for-like growth of 3.4% but
above all the expansion of the Group’s own
sales space in the past two years.
In spite of the ongoing expansion of the
Group’s own Retail operations and the
increasing implementation of the vertical
integration processes and the related
expenses, nine-month earnings before
interest and taxes (EBIT) were up by 7.9% to
EUR 65.5 million (9M previous year: EUR
60.7 million).
As a result, consolidated earnings after taxes
increased by 5.6% to EUR 43.1 million,
which is equivalent to earnings per share of
EUR 0.94 (9M previous year: EUR 0.89).
In view of the extraordinary importance of the
fourth quarter for our business model, we
continue to believe that we will reach the
performance indicators set out in our January
guidance.
9M 2013/14 9M 2012/13
in EUR million 01.11.13 - 30.04.14 01.11.12 - 31.07.13
Total assets 605.3 477.6
Equity 410.2 369.5
Debt Capital 195.1 108.1
Equity ratio 67.8% 77.4%
Key figures
High share price (in Euro) 39.24 38.35
Low share price (in Euro) 28.76 30.18
Earnings per share (in Euro) 0.94 0.89
Investments 47.5 17.8
Number of employees (average) 4,957 4,723
GERRY WEBER International AG Interim Report Q3 2013/14
3

THE GERRY WEBER SHARE While the global financial markets showed
great volatility in the first half of 2014, the
general trend was positive. Having passed
the 10,000 points mark in June, the DAX
reached an all-time high of 10,051 points on
20 June. In July, geopolitical events in the
Middle East and in Ukraine and the monetary
policies of the major central banks caused
growing uncertainty in the capital markets
and led to a marked slump in share prices.
The GERRY WEBER share delivered a very
positive performance in the first nine months,
reaching an all-time high of EUR 39.24 on 3
June 2014. Following a weaker performance
in the 2012/13 financial year, the GERRY
WEBER share opened the financial year
2013/14 at EUR 30.49 on 1 November 2013.
While the performance remained moderate in
the first quarter, the share price picked up in
the second and third quarter. At the end of
the third quarter on 31 July 2014, the share
price amounted to EUR 34.14, having gained
12.0% during the first nine months of the
financial year. The MDAX, in which the
GERRY WEBER share is listed, gained
1.35% during the same period, which means
that the GERRY WEBER share clearly
outperformed its benchmark index. An
average of 91,825 GERRY WEBER shares
per day were traded (Xetra) on 187 trading
days. On 31 July 2014, the market
capitalisation of the GERRY WEBER share
amounted to EUR 1,521 million.
In response to the growing interest shown by
foreign investors, we participated in the
German Investment Seminar in New York in
the third quarter of the current financial year,
where we informed existing but also new
potential investors about our business model
and our ongoing growth strategy. The first
nine months of the current financial year also
saw us participate in another four national
and international conferences and talk to
round about 120 investors on eight roadshow
days. In the coming quarter, our investors
and private shareholders will again be
informed about the business performance of
the GERRY WEBER Group at investor
conferences and roadshows as well as
various investor forums.
GERRY WEBER International AG Interim Report Q3 2013/14
4

GERRY WEBER International AG Interim Report Q3 2013/14
5

INTERIM GROUP MANAGEMENT REPORT on the first nine months of 2013/14
from 1 November 2013 to 31 July 2014
Sales performance
As in the two previous quarters of 2013/14,
GERRY WEBER International AG was able
to make a positive difference from the
general trend in the German fashion market
also in the third quarter. While the first half of
our financial year was characterised by an
almost balanced market environment, the
latter deteriorated in June and July 2014.
Having increased by 2% in May 2014, sales
revenues dropped sharply compared to the
previous year in June (-7 %) and July (-8 %).
While the GERRY WEBER Group was
unable to fully isolate itself from the negative
market environment in May and July 2014,
our like-for-like Retail sales did not decline
and remained stable on a quarterly basis.
Not least due to the increasing difficult
market environment, in which re-orders of
our Wholesale customers fell short of our
expectations, in particular, total Group sales
revenues declined by a moderate 0.9% to
EUR 187.2 million in the third quarter of
2013/14 compared to the prior year period.
Lower sales revenues in the Wholesale
segment (EUR 82.3 million) were not entirely
offset by the 12.7% increase in Retail
revenues, which climbed to EUR 104.9
million in the third quarter.
Total Group sales revenues in the first nine
months of 2013/14 amounted to EUR 600.0
million (9M previous year: EUR 592.8 Mio.),
which represents an increase of 1.2%.
A major contribution to this sales growth in
the first nine months was made by the Retail
segment, whose relative share in total Group
revenues climbed from 43.8% to 48.9%.
Performance of the Retail segment
Having climbed by 13.3% in H1 2013/14,
Retail revenues increased by 12.7 to EUR
104.9 million in the third quarter. Retail
revenues for the nine-month period of
2013/14 totalled EUR 293.6 million, which
represents an increase by 13.0% on the prior
year period.
Wholesale 51,1 %
(VJ: 56,2%)
Retail48,9 %
(VJ: 43,8%)
Sales split by segments 9M 2013/14
GERRY WEBER International AG Interim Report Q3 2013/14
6

The positive development of the Retail
segment is attributable to both a 3.4%
increase in like-for-like sales (9M) and to the
growing sales generated by the stores
opened in the past two years. The 3.4%
increase in like-for-like Retail sales means
that we clearly outperformed the market as a
whole.
The company-managed Houses of GERRY
WEBER and mono-label stores contributed
76.5% to the Retail segment’s total nine-
month revenues. The number of company-
managed stores increased by 39 (net) to 607
as of 31 July 2014.
In the context of the ongoing vertical
integration of our distribution channels, the
concession stores are playing an
increasingly important role. In contrast to the
shop-in-shops, which form part of the
Wholesale segment, the concession stores
are rented from our retail partners, which
gives us full control over the goods that are
available in these stores. At present, we
operate 115 concession stores exclusively in
European countries outside Germany.
The chart shows a breakdown of Retail
revenues by distribution channels.
Performance of the Wholesale segment
When analysing the Wholesale revenues, it
should be noted that the figures for the first
nine months of the previous financial year
included sales to 18 Belgian and eight
Houses of GERRY WEBER run by
franchisees. As we acquired majority
shareholdings in our Belgian and Norwegian
franchisees with effect from 1 August 2013
and 1 June 2014, respectively, these
revenues are now counted towards the Retail
segment.
Accordingly, Wholesale revenues declined
by 14.1% to EUR 82.3 million in the third
quarter of 2013/14 Q3 previous year: EUR
HoGWs+Mono 76.5%
(prev:75.1%)
Concession5.1%
(prev:4.8%)
Outlets12.9%
(prev: 14.7%)
Online Shops5.5%
(prev: 5.4%)
Sales split Retail 9M 2013/14
GERRY WEBER International AG Interim Report Q3 2013/14
7

95.8 million). As already in the previous year,
we again delisted a number of Wholesale
partners who failed to meet our strict credit
assessments. The re-ordering behaviour of
our Wholesale customers also contributed to
the reduction in Wholesale revenues.
Because of the difficult market environment
in June and July 2014, re-orders remained
clearly below our expectations, which means
that sales to existing Wholesale customers
also failed to improve.
Due to the reclassification of the revenues
generated by the 18 Belgian HoGWs to the
Retail segment as well as lower pre-order
volumes, Wholesale revenues were down on
the previous year already in the first two
quarters of our financial year (-5.6%). As
another eight Norwegian stores were taken
over with effect from 1 June 2014, their
revenues were reclassified to the Retail
segment as well; as a result, Wholesale
revenues for the first nine months of 2013/14
declined by a total of 8.0% to EUR 306.4
million (9M previous year: EUR 333.1
million).
Accordingly, the relative contribution made
by the Wholesale segment to total Group
revenues dropped from 56.2% in the first
nine months of the previous year to 51.1% in
the same period of the current financial year.
The decline in the Wholesale segment’s
share in total Group revenues reflects not
only the expansion of our Retail operations
but also the ongoing implementation of our
vertical integration strategy.
Performance of the distribution channels
The distribution channels of the fashion
industry have changed considerably in the
past years. Fully vertically integrated sales
formats will continue gaining ground in the
market. The GERRY WEBER Group opened
its first own House of GERRY WEBER
already back in 1999. The number of
company-managed stores increased at a
disproportionate rate especially in the past
financial years. At the end Q3 2013/14, the
company operated 751 own stores in
Germany and abroad. This clearly reflects
the growing importance of fully vertically
integrated distribution structures at GERRY
WEBER.
The aim of the vertical integration strategy is
to assume control over merchandise
management in more and more stores and to
get the collections to the sales floors even
more quickly.
In the first nine months of the current
financial year, the number of company-
managed stores increased from 701 to 751.
Own stores comprise the Houses of GERRY
WEBER and the mono-label stores as well
as the concession stores and the outlet
centres. See the chart below for a detailed
breakdown of the individual distribution
channels.
The number of own stores outside Germany
increased by 40 (net). Besides new store
openings in Belgium and Poland as well as
market entries in the Czech Republic,
Slovakia and Sweden, the acquisition of 25
Norwegian stores made an important
contribution to our increased Retail presence
in Europe. As of the end of Q3 2013/14,
GERRY WEBER International AG Interim Report Q3 2013/14
8

GERRY WEBER apparel was sold in
company-managed stores in 14 European
countries.
As we expanded our Retail operations in
Germany and abroad, the number of factory
outlets increased from 22 to 29 during the
reporting period; eight of these outlet centres
are located outside Germany.
At 272, the number of franchised Houses of
GERRY WEBER would seem to have
remained constant in the first nine months
(31 Oct. 2013: 271 franchised stores). It
should be noted, however, that eight
Norwegian franchised stores now form part
of the Retail segment following the June
2014 takeover. A total of 20 new franchised
stores were opened, including eight in
Russia and five in Switzerland. Franchised
stores were closed in Poland and Italy,
mostly for strategic reasons.
The shop-in-shops are another important
distribution channel of the Wholesale
segment. Their number declined from 2,816
at the end of the financial year on 31 October
2013 to 2,770. This decline is primarily
attributable to the fact that smaller shop-in-
shops were merged into larger, more visible
shops as well as to portfolio adjustments.
E-commerce is gaining importance primarily
for our TAIFUN and SAMOON brands and is
therefore being expanded on an international
scale. The EU online shop for Sweden,
Belgium, France and the UK was launched in
June 2014, which means that our own Retail
operations are now complemented by e-
shops in a total of nine countries.
9M 2013/14 2012/13
31.07.2014 31.10.2013
RETAIL
Houses of GERRY WEBER 469 424
Monolabel Stores 138 144
Concession Flächen 115 111
Factory Outlets 29 22
WHOLESALE
Houses of GERRY WEBER 272 271
Shop-in-Shops 2.770 2.816
GERRY WEBER International AG Interim Report Q3 2013/14
9
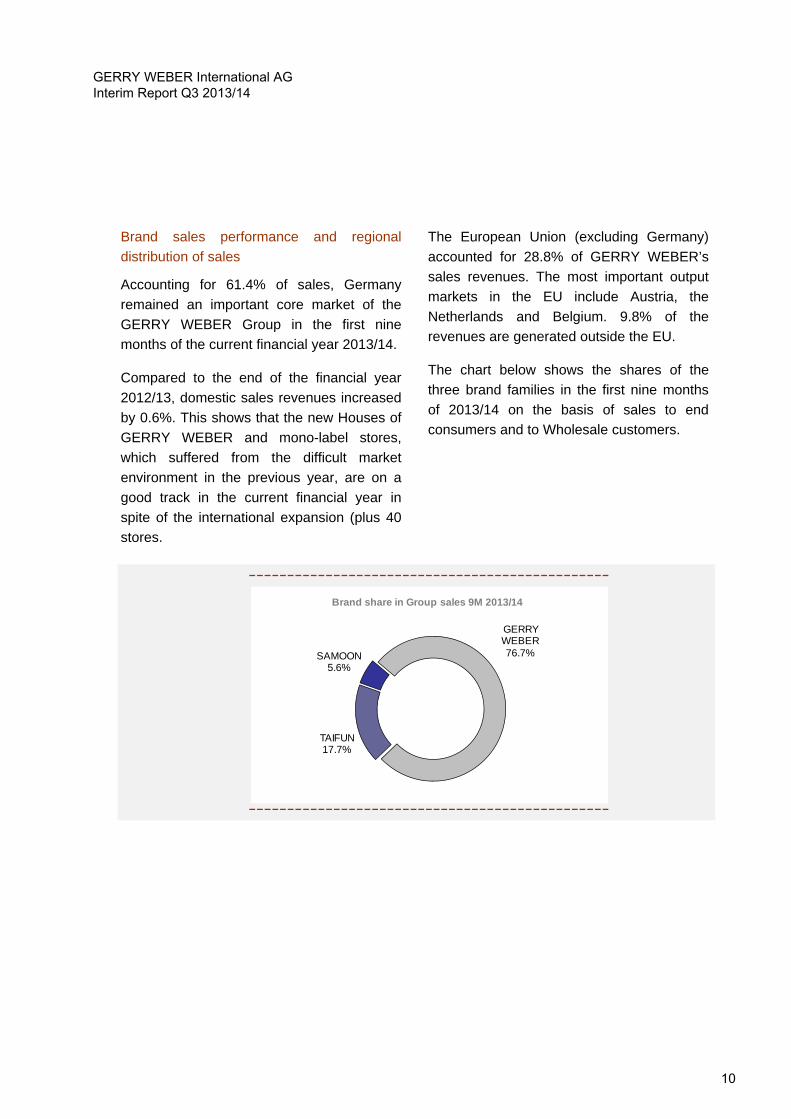
Brand sales performance and regional
distribution of sales
Accounting for 61.4% of sales, Germany
remained an important core market of the
GERRY WEBER Group in the first nine
months of the current financial year 2013/14.
Compared to the end of the financial year
2012/13, domestic sales revenues increased
by 0.6%. This shows that the new Houses of
GERRY WEBER and mono-label stores,
which suffered from the difficult market
environment in the previous year, are on a
good track in the current financial year in
spite of the international expansion (plus 40
stores.
The European Union (excluding Germany)
accounted for 28.8% of GERRY WEBER’s
sales revenues. The most important output
markets in the EU include Austria, the
Netherlands and Belgium. 9.8% of the
revenues are generated outside the EU.
The chart below shows the shares of the
three brand families in the first nine months
of 2013/14 on the basis of sales to end
consumers and to Wholesale customers.
GERRY WEBER 76.7%
TAIFUN17.7%
SAMOON5.6%
Brand share in Group sales 9M 2013/14
GERRY WEBER International AG Interim Report Q3 2013/14
10

Earnings
Q3 2013/14
The Retail segment’s continuously growing
contribution to the business model again led
to a notable improvement in the gross margin
in the third quarter of 2013/14. In spite of a
moderate 0.9% decline in sales revenues,
the gross result climbed from EUR 107.4
million to EUR 111.1 million in the third
quarter of the current financial year.
Accordingly, the gross margin improved from
56.8% to 59.4% in Q3 2013/14.
The ongoing expansion of GERRY WEBER
International AG influenced the Group’s
earnings also in the third quarter of 2013/14.
Higher personnel expenses and rents for the
company’s own stores as well as one-time
expenses relating to the acquisition of 25
Norwegian stores, including eight franchised
Houses of GERRY WEBER, led to increased
expense items in the third quarter. Add to
this the fact that newly opened stores
generally make a lower contribution to the
Q3 2013/14 Q3 2012/13 9M 2013/14 9M 2012/13
in KEUR 01.05.14 - 31.07.14 01.05.13 - 31.07.13 01.11.13 - 31.07.14 01.11.12 - 31.07.13
Sales 187,230.1 188,959.2 600,007.1 592,843.1
Other operating income 4,107.0 4,033.6 11,271.5 11,177.1
Changes in inventories 26,337.5 15,791.5 30,994.5 7,738.6
Cost of materials -102,423.8 -97,397.2 -292,763.5 -281,870.1
Personnel expenses -40,764.5 -37,076.4 -113,767.5 -106,344.8
Depreciation/Amortisation -6,707.2 -5,293.2 -18,969.4 -15,363.0
Other operating expenses -51,501.0 -51,388.4 -150,417.7 -146,673.0
Other taxes -301.7 -273.4 -862.0 -786.1
OPERATING RESULT 15,976.4 17,355.7 65,493.0 60,721.8
Financial result -1,104.3 -628.6 -3,805.8 -2,208.3
RESULTS FROM ORDINARY ACTIVITIES 14,872.1 16,727.1 -61,687.2 58,513.5
Taxes on income -4,487.5 -5,250.3 -18,593.9 -17,714.1
NET INCOME OF THE REPORTING PERIOD 10,384.6 11,476.8 43,093.3 40,799.4
GERRY WEBER International AG Interim Report Q3 2013/14
11

company’s profits during the first few months
after their opening. A newly opened store
typically needs some 24 to 30 months to
reach an average revenue level and make an
average contribution to earnings.
Personnel expenses increased by EUR 3.7
million to EUR 40.8 million in the third
quarter. At the same time, the number of
employees rose from 4,723 to 5,139 on 31
July. (Annual Average: 4,957)
In spite of partly higher fixed costs, e.g. the
rents for the company’s own stores, other
operating expenses remained almost
constant at EUR 51.5 million in the third
quarter (Q3 previous year: EUR 51.4 million).
Taking into account the improved gross
margin and the increased expansion-related
expenses, earnings before interest, taxes,
depreciation and amortisation (EBITDA)
remained almost unchanged at EUR 22.7
million (Q3 previous year: EUR 22.6 million).
Accordingly, the EBITDA margin remained
constant at 12.1%.
Depreciation/amortisation increased from
EUR 5.3 million in the prior year quarter to
EUR 6.7 million also due to the expansion of
the Retail operations and the related
investments in fixed assets. With EBITDA
remaining unchanged, the increase in
depreciation/amortisation led to a 7.9%
decline in EBIT to EUR 16.0 million in Q3
2013/14.
The negative financial result increased
moderately to EUR 1.1 million compared to
the third quarter of the previous year (EUR
0.6 million) but remained almost unchanged
compared to the previous quarters of the
current financial year. The increase on the
previous year is attributable to the interests
of a EUR 75 million note loan in November
2013 to finance the new logistic centre. The
result after taxes for the third quarter 2013/14
amounted to EUR 10.4 million. The moderate
decline by 9.5% led to lower earnings per
share, which declined from EUR 0.25 to EUR
0.23 in the third quarter.
9M 2013/14
Compared to the growth in sales revenues in
the first nine months of 2013/14 (+1.2%), the
gross result increased at a disproportionate
6.1% to EUR 338.2 million (9M previous
year: EUR 318.7 million). As outlined above,
the Retail segment’s higher share in total
revenues had a particularly positive effect on
the gross margin, which consequently
climbed from 53.8% to 56.4% (+260 basis
points).
Improved inventory management and the
resulting faster inventory turnover as well as
our flexible procurement structures also
contributed to the higher gross margin and,
hence, to the company’s improved
profitability.
The number of company-managed stores
increased by 119 to 751 over the past twelve
months (since 1 August 2013). Our own
stores are run by our own staff, which means
that personnel expenses increased at a
higher rate than sales revenues. In the nine-
month period, personnel expenses rose by
7.0% to EUR 113.8 million compared to the
first nine months of the previous year. In this
context, it should be noted that the sales
revenues generated by a newly opened store
slowly rise to an average level, whereas fixed
costs such as personnel expenses and rents
are partly incurred already prior to the
GERRY WEBER International AG Interim Report Q3 2013/14
12

opening. Personnel expenses as a
percentage of sales revenues climbed from
17.9% to 19.0%. As more and more
company-managed stores become
established in their locations, we expect to
be able to reduce personnel expenses as a
percentage of sales revenues.
Compared to personnel expenses, other
operating expenses rose only moderately in
the nine-month period. This is mainly due to
positive effects affecting the revenue-related
cost items such as transport and logistics,
which increased at a lower rate than fixed
costs. Other operating expenses totalled
EUR 150.4 million at the nine-month stage
(9M previous year: EUR 146.7 million), which
represents an increase of 2.6%.
Earnings before interest, taxes, depreciation
and amortisation (EBITDA) were up by a
high 11.0% on the previous year and
amounted to EUR 84.5 million (EUR 76.1
million). The improved EBITDA clearly
reflects the increased profitability of GERRY
WEBER Group.
In the last months new company-managed
stores were opened and existing franchised
stores were taken over and transferred to the
Retail segment. As this led to an increase in
the Group’s assets and depreciation
/amortisation rose by 23.5% to EUR 19.0
million (9M previous year: EUR 15.4 million).
Earnings before interest and taxes (EBIT) for
the full period amounted to EUR 65.5 million,
compared to EUR 60.7 million in the first nine
months of the previous year, which
represents an increase of 7.9%, Taking into
account the financial result (EUR -3.8 million)
and income taxes (EUR –18.6 million), the
GERRY WEBER Group’s net income for the
period after taxes amounted to EUR 40.8
million (9M previous year: EUR 40.8 million).
This represents an increase by 5.6%.
Accordingly, earnings per share improved
from EUR 0.89 to EUR 0.94 per share.
Net worth position
Since the end of the financial year 2012/13,
total assets of GERRY WEBER International
AG have increased by approx. EUR 73.7
million or 13.9% to EUR 605.3 million.
On the assets side of the balance sheet,
non-current assets were primarily influenced
by changes in intangible assets and property,
plant and equipment. At EUR 85.4 million,
intangible assets were up by approx EUR
15.3 million or 21.8% on the end of the
financial year 2012/13. This increase is
mainly the result of the recognition of
intangible assets acquired against payment
such as customer relationships, which were
acquired in conjunction with the acquisition of
25 Norwegian stores, including eight former
franchised Houses of GERRY WEBER.
As of 31 July 2014, property, plant and
equipment totalled EUR 178.9 million,
compared to EUR 165.9 million at the end of
the financial year 2012/13. This represents
an increase of 7.9%, which is due to the
ongoing expansion of the company’s Retail
operations, among other things. Advance
payments for work in progress climbed from
EUR 1.4 million to EUR 13.4 million at the
end of Q3 2013/14. Work in progress
primarily comprises construction measures
GERRY WEBER International AG Interim Report Q3 2013/14
13

related to the construction of our new logistic
centre close to our company headquarters.
At EUR 26.9 million, the carrying amount of
the Hall 30 investment property remained
almost unchanged (31 July 2013: EUR 27.3
million). Non-current assets totalled EUR
300.6 million, compared to EUR 274.9 million
at the end of the financial year 2012/13.
Current assets were primarily influenced by
an increase in inventories, in other current
assets as well as in cash and cash
equivalents.
Inventories increased by 26.7% or EUR 29.8
million compared to the end of the financial
year 2012/13 and amounted to EUR 141.2
million at the nine-month stage 2013/14. This
strong growth is due to the expansion of the
company-managed Retail stores as well as
to the seasonal increase in inventories during
the third quarter, in which the first part of the
autumn/winter collection is usually delivered
to the central warehouses.
Cash and cash equivalents rose by 18.6%
from EUR 65.6 million to EUR 77.8 million.
The third quarter of our financial year is
characterised by an outflow of cash used to
pre-finance a major part of the autumn/winter
collection, which, as outlined above, is
delivered to our customers and our own
stores in the following months. Also in the
third quarter, the company pays out the
dividend, which led to an outflow of cash of
EUR 34.4 million in Q3 2013/14. Current
trade receivables declined from EUR 65.8
million to EUR 54.9 million. The decrease by
16.6% is primarily attributable to the different
reporting dates.
Equity capital increased from EUR 395.8
million at the end of the previous financial
year to EUR 410.2 million as of 31 July 2014,
primarily due to the allocation of the higher
net income for the period. Against the
background of the increase in total assets
mentioned above, the Group’s equity ratio
declined moderately from 74.4% at the end
of the past financial year to 67.8%.
Non-current liabilities increased from EUR
48.5 million on 31 October 2013 to EUR
128.6 million. The increase is primarily
attributable to the note loan issued in
November 2013. As a result, non-current
financial liabilities climbed from EUR 5.7
million to EUR 85.8 million.
Other non-current liabilities in the amount of
EUR 24.3 million result from the majority
interests in the Dutch and Belgian Houses of
GERRY WEBER and concession stores. The
GERRY WEBER Group holds 51% in the
companies operating these stores. As there
is a mutual option right for the acquisition of
the remaining 49%, the anticipated purchase
price of these shares is recognised under
“Other non-current liabilities”.
Current liabilities declined from EUR 87.4
million to EUR 66.5 million in the first nine
months of 2013/14. This is primarily due to
the payment of current tax liabilities, which
sent other current liabilities falling to EUR
11.6 million (31 Oct. 2013: EUR 27.7 million).
GERRY WEBER International AG Interim Report Q3 2013/14
14

Financial assets and investments
Due to the increase in earnings before
interest and taxes in the first nine months of
2013/14, cash flow from operating activities
was up by 88.4% to EUR 16.4 million on the
same period of the previous year (EUR 8.7
million). Taking into account increased
interest payments for the note loan of EUR
2.0 million (9M previous year: EUR 1.0
million), cash flow from current operations
doubled to EUR 13.9 million (9M previous
year: EUR 7.0 million).
Investments in property, plant and equipment
as well as intangible assets stood at EUR
42.0 million at the nine-month stage, up by a
high EUR 24.4 million on the same period of
the previous financial year. Besides the
investments in the expansion of our Retail
operations, this is primarily attributable to the
acquisition of 25 Norwegian stores, which
were taken over with effect from 1 June
2014. In addition, the first investments were
made in our new logistic centre, construction
of which commenced in April 2014. Against
the background of the acquisition in Norway,
the outflow of cash for the acquisition of fully
consolidated entities amounted to EUR 5.2
million. The outflow of cash from investing
activities totalled EUR 47.0 million (9M
previous year: EUR 17.4 million).
Cash flow from financing activities is
influenced by the dividend payment for the
financial year 2012/13 in the amount of EUR
34.4 million on the one hand and by funds
raised in the amount of EUR 79.7 million on
the other hand. These primarily result from
the issue of a EUR 75 million note loan. At
the bottom line, cash flow from financing
activities totalled EUR 45.3 million.
As a result of the inflow and outflow of cash
described above, cash and cash equivalents
increased by EUR 12.2 million to EUR 77.8
million (1 November 2013: EUR 65.6 million).
Segment report
GERRY WEBER International AG
distinguishes between two main segments,
“Production and Wholesale" and “Retail", as
well as “Other segments”. The Wholesale
segment comprises all distribution structures
with external specialist retailers as well as all
development and production processes for
our merchandise including transport and
logistics. The “Retail“ segment is almost
exclusively a distribution segment and
includes all company-managed Houses of
GERRY WEBER, mono-label stores,
concession shops, outlet stores as well as
the individual national online shops. “Other
segments” mainly comprise the income and
expenses as well as the assets and liabilities
of the Hall 30 investment property. Income
and expenses as well as assets and liabilities
of the holding company are allocated
proportionately to the individual segments.
Due to the decline in Wholesale revenues
from EUR 333.1 million in the first nine
months of the previous year to EUR 306.4
million, the segment’s earnings before tax
also dropped from EUR 51.1 million to EUR
39.1 million. As discussed above, much of
this reduction is attributable to the
reclassification of revenues from the
GERRY WEBER International AG Interim Report Q3 2013/14
15

Wholesale segment to the Retail segment.
The Wholesale sales to 18 Belgian and eight
Norwegian Houses of GERRY WEBER have
been counted towards the Retail segment
since 1 August 2013 and 1 June 2014,
respectively, when these stores were taken
over.
The reclassification of stores to the Retail
segment is also reflected in the number of
franchised Houses of GERRY WEBER.
Although 20 franchised stores were opened,
their number remained almost constant, at
272, compared to the end of the financial
year.
Against the background of the allocation of
the holding company’s assets and liabilities
to the individual segments, the Wholesale
segment’s assets rose by 14.9% to EUR
397.8 million. Accordingly, the segment’s
liabilities also increased from EUR 53.7
million in the first nine months of the previous
financial year to EUR 73.2 million on 31 July
2014.
Wholesale investments in non-current assets
amounted to EUR 18.7 million in the first nine
months of 2013/14, compared to EUR 6.4
million in the previous year. The Wholesale
segment’s average headcount declined from
1,370 to 1,281.
Due to the strong 13% increase in the Retail
segment’s nine-month revenues to EUR
293.6 million, earnings before taxes (EBT)
improved to EUR 19.1 million. This
represents an almost fourfold increase in
EBT compared to the first nine months of the
previous year (9M previous year: EUR 5.0
million). As explained above, the increase in
sales revenues is due not only to the
expansion of our own sales space but also to
a 3.4% increase in like-for-like Retail sales in
the first nine months of 2013/14.
The consistent implementation of our Retail
expansion strategy and the takeover of
existing franchised stores led to an increase
in assets and hence to a sharp rise in the
Retail segment’s depreciation/amortisation,
which climbed from EUR 7.9 million in the
first nine months of the previous financial
year to EUR 11.3 million in the nine-month
period 2013/14.
As outlined under “Performance of the
distribution channels”, the number of
company-managed stores increased from
701 at the end of the financial year on 31
October 2013 to 751. This includes eleven
stores closed between November 2013 and
July 2014.
As investments in the Retail segment’s non-
current assets increased from EUR 10.9
million to EUR 28.8 million (nine-month
comparison), the segment’s assets also
picked up by 35.9% to EUR 300.3 million. At
the same time, the Retail segment also
posted higher liabilities of EUR 245.8 million
(9M previous year: EUR 169.7 million).
GERRY WEBER’s own stores are run by the
Group’s own staff, which is why the Retail
segment’s average headcount increased
from 3,352 to 3,675 (+9.6%).
GERRY WEBER International AG Interim Report Q3 2013/14
16
OPPORTUNITY AND RISK REPORT
As a global fashion and lifestyle company,
we are exposed to changes and
uncertainties which may result from national
and international external conditions but also
from internal factors.
This is why risk management is an integral
element of corporate governance in the
GERRY WEBER Group. GERRY WEBER
focuses on identifying, assessing, managing
and monitoring risks in the context of a
comprehensible risk management and
control system covering all corporate
processes. The aim is to identify positive
developments at an early stage and to seize
the resulting opportunities in the interest of
the company.
The GERRY WEBER Group generates about
61.4% of its sales revenues in Germany.
While the German economy showed a
positive trend, almost as planned, in the first
months of 2014, geopolitical events made
themselves felt primarily in the second
quarter of 2014. Accordingly, the GfK
consumer confidence index indicated
considerable uncertainty among consumers
for the first time in months. While income
expectations and purchasing propensity have
remained relatively stable so far, economic
expectations suffered a notable setback in
August, when the index fell by 35.5 points to
10.4 points.
While German consumers remain in a
spending mood, they seem to be paying
more and more attention to geopolitical
developments. Uncertainty about the
potential consequences for the German
economy is growing. In particular, the
sanctions against Russia, which have
already had a clearly adverse impact on
exports, could become a real threat to the
German economy.
Should geopolitical events have an adverse
impact on economic activity and/or consumer
behaviour in one of our output markets, we
have installed mechanisms to assess
potential risks to the GERRY WEBER Group
and to minimise them by taking appropriate
measures.
For a detailed description of our risk
management system, the control systems for
the accounting processes and the
opportunities and risks in the GERRY
WEBER Group, please refer to the risk report
in the 2012/13 Annual Report. The
statements made in this risk report remain
valid.
Since the beginning of the fiscal year
2013/14, no material changes have occurred
regarding the opportunity risks to our
company’s future. Based on current
knowledge, there are no risks that could
jeopardise the existence of the GERRY
WEBER Group.
GERRY WEBER International AG Interim Report Q3 2013/14
17

POST-BALANCE SHEET EVENTS
After the end of the reporting period (1 May -
31 July 2014), no events occurred which are
expected to have a material impact on the
net worth, financial and earnings position of
GERRY WEBER International AG.
FORECAST REPORT
Forward-looking statements
The present forecast report of GERRY
WEBER International AG reflects
management’s expectations regarding the
future geopolitical, macroeconomic, sector-
specific and company-specific developments
which many influence the company’s
business activities. It is based on
management’s knowledge at the time of the
preparation of the report.
As a fashion and lifestyle company, GERRY
WEBER International AG is primarily
exposed to the spending mood of end
consumers in the individual sales regions as
well as to the footfall in city centres and
stores. Consumer spending is influenced, on
the one hand, by the economic situation and
private households' income trend and, on the
other hand, by factors such as the weather or
special events such as large sports events,
which may influence consumers’ spending
propensity. Geopolitical developments
outside the home market such as the current
crises in the Middle East and Ukraine may
also influence consumers’ purchasing
propensity. In spite of the growing regional
diversification, approx. 61.4% of the sales
revenues were generated in Germany in the
first nine months of 2013/14. Consumer
spending in Germany thus remains the most
important factor influencing the sales
revenues of GERRY WEBER International
AG.
Economic situation and industry
environment
Eurozone
In July, Germany’s Gesellschaft für
Konsumforschung (GfK) published its
consumer confidence figures for Europe,
which painted a moderately positive picture.
While British consumers believed in a
positive economic trend and expected the
economic recovery to continue, there was
great uncertainty among French consumers.
In Southern Europe, especially in Italy, there
was generally cautious optimism among
consumers, while consumers in Greece,
Spain and Portugal believed in a slow
notable upswing and a way out of the crisis.
The generally positive picture has probably
clouded over somewhat in the meantime.
The escalation of the situation in eastern
Ukraine and the increasing sanctions
together with the crises in Israel and Iraq are
causing growing uncertainty. Experts
meanwhile consider the 1% growth forecast
issued by the European Central Bank (ECB)
in June to be too optimistic and therefore
expect it to be downgraded. The weak euro
and growing deflationary tendencies are also
GERRY WEBER International AG Interim Report Q3 2013/14
18

fuelling fears of an extended period of
stagnation in the eurozone.
Russia
Accounting for approx. 3% to 4% of sales
revenues, Russia is an important export
country for the GERRY WEBER Group. On
the one hand trade sanctions are putting a
damper on the Russian economy and on the
other hand the weak rouble and rising food
prices are causing additional uncertainty
among our local customers. We are closely
monitoring the situation in Russia and have
looked at various scenarios for our planning.
At this stage, however, we do not expect to
see a strong influence on the sales revenues
of the GERRY WEBER Group as a whole,
even though sales in Russia may be dented
somewhat. Moreover, our consumers in
Russia have above-average incomes, which
makes them less dependent on economic
developments in their country.
Germany
The consumer climate in Germany no longer
remains unaffected by the geopolitical
fluctuations and, for the first time, no longer
defies the general trend in Europe. Besides
the crises in Ukraine, Israel and Iraq, it is
primarily the fear of a trade war with Russia,
in conjunction with additional sanctions,
which is influencing the Russian and German
economies. In particular, the manufacturing
sector is suffering from the sanctions.
Exports to Russia dropped by as much as
15.5% in the first half of 2014. This trend is
also reflected in the Ifo Business Climate
Index, which declined for the fourth
consecutive time.
This trend is also reflected in consumer
expectations. While economic expectations
reached a new high of 45.9 points in July -
the highest level since German reunification -
they slumped to 10.4 points in August.
According to the GfK, this is the strongest
decline since 1980. Income expectations
also fell from a high of 54.7 points in July to
50.1 points in August. Purchasing propensity
was the only component to stay at a high
level of 49.3 points. Overall, however, the
consumer climate index stayed at a relatively
high level. Consumer confidence stood at 8.9
points in August 2014, up from 7.0 points in
August 2013. The GfK projects a further
decline to 8.6 points for September.
Industry environment
After a mixed year-end, the start to the
calendar year 2014 was positive throughout,
according to TW-Testclub, a panel of
German trade magazine Textilwirtschaft.
April was the first month in which sales
revenues remained below retailers’
expectations. June and July were
disappointing as sales were down by -8%
and -7%, respectively, on the previous year.
Tropical temperatures and thunderstorms on
the one hand and the Soccer World Cup on
the other hand led to lower footfall in city
centres and stores and, hence, to declining
sales. Between January and July, sales
declined by a total of -1%. Reporting an
increase of 3.2% in like-for-like sales for the
first nine months of the current fiscal year,
GERRY WEBER International AG Interim Report Q3 2013/14
19
GERRY WEBER International AG performed
much better than the market as a whole. At
+7%, sales figures for August showed a very
positive trend, according to Textilwirtschaft,
which makes us optimistic for the fourth
quarter.
Strategic outlook
In the first nine months of the fiscal year
2013/14, we have shown that we are well on
track to reach the targets we have set
ourselves for 2013/14. Due to our unique
brand positioning, our operational strengths,
our customer structure and, most
importantly, the international growth
opportunities, the “GERRY WEBER growth
story” remains intact. We will therefore stick
to our strategies:
The strategic positioning of the GERRY
WEBER Group primarily focuses on the
further expansion, especially outside
Germany, and the ongoing vertical
integration of the business model but also on
the modernisation of our collections in line
with consumer requirements. Our operating
activities in the coming months will therefore
focus on:
Expansion of the Retail operations,
especially in European countries outside
Germany
Ongoing internationalisation of the
distribution structures and, in this context,
expansion of the global market presence
Increase of the international market
penetration of TAIFUN and SAMOON
Ongoing vertical integration through the
reinforcement of the Retail segment, the
concession store model and the maximum
order limit arrangements in the Wholesale
segment
Development and expansion of the multi-
channel approach through the start-up of
the company’s own logistic warehouse
Ongoing modernisation of the collections
We will continue to expand the Retail
segment by opening company-managed
Houses of GERRY WEBER but also other
vertical distribution structures such as
concession stores. The expansion will focus
on neighbouring European countries as well
as Scandinavia and Eastern Europe.
We also intend to grow our Wholesale
segment and will open further Houses of
GERRY WEBER and shop-in-shops together
with franchisees and distribution partners,
primarily outside the eurozone. The main
target regions are Russia, the Middle East
and the US.
Besides the ongoing expansion, vertical
integration is another key element of our
strategic positioning. We aim to exert greater
influence on what products our customers
specify for their stores and to get our
collections to the retail stores as quickly as
possible. We want to provide our Wholesale
partners with more support in optimising their
space management. We offer our distribution
partners to take advantage of our expertise
and our knowledge in the form of our
maximum order limit arrangements, under
GERRY WEBER International AG Interim Report Q3 2013/14
20
which the customer merely specifies an order
limit and our experts choose the products for
the customer’s respective store.
Having implemented our strategies with great
determination over the past years, we will
continue to push them forward in the coming
months in order to allow the GERRY WEBER
Group to continue growing.
Anticipated business performance
Looking back on the first nine months of the
financial year 2013/14 and based on the
assumption of a stable environment,
including positive weather conditions, we
project a positive trend for the company for
the fourth quarter of the financial year
2013/14 and the coming months. While the
economic environment in our German core
market seems to be weakening somewhat
temporarily, spending propensity among
German consumers remains at a high level.
This is not least confirmed by
Textilwirtschaft’s sales figures for August
2014. Should the situation in the current
hotspots deteriorate, however, economic
effects could have an adverse impact on our
customer’s spending propensity. Business
with our Wholesale partners in Russia could
also be adversely affected by further
sanctions.
General statement by the Managing Board
regarding the forecast
By introducing an additional collection
comprising 29 items (NY-Collection) and
launching our first TV commercial we have
laid the basis for achieving our objectives in
Q4 2014/14 - regardless of the general
market situation.
At the nine-month stage of the financial year
2013/14, we continue to believe that we will
reach the performance indicators announced
in January provided that the overall
framework conditions remains unchanged.
GERRY WEBER International AG Interim Report Q3 2013/14
21
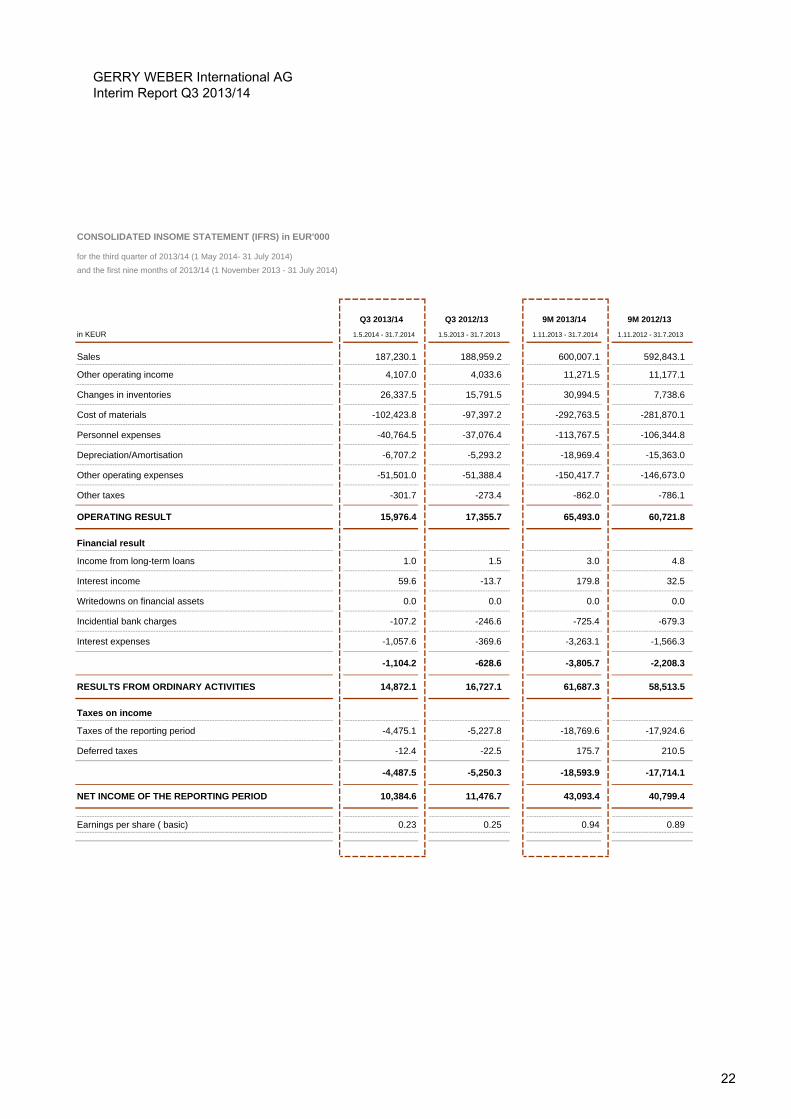
Q3 2013/14 Q3 2012/13 9M 2013/14 9M 2012/13
in KEUR 1.5.2014 - 31.7.2014 1.5.2013 - 31.7.2013 1.11.2013 - 31.7.2014 1.11.2012 - 31.7.2013
Sales 187,230.1 188,959.2 600,007.1 592,843.1
Other operating income 4,107.0 4,033.6 11,271.5 11,177.1
Changes in inventories 26,337.5 15,791.5 30,994.5 7,738.6
Cost of materials -102,423.8 -97,397.2 -292,763.5 -281,870.1
Personnel expenses -40,764.5 -37,076.4 -113,767.5 -106,344.8
Depreciation/Amortisation -6,707.2 -5,293.2 -18,969.4 -15,363.0
Other operating expenses -51,501.0 -51,388.4 -150,417.7 -146,673.0
Other taxes -301.7 -273.4 -862.0 -786.1
OPERATING RESULT 15,976.4 17,355.7 65,493.0 60,721.8
Financial result
Income from long-term loans 1.0 1.5 3.0 4.8
Interest income 59.6 -13.7 179.8 32.5
Writedowns on financial assets 0.0 0.0 0.0 0.0
Incidential bank charges -107.2 -246.6 -725.4 -679.3
Interest expenses -1,057.6 -369.6 -3,263.1 -1,566.3
-1,104.2 -628.6 -3,805.7 -2,208.3
RESULTS FROM ORDINARY ACTIVITIES 14,872.1 16,727.1 61,687.3 58,513.5
Taxes on income
Taxes of the reporting period -4,475.1 -5,227.8 -18,769.6 -17,924.6
Deferred taxes -12.4 -22.5 175.7 210.5
-4,487.5 -5,250.3 -18,593.9 -17,714.1
NET INCOME OF THE REPORTING PERIOD 10,384.6 11,476.7 43,093.4 40,799.4
Earnings per share ( basic) 0.23 0.25 0.94 0.89
for the third quarter of 2013/14 (1 May 2014- 31 July 2014)
CONSOLIDATED INSOME STATEMENT (IFRS) in EUR'000
and the first nine months of 2013/14 (1 November 2013 - 31 July 2014)
GERRY WEBER International AG Interim Report Q3 2013/14
22
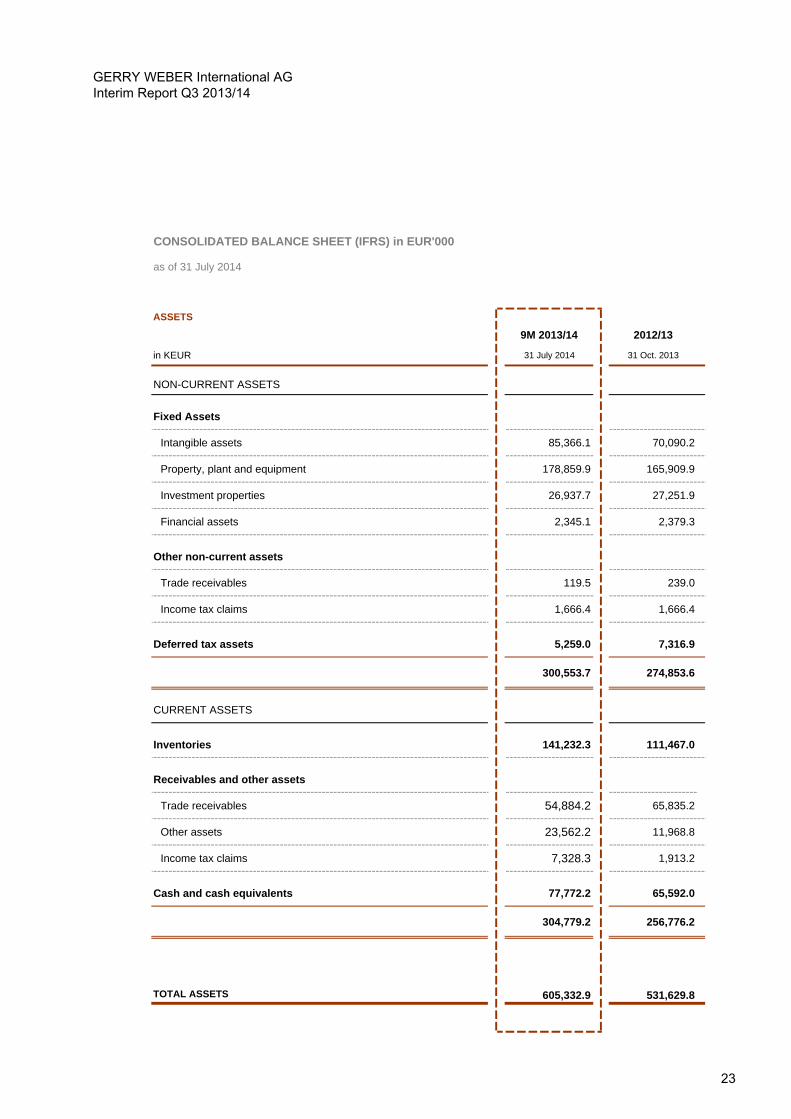
CONSOLIDATED BALANCE SHEET (IFRS) in EUR'000
ASSETS
9M 2013/14 2012/13
in KEUR 31 July 2014 31 Oct. 2013
NON-CURRENT ASSETS
Fixed Assets
Intangible assets 85,366.1 70,090.2
Property, plant and equipment 178,859.9 165,909.9
Investment properties 26,937.7 27,251.9
Financial assets 2,345.1 2,379.3
Other non-current assets
Trade receivables 119.5 239.0
Income tax claims 1,666.4 1,666.4
Deferred tax assets 5,259.0 7,316.9
300,553.7 274,853.6
CURRENT ASSETS
Inventories 141,232.3 111,467.0
Receivables and other assets
Trade receivables 54,884.2 65,835.2
Other assets 23,562.2 11,968.8
Income tax claims 7,328.3 1,913.2
Cash and cash equivalents 77,772.2 65,592.0
304,779.2 256,776.2
TOTAL ASSETS 605,332.9 531,629.8
as of 31 July 2014
GERRY WEBER International AG Interim Report Q3 2013/14
23

CONSOLIDATED BALANCE SHEET (IFRS) in EUR'000
EQUITY AND LIABILITIES
9M 2013/14 2012/13
in KEUR 31 July 2014 31 Oct. 2013
EQUITY
Share capital 45,906.0 45,906.0
Capital reserve 102,386.9 102,386.9
Retained earnings 195,341.7 195,341.7
Accumulated other comprehensive income/loss acc. to IAS 39 1,672.5 -4,223.9
Exchange differences -400.8 -225.5
Accumulated profits 65,245.4 56,581.5
410,151.7 395,766.7
NON-CURRENT LIABILITIES
Provisions for personnel 18.5 60.7
Other provisions 5,816.3 5,479.1
Financial liabilities 85,833.3 5,725.0
Other liabilities 24,324.0 24,836.7
Deferred tax liabilities 12,647.9 12,354.5
128,640.0 48,456.0
CURRENT LIABILITIES
Provisions
Tax liabilities 636.0 1,920.3
Provisions for personnel 11,706.5 13,150.0
Other provisions 8,331.3 8,273.4
LIABILITIES
Financial liabilities 5,636.1 6,008.2
Trade payables 28,629.8 30,330.8
Other liabilities 11,601.5 27,724.4
66,541.2 87,407.1
TOTAL EQUITY AND LIABILITIES 605,332.9 531,629.8
as of 31 July 2014
GERRY WEBER International AG Interim Report Q3 2013/14
24

9M 2013/14 Capital stock Capital Retained Accumulated Exchange Accumulated Equityreserves earnings other comp differences profits
in KEUR income / loss
As of 1 November 2013 45,906.0 102,386.9 195,341.7 -4,223.9 -225.6 56,581.5 395,766.6
Sale of own shares -34,429.4 -34,429.4
Allocation of retained earnings of the AG from the net income of the year
0.0
Adjustments of exchange differences -175.2 -175.2
Changes in equity acc. to IAS 39 5,896.4 5,896.4
Net income of the reporting period 43,093.3 43,093.3
As of 31 July 2013 45,906.0 102,386.9 195,341.7 1,672.5 -400.8 65,245.4 410,151.7
9M 2012/13 Capital stock Capital Retained Accumulated Exchange Accumulated Equityreserves earnings other comprehensdifferences profits
in KEUR income/loss
As of 1 November 2012 45,906.0 102,386.9 140,341.7 -212.5 -400.5 74,983.1 363,004.7
Sale of own shares -34,429.4 -34,429.4
Allocation of retained earnings of the AG from the net income of the year
20,000.0 -20,000.0 0.0
Adjustments of exchange differences -156.6 -156.6
Changes in equity acc. to IAS 39 303.1 303.1
Net income of the reporting period 40,799.4 40,799.4
As of 31 July 2013 45,906.0 102,386.9 160,341.7 90.6 -557.1 61,353.1 369,521.2
STATEMENT OF CHANGES IN GROUP EQUITY (IFRS) in EUR'000for the first nine months of 2013/14 (1 November 2013 - 31 July 2014)
GERRY WEBER International AG Interim Report Q3 2013/14
25
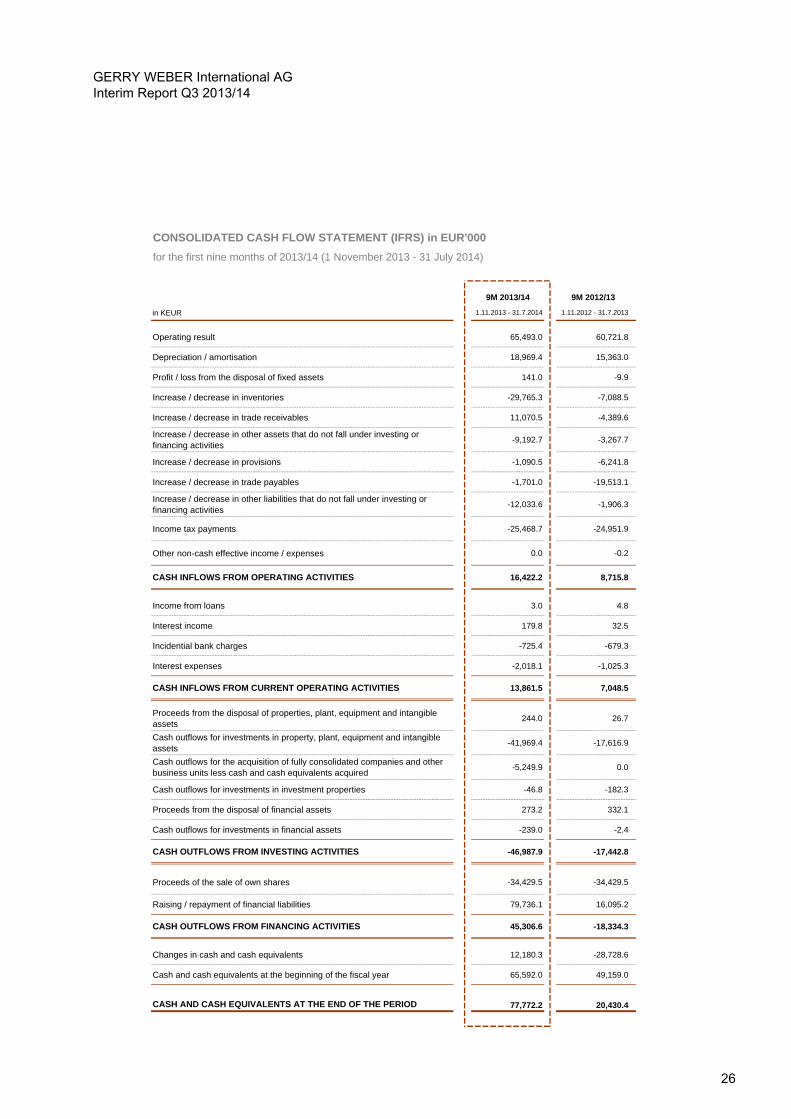
CONSOLIDATED CASH FLOW STATEMENT (IFRS) in EUR'000
9M 2013/14 9M 2012/13
in KEUR 1.11.2013 - 31.7.2014 1.11.2012 - 31.7.2013
Operating result 65,493.0 60,721.8
Depreciation / amortisation 18,969.4 15,363.0
Profit / loss from the disposal of fixed assets 141.0 -9.9
Increase / decrease in inventories -29,765.3 -7,088.5
Increase / decrease in trade receivables 11,070.5 -4,389.6
Increase / decrease in other assets that do not fall under investing or financing activities
-9,192.7 -3,267.7
Increase / decrease in provisions -1,090.5 -6,241.8
Increase / decrease in trade payables -1,701.0 -19,513.1
Increase / decrease in other liabilities that do not fall under investing or financing activities
-12,033.6 -1,906.3
Income tax payments -25,468.7 -24,951.9
Other non-cash effective income / expenses 0.0 -0.2
CASH INFLOWS FROM OPERATING ACTIVITIES 16,422.2 8,715.8
Income from loans 3.0 4.8
Interest income 179.8 32.5
Incidential bank charges -725.4 -679.3
Interest expenses -2,018.1 -1,025.3
CASH INFLOWS FROM CURRENT OPERATING ACTIVITIES 13,861.5 7,048.5
Proceeds from the disposal of properties, plant, equipment and intangible assets
244.0 26.7
Cash outflows for investments in property, plant, equipment and intangible assets
-41,969.4 -17,616.9
Cash outflows for the acquisition of fully consolidated companies and other business units less cash and cash equivalents acquired
-5,249.9 0.0
Cash outflows for investments in investment properties -46.8 -182.3
Proceeds from the disposal of financial assets 273.2 332.1
Cash outflows for investments in financial assets -239.0 -2.4
CASH OUTFLOWS FROM INVESTING ACTIVITIES -46,987.9 -17,442.8
Proceeds of the sale of own shares -34,429.5 -34,429.5
Raising / repayment of financial liabilities 79,736.1 16,095.2
CASH OUTFLOWS FROM FINANCING ACTIVITIES 45,306.6 -18,334.3
Changes in cash and cash equivalents 12,180.3 -28,728.6
Cash and cash equivalents at the beginning of the fiscal year 65,592.0 49,159.0
CASH AND CASH EQUIVALENTS AT THE END OF THE PERIOD 77,772.2 20,430.4
for the first nine months of 2013/14 (1 November 2013 - 31 July 2014)
GERRY WEBER International AG Interim Report Q3 2013/14
26

Explanatory notes on the interim consolidated financial statements of GERRY WEBER International AG for the
period ended 31 July 2014 (first nine months of the fiscal year 2013/14)
General information and accounting basis
GERRY WEBER International AG is a listed joint stock company headquartered in
Neulehenstraße 8, D – 33790 Halle (Westphalia/Germany).
The present abridged consolidated financial statements were prepared pursuant to section 37x
para. 3 WpHG in accordance with the International Financial Reporting Standards (IFRS) and
the related interpretations by the International Accounting Standards Board (IASB) for interim
financial reporting such as they have been adopted by the European Union. Accordingly, these
financial statements do not contain all information and notes that are required for year-end
consolidated financial statements pursuant to IFRS.
The interim consolidated financial statements for the third quarter 2013/14 (1 November 2013
– 31 July 2014) were prepared in accordance with IAS 34 “Interim Financial Reporting“ and
were not reviewed by the auditors. The accounting and valuation methods and the principles of
consolidation have basically remained unchanged compared to the latest consolidated
financial statements for the year ended 31 October 2013. The interim consolidated financial
statements for the third quarter and the first nine months of the fiscal year 2013/14 were
prepared in Euros.
The Managing Board is of the opinion that the present unaudited interim consolidated financial
statements contain all necessary information to give a true and fair view of the business
performance and the earnings position in the reporting period. The results achieved in the first
nine months of the financial year 2013/14 (1 November 2013 – 31 July 2014) do not
necessarily provide an indication as to the future results.
Pursuant to IAS 34 “Interim Financial Reporting“, the Managing Board must make
discretionary decisions, estimates and assumptions in the preparation of the interim
consolidated financial statements. These may influence the application of accounting
standards and the recognition of assets and liabilities as well as income and expenses. The
actual results may differ from these estimates in individual cases.
The present interim consolidated financial statements comprise the interim financial
statements of GERRY WEBER International AG and all its subsidiaries for the period ended
31 July 2014. The subsidiaries are fully consolidated. As of the reporting date, the basis of
consolidation comprises 37 subsidiaries. In five of its subsidiaries abroad GERRY WEBER
GERRY WEBER International AG Interim Report Q3 2013/14
27

International AG holds 51% interest stake; in the rest the company holds 100%. All
subsidiaries have been integrated into the consolidated financial statements in accordance
with the rules for full consolidation.
Currency translation
The functional currency of GERRY WEBER International AG is the euro. Foreign currency
transactions in the separate financial statements of GERRY WEBER International AG and its
subsidiaries are translated at the exchange rates prevailing at the time of the transaction. As of
the balance sheet date, monetary items in foreign currency are shown at the closing rate.
Exchange differences are recognised in profit or loss.
The interim financial statements of the consolidated Group companies prepared in foreign
currencies are translated according to the concept of the functional currency using the
modified closing rate procedure. Accordingly, assets and liabilities, with the exception of equity
capital, are translated at the closing rate, while income and expenses are translated at the
average annual exchange rate. Effects from the currency translation of the equity capital are
recognised in equity.
Intangible assets
Goodwill is recognised in accordance with IFRS 3 and tested for impairment on an annual
basis and whenever there are indications of impairment.
Purchased intangible assets are recognised at cost, taking ancillary costs and cost reductions
into account, and amortised using the straight-line method. Furthermore, the item includes
exclusive rights of supply to Houses of GERRY WEBER operated by third parties as well as
advantageous lease agreements resulting from acquired stores. The advantageous lease
agreements recognised as depreciable intangible assets are written down over the remaining
term of the leases using the straight-line method. In addition, customer relationships were
identified in the context of the takeover of 51% shares in three Belgian and two Dutch
companies, which have been recognized at the present value. The same applies for the
acquisition of 25 Norwegian stores, which have been fully consolidated in the consolidated financial
statement of GERRY WEBER International AG since 1 June 2014.
Due to the majority takeover in three Belgian companies in August 2013 and the acquisition of
two operating companies of the 25 Norwegian stores in June 2014, intangible assets
increased from EUR 70.1 million as of 31 October 2013 to EUR 85.4 Mio. at the end of the
reporting period Q3.
GERRY WEBER International AG Interim Report Q3 2013/14
28

Accumulated other comprehensive income / loss
The GERRY WEBER International AG Group holds derivative financial instruments only to
hedge currency risks arising from operations. According to IAS 39, all derivative financial
instruments must be recognised at their fair value. If the financial instruments used are
effective hedges in the context of a hedging relationship as defined in IAS 39 (cash flow
hedges), fluctuations in the fair value have no effect on profit or loss during the term of the
derivative. Fluctuations in the fair value are recognised in the respective equity item. The
effects of the remeasurement of financial instruments accounted after taxes. As at 31 July
2014 effects of the fluctuations in the fair value of financial instruments were recognised after
deferred taxes in the respectively equity item in an amount of EUR 1.7 million (31 October
2013: EUR -4.2 million).
Financial liabilities (non-current)
As at 31 July 2014 non-current financial liabilities increased in comparison to the end of fiscal
2012/13 from EUR 5.7 million to EUR 85.8 million. The increase is due to the issuance of a
EUR 75 million note loan in November 2013, which will be used, among other things, to
finance the planned logistic centre as well as general working capital requirements.
Oversubscribed several times, the note loan was issued at 100% of the nominal value and will
be repaid at the end of the respective term. Investors could choose between terms of three,
five and seven years as well as fixed and variable interest rates. The average fixed interest
rate is 2.3%. Across all tranches the interest rate in the first nine month of the fiscal year was
below 2 %.
Other liabilities (non-current)
GERRY WEBER International AG holds 51% of the shares in the Dutch GERRY WEBER
Retail B.V. and GERRY WEBER Incompany B.V. as well as in the Belgian ARW Retail –
GERRY WEBER NV, Coast Retail – GERRY WEBER NV and ARW – GERRY WEBER Belux
BVBA. The acquired companies sell textiles at retail level and operated retail stores as well as
concession shops in the Netherlands and Belgium. For the remaining 49% shares in the
named companies, Gerry Weber International AG has a call option, while the seller has a put
option. Pursuant to IAS 32, these obligations must be recognised at fair value. Liabilities from
minority options were recognised under other non-current liabilities and amounted to EUR 24.3
million on 31 July 2014 (31 October 2013: EUR 24.8 million).
GERRY WEBER International AG Interim Report Q3 2013/14
29

Earnings per share
Earnings per share are determined on the basis of the net income for the period after taxes
that is attributable to the shareholders of GERRY WEBER International AG and the average
number of shares outstanding in the reporting period.
The average number of shares outstanding is determined on a pro-rata temporis basis as
shown below.
Accordingly, earnings per share of Q3 2013/14 (1.02.2013 – 31.07.2014) amounted to EUR
0.23 (Q3 previous year: EUR 0.25). Thus earnings per share amount to EUR 0.94 for the first
nine months of the fiscal year 2013/14. (9M 2012/13: EUR 0.89).
Segment reporting
GERRY WEBER International AG distinguishes in two main segments: “Production and
Wholesale“ and “Retail“ as well as in “other segments”. The Wholesale segment comprises all
distribution structures with external customers; these include the franchised Houses of GERRY
WEBER worldwide, the shop-in-shops in our retail partners’ stores as well as the multi-label
business. The ”Production and Wholesale“ segment also comprises all development and
production processes for our merchandise, including transport and logistics. The “Retail“
segment is almost exclusively a distribution segment and includes all company-managed
Houses of GERRY WEBER, monolabel stores, concession shops, outlet stores as well as the
individual national online shops. Other segments comprises in particular earnings and
expenses as well as assets and liabilities of our investment property „Hall 30”. Income and
9M 2013/14 9M 2012/13
1.11.2013-31.7.2014 1.11.2012-31.7.2013
November 2013 45,905,960 x 1/12 45,905,960 x 1/12
December 2013 45,905,960 x 1/12 45,905,960 x 1/12
January 2014 45,905,960 x 1/12 45,905,960 x 1/12
February 2014 45,905,960 x 1/12 45,905,960 x 1/12
March 2014 45,905,960 x 1/12 45,905,960 x 1/12
April 2014 45,905,960 x 1/12 45,905,960 x 1/12
May 2014 45,905,960 x 1/12 45,905,960 x 1/12
June 2014 45,905,960 x 1/12 45,905,960 x 1/12
July 2014 45,905,960 x 1/12 45,905,960 x 1/12
= 45,905,960 units = 45,905,960 units
GERRY WEBER International AG Interim Report Q3 2013/14
30

expenses as well as assets and liabilities of the holding company are assigned to the
segments as incurred.
3rd Quarter 2013/14 Production and Retail Other Consolidated Totalwholesale segments entries
in KEUR
Sales by segment 82.297,9 104.932,2 0,0 0,0 187.230,1
EBT (Earnings Before Tax) 7.557,4 5.244,3 446,0 1.624,4 14.872,1
Depreciation of property, plant and equipment 2.474,9 4.084,8 147,5 0,0 6.707,2
Interest income 113,7 8,1 0,0 -62,3 59,5
Interest expenses 444,8 681,6 0,0 -68,8 1.057,6
Assets 397.845,7 300.316,4 29.795,7 -122.624,9 605.332,9
Liabilities 73.158,7 245.804,4 0,0 -123.781,9 195.181,2
Investments in non-current assets 12.140,3 19.633,3 14,6 0,0 31.788,2
Number of employees (31 July 2014) 1.281 3.675 1 0 4.957
3rd Quarter 2012/13 Production and Retail Other Consolidated Totalwholesale segments entries
in KEUR
Sales by segment 95.817,8 93.141,4 0,0 0,0 188.959,2
EBT (Earnings Before Tax) 17.668,6 448,2 404,6 -1.794,3 16.727,1
Depreciation of property, plant and equipment 2.550,0 3.052,1 153,7 -462,7 5.293,1
Interest income 167,2 14,6 0,0 -195,5 -13,7
Interest expenses 220,7 108,3 0,0 40,6 369,6
Assets 346.235,3 220.903,4 30.234,0 -119.764,0 477.608,7
Liabilities 53.736,4 169.748,1 0,0 -115.396,9 108.087,6
Investments in non-current assets 1.649,5 1.653,1 97,2 0,0 3.399,8
Number of employees (31 July 2013) 1.370 3.352 1 0 4.723
GERRY WEBER International AG Interim Report Q3 2013/14
31

A detailed segment report is stated in the management report of this interim report.
9M 2013/14 Production and Retail Other Consolidated Totalwholesale segments entries
in KEUR
Sales by segment 306.432,5 293.574,6 0,0 0,0 600.007,1
EBT (Earnings Before Tax) 39.052,4 19.137,5 1.363,9 2.133,5 61.687,3
Depreciation of property, plant and equipment 7.249,6 11.276,2 443,6 0,0 18.969,4
Interest income 344,9 61,8 0,0 -226,9 179,8
Interest expenses 1.644,7 1.840,7 0,0 -222,2 3.263,2
Assets 397.845,7 300.316,4 29.795,7 -122.624,9 605.332,9
Liabilities 73.158,7 245.804,4 0,0 -123.781,9 195.181,2
Investments in non-current assets 18.669,8 28.794,1 46,8 0,0 47.510,7
Number of employees (31 July 2014) 1.281 3.675 1 0 4.957
9M 2012/13 Ladiesware Ladiesware Other Consolidated Totalproduction and Retail segments entries
in KEUR wholesale
Sales by segment 333.144,1 259.699,0 0,0 0,0 592.843,1
EBT (Earnings Before Tax) 51.110,5 4.981,2 1.202,8 1.219,0 58.513,5
Depreciation of property, plant and equipment 7.186,5 7.900,7 438,7 -163,0 15.362,9
Interest income 328,1 14,6 0,0 -310,1 32,6
Interest expenses 1.115,6 657,5 0,0 -206,7 1.566,4
Assets 346.235,3 220.903,4 30.234,0 -119.764,0 477.608,7
Liabilities 53.736,3 169.748,1 0,0 -115.396,9 108.087,5
Investments in non-current assets 6.355,1 10.888,4 558,4 0,0 17.801,9
Number of employees (31 July 2013) 1.370 3.352 1 0 4.723
GERRY WEBER International AG Interim Report Q3 2013/14
32

Financial Calendar
Investor Relations Contact:
GERRY WEBER International AG
Neulehenstraße 8
33790 Halle / Westphalia
www.gerryweber.com
Claudia Kellert Anne Hengelage
Head of Investor Relations Manager Investor Relations
phone: +49 (0) 5201 185 0 phone: +49 (0) 5201 185 0
email: [email protected] email: [email protected]
Disclaimer
This interim report contains forward-looking statements that are based on assumptions and/or
estimates by the management of GERRY WEBER International AG. While it is assumed that
these forward-looking statements are realistic, no guarantee can be given that these
expectations will actually materialise. Rounding differences may occur in the percentages and
figures stated in this report
Publication of the Nine Month Report 2013/14 12 September 2014
Merrill Lynch Global Consumer Conference, London 18 September 2014
Baader Investment Conference, Munich 24 September 2014
Roadshow Zurich, Lugano 29/30 September 2014
MM Warburg London Conference 19 November 2014
End of the fiscal year 2013/14 31 October 2014
GERRY WEBER International AG Interim Report Q3 2013/14
33