overview of the contaminant candidate list and the
TRANSCRIPT

Overview of the Contaminant Candidate List and the Unregulated Contaminant
Monitoring Rule
1
Steven C. Wendelken, Ph.D.
Office of Groundwater and Drinking Water
Standards and Risk
Management Division
Technical Support Center

How Are Drinking Water Standards Developed?
• 1996 SDWA amendments changed the process of developing and reviewing NPDWS – Contaminant Candidate List (CCL) – Unregulated Contaminant Monitoring Rule (UCMR) – Regulatory Determination – Six-Year Review
2

Contaminant Candidate List (CCL)
• SDWA requires EPA to list unregulated contaminants that may require a national drinking water regulation in the future
• Every five years CCL defines unregulated contaminants for which EPA needs – Occurrence data – Analytical methods – Potential health effects – Evaluation of treatment techniques
3

UCMR Objective
• Collect occurrence data for suspected drinking water contaminants that do not have health-based standards set under SDWA
• Occurrence information is used to support future regulatory decision-making – Supports the Administrator’s determination of
whether (or not) to regulate a contaminant under the drinking water program
4

Three Regulatory Determination Criteria SDWA requires EPA to consider the following criteria in
evaluating whether to regulate a contaminant: 1) The contaminant may have an adverse effect on the
health of persons;
2) The contaminant is known to occur or there is substantial likelihood that the contaminant will occur in public water systems with a frequency and at levels of public health concern; and
3) In the sole judgment of the Administrator, regulation of such contaminant presents a meaningful opportunity for health risk reduction for persons served by public water systems
*SDWA Section 1412(b)(1)
5

Status and Next Steps for Regulatory Determinations 3 (RD 3)
• Published Third Contaminant Candidate List (CCL 3) in Oct 2009, which listed 116 contaminants:
– 12 microbes (e.g., viruses, bacteria) – 104 chemicals (pesticides, industrial chemicals, pharmaceuticals, inorganics)
• Evaluating the health and occurrence information to identify which CCL 3
contaminants have sufficient information to make to the preliminary regulatory determinations
• Expect to publish preliminary RD 3 for public comment in 2013
• After considering public comments, expect to publish final RD3 in 2014
6

Six Year Review 3 • 1996 SDWA Amendments require EPA to review and, if
appropriate, revise existing National Primary Drinking Water Regulations (NPDWRs) every six years – In 2003, EPA completed the 1st Six Year Review of 69 NPDWRs; made
decision to revise TCR – In 2010, EPA completed the 2nd Six Year Review of 71 NPDWRs and made
decisions to revise tetrachloroethylene (PCE), trichloroethylene (TCE), acrylamide and epichlorohydrin
• Occurrence analysis is a key component in the Six Year Review process
• Expect to complete Six Year Review 3 by 2016
7

General Flow of SDWA Regulatory Processes Draft CCL
Final CCL
Final Rule (NPDWR)
Six Year Review of Existing NPDWRs
No further action if make decision to not to regulate (may develop health advisory).
Preliminary Regulatory
Determinations
Final Regulatory Determinations
Proposed Rule (NPDWR)
Public review and comment
Draft UCMR
Final UCMR
UCMR Monitoring Results
At each stage, need increased specificity and confidence in the type of supporting data used (e.g. health, occurrence, treatment).
8

Generation of CCL 3
• EPA considered approximately 7,500 potential chemical and microbial contaminants
• Screening process based on a contaminant’s potential to occur in public water systems (PWSs) and the potential for public health concerns
• Further detailed evaluations, public input, and expert judgment and review are the final contaminant selection tools
• Final CCL 3 published September 2009 – 104 chemicals or chemical groups and 12 microbiological
contaminants
9

Unregulated CCL 3 Contaminants 104 Chemicals and 12 Microbes
1,1,1,2-Tetrachloroethane 1,1-Dichloroethane 1,2,3-Trichloropropane 1,3-Butadiene 1,3-Dinitrobenzene 1,4-Dioxane 17 alpha-Estradiol 1-Butanol 2-Methoxyethanol 2-Propen-1-ol 3-Hydroxycarbofuran (degradate) 4,4'-Methylenedianiline Acephate Acetaldehyde Acetamide Acetochlor Acetochlor ethanesulfonic acid (ESA) Acetochlor oxanilic acid (OA) Acrolein Alachlor ethanesulfonic acid (ESA) Alachlor oxanilic acid (OA) alpha-Hexachlorocyclohexane (former) Aniline Bensulide Benzyl chloride Butylated hydroxyanisole Captan Chlorate (also D-DBP) Chloromethane (Methyl chloride) Clethodim Cobalt Cumene hydroperoxide
Cyanotoxins (3) Dicrotophos Dimethipin Dimethoate Disulfoton Diuron Equilenin Equilin Erythromycin Estradiol (17-beta) Estriol Estrone Ethinyl Estradiol (17-alpha) Ethoprop Ethylene glycol Ethylene oxide Ethylene thiourea Fenamiphos Formaldehyde (formerly) Germanium Halon 1011 (Bromochloromethane) HCFC-22 Hexane Hydrazine Mestranol Methamidophos Methyl bromide (Bromomethane) Methyl tert-butyl ether Metolachlor Metolachlor ethanesulfonic acid (ESA) Metolachlor oxanilic acid (OA) Molinate
Molybdenum Nitrobenzene Nitroglycerin N-Methyl-2-pyrrolidone N-Nitrosodiethylamine (NDEA) N-nitrosodimethylamine (NDMA) N-Nitroso-di-n-propylamine (NDPA) N-Nitrosodiphenylamine N-nitrosopyrrolidine (NPYR) Norethindrone (19-Norethisterone) n-Propylbenzene o-Toluidine Oxirane, methyl- Oxydemeton-methyl Oxyfluorfen Perchlorate Perfluorooctane sulfonic acid (PFOS) Perfluorooctanoic acid (PFOA) Permethrin Profenofos Quinoline RDX sec-Butylbenzene Strontium Tebuconazole Tebufenozide Tellurium Terbufos Terbufos sulfone Thiodicarb Thiophanate-methyl Toluene diisocyanate Tribufos
Triethylamine Triphenyltin hydroxide (TPTH) Urethane Vanadium Vinclozolin Ziram Adenovirus Caliciviruses Campylobacter jejuni Enterovirus Escherichia coli (0157) Helicobacter pylori Hepatitis A virus Legionella pneumophila Mycobacterium avium Naegleria fowleri Salmonella enterica Shigella sonnei
10

UCMR 3
• Final rule published May 2, 2012 • http://water.epa.gov/lawsregs/rulesregs/sdwa/ucmr/u
cmr3/index.cfm • Monitoring will occur from 2013-15 • 28 chemicals and 2 viruses • Contaminants include hormones, perfluorinated
compounds (e.g., PFOS/PFOA), VOCs, metals (including Cr-6 and total Cr), 1,4-dioxane, chlorate and pathogens
11

UCMR 3 – Monitoring Required
• Assessment monitoring (List 1) – All systems serving >10,000 people – 800 representative systems serving <10,000 people
• Screening Survey (List 2) – All systems serving >100,000 people – 320 representative systems serving 10,001 to 100,000
people – 480 representative systems serving <10,000 people
12

UCMR 3 – Monitoring Required (cont.)
• Pre-Screen Testing (List 3) – Selected 800 systems serving <1000 people that do not
disinfect. Systems with wells that are located in areas of karst or fractured bedrock
• EPA pays for analysis of all samples from systems serving <10,000 and arranges for collection of List 3 samples
13

UCMR 3 – Contaminants: Assessment Monitoring (“List 1”)
• Perfluorinated Chemicals (EPA Method 537) – perfluorooctanonic acid (PFOA) – perfluorooctane sulfonic acid (PFOS) – perfluoroheptanoic acid (PFHpA) – perfluorononanoic acid (PFNA) – perfluorobutane sulfonic acid (PFBS) – perfluorohexane sulfonic acid (PFHxS)
• Metals (EPA Method 200.8) – cobalt – molybdenum – strontium – vanadium – (total) chromium
•EPA Method 218.7 -hexavalent chromium
• Volatile Organic Compounds (EPA
Method 524.3) - 1,1-dichloroethane - 1,2,3-trichloropropane - 1,3-butadiene - bromochloromethane - chlorodifluoromethane - chloromethane - methyl bromide
• EPA Method 522
-1,4-dioxane • EPA Method 300.1
-chlorate
14

UCMR 3 – Contaminants: Screening Survey (“List 2”) and
Pre-Screen Testing (“List 3”)
Hormones (EPA Method 539) – List 2 -17-α-ethynylestradiol ------
17-β-estradiol equilin estriol estrone testosterone 4-androstene-3,17-dion
15
Viruses – List 3 – enterovirus (qPCR & cell
culture) – norovirus (qPCR) – “Indicator organisms”
• Total coliform • E. coli • enterococci • coliphage • aerobic spores

Unregulated CCL 3 Contaminants 104 Chemicals and 12 Microbes
1,1,1,2-Tetrachloroethane 1,1-Dichloroethane 1,2,3-Trichloropropane 1,3-Butadiene 1,3-Dinitrobenzene 1,4-Dioxane 17 alpha-Estradiol 1-Butanol 2-Methoxyethanol 2-Propen-1-ol 3-Hydroxycarbofuran (degradate) 4,4'-Methylenedianiline Acephate Acetaldehyde Acetamide Acetochlor Acetochlor ethanesulfonic acid (ESA) Acetochlor oxanilic acid (OA) Acrolein Alachlor ethanesulfonic acid (ESA) Alachlor oxanilic acid (OA) alpha-Hexachlorocyclohexane (former) Aniline Bensulide Benzyl chloride Butylated hydroxyanisole Captan Chlorate (also D-DBP) Chloromethane (Methyl chloride) Clethodim Cobalt Cumene hydroperoxide
Cyanotoxins (3) Dicrotophos Dimethipin Dimethoate Disulfoton Diuron Equilenin Equilin Erythromycin Estradiol (17-beta) Estriol Estrone Ethinyl Estradiol (17-alpha) Ethoprop Ethylene glycol Ethylene oxide Ethylene thiourea Fenamiphos Formaldehyde (formerly) Germanium Halon 1011 (Bromochloromethane) HCFC-22 Hexane Hydrazine Mestranol Methamidophos Methyl bromide (Bromomethane) Methyl tert-butyl ether Metolachlor Metolachlor ethanesulfonic acid (ESA) Metolachlor oxanilic acid (OA) Molinate
Molybdenum Nitrobenzene Nitroglycerin N-Methyl-2-pyrrolidone N-Nitrosodiethylamine (NDEA) N-nitrosodimethylamine (NDMA) N-Nitroso-di-n-propylamine (NDPA) N-Nitrosodiphenylamine N-nitrosopyrrolidine (NPYR) Norethindrone (19-Norethisterone) n-Propylbenzene o-Toluidine Oxirane, methyl Oxydemeton-methyl Oxyfluorfen Perchlorate Perfluorooctane sulfonic acid (PFOS) Perfluorooctanoic acid (PFOA) Permethrin Profenofos Quinoline RDX sec-Butylbenzene Strontium Tebuconazole Tebufenozide Tellurium Terbufos Terbufos sulfone Thiodicarb Thiophanate-methyl Toluene diisocyanate Tribufos
Triethylamine Triphenyltin hydroxide (TPTH) Urethane Vanadium Vinclozolin Ziram Adenovirus Caliciviruses Campylobacter jejuni Enterovirus Escherichia coli (0157) Helicobacter pylori Hepatitis A virus Legionella pneumophila Mycobacterium avium Naegleria fowleri Salmonella enterica Shigella sonnei Red = No EPA Method Blue = Current Method
Development
16

Contaminant Candidate List 4 (CCL 4)
• Spring 2012 - Published FR notice requesting nominations of contaminants to be considered for inclusion on CCL 4
• Summary of Nominations: • 59 unique contaminants were nominated by 10 organizations and
individuals • 5 microbes and 54 chemicals • 8 contaminants were nominated more than once
• EPA is currently evaluating the new data provided for nominated chemicals and microbes, to determine the appropriateness of inclusion on the CCL 4 • The nomination letters and web site submittals can be found in the CCL 4
docket (EPA-HQ-OW-2012-0217) at www.regulations.gov
17

Current Status
18
• 2013 - Expect to publish Draft CCL 4 for public review and comment
• 2014 - Expect to publish Final CCL 4

Method Development Challenges
• Lack of suitable standards, internal standards and surrogate compounds
• Compounds with extremely high water solubility • Low detection limits are often required • Timeframe imposed by continual CCL/UCMR cycle • Lack of previous method development work
19

Office of Research and Development National Exposure Research Laboratory
Development of LC/MS/MS Methods for the Analysis of Chemicals on
U.S. EPA’s Contaminant Candidate List
Jody A. Shoemaker and Daniel R. Tettenhorst
Disclaimer: Mention of trade names or commercial products does not constitute endorsement or recommendation for use.
CCL/UCMR Methods Webinar -2013

Office of Research and Development National Exposure Research Laboratory
NO
YES Does Method Meet DQOs?
70-130% recovery with <30% RSD
Revise Technical Approach
Write Method
Use in Future UCMR
Optimize Instrumentation (chromatography, mass calibrate, tune, evaluate instrument stability)
Determine Preservatives (select antimicrobial & dechlor)
Determine Best Calibration (linear/quadratic, internal standards)
Determine Interferences (Are DQOs met in various difficult matrices?)
Determine Aqueous & Extract Holding Times
Optimize SPE (select sorbent, surrogates, solvents, solvent volumes, sample volume, evaporation parameters)
Multi-Lab Verification
Method Development Process

Office of Research and Development National Exposure Research Laboratory
ORD/NERL LC/MS/MS Methods
LC/MS/MS Drinking Water Methods
Method 535 – 12 acetanilide degradates (6 CCL)-UCMR 2 Method 537 – 14 perfluorinated alkyl acids (2 CCL)-UCMR 3
Method 538 – 11 chemicals (4 CCL)
LC/MS/MS Methods Under Development
Method 540 – 12 pesticides (5 CCL) Method 543 – 8 pesticides (6 CCL) Method 544 – 8 cyanotoxins (1 CCL)
http://www.epa.gov/nerlcwww/ordmeth.htm

Office of Research and Development National Exposure Research Laboratory
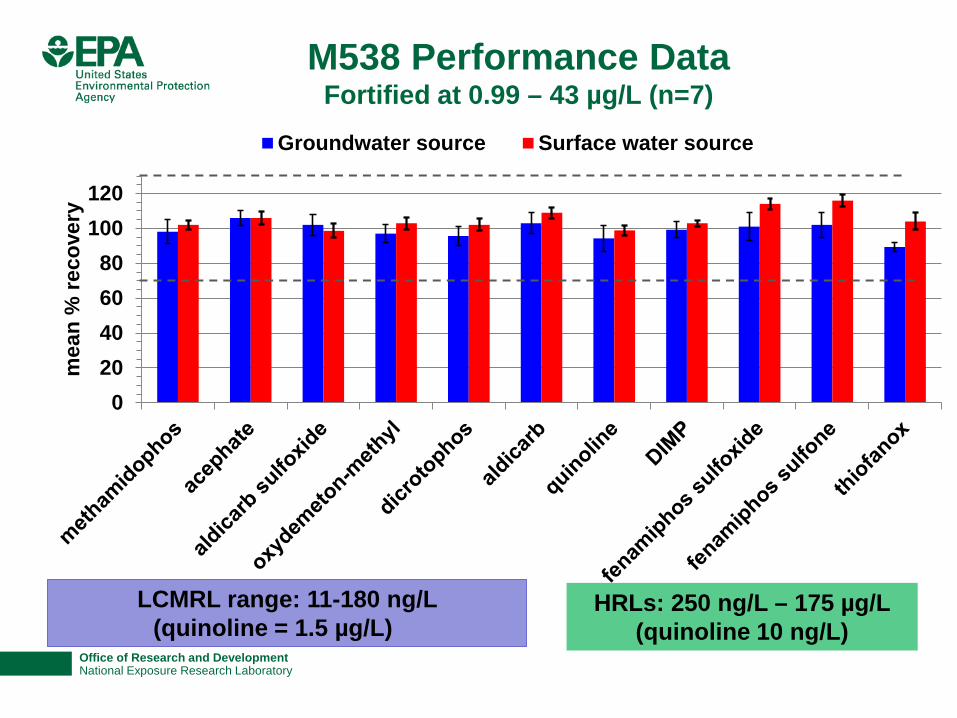
Method 538: DAI-LC/MS/MS Contains 11 Analytes
Method Analytes acephate aldicarb dicrotophos aldicarb sulfone methamidophos diisopropyl methylphosphonate (DIMP) oxydemeton-methyl fenamiphos sulfone quinoline fenamiphos sulfoxide
thiofanox
Analytes in red are on CCL 3
Most method analytes are pesticides (except for quinoline and DIMP) with the potential to contaminate drinking water sources
Quinoline is an industrial starting material, a pharmaceutical (anti-
malarial) and a flavoring agent
DIMP is a chemical by-product in the production of sarin gas

Office of Research and Development National Exposure Research Laboratory
M538 Direct Aqueous Injection Approach
Selected Reaction Monitoring
Detector Source LC Pos ESI 50 µL
injection
40 mL sample
10 µL IS PDS acephate, d6 quinoline, d7 methamidophos, d6 DIMP, d14 oxydemeton-methyl, d6
Antimicrobial: 64 mg/L sodium omadine
Remove free chlorine: 20 mM ammonium acetate
990 µL aliquot
Office of Research and Development National Exposure Research Laboratory
M538 Performance Data Fortified at 0.99 – 43 µg/L (n=7)
020406080
100120
mea
n %
rec
over
y
Groundwater source Surface water source
LCMRL range: 11-180 ng/L (quinoline = 1.5 µg/L)
HRLs: 250 ng/L – 175 µg/L (quinoline 10 ng/L)

Office of Research and Development National Exposure Research Laboratory
Method 540: SPE-LC/MS/MS Contains 12 Analytes
Method Analytes on CCL 3
3-hydroxycarbofuran fenamiphos sulfone fenamiphos fenamiphos sulfoxide bensulide methomyl tebuconazole chlorpryifos oxon tebufenozide phorate sulfone disulfoton sulfoxide phorate sulfoxide
Analytes in red are on CCL 3
all method analytes are pesticides or pesticide degradates with the potential to contaminate drinking water sources

Office of Research and Development National Exposure Research Laboratory
Method 540 Analytical Procedure
inject
Elute with 5 mL MeOH
150 mg Water Oasis HLB J.T. Baker Speedisk H2O-Philic DVB
N2 blowdown + IS
DetSource C
LC/MS/MS - Selected Reaction Monitoring
Argon
ector L+ ESI
Rinse cartridge with 5 mL reagent water after loading
Surrogates & preservatives
Surrogates methomyl-13C2,15N tebuconazole-d6 Preservatives 2-chloracetamide ascorbic acid Trizma
250 mL sample
Condition with 5 mL MeOH & 10 mL reagent water
Internal Standards carbofuran-13C6 bensulide-d14 phorate-d10

Office of Research and Development National Exposure Research Laboratory
020406080
100120
mea
n %
reco
very
Groundwater source
M540 Performance Data Fortified at 12.8 – 32 ng/L (n=4)
Surface water source
LCMRL range: 0.64 – 2.0 ng/L HRLs: 420 ng/L – 210 µg/L

Office of Research and Development National Exposure Research Laboratory
Method 543: On-line SPE-LC/MS/MS Contains 8 Analytes
Method Analytes on CCL 3 3-hydroxycarbofuran fenamiphos sulfone fenamiphos fenamiphos sulfoxide bensulide quinoline tebuconazole tebufenozide
Analytes in red are on CCL 3
all method analytes are pesticides or pesticide degradates (except quinoline) with the potential to contaminate drinking water sources
concentration, elution, separation all done by automation
1-5 mL sample volume typical analysis time/sample is <20 min high throughput

Office of Research and Development National Exposure Research Laboratory
SPE injection port 2.5 mL injections
UPLC injection port 1-10 µL range
SPE 5-mL sample loop
Analytical sample loop 10 µL
SPE cartridge 1 Oasis HLB
SPE cartridge 2 Oasis HLB
LC/MS/MS - Selected Reaction Monitoring
Argon
Detector Source UPLC Pos ESI
20 mL sample vial
Internal Standards quinoline-d7 carbofuran-13C6 tebuconazole-d6 bensulide-d14
IS(s) & preservatives:
potassium citrate ascorbic acid
Method 543 Preliminary Procedure

Office of Research and Development National Exposure Research Laboratory
Method 543: On-line SPE Events
0 Time
2 4 6 8 10 12
Start
Loading
3 min/5mL
SPE wash
5 min gradient elution Re-equilibration
SPE Cartridge #1
0 Time
2 4 6 8 10 12
Start Re-equilibration
SPE Cartridge #2
Re-condition
2% NH4OH 2% FA
0.5% FA ACN + 0.5% FA
ACN + 0.5% FA 2% FA
Quat Pump Quat Pump
Quat Pump Quat Pump
Binary Pump Binary Pump

Office of Research and Development National Exposure Research Laboratory
On-line SPE-LC/MS/MS Preliminary Performance Data Fortified at 4 – 10 ng/L (n=3)
0
20
40
60
80
100
120
mea
n %
rec
over
y
Surface water source 3 mg/L Ohio River NOM
LCMRL range: TBD HRLs: 10 ng/L – 210 µg/L

Office of Research and Development National Exposure Research Laboratory
Method 544: SPE-LC/MS/MS
Potentially 8 Cyanotoxins
Method Analytes MC-LR MC -RR MC-YR MC-LA MC-LW MC -LF MC-LY Nodularin
widespread occurrence of blooms
potential for occurrence in finished drinking water toxic – HRL is 21 ng/L for MC-LR unique problems in development of robust analytical methods – availability of multiple sources of high purity standards, lack of isotopically labeled IS and SUR, matrix interferences
Analytes in red are on CCL 3

Office of Research and Development National Exposure Research Laboratory
Preliminary Method 544 Analytical Procedure
inject
Elute with 10 mL MeOH
Water Oasis HLB others?
N2 blowdown + IS
LC/MS/MS - Selected Reaction Monitoring
Argon
Detector Source LC + ESI
Rinse cartridge with 15 mL reagent water after loading
Surrogates & preservatives
Surrogates TBD e.g., leucine-enkephalin cyclo-RADFV
Preservatives 2-chloracetamide ascorbic acid Trizma
250-500 mL sample
Condition with MeOH & reagent water
Internal Standards TBD Current : Me-MC-LR, CD3
Lysing of the cyanobacterial cells in the sample will be investigated

Office of Research and Development National Exposure Research Laboratory
Method 544 Preliminary Performance Data Fortified at 200 – 400 ng/L
except MC-LA at 1000 ng/L (n=3)
0000
0204068
1012
mea
n %
rec
over
y
Groundwater source Surface water source(External Cal) (Internal Cal)
LCMRL range: TBD HRL MC-LR: 21 ng/L

Office of Research and Development National Exposure Research Laboratory
Summary of ORD/NERL LC/MS/MS Methods
2 LC/MS/MS methods completed and ready for potential use in UCMR 4 – total of 9 CCL 3 chemicals • Method 538 • Method 540
2 methods under development for potential
use in UCMR 4 – one additional CCL 3 analyte • Method 543 (optional method for Method 540 analytes) • Method 544 (MC-LR)
Office of Research and Development National Exposure Research Laboratory
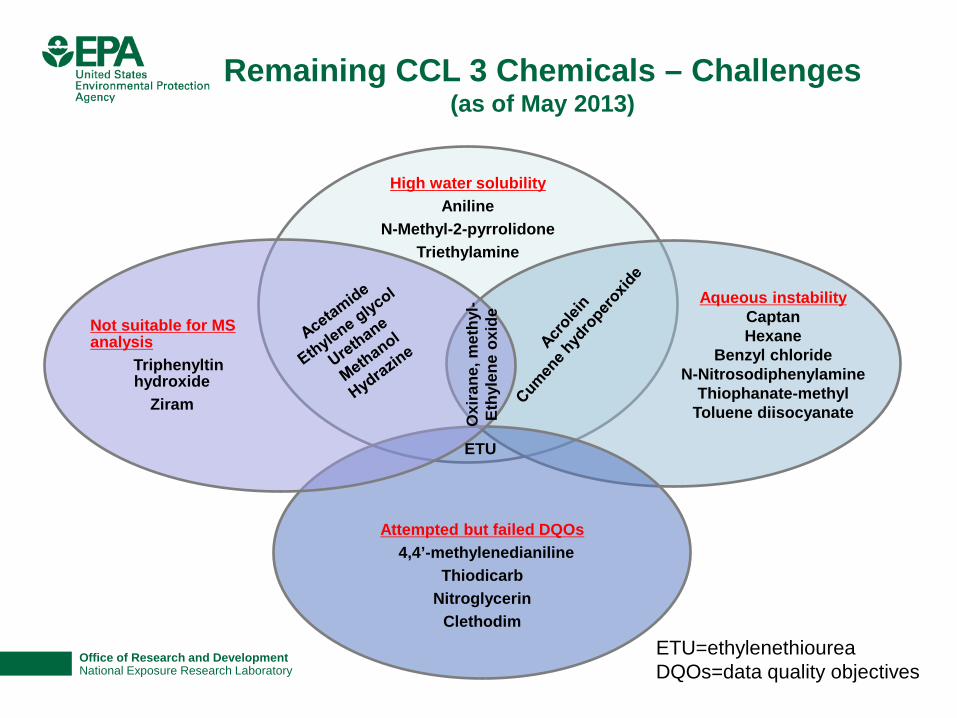
High water solubility Aniline
N-Methyl-2-pyrrolidone Triethylamine
Attempted but failed DQOs 4,4’-methylenedianiline
Thiodicarb Nitroglycerin
Clethodim
Not suitable for MS analysis
Triphenyltin hydroxide
Ziram ETU
ETU=ethylenethiourea DQOs=data quality objectives
Aqueous instability Captan Hexane
Benzyl chloride N-Nitrosodiphenylamine
Thiophanate-methyl Toluene diisocyanate O
xira
ne, m
ethy
l- Et
hyle
ne o
xide
Remaining CCL 3 Chemicals – Challenges (as of May 2013)
Office of Research and Development National Exposure Research Laboratory, 26 W. Martin Luther King Dr., Cincinnati, OH 45268
Photo image area measures 2” H x 6.93” W and can be masked by a collage strip of one, two or three images.
The photo image area is located 3.19” from left and 3.81” from top of page.
Each image used in collage should be reduced or cropped to a maximum of 2” high, stroked with a 1.5 pt white frame and positioned edge-to-edge with accompanying images.
Disclaimer: Although this work was reviewed by EPA and approved for publication, it may not necessarily reflect official agency policy. Mention of trade names or commercial products does not constitute endorsement or recommendation for use.
Drinking Water Methods Development by Gas Chromatography-Mass Spectrometry (GC-MS) Paul E. Grimmett

Office of Research and Development National Exposure Research Laboratory, 26 W. Martin Luther King Dr., Cincinnati, OH 45268 1
Background • The Safe Drinking Water Act, as amended in 1996, requires EPA to execute a
program that identifies, monitors and considers for regulation new and emerging chemicals that may pose a risk to drinking water consumers.
• EPA notifies the public of chemicals it is investigating by publishing the drinking water Contaminant Candidate List (CCL).
• In order for EPA’s Office of Water to evaluate CCL chemicals for regulation, it is vital that nationwide occurrence data for these chemicals in drinking water are obtained.
• Nationwide occurrence data are obtained through Unregulated Contaminant Monitoring (UCM).
• Rugged, accurate, and sensitive methods are needed for UCM.

Office of Research and Development National Exposure Research Laboratory, 26 W. Martin Luther King Dr., Cincinnati, OH 45268
Method Development Goals
•
•
•
•
•
Determine appropriate surrogates and internal standards Establish Data Quality Objectives (DQOs): normally 70-130% recovery with <30% RSD Preservation scheme to allow for sample holding: antimicrobial, dechlorinating agent, and pH buffer Establish sample and extract holding times – ideally ≥14 days Establish detection limits (DLs) and lowest concentration minimum reporting levels (LCMRLs) below health reference levels (HRLs)
2

Office of Research and Development National Exposure Research Laboratory, 26 W. Martin Luther King Dr., Cincinnati, OH 45268
3
Recently Published GC Methods by ORD-NERL
1. Method 522: 1,4-dioxane
– SPE on coconut carbon sorbent, followed by GC/MS – allows for selected ion monitoring (SIM) – two sampling/extraction options (100 mL and 500 mL samples) – method currently used for occurrence data in UCMR 3 (2013-2015)

Office of Research and Development National Exposure Research Laboratory, 26 W. Martin Luther King Dr., Cincinnati, OH 45268
Recently Published GC Methods by ORD-NERL (cont.) 2. Method 525.3: Semi-volatiles
– published in February 2012 – approx. 130 analytes (pesticides, herbicides, PCBs, PAHs, etc) – includes 16 CCL 3 compounds and 17 regulated contaminants – SPE on polymeric sorbent (DVB), followed by GC/MS – improved preservation scheme, updated surrogates and internal
standards, addition of SIM option, and new PCB screening procedure
4

Office of Research and Development National Exposure Research Laboratory, 26 W. Martin Luther King Dr., Cincinnati, OH 45268
5
Current Work
Development of drinking water method for o-toluidine, quinoline, dimethipin, captan, and butylated hydroxyanisole (BHA)
• o-Toluidine and quinoline (both industrial precursors) have basic structures, which
led to poor sorbent recovery using Method 525.3 preservatives (acidic scheme) • BHA (a food and packaging preservative) suffered from randomly occurring
extraction inefficiency and was removed from Method 525.3
• Dimethipin was included in EPA Method 525.3, but with limited sorbent options
• Captan was removed from Method 525.3 in the evaluation phase, due to hydrolysis (half life in water is less than 1 day)
• All 5 compounds are being evaluated for an EPA method using a neutral pH
preservation scheme

Office of Research and Development National Exposure Research Laboratory, 26 W. Martin Luther King Dr., Cincinnati, OH 45268
Current SPE Extraction Technique - Cartridges
Add surrogates: o-toluidine-d9 quinoline-d7 Add preservatives: ascorbic acid Trizma buffer (pH 7.0) EDTA DZU
Rinse & condition: methylene chloride
methanol water
Add 1 L water sample extract at ~10 mL/min
Rinse with RW
Dry cartridge for 10 min
Elute with methylene chloride
Add IS(s): acenaphthene-d10 phenanthrene-d10 chrysene-d12
Dry and concentrate extract to 1 mL
GC/MS: Full scan option or SIM option
Multiple hydrophilic-
modified sorbent options

Office of Research and Development National Exposure Research Laboratory, 26 W. Martin Luther King Dr., Cincinnati, OH 45268
7
GC/MS Full Scan Analysis Specs
Column: Restek RXI-5sil-MS and J&W DB-1701 30 m x 0.25 mm x 0.25 μm column
Injector: 275 °C (splitless mode), 20 psi pulse
Inj. vol: 1 μL
Flow: 1 mL/min, helium carrier gas
Oven: 60 °C for 1 min, to 300 °C at 10 °C/min, hold 2 min. Total time = 27 min.
MS Transfer Line: 275 °C
MS: scan 50-350 amu, full scan

Office of Research and Development National Exposure Research Laboratory, 26 W. Martin Luther King Dr., Cincinnati, OH 45268
8
GC/MS SIM Analysis Specs (Preliminary)
Column: Restek RXI-5sil-MS
Injector: 275 °C (splitless mode), 20 psi pulse
Inj. vol: 1 µL
Flow: 1 mL/min, helium carrier gas
Oven: 60 °C for 1 min, to 300 °C at 10 °C/min, hold 2 min. Total time = 27 min.
MS Transfer Line: 275 °C
MS SIM: 6 windows (amu, dwell time) WIN1, 5.00 min: (106.10, 25) (107.10, 25) (112.10, 25)(114.10, 25) WIN2, 7.64 min: (102.00, 25) (108.10, 25) (129.10, 25)(136.10, 25) WIN3, 10.62 min: (137.10, 25) (162.10, 25) (164.10, 25)(180.10, 25) WIN4, 13.76 min: ( 54.10, 75) (118.00, 75) (188.10, 25) WIN5, 17.16 min: ( 79.00, 75) (149.00, 75) WIN6, 20.37 min: (236.20, 25) (240.20, 25)

Office of Research and Development National Exposure Research Laboratory, 26 W. Martin Luther King Dr., Cincinnati, OH 45268
Sample Total Ion Chromatogram (TIC) with Mass Spectra, 5 µg/mL standard
9
Internal Standards acenaphthene-d10, phenanthrene-d10, and chrysene-d12 labeled as ISTD 1, ISTD 2, and ISTD 3, respectively.

Office of Research and Development National Exposure Research Laboratory, 26 W. Martin Luther King Dr., Cincinnati, OH 45268
Quality Control Data at Various Concentrations, Drinking Water Matrices
• Three different water matrices were fortified with CCL 3 compounds of interest, then extracted and analyzed.
1. Drinking water – surface water source 2. Drinking water – groundwater source (hardness ~ 350 mg/L) 3. Natural Organic Material NOM water – lab water spiked with concentrated organic
matter from the Ohio River (TOC @ 1.8-2.2 mg/L) • Fortification performed at 5 µg/L, 1 µg/L, and 0.1 µg/L.
• Each matrix was extracted in 4x replicates
10

Office of Research and Development National Exposure Research Laboratory, 26 W. Martin Luther King Dr., Cincinnati, OH 45268
Quality Control Data from Matrix Extracts at High Level Fortification (Full Scan GC/MS)
11
Lower and upper limit bars are set at 70% and 130%, respectively.

Office of Research and Development National Exposure Research Laboratory, 26 W. Martin Luther King Dr., Cincinnati, OH 45268
Quality Control Data from Matrix Extracts at Mid Level Fortification (Full Scan GC/MS)
12
Lower and upper limit bars are set at 70% and 130%, respectively.

Office of Research and Development National Exposure Research Laboratory, 26 W. Martin Luther King Dr., Cincinnati, OH 45268
13
Quality Control Data from Matrix Extracts at Low Level Fortification (Full Scan GC/MS)
Lower and upper limit bars are set at 50% and 150%, respectively.

Office of Research and Development National Exposure Research Laboratory, 26 W. Martin Luther King Dr., Cincinnati, OH 45268
Remaining Laboratory Work with Current Method
• Perform sample and extract holding time study - GOALS:14-28 day holding time for samples; 14-28 days for extracts - Special attention to captan (hydrolysis issues) and o-toluidine (solvent stability issues) • LCMRL and MDL analysis and calculations
• Repeat sample matrix challenges, holding time studies, and LCMRL/MDL calculations in
SIM (work has been initiated)
- quinoline: HRL of 0.010 µg/L
• Multi-laboratory verification
14

Office of Research and Development National Exposure Research Laboratory, 26 W. Martin Luther King Dr., Cincinnati, OH 45268
15
Future Research and Potential Challenges Review of Select Remaining CCL 3 Compounds:
CCL3 Compound Comments
Acetamide Not suitable for generic SPE, highly water soluble (2000g/L); Too small molecular weight (59.1) for LC/MS or EI-GC/MS
Acrolein Volatile, water solubility > 10%. Stability issues in water.
Cumene hydroperoxide Safety concerns due to high reactivity, low water solubility
Ethylene glycol Too small molecular weight (62.1) for EI-GC/MS or LC/MS; miscible with water, not suitable for generic SPE
Ethylene oxide Too small molecular weight (44.0) for EI-GC/MS or LC/MS/MS; gas at room temperature
Hydrazine Too small molecular weight (32.0) for EI-GC/MS or LC/MS; volatile
Methanol Too small molecular weight (32.0) for EI-GC/MS or LC/MS; volatile
Nitroglycerin Not amenable to GC due to thermal instability; cannot ionize by positive ion ESI-LC/MS/MS
N-Methyl-2-pyrrolidone Miscible with water, not suitable for generic SPE
Oxirane, methyl- (propylene oxide) Too small molecular weight (58.1) for EI-GC/MS or LC/MS; volatile
Toluene diisocyanate Reacts immediately with water, stability issues
Urethane Not suitable for GC; Too small molecular weight (89.1) for LC/MS

A World of SolutionsTM
METHOD DEVELOPMENT PROCESS FOR DRINKING WATER ANALYSIS
CB&I Alan Zaffiro

A World of SolutionsTM 1
W HA T WE DO TO CREATE A METHOD
PLANNING
AGENCY DIRECTION (e.g.,CCL3)
ANALYTE GROUPING
LITERATURE SEARCH PRIVATE PARTNERS
RESEARCH PLAN
(NEW OR UPDATE EXISTING METHOD)
EXECUTION
METHOD DEVELOPMENT
VALIDATION
REVIEW
PUBLICATION

A World of SolutionsTM 2
WHAT WE DO TO CREATE A METHOD
PLANNING
AGENCY DIRECTION (e.g.,CCL3)
ANALYTE GROUPING
LITERATURE SEARCH PRIVATE PARTNERS
RESEARCH PLAN
(NEW OR UPDATE EXISTING METHOD)
EXECUTION
METHOD DEVELOPMENT
VALIDATION
REVIEW
PUBLICATION

A World of SolutionsTM 3
INITIAL ANALYTE GROUPING
CONSIDERATIONS
MAXIMIZE # OF COMPOUNDS ANALYZED BY A SINGLE TECHNIQUE PHYSICAL-CHEMICAL PROPERTIES REACTIVITY / FORM MONITORING LIMITS USE OR ENVIRONMENTAL IMPACT RELEVANCE EXTEND EXISTING DRINKING WATER METHOD

WHAT WE DO TO CREATE A
PLANNING
METHOD
AGENCY DIRECTION (e.g.,CCL3)
ANALYTE GROUPING
LITERATURE SEARCH PRIVATE PARTNERS
RESEARCH PLAN
(NEW OR UPDATE EXISTING METHOD)
EXECUTION
METHOD DEVELOPMENT
VALIDATION
REVIEW
PUBLICATION
A World of SolutionsTM 4

A World of SolutionsTM 5
L IT ERATURE SEARCH AND PARTNERS
SOURCES
EPA METHODS PUBLISHED BY OTHER DIVISIONS JOURNALS METHODS PUBLISHED BY OTHER GOVERNMENT AGENCIES, e.g., USGS APPLICATION NOTES VENDORS UNIVERSITIES PERSONAL COMMUNICATION PAST TSC ATTEMPTS PRELIMINARY LAB WORK VOLUNTARY CONSENSUS STANDARD BODIES (e.g. ASTM, STANDARD METHODS)

WHAT WE DO TO CREATE A METHOD
PLANNING
AGENCY DIRECTION (e.g.,CCL3)
ANALYTE GROUPING
LITERATURE SEARCH PRIVATE PARTNERS
RESEARCH PLAN
(NEW OR UPDATE EXISTING METHOD)
EXECUTION
METHOD DEVELOPMENT
VALIDATION
REVIEW
PUBLICATION
A World of SolutionsTM 6

A World of SolutionsTM 7
RESEARCH PLAN
ELEMENTS
LITERATURE SEARCH RESULTS PROPOSED TARGET LIST PROPOSED QC COMPOUNDS – INTERNAL AND SURROGATE STANDARDS
PROPOSED TECHNIQUE – PRESERVATION – DIRECT INSTRUMENTAL ANALYSIS? – SAMPLE PREPARATION (EXTRACTION, DERIVATIZATION, BUFFER)
PROPOSED CONDITIONS

WHAT WE DO TO CREATE A METHOD
PLANNING
AGENCY DIRECTION (e.g.,CCL3)
ANALYTE GROUPING
LITERATURE SEARCH PRIVATE PARTNERS
RESEARCH PLAN
(NEW OR UPDATE EXISTING METHOD)
EXECUTION
METHOD DEVELOPMENT
VALIDATION
REVIEW
PUBLICATION
A World of SolutionsTM 8

A World of SolutionsTM 9
METHOD DEVELOPMENT
BENCH WORK TO OPTIMIZE CONDITIONS
WORK BACKWARDS ITERATIVELY – INSTRUMENTAL DETERMINATION>Sx PPEP>PRESERVATION – REAGENT WATER>FIELD SAMPLES
GOALS – ROBUST, REPEATABLE, TRANSLATABLE METHOD – 70 TO 130% RECOVERY; +30% PRECISION – AT LEAST 14 DAYS STORAGE STABILITY – DETECTION LIMITS MEET MONITORING / REGULATORY OBJECTIVES
MINIMIZE COST AND HAZARDOUS MATERIALS UTILIZE GENERIC LABORATORY MATERIALS

WHAT WE DO TO CREATE A METHOD
PLANNING
AGENCY DIRECTION (e.g.,CCL3)
ANALYTE GROUPING
LITERATURE SEARCH PRIVATE PARTNERS
RESEARCH PLAN
(NEW OR UPDATE EXISTING METHOD)
EXECUTION
METHOD DEVELOPMENT
VALIDATION
REVIEW
PUBLICATION
A World of SolutionsTM 10

A World of SolutionsTM 11
DEMONSTRATION
VERIFY PERFORMANCE AT EPA AND MULTIPLE OUTSIDE LABORATORIES
SINGLE LABORATORY--MOST EXTENSIVE SCOPE – LCMRL, P&A (CHALLENGING MATRIXES), MRL CONFIRMATION – STORAGE STABILITY WITH MICROBIAL INOCULANT PRESENT – DATA PUBLISHED IN SECTION 17 DRINKING WATER METHODS
MULTI-LABORATORY VALIDATION – LCMRL, P&A (ONE MATRIX), MRL CONFIRMATION – DATA PUBLISHED IN RESEARCH SUMMARY – LABORATORIES RECOGNIZED IN METHOD

WHAT WE DO TO CREATE A METHOD
PLANNING
AGENCY DIRECTION (e.g.,CCL3)
ANALYTE GROUPING
LITERATURE SEARCH PRIVATE PARTNERS
RESEARCH PLAN
(NEW OR UPDATE EXISTING METHOD)
EXECUTION
METHOD DEVELOPMENT
VALIDATION
REVIEW
PUBLICATION
A World of SolutionsTM 12

A World of SolutionsTM 13
REVIEW
METHOD DOCUMENT AND PERFORMANCE DATA
PEER REVIEW OF METHOD – CONCURRENT WITH MULTI-LABORATORY VALIDATION
AGENCY – INTERNAL (CB&I) – EPA PO – EPA MANAGEMENT – EPA HEADQUARTERS – VERIFY PDF CONVERSION (SECTION 508 COMPLIANT)

WHAT WE DO TO CREATE A METHOD
World of SolutionsTM 14
PLANNING
AGENCY DIRECTION (e.g.,CCL3)
ANALYTE GROUPING
LITERATURE SEARCH PRIVATE PARTNERS
RESEARCH PLAN
(NEW OR UPDATE EXISTING METHOD)
EXECUTION
METHOD DEVELOPMENT
VALIDATION
REVIEW
PUBLICATION
A

A World of SolutionsTM 15
CCL3 LO W MW COMPOUNDS REMAINING
12 CANDIDATES
INITIAL ANALYTE GROUPING
Ethylene oxide, propylene oxide, methanol, 1-butanol, allyl alcohol, 2-methoxy ethanol, ethylene glycol, acrolein, hexane, o-toluidine, triethylamine, benzyl chloride SMALL, POLAR MOLECULES POSSIBLY AMENABLE TO GC MOST POSSIBLY ISOLATED FROM H2O USING CARBON- OR CMS-BASED EXTRACTION MEDIA

A World of SolutionsTM 16
RESEARCH PLAN
12 CANDIDATES
LITERATURE SEARCH
PHYSICAL PROPERTIES – HENRY’S LAW CONSTANT – MW – BOILING POINT
HRL METHODS PUBLISHED BY OTHER GOVERNMENT AGENCIES TECHNIQUES REPORTED IN: – APPLICATION NOTES – JOURNALS – PROCEEDINGS OF CONFERENCES – PERSONAL COMMUNICATION

A World of SolutionsTM 17
RESEARCH PLAN
Table 1. Physical properties, published methods, and literature summary.
a. Reference: ethanol (1.9 x 10²), benzene (1.8 x 10⁻¹), 1-propanol (1.4 x 10²), MtBE (1.7), 1,4-dioxane (2.1 X 10² ), TBA (8.4). b. Azeotropic distillation c. Purge and trap technique
Analyte(s) Henry’s Law Constant, M/atm a MW bp,
°C HRL, µg/L SW846 Literature techniques (author reference in parentheses)
Ethylene oxide Propylene oxide
7.1 5.2
44 58
10.7 34
0.1 0.2
5031b, 8015D (direct aqueous injection—DAI) Air and pharmaceutical residual methods
Methanol 2.3 x 10² 32 64.7 3,500 8015D DAI
P&T w/FID Ether extraction (Woo)
Headspace in blood (numerous citations) Derivatization to alkyl nitrite/extraction/GC/ECD (Nguyen)
SPME (Supelco application notes) 1-Butanol 1.2 x 10² 74 118 700 5031, 5030Cc w/heat, Ether extraction (Woo)
Allyl alcohol 2 x 10² 58 97 35 5031, 5030C w/heat, 8015D DAI 2-Methoxyethanol 12.1 76 125 21 Not found SPE-carbon molecular sieve (Supelco application notes)
Ethylene glycol 1.7 x 10⁴ 62 197 14,000 8015B DAI SPE-carbon molecular sieve (Supelco), DAI-GC-FID (Turner, Restek, Teske)
Acrolein 7 – 8 56 53 3.5 5030C, 8015D DAI, 8261A vacuum distillation EPA Method 603 (heated purge and trap)
Hexane 5.5 x 10⁻⁴ 86 69 420 Not found P&T (524.3 Research Summary) Ortho-toluidine Not available 107 200 0.19 8015D DAI SPME (Supelco), IC (Zhu) Triethylamine Not available 101 90 2.3 8015D DAI SPME (Alltech application note)
Benzyl chloride 1.6 127 179 0.2 5030C P&T (524.2)
LITERATURE SEARCH SUMMARY TABLE

A World of SolutionsTM 18
RESEARCH PLAN
12 CANDIDATES
INITIAL LAB WORK AND PROPOSED METHOD
PRIORITY CONTAMINANT: 2-methoxyethanol LIMITED INFORMATION OR EXPENSIVE INSTRUMENTS NEEDED – methanol, hexane, acrolein, triethyl amine, o-toluidine (not
practical) INITIAL LAB INVESTIGATION REQUIRED – EtO AND ptO: HEADSPACE, EXTRACTION, AND P&T FAILED – THESE TWO ELIMINATED
REMAINING 5 COMPOUNDS AMENABLE TO EXTRACTION – SIMILAR TECHNIQUE TO EPA METHOD 522 – ORD-NERL ORIGINALLY PROPOSED MULTIPLE TARGETS FOR THIS
METHOD

A World of SolutionsTM 19
RESEARCH PLAN
6 CANDIDATES
PROPOSED METHOD (CONT.)
PROPOSE EXTENDING M-522 beyond 1,4-dioxane NEW TARGETS: n-butanol, allyl alcohol, 2-methoxyethanol, ethylene glycol, benzyl chloride – CONTAINS PRIORITY CONTAMINANT
QC COMPOUNDS – LABELED ISOTOPES OF 1,4-dioxane, n-butanol, allyl alcohol
PROPOSED CONDITIONS – CARBON-EXTRACTION, GC-MS DETERMINATION

A World of SolutionsTM 20
METHOD DEVELOPMENT
6 CANDIDATES
BENCH WORK TO OPTIMIZE CONDITIONS
ETHYLENE GLYCOL NOT RETAINED BY ANY EXTRACTION MEDIA EVALUATED BENZYL CHLORIDE FAILED PRELIMINARY STORAGE STABILITY ONLY ONE OF THE EXTRACTION MEDIA IN M-522 SUITABLE FOR REMAINING COMPOUNDS MODIFICATION OF M-522 EXTRACTION SOLVENT REQUIRED TO RECOVER ADDITIONAL TARGETS 1,4-dioxane, n-butanol, allyl alcohol, 2-methoxyethanol

DEMONSTRATION/VALIDATION
A World of SolutionsTM 21
4 ANALYTES
VERIFY PERFORMANCE AT EPA AND MULTIPLE OUTSIDE LABORATORIES
SUCCESSFULLY DEMONSTRATED AT EPA METHOD CURRENTLY BEING WRITTEN CURRENTLY RECRUITING OUTSIDE LABORATORIES

A World of SolutionsTM 22
CONCLUSION SLIDE 1
ABILITY TO MEET MONITORING GOALS
MRL’s and HRLs
Analytes MRL * CCL3 HRL 1,4-dioxane 0.2 µg/L 3.0 µg/L (cancer) allyl alcohol 1.0 µg/L 35 µg/L n-butanol 1.0 µg/L 700 µg/L 2-methoxyethanol 1.0 µg/L 21 µg/L * This is the aqueous concentration equivalent to the low calibration standard.

A World of SolutionsTM 23
CONCLUSION SLIDE 2
METHOD PARAMETERS
Preservation: identical to EPA method 522 SPE: 0.1 L Sx; neutralized with 5 mL x 0.8 M NaHCO3; Supelco Envi-Carb Plus (400 mg); 60-min air dry in reverse direction; elution 20% MeOH:DCM; 2-mL extract volume Extract analysis: 30 m x 0.25 mm i.d. x 0.5 µm df column (Agilent P/N CP9222 VF-WAXms); 1 µL injection @ 200 °C inlet; temperature- programmed separation; MS detection in SIM mode

A World of SolutionsTM 24
CONCLUSION SLIDE 3
ANALYTE LIST AND CALIBRATION RANGES
Analytes Range, µg/L Range, ng/mL (equivalent extract concentration) I.S.: 1,4-dioxane-d8 added to extract 250 I.S.: chlorobenzene-d5 added to extract 250 Surr: allyl alcohol-d6 5.0 250 (also serves as isotope dilution internal standard) Surr: n-butanol-d10 5.0 250 (also serves as isotope dilution internal standard) 1,4-dioxane 0.10 — 8.0 5.0 — 400 allyl alcohol 0.50 —20 25 — 1000 allyl alcohol* 0.50 —20 25 — 1000 n-butanol 0.50 —20 25 — 1000 n-butanol* 0.50 —20 25 — 1000 2-methoxyethanol 0.50 —20 25 — 1000 * Reported with isotope dilution quantitation

A World of SolutionsTM 25
CONCLUSION SLIDE 4
CHALLENGES
WATER MANAGEMENT – EXTRACTION MEDIA IS DIFFICULT TO DRY – WET EXTRACTS CAUSE RETENTION TIME SHIFTS
(COMPROMISING QUALITATIVE ID) AND CAN AFFECT ANALYTE RESPONSE (QUANTITATIVE AND QC)
– EXCESSIVE DRYING CAUSES LOW RECOVERY ONLY 1 EXTRACTION MEDIUM AVAILABLE FOR THE ANALYSIS OF THESE ANALYTES LOT TO LOT VARIATION – LOADING TIME – DRYING TIME

A World of SolutionsTM
ANALYSIS OF ERYTHROMYCIN AND OTHER PHARMACEUTICALS BY LC-
MS/MS CB&I
William A. Adams, Ph.D.

A World of SolutionsTM 1
PHARMACEUTICAL TARGET ANALYTES
Carbamazepine, Diazepam, Diclofenac (sodium salt), Enalapril (maleate salt), Fluoxetine (HCl), Gemfibrozil, Naproxen, Phenytoin, Sulfamethoxazole, Triclosan, Trimethoprim, and Erythromycin ( measured as Erythromycin–H2O)
Variety of chemically unrelated analytes – Both ESI positive and ESI negative modes
Analysis by LC-MS/MS using an 5 mM ammonium acetate and methanol gradient
SPE (6 mL, 200 mg HLB cartridge) 13C-Naproxen-d3, Triclosan-d3, Carbamazepine-d10, chosen as internal standards; 13C-Trimethoprim-d3 and Diclofenac-d4 chosen as surrogate standards

A World of SolutionsTM 2
CCL3 AND PRIORITY TARGET ANALYTES
Erythromycin and triclosan Only erythromycin listed on CCL3
Erythromycin Triclosan

A World of SolutionsTM 3
Erythromycin – At pH <7, water is
removed and compound no longer exhibits antibiotic properties (Hirsch et al., 1999)
– For analysis, erythromycin
is measured as erythromycin–H2O (717.0 > 158.3 m/z)
Erythromycin
Erythromycin

A World of SolutionsTM 4
Preservation
Store samples in refrigerator (6°C)
100 mg/L ascorbic acid – Reduces free chlorine present in tap water samples – Easy to handle – Solid can be added to bottles before sampling
350 mg/L EDTA – Chelates metals in tap water samples – Prevents metal hydrolysis – Solid can be added to bottles before sampling
9.4 g/L potassium citrate – Acts as a microbial inhibitor – pH ~3.8 – Solid can be added to bottles before sampling

A World of SolutionsTM 5
SAMPLE PREPARATION
Solid phase extraction (SPE) – 6 cc, 200 mg HLB cartridges – Vacuum manifold – 1 liter samples extracted and eluted with 5 mL 1:1
methanol/acetone
Dilution – 5 mL reagent water added to extract – 100:1 sample to extract concentration factor

A World of SolutionsTM 6
INSTRUMENTAL METHOD
CHROMATOGRAPHIC CONDITIONS
ESI positive HPLC Column: Waters Xterra® MS C18, 2.1 x 150 mm, 3.5 µm Column temperature: 30 oC Column flow rate: 0.200 mL/min Autosampler temperature: 10 OC Injection volume: 10 µL Gradient:
Time (min)
%5 mM ammonium
acetate in 10% MeOH/90%
reagent water
%MeOH
0.00 90 10 0.50 90 10 0.51 50 50 8.00 25 75 8.01 0 100 10.00 0 100 14.00 90 10 24.00 End Run
ESI negative HPLC Column: Waters Xterra® MS C18, 2.1 x 150 mm, 3.5 µm Column temperature: 30 oC Column flow rate: 0.200 mL/min Autosampler temperature: 10 OC Injection volume: 50 µL Gradient:
Time (min)
%5 mM ammonium
acetate in 10% MeOH/90%
reagent water
%MeOH
0.00 90 10 0.50 90 10 0.51 40 60 8.00 0 100 11.00 0 100 15.00 90 10 25.00 End Run

A World of SolutionsTM 7
INSTRUMENTAL METHOD
MS CONDITIONS
MS Parameter HPLC-MS/MS Polarity Positive ion electrospray Capillary Voltage, kV 2.50 Source Temperature, oC 120 N2 Desolvation Temperature, oC 400 N2 Desolvation Gas Flow, L/hr 900 Cone Gas Flow, L/hr 50 Extractor Lens, V 2.00 RF Lens, V 0.2
MS Parameter HPLC-MS/MS Polarity Negative ion electrospray Capillary Voltage, kV 2.50 Source Temperature, oC 120 N2 Desolvation Temperature, oC 400 N2 Desolvation Gas Flow, L/hr 900 Cone Gas Flow, L/hr 50 Extractor Lens, V 1.00 RF Lens, V 0.1

A World of SolutionsTM 8
ESI POSTIVE CHROMATOGRAM

ESI NEGATIVE CHROMATOGRAMS
A World of SolutionsTM 9

A World of SolutionsTM 10
LCMRL
Analyte LCMRL (ng/L)a
Carbamazepine 2.4 Diazepam 0.27 Diclofenac 1.1 Enalapril 0.60 Fluoxetine 0.98 Gemfibrozil 1.4 Naproxen 4.5 Phenytoin 1.4 Sulfamethoxazole 0.28 Triclosan 3.4 Trimethoprim 4.1 Erythromycin 5.0

PRECISION AND ACCURACY
A World of SolutionsTM 11
Precision and accuracy measured in different matrixes (e.g. reagent water, high TOC tap water, hard tap water) Measured at two concentrations – Low and Mid/High of calibration range
Accuracy – Low: 50–150% recovery – Mid/High: 70–130% recovery
Precision – Low: ≤30% RSD – Mid/High: ≤20% RSD

A World of SolutionsTM 12
PRECISION AND ACCURACY
Reagent water – 9.4 g/L potassium citrate, 350 mg/L EDTA, and 100 mg/L ascorbic acid
Analyte
Low Concentration High Concentration Fortified
Concentration (ng/L)
Avg. %Recovery %RSD Fortified
Concentration (ng/L)
Avg. %Recovery %RSD
Carbamazepine 4.94 87.9 4.0 31.3 91.5 0.88 Diazepam 0.340 72.9 7.8 20.0 92.1 3.4 Diclofenac 2.04 97.2 4.2 102 95.1 1.2 Enalapril 1.22 105 6.0 40.4 89.7 1.6 Fluoxetine 1.24 70.3 8.2 104 84.6 2.3 Gemfibrozil 3.00 92.7 1.4 100 95.6 2.1 Naproxen 9.20 101 4.0 100 98.5 1.2 Phenytoin 2.42 76.0 4.5 30.7 90.2 4.1 Sulfamethoxazole 0.410 92.2 8.0 29.4 90.9 0.51 Triclosan 7.00 91.5 5.0 311 99.7 1.5 Trimethoprim 8.80 90.5 4.2 30.4 91.1 2.4 Erythromycin 5.60 80.4 6.2 40.0 83.9 1.7 Diclofenac-d4 100 94.0 2.4 100 93.9 1.8 13C3-Trimethoprim 20.0 86.6 2.3 20.0 87.3 3.3

A World of SolutionsTM 13
PRECISION AND ACCURACY
Ground source tap water – 9.4 g/L potassium citrate, 350 mg/L EDTA, and 100 mg/L ascorbic acid – Free chlorine: 0.76 mg/L – Total chlorine: 0.97 mg/L – Hardness: 331 mg/L – TOC: 0.75 ppm
Analyte
Low Concentration High Concentration Fortified
Concentration (ng/L)
Avg. %Recovery %RSD Fortified
Concentration (ng/L)
Avg. %Recovery %RSD
Carbamazepine 4.94 93.0 2.5 31.3 95.3 1.2 Diazepam 0.340 73.5 13 20.0 97.7 1.8 Diclofenac 2.04 104 7.6 102 97.4 1.4 Enalapril 1.22 94.3 2.9 40.4 94.4 1.1 Fluoxetine 1.24 86.1 6.4 104 94.9 2.4 Gemfibrozil 3.00 92.7 4.1 100 96.4 2.0 Naproxen 9.20 89.0 3.8 100 104 2.1 Phenytoin 2.42 83.0 5.9 30.7 80.2 2.1 Sulfamethoxazole 0.410 87.8 12 29.4 93.8 1.3 Triclosan 7.00 88.5 10 311 96.7 1.0 Trimethoprim 8.80 92.4 5.2 30.4 94.3 1.2 Erythromycin 5.60 69.8 7.3 40.0 78.7 5.5 Diclofenac-d4 100 98.9 1.5 100 88.9 2.2 13C3-Trimethoprim 20.0 98.4 1.8 20.0 97.7 1.8

A World of SolutionsTM 14
PRECISION AND ACCURACY
Surface source tap water – 9.4 g/L potassium citrate, 350 mg/L EDTA, and 100 mg/L ascorbic acid – Free chlorine: 1.16 mg/L – Total chlorine: 1.65 mg/L – Hardness: 124 mg/L – TOC: 4.23 ppm
Analyte
Low Concentration High Concentration Fortified
Concentration (ng/L)
Avg. %Recovery %RSD Fortified
Concentration (ng/L)
Avg. %Recovery %RSD
Carbamazepine 4.94 83.7 2.7 31.3 91.1 2.8 Diazepam 0.340 54.7 27 20.0 95.7 0.92 Diclofenac 2.04 71.8 5.6 102 73.6 1.4 Enalapril 1.22 99.5 8.8 40.4 94.1 0.42 Fluoxetine 1.24 96.6 4.3 104 105 1.8 Gemfibrozil 3.00 104 3.3 100 111 0.91 Naproxen 9.20 92.7 4.8 100 98.6 1.9 Phenytoin 2.42 95.4 6.6 30.7 95.4 1.6 Sulfamethoxazole 0.410 92.2 28 29.4 93.3 0.96 Triclosan 7.00 93.5 12 311 99.2 0.94 Trimethoprim 8.80 69.6 5.2 30.4 72.5 2.1 Erythromycin 5.60 85.0 6.3 40.0 87.2 2.0 Diclofenac-d4 100 72.3 0.92 100 75.3 1.7 13C3-Trimethoprim 20.0 80.2 1.6 20.0 81.4 1.3

A World of SolutionsTM 15
HOLDING TIME - SAMPLE
Surface source tap water
Analyte Fortified
Conc. (ng/L)
Day 0 Day 7 Day 14 Day 21 Day 28
Avg. %Rec %RSD
% Change
from Day 0
%RSD
% Change
from Day 0
%RSD
% Change
from Day 0
%RSD
% Change
from Day 0
%RSD
Carbamazepine 7.82 106 6.1 -1.3 6.6 -2.2 3.0 -6.7 3.4 -8.4 0.46 Diazepam 5.00 114 1.1 -8.9 1.5 -6.7 1.8 -6.7 1.8 -11 1.7 Diclofenac 25.6 105 0.84 -c -c 4.3 1.8 3.3 0.92 -13 1.2 Enalapril 10.1 90.8 2.3 0.29 2.9 -2.6 2.8 -1.3 0.78 1.1 2.2 Fluoxetine 26.0 113 2.4 0.56 7.8 15 41 -6.6 3.6 -4.1 1.9 Gemfibrozil 25.0 104 1.2 7.3 2.3 3.3 2.1 4.1 1.1 -5.3 2.5 Naproxen 25.0 106 1.2 3.4 2.0 2.5 2.7 0.39 2.7 0.50 2.2 Phenytoin 7.68 94.8 11 -c -c -30 3.4 -15 9.2 -18 2.8 Sulfamethoxazole 7.34 93.0 3.3 -1.2 5.5 -2.7 0.53 -7.8 0.56 -6.1 2.6 Triclosan 77.8 103 2.8 3.1 3.5 5.1 2.2 1.5 1.3 -1.1 0.76 Trimethoprim 7.60 74.8 2.0 1.7 4.1 -10 3.0 -10 4.5 -16 3.4 Erythromycin 10.0 102 1.9 -1.3 22 -6.2 4.5 -0.62 1.5 -3.7 2.8
Surrogate Fortified
Conc. (ng/L)
Avg. %Rec %RSD Avg.
%Rec %RSD Avg. %Rec %RSD Avg.
%Rec %RSD Avg. %Rec %RSD
Diclofenac-d4 100 85.5 1.2 103 5.1 97.8 1.7 99.7 0.55 82.2 0.68 13C3-Trimethoprim 20.0 79.4 0.84 78.9 0.84 74.7 0.43 76.7 2.4 79.1 1.9

HOLDING TIME - EXTRACT
Surface source tap water
A World of SolutionsTM 16
Analyte Fortified
Conc. (ng/L)
Day 0 Day 7 Day 14 Day 21 Day 28
Avg. %Rec %RSD
% Change
from Day 0
%RSD
% Change
from Day 0
%RSD
% Change
from Day 0
%RSD
% Change
from Day 0
%RSD
Carbamazepine 7.82 106 6.1 -10 3.8 -9.4 3.5 -12 2.3 -14 3.5 Diazepam 5.00 114 1.1 -14 2.5 -12 4.1 -11 2.4 -13 3.0 Diclofenac 25.6 105 0.84 -6.4 1.1 -6.4 3.2 -0.74 1.0 -17 1.1 Enalapril 10.1 90.8 2.3 4.4 2.2 0.69 0.50 2.4 0.79 4.3 1.5 Fluoxetine 26.0 113 2.4 13 2.2 2.6 4.6 8.8 4.9 18 6.0 Gemfibrozil 25.0 104 1.2 -2.5 1.8 -3.3 1.7 3.0 0.41 -11 0.63 Naproxen 25.0 106 1.2 -0.48 1.3 3.6 3.1 4.0 1.8 3.2 2.8 Phenytoin 7.68 94.8 11 - - -35 7.4 -20 4.3 -16 13 Sulfamethoxazole 7.34 93.0 3.3 -12 4.0 -9.6 1.2 -7.6 2.2 -8.2 1.6 Triclosan 77.8 103 2.8 -1.0 1.8 -0.10 1.1 1.5 1.6 -4.1 2.7 Trimethoprim 7.60 74.8 2.0 -3.1 3.0 -12 3.1 -9.7 0.41 -11 3.4 Erythromycin 10.0 102 1.9 -24 6.6 -14 4.5 -12 1.8 -16 4.8 Diclofenac-d4 100 85.5 1.2 -0.94 2.4 -1.8 5.2 10 5.1 -11 4.2 13C3-Trimethoprim 20.0 79.4 0.84 11 3.7 -1.9 4.5 1.6 2.8 1.2 2.0

A World of SolutionsTM 17
CONCLUSIONS
Various pharmaceuticals/personal care products (PPCPs) analyzed in both ESI positive and ESI negative modes
Erythromycin measured as erythromycin–H2O – Likely transforms prior to analysis
Extraction necessary to reach desired concentration levels – HLB cartridges found to provide best overall extraction recovery for both
positive and negative analytes
All analytes meet precision and accuracy QC requirements in three different matrixes Sample and extract hold times change less than 20% after 28 days

A World of SolutionsTM
ANALYSIS OF CYLINDROSPERMOPSIN AND ANATOXIN-A BY LC-MS/MS
CB&I William A. Adams, Ph.D.

CC L 3 ALGAL TOXIN TARGET ANALYTES
A World of SolutionsTM 1
Anatoxin-a
Cylindrospermopsin
Cylindrospermopsin and anatoxin-a – Toxins produced by blue-green algae
Water soluble, polar molecules
Analysis by LC-MS/MS using a high aqueous composition eluent – Cylindrospermopsin: 416.2 > 194.0 m/z – Anatoxin-a: 165.8 > 148.8 m/z
Direct injection

SE LE CTION OF INTERNAL STANDARDS
A World of SolutionsTM 2
Uracil L-phenylalanine
Isotopically labeled standards not available for cylindrospermopsin or anatoxin-a
Cylindrospermopsin is a uracil derivative – Deuterated uracil readily available and elutes near
retention time of cylindrospermopsin (Uracil-d5)
Anatoxin is isobaric and structurally similar to L-phenylalanine – Deuterated phenylalanine is readily available and appears
to track well with anatoxin-a (L-phenylalanine-d4)

A World of SolutionsTM 3
CHROMATOGRAPHIC CONDITIONS
INSTRUMENTAL METHOD
HPLC Column: Waters XSelect® HSS T3, 2.1 x 150 mm, 3.5 µm Column temperature: 30 oC Column flow rate: 0.200 mL/min Autosampler temperature: 10 oC Injection volume: 50 µL Gradient:
Time (min)
%100 mM acetic acid in reagent
water
%MeOH
0.00 100 0 0.50 90 10 8.50 100 0 13.50 End Run
MS CONDITIONS
MS Parameter HPLC-MS/MS Polarity Positive ion electrospray Capillary Voltage, kV 2.50 Source Temperature, oC 120 N2 Desolvation Temperature, oC 400 N2 Desolvation Gas Flow, L/hr 900 Cone Gas Flow, L/hr 50 Extractor Lens, V 2.00 RF Lens, V 0.2

A World of SolutionsTM 4
Preservation
Store samples in refrigerator
100 mg/L ascorbic acid – Reduces free chlorine present in tap water samples – Easy to handle – Solid can be added to bottles before sampling
1000 mg/L sodium bisulfate – Acts as a microbial inhibitor – pH less than 3 – Solid can be added to bottles before sampling

CHR O MATOGRAM – 5 ng/mL ANALYTES
A World of SolutionsTM 5
Uracil-d4
L-phenylalanine-d5
CYN
ANA

A World of SolutionsTM 6
MRL TARGETS
HRL values FROM CCL3 – Cylindrospermopsin – 0.21 µg/L – Anatoxin-a – 3.5 µg/L
Calibration range – Cylindrospermopsin – 0.050 to 10.0 µg/L – Anatoxin-a – 0.050 to 10.0 µg/L
MRL confirmed at 0.100 µg/L for both analytes

A World of SolutionsTM 7
LCMRL

A World of SolutionsTM 8
PRECISION AND ACCURACY
Precision and accuracy measured in different matrixes (e.g. reagent water, high TOC tap water, hard tap water) Measured at two concentrations – Low and Mid/High of calibration range
Accuracy – Low: 50–150% recovery – Mid/High: 70–130% recovery
Precision – Low: ≤30% RSD – Mid/High: ≤20% RSD

A World of SolutionsTM 9
PRECISION AND ACCURACY
Reagent water – 1000 mg/L sodium bisulfate and 100 mg/L ascorbic acid
Reagent Water Low Compound Samples (ug/L) Mean
(ug/L) SD Unfortified
blank (ug/L)
Theoretical spike (ug/L)
%RSD %Rec ESI (+) 1 2 3 4 5 6 7
cylindrospermopsin 0.117 0.128 0.117 0.103 0.100 0.094 0.102 0.109 0.012 0.000 0.100 11.136 108.7 anatoxin-a 0.108 0.116 0.108 0.106 0.102 0.127 0.111 0.111 0.008 0.000 0.100 7.391 111.1
Reagent Water High Compound Samples (ug/L) Mean
(ug/L) SD Unfortified
blank (ug/L)
Theoretical spike (ug/L)
%RSD %Rec ESI (+) 1 2 3 4 5 6 7
cylindrospermopsin 2.837 2.609 2.834 2.767 2.614 2.681 2.664 2.715 0.097 0.000 2.500 3.588 108.6 anatoxin-a 2.757 2.689 2.810 2.580 2.688 2.798 2.709 2.719 0.079 0.000 2.500 2.898 108.7

A World of SolutionsTM 10
PRECISION AND ACCURACY
Ground source tap water – 1000 mg/L sodium bisulfate and 100 mg/L ascorbic acid – Free chlorine: 0.69 mg/L – Total chlorine: 0.97 mg/L – Hardness: 325 mg/L – Conductivity: 798 µS – pH: 7.76
Ground Water Low Compound Samples (ug/L) Mean
(ug/L) SD Unfortified
blank (ug/L)
Theoretical spike (ug/L)
%RSD %Rec ESI (+) 1 2 3 4 5 6 7
cylindrospermopsin 0.137 0.132 0.120 0.128 0.119 0.122 0.125 0.126 0.007 0.000 0.100 5.247 126.1 anatoxin-a 0.102 0.080 0.087 0.099 0.092 0.096 0.093 0.093 0.007 0.000 0.100 8.016 92.7
Ground Water High Compound Samples (ug/L) Mean
(ug/L) SD Unfortified
blank (ug/L)
Theoretical spike (ug/L)
%RSD %Rec ESI (+) 1 2 3 4 5 6 7
cylindrospermopsin 2.406 2.516 2.413 2.435 2.380 2.487 2.508 2.449 0.054 0.000 2.500 2.206 98.0 anatoxin-a 2.316 2.394 2.370 2.324 2.382 2.419 2.424 2.376 0.043 0.000 2.500 1.790 95.0

A World of SolutionsTM 11
PRECISION AND ACCURACY
Surface source tap water – 1000 mg/L sodium bisulfate and 100 mg/L ascorbic acid – Free chlorine: 0.64 mg/L – Total chlorine: 1.14 mg/L – Hardness: 142 mg/L – Conductivity: 344 µS – pH: 7.20 – TOC 3.04 mg/L
Surface Water Low Compound Samples (ug/L) Mean
(ug/L) SD Unfortified
blank (ug/L)
Theoretical spike (ug/L)
%RSD %Rec ESI (+) 1 2 3 4 5 6 7
cylindrospermopsin 0.139 0.124 0.111 0.112 0.119 0.109 0.104 0.117 0.012 0.000 0.100 10.070 116.9 anatoxin-a 0.106 0.091 0.096 0.101 0.101 0.093 0.090 0.097 0.006 0.000 0.100 6.178 96.9
Surface Water High Compound Samples (ug/L) Mean
(ug/L) SD Unfortified
blank (ug/L)
Theoretical spike (ug/L)
%RSD %Rec ESI (+) 1 2 3 4 5 6 7
cylindrospermopsin 2.762 2.768 2.699 2.714 2.715 2.649 2.679 2.712 0.043 0.000 2.500 1.570 108.5 anatoxin-a 2.450 2.506 2.383 2.585 2.484 2.565 2.548 2.503 0.071 0.000 2.500 2.833 100.1

A World of SolutionsTM 12
CONCLUSIONS
Cylindrospermopsin and anatoxin-a show good response with method Labeled analogs of target analytes not available – Internal standards chosen based on tracking ability and response – Uracil-d4 has shown some inconsistency in dirtier matrixes and may be
removed Precision and accuracy are within the acceptable range in three different matrixes MRL is confirmed below HRL of both analytes and LCMRL gives reasonable results Method development will continue with storage/stability study and second laboratory demonstration

A World of SolutionsTM
Update to Method 539
CB&I Steven D. Winslow

A World of SolutionsTM 1
Update to Method 539
EPA Method 539: LC-MSMS analysis , multiple reaction monitoring (MRM) , SPE extraction Original Target Analyte List Method 539 CASRN
4-Androstene-3,17-dione 63-05-8
Equilin 474-86-2
17β-Estradiol 50-28-2
Estriol 50-27-1
Estrone 53-16-7
17α-Ethynylestradiol 57-63-6
Testosterone 58-22-0

A World of SolutionsTM
β-estradiol
2
Estriol
Estrone
Ethynylestradiol
Androstenedione
Equilin
Testosterone
Update to Method 539
EPA METHOD 539 TARGET ANALYTES

A World of SolutionsTM 3
Update to Method 539
Proposed additional hormones to Method 539
Five compounds, introduced late in Method 539 development, were initially rejected from method COMPOUNDS CAS# ISSUES HRL
(ug/L) alpha- Estradiol 57-91-0 M539: enhancement issue 0.35
Equilenin 517-09-9 M539: recovery in finished ground water failed QC 0.35
Mestranol 72-33-3 M539: did not work with ESI 0.28
Norethindrone 68-22-4 M539: ESI+ internal standard did not track 0.04
Progesterone 57-83-0 M539: ESI+ internal standard did not track Nominated for CCL4
---
Internal standards now available – Norethindrone-2,2,4,6,6,10-d6 – Progesterone-2,3,4-13C3

A World of SolutionsTM 4
Equilenin
α-Estradiol
Norethindrone
Mestranol
Update to Method 539
Structures of new hormones
Progesterone

A World of SolutionsTM 5
Update to Method 539
Bisphenol A
Also add bisphenol A to method – Nominated for CCL4 – Deuterated bisphenol A used as surrogate M539
• Extraction not an issue – But, bisphenol A contamination from instrument
and solvent at least 8 ppb – Quantitation level can be no lower than 3 times
LRB level • MRL would be above 24 ppb

A World of SolutionsTM 6
Update to Method 539
Bisphenol A Instrument manufacturer suggests use of an
“isolator” column for bisphenol A – Contamination temporarily retained in short
column placed between solvent mixer & pumps – Contamination separated on chromatogram by
later elution Would bisphenol A require too many precautions for a “hormone” method? Separate method?

A World of SolutionsTM 7
Update to Method 539
Proposed target analyte list for Method 539 revision with additional five hormones & bisphenol A (in bold)
CAS# Androstenedione 63-05-8 Bisphenol A 80-05-7 Equilenin 517-09-9 Equilin 474-86-2 α-Estradiol 57-91-0 β-Estradiol 50-28-2 Estriol 50-27-1 Estrone 53-16-7 α-Ethynylestradiol 57-63-6 Mestranol 72-33-3 Norethindrone 68-22-4 Progesterone 57-83-0 Testosterone 58-22-0

A World of SolutionsTM 8
Update to Method 539
Initial chromatographic challenges – alpha- & beta-estradiol must be well separated,
because precursor and product ions are same – Must use high water content (90%) in initial segment
of gradient mobile phase program to focus bisphenol A contamination
Develop calibration range – Test for reproducibility – Estimate lowest calibration level
Extract spiked samples with C18 disks – If needed, use Oasis HLB disks
Check for contamination or interference in Laboratory Reagent Blanks (LRBs) that contain preservation reagents, sodium omadine & sodium thiosulfate

A World of SolutionsTM 9
First 6 Norethindrone 299.52 > 108.88
Androstenedione 287.53 > 96.92
Equilin 267.46 > 143.08
Equilinen 265.44 > 221.32
Bisphenol A 227.45 >212.28
Estriol 287.48 > 171.18
Update to Method 539

A World of SolutionsTM
Last 7 Mestranol 311.53 > 121.10
Progesterone 315.55 > 96.85
Testosterone 289.58 > 96.89
alpha-ethynylestradiol 295.48 > 145.09
beta-estradiol alpha-estradiol 271.48 > 145.08
Estrone 269.48> 145.11
10
Update to Method 539

A World of SolutionsTM 11
Update to Method 539
Collect data for demonstration of capability – Determine Lowest Concentration Minimum Reporting
Level (LCMRL) – Run Precision & Accuracy studies at a low and a mid
level in reagent water, surface water and ground water – Conduct holding time study for samples with
preservatives • Holding time study for extracts
– Conduct Multi-Laboratory Validation • At least two other labs • Use data to calculate MRL for method

Microbiology Methods Overview Sandhya Parshionikar, Ph.D.
Office of Ground Water and Drinking Water Standards and Risk Management Division
Technical Support Center
May 15, 2013
5/10/2013 1
U.S. Environmental Protection Agency

Candidate Contaminant List 3 Microbial Contaminant Name Information
Adenovirus Virus -respiratory and gastrointestinal illness
Caliciviruses Virus (includes Norovirus) Virus - gastrointestinal illness
Campylobacter jejuni Bacterium - gastrointestinal illness
Enterovirus Group of viruses - mild respiratory illness
Escherichia coli (0157) Toxin-producing bacterium - gastrointestinal illness and kidney failure
Helicobacter pylori Bacterium - ulcers and cancer
Hepatitis A virus Virus - liver disease and jaundice
Legionella pneumophila Bacterium -lung diseases when inhaled
Mycobacterium avium Bacterium - lung infection in those with underlying lung disease, and disseminated infection in the severely immuno compromised
Naegleria fowleri Protozoan parasite -warm surface and ground water causing primary amebic meningoencephalitis
Salmonella enterica Bacterium -gastrointestinal illness
Shigella sonnei Bacterium -gastrointestinal illness and bloody diarrhea 5/10/2013 U.S. Environmental Protection Agency 2

Challenges to Microbial monitoring under UCMR • Pathogen presence in biofilms
– Biofilm sampling presents a challenge for UCMR
• Could be present in low concentrations – Need to sample large volumes of water
• Presents logistical challenges for UCMR
• Pathogen presence in unconventional locations – Hospital and nursing home hot water tanks and storage tanks
• Public health concern but challenging to monitor
• Some pathogens hard to grow in culture • Risk assessment with PCR data is a challenge
5/10/2013 U.S. Environmental Protection Agency 3

Method Development Rationale • Depends on which pathogen to target for UCMR
monitoring – What is the likelihood of a pathogen being found in finished drinking
water? – Which pathogen has a validated method ready? – Which public health issue to address during UCMR monitoring?
• Outbreaks • Other public health concerns
– Under what conditions do we monitor? • Frequency • Volume of water • Seasonality • Type of public water system
5/10/2013 U.S. Environmental Protection Agency 4

Current Method Development Efforts
• H.pylori • E.coli O157:H7 • Adenovirus • Mycobacterium
5/10/2013 U.S. Environmental Protection Agency 5

Development of Methods to detect H. pylori and E. coli
O157:H7 in Water
CCL Methods Meeting/Webinar Keya Sen,
Technical Support Center, SRMD, OGWDW, OW US EPA
May 15, 2013
5/10/2013 1 U.S. Environmental Protection Agency

Facts about H. pylori • H. pylori a gram negative bacteria
– Causes chronic active and persistent gastritis – Stomach and duodenal ulcers and in few of these cases,
gastric cancer • Approximately 25 Million Americans suffer from the disease
– Each year 500,000 to 850,000 new cases • Culturable from stomach but unculturable from water
– necessitates the use of PCR based methods
5/10/2013 U.S. Environmental Protection Agency 2

H. Pylori Method Development • Analyzes 1 liter of sample collected • Detects a segment of the gene ureA,
conserved in all H. pylori, by qPCR • Uses an internal control which is a process
control and is added to every sample- a Bioball – Confirms whether a sample is a true negative
5/10/2013 3 U.S. Environmental Protection Agency

Detection of H. pylori from Water Collect 1 liter of drinking water. Spike with 10-1000 cells of H. pylori. Add 1 Bioball
Filter through 47mM, 0.4 micron
5/10/2013 4 U.S. Environmental Protection Agency
Extract filter with lysis solution
Remove solution to centrifuge tube.
Extract DNA into 33 µl water. Use 11 µl (x3) for qPCR

Inter-laboratory validation of qPCR method for H. pylori detection
• Five volunteer laboratories selected • Three drinking water samples (1L) tested • One sterile reagent grade water (1L) • 2 levels of spike used
– 15 or 100 cells of H. pylori • BioBall-KS 10 containing 30 cells of E. coli used as
matrix spike (process control)
5/10/2013 U.S. Environmental Protection Agency 5

Initial and Ongoing Precision and Recovery (IPR and OPR) Acceptance Criteria1
Performance test* E. coli KS10 BioBall™ acceptance criteria
Initial precision and recovery (IPR)
• Mean percent recovery 25% - 379% (8-114 gene copies)2
• Precision (as maximum relative standard deviation) 107%
Ongoing precision and recovery (OPR) as percent recovery
Detect - 482% (145 gene copies)
1IPR requires the analysis of 4 reagent-grade water samples; OPR requires the analysis of a single reagent water sample 2One gene copy can be considered to be equivalent to one cell since each E. coli KS10 cell has the target cloned into a single copy plasmid.
5/10/2013 6 U.S. Environmental Protection Agency

E. Coli O157:H7 Method Development
5/10/2013 7 U.S. Environmental Protection Agency

Facts about E. coli O157:H7 • Gram negative bacteria that lives in the guts of ruminants • Causes severe illness
– bloody diarrhea and vomiting – About 10 % develop hemolytic uremic syndrome (HUS) that can
result in non-functioning kidneys • About 95,400 cases each year from E. coli O157:H7 in the US • Bacteria can be cultured from water but can be difficult to identify
– Needs specialized approach
5/10/2013 U.S. Environmental Protection Agency 8

Traditional Methods for Detection of E. coli O157:H7
5/10/2013 9 U.S. Environmental Protection Agency
Filter Water • 0.1L-1L
Enrich filter in broth • Tryptic Soy or Buffered Peptone Water
Immunomagnetic separation • Specific Antibodies
Grow in CT-SMAC or Rainbow Agar with antibiotics
• select colonies with characteristic morphology
Verify by PCR/qPCR •Primers and Probes to virulence factors
Primers and Probes to Structural genes •

Issues With Detection of E. coli O157:H7 by Traditional Methods
5/10/2013 10 U.S. Environmental Protection Agency
False Positivesobtained
• Closely related pathogenic E. coli serotypes having similar phenotypic and genotypic properties Growth of O157:H7 suppressed •
Takes 3-5 days
Labor intensive

•
•
•••
Rapid method
Goals for EPA Method for E. coli O157:H7 Detect in source and drinkingwater within a day
5/10/2013 11 U.S. Environmental Protection Agency
Highly Sensitive
Able to detect 1-5 cells
Highly specific
Able to detect viable cells
No false positives Appropriate QC reagents Allow better risk assessment

Strategy • Add an enrichment medium directly to water sample • Provide conditions for stressed cells (starvation,
chlorination induced), if present , to recover and grow • Perform qPCR before and after enrichment without
isolation of E. coli cells – Change in Ct value from pre to post enrichment will indicate
viable cells – A decrease of 3.3 Ct value corresponds to 1 log increase in
gene copies, if the amplification efficiency is 100%
5/10/2013 12 U.S. Environmental Protection Agency

Development of E. coli O157: H7 qPCR assays
• Searched literature for primers and probes • Tested primers and probes with an ATCC strain • Tested 4 commercially available kits with an ATCC strain • Obtained 61 strains from USDA, FDA and in-house
collection – Tested kits and probes
5/10/2013 U.S. Environmental Protection Agency 13

Selection of Targets/kits • ABI MicroSeq kit produced no false positives
– Targets two non-coding regions on the E. coli genome – Has an internal control for qPCR
• Additional triplex qPCR reaction optimized – Targets genes stx1, stx2, eae – Developed MGB probes
• Additional monoplex assay that targets rfbE gene optimized for confirmation – rfbE specific to O157 serotype – Developed MGB probes
(Environmental Science and Technology (2011): 45, 2250-2256 Sen, K1. Sinclair1, J, Boczek, L2, Rice, E.G3.)
5/10/2013 U.S. Environmental Protection Agency 14

Demonstration of Viability • Bacterial Cells starved for 12- 14 days • Dilutions made, 4-400 cells • Spiked water samples with different dilutions • Added 6X Presence-Absence broth to sample -1 mL aliquot removed and stored at – 200 C (pre-enrichment). • Allowed to grow:35 0C for 18-23 hrs
– 1 mL aliquot removed • DNA extracted from both aliquots
– Centrifuge to pellet cells – Add 100 µL of PrepMan buffer; Heat at 99 0 C
• Perform 3 qPCR assays with 3 µL extract. • Examine whether there is a shift in Ct values from pre to post
enrichment samples
5/10/2013 U.S. Environmental Protection Agency 15

5/10/2013 U.S. Environmental Protection Agency 16
Stx1 Stx2 eae
18 hr 0 hr
Demonstration of Viability
Detects less than 10 cells Examines only 30 µL of sample

Addition of Process Control • Bioball-KS10 used for H. pylori considered good for
the purpose since they are E. coli cells but not expected to occur naturally
• Optimized the number of cells to add • BTF-Biomerieux packaged 5000 cells into Bioball. • Bioball added at the time of extraction • Detected in a separate Monoplex assay,
– Used same primers and probe used in H. pylori assay
5/10/2013 U.S. Environmental Protection Agency 17

5/10/2013 U.S. Environmental Protection Agency 18
SS
ID
Collection to Detection
Collect 1L water
Add 200 mLPresence /Absence broth
Remove 1 mL. Store at -20 0C Grow 1199 mL x 18-23 hrs at 35 0C till yellow.
Remove 2 x 1 mL
Add 1 Bioball-5000 to all three tubes Centrifuge all tubes Remove supernatant Suspend Pellet in PrepMan Buffer
Heat to 950 C x 10 mins Centrifuge tubes x 2 mins
Use 3 µL of supernatant from each tube in 3 qPCR assays
rfbE ABI MicroSeq ( Triplex 1)
tx1, Stx2, eae (Triplex 2) PC (Monoplex)

Testing Method With Field Samples
• Six Surface water tested – Four had pathogenic E. coli – Only one sample had E. coli O157:H7
19 5/10/2013 U.S. Environmental Protection Agency

Inter-laboratory validation of qPCR method for detection
• Five volunteer laboratories selected • Three drinking (ground) water samples (1L) tested by
all 5 labs • One sterile reagent grade water (1L) by all 5 labs • One spike level used <10 cells
5/10/2013 U.S. Environmental Protection Agency 20

Initial and Ongoing Demonstration of Capability (IDC and ODC) Acceptance Criteria
5/10/2013 U.S. Environmental Protection Agency 21
Performance Test Acceptance Criteria Initial Demonstration of Capability ( IDC) (as Ct difference between pre and post enrichment samples). IPR requires the analysis of 4 reagent-grade water samples Target Ct difference Precision (as standard deviation
of Ct difference) MicroSEQ FAM 15.86- 25.21 1.79 MicroSEQ VIC 17.51-23.90 1.49 eae 15.11- 22.85 2.46 stx1 16.42-25.02 2.38 stx2 10.40-29.01 3.85
Ongoing Demonstration of Capability ( IDC) (as Ct difference between pre and post enrichment samples). OPR requires the analysis of a single reagent water sample Target Ct difference
MicroSEQ FAM 15.74-25.33
MicroSEQ VIC 17.44-23.97
eae 13.40-24.56
stx1 14.95-26.49
stx2 10.55-28.86

Conclusions and Next Steps
• Both methods have been developed and validated
• Currently being processed for EPA publication
5/10/2013 U.S. Environmental Protection Agency 22

Office of Research and Development National Exposure Research Laboratory, Cincinnati, Ohio May 2013
G. Shay Fout, Jennifer L. Cashdollar, and Nichole E. Brinkman U.S. Environmental Protection Agency, Cincinnati, OH
Adenovirus Methods: Method 1615 Modification and Small Volume Approach

1 Office of Research and Development National Exposure Research Laboratory, Cincinnati, OH
Presentation Outline
•
•
•
Method 1615
Rationale for the development and enhancement of Method 1615 Method overview Water Cluster modifications
Method performance Small Volume Approaches Method overview and performance
Future development

2
•
•
•
•
EPA Method 1615 Rationale
Office of Research and Development National Exposure Research Laboratory, Cincinnati, OH
Groundwater-Borne Disease Outbreaks in the USA
From 1971 to 2008 there were nearly 846 outbreaks associated with an infectious agent in drinking water; about 50% of the outbreaks were attributable to groundwater
During the same period, 8% of the outbreaks were caused by viruses and another 43% had a likely viral cause
Numerous studies have found human enteric viruses in about 25% of wells studied Two studies focused on small community systems that use untreated groundwater
A study of communities in Southeast Michigan found virus presence in 24% of the wells (Francy et al., 2004) A study of communities in Wisconsin found virus in 95% of the wells (Borchardt et al. 2012)

3
Virus Types, Frequencies, and Concentrations in Tap Water
Virus Type
Number qPCR
Positive Samples
Virus Concentration Genomic copies/L
Number Culture Positive Samples
Mean
Maximum
Adenovirus 157 (13%) 0.07 9.5 40/157 (25%) Enterovirus 109 (9%) 0.8 851.1 31/109 (28%) GI Norovirus 51 (4%) 0.6 115.7 GII Norovirus 0 (0%) 0 0 Hepatitis A 10 (1%) 0.006 4.1 Rotavirus 1 (0.1%) 2 x 10⁻⁵ 0.03 All Viruses 287 (24%) 1.5 853.6
Office of Research and Development National Exposure Research Laboratory, Cincinnati, OH
N = 1,204 samples from 14 Communities; Infectivity was measured on qPCR positive samples only; Reference: Borchardt et al. 2012.

4 Office of Research and Development National Exposure Research Laboratory, Cincinnati, OH
EPA Method 1615 Rationale
• The Wisconsin study demonstrated that 22% of the AGI in the study communities was from virus-contaminated tap water (Borchardt et al. 2012. Environmental Health Perspectives 120:1272-1279)
• For children < 5 yrs in the spring of 2006, the fraction of AGI from norovirus in drinking water was 63%!

5 Office of Research and Development National Exposure Research Laboratory, Cincinnati, OH
EPA Method 1615 Rationale
Virus in U.S. Source Waters Percent Cell Culture Positive Samples Plant Intakes Region East 28 85 South 22 86 Midwest 21 90 West 20 83 Totals 24 87
Average titer all samples: 1.5 MPN/100 L (range: 0-1974)

6 Office of Research and Development National Exposure Research Laboratory, Cincinnati, OH
EPA Method 1615 Enhancement
Adenovirus in Wastewater
Adenovirus Genomic Copies/Liter Raw/Primary Effluent 2,000 – 800,000,000 Tertiary Effluent 930 – 8,900,000 References: Bofill-Mas et al., 2006 Katayama et al., 2008 Dong et al., 2009 Kuo et al., 2010 Hewitt et al., 2011 Sidhu et al., 2013 Brinkman et al., submitted
7
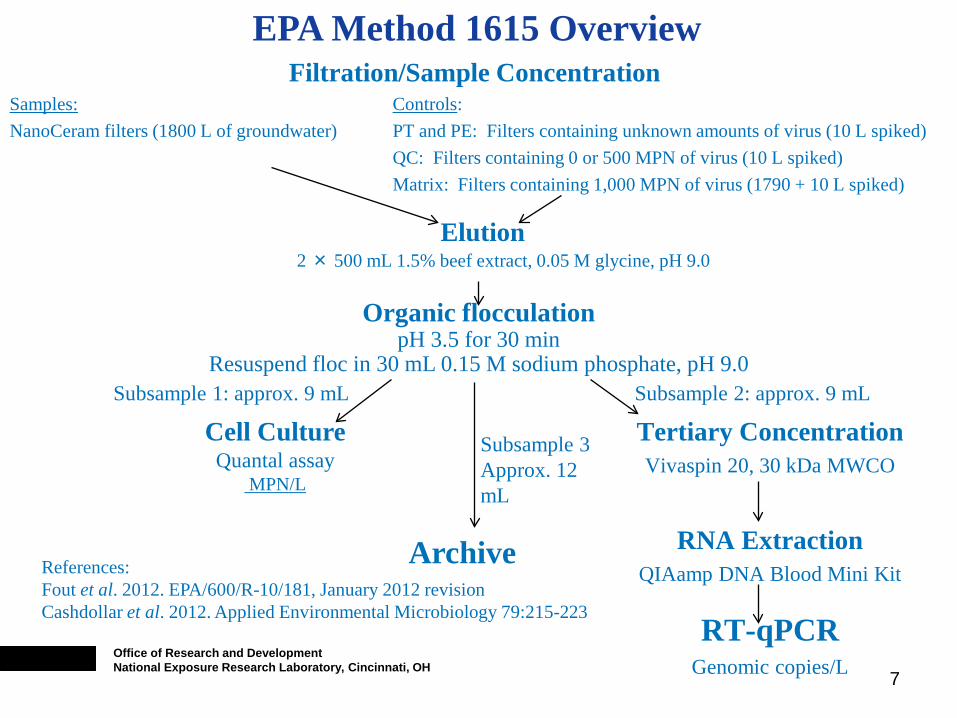
EPA Method 1615 Overview Filtration/Sample Concentration
Samples: Controls: NanoCeram filters (1800 L of groundwater) PT and PE: Filters containing unknown amounts of virus (10 L spiked) QC: Filters containing 0 or 500 MPN of virus (10 L spiked) Matrix: Filters containing 1,000 MPN of virus (1790 + 10 L spiked)
Elution 2 × 500 mL 1.5% beef extract, 0.05 M glycine, pH 9.0
Organic flocculation pH 3.5 for 30 min
Resuspend floc in 30 mL 0.15 M sodium phosphate, pH 9.0 Subsample 1: approx. 9 mL
Cell Culture Quantal assay
MPN/L
Subsample 3 Approx. 12 mL
Office of Research and Development National Exposure Research Laboratory, Cincinnati, OH
Archive
Subsample 2: approx. 9 mL
Tertiary Concentration Vivaspin 20, 30 kDa MWCO
RNA Extraction
QIAamp DNA Blood Mini Kit
RT-qPCR Genomic copies/L
References: Fout et al. 2012. EPA/600/R-10/181, January 2012 revision Cashdollar et al. 2012. Applied Environmental Microbiology 79:215-223

8 Office of Research and Development National Exposure Research Laboratory, Cincinnati, OH
Total Culturable Virus Assay
BGM cells showing early cytopathic effect from poliovirus
QUANTITATION OF TOTAL CULTURABLE VIRUS DATA SHEET Sample Number: Sample 1
Sample Number
Replicates Inoculated
Number with CPE (1)
MPN/mL (2) 95% Confidence
Limits/mL Lower Upper
Undiluted 10 6
1.1 0.4 2.2 1:5 Dilution 0 1:25 Dilution 0 1:125 Dilution 0
D SM = M Lm
L = (1.1 MPN/mL * 8.33 mL)/1800 L = 0.02 MPN/L

9 Office of Research and Development National Exposure Research Laboratory, Cincinnati, OH
Additional Concentration for the Molecular Assay Tertiary Concentration with Vivaspin Concentrators • Fill Vivaspin 20 unit with PBS, 0.2% BSA • Soak overnight at 4 °C. Discard PBS • Rinse with sterile water. Discard water • Add an amount of Subsample 2 = S • Centrifuge at 3,000 – 6,000 x g to a volume
less than 0.4 mL • Add 1 mL of 0.15 M sodium phosphate, pH
7-7.5 • Centrifuge at 3,000 – 6,000 x g to a volume
less than 0.4 mL • Add 1 mL of 0.15 M sodium phosphate, pH
7-7.5 • Centrifuge at 3,000 – 6,000 x g to a volume
less than 0.4 mL • Transfer sample to a 1.5 mL microcentrifuge
tube • Bring to a volume of 400 ± 2 μL

10
Tertiary Concentration
Recovery of Poliovirus and Murine Norovirus Using Vivaspin 20
Office of Research and Development National Exposure Research Laboratory, Cincinnati, OH
Poliovirus Murine Norovirus
30,000 MWCO
80.9% 45.6%
100,000 MWCO
55.1% 26.1%

11
Subsample 2 Reverse Transcription – Quantitative PCR
Volume = S Tertiary Concentration
Nucleic Acid Extraction 0.2 mL
Volume = 0.4 mL
Volume = 100 μL RNA
6.7 μL per replicate 16.5 μL RT Master Mix 1
RT1 RT2 RT3
Step 10.4.9 99°C 99°C 99°C
16.8 μL RT Master Mix 2
Step 10.4.12 42°C 42°C 42°C
qPCR qPCR qPCR Office of Research and Development National Exposure Research Laboratory, Cincinnati, OH

12
Reverse Transcription
Reverse Transcription • Prepare master mixes • Add 16.5 μL RT Mix 1 • Add 6.7 μL of sample • Add 6.7 μL PCR-grade
water as no template controls
• Heat at 99 °C for 4 min
• Quench on ice • Add 16.8 μL RT Mix 2 • Run at 25 °C for 15
min, 42 °C for 60 min, 99 °C for 5 min, hold of 4 °C
Office of Research and Development National Exposure Research Laboratory, Cincinnati, OH
Ingredient Volume per reaction (1)
Final concentration Volume per Master Mix (2)
RT Master Mix 1 Random primer (Item 7.5.11) 0.8 10 ng/μL 84.0 Hepatitis G Armored RNA (3) (Item 7.5.12) 1.0 105.0
PCR grade water (Item 7.5.2) 14.7 1543.5 Total 16.5 1732.5
RT Master Mix 2
10X PCR Buffer II (Item 7.5.13) 4.0 10 mM tris, pH 8.3, 50 mM KCL 420.0
25-mM MgCl2 (Item 7.5.13) 4.8 3 mM 504.0
10-mM dNTPs (Item 7.5.14) 3.2 0.8 mM 336.0
100-mM DTT (Item 7.5.15) 4.0 10 mM 420.0
RNase Inhibitor (Item 7.5.10) 0.5 0.5 units/μL 52.5
SuperScript II RT (Item 7.5.16) 0.3 1.6 units/μL 31.5
Total 16.8 1764.0
(1) The volumes given are for 40-μL RT assays. (2) Reagent amounts sufficient for a 96-well PCR plate are given. The volumes shown were calculated by multiplying the volume per
reaction amount by the number of assays to be performed, plus an additional 9 assays to account for losses during transfer of the master mix to plates (Item 6.6.15) using items 6.6.9 and 6.6.12. The amount of additional assays to add can be reduced if experience shows that lower amounts are adequate.
(3) Hepatitis G Armored RNA is supplied as an untitered stock. The amount to use must be determined for each lot, as described in Step 13.6.1.

13 Office of Research and Development National Exposure Research Laboratory, Cincinnati, OH
Quantitative PCR Ingredient Volume per reaction
(μL) (1) Final concentration Volume per Master Mix
(μL) (2)
2X LightCycler 480 Probes Master Mix
(Item 7.4.17) (3) 10.0 Proprietary 1050.0
ROX reference dye (Item 7.4.18) (4) 0.4 0.5 mM 42.0
PCR grade water (Item 7.4.2) 1.0 105.0
10 μM EntF 0.6 300 nM 63.0
10 μM EntR 1.8 900 nM 189.0
10 μM EntP 0.2 100 nM 21.0
Total 14.0 1470.0
(1) The volumes given are for using 6 μL of cDNA from Step 12.5.3 in a qPCR assay using a total qPCR volume of 20 μL.
(2) Reagent amounts sufficient for a 96-well PCR plate are given. The volumes shown were calculated by multiplying the volume per reaction amount by the number of assays to be performed, plus an additional 9 assays to account for losses during transfer of the master mix to tubes or plates. The amount of additional assays to add can be reduced if experience shows that lower amounts are adequate.
(3) 10X PCR Buffer II , 25-mM MgCl2 , and AmpliTaq Gold can be substituted for the LightCycler 480 Probe Master Mix.
(4) This reagent is necessary for use with Applied Biosystems and similar instruments. It should be substituted with PCR grade water for use with the LightCycler and similar instruments.

14 Office of Research and Development National Exposure Research Laboratory, Cincinnati, OH
Quantitative PCR Standard Curves Using Armored RNA® EPA-1615 • All results must be based upon standard curves run in duplicate on
every RT-qPCR plate • Standard curves are prepared at concentrations of 2.5 x 10⁸ to 2.5 x
103, giving 502,500 to 5 genomic copies per standard • Acceptable standard curves must have a R2 value of > 0.97 and an
efficiency of 80-110% • R2 and slope are calculated by the thermocycler • Efficiency is calculated by the thermocycler or as shown in the
example below • For example, a curve having a slope of -3.29 has a % efficiency of
100 x (10-1/-3.29 -1) = 101.3%

15
NorGIA: y = -3.2032x + 41.422
R² = 0.9931
Nor GIB: y = -3.3328x + 41.144
R² = 0.9969 20.00
25.00
30.00
35.00
40.00
45.00
0 2 4 6
Ct V
alue
Log Copies/Reaction
NorGIA
NorGIB
Armored RNA® EPA-1615 Norovirus GI Standard Curve
Target NorGIA NorGIB
Efficiency 105.4% 99.7%
Theoretical Detection Limit (# Particles) 3 2
Office of Research and Development National Exposure Research Laboratory, Cincinnati, OH

16
Mean Recovery (%) of Spiked Poliovirus and Murine Norovirus from Ground, Surface, and Reagent-Grade Water Samples
Assay
Groundwater n=7
Reagent-Grade Water (High Titerb)
n=6
Reagent-Grade Water (Low Titerc)
n=6
Recovery CVa Recovery CVa Recovery CVa
Total Culturable Virus Assay
58 79 42 34 122 96
Poliovirus RT-qPCR
20 64 48 36 39 29
Murine Norovirus RT-qPCR
30 75 0.6 100 8 83
aCV is % coefficient of variation bHigh titer spike at 1000 MPN of poliovirus and 1000 PFU of murine norovirus per 10 L sample
cLow titer spike at 300 MPN of poliovirus and 300 PFU of murine norovirus per 10 L sample Reference: Cashdollar et al., 2012
Office of Research and Development National Exposure Research Laboratory, Cincinnati, OH
16

17 Office of Research and Development National Exposure Research Laboratory, Cincinnati, OH
Issues with EPA 1615
• Filter clogging in turbid waters • An assay for adenoviruses was not included in the method • Poor virus recovery from turbid waters • Turbid waters have RT-qPCR inhibitors

18
Subobjective 1.A.i. Prefilter and electropositive filter options: Enhance ability to collect required sample volume when testing turbid waters
Subobjective 1.A.ii. Ultrafiltration versus NanoCeram – Determine the relative effectiveness of using ultrafiltration versus the NanoCeram electropositive filter for concentration of secondary and tertiary effluent
Subobjective 1.A.iii. Celite versus NanoCeram – Determine the relative effectiveness of the NanoCeram versus the small volume method
Subobjective 1.A.iv. Addition of Sea Salts – Determine whether the addition of sea salts can enhance recovery of norovirus recovery
Subobjective 1.A.v. Sonification, Dispersants, and Surfactants – Determine if sonication or treatment with dispersants and surfactants will improve recovery as measured by plaque assay and RT-qPCR
Project P1.5.3A.D.1: Improvements, Field Evaluation, and Commercialization of EPA Method 1615
Water Cluster Modifications
Office of Research and Development National Exposure Research Laboratory, Cincinnati, OH

Subobjective 1.B. Dilutions for Samples with High Virus Levels – quantify the loss of precision resulting from the use of 10-fold rather than 5-fold dilutions when assaying samples with high virus titer
Subobjective 1.C. Tertiary Concentration - Large Volume Extraction Option – Examine if virus recoveries can be improved by replacing the tertiary concentration followed by a small volume RNA extraction approach with a large volume RNA extraction
Subobjective 1.D. Inhibitor Removal - Proprietary versus EPA Options: improve ability to remove RT-qPCR inhibitors from turbid waters
Subobjective 2.A. and 2.B. Add an adenovirus culture and molecular assay to 1615
Office of Research and Development National Exposure Research Laboratory, Cincinnati, OH
Water Cluster Modifications

20 Office of Research and Development National Exposure Research Laboratory, Cincinnati, OH
Water Cluster Modifications
Objective 3. Develop a RT-qPCR Commercial Kit and compare it to our current approach
Objective 4. Develop an Infectious Virus RT-qPCR assay using PMA
Objective 5. Measurement of Virus Occurrence • Measure virus in primary, secondary, and tertiary effluents at AAA Wastewater Services, Hamilton Water Reclamation Facility (biological with chlorine treatment), Sycamore Wastewater Treatment Plant (nutrient removal plant), Twin Creek Preserve, and Upper Mill Creek Regional Water Reclamation Facility (biological with UV) • Compare virus occurrence with indicator occurrence

21 Office of Research and Development National Exposure Research Laboratory, Cincinnati, OH
Addition of Adenovirus to Method 1615
Adenovirus Culture Assay using A549 cells
Process Control % Recovery Negative - Positive 1 18 Positive 2 32 Positive 3 28 Positive 4 12 Positive 5 7 Positive 6 3 Positive 7 12 Positive 8 96 Positive 9 29 Mean Recovery 26 CV 108

22 Office of Research and Development National Exposure Research Laboratory, Cincinnati, OH
Addition of Adenovirus to Method 1615
AdV PCR
AdV PCR
AdV PCR

23 Office of Research and Development National Exposure Research Laboratory, Cincinnati, OH
Adenovirus PCR
Prepare Standard Curves for Adenovirus using quantified Adenovirus 5 from OD260, Inc.
y = -3.363x + 36.003 R² = 0.9951
Efficiency = 98.3%
0
5
10
15
20
25
30
35
40
0 1 2 3 4
Standard Curve for Adenovirus

24 Office of Research and Development National Exposure Research Laboratory, Cincinnati, OH
Small Volume Method
Celite Method 1. Add 1.5g of celite to the eluent
2. Drop the pH to 4 and mix for 10-30 minutes
3. Collect celite on a sterile pre-filter
4. Elute virus from celite with 40-80 ml of 0.15M sodium phosphate
5. Adjust pH to 7-7.5. Filter sterilize. Freeze for analysis
Recoveries range from 60-90% for enteroviruses and 65-69% for adenovirus

25 Office of Research and Development National Exposure Research Laboratory, Cincinnati, OH
Future Development
• As part of the Water Cluster Project
Improve virus detection for turbid waters
Test robustness of EPA Method 1615 for measuring virus occurrence at wastewater “End-of-Pipe” settings and in recreational settings
• Test whether the small volume method is scalable to 10 L of secondary or tertiary effluent

Questions?
Although this work was reviewed by EPA and approved for publication, it may not necessarily reflect official Agency policy. Mention of trade names or commercial products does not constitute endorsement or recommendation for use.

Office of Research and Development National Exposure Research Laboratory, Microbial and Chemical Exposure and Assessment Research Division
Photo image area measures 2” H x 6.93” W and can be masked by a collage strip of one, two or three images.
The photo image area is located 3.19” from left and 3.81” from top of page.
Each image used in collage should be reduced or cropped to a maximum of 2” high, stroked with a 1.5 pt white frame and positioned edge-to-edge with accompanying images.
May 15, 2013
Detection Methods for Mycobacteria Stacy Pfaller
Ohio River and Downtown Cincinnati, OH
Disclaimer: This presentation does not necessarily reflect official U.S. EPA policy

Office of Research and Development National Exposure Research Laboratory, Microbial and Chemical Exposure and Assessment Research Division 1
Background
Waterborne illness caused by nontuberculous mycobacteria (NTM) costs the US nearly $500 M in hospitalizations per year (aCollier et al, 2012). Pulmonary NTM infections account for almost half of all NTM hospitalizations in the US, and are typically caused by Mycobacterium avium (MA) and M. intracellulare (MI) In addition to pulmonary infections, cause skin, soft tissue, lymph node, systemic infections, among others Primary source of human exposure: WATERa
CCL’s 1 and 2: Mycobacterium avium Complex (MAC) CCL 3: M. avium
4 subspecies: M. avium subsp. hominissuis
M. avium subsp. avium M. avium subsp. silvaticum M. avium subsp. paratuberculosis
aCollier et al (2012) Epidemiology and Infection, 140: 2003-2013

Office of Research and Development National Exposure Research Laboratory, Microbial and Chemical Exposure and Assessment Research Division 2
Culture and Molecular Methods Culture Method Standard Methods for the Examination of Water and Wastewatera
section 9260M Modifications described in Covert et al (1999) Appl Environ Microbiol
65:2492-2496 Quantitative PCR (qPCR) Beumer et al, (2010) Appl Environ Microbiol 76:7367-7370 and Figure
S1, Supplemental Material http://aem.asm.org/content/76/21/7367/suppl/DC1 Primers and probe for M. avium and M. intracellulare have been
submitted for publication aEaton, A. D., L. S. Clesceri, E. W. Rice, and A. E. Greenberg (ed.). 2005. Standard methods for
the examination of water and wastewater, 21st ed. American Public Health Association, Washington, DC.

Office of Research and Development National Exposure Research Laboratory, Microbial and Chemical Exposure and Assessment Research Division 3
Sample Collection
Sample collection is identical for both culture and qPCR Bulk Water: collected in 1L sterile polypropylene bottles according to sections 9060A and B of Standard Methods for the Examination of Water and Wastewatera, except NO preservative (Na2S2O3).
Biofilm: collected by swabbing surface of tap, pipe, tubing, etc. Samples transported back to lab on ice, stored at 4 °C until processing, within 48 hours.
aEaton, A. D., L. S. Clesceri, E. W. Rice, and A. E. Greenberg (ed.). 2005. Standard methods for the examination of water and wastewater, 21st ed. American Public Health Association, Washington, DC.

Office of Research and Development National Exposure Research Laboratory, Microbial and Chemical Exposure and Assessment Research Division 4
Culture method
1L water split into 2 x 500 ml aliquots or some volume of biofilm slurry (1 – 2 ml typically) cetyl pyridinium chloride (CPC) is added to a final concentration of 0.04% for reduction of background organisms Samples shaken and incubated at room temperature for 30 min Samples filtered through 0.45 um pore-size, 47 mm black-grid, cellulose ester filter by vacuum filtration, washing the filter with sterile deionized water. filter aseptically transferred to Middlebrook 7H10 agar containing 500 mg L-1 cycloheximide Plates are incubated a minimum 8 weeks at 37 °C and inspected weekly for growth

Office of Research and Development National Exposure Research Laboratory, Microbial and Chemical Exposure and Assessment Research Division
QC samples for Culture method
Sterile medium negative control • Performed when medium is made, in advance of samples arriving • Incubation of un-inoculated medium to ensure sterility Method blank negative control • Sterile deionized water filtered processed at the same time in the
same way as unknowns No CPC control, if possible 5

Office of Research and Development National Exposure Research Laboratory, Microbial and Chemical Exposure and Assessment Research Division 6

Office of Research and Development National Exposure Research Laboratory, Microbial and Chemical Exposure and Assessment Research Division
7
Benefits of Culture Method
Many NTM can grow on medium Live only detection Obtain a culture collection for future characterization
•Genotype •Virulence genes
Drawbacks of Culture Method
•
Method has not been characterized for specificity or sensitivity medium is not selective for mycobacteria CPC disinfection may reduce recovery of target by 70% (Personal communication: Terry Covert)
•
Every colony is an unknown in need of identification Only a subset of colonies can be chosen for identification method is not quantitative Months to years before results are obtained Performs poorly on biofilm

Office of Research and Development National Exposure Research Laboratory, Microbial and Chemical Exposure and Assessment Research Division
8
I/MAP-specific
ta Analysis te Quantification
qPCR Method and/or
r Biofilm
MA/M assay
DaAbsolu
Bulk wate
Water/biofilm slurry is vacuum filtered through 47.0 mm, 0.45 um polycarbonate membrane (no CPC treatment necessary) Membrane rolled and placed in 2.0ml tube containing 0.3g glass beads and buffer Microorganisms trapped on membrane lysed physically by bead beating DNA from crude lysate extracted using WaterMaster kit reagents from (EpiCenter Biotechnologies, Madison, WI) DNA resuspended in sterile, molecular biology-grade water Three replicate qPCR reactions analyzed/ DNA extract • Two replicates must be positive for a sample to be
considered positive

Office of Research and Development National Exposure Research Laboratory, Microbial and Chemical Exposure and Assessment Research Division
Absolute Quantification from Master Standard Curves
Generated from six independents series of 10-fold serial dilutions of purified genomic DNA from ATCC Type strains of MA, MI, and MAP Each dilution series contains eight standards, ranging in concentration from 106 target copies to 1 copy, run in triplicate = 18 measurements/ standard CT measurements plotted against log target number and analyzed by linear regression to generate line equation Target number in unknown sample estimated from line equation
9

Office of Research and Development National Exposure Research Laboratory, Microbial and Chemical Exposure and Assessment Research Division
QC Samples for qPCR
•
•
•
•
Method Blank (negative control) Sterile molecular biology grade water or sterile swab filtered and processed at the same time in the same way as unknowns Standards (positive control) Purified genomic DNA from target, serially diluted No Template Control (negative control) Sterile molecular biology grade water added to qPCR reaction instead of DNA extract Internal positive Control (IC) Commercially available kit (TaqMan Exogenous Internal Positive Control Kit, Life Technologies, Carlsbad, CA)
10

Office of Research and Development National Exposure Research Laboratory, Microbial and Chemical Exposure and Assessment Research Division 11
Characteristics of qPCR assays for drinking water and biofilm qPCR assay Target
(copies/ genome)
E¶ Amplification
Efficiency
LOD‡ Targets/qPCR reaction
LOQ† Targets/qPCR reaction
Specificity£ Sensitivity§
Drinking Water
Sensitivity§
Biofilm
M. avium 16S rDNA (1)
1.92 10 10 100% 100 cells/L 1000 cells/swab
M. avium subsp. paratuberculosis
IS900 (14-20)
2.01 1.8 1.8 100% 100 cells/L Not determined
Beumer et al, 2010, Appl Environ Microbiol
Target 251 (1)
Not determined
Not determined
Not determined
95% Not determined
Not determined
M. intracellulare 16S rDNA (1)
1.91 10 10 100% 10 cells/L 1000 cells/swab
¶Amplification Efficiency = 10(1/-slope). If E = 2, the reaction is 100% efficient. ‡LOD = Limit of detection = lowest copy number/assay giving CT < 40 in 6/6 independent assays. †LOQ = Limit of quantification = lowest copy number/assay yielding a coefficient of variation < 25%. £Specificity = Number of target testing positive/total number targets tested x 100. §Sensitivity = lowest copy number detected when spiking serial dilutions of known cell quantities into actual tap water samples, processed as described in Beumer et al, 2010, Appl Environ Microbiol, 76:7367-70

Office of Research and Development National Exposure Research Laboratory, Microbial and Chemical Exposure and Assessment Research Division 12
Benefits of qPCR Method
Assays are specific for MA and MI (CCL) No CPC treatment Time to results = 3 days
Drawbacks of qPCR Method
Assays are specific for MA , MI, and MAP only Cannot distinguish between live and dead organisms though studies
have demonstrated that DNA contained within chlorine disinfected cells does not typically persist in water with a chlorine residual Page et al, 2010, Appl Environ Microbiol, 29:2946-2954 Sen et al, 2010, Current Microbiol, 62:727-732

Office of Research and Development National Exposure Research Laboratory, Microbial and Chemical Exposure and Assessment Research Division
National Occurrence Study using Culture
Covert et al (1999) Appl Environ Microbiol, 65:2492-2496 139 samples – Drinking water (ground and surface water sources) – Bottled water – Cistern – Ice – Reservoir
Results – 1/139 samples positive for MA (drinking water from surface water
source) – 5/139 samples positive for MI (drinking water from surface water
source)
13

Office of Research and Development National Exposure Research Laboratory, Microbial and Chemical Exposure and Assessment Research Division
Occurrence Revisited MJ Study: National Survey of MA and MI Occurrence using Culture and qPCR, 2009-2010
40 sites across the US 68 taps (1 to 2 taps/site)
ground + no treatment = 2 ground + chlorine = 6 ground + chloramine = 1 surface + no treatment = 0 surface + chlorine = 15 surface + chloramine = 12 mixed + chlorine = 2 mixed + chloramine = 2 Samples collected 3 times in 2009,
once in 2010
14
PR

Office of Research and Development National Exposure Research Laboratory, Microbial and Chemical Exposure and Assessment Research Division
qPCR and Culture Results by Site
15
Number of Sites
N = 40
qPCR Culture
Number of Sites
N = 40
9 5 19
7
+ MI Only + MA Only
+ MA & MI
- MA & MI
6 8 6
19
+ MI Only + MA Only
+ MA & MI
- MA & MI

Office of Research and Development National Exposure Research Laboratory, Microbial and Chemical Exposure and Assessment Research Division
qPCR and Culture Results by Tap
16
Number of Taps
N = 68
qPCR Culture
Number of Taps
N = 68
15 9 23
21
+ MI Only + MA Only
+ MA & MI
- MA & MI
7 11 5
45
+ MI Only + MA Only
+ MA & MI
- MA & MI

Office of Research and Development National Exposure Research Laboratory, Microbial and Chemical Exposure and Assessment Research Division
Persistence of MA and MI at taps
17
Number Times Positive Number Times PositiveN
umbe
r Tap
s Po
sitiv
e
0
10
20
30
40
50
60
MAMI
Culture
0 Times 1 Time 2 Times 3 Times 4 Times0 Times 1 Time 2 Times 3 Times 4 Times
qPCR
Num
ber T
aps
Posi
tive
0
10
20
30
40
MAMI

Office of Research and Development National Exposure Research Laboratory, Microbial and Chemical Exposure and Assessment Research Division
Agreement Between Culture and qPCR
Target No. Samples Positive Both Methods
Culture Positive Only
qPCR Positive Only
M. avium 12 16 37 M. intracellulare 11 4 67
18

Office of Research and Development National Exposure Research Laboratory, Microbial and Chemical Exposure and Assessment Research Division
PHASE II Study Leads Susan Glassmeyer(USEPA), Ed Furlong (USGS), and Dana Kolpin(USGS): Occurrence of Contaminants of Emerging Concern at Drinking Water Treatment Plants (DWTPs)
19
EPA Region Number of DWTPs
1 1
2 1
3 4
4 5
5 3
6 5
7 1
8 2
9 2
10 1

Office of Research and Development National Exposure Research Laboratory, Microbial and Chemical Exposure and Assessment Research Division
20
DWTPs positive by qPCR
Twelve DWTPs were positive for MA, MI, and/or MAP by qPCR
Estimated concentrations of MA, MI, and MAP are higher in untreated source water than finished treated water
1 2 3 4 5 6 7 8 9 10 11 12 13 14 15 16 17 18 19 20 21 22 23 24 25
Estim
ated
Tar
gets
L-1
1e+0
1e+1
1e+2
1e+3
1e+4
1e+5
1e+6
MAMIMAP
UNTREATED
Drinking Water Treatment Plant
1 2 3 4 5 6 7 8 9 10 11 12 13 14 15 16 17 18 19 20 21 22 23 24 25
Estim
ated
Tar
gets
L-1
1e+0
1e+1
1e+2
1e+3
1e+4
1e+5MAMI MAP
TREATED

Office of Research and Development National Exposure Research Laboratory, Microbial and Chemical Exposure and Assessment Research Division
Description of qPCR Positive Samples target
N untreated untreated
N
treated treated
geometric mean (target copies/L)
maximum (target copies/L)
geometric mean (target copies/L)
maximum (target copies/L)
M. avium 4 900 5200 2 240 300
M. intracellulare 3 1600 5300 3 40 50 M. avium subsp. paratuberculosis 0 3 20 300
21

Office of Research and Development National Exposure Research Laboratory, Microbial and Chemical Exposure and Assessment Research Division
Culture: NTM isolates from treated water at DWTPs No NTM isolated from untreated
source water samples. • All samples lost prior to 8 week
minimum incubation period for MAC
Thirty one isolates obtained from
treated finished water samples from 6 DWTPs.
• None are MAC though 71% (22/31) have been putatively identified as other clinically relevant NTM species by 16S sequencing
22
6 (27%)
8 (36%)
5 (23%)
M. septicum
M. mucogenicum
M. phocaicum
M. triplex
M. fortuitum
M. lentiflavum
1 (5%)
1 (5%)
1 (5%)

Office of Research and Development National Exposure Research Laboratory, Microbial and Chemical Exposure and Assessment Research Division
Method for Mycobacterium Detection for UCMR?
Both, if possible, as both provide important information qPCR performs well regardless of sample matrix (water or biofilm) Culture does not perform well on microbiologically complex samples (contaminated water and biofilm) but does perform well on samples where microbiological water quality is good (i.g. treated water before distribution)
23
Office of Research and Development National Exposure Research Laboratory, Microbial and Chemical Exposure and Assessment Research Division
Acknowledgments ••••
Dawn King (NERL)
••
•••
Amy Beumer (NERL) Eunice Chern (NERL) Terry Covert (NERL)
Maura Donohue (NERL) Jatin Mistry (EPA Region 6) Susan Glassmeyer (NERL) Ed Furlong (USGS) Dana Kolpin (USGS)
24