overview of sustainable aviation fuels with emission
TRANSCRIPT
energies
Article
Overview of Sustainable Aviation Fuels with EmissionCharacteristic and Particles Emission of the Turbine EngineFueled ATJ Blends with Different Percentages of ATJ Fuel
Paula Kurzawska * and Remigiusz Jasinski
�����������������
Citation: Kurzawska, P.; Jasinski, R.
Overview of Sustainable Aviation
Fuels with Emission Characteristic
and Particles Emission of the Turbine
Engine Fueled ATJ Blends with
Different Percentages of ATJ Fuel.
Energies 2021, 14, 1858. https://doi.
org/10.3390/en14071858
Academic Editor: S M
Ashrafur Rahman
Received: 3 February 2021
Accepted: 23 March 2021
Published: 26 March 2021
Publisher’s Note: MDPI stays neutral
with regard to jurisdictional claims in
published maps and institutional affil-
iations.
Copyright: © 2021 by the authors.
Licensee MDPI, Basel, Switzerland.
This article is an open access article
distributed under the terms and
conditions of the Creative Commons
Attribution (CC BY) license (https://
creativecommons.org/licenses/by/
4.0/).
Faculty of Civil and Transport Engineering, Poznan University of Technology, 60-965 Poznan, Poland;[email protected]* Correspondence: [email protected]
Abstract: The following article focuses on sustainable aviation fuels, which include first and secondgeneration biofuels and other non-biomass fuels that meet most of environmental, operationaland physicochemical requirements. Several of the requirements for sustainable aviation fuels arediscussed in this article. The main focus was on researching the alcohol-to-jet (ATJ) alternative fuel.The tests covered the emission of harmful gaseous compounds with the Semtech DS analyzer, as wellas the number and mass concentration of particles of three fuels: reference fuel Jet A-1, a mixture ofJet A-1 and 30% of ATJ fuel, and mixture of Jet A-1 and 50% of ATJ fuel. The number concentrationof particles allowed us to calculate, inter alia, the corresponding particle number index and particlemass index. The analysis of the results made it possible to determine the effect of the content ofalternative fuel in a mixture with conventional fuel on the emission of harmful exhaust compoundsand the concentration of particles. One of the main conclusion is that by using a 50% blend of ATJand Jet A-1, the total number and mass of particulate matter at high engine loads can be reduced byalmost 18% and 53%, respectively, relative to pure Jet A-1 fuel.
Keywords: alcohol-to-jet; alternative fuel; SAF; emission; particles; particulate matter
1. Introduction
Along with the development of the aviation industry, its share in the emission ofenvironmental pollution has increased. Currently, the aviation industry is responsible foran estimated 2% of global greenhouse gas emissions [1,2]. In 2015, aviation operationsgenerated over 781 million tons of carbon dioxide, and it is expected that by 2050, basedon forecasts of air traffic growth, 2700 million tons of carbon dioxide will be generatedannually [2]. According to forecasts by Airbus, air traffic doubles every 15 years and thenumber of flights increased by 80% between 1990 and 2014 [3,4]. The growing number of airconnections unfortunately significantly affects environmental pollution and the associatedclimate change effects. As a result, many aviation organizations and airlines are takingmeasures to reduce greenhouse gas emissions from the aviation industry, including usingalternative fuels. The increase in interest in alternative fuels is caused not only by climatechange and the impact of burning conventional fuels on the environment, but also by thedepletion of natural resources of crude oil [5], rising oil prices and countries’ dependence ontheir suppliers. The aviation sector wants to ensure security of supply alternative aviationfuels at affordable prices [6]. Alternative fuels obtained from plants or other raw materialswould achieve energy independence from Organization of Petroleum Exporting Countries(OPEC) member states, whose political instability is associated with frequent changes in oilprices [7]. For this reason, more and more countries and airlines are investing in researchto produce sustainable aviation fuels from alternative sources, e.g., used oil, municipalwaste, algae or even plastic. In 2018 the Renewable Energy Directive II (REDII) entered intoforce, which increased targets for the share of renewable fuels in transport from 10% by
Energies 2021, 14, 1858. https://doi.org/10.3390/en14071858 https://www.mdpi.com/journal/energies

Energies 2021, 14, 1858 2 of 18
2020, to 14% by 2030 [8]. Also due to REDII savings of greenhouse gas emissions from useof renewable liquid and gaseous fuels made from non-biological origin in transport fieldshall be at least 70% from the year 2021 [9]. In the aviation field there are currently sevenapproved technologies for the production of alternative aviation fuels, which include forexample hydroprocessed esters, hydroprocessed fermented sugar and alcohols. Alcoholshave a huge potential as alternative fuels, because of their liquid nature, production fromrenewable biomass and high oxygen contents and also high cetane number. Fuels whichcontain oxygen can reduce the combustion chamber parameters, like temperature, andthrough this emission of harmful gaseous compounds can be reduced [10]. Therefore, thework below focuses on the study of the concentration of harmful exhaust compoundsand particles in the engine exhaust, depending on the degree of mixing of the alternativealcohol-to-jet (ATJ) fuel with conventional Jet A-1 fuel.
2. Sustainable Aviation Fuels
Sustainable aviation fuels (SAF) is the principal term used to refer to non-conventionalaviation fuels. Another names are sustainable alternative fuel, biojet or renewable jetfuel [11]. The term sustainable aviation fuels covers not only biofuels, but also fuelsproduced from raw materials other than biomass, such as waste. Biofuels refer to fuelsproduced from raw materials of plant or animal origin, and due to their aggregate state,we divide them into solid, liquid and gas [11]. In the aviation industry, biofuels mainlyrefer to liquid biofuels [2]. In order to qualify as “sustainable” aviation fuels must meet thefollowing criteria [11]:
• Reducing carbon dioxide emissions throughout the life cycle;• Limited need for fresh water;• No need for deforestation and no competition with food production for land for cultivation.
Biofuels used in aviation can be divided into first, second and third generation bio-fuels according to the general division of biofuels. In this analysis of alternative fuels,the 1st generation fuels have been omitted due to the fact that they cannot be called sus-tainable fuels, as their production uses food crops [12]. Second-generation biofuels arefuels obtained from inedible plants or plant waste, which can be grown on less fertile soils,and even on wastelands [13]. This group includes wood and its waste, which containlignocellulosic biomass, organic waste and food waste from agri-food processing [14]. Theydo not compete with food cultivation as they come from a separate biomass, but somebiomass still competes with land use, as it grows in the same climate as food crops [15].Other raw materials, which are not biomass, are currently in the phase of physicochemicalresearch and testing, or test flights are being carried out with their use. Most often it iswaste from households and companies. Research on the use of clothes, bottles, leftoversand newspapers has also been started. The use of municipal solid waste (MSW) has avery large potential, due to the use of raw materials that would be stored and would emitcarbon dioxide, and thanks to re-use they can drive aircraft engines [13]. These are e.g.,fuels produced from municipal waste.
The second-generation raw material is jatropha oil. It is sourced from jatropha seeds,which are poisonous to both humans and animals. 30 to 40% of the seed weight can beobtained from each seed. Jatropha has low soil and climatic requirements, therefore it canbe cultivated in difficult conditions, such as dry and undeveloped areas [14]. As a result, itdoes not compete with food crops for arable land. Jatropha is subjected to the process of oilextraction, which produces bio oil, and then it is treated with hydrogen to obtain a fuelof the hydroprocessed renewable jet (HRJ) type [16]. Another oilseed plant is camellina.It is often cultivated as a crop rotation plant, so like jatropha—it does not compete withfood crops for arable land [13]. It occurs mainly in a temperate climate, in Central Europe,Finland and the United States [17]. The latter is also subjected to an oil extraction processand then treated with hydrogen to obtain HRJ fuel.
Vegetable and animal oils, which are already waste and will not be used further in thefood industry, can also be considered as second-generation biofuels. Used vegetable oils
Energies 2021, 14, 1858 3 of 18
can be treated with hydrogen to make jet fuel. It is currently one of the most promisingraw materials for the production of alternative aviation fuels.
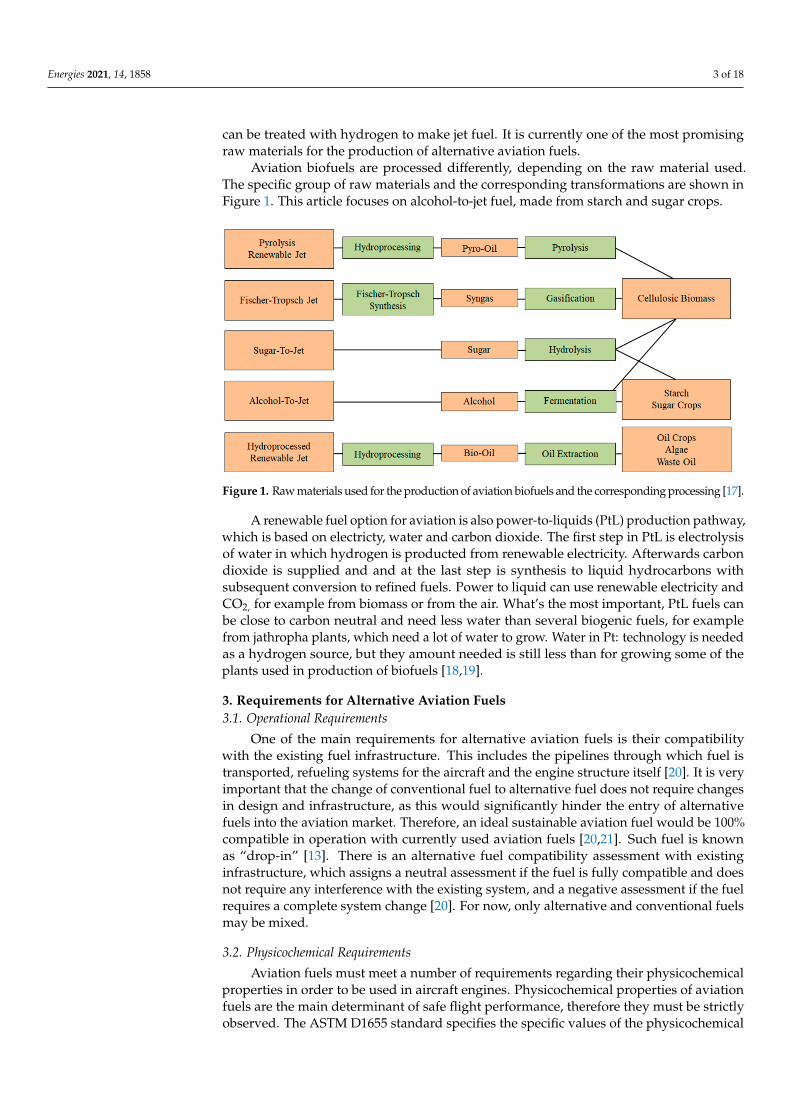
Aviation biofuels are processed differently, depending on the raw material used.The specific group of raw materials and the corresponding transformations are shown inFigure 1. This article focuses on alcohol-to-jet fuel, made from starch and sugar crops.
Figure 1. Raw materials used for the production of aviation biofuels and the corresponding processing [17].
A renewable fuel option for aviation is also power-to-liquids (PtL) production pathway,which is based on electricty, water and carbon dioxide. The first step in PtL is electrolysisof water in which hydrogen is producted from renewable electricity. Afterwards carbondioxide is supplied and and at the last step is synthesis to liquid hydrocarbons withsubsequent conversion to refined fuels. Power to liquid can use renewable electricity andCO2, for example from biomass or from the air. What’s the most important, PtL fuels canbe close to carbon neutral and need less water than several biogenic fuels, for examplefrom jathropha plants, which need a lot of water to grow. Water in Pt: technology is neededas a hydrogen source, but they amount needed is still less than for growing some of theplants used in production of biofuels [18,19].
3. Requirements for Alternative Aviation Fuels3.1. Operational Requirements
One of the main requirements for alternative aviation fuels is their compatibilitywith the existing fuel infrastructure. This includes the pipelines through which fuel istransported, refueling systems for the aircraft and the engine structure itself [20]. It is veryimportant that the change of conventional fuel to alternative fuel does not require changesin design and infrastructure, as this would significantly hinder the entry of alternativefuels into the aviation market. Therefore, an ideal sustainable aviation fuel would be 100%compatible in operation with currently used aviation fuels [20,21]. Such fuel is knownas “drop-in” [13]. There is an alternative fuel compatibility assessment with existinginfrastructure, which assigns a neutral assessment if the fuel is fully compatible and doesnot require any interference with the existing system, and a negative assessment if the fuelrequires a complete system change [20]. For now, only alternative and conventional fuelsmay be mixed.
3.2. Physicochemical Requirements
Aviation fuels must meet a number of requirements regarding their physicochemicalproperties in order to be used in aircraft engines. Physicochemical properties of aviationfuels are the main determinant of safe flight performance, therefore they must be strictlyobserved. The ASTM D1655 standard specifies the specific values of the physicochemical

Energies 2021, 14, 1858 4 of 18
properties of aviation fuels. For alternative aviation fuels was assigned the standard ASTMD7566 [21], shown in Table 1.
Table 1. Physicochemical properties according to ASTM D7566 standard.
No. Property Name Unit of Measure Requirements acc. to ASTM D7566
1 Density at 15 ◦C kg/m3 from 775 to 8402 Viscosity at −20 ◦C mm2/s max 8.03 Viscosity at −40 ◦C mm2/s max 124 Calorific value MJ/kg min 42.85 Aroma content % min 8, max 256 Naphthalene content % max 3.07 Flash-point ◦C min 388 Crystallization temperature ◦C max −47
9
Distillation:Start distillation temperature ◦C -10% distils to temperature ◦C max 205End distillation temperature ◦C max 300Residue % max 1.5Loss % max 1.5
10 Lubricity mm max 0.85
This standard specifies the maximum share of alternative fuels in the mixture con-sisting of conventional and sustainable fuels at the level of 50% in volume terms. Atleast half of the mixture must be Jet A or Jet A-1 fuel [13]. Alternative fuels that meetthe requirements of ASTM D7566 can be used in aircraft engines that require the D1655aviation fuel standard [22]. The approved aviation fuel production methods are presentedin Table 2.
Table 2. Methods of producing alternative fuels approved by the ASTM D7566 standard (own study based on [4,14,23,24]).
Annex Process Raw Material Approval Date Blending Limit
A1 Fischer-Tropsch Synthetic ParaffinicKerosene (FT-SPK)
Biomass (wood waste, grass, municipalsolid waste) 2009 up to 50%
A2 Hydroprocessed Esters and Fatty Acids(HEFA-SPK)
Oily biomass, e.g., algae,jatropha, camelina 2011 up to 50%
A3 Hydroprocessed Fermented Sugars toSynthetic Isoparaffins (HFS-SIP)
Bacterial conversion of sugarsinto hydrocarbons 2014 10%
A4 FT-SPK with aromatics (FT-SPK/A) Renewable biomass, i.e., municipal solidwaste, agricultural and wood waste 2015 up to 50%
A5 Alcohol-to-jet Synthetic ParaffinicKerosene (ATJ-SPK)
Agricultural waste (corn shoots, grass,straw), cellulosic biomass 2016 up to 50%
A6 Catalytic Hydrothermolysis SynthesizedKerosene (CH-SK, or CHJ)
Vegetable or animal fats, oilsand greases 2020 up to 50%
A7Hydroprocessed Hydrocarbons, Esters
and Fatty Acids Synthetic ParaffinicKerosene (HHC-SPK or HC-HEFA-SPK)
Hydrocarbons of biological origin, fattyacid esters, free fatty acids, or a species
of Botryococcus braunia algae2020 up to 10%
3.3. Environmental Requirements
One of the main reasons for studying alternative fuels and looking for new solutionsto power jet engines is the impact of crude oil and its derivatives on the environmentand climate change. Emissions of harmful compounds are related to the physical andchemical properties of fuel [24]. High emissions of carbon dioxide, greenhouse gasesand other harmful substances generated during the combustion of conventional aviationfuels, such as carbon oxides, nitrogen oxides, hydrocarbons and particles, increase theinterest in alternative fuels. Carbon dioxide absorbed by plants during the growth ofbiomass is similar to the amount of carbon dioxide emitted during the combustion offuel from that biomass, which makes it possible to remain neutral in terms of greenhouse

Energies 2021, 14, 1858 5 of 18
gas emissions [13]. Sustainable aviation fuels should enable a significant reduction ingreenhouse gas emissions during their combustion, but also, which is crucial, throughouttheir entire life cycle, from the growth and fertilization of plants and algae, through theirtransport, processing, distribution, and end use in the engine aviation. Life cycle emissionsare mainly related to second and third generation biofuels which are based on plants andalgae that need to be grown for use in the aerospace industry.
By using fuel based on wood biomass, 95% of CO2 can be saved compared to thecurrently used jet fuel. Wood biomass is one of the lowest carbon dioxide emissions per MJof fuel, only algae fuel has a greater one, which in a realistic case could be 98% greenhousegas emissions, and in the best scenario up to 124%, compared to conventional jet fuel. Thisis due to the fact that during their growth and development, algae absorb large amounts ofcarbon dioxide, which in the case of their total CO2 emission, may be below zero. Carbondioxide emissions for other alternative fuels obtained e.g., from conventional oil, jatrophaor animal fuels range from 20% to 90% depending on the raw material used, with the leastpreferred fuel being from oil plants. The above data is indicative of the fact the specificemission value for each of the analyzed fuels depends on the method used for producingthe alternative fuel [25].
4. Experimental
The fuels used during the research were the alternative fuel alcohol to jet synthesizedparaffinic kerosene (ATJ-SPK) from isobutanol and the comparative fuel Jet A-1. Thealternative fuels supplying the engine during the tests were mixed in the following volumeproportions with conventional JetA-1 fuel: 30% ATJ fuel and 50% ATJ fuel. During thetests, the concentration of carbon oxides (CO), carbon dioxide (CO2), hydrocarbons (HC)and nitrogen oxides (NOx) was measured, as well as the concentration of the number ofparticles by particle diameter.
The conventional fuel Jet A-1 is produced during the fractional distillation of crude oil,known as rectification. It is aviation kerosene, i.e., the liquid fraction of distilling crude oilranging from 130 ◦C to about 280 ◦C. Due to the low octane number and simple productiontechnology, it is relatively cheap—cheaper than gasoline or diesel. Jet A-1 is used in civilaviation, and it differs from Jet A mainly in the freezing point, which is −47 ◦C for Jet A-1and −40 ◦C for Jet A [26].
The ATJ alternative fuel can be produced by many different conversion routes, buteach starts with a biomass feedstock. The raw materials used to produce ATJ fuel are, forexample, sugar cane, sugar beet, cereals or lignocellulosic biomass. ATJ fuel is made byconverting alcohols such as methanol, ethanol, butanol and long-chain fatty alcohols. Themaximum use of ethanol in the production of ATJ fuel is 10–15%. ATJ fuels currently usedin aviation and meeting the requirements of ASTM D7566 are isobutanol- and ethanol-based fuels, however Annex A5 (ATJ-SPK) is ultimately to include the use of any alcoholscontaining from two to five carbon atoms [25,27–29]. Use of ATJ fuel in an aircraft enginerequires a maximum of 50% ATJ blend with conventional fuel. The process of convertingalcohol into alcohol-to-jet fuel includes the following processes: isobutanol or ethanoldehydration, oligomerization, hydrogenation and fractionation to obtain a componentwhich is a mixture of hydrocarbon jet fuel (Figure 2) [23].
Figure 2. Simplified diagram of the ATJ-SPK process [30].
According to the European Aviation Environmental Report 2019 prepared by the Eu-ropean Union Aviation Safety Agency (EASA), thanks to the use of ATJ fuel, the percentage

Energies 2021, 14, 1858 6 of 18
reduction in greenhouse gas emissions compared to the use of conventional fuel rangesfrom 26 to 74%, depending on the raw material used in the production. These estimatesdo not take into account the greenhouse gas emissions in the raw material growth phase.In the case of ATJ aviation fuel based on isobutanol, the lowest percentage reduction canbe achieved by using maize grain as a raw material (54%), and the highest by using forestresidues (74%). On the other hand, in the case of ATJ fuel obtained from ethanol, the lowestreduction in greenhouse gas emissions can be obtained by using corn kernel as a rawmaterial (26%), and the highest—sugar cane (69%). Table 3 presents the physicochemicalproperties of the tested fuels [4].
Table 3. Physicochemical properties of tested fuels [own study based on [31,32].
Property Jet A-1[According to ASTM D1655 Standard] ATJ-SPK 50/50% v
ATJ-SPK and Jet A-1
Crystallization temperature [◦C] −47 −61 −54
Flash point [◦C] min 38 48 min 38
Calorific value [MJ/kg] 42.8 43.2 43.8
Total sulfur content [%] max 0.3 <0.01 0.02
Aromas content [%] 17.3 0 8.8
The tests were carried out on a GTM-120 miniature turbine engine, made of a centrifu-gal compressor, diffuser, annular combustion chamber with pre-vaporising tubes, turbinenozzle, turbine wheel and nozzle cone. The engine is started by a starter. The technicalparameters of the described engine are presented in Table 4.
Table 4. Technical parameters of the GTM-120 engine.
Maximum thrust [N] 100Fuel consumption (for maximum thrust)
[g/min] 520
Length [mm] 340Width [mm] 115Weight [kg] 1.5
The Semtech DS analyzer from Sensors Company (city, state abbrev if USA, country)was used to measure the concentration of gaseous exhaust compounds. This analyzermeasures the concentration of nitrogen oxides, hydrocarbons, carbon monoxide and carbondioxide. The exhaust gases from the GTM-120 engine were fed to the analyzer via a probeplaced 3 cm from the outlet nozzle and a cable with a temperature of 191 ◦C, required tomeasure the concentration of hydrocarbons in the flame ionization analyzer. Then aftercooling the exhaust gases to the temperature of 4 ◦C, measurements of the concentrationsof carbon monoxide, carbon dioxide and nitrogen oxides were carried out. The SemtechDS analyzer includes the following measurement modules [32]:
• A flame ionization detector (FID), which uses the change of electric potential result-ing from the ionization of molecules in the flame; it is used to determine the totalconcentration of hydrocarbons,
• A non-dispersive ultraviolet (NDUV) analyzer that uses ultraviolet radiation to mea-sure the concentration of nitrogen oxide and dioxide
• A non-dispersive infrared (NDIR) analyzer using radiation infrared to measure theconcentration of carbon monoxide and dioxide, and
• An electrochemical analyzer for determining the oxygen concentration in the ex-haust gas.
At the same time, the particle number concentration was measured using an EEPS3090 (Engine Exhaust Particulate Sizer™ spectrometer) analyzer from TSI Incorporated
Energies 2021, 14, 1858 7 of 18
(city, state abbrev if USA, country). This analyzer measures the discrete range of particlediameters from 5.6 nm to 560 nm [32,33]. The exhaust gas was directed to the analyzerthrough a dilution system, where the total flow was 10 l/min, including the exhaust gasflow 0.3 l/min, so the exhaust gas in the tested sample accounted for 3%. Technical data ofthe EEPS 3090 analyzer are presented in Table 5.
Table 5. Technical data of the EEPS 3090 analyzer [33].
Parameters Value
Diameter of the measured particles 5.6–560 nm
Number of measurement channels 16 channels per decade
Resolution 10 Hz
Exhaust sample volume flow rate 0.6 m3/h
Compressed air volume flow rate 2.4 m3/h
Input sample temperature 10–52 ◦C
The measuring range was from 10 to 100 N, and the measurements were madeevery 10 N. In order to clearly present the results, after the measurements, the measuringrange was reduced to the following three ranges: low engine operation load from 10 to30 N, medium engine operation load from 40 to 60 N and high engine operation loadranging from 70 to 100 N (Table 6). Measurement results were averaged in each of theexamined areas.
Table 6. Measurement ranges for engine operation load and their values.
Range NameEngine Operation Load Range [N]
Up To
Low 10 30Medium 40 60
High 70 100
5. Results and Discussion5.1. Concentration of Harmful Exhaust Gas Compounds
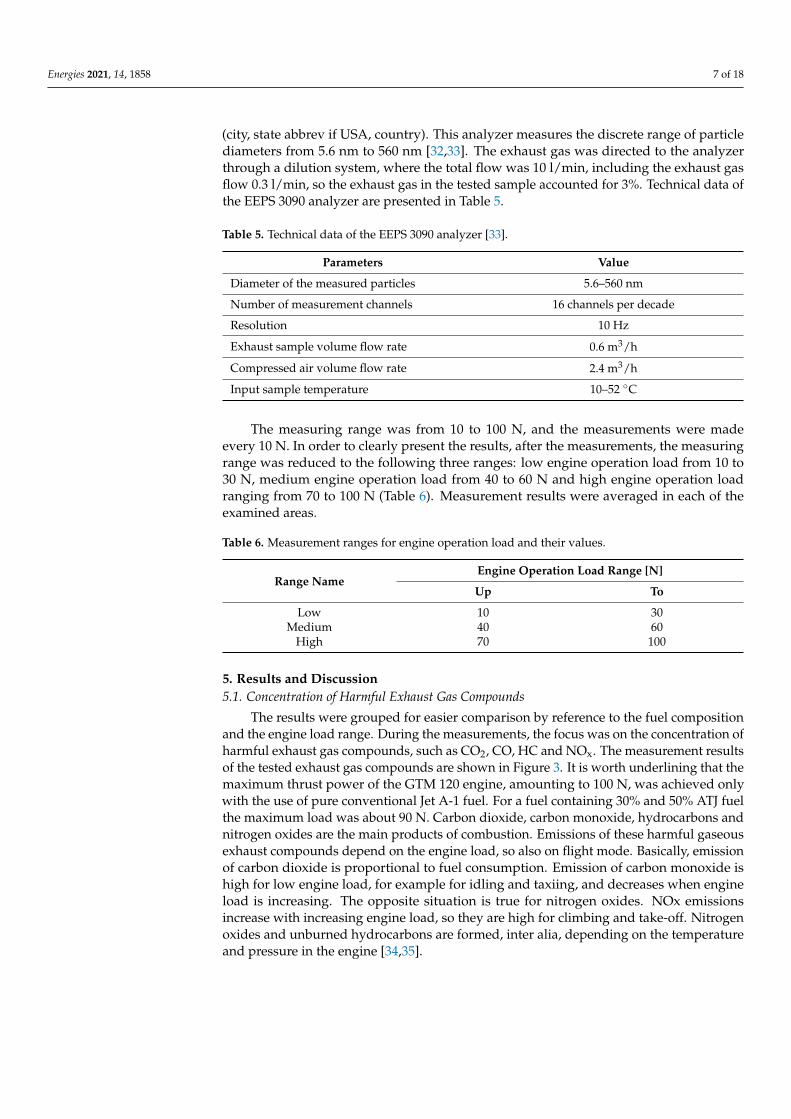
The results were grouped for easier comparison by reference to the fuel compositionand the engine load range. During the measurements, the focus was on the concentration ofharmful exhaust gas compounds, such as CO2, CO, HC and NOx. The measurement resultsof the tested exhaust gas compounds are shown in Figure 3. It is worth underlining that themaximum thrust power of the GTM 120 engine, amounting to 100 N, was achieved onlywith the use of pure conventional Jet A-1 fuel. For a fuel containing 30% and 50% ATJ fuelthe maximum load was about 90 N. Carbon dioxide, carbon monoxide, hydrocarbons andnitrogen oxides are the main products of combustion. Emissions of these harmful gaseousexhaust compounds depend on the engine load, so also on flight mode. Basically, emissionof carbon dioxide is proportional to fuel consumption. Emission of carbon monoxide ishigh for low engine load, for example for idling and taxiing, and decreases when engineload is increasing. The opposite situation is true for nitrogen oxides. NOx emissionsincrease with increasing engine load, so they are high for climbing and take-off. Nitrogenoxides and unburned hydrocarbons are formed, inter alia, depending on the temperatureand pressure in the engine [34,35].
Energies 2021, 14, 1858 8 of 18
Figure 3. Emission index for (a) carbon monoxide; (b) hydrocarbons; (c) nitrogen oxides.
The emission of harmful gaseous compounds was presented in the form of emissionfactors related to the emission of carbon dioxide during each measurement. Comparing theemissions of carbon monoxide (Figure 3a) with CO2 emissions at low and medium engineoperation load, it was found that it is the lowest for pure Jet A-1 fuel, while in the case ofhigh engine operation load for Jet A-1 fuel it is the highest, compared to other tested fuels.Carbon monoxide emissions for between 30% and 50% ATJ fuel do not differ significantlyover the entire operating range of the engine. The difference between Jet A-1 and 50%ATJ for low engine operation load is 23% and for medium engine operation load it is 25%,when the emission was higher for 50% ATJ. In turn comparing high engine operation load,emissions of CO related to CO2 were the lowest for 50% ATJ and about 8% lower than forJet A-1.
On the other hand, in the case of hydrocarbon emissions (Figure 3b), for low engineoperation load, the highest HC emission is shown for fuel with 30% ATJ content, while atmedium and high engine operation load it is for fuel with 50% ATJ content. For low engineoperation load the difference between 30% ATJ and Jet A-1 is 40% and between 30% ATJand 50% ATJ is 36%. In turn for high engine operation load difference between the highestemission for 50% ATJ and Jet A-1 is 16% in favor of the Jet A-1 fuel.
Comparing the emission of nitrogen oxides (Figure 3c), it was found that the lowestemissions occur for the pure conventional fuel Jet A-1 in the entire engine operation range,while the highest carbon oxide emission per CO2 emission occurs for the fuel with 50% ATJcontent in the entire engine operation range. The differences between Jet A-1 and 50% ATJare respectively 31% for low load engine operation, 76% for medium load and 57% for highload engine operation. In this case, increasing the content of alternative fuel Alcohol-to-Jetin the mixture of Jet A-1 and ATJ is expected to increase the emission of nitrogen oxides.

Energies 2021, 14, 1858 9 of 18
5.2. Particles Concentration
Based on the obtained data for the particle number concentration, the characteristicsof the mass concentration of particles depending on their diameter were calculated. Forthe calculation the solids density characteristic was used (Figure 4), which decreases withincreasing particle diameter. The particle density function was determined empirically onthe basis of the CFM56-7B26/3 aviation engine [36–38]. Knowing the diameter of particles,it was possible to calculate the mass of particulate matter by using the density and volumeof the particles.
1
Figure 4. Density of solid particles depending on their diameter [32].
5.2.1. Low Engine Load
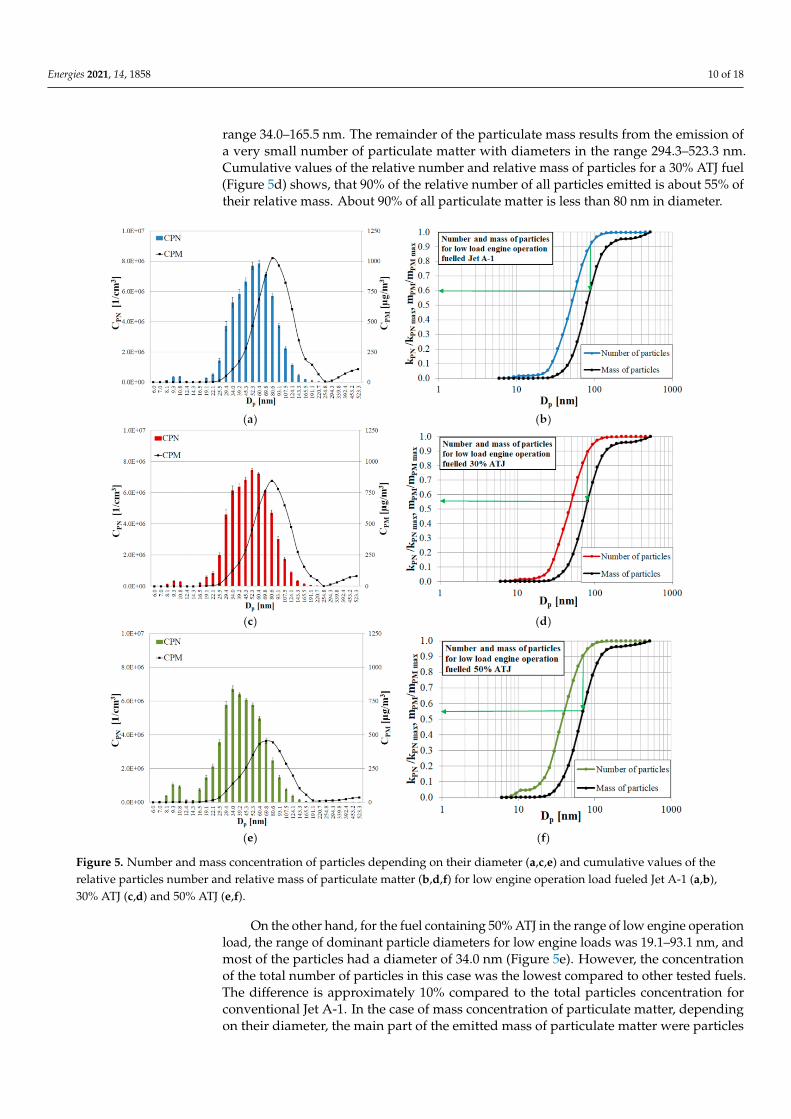
Figure 5 shows the number and mass concentration of particles depending on theirdiameter (first column) and cumulative values of the relative particle number and relativemass of particulate matter (second column) for low load engine operation fueled Jet A-1(first row), 30% ATJ (second row) and 50% ATJ (third row). The cumulative curves weredetermined by standardizing the obtained data for the number and mass of particulatematter to the value 1 and using the connection between the quotient of the number ofparticles and the maximum number of particles as well as the quotient of the mass ofparticles and the maximum mass of particles.
In the case of particles in the exhaust of an engine running on clean fuel Jet A-1(Figure 5a), for low engine operation load, particles with 25.5–124.1 nm diameter domi-nated. The characteristic diameter, i.e., the highest number of particles, of the discussednumber concentration characteristic was about 60.4 nm. Based on the characteristics ofthe mass concentration of particulate matter for Jet A-1 fuel at low engine operation load,the vast majority of the mass of particulate matter was due to particles with a diameterof 25.5–220.7 nm. The remainder of the particulate mass results from the emission of avery small amount of particulate matter with diameters in the 294.3–523.3 nm range. Atlow engine operation load fueled Jet A-1 (Figure 5b) the cumulative values of the relativeparticles number and relative mass of particulate matter show that 90% of the relativenumber of all particles emitted corresponds to 60% of their relative mass. About 90% of allparticles are less than 100 nm in diameter.
In the case of low engine operation loads ranging from 10 N to 30 N for the fuelwith 30% ATJ content (Figure 5c), the particle diameters of 25.5–107.5 nm dominated,and the majority were the particles with a diameter of 52.3 nm. Compared to the totalparticles concentration for Jet A-1, the 30% ATJ fuel had a slight reduction in total particlecount. The main part of the emitted mass was particulate matter with diameters in the
Energies 2021, 14, 1858 10 of 18
range 34.0–165.5 nm. The remainder of the particulate mass results from the emission ofa very small number of particulate matter with diameters in the range 294.3–523.3 nm.Cumulative values of the relative number and relative mass of particles for a 30% ATJ fuel(Figure 5d) shows, that 90% of the relative number of all particles emitted is about 55% oftheir relative mass. About 90% of all particulate matter is less than 80 nm in diameter.
Figure 5. Number and mass concentration of particles depending on their diameter (a,c,e) and cumulative values of therelative particles number and relative mass of particulate matter (b,d,f) for low engine operation load fueled Jet A-1 (a,b),30% ATJ (c,d) and 50% ATJ (e,f).
On the other hand, for the fuel containing 50% ATJ in the range of low engine operationload, the range of dominant particle diameters for low engine loads was 19.1–93.1 nm, andmost of the particles had a diameter of 34.0 nm (Figure 5e). However, the concentrationof the total number of particles in this case was the lowest compared to other tested fuels.The difference is approximately 10% compared to the total particles concentration forconventional Jet A-1. In the case of mass concentration of particulate matter, dependingon their diameter, the main part of the emitted mass of particulate matter were particles
Energies 2021, 14, 1858 11 of 18
with a diameter of 25.5–165.5 nm. The remainder of the particulate mass results fromthe emission of a very small number of particulate matter with diameters ranging from254.8–523.3 nm. The total particulate mass concentration for the fuel containing 50% ATJwas 51% lower than the total particulate mass concentration for the Jet A-1 fuel in thediscussed engine operating range. For a fuel containing 50% ATJ (Figure 5f), cumulativevalues of the relative number and relative mass of particles shows that 90% of the relativenumber of all particulate matter emitted is about 55% of their relative mass. About 90% ofall particulate matter is less than 70 nm in diameter.
5.2.2. Medium Engine Load
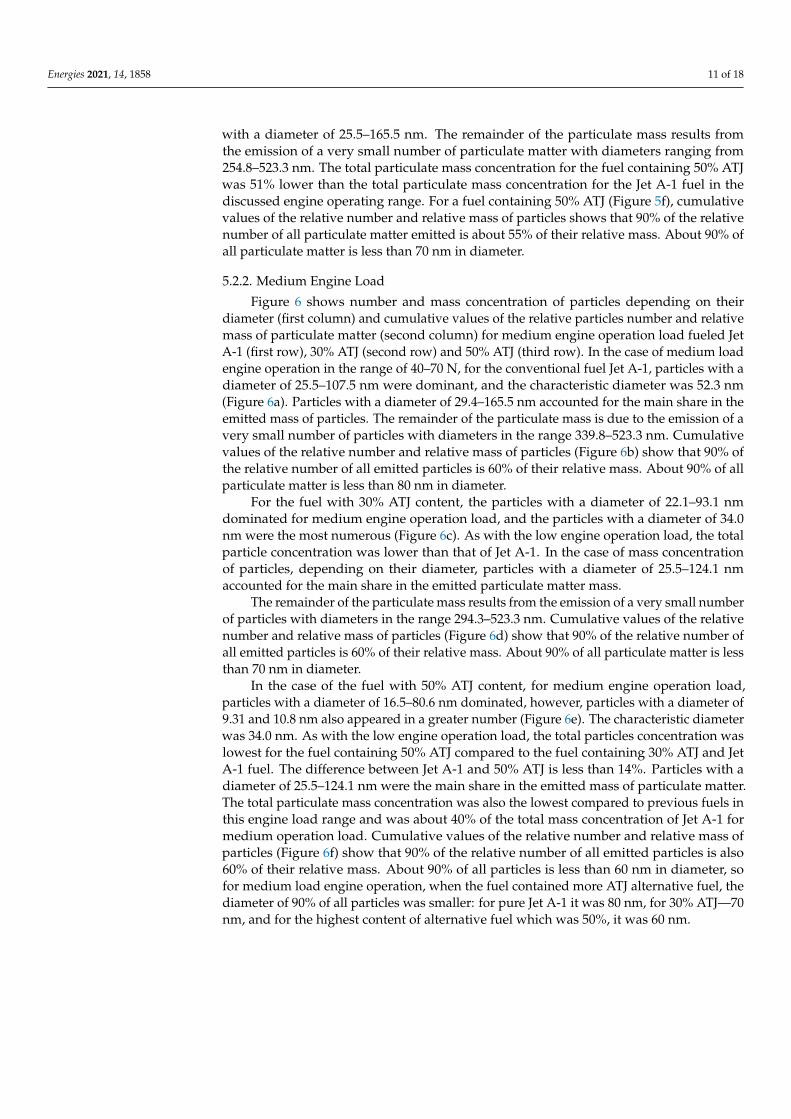
Figure 6 shows number and mass concentration of particles depending on theirdiameter (first column) and cumulative values of the relative particles number and relativemass of particulate matter (second column) for medium engine operation load fueled JetA-1 (first row), 30% ATJ (second row) and 50% ATJ (third row). In the case of medium loadengine operation in the range of 40–70 N, for the conventional fuel Jet A-1, particles with adiameter of 25.5–107.5 nm were dominant, and the characteristic diameter was 52.3 nm(Figure 6a). Particles with a diameter of 29.4–165.5 nm accounted for the main share in theemitted mass of particles. The remainder of the particulate mass is due to the emission of avery small number of particles with diameters in the range 339.8–523.3 nm. Cumulativevalues of the relative number and relative mass of particles (Figure 6b) show that 90% ofthe relative number of all emitted particles is 60% of their relative mass. About 90% of allparticulate matter is less than 80 nm in diameter.
For the fuel with 30% ATJ content, the particles with a diameter of 22.1–93.1 nmdominated for medium engine operation load, and the particles with a diameter of 34.0nm were the most numerous (Figure 6c). As with the low engine operation load, the totalparticle concentration was lower than that of Jet A-1. In the case of mass concentrationof particles, depending on their diameter, particles with a diameter of 25.5–124.1 nmaccounted for the main share in the emitted particulate matter mass.
The remainder of the particulate mass results from the emission of a very small numberof particles with diameters in the range 294.3–523.3 nm. Cumulative values of the relativenumber and relative mass of particles (Figure 6d) show that 90% of the relative number ofall emitted particles is 60% of their relative mass. About 90% of all particulate matter is lessthan 70 nm in diameter.
In the case of the fuel with 50% ATJ content, for medium engine operation load,particles with a diameter of 16.5–80.6 nm dominated, however, particles with a diameter of9.31 and 10.8 nm also appeared in a greater number (Figure 6e). The characteristic diameterwas 34.0 nm. As with the low engine operation load, the total particles concentration waslowest for the fuel containing 50% ATJ compared to the fuel containing 30% ATJ and JetA-1 fuel. The difference between Jet A-1 and 50% ATJ is less than 14%. Particles with adiameter of 25.5–124.1 nm were the main share in the emitted mass of particulate matter.The total particulate mass concentration was also the lowest compared to previous fuels inthis engine load range and was about 40% of the total mass concentration of Jet A-1 formedium operation load. Cumulative values of the relative number and relative mass ofparticles (Figure 6f) show that 90% of the relative number of all emitted particles is also60% of their relative mass. About 90% of all particles is less than 60 nm in diameter, sofor medium load engine operation, when the fuel contained more ATJ alternative fuel, thediameter of 90% of all particles was smaller: for pure Jet A-1 it was 80 nm, for 30% ATJ—70nm, and for the highest content of alternative fuel which was 50%, it was 60 nm.

Energies 2021, 14, 1858 12 of 18
Figure 6. Number and mass concentration of particles depending on their diameter (a,c,e) and cumulative values of therelative particles number and relative mass of particulate matter (b,d,f) for medium engine operation load fueled Jet A-1(a,b), 30% ATJ (c,d) and 50% ATJ (e,f).
5.2.3. High Engine Load
At high engine operation load (Figure 7), for each of the tested fuel, an increase in theconcentration of the total number of particles was found. In the case of Jet A-1 fuel, particleswith a diameter of 16.5–107.5 nm dominated for high engine load (Figure 7a). As can beseen, with increasing engine load, the diameter of the dominant particles decreased. Forlow and medium engine operation load, the most were particles with a diameter of 60.4 nm,while for high engine operation load, the most were particles with a diameter of 34.0 nm.However, the total number of particles is incomparably the highest at high engine operationload. On the other hand, the main part of the emitted mass of particulate matter wereparticles with diameters of 25.5–143.3 nm, and the remaining part of the mass of particulatematter results from the emission of a very small number of particles with diameters in therange of 294.3–523.3 nm. Cumulative values of the relative number and relative mass of

Energies 2021, 14, 1858 13 of 18
particles (Figure 7b) show that 90% of the relative number of all emitted particles is also60% of their relative mass. About 90% of all particles is less than 70 nm in diameter.
Figure 7. Number and mass concentration of particles depending on their diameter (a,c,e) and cumulative values of therelative particles number and relative mass of particulate matter (b,d,f) for high engine operation load fueled Jet A-1 (a,b),30% ATJ (c,d) and 50% ATJ (e,f).
For the fuel with 30% ATJ fuel content, particles with a diameter of 22.1–93.1 nmdominated at high engine operation load (Figure 7c), and the most were particles witha diameter of 34.0 nm, similar to the medium engine operation load. In the case of theparticulate matter mass concentration, depending on their diameter, the main fraction ofthe emitted particulate matter mass were particles with a diameter of 25.5–143.3 nm. Theremainder of the particulate matter mass results from the emission of a very small numberof particles with diameters in the 254.8–523.3 nm range. Cumulative values of the relativenumber and relative mass of particles (Figure 7d) show that 90% of the relative number of
Energies 2021, 14, 1858 14 of 18
all emitted particles is also 60% of their relative mass. About 90% of all particles is also lessthan 70 nm in diameter.
On the other hand, when analyzing the numerical and mass concentration of particlesfor a 50% mixture of ATJ and Jet A-1 fuel (Figure 7e), it was found that in this case thenumerical distribution of particles depending on the particle diameter in the entire engineoperating range differs the most compared to the previous fuels. The range of diameters ofthe dominant particles for high loads was 16.5–80.6 nm, but there were also more particleswith a diameter of 9.31 and 10.8 nm. The characteristic particle diameter was 34.0 nm. Thetotal particle number concentration was approximately 18% lower than the total particlenumber concentration for conventional Jet A-1 fuel in the described engine operating range.In turn, the main part of the emitted mass of particulate matter were particles with adiameter of 22.1–124.1 nm. The total particulate mass concentration was 51% of the totalJet A-1 fuel mass concentration at the high engine operation load. Cumulative values ofthe relative number and relative mass of particles (Figure 7f) show that 90% of the relativenumber of all emitted particles is also 60% of their relative mass. About 90% of all particlesis less than 55 nm in diameter.
5.2.4. Analysis of the Results
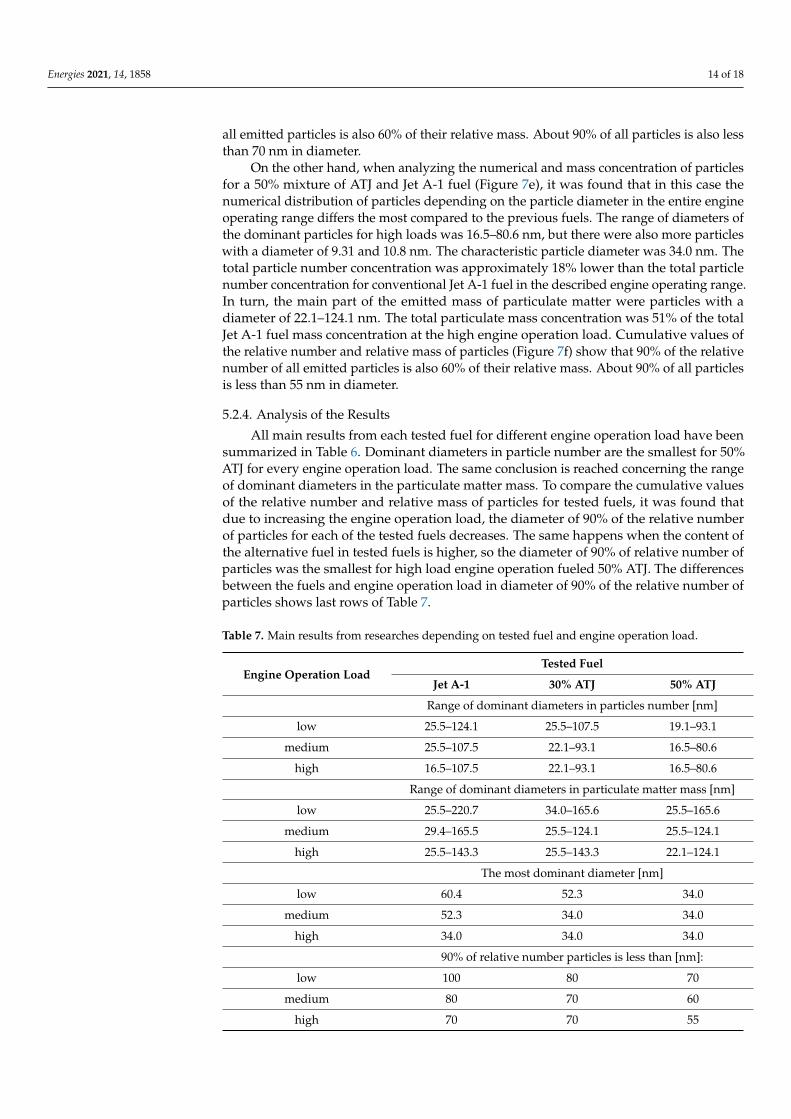
All main results from each tested fuel for different engine operation load have beensummarized in Table 6. Dominant diameters in particle number are the smallest for 50%ATJ for every engine operation load. The same conclusion is reached concerning the rangeof dominant diameters in the particulate matter mass. To compare the cumulative valuesof the relative number and relative mass of particles for tested fuels, it was found thatdue to increasing the engine operation load, the diameter of 90% of the relative numberof particles for each of the tested fuels decreases. The same happens when the content ofthe alternative fuel in tested fuels is higher, so the diameter of 90% of relative number ofparticles was the smallest for high load engine operation fueled 50% ATJ. The differencesbetween the fuels and engine operation load in diameter of 90% of the relative number ofparticles shows last rows of Table 7.
Table 7. Main results from researches depending on tested fuel and engine operation load.
Engine Operation LoadTested Fuel
Jet A-1 30% ATJ 50% ATJ
Range of dominant diameters in particles number [nm]
low 25.5–124.1 25.5–107.5 19.1–93.1
medium 25.5–107.5 22.1–93.1 16.5–80.6
high 16.5–107.5 22.1–93.1 16.5–80.6
Range of dominant diameters in particulate matter mass [nm]
low 25.5–220.7 34.0–165.6 25.5–165.6
medium 29.4–165.5 25.5–124.1 25.5–124.1
high 25.5–143.3 25.5–143.3 22.1–124.1
The most dominant diameter [nm]
low 60.4 52.3 34.0
medium 52.3 34.0 34.0
high 34.0 34.0 34.0
90% of relative number particles is less than [nm]:
low 100 80 70
medium 80 70 60
high 70 70 55
Energies 2021, 14, 1858 15 of 18
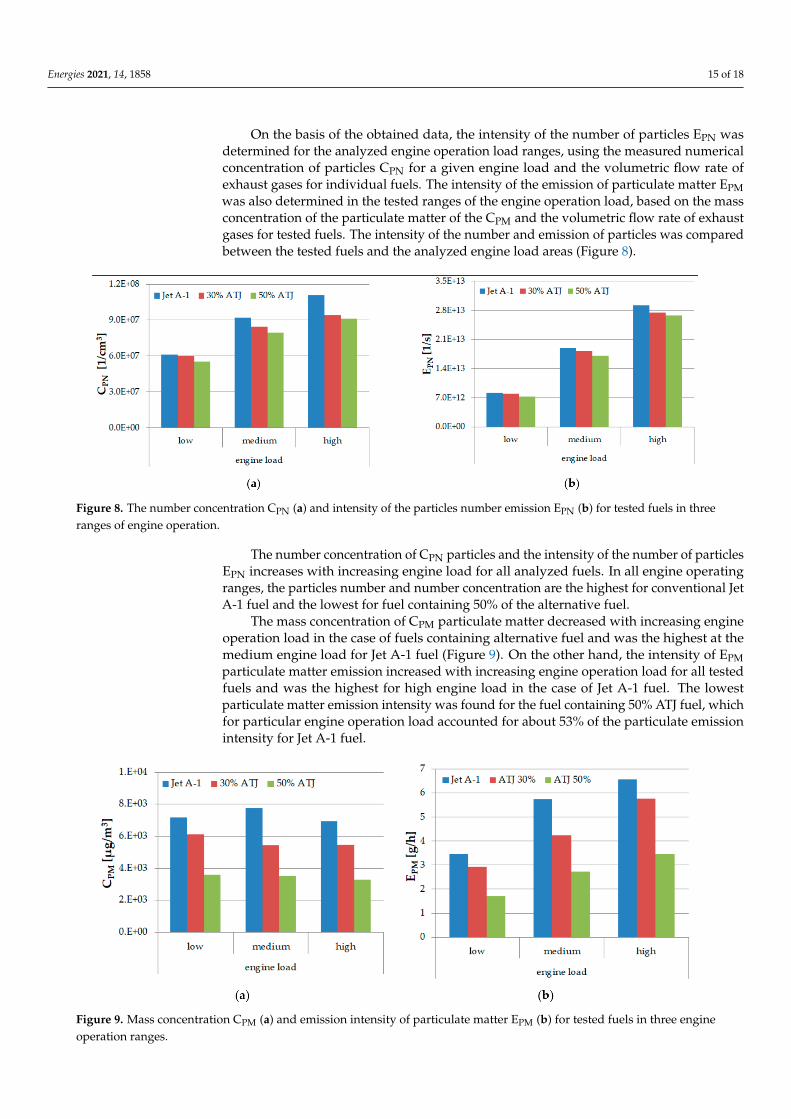
On the basis of the obtained data, the intensity of the number of particles EPN wasdetermined for the analyzed engine operation load ranges, using the measured numericalconcentration of particles CPN for a given engine load and the volumetric flow rate ofexhaust gases for individual fuels. The intensity of the emission of particulate matter EPMwas also determined in the tested ranges of the engine operation load, based on the massconcentration of the particulate matter of the CPM and the volumetric flow rate of exhaustgases for tested fuels. The intensity of the number and emission of particles was comparedbetween the tested fuels and the analyzed engine load areas (Figure 8).
Figure 8. The number concentration CPN (a) and intensity of the particles number emission EPN (b) for tested fuels in threeranges of engine operation.
The number concentration of CPN particles and the intensity of the number of particlesEPN increases with increasing engine load for all analyzed fuels. In all engine operatingranges, the particles number and number concentration are the highest for conventional JetA-1 fuel and the lowest for fuel containing 50% of the alternative fuel.
The mass concentration of CPM particulate matter decreased with increasing engineoperation load in the case of fuels containing alternative fuel and was the highest at themedium engine load for Jet A-1 fuel (Figure 9). On the other hand, the intensity of EPMparticulate matter emission increased with increasing engine operation load for all testedfuels and was the highest for high engine load in the case of Jet A-1 fuel. The lowestparticulate matter emission intensity was found for the fuel containing 50% ATJ fuel, whichfor particular engine operation load accounted for about 53% of the particulate emissionintensity for Jet A-1 fuel.
Figure 9. Mass concentration CPM (a) and emission intensity of particulate matter EPM (b) for tested fuels in three engineoperation ranges.

Energies 2021, 14, 1858 16 of 18
The WPN and WPM coefficients were also determined, which determine the numberand mass of particles, respectively, formed from one kilogram of fuel consumed by theengine. The values of the discussed coefficients are shown in Figure 10. Based on thecharts below, it was found that the highest average number of particles is generated whenthe engine is fueled with conventional Jet A-1 fuel and at high engine operation load itamounts to 7.45 × 10¹⁵ units (Figure 10a). On the other hand, for high engine load thelowest average number of particles per kilogram of fuel used is for fuel containing 50% ATJfuel and it amounts to 5.05 × 10¹⁵ units, thus it is about 32% lower than for Jet A-1. In thecase of the particulate matter mass coefficient (Figure 10b), the highest mean value of thecoefficient was equal to 0.53 for Jet A-1 fuel for medium engine loads, and the lowest forfuel containing 50% ATJ for high engine loads. The largest difference between the averagevalue of the particulate matter mass factor, amounting to 63%, was found at the mediumengine operation load between Jet A-1 fuel and the fuel containing 50% ATJ.
Figure 10. Particle number index WPN (a) and particle mass index WPM (b) for tested fuels in three engine load ranges.
6. Conclusions
Given the problems that the aviation industry is currently facing, the development ofalternative fuels to power aircraft is inevitable. Over the past 10 years, over 200,000 flightshave already been made using alternative fuels. Thanks to constant research and newsolutions, the biofuels and sustainable fuels sector is constantly developing. In relationto the research carried out, using alternative fuel based on alcohol which is ATJ fuel, canhave positive impact on the concentration of number and mass of particles compared to JetA-1, but also negative impact on the emission of harmful gaseous compounds. It is crucialthat the maximum engine load for a mixture of 30% ATJ and Jet A-1 and 50% ATJ andJet A-1 was about 90% of maximum engine load for pure Jet A-1. Thus when comparingthe emission of gaseous compound and particulate matter, attention should also be paidto the maximum achievable engine load for a given fuel mixture. For nitrogen oxides,hydrocarbons and carbon monoxide increasing the content of ATJ fuel in mixture of Jet A-1and ATJ results in an increase of emission of these gaseous compounds in almost everyengine operation load situation that was analyzed. As shown in the graphs of cumulativevalues of the relative particles number and relative mass of particulate matter for testedfuels, it was found that due to the increasing engine operation load, the diameter of 90% ofthe relative number of particles for each of the tested fuels decreases. The same happenswhen the content of the alternative fuel in tested fuels is higher, so the diameter of 90%of relative number of particles was the smallest for high load engine operation fueled bymixture of 50% ATJ and Jet A-1. Due to studies it is found out that the highest averagenumber of particles is generated when the engine is fueled with conventional Jet A-1 fueland the lowest average number of particles per kilogram of fuel used is for fuel containing

Energies 2021, 14, 1858 17 of 18
50% ATJ fuel. Thus, it can be concluded that the addition of ATJ has a positive effect on thenumber and mass concentration of particles.
The aim and the main conclusion of the above comprehensive analysis in the fieldof exhaust gas emissions from biofuels is that the emission of gaseous compounds is notnecessarily lower than with the use of conventional Jet A-1 fuel, but in terms of the entirelife cycle of biofuels, they are still less harmful to environment than conventional fuels. Onthe other hand, the emissions of particulate matter, in contrast to toxic compounds, is betterwhen using a mixture of conventional fuel and biofuel than when using pure conventionalfuel. Further recommendation is to maximize the proportion of biofuels, as far as possibleand with all the safety and technical aspects of the engine, because they give measurableeffects in the form of reduced particulate emissions.
Author Contributions: Conceptualization, R.J. and P.K.; methodology, R.J.; software, P.K.; validation,P.K. and R.J.; formal analysis, P.K.; investigation, P.K.; resources, R.J.; data curation, R.J.; writing—original draft preparation, P.K.; writing—review and editing, R.J.; visualization, P.K.; supervision,R.J.; project administration, R.J.; funding acquisition, R.J. Both authors have read and agreed to thepublished version of the manuscript.
Funding: The APC was funded by Interdisciplinary Rector’s Grant, grant number ERP/33/32/SIGR/0004.
Institutional Review Board Statement: Not applicable.
Informed Consent Statement: Not applicable.
Conflicts of Interest: The authors declare no conflict of interest.
References1. IRENA. Biofuels for Aviation, Technology Brief ; International Renewable Energy Agency: Abu Dhabi, UAE, 2017.2. Bosch, J.; Hoefnagels, R.; Jong, S.; Slade, R. Aviation Biofuels: Strategically Important, Technically Achievable, Tough to Deliver;
Grantham Institute, Imperial College London: London, UK, 2017.3. Airbus Global Market Forecast, Cities, Airports & Aircraft, 2019–2038. 2019. Available online: http://gmf.airbus.com/assets/
pdf/Airbus_Global_Market_Forecast_2019-2038.pdf?v=1.0.1 (accessed on 14 January 2020).4. European Aviation Environmental Report 2019, EASA, EEA, Eurocontrol. Available online: https://ec.europa.eu/transport/
sites/transport/files/2019-aviation-environmental-report.pdf (accessed on 12 January 2020).5. Merkisz, J.; Idzior, M.; Lijewski, P.; Fuc, P.; Karpiuk, W. The Analysis of the Quality of Fuel Spraying in Relation to Selected Rapeseed
Oil Fuels for the Common Rail System; SAE International: Warrendale, PA, USA, 2008.6. Braun-Unkhoff, M.; Riedel, U. Alternative fuels in aviation. CEAS Aeronaut. J. 2015, 6, 83–93. [CrossRef]7. Hakes, J. A Declaration of Energy Independence: How Freedom from Foreign Oil Can Improve National Security, Our Economy, and the
Environment; Wiley: Hoboken, NJ, USA, 2008.8. Renewable Energy Directive, European Commission. Available online: https://ec.europa.eu/energy/topics/renewable-energy/
renewable-energy-directive/overview_en (accessed on 10 March 2021).9. European Parliament; Council of the European Union. Directive (EU) 2018/2001 of the European Parliament and of the Council of
11 December 2018 on the promotion of the use of energy from renewable sources (recast). Off. J. Eur. Union 2018, PE/48/2018/REV/1,82–209.
10. Atmanli, A.; Yilmaz, N. An experimental assessment on semi-low temperature combustion using waste oil biodiesel/C3-C5alcohol blends in a diesel engine. Fuel 2019, 260, 116357. [CrossRef]
11. IATA. Sustainable Aviation Fuels Fact Sheet; International Air Transport Association: Montreal, QC, Canada, 2019.12. Saha, S.; Sharma, A.; Purkayastha, S.; Pandey, K.; Dhingra, S. Bio-plastics and Biofuel: Is it the Way in Future Development for
End Users? In Plastics to Energy Fuel, Chemicals, and Sustainability Implications; Plastics Design Library Series; Elsevier: Amsterdam,The Netherlands, 2019; pp. 365–376.
13. ATAG. Beginner’s Guide to Sustainable Aviation Fuel; Air Transport Action Group: Geneva, Switzerland, 2017.14. Carriquiry, M.A.; Du, X.; Timilsina, G.R. Second generation biofuels: Economics and policies. Energy Policy 2011, 39, 4222–4234.
[CrossRef]15. Oregon State University. Generation of Biofuels; Bioenergy Education Initiative, Oregon State University: Corvallis, OR, USA.16. Kostova, B. Current Status of Alternative Aviation Fuels; U.S. Department of Energy: Washington, DC, USA, 2017.17. Shonnard, D.R.; Williams, L.; Kalnes, T.N. Camelina-Derived Jet Fuel and Diesel: Sustainable Advanced Biofuels. Environ. Prog.
Sustain. Energy 2010, 29, 382–392. [CrossRef]18. Power-to-Liquids Potentials and Perspectives for the Future Supply of Renewable Aviation Fuel, German Enivronment Agency.
2016. Available online: https://www.umweltbundesamt.de/sites/default/files/medien/377/publikationen/161005_uba_hintergrund_ptl_barrierrefrei.pdf (accessed on 10 March 2021).

Energies 2021, 14, 1858 18 of 18
19. Schmidt, P.; Batteiger, V.; Roth, A.; Weindorf, W.; Raksha, T. Power-to-Liquids as Renewable Fuel Option for Aviation: A Review.Chem. Ing. Tech. 2018, 90, 127–140. [CrossRef]
20. RAND Corporation. Infrastructure, Safety and Environment; RAND Corporation: Santa Monica, CA, USA, 2009.21. ICAO. Sustainable Aviation Fuels Guide; International Civil Aviation Organization: Montreal, QC, Canada, 2018.22. ASTM. ASTM Standardization News, D7566 Takes Flight; ASTM International: West Conshohocken, PA, USA, 2011.23. CAAFI Commercial Aviation Alternative Fuel Initiative, Fuel Qualification. Available online: http://www.caafi.org/focus_areas/
fuel_qualification.html (accessed on 13 August 2020).24. Karpiuk, W.; Borowczyk, T.; Idzior, M.; Smolec, R. The Evaluation of the Impact of Design and Operating Parameters of Common
Rail System Fueled by Bio-Fuels on the Emission of Harmful Compounds. In Proceedings of the 2016 International Conferenceon Sustainable Energy, Environment and Information Engineering (SEEIE 2016), Bangkok, Thailand, 20–21 March 2016.
25. IATA. Sustainable Aviation Fuels Roadmap; International Air Transport Association: Montreal, QC, Canada, 2015.26. Chevron Products Company, Aviation Fuels Technical Review. 2007. Available online: https://skybrary.aero/bookshelf/books/
2478.pdf (accessed on 10 March 2021).27. Biomass Magazine. PNNL Technology Clears Way for Ethanol-Derived Jet Fuel. 2018. Available online: http://biomassmagazine.
com/articles/15369/pnnl-technology-clears-way-for-ethanol-derived-jet-fuel (accessed on 12 January 2020).28. Csonka, S. The State of Sustainable Aviation Fuel (SAF); CAAFI Webinar Series; International Civil Aviation Organization: Montreal,
QC, Canada, 2020.29. Zschocke, A.; Scheuermann, S.; Ortner, J. High Biofuel Blends in Aviation (HBBA), ENER/C2/2012/420-1, Final Report; Lufthansa:
Cologne, Germany, 2012.30. Johnston, G. Alcohol to Jet—Isobutanol, ICAO Seminarium on Alternative Fuels 2017; ICAO: Montreal, QC, Canada, 2017.31. LanzaTech. No Carbon Left Behind: Alcohol-to-Jet. 2018. Available online: https://www.iata.org/contentassets/8dc7f9f4c38247
ae8f007998295a37d5/jennifer-holmgren-vf-panel-session-2.pdf (accessed on 10 March 2021).32. Jasinski, R. Evaluation of Nanoparticles Mass and Size Emissions from Aircraft Engines. Ph.D. Thesis, Poznan University of
Technology, Poznan, Poland, 2019.33. Merkisz, J.; Pielecha, J. The on-road exhaust emissions characteristics of SUV vehicles fitted with diesel engines. Siln. Spalinowe
2011, 50, 58–72.34. Braun-Unkhoff, M.; Riedel, U.; Wahl, C. About the Emissions of Alternative Jet Fuels. CEAS Aeronaut. J. 2017, 8, 167–180.
[CrossRef]35. Riebl, S.; Braun-Unkhoff, M.; Riedel, U. A study on the emissions of alternative aviation fuels. J. Gas Turbines Power 2017, 139,
081503. [CrossRef]36. Lobo, P.; Durdina, L.; Smallwood, G.J.; Rindlisbacher, T.; Siegerist, F.; Black, E.A.; Yu, Z.; Mensah, A.A.; Hagen, D.E.; Miake-Lye,
R.C.; et al. Measurement of aircraft engine non-volatile PM emissions: Results of the Aviation-Particle Regulatory InstrumentationDemonstration Experiment (A-PRIDE) 4 Campaign. Aerosol Sci. Technol. 2015, 49, 472–484. [CrossRef]
37. Park, K.; Cao, F.; Kittelson, D.B.; McMurry, P.H. Relationship between particle mass and mobility for diesel exhaust particles.Environ. Sci. Technol. 2003, 37, 577–583. [CrossRef] [PubMed]
38. Petzold, A.; Marsh, R.; Johnson, M.; Miller, M.; Sevcenco, Y.; Delhaye, D.; Ibrahim, A.; Williams, P.; Bauer, H.; Crayford, A.; et al.Evaluation of methods for measuring particulate matter emissions from gas turbines. Environ. Sci. Technol. 2011, 45, 3562–3568.[CrossRef] [PubMed]