overview of infrastructure and construction machinery
TRANSCRIPT
Overview of
Infrastructure and
Construction
Machinery Industry in
India
– Opportunities and
Challenges
Rajesh Nath
Managing Director
VDMA India
Page 1
Contents
India – An Overview
Infrastructure Sector & the 12th Five Year Plan
Construction Equipment Market
Opportunities & Challenges
Conclusion
German Engineering Federation (VDMA)
Page 2
Page 3
INDIA
An Overview
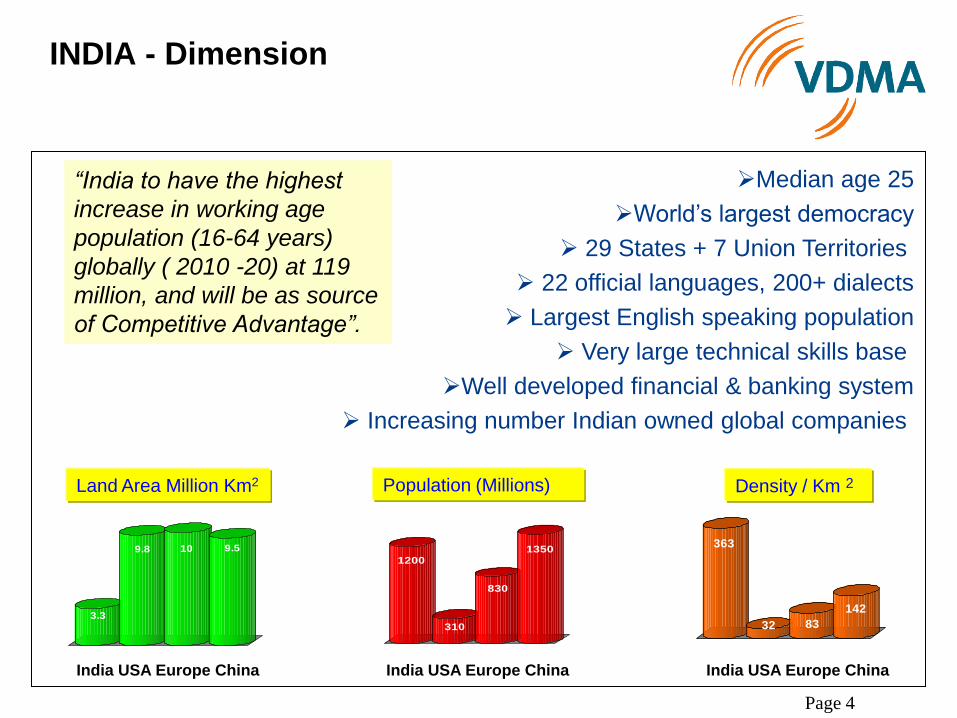
INDIA - Dimension
3.3
9.8 10 9.5
1200
310
830
1350363
32 83
142
India USA Europe China India USA Europe China India USA Europe China
Land Area Million Km2 Population (Millions) Density / Km 2
Median age 25
World’s largest democracy
29 States + 7 Union Territories
22 official languages, 200+ dialects
Largest English speaking population
Very large technical skills base
Well developed financial & banking system
Increasing number Indian owned global companies
“India to have the highest
increase in working age
population (16-64 years)
globally ( 2010 -20) at 119
million, and will be as source
of Competitive Advantage”.
Page 4
INDIA - Snapshot 1
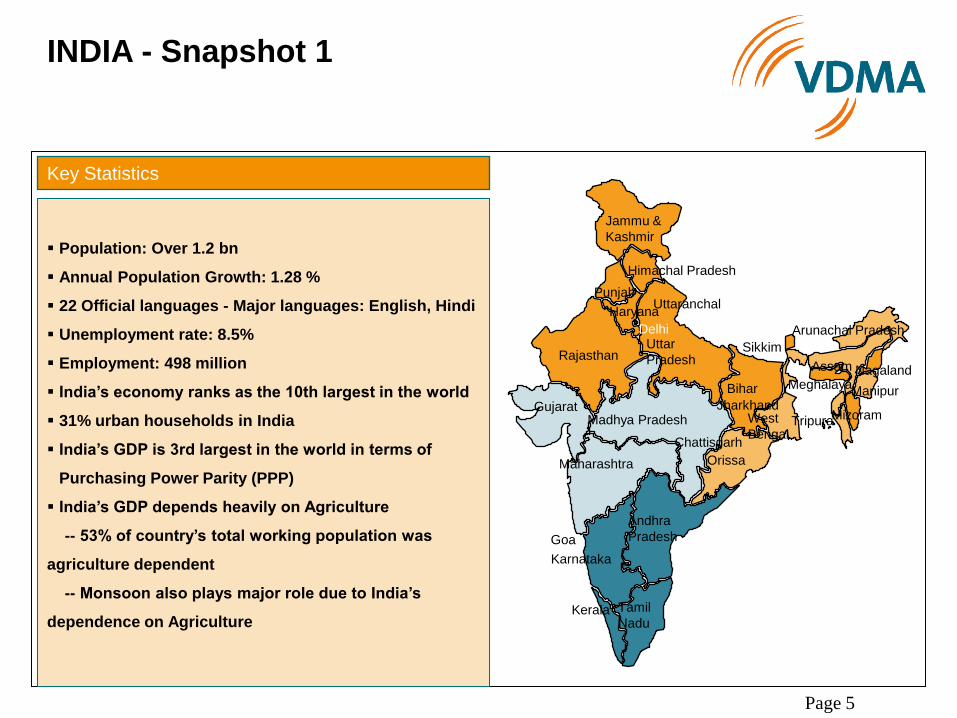
Population: Over 1.2 bn
Annual Population Growth: 1.28 %
22 Official languages - Major languages: English, Hindi
Unemployment rate: 8.5%
Employment: 498 million
India’s economy ranks as the 10th largest in the world
31% urban households in India
India’s GDP is 3rd largest in the world in terms of
Purchasing Power Parity (PPP)
India’s GDP depends heavily on Agriculture
-- 53% of country’s total working population was
agriculture dependent
-- Monsoon also plays major role due to India’s
dependence on Agriculture
Key Statistics
Arunachal Pradesh Delhi
Rajasthan
Gujarat
Maharashtra
Karnataka
Andhra
Pradesh
Tamil
Nadu
Orissa
Uttar
Pradesh
West
Bengal Madhya Pradesh
Kerala
Jammu &
Kashmir
Bihar
Punjab
Haryana
Mizoram
Manipur
Sikkim
Assam Nagaland
Goa
Chattisgarh
Tripura
Meghalaya
Himachal Pradesh
Uttaranchal
Jharkhand
Page 5
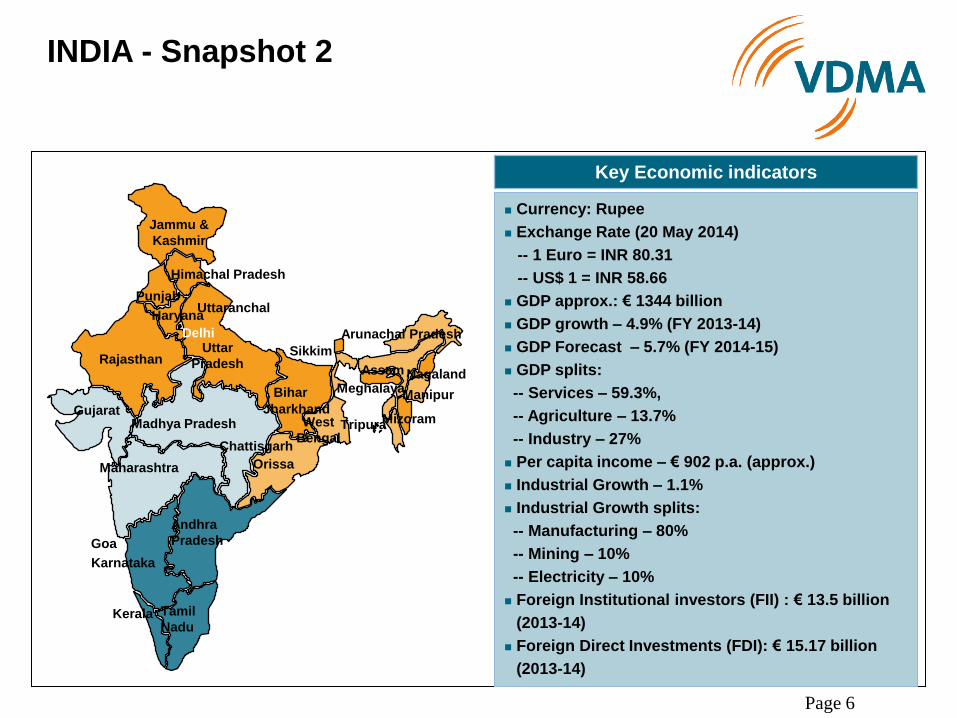
Currency: Rupee
Exchange Rate (20 May 2014)
-- 1 Euro = INR 80.31
-- US$ 1 = INR 58.66
GDP approx.: € 1344 billion
GDP growth – 4.9% (FY 2013-14)
GDP Forecast – 5.7% (FY 2014-15)
GDP splits:
-- Services – 59.3%,
-- Agriculture – 13.7%
-- Industry – 27%
Per capita income – € 902 p.a. (approx.)
Industrial Growth – 1.1%
Industrial Growth splits:
-- Manufacturing – 80%
-- Mining – 10%
-- Electricity – 10%
Foreign Institutional investors (FII) : € 13.5 billion
(2013-14)
Foreign Direct Investments (FDI): € 15.17 billion
(2013-14)
Arunachal Pradesh Delhi
Rajasthan
Gujarat
Maharashtra
Karnataka
Andhra
Pradesh
Tamil
Nadu
Orissa
Uttar
Pradesh
West
Bengal Madhya Pradesh
Kerala
Jammu &
Kashmir
Bihar
Punjab
Haryana
Mizoram
Manipur
Sikkim
Assam Nagaland
Goa
Chattisgarh
Tripura
Meghalaya
Himachal Pradesh
Uttaranchal
Jharkhand
Key Economic indicators
INDIA - Snapshot 2
Page 6
Performance of the Indian Economy
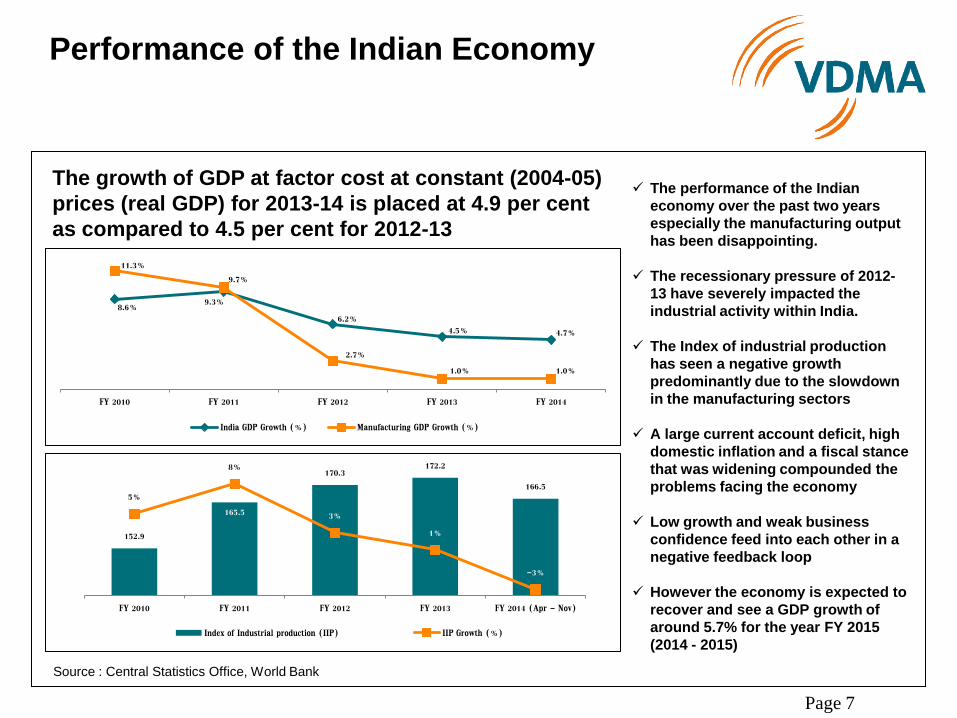
The growth of GDP at factor cost at constant (2004-05)
prices (real GDP) for 2013-14 is placed at 4.9 per cent
as compared to 4.5 per cent for 2012-13
8.6% 9.3%
6.2%
4.5% 4.7%
11.3%
9.7%
2.7%
1.0% 1.0%
FY 2010 FY 2011 FY 2012 FY 2013 FY 2014
India GDP Growth (%) Manufacturing GDP Growth (%)
The performance of the Indian
economy over the past two years
especially the manufacturing output
has been disappointing.
The recessionary pressure of 2012-
13 have severely impacted the
industrial activity within India.
The Index of industrial production
has seen a negative growth
predominantly due to the slowdown
in the manufacturing sectors
A large current account deficit, high
domestic inflation and a fiscal stance
that was widening compounded the
problems facing the economy
Low growth and weak business
confidence feed into each other in a
negative feedback loop
However the economy is expected to
recover and see a GDP growth of
around 5.7% for the year FY 2015
(2014 - 2015)
152.9
165.5
170.3 172.2
166.5 5%
8%
3%
1%
-3%
-4%
-2%
0%
2%
4%
6%
8%
10%
140.0
145.0
150.0
155.0
160.0
165.0
170.0
175.0
FY 2010 FY 2011 FY 2012 FY 2013 FY 2014 (Apr - Nov)
Index of Industrial production (IIP) IIP Growth (%)
Source : Central Statistics Office, World Bank
Page 7
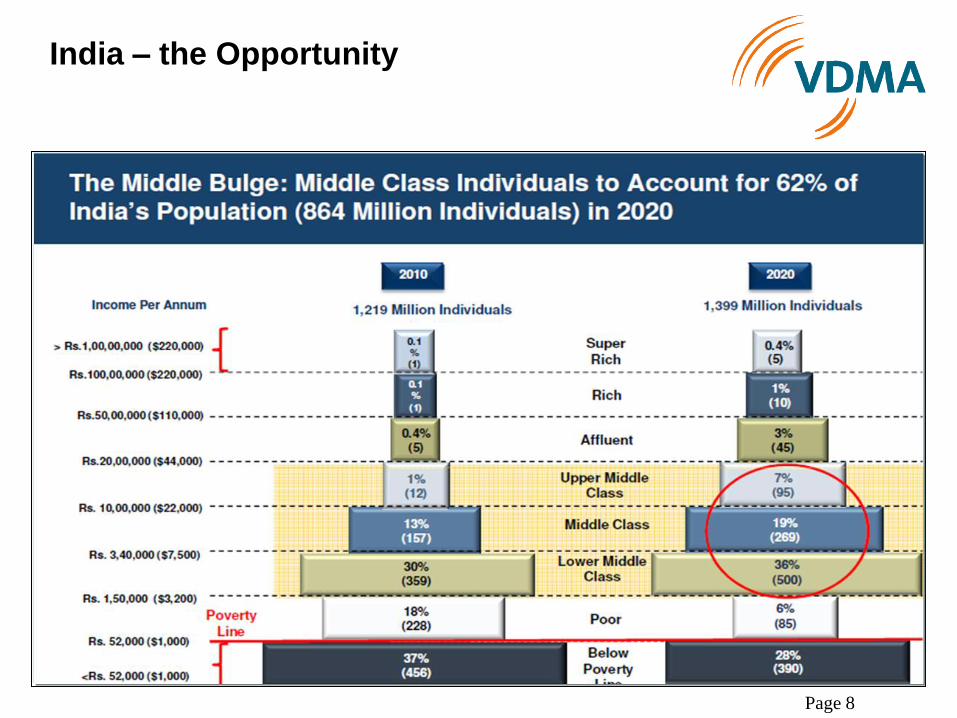
India – the Opportunity
Page 8

India is under-penetrated in terms of infra-
structure availability compared to other
nations
Page 9

Infrastructure Sector
&
The 12th Five Year Plan
Page 10
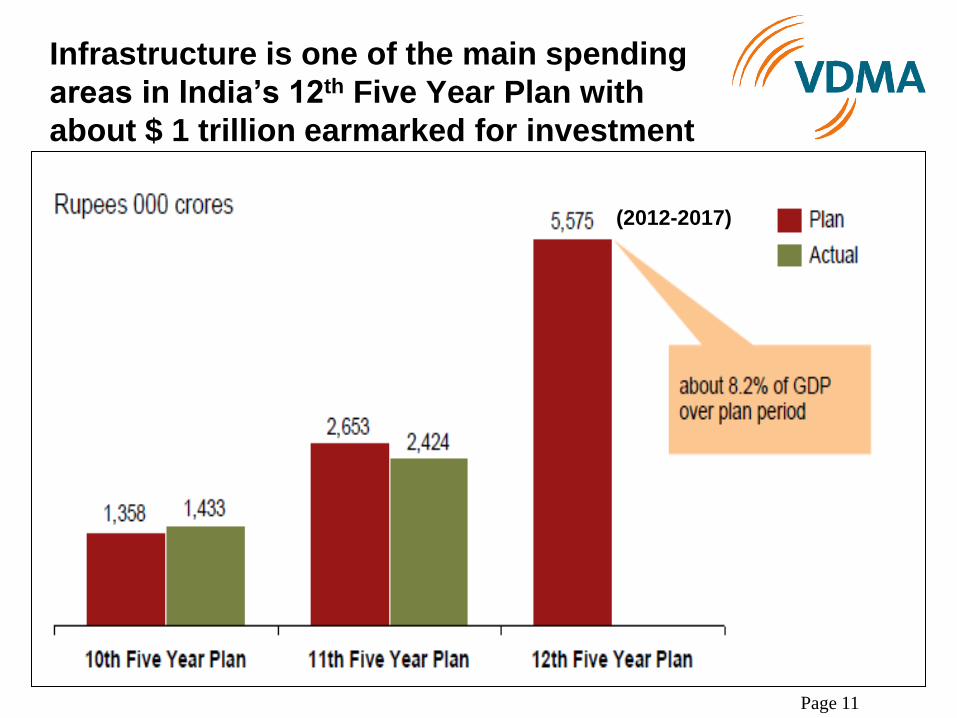
Infrastructure is one of the main spending
areas in India’s 12th Five Year Plan with
about $ 1 trillion earmarked for investment
Page 11
(2012-2017)

Infrastructure spending is expected to grow
Source: Knowledge report - EXCON
Page 12
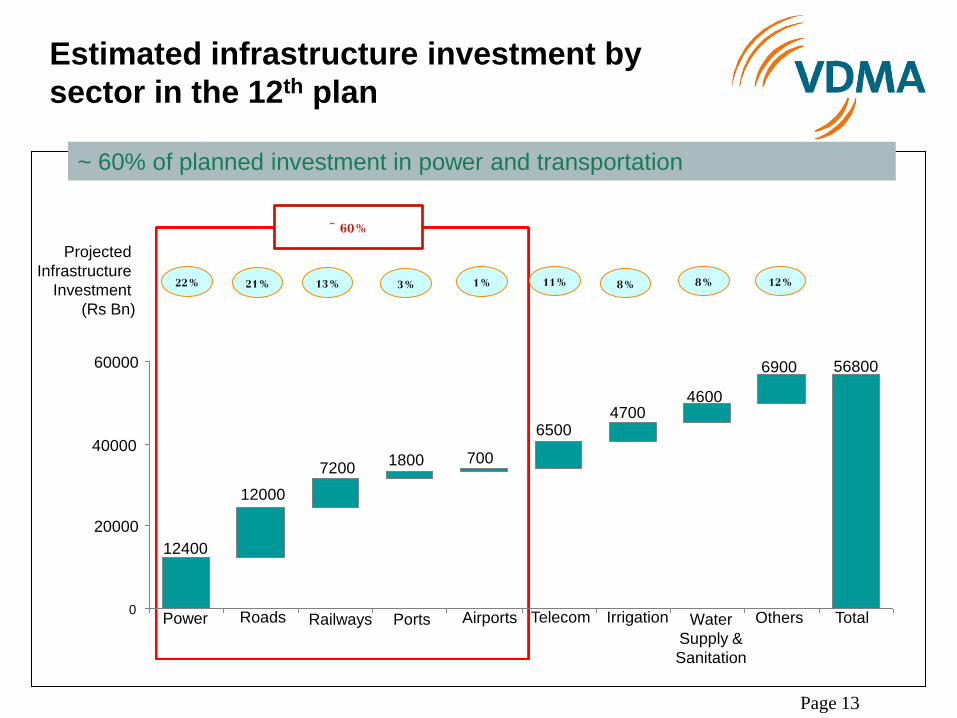
Estimated infrastructure investment by
sector in the 12th plan
~ 60%
Projected
Infrastructure
Investment
(Rs Bn)
60000
40000
20000
0 Power Roads Railways Ports Airports Telecom Irrigation Water
Supply &
Sanitation
Others Total
12400
12000
7200 1800 700
6500 4700
4600
6900 56800
22% 21% 13% 3% 1% 11% 8% 8% 12%
~ 60% of planned investment in power and transportation
Page 13
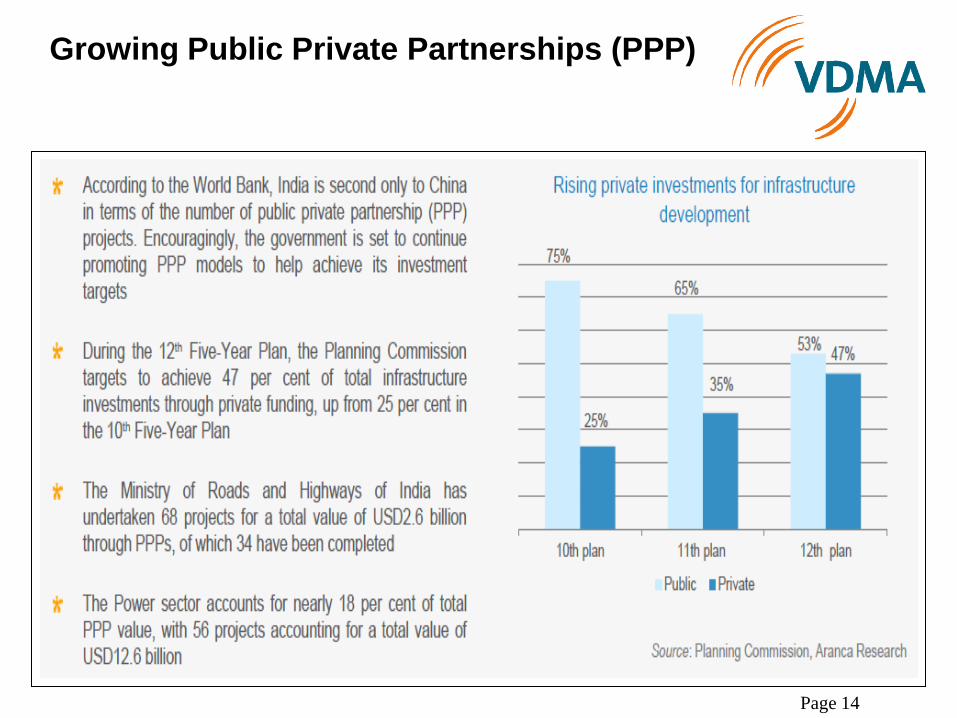
Growing Public Private Partnerships (PPP)
Page 14
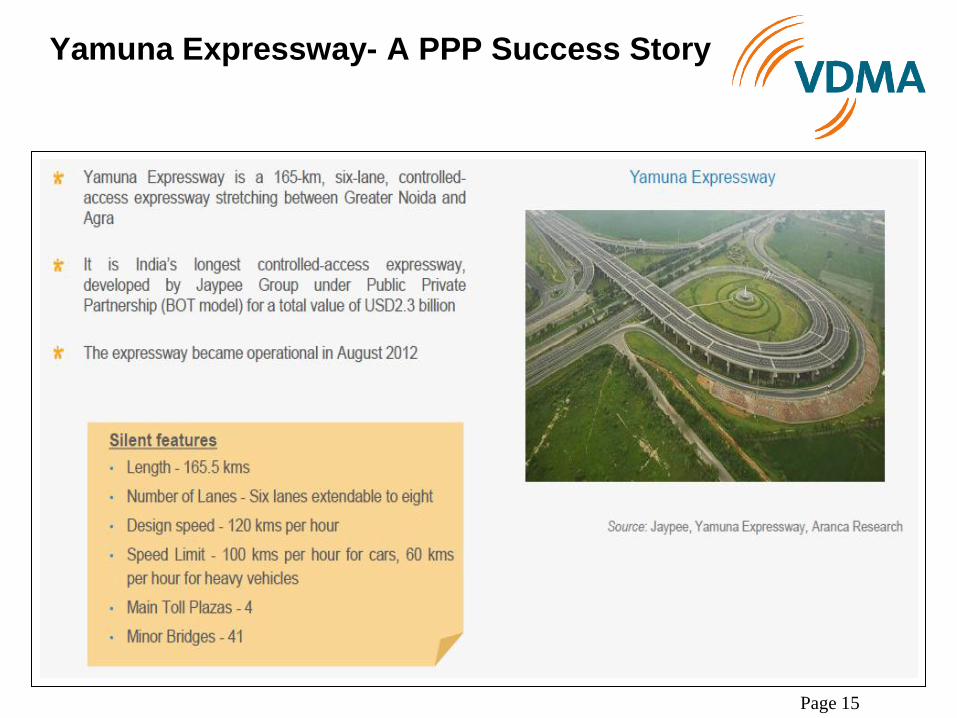
Yamuna Expressway- A PPP Success Story
Page 15

India has a shortage of multilane highways
Page 16

Investments in India’s road network are
expected to jump
Page 17
Source: Knowledge report - EXCON
(US$ 157 billion approx.)

Investment in rural roads expected to
continue
Page 18
Source: Knowledge report - EXCON
(US$ 21 billion approx.)
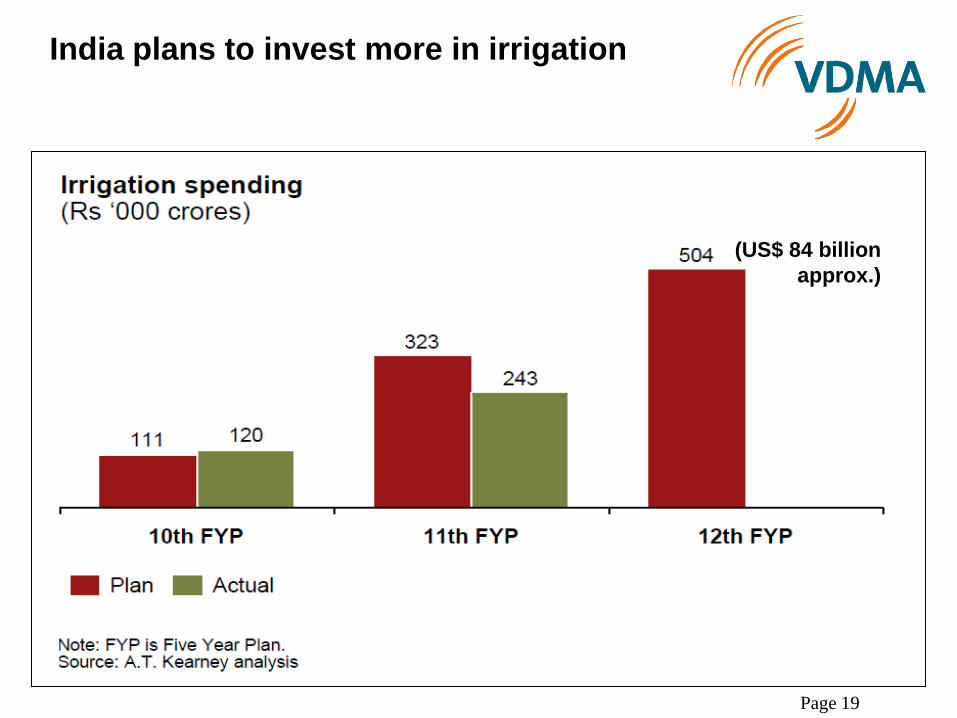
India plans to invest more in irrigation
Page 19
(US$ 84 billion
approx.)
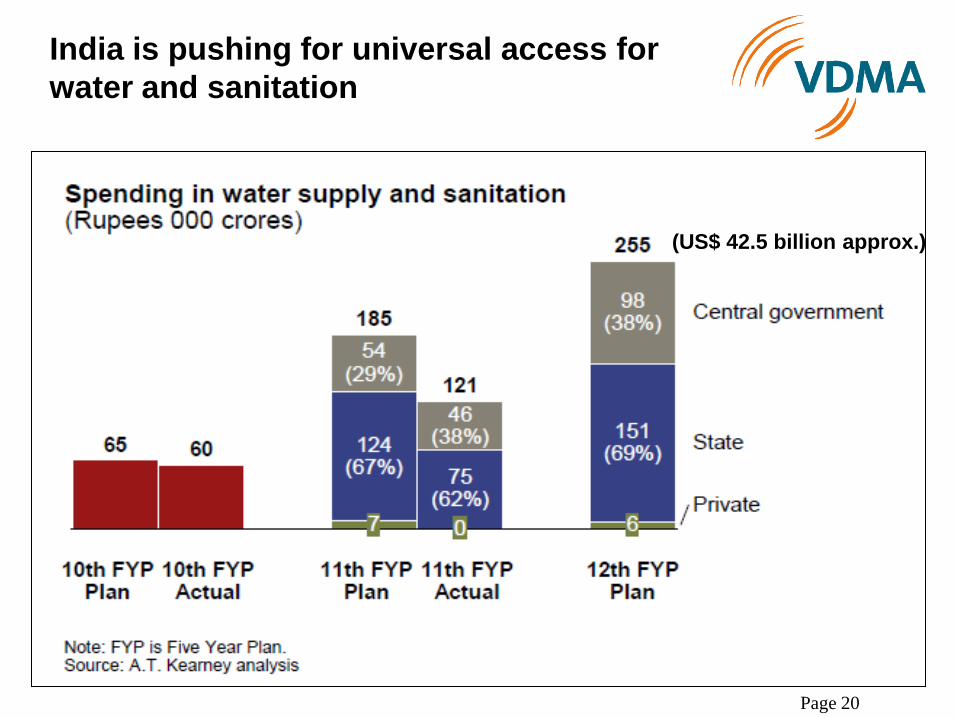
India is pushing for universal access for
water and sanitation
Page 20
(US$ 42.5 billion approx.)

Status of Implementation of 12th Plan
HIGHWAYS
3, 928 Kms of National Highways created
39, 144 Kms of Rural Roads created
13 Projects for the total length of 1203.647 Kms have been awarded
RAILWAYS
3,343 Kms of New Railway track created
AIRPORTS
7 new Air ports are under construction
Page 21

PORTS
217.5 million tonnes of capacity per annum in our ports have been created
The Cabinet has approved the proposal for establishment of two new Ports in Andhra Pradesh (Dugarajapatnam) and West Bengal (Sagar)
The Detailed Project Report (DPR) of the Outer Harbour Project of V.O. Chidambaranar Port, Tuticorin has been completed
POWER
29, 350 MW of power capacity created
19 Oil and Gas blocks were given out for exploration
Status of Implementation of 12th Plan
Page 22
Page 23
Construction Equipment Market
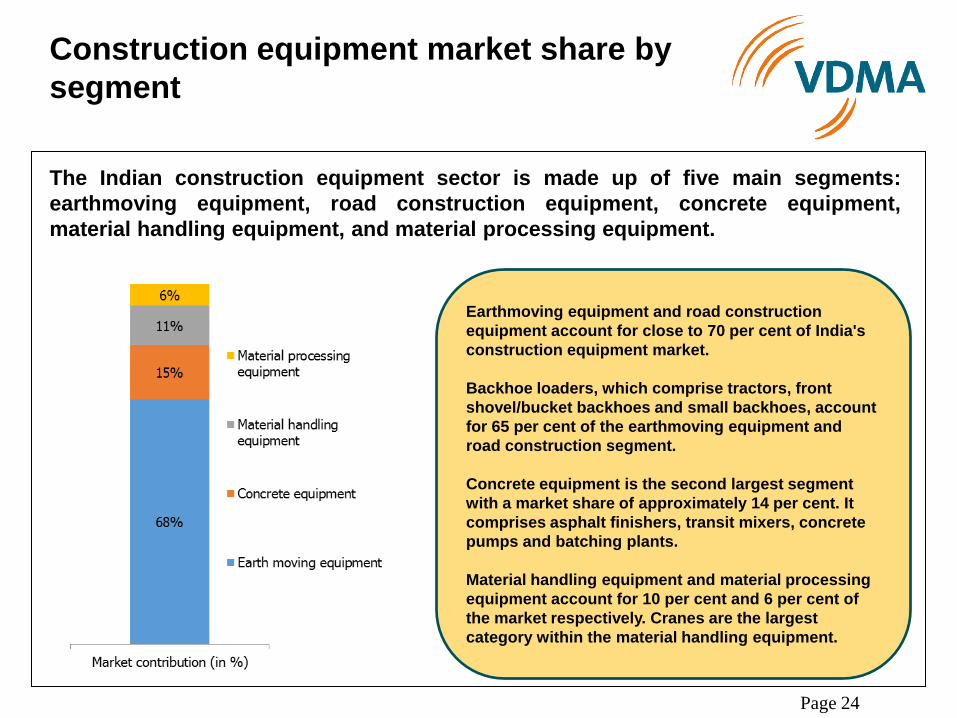
Construction equipment market share by
segment
Page 24
Earthmoving equipment and road construction
equipment account for close to 70 per cent of India's
construction equipment market.
Backhoe loaders, which comprise tractors, front
shovel/bucket backhoes and small backhoes, account
for 65 per cent of the earthmoving equipment and
road construction segment.
Concrete equipment is the second largest segment
with a market share of approximately 14 per cent. It
comprises asphalt finishers, transit mixers, concrete
pumps and batching plants.
Material handling equipment and material processing
equipment account for 10 per cent and 6 per cent of
the market respectively. Cranes are the largest
category within the material handling equipment.
The Indian construction equipment sector is made up of five main segments:
earthmoving equipment, road construction equipment, concrete equipment,
material handling equipment, and material processing equipment.

India: Construction Equipment Sales
Units of earthmoving and road equipment sales, *=forecast, source: CECE, VDMA calculations
0
10.000
20.000
30.000
40.000
50.000
60.000
2000 2002 2004 2006 2008 2010 2012 2014*
After two disappointing years, slight recovery expected
Page 25

Indian ECE market has the potential to
grow at 20-25% to reach 330k-450k unit
sales by 2020
Page 26
Source: Knowledge report - EXCON
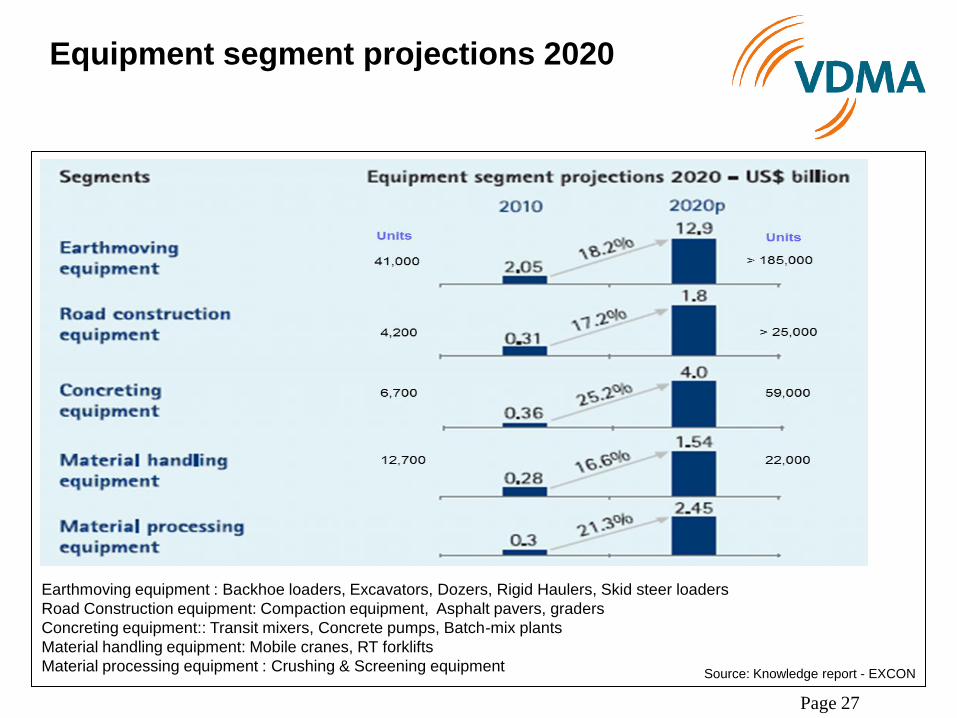
Equipment segment projections 2020
Earthmoving equipment : Backhoe loaders, Excavators, Dozers, Rigid Haulers, Skid steer loaders
Road Construction equipment: Compaction equipment, Asphalt pavers, graders
Concreting equipment:: Transit mixers, Concrete pumps, Batch-mix plants
Material handling equipment: Mobile cranes, RT forklifts
Material processing equipment : Crushing & Screening equipment
Page 27
Source: Knowledge report - EXCON
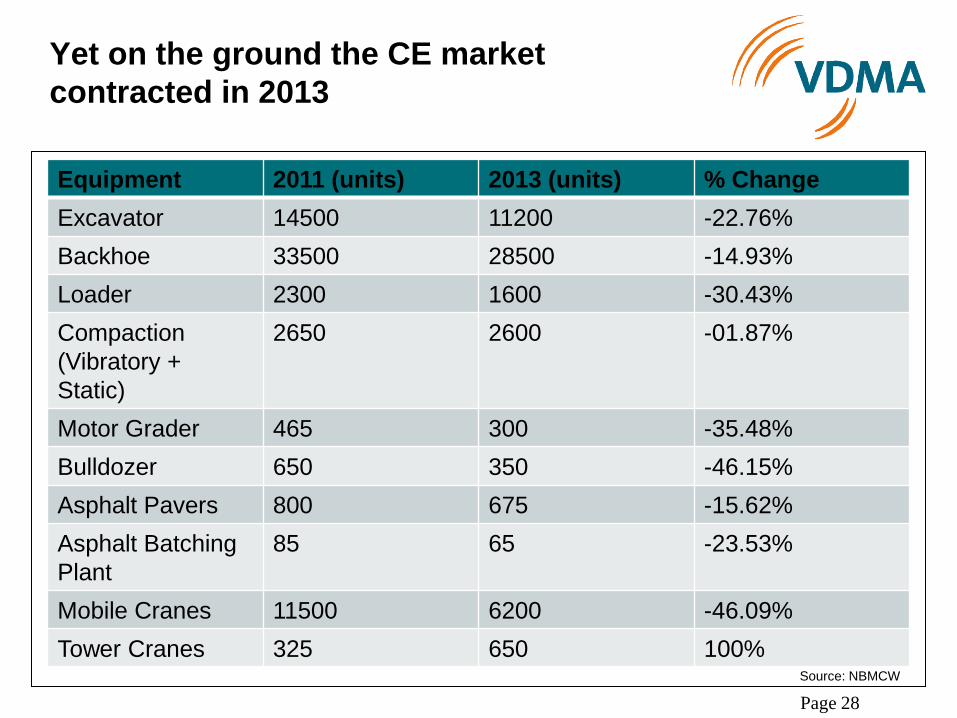
Yet on the ground the CE market
contracted in 2013
Equipment 2011 (units) 2013 (units) % Change
Excavator 14500 11200 -22.76%
Backhoe 33500 28500 -14.93%
Loader 2300 1600 -30.43%
Compaction
(Vibratory +
Static)
2650 2600 -01.87%
Motor Grader 465 300 -35.48%
Bulldozer 650 350 -46.15%
Asphalt Pavers 800 675 -15.62%
Asphalt Batching
Plant
85 65 -23.53%
Mobile Cranes 11500 6200 -46.09%
Tower Cranes 325 650 100%
Page 28
Source: NBMCW

Exports of Construction Equipment to India
in million EUR, 2012 figures in percent, source: National Statistics Agencies
0
200
400
600
800
1.000
2003 2004 2005 2006 2007 2008 2009 2010 2011 2012
Others
Korea
USA
China
Japan
Germany
South Korea21%
USA21%
China16%
Japan11%
Germany9%
Others22%
Page 29

Page 30
Opportunities
&
Challenges

Strengths of the Construction Equipment
Market
Robust economic development: India's 12th Five Year Plan is targeting 11 per cent growth for the construction sector up from 7.8 per cent in the previous plan.
Infrastructure growth: Substantial infrastructure investment of USD 1 trillion under the 12th plan will drive higher demand for construction equipment.
Growing OEM presence: India offers significant potential as an OEM hub due to its lower costs and the availability of skilled labour. At least 10 new equipment manufacturers are expected to establish bases in India in the next couple of years
Higher FDI in construction: Increased construction activities create favorable conditions for foreign direct investment in the construction sector
Page 31
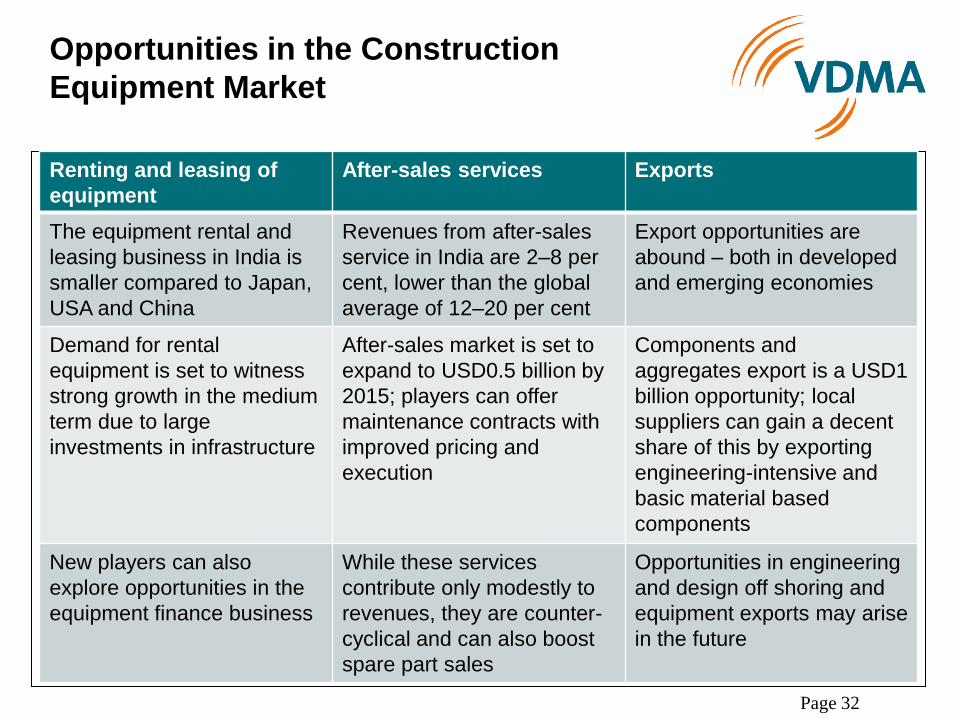
Opportunities in the Construction
Equipment Market
Renting and leasing of
equipment
After-sales services Exports
The equipment rental and
leasing business in India is
smaller compared to Japan,
USA and China
Revenues from after-sales
service in India are 2–8 per
cent, lower than the global
average of 12–20 per cent
Export opportunities are
abound – both in developed
and emerging economies
Demand for rental
equipment is set to witness
strong growth in the medium
term due to large
investments in infrastructure
After-sales market is set to
expand to USD0.5 billion by
2015; players can offer
maintenance contracts with
improved pricing and
execution
Components and
aggregates export is a USD1
billion opportunity; local
suppliers can gain a decent
share of this by exporting
engineering-intensive and
basic material based
components
New players can also
explore opportunities in the
equipment finance business
While these services
contribute only modestly to
revenues, they are counter-
cyclical and can also boost
spare part sales
Opportunities in engineering
and design off shoring and
equipment exports may arise
in the future
Page 32

Construction equipment financing in India
is expected to grow
Page 33

Multiple challenges need to be addressed
for the ECE industry to achieve ‘long term’
potential
Page 34

In addition challenges faced in the ECE
‘ecosystem’ will also need to be
addressed
Page 35

Favourable policies are supporting sector
growth
Page 36
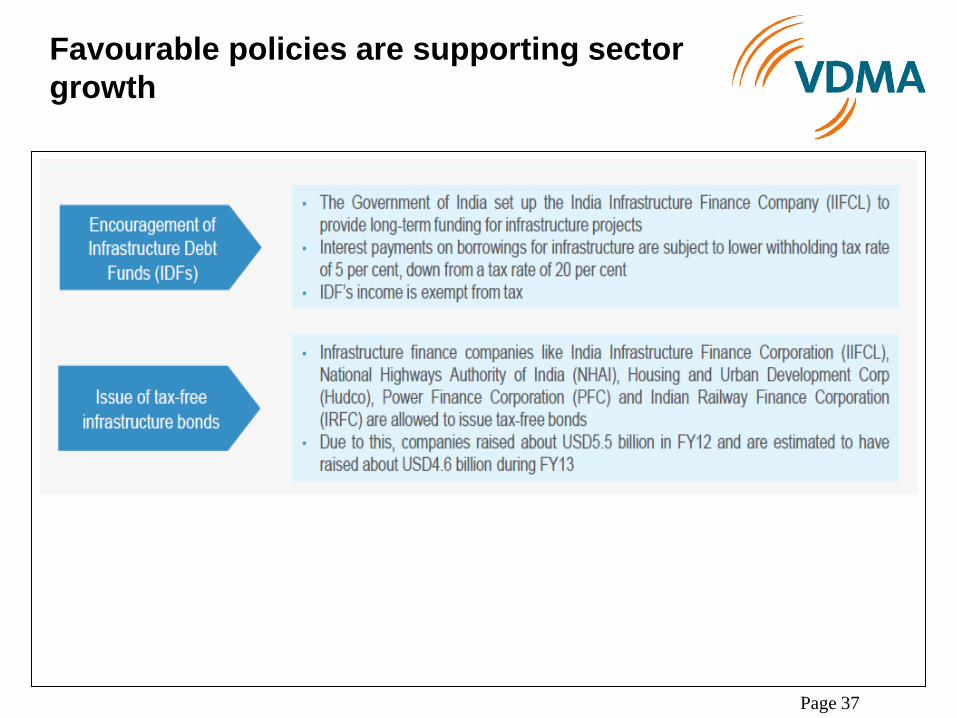
Favourable policies are supporting sector
growth
Page 37

Page 38
Conclusion
Conclusions
In the years ahead, the construction industry in India has to overcome various challenges with respect to housing, environment, transportation, power or natural hazards.
Technocrats associated with the Indian construction industry need to employ innovative technologies and skilled project handling strategies to overcome these challenges.
The performance in the past will stand in good stead and give confidence to the Indian construction industry to bring about an overall development in the infrastructure of the nation.
The 12th five year plan earmarking an investment of US$ 1 trillion in the Infrastructure sector by 2017 will translate to a good potential for the Construction Industry.
Page 39

Important Agencies in India
Ministry of Power - Government of India (www.powermin.nic.in)
Ministry of Road Transport & Highways – Government of India (www.morth.nic.in)
National Highways Authority of India (www.nhai.org)
Indian Railways (www.indianrailways.gov.in)
Airports Authority of India (www.aai.aero)
Ministry of Civil Aviation (www.civilaviation.gov.in)
Ministry of Shipping (www.shipping.gov.in)
Page 40

The German Engineering Federation (VDMA)
VDMA India Services Pvt. Ltd.
Page 41
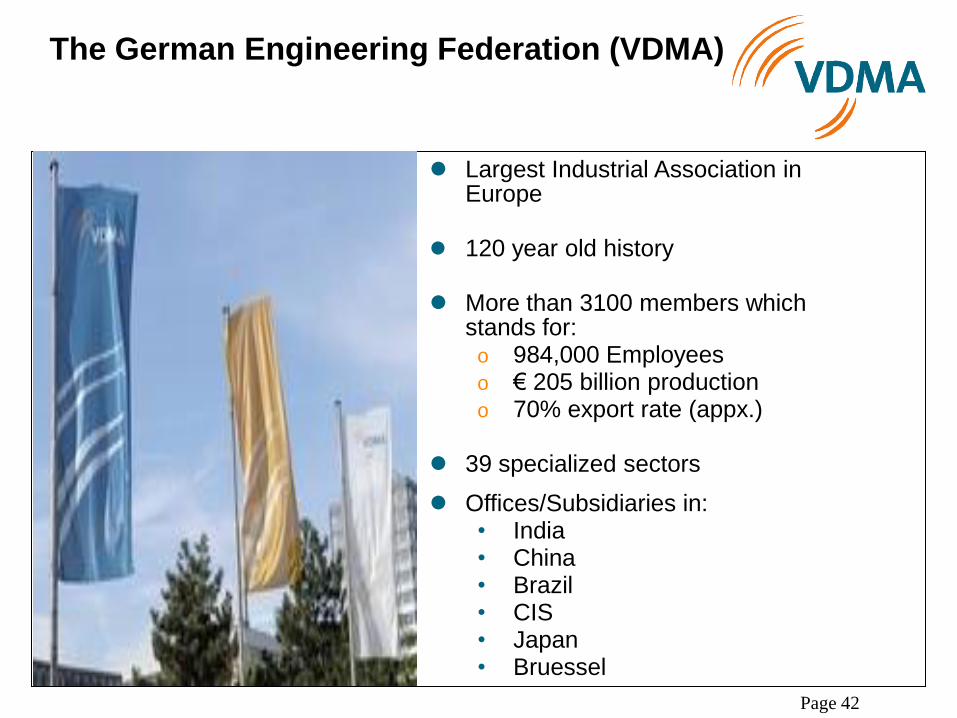
The German Engineering Federation (VDMA)
Largest Industrial Association in Europe
120 year old history
More than 3100 members which stands for:
o 984,000 Employees o € 205 billion production o 70% export rate (appx.)
39 specialized sectors
Offices/Subsidiaries in: • India • China • Brazil • CIS • Japan • Bruessel
Page 42

VDMA in India
VDMA Office in Kolkata, Delhi & Mumbai promotes the Indo-German
trade in mechanical engineering machinery.
Mr. Rajesh Nath, Managing Director
German Engineering Federation
GC-34, Sector III, Salt Lake City,
Kolkata-700106, India
Tel. 0091-33-3219522
Fax 0091-33-3217073
E-Mail: [email protected]
Mr. Sumit Sharma, Regional Manager Ms. Jamly John, Regional Manager
Noida Mumbai
Phone 0120-4255029 Phone 09819045109
E-Mail: [email protected] E-Mail: [email protected]
Page 43
Getting the…. ….right in India
Almighty Bollywood Cricket
A B C
Page 44

Thank you for Your Attention
V
Deliver
More
Always
Page 45