overview of florida's teacher evaluation system - original
TRANSCRIPT
Overview of Florida’s Teacher Evaluation System
1

Purpose of Personnel Evaluations
As set forth in the Student Success Act and Race to the Top, teacher evaluations are: – Designed to support effective instruction and student learning growth
– Results used when developing district and school level improvement plans
– Results used to identify professional development and other human capital decisions for instructional personnel and school administrators
2

Purpose of Personnel Evaluations
• Evaluations must differentiate among 4 levels of performance: – Highly effective
– Effective
– Needs improvement, or for instructional personnel in their first 3 years of employment, Developing
– Unsatisfactory
• During the 2015‐16 School Year, the State Board of Education must establish student growth standards for each performance level
3

Purpose of Personnel Evaluations
To support those objectives, the law also sets forth that teacher evaluations are to be based on sound educational principles and contemporary research in effective practices in three major areas: 1. The performance of students 2. Instructional practice
3. Professional and job responsibilities
4
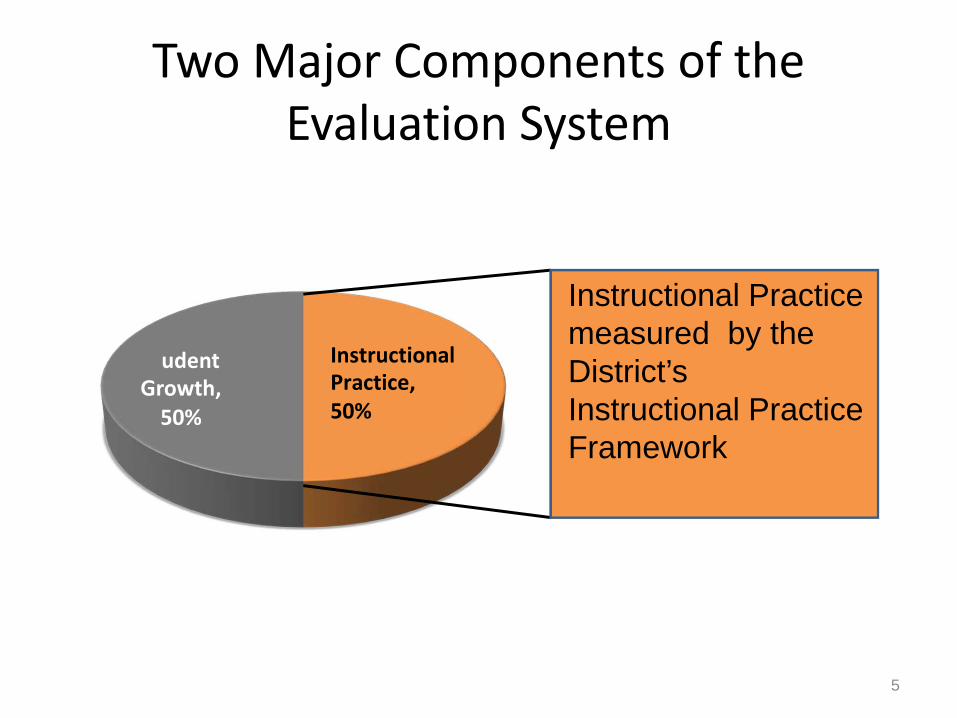
Two Major Components of the Evaluation System
Instructional Practice measured by the District’s Instructional Practice Framework
Gr tr c
Pr c ce
5
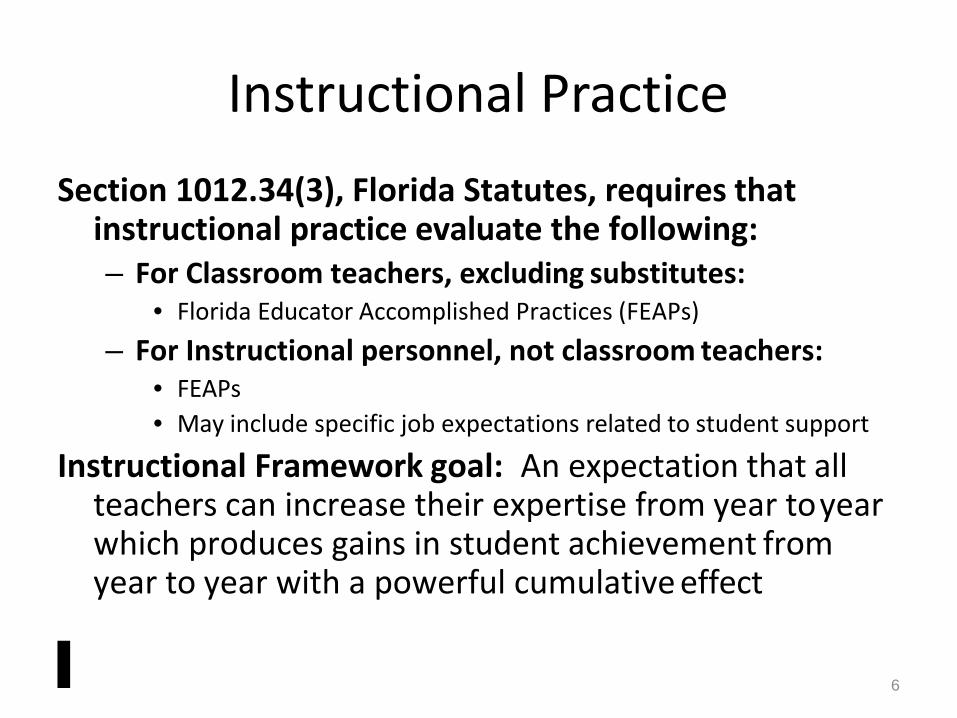
Instructional Practice
Section 1012.34(3), Florida Statutes, requires that instructional practice evaluate the following: – For Classroom teachers, excluding substitutes:
• Florida Educator Accomplished Practices (FEAPs) – For Instructional personnel, not classroom teachers:
• FEAPs • May include specific job expectations related to student support
Instructional Framework goal: An expectation that all teachers can increase their expertise from year toyear which produces gains in student achievement from year to year with a powerful cumulative effect
6
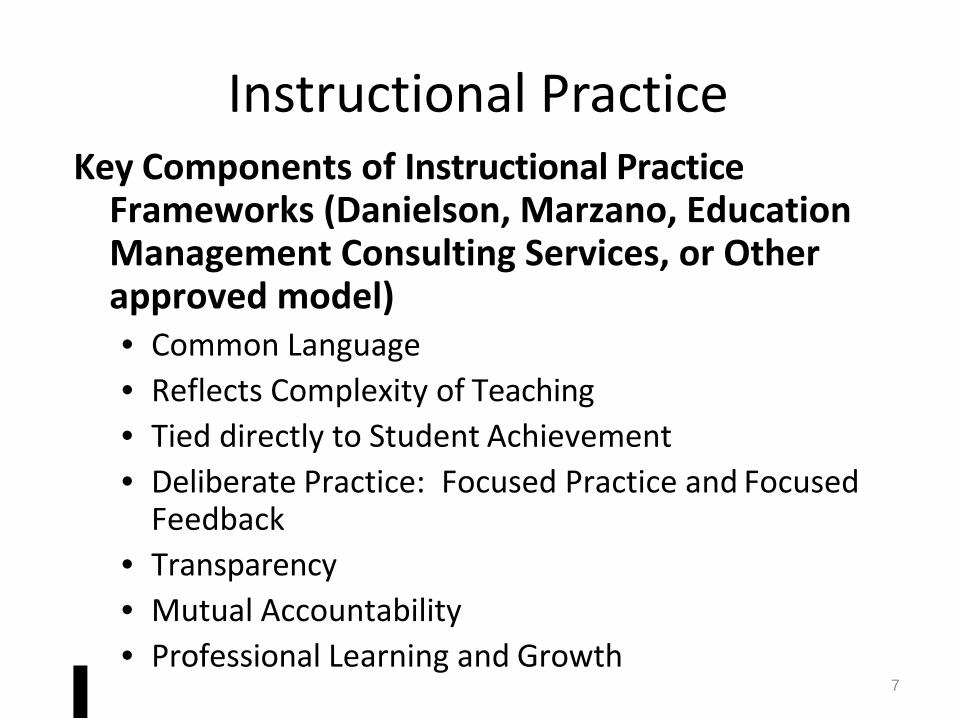
Instructional Practice Key Components of Instructional Practice Frameworks (Danielson, Marzano, Education Management Consulting Services, or Other approved model) • Common Language • Reflects Complexity of Teaching • Tied directly to Student Achievement • Deliberate Practice: Focused Practice and Focused Feedback
• Transparency • Mutual Accountability • Professional Learning and Growth
7
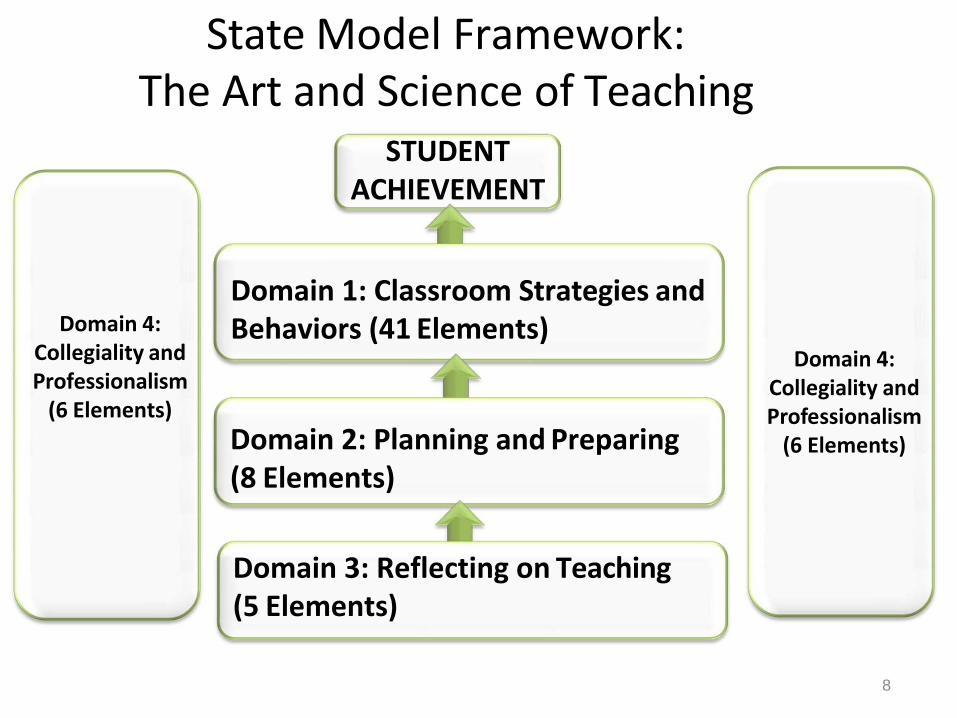
State Model Framework: The Art and Science of Teaching
STUDENT ACHIEVEMENT
Domain 1: Classroom Strategies and Domain 4: Behaviors (41 Elements)
Collegiality and Professionalism (6 Elements)
Domain 2: Planning and Preparing (8 Elements)
Domain 3: Reflecting on Teaching (5 Elements)
8
D ma C eg Pr fe sm
eme
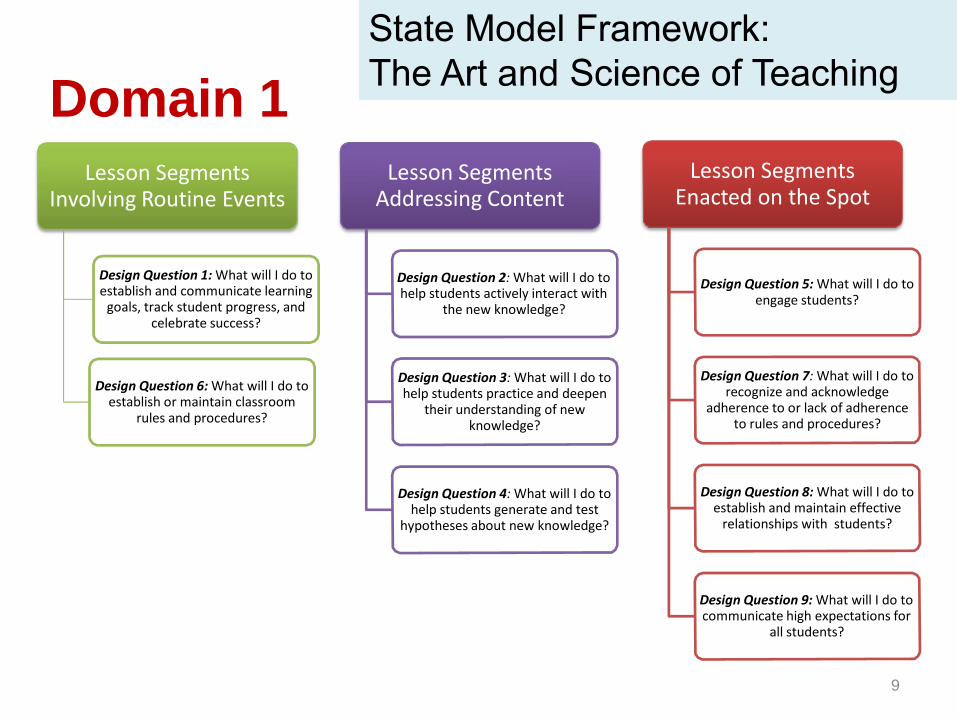
Domain 1
Lesson S s Add ssin Con n
Design Question 2: What will I do to help students actively interact with
the new knowledge?
Design Question 3: What will I do to help students practice and deepen
their understanding of new knowledge?
Design Question 4: What will I do to help students generate and test
hypotheses about new knowledge?
Lesson S s En d on h Spo
Design Question 5: What will I do to engage students?
Design Question 7: What will I do to recognize and acknowledge
adherence to or lack of adherence to rules and procedures?
Design Question 8: What will I do to establish and maintain effective relationships with students?
Design Question 9: What will I do to communicate high expectations for
all students?
Lesson S s In olvin Rou in E n s
Design Question 1: What will I do to establish and communicate learning goals, track student progress, and
celebrate success?
Design Question 6: What will I do to establish or maintain classroom
rules and procedures?
9
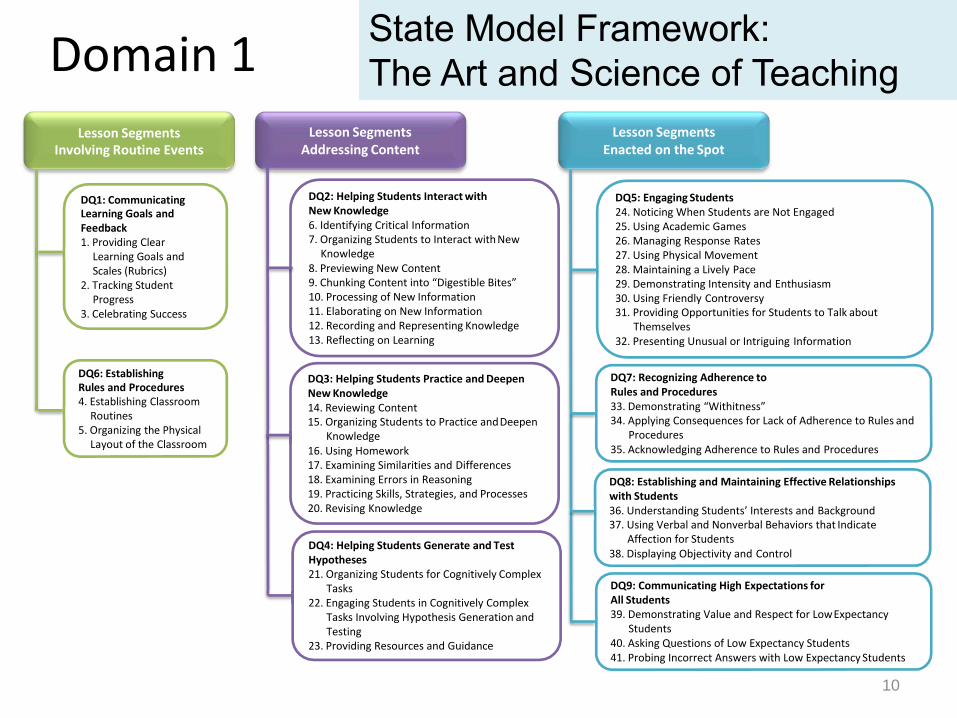
Domain 1
Lesson Segments Involving Routine Events
DQ C mmu c g e r g G ee c
o idin Cl a L ning oals and S l s (Rub i ) T a ing S udent o ss
C l b a in Su ss
D g e Pr ce re Establishin Cla oo outines
O anizing hysi al La ou of h Class oom
Lesson Segments Addressing Content
DQ2: Helping Students Interact with New Knowledge 6. Identifying Critical Information 7. Organizing Students to Interact with New Knowledge
8. Previewing New Content 9. Chunking Content into “Digestible Bites” 10. Processing of New Information 11. Elaborating on New Information 12. Recording and Representing Knowledge 13. Reflecting on Learning
DQ3: Helping Students Practice and Deepen New Knowledge 14. Reviewing Content 15. Organizing Students to Practice andDeepen
Knowledge 16. Using Homework 17. Examining Similarities and Differences 18. Examining Errors in Reasoning 19. Practicing Skills, Strategies, and Processes 20. Revising Knowledge
DQ4: Helping Students Generate and Test Hypotheses 21. Organizing Students for Cognitively Complex
Tasks 22. Engaging Students in Cognitively Complex
Tasks Involving Hypothesis Generation and Testing
23. Providing Resources and Guidance
Lesson Segments Enacted on the Spot
DQ5: Engaging Students 24. Noticing When Students are Not Engaged 25. Using Academic Games 26. Managing Response Rates 27. Using Physical Movement 28. Maintaining a Lively Pace 29. Demonstrating Intensity and Enthusiasm 30. Using Friendly Controversy 31. Providing Opportunities for Students to Talk about
Themselves 32. Presenting Unusual or Intriguing Information
DQ7: Recognizing Adherence to Rules and Procedures 33. Demonstrating “Withitness” 34. Applying Consequences for Lack of Adherence to Rules and
Procedures 35. Acknowledging Adherence to Rules and Procedures
DQ8: Establishing and Maintaining Effective Relationships with Students 36. Understanding Students’ Interests and Background 37. Using Verbal and Nonverbal Behaviors that Indicate
Affection for Students 38. Displaying Objectivity and Control
DQ9: Communicating High Expectations for All Students 39. Demonstrating Value and Respect for LowExpectancy
Students 40. Asking Questions of Low Expectancy Students 41. Probing Incorrect Answers with Low Expectancy Students
10

Two Major Components of the Evaluation System
Instructional Practice 50%
Performance of Students 50%
Performance of Students is focused primarily on student learning growth
12

Performance of Students
Performance of Students. At least 50% of a performance evaluation must be based upon data and indicators of student learning growth assessed annually and measured by statewide assessments or, for subjects and grade levels not measured by statewide assessments, by district assessments as provided in s. 1008.22(6), F.S.
‐ Section 1012.34(3)(a)1., Florida Statutes SB 736, The Student Success Act (2010)
13
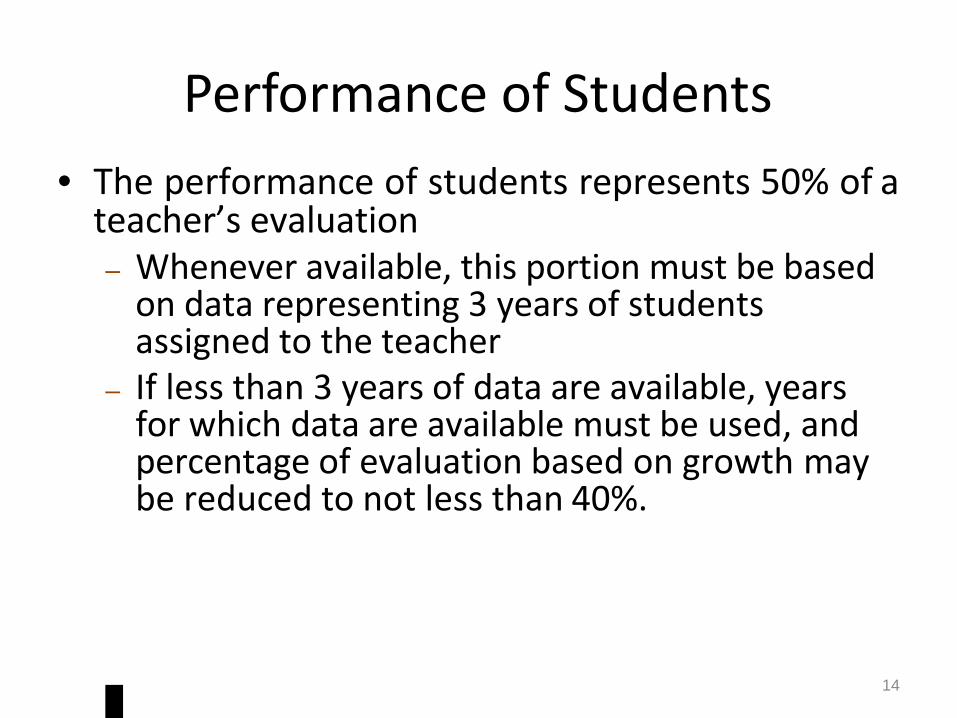
Performance of Students • The performance of students represents 50% of ateacher’s evaluation – Whenever available, this portion must be basedon data representing 3 years of studentsassigned to the teacher
– If less than 3 years of data are available, yearsfor which data are available must be used, and percentage of evaluation based on growth maybe reduced to not less than 40%.
14
Performance of Students There are 4 basic situations for classroom teachers: Teachers who teach grades or subjects not assessed by statewide standardized assessments Teachers who teach grades or subjects assessed by statewide standardized assessments for which there is not yet an approved statewide model Teachers who teach grades and subjects assessed by statewide standardized assessments for which there is an approved statewide model Teachers who teach a combination of courses falling into more than one of the above categories
15

Performance of Students
For teachers who teach subjects and grades not assessed by statewide assessments:
• Beginning in 2014‐15, districts shall measure growth usinga methodology determined locally. DOE has provided ongoing technical assistance to districts as they prepare for this transition. Additional resources include: – Item Bank and Test Platform which allows districts
to construct and share assessments generated from existing items, and to add new items to the bank.
– Whitepaper explaining how to determine what methodology is right for the district for calculating the student performance component for teachers
16
Performance of Students of subjects not assessed by statewide standardized assessments.
– Access to the department’s team of psychometricians and statisticians for help in determining how to develop or apply methodologies, including setting cut scores.
• Districts may also request through evaluation system review process to: – Use student achievement, rather than growth, orcombination
of growth and achievement for classroom teachers where achievement is more appropriate;
– Incorporate growth on statewide standardized assessments as part of the performance of students component of a teacher’s evaluation where appropriate by providing a rationale for doing so.
17

Performance of Students • For the 2014‐15 school year only, for classroom teachers of courses for which there are no statewide standardized assessments, districts may also: – Use measurable learning targets approved by the principal.
• Assign instructional personnel in an instructional team the growth of the team’s students on statewide assessments, with Superintendent’s approval.
Teachers who teach grades or subjects assessed by statewide standardized assessments for which there is not yet an approved statewide model: Options for districts are essentially the same as they are for teachers assessed using local assessments, except for the fact that
18

Performance of Students the statewide assessment data must be used in the calculation. The method (proficiency, growth, etc.) is determined by the district. Courses falling into this category currently include Science (5th and 8th grades only), Civics, Algebra 1 (in any grade other than 9th), Geometry, Algebra 2, Biology, U.S. History, Mathematics (3rd grade only) and ELA (3rd and 11th grades only).
Teachers who teach grades and subjects assessed by statewide standardized assessments for which there is an approved statewide model Must use approved model no later than the year after it is approved All currently approved models are covariate adjusted Value‐Added
19
Performance of Students Models (VAM) Courses falling into this category currently include ELA (4th through 10th grades), Mathematics (4th through 8th grades), and Algebra 1 (9th grade only)
Teachers who teach a combination of courses falling into more than one of the above categories Determining how to incorporate multiple measures into the performance of students component of a teacher’s evaluations in this situation is a local decision
The department, when asked, has recommended weightedaverages based on number of students on number of courses,but it is not required
20
FLORIDA’S VALUE ADDED MODEL
Overview of the Model to Measure Student Learning Growth on FCAT as developed by the Student Growth Implementation Committee
21

The Measure: Value‐Added Analysis
• A value‐added model measures the impact of a teacher on student learning, by accounting for other factors that may impact the learning process.
• These models do not: – Evaluate teachers based on a single year of student performance or proficiency (status model) or
– Evaluate teachers based on simple comparison of growth from one year to the next (simple growth)
18

Value‐Added Example Teacher X
500
400
300
200
100
0 StudentE
Prior Performance Current Performance Predicted Performance
A portion of the difference between the predicted performance and the actual performance represents the value‐added by the teacher’s instruction.
The predicted performance represents the level ofperformance the student is expected to demonstrate after statistically accounting for factors through a value‐added model.
19
Advantages of Value‐Added Models
• Teachers teach classes of students who enter with different levels of proficiency and possibly different student characteristics
• Value‐added models “level the playing field” by accounting for differences in the proficiency and characteristics of students assigned to teachers
• Value‐added models are designed to mitigate the influence of differences among the entering classes so that schools and teachers do not have advantages or disadvantages simply as a result of the students who attend a school or are assigned to a class
20

Florida’s Value‐Added Model Developed by Florida Educators
• The Department convened a committee of stakeholders (Student Growth Implementation Committee – or SGIC) to identify the type of model and the factors that should be accounted for in Florida’s value‐added models
• To provide technical expertise, the Department contracted with the American Institutes for Research (AIR) to help the SGIC develop the recommendedmodel that was adopted.
21
Florida’s Value‐Added Model Developed by Florida Educators
• The Student Growth Implementation Committee (SGIC) iscomposed of 27 members from across the state. The groupincludes: o Teachers (across various subjects and grade levels, including
exceptional student education) o School administrators o District‐level administrators (assessment and HR) o Postsecondary teacher educators o Representative from the business community o Parents
• The SGIC met from March through June 2011 o 2 two‐day in‐person meetings o 4 conference call meetings
22
Florida’s Value‐Added Model Developed by Florida Educators
• Model was not pre‐selected by the Department or a vendor
• SGIC process (including the presence of national expertise) allowed for questions, in‐depth discussions and perspectives to be shared from many points of view
• Nearly all votes of the SGIC were unanimous • The SGIC’s recommended model for FCAT data was fully
adopted by the Commissioner as Florida’s Value‐added Model with no additions, deletions, or changes
• See all materials and videos/recordings of committee proceedings at http://www.fldoe.org/committees/sg.asp
23
Florida’s Value‐Added Model Developed by Florida Educators
• After exploring eight different types of value‐added models, the SGIC recommended a model from the class of covariate adjustment models
• This model begins by establishing expected growth for each student: • Based on historical data each year • Represents the typical growth seen among students who have earned similar test scores the past two years, and share the other characteristics identified by thecommittee
24
Factors Identified by the SGIC to “Level the Playing Field”
To isolate the impact of the teacher on student learning growth, the model developed by the SGIC and approved by the Commissioner accounts for:
– Student Characteristics – Classroom Characteristics – School Characteristics
25

Factors Identified by the SGIC to “Level the Playing Field”
Student Characteristics: – Up to two prior years of achievement scores (the strongest predictor of
student growth) – The number of subject‐relevant courses in which the student is enrolled
– Students with Disabilities (SWD) status – English Language Learner (ELL) status – Gifted status – Attendance
– Mobility (number of transitions) – Difference from modal age in grade (as an indicator of retention)
Classroom characteristics: – Class size
– Homogeneity of students’ entering test scores in the class
26
Factors Identified by the SGIC to “Level the Playing Field”
The model recognizes that there is an independent factor related to the school that impacts student learning – a school component. – Statistically is simply the factors already controlled forin the model measured at the school level by grade and subject
– May represent the impact of the school’s leadership, the culture of the school, or the environment of the schoolon student learning
– Acts as another covariate, just like all other factors 27
Factors Identified by the SGIC to “Level the Playing Field”
SGIC decisions on the use of the school component – The SGIC decided to include 50% of the school component in the measurement of the teacher’s effectiveness
– By attributing a portion of the school component to the teacher in the measurement of her effectiveness, one recognizes that the teacher contributes somewhat to the overall school component, but there are factors imbedded in that component that are beyond his/her direct control and that s/he should not directly be held accountable for
28
Florida’s Value‐Added Model • The value‐added model is one part of a multi‐faceted teacher evaluation system
• The model was developed independently by acommittee of Florida educators
• The model accounts for factors outside the teacher’s control and does not rely on a singleyear of data or single test score
• The development process is an on‐going process – The SGIC, Department, and AIR will continue toanalyze the value‐added model and seek feedback to make adjustments, if necessary
29