overview of energgp()etic particle precipitation (epp ... of energgp()etic particle precipitation...
TRANSCRIPT

Overview of Energetic Particle Precipitation (EPP) g p ( )
Effects on the Earth's Atmosphere
Charles JackmanNASA Goddard Space Flight Center Greenbelt MDNASA Goddard Space Flight Center, Greenbelt, MD
October 9, 2012
Acknowledgments:Cora Randall
University of Colorado, Boulder, CO
Daniel Marsh, Francis Vitt, and Rolando GarciaNational Center for Atmospheric Research, Boulder, CO
Eric FlemingNASA Goddard Space Flight Center, Greenbelt, MD
Sh h i WShuhui WangJPL, California Institute of Technology, Pasadena, CA
Pekka VerronenPekka Verronen Finnish Meteorological Institute, Helsinki, FINLAND
Bernd FunkeInstituto de Astrofisica de Andalucia, CSIC, Granada, SPAIN
OutlineI. Introduction
II. EPP-caused HOx and Ozone Change
III. EPP-caused NOx, NOy, and Ozone Change
IV. Conclusions
I IntroductionI. Introduction
Ulti t i i f t E ti P ti lUltimate origin of most Energetic Particlesis the Sun
Galactic Cosmic Rays (GCRs)originate outside the Solar System
and will not be discussed
I IntroductionI. Introduction
Ulti t i i f t E ti P ti lUltimate origin of most Energetic Particlesis the Sun
Galactic Cosmic Rays (GCRs)Stay tuned f Jó E ill K i tjá ’ T lkoriginate outside the Solar System
and will not be discussed for Jón-Egill Kristjánsson’sTalk
at 11:10 Tomorrow about GCR impacts

Overview ofEnergetic Particle Precipitation
Electrons and Protonscomprise most (~90% or so) of these Particles
Higher flux of particles associated with:Higher flux of particles associated with:1) Solar flares, 2) Coronal mass ejections (CMEs),3) Geomagnetic storms

Animation ofC l M Ej tiCoronal Mass Ejection


Electron PrecipitationLower energy
Auroral electrons auroral zone [~62-75o geomag. lat.]
50o60o
70o 80o 90oN geomagnetic
40o
50
Medium & high energy electrons subauroral zone [~55-65o geom. lat.]
Each zone is ~9% of Earth area.

Protons also come via CMEs
Earthand enter through the magnetosphere
“S l P t E t (SPE)”
Earthnear the poles and precipitate there
“Solar Proton Event (SPE)”
GOES
Sun
GOES Geostationary Operational Environmental SatellitesGOES - Geostationary Operational Environmental Satellites
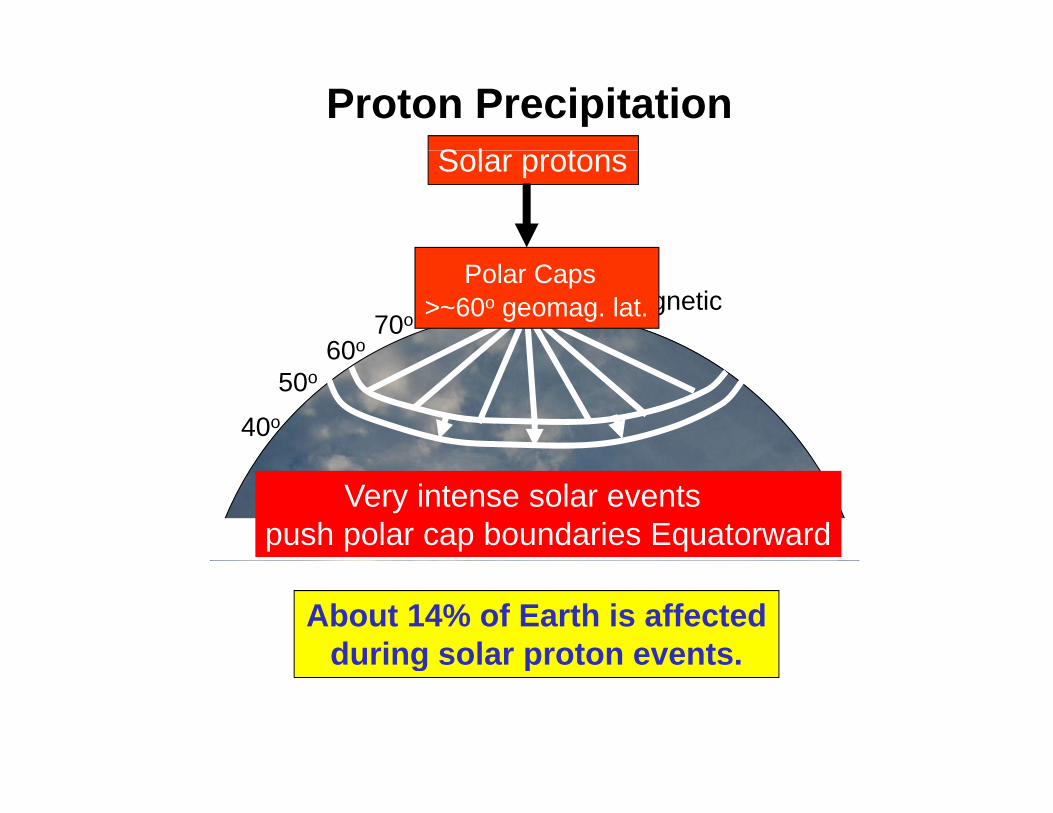
Proton PrecipitationS l tSolar protons
60o70o 80o 90oN geomagnetic
Polar Caps >~60o geomag. lat.
40o
50o60
Very intense solar events push polar cap boundaries Equatorward
About 14% of Earth is affectedduring solar proton events.during solar proton events.

125Thermosphere
100
m)
MesosphereMesopause
75
tude
(km Mesosphere
Middl
25
50
Alti
t
Stratosphere
StratopauseMiddleAtmosphere
0
25
TroposphereTropopause
Atmospheric Structure

1 keV electron
125Thermosphere 1 MeV proton
10 keV electron
100
m)
MesosphereMesopause
10 MeV proton100 keV electron
75
tude
(km Mesosphere p
Middl
1 MeV electron
25
50
Alti
t
Stratosphere
Stratopause100 MeV protonMiddleAtmosphere
Bremsstrahlungpenetrate further
0
25
TroposphereTropopause
Atmospheric Structure

Atmospheric Influences ofAtmospheric Influences ofEnergetic Particle Precipitation
M t (70 80%) f th E D it dMost (70-80%) of the Energy Deposited creates Ion Pairs:
free Electron & positive Ion

Energetic Particle Precipitation
Medium & High Energy Electrons
Solar Protons
What are the dates of some large Solar Proton Events?Solar Proton Events?

Largest 15 Solar Proton Events (SPEs) in Past 50 YearsDate of Computed Rank Date of Computed Rank
SPEs (Total Ion Pair Production) October 1989 1
Note that seven
August 1972 2July 2000 3October 28-31, 2003 4
of the largest SPEsoccurred in 2000-2005!
November 5-7, 2001 5November 2000 6September 2001 7
Note that two
pAugust 1989 8November 23-25, 2001 9March 2012 10 Note that two
of the largest SPEsoccurred in 2012!
September 1966 11January 2012 12January 2005 13January 2005 13Sep. 29 – Oct. 3, 1989 14Jan. 28 – Feb. 1, 1967 15

Large SPE – GOES Proton Flux Data (March 6-11, 2012)
Note the large (>100X)
> 10 MeV104
-1 103
enhancement !
> 10 MeV
m-2
s-1sr
- 103
102
101
rtic
les c
m 10100
10-1
6 7 8 9 10 11 12Day in March 2012
Par
10-2
Day in March 2012

Ionization Rates (#cm-3 s-1) – March 6-11, 2012
500
Mesosphere
200
500
100 Stratosphere
Day in March
P t f 1 300 M V i l d d
Contour levels: 100, 200, 500, 1000, & 2000 (#cm-3 s-1)
Protons from 1-300 MeV included

Energetic Particles also ProduceEnergetic Particles also Produce HOx (H,OH,HO2) & NOx (N,NO,NO2)
Both of which can destroy Ozone

II EPP caused HO andII. EPP-caused HOx andOzone ChangeOzone Change

EPPs Enhance HO (H OH HO )HOx (H, OH, HO2)
• HOx constituents are produced through waterHOx constituents are produced through water cluster ion formation & neutralization– Primarily short-term effects as HOx lifetime is short
(~hours) in the atmosphere
HO d i b EPP b h h• HOx production by EPPs to be shown here:
– For Solar Proton Event in March 2012
– For Electron Precipitation in April 2006

Solar Proton HOx Production

Ionization RatesIonization Rates (top) &
HO Production
f
HOx Production Rates (bottom)
100200
500
for March 6-11, 2012 Day in March 2012
Contour levels: 100, 200, 500, 1000,
2000 & 5000 (#cm-3 s-1)200
500
2000, & 5000 (#cm s ) 100
Aura MLS(Microwave Limb Sounder)(M c o a e b Sou de )
measures HO2 and Ozone
MLS and 2D Model HO2 Polar NH (60-82.5o)March 6-11, 2012
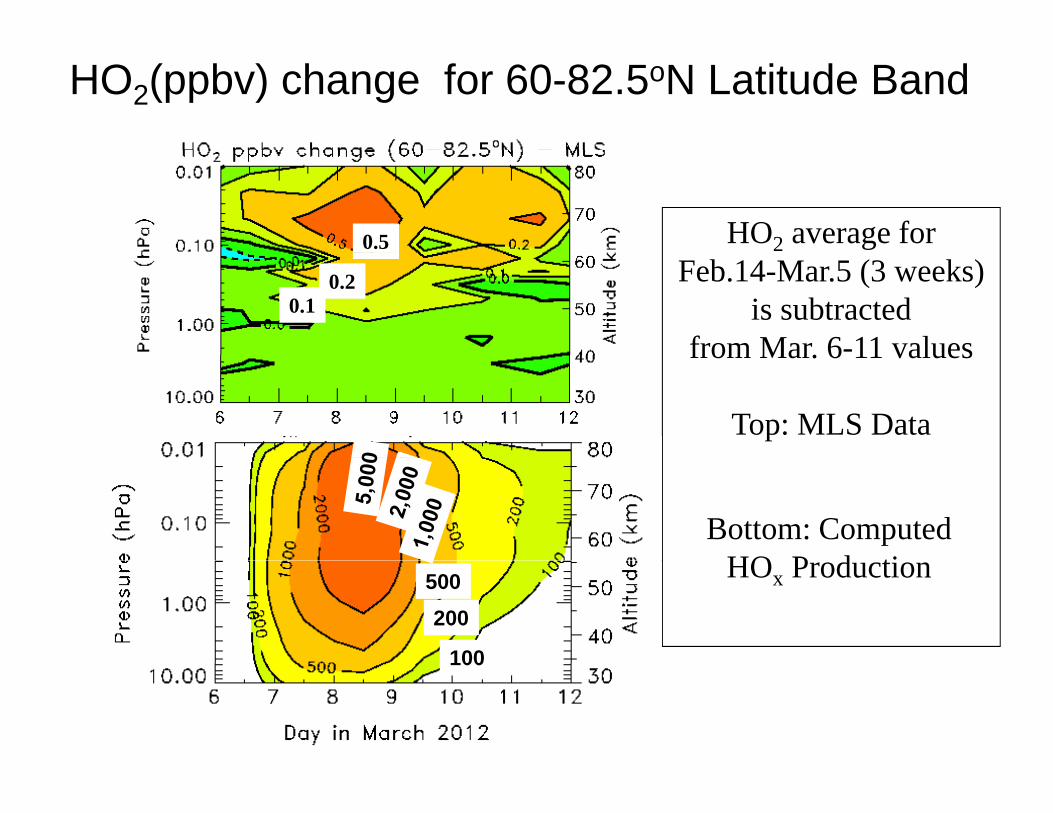
HO2(ppbv) change for 60-82.5oN Latitude Band
HO2 average for0.5Feb.14-Mar.5 (3 weeks)
is subtractedfrom Mar. 6-11 values
0.10.2
from Mar. 6 11 values
Top: MLS DataDay in March 2012Day in March 2012
Bottom: ComputedHO P d tiHOx Production
100
200500
100

Ozone ImpactOzone Impact– March 2012 SPE
Aura MLS observations
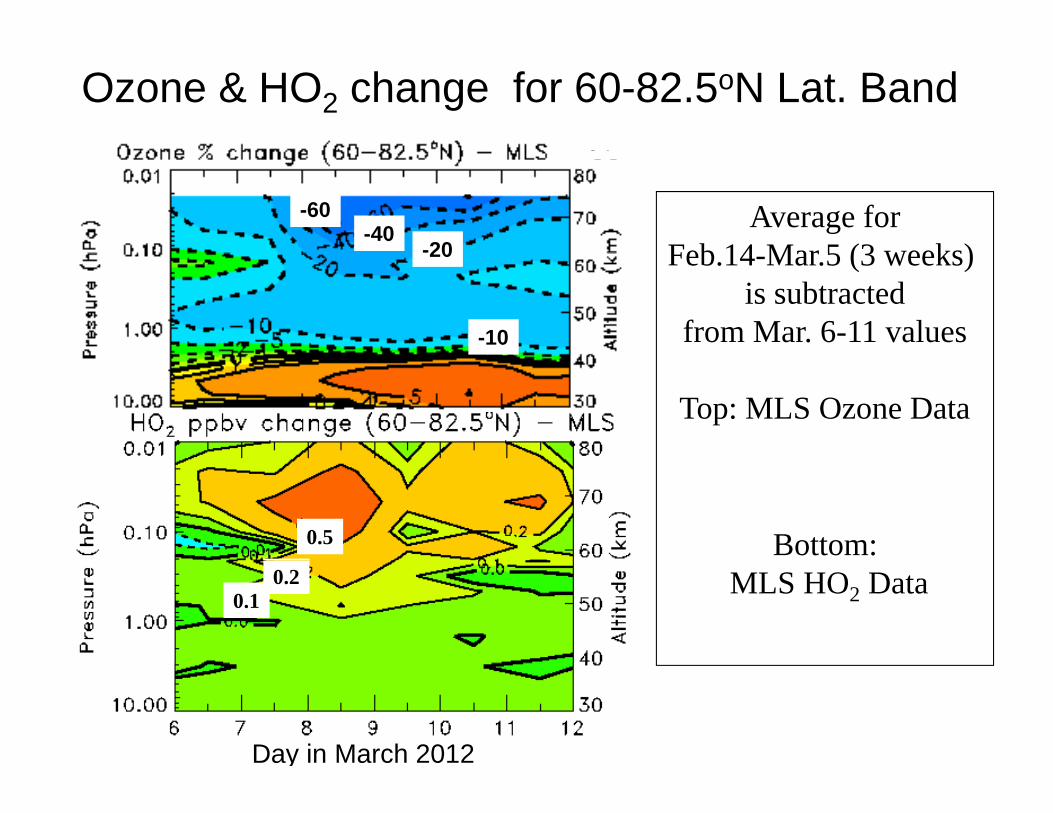
MLS and 2D Model Ozone Polar NH (60-82.5o)March 6-11, 2012 Ozone(%) change for 60-82.5oN Latitude BandOzone & HO2 change for 60-82.5oN Lat. Band
Average forFeb 14 Mar 5 (3 weeks)-20
-40-60
Feb.14-Mar.5 (3 weeks) is subtracted
from Mar. 6-11 values-10
20
Day in March 2012Top: MLS Ozone Data
2D ModelDay in March 2012
Bottom: 0.5
MLS HO2 Data0.1
0.2
Day in March 2012

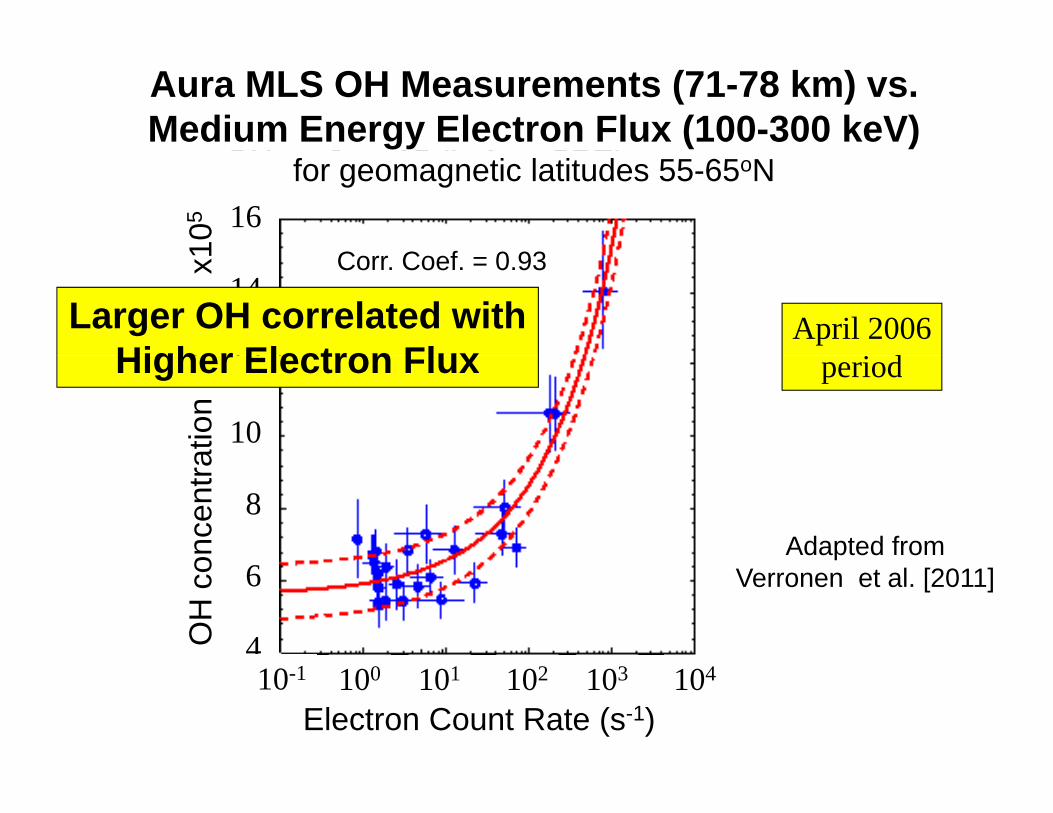
OH ProductionOH Production– Precipitating Electrons in April 2006
Aura MLS - OH observations
Adapted from Verronen et al. [2011]
OH J 15 (b f SPE)
Aura MLS OH Measurements (71-78 km) vs.Medium Energy Electron Flux (100-300 keV)
1610
5OH on Jan. 15 (before SPE)
C C f 0 93
for geomagnetic latitudes 55-65oN
12
14
m-3
] x
1
April 2006i d
Corr. Coef. = 0.93
Larger OH correlated withHigher Electron Flux
10
12
atio
n [c
m periodHigher Electron Flux
8
once
ntra
Adapted from
4
6
OH
co Verronen et al. [2011]
10-1
Electron Count Rate (s-1)100 101 102 103 104

III. EPP-caused NOx , NOy, and Ozone Change

EPPs EnhanceNO (N NO NO )NOx (N, NO, NO2)
• NO constituents are produced by primary electrons• NOx constituents are produced by primary electrons and protons and associated secondary electrons dissociating N2g 2– Short- and long-term effects as NOx constituents can last
for weeks
• SCISAT-1 ACE (Atmospheric Chemistry Experiment) NO (NO NO ) tit tmeasures NOx (NO+NO2) constituents
Adapted from Randall et al. [2006]
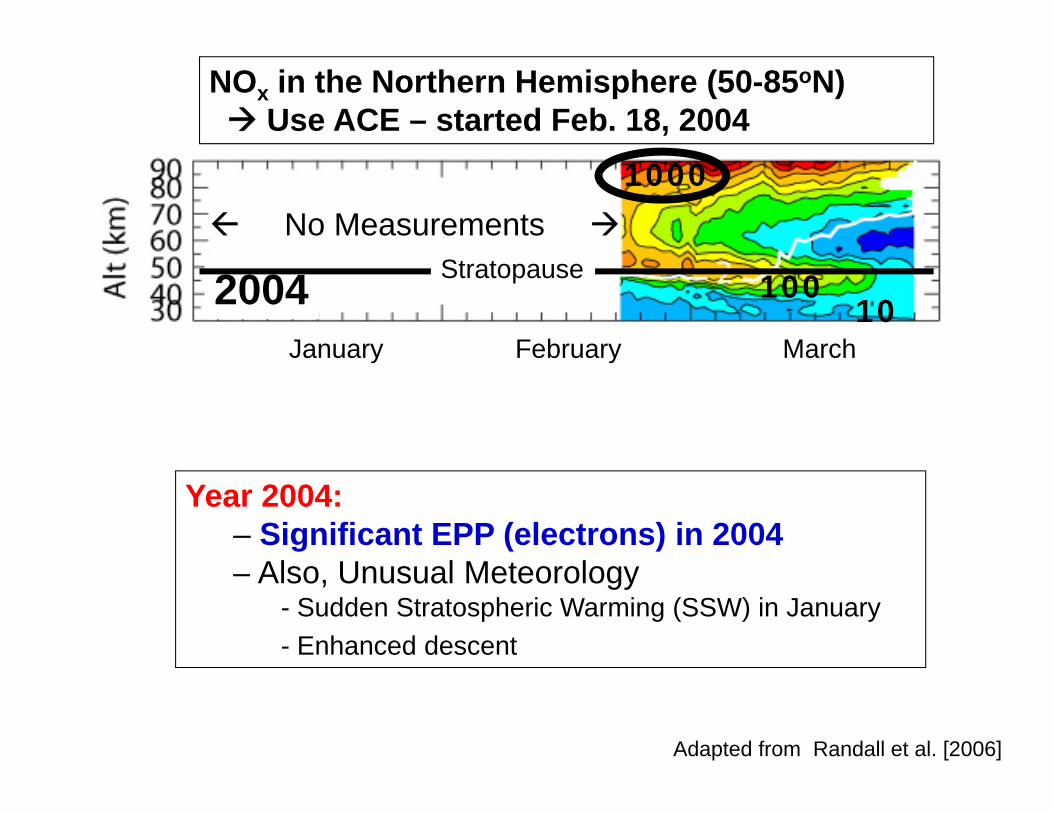
NOx in the Northern Hemisphere (50-85oN) Use ACE – started Feb. 18, 2004
1000 No Measurements
2004January February March
10Stratopause 100
January February March
Year 2004:– Significant EPP (electrons) in 2004
Al U l M l– Also, Unusual Meteorology- Sudden Stratospheric Warming (SSW) in January- Enhanced descent
Adapted from Randall et al. [2006]

NOx in the Northern Hemisphere (50-85oN) Use ACE – started Feb. 18, 2004
1000 No Measurements
2004January February March
10100Stratopause 100
January February March
Downward transport of NOxfrom the Mesosphere to the Upper Stratosphere
Year 2004:– Significant EPP (electrons) in 2004
Al U l M l– Also, Unusual Meteorology- Sudden Stratospheric Warming (SSW) in January- Enhanced descent
Adapted from Randall et al. [2006]
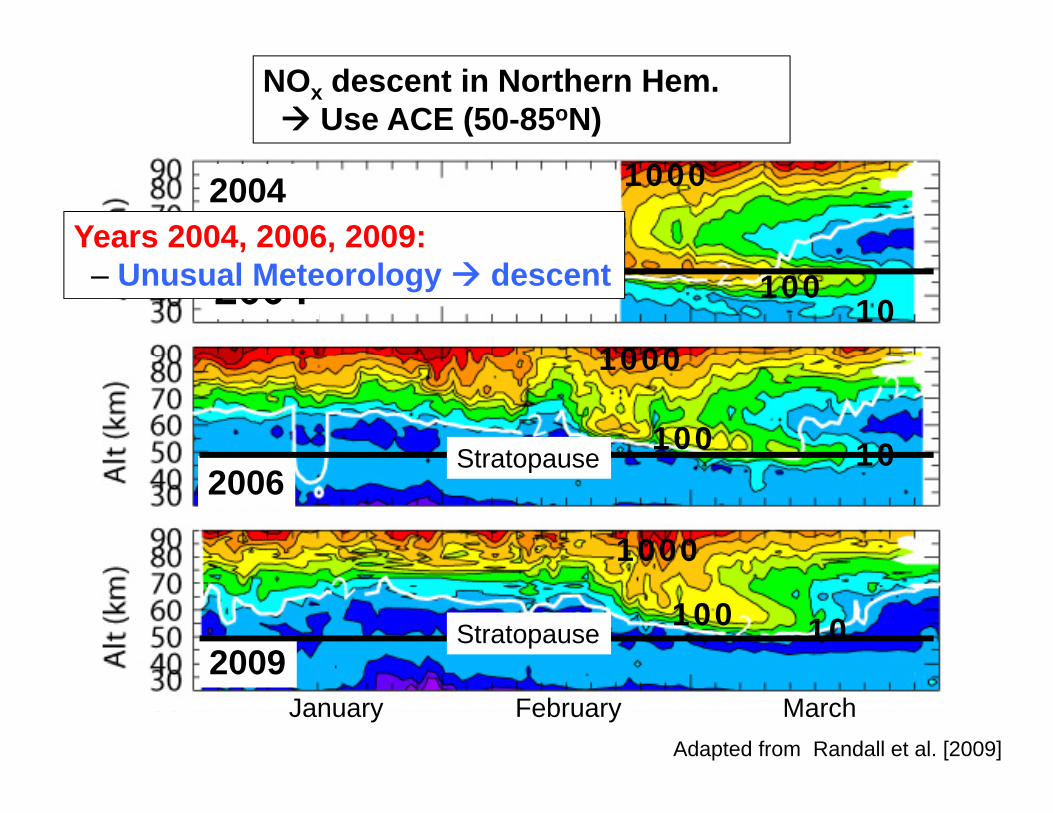
NOx descent in Northern Hem. Use ACE (50-85oN)
2004 1000
Years 2004, 2006, 2009:
2004 10100
1000
Stratopause– Unusual Meteorology descent
10
1000
100Stratopause
200610
1000
Stratopause
200910100
1000
Stratopause2009
January February MarchAdapted from Randall et al. [2009]

NOx descent in Northern Hem. Use ACE (50-85oN)Also, note that:
Years 2005, 2007, 2008, 2010, & 2011 2004 1000
, , , ,did not show enhanced descent
Years 2004, 2006, 2009:
2004 10100
1000
100Stratopause– Unusual Meteorology descent
10
1000
100100Stratopause
200610
1000
Stratopause
However: Yrs 2006 and 2009 did t h h
200910100
1000
100Stratopause
did not show much NOx descent to stratosphere
2009January February March
Adapted from Randall et al. [2009]

Now back to Year 2004:
How did the electron-produced NOximpact Ozone?impact Ozone?
Use data from POAM (Polar Ozone and Aerosol Measurement) instrumentsand Aerosol Measurement) instruments
Adapted from Randall et al. (2005)
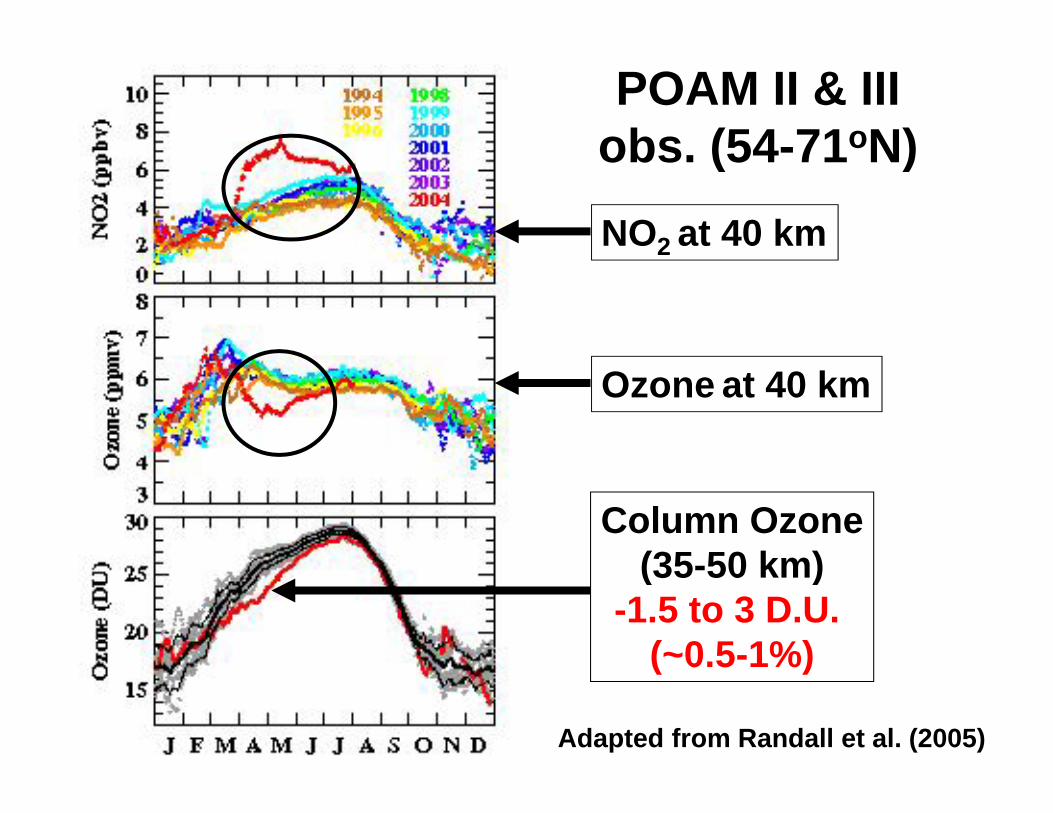
POAM II & IIIobs (54-71oN)obs. (54-71 N)
NO2 at 40 km2
Ozone at 40 km
Column Ozone(35 50 km)(35-50 km)
-1.5 to 3 D.U. (~0.5-1%)
Adapted from Randall et al. (2005)
( 0.5 1%)

POAM II & IIIobs (54-71oN)obs. (54-71 N)
NO2 at 40 km2
Year 2004 appears to be very Ozone at 40 kmexceptional for EPP (electron)
NO transport to the StratosphereColumn Ozone
(35 50 km)
NOx transport to the Stratosphere
(35-50 km)-1.5 to 3 D.U.
(~0.5-1%)
Adapted from Randall et al. (2005)
( 0.5 1%)

Does the electron-caused Ozone change impact Climate?
Stay tuned for Annika Seppälä’sTalkfor Annika Seppälä sTalk
at 16:30 Todayat 16:30 Today for more information

Date of Computed Rank
Largest 15 Solar Proton Events (SPEs) in Past 50 YearsDate of Computed Rank
SPEs (Total Ion Pair Production) October 1989 1August 1972 2July 2000 3October 28-31, 2003 4
“Halloween” SPEof Oct. 2003
November 5-7, 2001 5November 2000 6September 2001 7
of Oct. 2003 was Very Large
pAugust 1989 8November 23-25, 2001 9March 2012 10September 1966 11January 2012 12January 2005 13January 2005 13Sep. 29 – Oct. 3, 1989 14Jan. 28 – Feb. 1, 1967 15

In memory of:ESA Envisat
(1 March 2002 8 April 2012)(1 March, 2002 – 8 April, 2012) Over 10 years of Earth observations
MIPAS, SCIAMACHY, & GOMOS Instruments provided greatInstruments provided great
measurements of EPP impact th At hon the Atmosphere

MIPAS provided measurements ofpmost NOy constituents:
NO, NO2, N2O5, HNO3 , HO2NO2, ClONO2
Only missing N, NO3, BrONO2, which are minuscule in the middle atmospherewhich are minuscule in the middle atmosphere.
NOy lifetime can be long (~months) NOy lifetime can be long ( months)
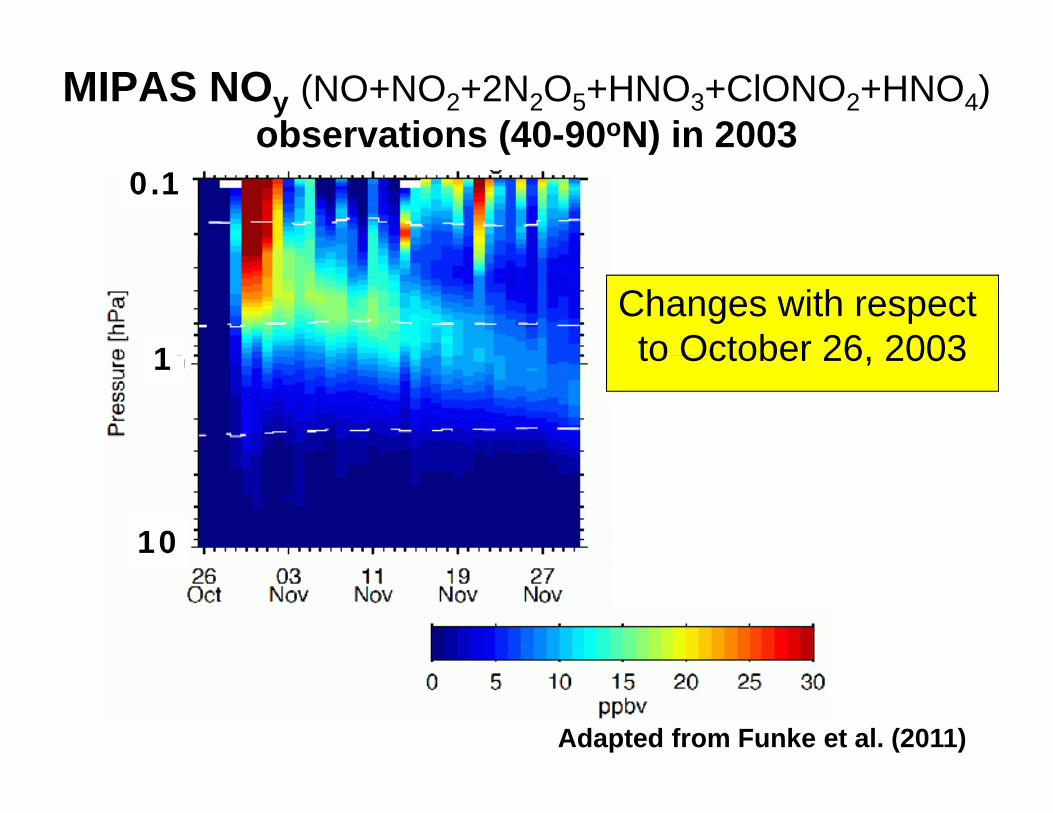
MIPAS NOy (NO+NO2+2N2O5+HNO3+ClONO2+HNO4)observations (40-90oN) in 2003( )
0.1
Changes with respect to October 26 20031 to October 26, 20031
10
Adapted from Funke et al. (2011)

Model
• Whole Atmosphere Community Climate Model p y(WACCM) – NCAR Model
- Domain [90oS – 90oN, 0 - 145 km] Ground to
Lower Thermosphere!
- Atmospheric physics & photochemistry - Specified dynamics from measurements for 2003
• Perturbed: Simulation ‘With’ SPEs
D. Marsh et al.

NOy (40-90oN) in 2003MIPAS WACCM
0.1 0.1
1 1
Changes with respect
1 1
10 10
g pto October 26, 2003
Adapted from Funke et al. (2011)

More WACCM Simulations
• Perturbed (1963-2004): Four realizations ‘With’ SPEs
Interactive dynamics
Perturbed (1963 2004): Four realizations With SPEs
• Base (1963-2004): Four realizations ‘Without’ SPEs
• Difference mean of Perturbed and Base results to compute SPE-caused change
Look at Averagegfor Years 2000-2004

Perturbed – Base (2000-2004 average)
50
100
-5
-2
10
20
50
5
10-2
5
2
Very Large SPEs in 2000, 2001, & 2003From Jackman et al. (2009)

Perturbed – Base (2000-2004 average)
C l d R iFrom Jackman et al. (2009)
Colored Regions are Statistically Significant to 95% (Student’s t-test)

Perturbed – Base (2000-2004 average)
Large stratospheric areawith statistically significant
Some stratospheric areawith statistically significantwith statistically significant
NOy increasewith statistically significant Ozone decrease (mainly NH)
Ozone decreaseOzone decrease more NOy-induced O3 loss
Ozoneiincrease
Interference of NOy with Cl/Br O3 loss
C l d R iFrom Jackman et al. (2009)
Colored Regions are Statistically Significant to 95% (Student’s t-test)

Do Solar Proton Events impact Total Ozone?impact Total Ozone?
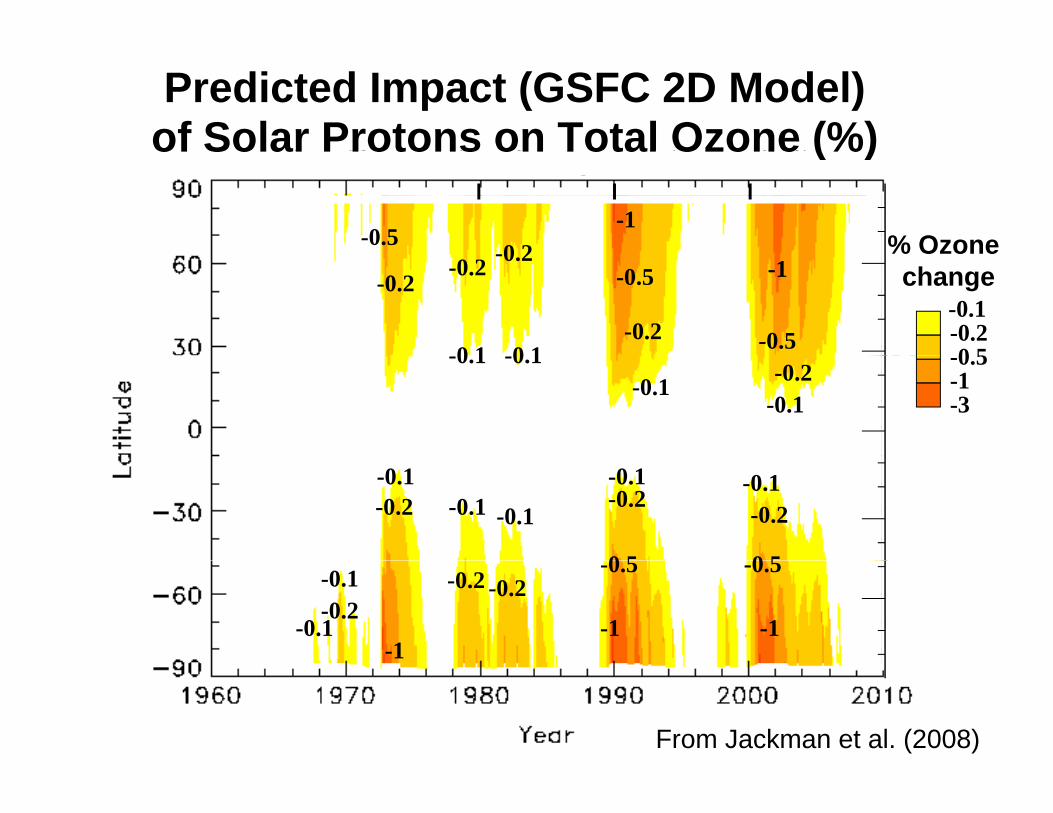
Predicted Impact (GSFC 2D Model) of Solar Protons on Total Ozone (%)of Solar Protons on Total Ozone (%)
% Ozone-1
0 2-0.5
-0.1-0.20 5
% Ozonechange
-0.2
-0.5 -1
0 10 1
-0.2-0.2
-0.2
-0.5-0.5-1-3
-0.1-0.1
-0.1-0.1-0.2
-0.1-0.1-0.1-0.1 -0.1 -0.2
-0.2-0.2
0 5 0 5
-1 -1-1
-0.1
-0.1 -0.2-0.2-0.5 -0.5
-0.2
From Jackman et al. (2008)

Predicted Impact (GSFC 2D Model) of Solar Protons on Total Ozone (%)of Solar Protons on Total Ozone (%)
% Ozone-1
0 2-0.5
-0.1-0.20 5
% Ozonechange
-0.2
-0.5 -1
0 10 1
-0.2-0.2
-0.2
-0.5
Larger decreases in NH caused by1989, 2001, & 2003 SPEs
-0.5-1-3
-0.1-0.1
-0.1-0.1-0.2
-0.1-0.1-0.1-0.1 -0.1 -0.2
-0.2-0.2
0 5 0 5Larger decreases in SH caused by
1972 1989 & 2000 SPEs
-1 -1-1
-0.1
-0.1 -0.2-0.2-0.5 -0.5
-0.2
1972, 1989, & 2000 SPEs
From Jackman et al. (2008)

Predicted Impact (GSFC 2D Model) of Solar Protons on Total Ozone (%)of Solar Protons on Total Ozone (%)
% Ozone-1
0 2-0.5
-0.1-0.20 5
% Ozonechange
-0.2
-0.5 -1
0 10 1
-0.2-0.2
-0.2
-0.5
Larger decreases in NH caused by1989, 2001, & 2003 SPEs
Computed Total Ozone decreasesfrom SPEs are <3% -0.5
-1-3
-0.1-0.1
-0.1-0.1-0.2from SPEs are <3%.
These can be compared -0.1-0.1-0.1
-0.1 -0.1 -0.2-0.2-0.2
0 5 0 5Larger decreases in SH caused by
1972 1989 & 2000 SPEs
with measured interannual variability of up to ~10%, thus are not observable
-1 -1-1
-0.1
-0.1 -0.2-0.2-0.5 -0.5
-0.2
1972, 1989, & 2000 SPEso up to 0%, t us a e ot obse ab e
From Jackman et al. (2008)

IV. Conclusions• Both electrons & protons influence the polar
mesosphere/stratosphere – mainly in certain years e.g., near solar max, large Ap, unusual meteorology
• EPP produces HO which is short-livedEPP produces HOx, which is short lived Mesospheric Ozone depletion can be large (>20%)
• EPP produces long-lived NOy (1972,’89, 2000, ‘01, ‘03,’04, ‘06?)
Stratospheric Ozone impacts can last for months Computed total ozone changes are small (<3%)

Addendum:Addendum:EPP also impacts other constituents (e g HNO N O HO NO N O ClONO(e.g., HNO3,N2O5,HO2NO2,N2O,ClONO2,
ClO,HOCl,HCl,CO,H2O2) & T
Th k f tt ti !Thank you for your attention!