overview of aquaculture. world annual average per capita consumption of fish and fishery products...
TRANSCRIPT

Overview of Aquaculture

World annual average per capita World annual average per capita consumption of fish and fishery productsconsumption of fish and fishery products
(kg/capita)(kg/capita)
11.511.5 12.512.5
16.716.7
1970s1970s 1980s1980s 20062006
14.514.5
1990s1990s
16.7?16.7?
20302030

Million tonnes
World Fish Production (1951-2006)
0.0
20.0
40.0
60.0
80.0
100.0
120.0
140.0
160.0
1951 1956 1961 1966 1971 1976 1981 1986 1991 1996 2001 2006
Mill
ion
tonn
es
Capture (marine waters) Capture (inland waters) Total aquaculture
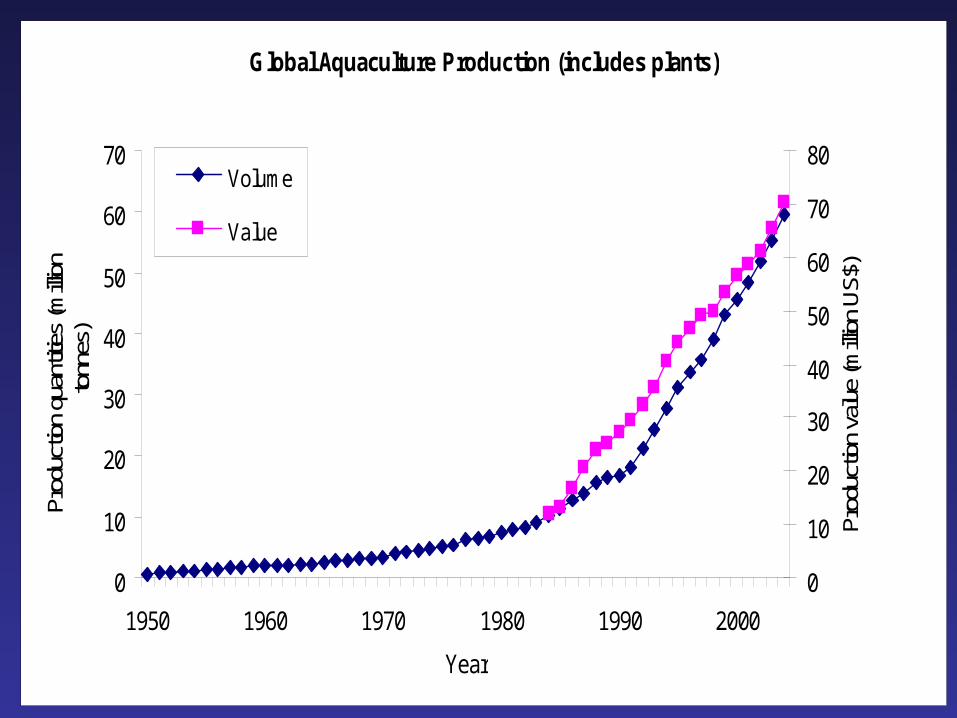
Global Aquaculture Production (includes plants)
0
10
20
30
40
50
60
70
1950 1960 1970 1980 1990 2000
Year
Prod
uctio
n qu
antit
ies
(milli
on
tonn
es)
0
10
20
30
40
50
60
70
80
Prod
uctio
n va
lue
(milli
on U
S$)
Volume
Value

Global Aquaculture Production
Rest of World
Asia
0
10
20
30
40
50
60
70
1950 1960 1970 1980 1990 2000
Year
Pro
duct
ion
quan
tity
(tonn
e x
106 )
China vs Rest of Asia
Rest of Asia
China
0
20
40
60
1950 1970 1990Year
Pro
duct
ion
quan
tity
(ton
ne x
106
)

Contribution to food-fish supply
0
20
40
60
80
100
120
1970 1975 1980 1985 1990 1995 2000 2005
millio
n ton
nes
0.0%
10.0%
20.0%
30.0%
40.0%
50.0%
AquacultureCaptureAQ share

Aquaculture Production
Aquaculture Production
05,000,000
10,000,00015,000,00020,000,00025,000,00030,000,00035,000,00040,000,00045,000,00050,000,000
Year
Tons
Crustacea
Herbivores
Plankton Feeders
Carnivores
Molluscs
Omnivores

Aquaculture Production
Aquaculture Production in Major Environments
0%
20%
40%
60%
80%
100%
1980
1982
1984
1986
1988
1990
1992
1994
1996
1998
2000
2002
2004
Year
Perc
enta
ge P
rodu
ctio
n
Mariculture
Freshwater
Brackish

Contribution of fish to human diet (2003)
22.0
18.7
10.0
9.8
7.7
6.7
19.4
15.5
0 5 10 15 20 25
Asia
Africa
Europe
Oceania
North and Central America
South America
LIFDC's
WORLD
Fish as percentage of total animal protein intake

Fish is the most valuable exported agricultural Fish is the most valuable exported agricultural commodity from developing countriescommodity from developing countries
Net exports of selected agricultural commodities by developing countries
-5.0
0.0
5.0
10.0
15.0
20.0
Fish Coffee Cocoa Bananas Rubber Sugar Tea Rice Tobacco Meat
US$ billions
1982
1992
2002
Figure 32. Skipjack tuna prices (c&f) in the United States, Thailand and Africa
200
500
800
1100
1400
Jan-88
Jan-89
Jan-90
Jan-91
Dec-91
Jan-93
Jan-94
Jan-95
Jan-96
Jan-97
Jan-98
Jan-99
Jan-00
Jan-01
Jan-02
Jan-03
Jan-04
US$/tonne
USA
Thailand
Africa

Fish exports (1976–2005)
US$ billion
10
20
30
40
1976 78 80 82 84 86 88 90 92 94 96 98 2000 2002 2004
year
US$
bill
ion
Developed countries or areas Developing countries or areas

Imports
Japan 18%
USA 15%
Others7%
Developing countries
18%
EU (25)40%
Exports
Japan 2%
EU (25)25%
Others20%
USA 5%
Developing countries
48%
World Fish Trade 2005 (by value)

Commodity breakdown (Trade)
8%
19%
8%
4%
12%3%3%1%
42%
TunaShrimpSalmonPelagicsDemersalsCephalopodsFishmealFish oilOthers

• Aquaculture still is the Aquaculture still is the fastest growingfastest growing food producing sector in the world.food producing sector in the world.
• Aquaculture now accounts for Aquaculture now accounts for almost almost 50%50% of the global of the global food fishfood fish..
• In 2006 In 2006 51.7 million51.7 million tonnes of aquatic tonnes of aquatic animals worth animals worth USD 78.8 billionUSD 78.8 billion were were produced globally.produced globally.
• Given the projected population growth, Given the projected population growth, an additional an additional 27 million tonnes27 million tonnes of of aquatic aquatic foodfood will be required by will be required by 20302030, at least to , at least to maintain the current per caput maintain the current per caput consumption.consumption.

• Since 1970, aquaculture sector Since 1970, aquaculture sector maintained an average annual rate of maintained an average annual rate of growth of growth of 8.7 percent8.7 percent worldwide, and worldwide, and
• 6.5 percent6.5 percent per year when per year when excluding excluding China.China.
• The rate of growth of aquaculture The rate of growth of aquaculture production production between 2004 and 2006between 2004 and 2006 were were 6.1 percent in volume6.1 percent in volume and and 11.0 11.0 percent in valuepercent in value. .

Aquaculture trends and forecastAquaculture trends and forecast
• Aquaculture will intensify, diversify, and expand• Production of all species groups (including
seaweeds) will be increased• New species will appear• All environments will be increasingly utilized• More and more resources will be used in
increasing quantities.• More people will be involved in aquaculture
production.• More and more constraints to be faced!

Fisheries stock enhancement
Fisheries stock enhancement
Bait productionBait production
OrnamentalsOrnamentals BiomedicalBiomedical
Photograph by HBOI Photograph by HBOI
Photograph by HBOI Photograph by HBOI

Commercially Cultured Commercially Cultured Species Species
Commercially Cultured Commercially Cultured Species Species
Photograph by HBOI
CatfishCatfishTilapiaTilapiaTroutTrout
SalmonSalmon Striped BassStriped Bass
OystersOystersClamsClamsShrimpShrimp
CatfishCatfishTilapiaTilapiaTroutTrout
SalmonSalmon Striped BassStriped Bass
OystersOystersClamsClamsShrimpShrimp

Research and Development Research and Development Species Species
Research and Development Research and Development Species Species SnapperSnapper
CobiaCobiaFlounderFlounderPompanoPompanoSturgeonSturgeonTunaTunaConchConchLobsterLobster
SnapperSnapperCobiaCobiaFlounderFlounderPompanoPompanoSturgeonSturgeonTunaTunaConchConchLobsterLobster
Photograph by HBOI

Aquaculture SystemsAquaculture Systems
• Open– Netpens, cages, longlines, bottom
culture
• Semi-closed– Ponds, raceways, tanks
• Closed– raceways, tanks
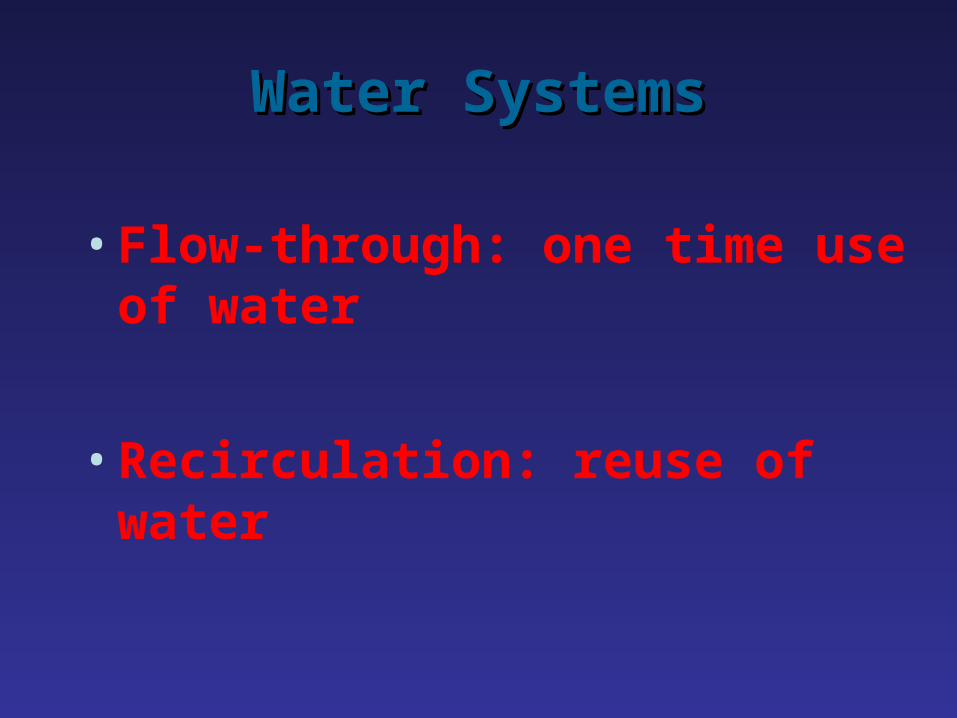
Water SystemsWater Systems
• Flow-through: one time use of water
• Recirculation: reuse of water

Aquaculture systems: Closed
• Water is reused - little or no effluent• Sophisticated water filtration and treatment• Recirculating aquaculture systems,
aquariumsPhotograph by HBOI

Aquaculture systems: Flow-throughAquaculture systems: Flow-through
PretreatmentWaterSource
RearingTank
Effluent
Photographs by HBOI

Aquaculture systems: Aquaculture systems: RecirculatingRecirculating
Pretreatment
RearingTank
WaterSource
Post treatmentEffluent
Water treatment Biofiltration Disinfection
Photographs by HBOI

Recirculating aquaculture systemsRecirculating aquaculture systems
Disadvantages• Higher costs• Higher skill level• Complex system, potential problems• Must provide all feed • Buildup of toxins & pathogens
Advantages• Environmental control• Free of outside contaminants• Fewer regulatory constraints

Open systems:Ponds

Ponds

Open systems:Net Cages
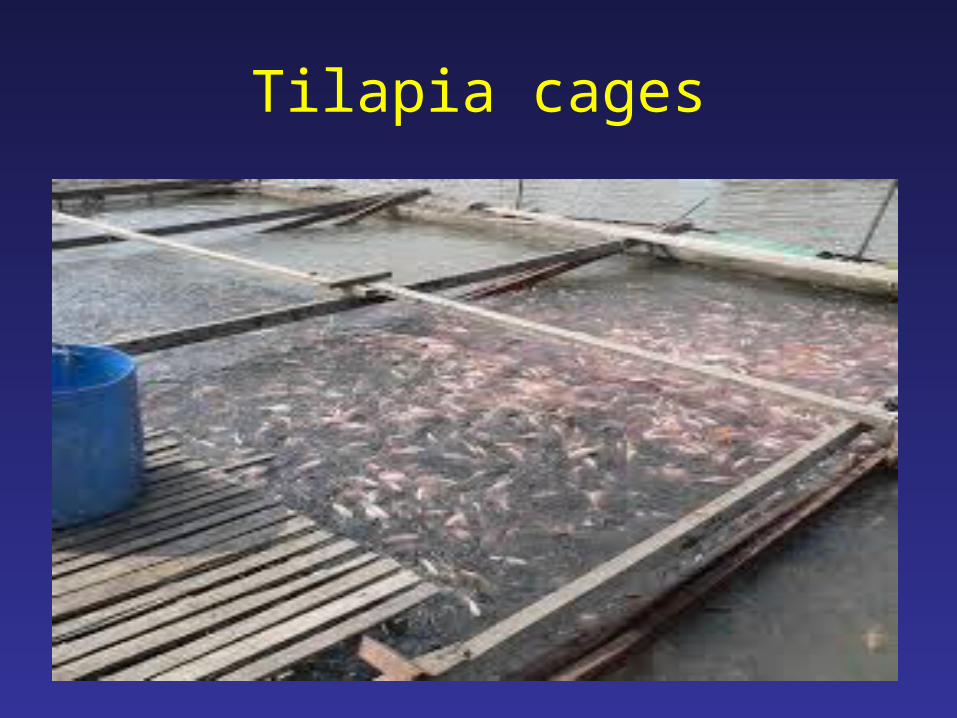
Tilapia cages

Red tilapia


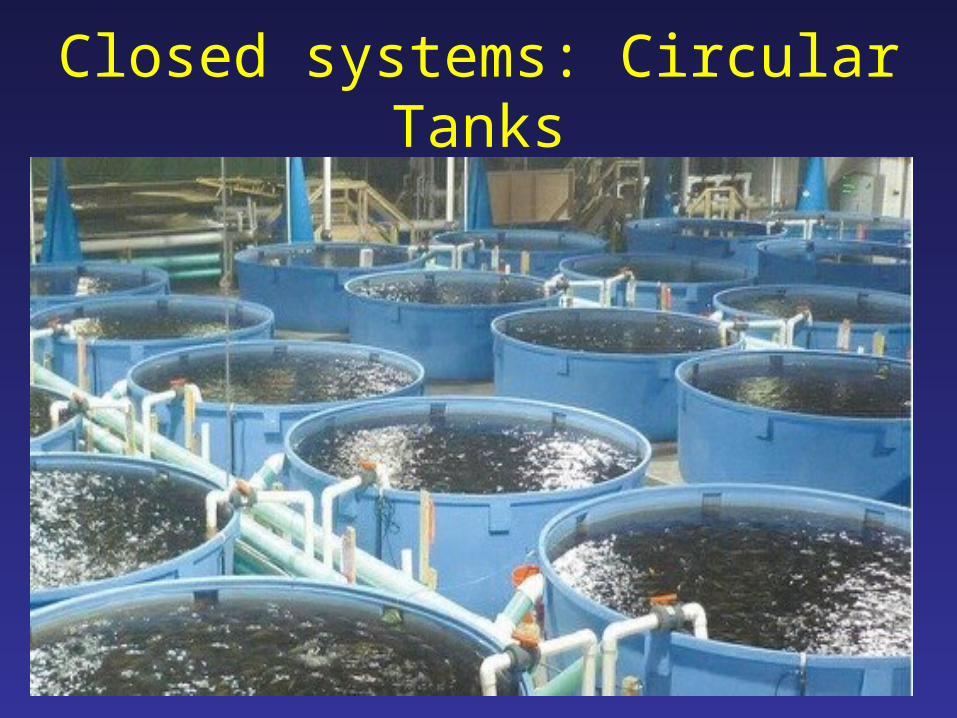
Closed systems: Circular Tanks

Rectangular tanks

Tilapia Aquaponics

Aquaponics

Aquaponics

Aquaponics