overview grace monthly estimates compared with …€¦ · grace monthly gravity estimates have...
TRANSCRIPT
ESS EARTH SCIENCESSECTOR
SECTEUR DES SCIENCESDE LA TERRESST
1 3 4A. Lambert J. Henton , . Winester1 2 & 3 4 Natural Resources Canada (Geological Survey of Canada); Natural Resources Canada (Geodetic Survey Division); National Oceanic & Atmospheric Administration (National Geodetic Survey)
2 1 2 , J. Huang , N. Courtier , J. Liard & D
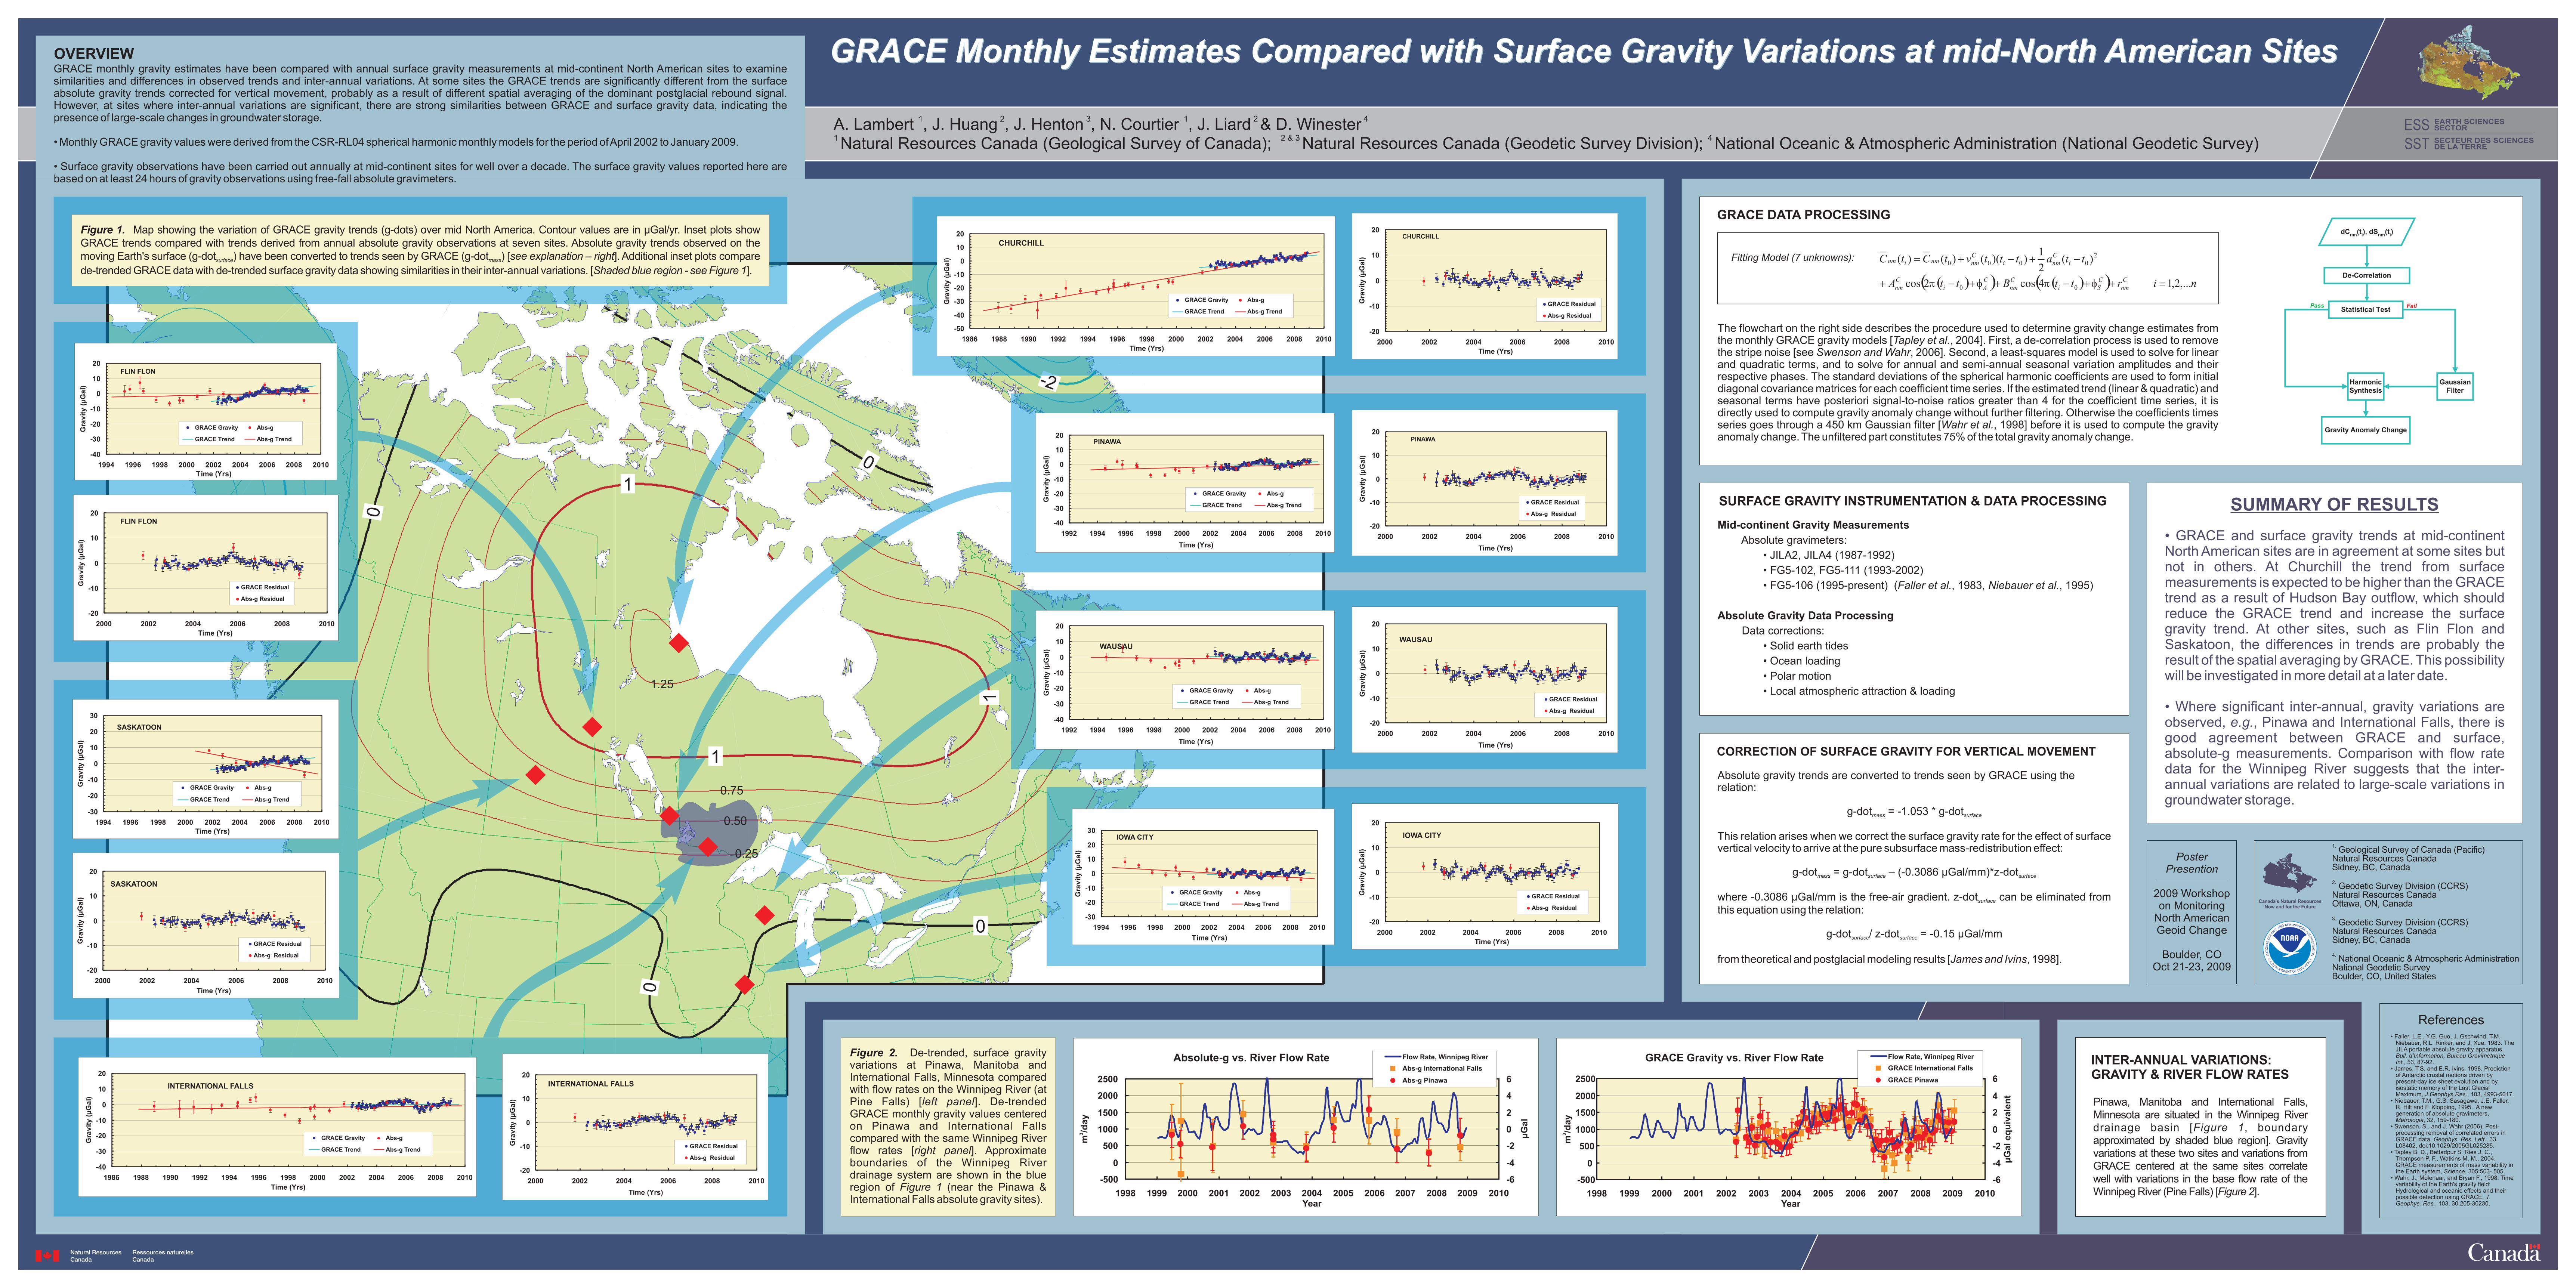
GRACE monthly gravity estimates have been compared with annual surface gravity measurements at mid-continent North American sites to examine similarities and differences in observed trends and inter-annual variations. At some sites the GRACE trends are significantly different from the surface absolute gravity trends corrected for vertical movement, probably as a result of different spatial averaging of the dominant postglacial rebound signal. However, at sites where inter-annual variations are significant, there are strong similarities between GRACE and surface gravity data, indicating the presence of large-scale changes in groundwater storage.
• Monthly GRACE gravity values were derived from the CSR-RL04 spherical harmonic monthly models for the period of April 2002 to January 2009.
• Surface gravity observations have been carried out annually at mid-continent sites for well over a decade. The surface gravity values reported here are based on at least 24 hours of gravity observations using free-fall absolute gravimeters.
• GRACE and surface gravity trends at mid-continent North American sites are in agreement at some sites but not in others. At Churchill the trend from surface measurements is expected to be higher than the GRACE trend as a result of Hudson Bay outflow, which should reduce the GRACE trend and increase the surface gravity trend. At other sites, such as Flin Flon and Saskatoon, the differences in trends are probably the result of the spatial averaging by GRACE. This possibility will be investigated in more detail at a later date.
• Where significant inter-annual, gravity variations are observed, e.g., Pinawa and International Falls, there is good agreement between GRACE and surface, absolute-g measurements. Comparison with flow rate data for the Winnipeg River suggests that the inter-annual variations are related to large-scale variations in groundwater storage.
GRACE DATA PROCESSING
The flowchart on the right side describes the procedure used to determine gravity change estimates from the monthly GRACE gravity models [Tapley et al., 2004]. First, a de-correlation process is used to remove the stripe noise [see Swenson and Wahr, 2006]. Second, a least-squares model is used to solve for linear and quadratic terms, and to solve for annual and semi-annual seasonal variation amplitudes and their respective phases. The standard deviations of the spherical harmonic coefficients are used to form initial diagonal covariance matrices for each coefficient time series. If the estimated trend (linear & quadratic) and seasonal terms have posteriori signal-to-noise ratios greater than 4 for the coefficient time series, it is directly used to compute gravity anomaly change without further filtering. Otherwise the coefficients times series goes through a 450 km Gaussian filter [Wahr et al., 1998] before it is used to compute the gravity anomaly change. The unfiltered part constitutes 75% of the total gravity anomaly change.
()( ) ()( ) nirttBttA
ttatttvtCtC
Cnm
CSi
Cnm
CAi
Cnm
iCnmi
Cnmnminm
,...2,14cos2cos
)(2
1))(()()(
00
20000
=++-++-+
-+-+=
fpfp
Fitting Model (7 unknowns):
References• Faller, L.E., Y.G. Guo, J. Gschwind, T.M. Niebauer, R.L. Rinker, and J. Xue, 1983. The JILA portable absolute gravity apparatus, Bull. d’Information, Bureau Gravimetrique Int., 53, 87-92.• James, T.S. and E.R. Ivins, 1998. Prediction of Antarctic crustal motions driven by present-day ice sheet evolution and by isostatic memory of the Last Glacial Maximum, J.Geophys.Res., 103, 4993-5017.• Niebauer, T.M., G.S. Sasagawa, J.E. Faller, R. Hilt and F. Klopping, 1995. A new generation of absolute gravimeters, Metrologia, 32, 159-180.• Swenson, S., and J. Wahr (2006), Post- processing removal of correlated errors in GRACE data, Geophys. Res. Lett., 33, L08402, doi:10.1029/2005GL025285.• Tapley B. D., Bettadpur S. Ries J. C., Thompson P. F., Watkins M. M., 2004. GRACE measurements of mass variability in the Earth system, Science, 305:503- 505.• Wahr, J., Molenaar, and Bryan F., 1998. Time variability of the Earth's gravity field: Hydrological and oceanic effects and their possible detection using GRACE, J. Geophys. Res., 103, 30,205-30230.
Absolute gravity trends are converted to trends seen by GRACE using the relation:
g-dot = -1.053 * g-dotmass surface
This relation arises when we correct the surface gravity rate for the effect of surface vertical velocity to arrive at the pure subsurface mass-redistribution effect:
g-dot = g-dot – (-0.3086 µGal/mm)*z-dotmass surface surface
where -0.3086 µGal/mm is the free-air gradient. z-dot can be eliminated from surface
this equation using the relation:
g-dot / z-dot = -0.15 µGal/mmsurface surface
from theoretical and postglacial modeling results [James and Ivins, 1998].
0
0
0
0
0
0
0
0
1
1
00
0
0
1
-2
-1
-1
0.75
1.25
0.25
0.50
OVERVIEW
FLIN FLON
-40
-30
-20
-10
0
10
20
1994 1996 1998 2000 2002 2004 2006 2008 2010
Time (Yrs)
Gra
vit
y(µ
Ga
l)
GRACE Gravity Abs-g
GRACE Trend Abs-g Trend
FLIN FLON
-20
-10
0
10
20
2000 2002 2004 2006 2008 2010
Time (Yrs)
Gra
vit
y(µ
Ga
l)
GRACE Residual
Abs-g Residual
SASKATOON
-30
-20
-10
0
10
20
30
1994 1996 1998 2000 2002 2004 2006 2008 2010
Time (Yrs)
Gra
vit
y(µ
Ga
l)
GRACE Gravity Abs-g
GRACE Trend Abs-g Trend
SASKATOON
-20
-10
0
10
20
2000 2002 2004 2006 2008 2010
Time (Yrs)
Gra
vit
y(µ
Ga
l)
GRACE Residual
Abs-g Residual
Figure 1. Map showing the variation of GRACE gravity trends (g-dots) over mid North America. Contour values are in µGal/yr. Inset plots show GRACE trends compared with trends derived from annual absolute gravity observations at seven sites. Absolute gravity trends observed on the moving Earth's surface (g-dot ) have been converted to trends seen by GRACE (g-dot ) [see explanation – right]. Additional inset plots compare surface mass
de-trended GRACE data with de-trended surface gravity data showing similarities in their inter-annual variations. [Shaded blue region - see Figure 1].
CHURCHILL
-50
-40
-30
-20
-10
0
10
20
1986 1988 1990 1992 1994 1996 1998 2000 2002 2004 2006 2008 2010
Time (Yrs)
Gra
vit
y(µ
Ga
l)
GRACE Gravity Abs-g
GRACE Trend Abs-g Trend
CHURCHILL
-20
-10
0
10
20
2000 2002 2004 2006 2008 2010
Time (Yrs)
Gra
vit
y(µ
Ga
l)
GRACE Residual
Abs-g Residual
PINAWA
-40
-30
-20
-10
0
10
20
1992 1994 1996 1998 2000 2002 2004 2006 2008 2010
Time (Yrs)
Gra
vit
y(µ
Ga
l)
GRACE Gravity Abs-g
GRACE Trend Abs-g Trend
PINAWA
-20
-10
0
10
20
2000 2002 2004 2006 2008 2010
Time (Yrs)
Gra
vit
y(µ
Ga
l)
GRACE Residual
Abs-g Residual
WAUSAU
-20
-10
0
10
20
2000 2002 2004 2006 2008 2010
Time (Yrs)
Gra
vit
y(µ
Ga
l)
GRACE Residual
Abs-g Residual
WAUSAU
-40
-30
-20
-10
0
10
20
1992 1994 1996 1998 2000 2002 2004 2006 2008 2010
Time (Yrs)
Gra
vit
y(µ
Ga
l)
GRACE Gravity Abs-g
GRACE Trend Abs-g Trend
IOWA CITY
-30
-20
-10
0
10
20
30
1994 1996 1998 2000 2002 2004 2006 2008 2010
Time (Yrs)
Gra
vit
y(µ
Ga
l)
GRACE Gravity Abs-g
GRACE Trend Abs-g Trend
IOWA CITY
-20
-10
0
10
20
2000 2002 2004 2006 2008 2010
Time (Yrs)
Gra
vit
y(µ
Ga
l)
GRACE Residual
Abs-g Residual
INTERNATIONAL FALLS
-40
-30
-20
-10
0
10
20
1986 1988 1990 1992 1994 1996 1998 2000 2002 2004 2006 2008 2010
Time (Yrs)
Gra
vit
y(µ
Ga
l)
GRACE Gravity Abs-g
GRACE Trend Abs-g Trend
INTERNATIONAL FALLS
-20
-10
0
10
20
2000 2002 2004 2006 2008 2010
Time (Yrs)
Gra
vit
y(µ
Ga
l)
GRACE Residual
Abs-g Residual
SURFACE GRAVITY INSTRUMENTATION & DATA PROCESSING
CORRECTION OF SURFACE GRAVITY FOR VERTICAL MOVEMENT
Mid-continent Gravity Measurements
Absolute gravimeters:
• JILA2, JILA4 (1987-1992)
• FG5-102, FG5-111 (1993-2002)
• FG5-106 (1995-present) (Faller et al., 1983, Niebauer et al., 1995)
Absolute Gravity Data Processing
Data corrections:
• Solid earth tides
• Ocean loading
• Polar motion
• Local atmospheric attraction & loading
dCnm
(ti), dS
nm(t
i)
Statistical Test
GaussianFilter
HarmonicSynthesis
Gravity Anomaly Change
De-Correlation
FailPass
SUMMARY OF RESULTS
INTER-ANNUAL VARIATIONS:GRAVITY & RIVER FLOW RATES
Pinawa, Manitoba and International Falls, Minnesota are situated in the Winnipeg River drainage basin [Figure 1, boundary approximated by shaded blue region]. Gravity variations at these two sites and variations from GRACE centered at the same sites correlate well with variations in the base flow rate of the Winnipeg River (Pine Falls) [Figure 2].
GRACE Gravity vs. River Flow Rate
-500
0
500
1000
1500
2000
2500
1998 1999 2000 2001 2002 2003 2004 2005 2006 2007 2008 2009 2010Year
-6
-4
-2
0
2
4
6
µG
al
eq
uiv
ale
nt
3m
/da
y
Flow Rate, Winnipeg River
GRACE International Falls
GRACE Pinawa
Absolute-g vs. River Flow Rate
-500
0
500
1000
1500
2000
2500
1998 1999 2000 2001 2002 2003 2004 2005 2006 2007 2008 2009 2010Year
-6
-4
-2
0
2
4
6
Flow Rate, Winnipeg River
Abs-g International Falls
Abs-g Pinawa
µG
al
3m
/da
y
Figure 2. De-trended, surface gravity variations at Pinawa, Manitoba and International Falls, Minnesota compared with flow rates on the Winnipeg River (at Pine Falls) [left panel]. De-trended GRACE monthly gravity values centered on Pinawa and International Falls compared with the same Winnipeg River flow rates [right panel]. Approximate boundaries of the Winnipeg River drainage system are shown in the blue region of Figure 1 (near the Pinawa & International Falls absolute gravity sites).
Canada's Natural ResourcesNow and for the Future
1. Geological Survey of Canada (Pacific)
Natural Resources CanadaSidney, BC, Canada
2. Geodetic Survey Division (CCRS)
Natural Resources CanadaOttawa, ON, Canada
3. Geodetic Survey Division (CCRS)
Natural Resources CanadaSidney, BC, Canada 4. National Oceanic & Atmospheric Administration
National Geodetic SurveyBoulder, CO, United States
PosterPresention
2009 Workshopon Monitoring
North AmericanGeoid Change
Boulder, COOct 21-23, 2009
GRACE Monthly Estimates Compared with Surface Gravity Variations at mid-North American SitesGRACE Monthly Estimates Compared with Surface Gravity Variations at mid-North American Sites