overview - albertadepartment/deptdocs.nsf/all/bt15110/$file/... · 10 market areas •prepared...
TRANSCRIPT


•Project Overview
•Process
•Results
•Next Steps
Bio Based Chemicals
Import Replacement Initiative

• Theory
• Practical
• Reality
Project Overview

Theory

Theory

Practical
Preliminary Research
• Scoped about 300 chemicals
• Analyzed imports, market data, supplier information, etc.
Phase I Research
• Market research on 40 chemicals and 10 market areas
• Prepared brief profiles
Phase II Research
• More detailed market research on 10 best
• 6 chemicals, 4 market areas

Practical
• Solvents • Glycerol Carbonate • Lubricants • Surfactants • Isopropanol • Hexane • Guar Gum • Carboxymethylcellulose (CMC) • Alpha Olefins • Oilfield Chemicals
Results

Phenol
Table 1: Canadian and Alberta Imports of Phenol 2009 2010 2011 2012
(tonnes) ($ million) (tonnes) ($ million) (tonnes) ($ million) (tonnes) ($ million)
Canada 70,451 $67 77,501 $96 73,812 $103 75,070 $110
Alberta 20,913 $21 30,070 $37 33,331 $47 35,666 $52
Source: Statistics Canada, Canadian International Merchandise Trade

Phenol

Surfactants
Table 1: Trend in Canadian and Alberta’s Imports of Main Surfactants
Canada Canada Canada Canada Canada Canada Canada
1990 2009 2010 2011 2012 2012 2012
Canada
HS *
Code (kilotonnes) (kilotonnes) (kilotonnes) (kilotonnes) (kilotonnes) ($ million) ($/kg)
Anionic 340211 15.2 52.5 54.6 57.0 59.6 $120.1 $2.02
Cationic 340212 2.0 5.9 7.5 7.4 8.1 $27.7 $3.41
Non-ionic 340213 24.0 45.5 49.1 48.9 47.2 $152.7 $3.23
Other (NES)* 340219 7.8 9.3 9.5 12.1 12.6 $33.2 $2.63
Total Canada
49.0 113.2 120.6 125.5 127.5 $333.6 $2.62
Alberta Alberta Alberta Alberta Alberta Alberta Alberta
Alberta
HS
Code 1990 2009 2010 2011 2012 2012 2012
Anionic 340211 0.95 3.4 4.6 6.0 7.0 $19.1 $2.74
Cationic 340212 0.09 0.3 0.6 0.6 0.6 $1.9 $3.40
Non-ionic 340213 1.43 4.4 4.9 5.2 3.4 $10.5 $3.06
Other (NES)* 340219 0.61 0.9 1.2 2.7 3.2 $9.7 $3.02
Total Alberta
3.1 8.9 11.3 14.4 14.2 $41.2 $2.90
% of Total Canada
6% 8% 9% 12% 11% 12%
Source: Statistics Canada, http://www.statcan.gc.ca/trade-commerce/data-donnee-eng.htm
* HS stands for harmonized system. NES stands for “not elsewhere specified”.
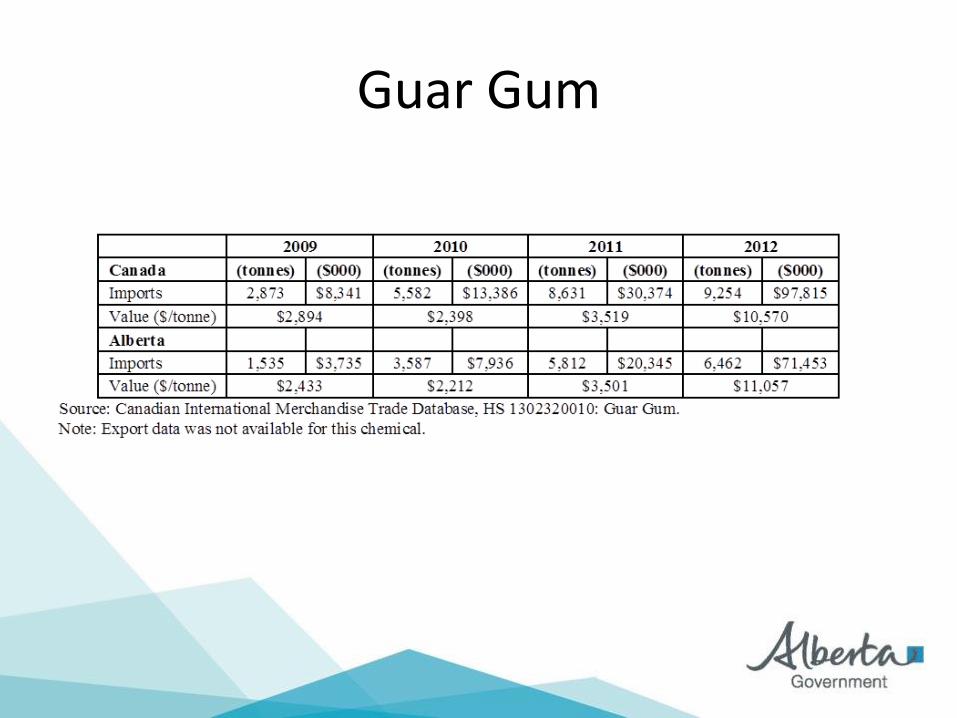
Guar Gum

Full report available at:
• https://www.albertacanada.com/industry-reports.aspx
Conclusions

Morley Kjargaard, Manager
Bio Industrial, Enterprise Division
Innovation and Advanced Education
403 556 4316