overview courses
DESCRIPTION
TRANSCRIPT

• Kristian Linnet, MD, [email protected]
• Per Hyltoft Petersen, [email protected]
• Sverre Sandberg, MD, [email protected]
Statistics & graphics for the
laboratory
Linda [email protected]
Dietmar Stö[email protected]
In cooperation with AQML: D Stöckl, L Thienpont &
ApplicationsInternal quality control

Statistics & graphics for the laboratory 2
Prof Dr Linda M ThienpontUniversity of Gent
Institute for Pharmaceutical SciencesLaboratory for Analytical Chemistry
Harelbekestraat 72, B-9000 Gent, Belgiume-mail: [email protected]
STT ConsultingDietmar Stöckl, PhD
Abraham Hansstraat 11B-9667 Horebeke, Belgium
e-mail: [email protected] + FAX: +32/5549 8671
Copyright: STT Consulting 2007

Statistics & graphics for the laboratory 3
Content
Introduction
IQC in the broader contextOrigin of internal quality controlQuality managementTechnical competenceManagement of the analytical processPurpose of IQC
IQC and regulation
ManufacturersIVD 98/79/EC Directive & CEN-documentsManufacturer’s recommendations
LaboratoriesBelgian Guidelines (Koninklijk Besluit/Praktijkrichtlijn)Summary and conclusion
Fundamentals of IQC
Analytical paradigm and IQC paradigm
IQC – practical aspectsIQC materials
• Nature• Target mean & CV
–Statistical excursion: uncertainty of mean & SD• Frequency and location
Presentation of resultsSoftware & Documentation
Statistics & graphics for the laboratory 4
Content
Statistical basis of IQC
Introduction
StatisticsBasic calculationsGaussian distribution (standard and cumulated)Gaussian distribution and %-age of observationsStatistical probabilities“Rare events”Summary outside probabilities
Control rulesFrom outside probabilities to control rulesControl rules – An exampleControl rules – basic monitoring principlesSelection of control rules: Fundamental problemsPower function graphsConstruction of the power function for 13s and SE
Construction of the power function for 12s and RE
Power of control rules and -limitsPower of control rules and nComparison of the power of control rulesControl rules: The problem of false rejection (Pfr)
Circumventing the increase in Pfr with n: control rules with variable limits
The ideal control ruleMagnitude of errors detected by IQC
Conclusions from statistical considerations
Statistics & graphics for the laboratory 5
Content
Metrological basis of IQC
IntroductionThe error concept chosen hereThe total error conceptTotal error – calculationsInstability of the analytical process
Instability and analytical process specificationsInstability – how much can be tolerated?Analytical process specifications - TEaIQC and TEa
The error model for IQCBasic formulaCritical errorsGraphical presentation of critical errorsCalculation of critical errors
Special topic: The TEa problematic
Control rules based on TEaAutomatic selection of rules based on TEa: The ValidatorOPSpecs®-ChartsCritical error graphsSelection of a control rule based on TEa with the Validator: an exampleOther selection tools: the TEa/CVa,tot ratio; the IQC decision tool
Summary and Conclusion
Statistics & graphics for the laboratory 6
IQC policy
Introduction
Software
Samples
Frequency (& location) of IQC measurements
Performance (State-of-the-art)
IQC rule selection• Patient release• Process control• Examples
IQC rules for state-of-the-art performance• Screening with TEa/CVa,tot
• STT IQC decision tool• EZ rules/Validator
Special topics• Calculation of an actual TEa• Rule “n” and patient release• Dealing with a bias• IQC rules with wide limits (e.g. 6) and lot variations• “Fine-tuning” of IQC according to instability
Remedial actions &• Pfr of the IQC rule and frequency of remedial actions
• CVa,tot /CVa,w ratio
• Inspecting IQC charts
Summary
EXCEL files
Content
Basic
introd uction-participantData IQC Basic
introd uction-participantIQC decision
Statistics & graphics for the laboratory 7
Annex
Checklists
Glossary of terms
References
Content
Statistics & graphics for the laboratory 8
Introduction
IQC in the broader contextOrigin of internal quality controlQuality managementTechnical competenceManagement of the analytical processPurpose of IQC
IQC and regulationManufacturersIVD 98/79/EC Directive & CEN-documentsManufacturer’s recommendations
LaboratoriesBelgian Guidelines (Koninklijk Besluit/Praktijkrichtlijn)Summary and conclusion
Introduction
Statistics & graphics for the laboratory 9
Origin of internal quality control
IQC in the broader context
The idea of internal quality control (IQC) was applied first in the industrial manufacturing process (Shewart). In clinical chemistry (= laboratory medicine), IQC was introduced by Levey & Jennings. Since the 70ies, IQC is very much related with the name of Westgard.Before going into the details of IQC, some general aspects will be addressed, of:
• Quality management• Technical competence• Management of the analytical process
Quality managementAll activities of the overall management function that determine the quality policy, objectives and responsibilities, and implement them by means such as quality planning, quality control, quality assurance and quality improvement within the quality system.While this text focuses on IQC, it shall be stressed that IQC should not be viewed isolated. IQC is embedded in the overall effort of the laboratory for quality. This relates to its technical competence as well as its management competence.
Management competenceIn the quality management system, IQC is part of the circle quality-planning, -assurance, -control, and -improvement (note: a glossary of terms is found in the Annex). Thus, IQC is an integral part of the quality system.
Technical competenceTechnical competence relates to all aspects of the analytical process. Naturally, any test in the medical laboratory has to be proven medically useful. Technical competence starts with the knowledge of the principles for the establishment of medically relevant analytical performance specifications. On that basis, the adequate test is selected, installed, and run in daily routine. However, routine performance of a test needs adequate analytical quality management, IQC being one part of it. Thus, IQC is an integral part of the analytical process.
References• Shewart WA. Economic control of manufactured products. Van Nostrand: 1931.• Levey S, Jennings ER. The use of control charts in the clinical laboratory. Am J Clin Pathol 1950;20:1059-66.• Westgard JO, Groth T, Aronsson T, Falk H, de Verdier C-H. Performance characteristics of rules for internal quality control: probabilities for false rejection and error detection. Clin Chem 1977;23:1857-67.
Statistics & graphics for the laboratory 10
Technical competence (ctd.)
IQC in the broader context
IQC, an integral part of the analytical process ("Westgard")
An analytical process has two major parts:Measurement procedure… necessary to obtain a measurementon a patient's sample.Control procedure… necessary to assess the validity of a measurement result.
In the words of Westgard, it is made absolutely clear that a measurement result that was obtained without IQC, "is no result". IQC is a "sine-qua-non" for reporting a result.
Thus, a well established IQC system is an important part of the technical competence of the laboratory.
Management of the analytical process“IQC should be imbedded in the overall quality philosophy of the laboratory”
It is important that the laboratory does not elaborate "stand-alone" solutions for IQC. IQC is only one means of managing daily routine quality. For example, if it has chosen a robust test that easily fulfills the performance specifications, IQC may be quite easy. Also, work according to the motto: "prevention is better than curation". And, make use of the information available through external quality assessment (EQA).
References• Westgard JO, Barry PL. Cost-effective quality control. AACC Press, 1995
Statistics & graphics for the laboratory 11
Management of the analytical process
IQC in the broader context
Management of the analytical process – more than IQC
Make use of quality assurance• Knowledge of instrument• Unequivocal working instructions• Inventory control (reagent batches)• Maintenance• Qualified personnel, etc.
Electronic QCPre-analytics (sample)• Clot• Hemolysis, etc• Sample volumeAnalytics (instrument & reagent)• Pipette volumes• Wavelength• Light source output, sensor response• Temperature• KineticPost-analytics (verification, reports, etc)• Calibration verification• Calculation verification
Make use of EQA• Company• NationalThis information is particularly useful for troubleshooting(explained later in more detail).
For more information about quality assurance, the reader is referred to the books cited below.
References• Stewart CE, Koepke JA. Basic quality assurance practices for clinical laboratories. Philadelphia (USA): J. B. Lippincott Company, 1987.• Garfield FM. Quality assurance principles for analytical laboratories. AOAC International: 1994.• St John A. Critical care testing. Quality assurance. Mannheim: Roche Diagnostics, 2001. • Nilsen CL. Managing the analytical laboratory: plain and simple. Buffalo Grove (IL): Interpharm Press, 1996.
Statistics & graphics for the laboratory 12
Purpose of IQC
IQC in the broader context
We have seen that IQC is an integral part of the analytical process and of the quality system. Therefore,
IQC serves two purposes
It is primarily useful for the laboratory itself• It monitors analytical performance and indicates when performance deteriorates.• It allows actions to be taken before quality specifications are exceeded
It demonstrates to the outside (e.g. physicians, accreditation bodies, health authorities)• That analytical performance was adequate at the time patient results have been reported
Summary – IQC in the broader context
IQC is an integral part of the• analytical process• quality system
IQC is useful for• the laboratory itself• demonstration of performance to the outside
IQC is one mosaic stone of the whole quality management/quality assurance process
Statistics & graphics for the laboratory 13
IQC and regulation
Manufacturers• IVD 98/79/EC Directive & CEN-documents• Manufacturer recommendations
Laboratories• Belgian Guidelines (Koninklijk Besluit/ Praktijkrichtlijn)• Summary and conclusion
Foreword
Regulatory requirements for IQC exist for laboratories as well as for manufacturers.
For manufacturers, usually, international rules apply (or at least, for the "big regions", such as the United States, Europe, Japan).
For laboratories, usually, national rules apply, mostly associated with the rules for external quality assessment.
Examples
ManufacturerThe key elements of the European rules will be presented.
LaboratoryThe key elements of the Belgian rules will be presented.
IQC and regulation
Introduction
Statistics & graphics for the laboratory 14
Manufacturers
IQC and regulation
European IVD Directive 98/79/EC8. Information supplied by the manufacturer(k) information appropriate to users on:- internal quality control including specific validation procedures
The IVD directive states that- Manufacturers should give information about appropriate IQC procedures, but - The content of the information is not detailed.
Corresponding CEN-standard# (EN 375:2001, Information by the manufacturer)5.15 Internal quality controlSuitable procedures for internal quality control shall be given including a means for the user to establish criteria for assessing the validity of the measurement procedure.
The CEN standard states that-Suitable procedures for IQC shall be given, but-the content of the information is not detailed.
Conclusion European requirements for manufacturers are vague: There should be recommendations for IQC, but the content is left over to the manufacturer.
A closer look at manufacturers’ recommendations
References• #For more information see: www.cenorm.be
Statistics & graphics for the laboratory 15
Manufacturers
IQC and regulation
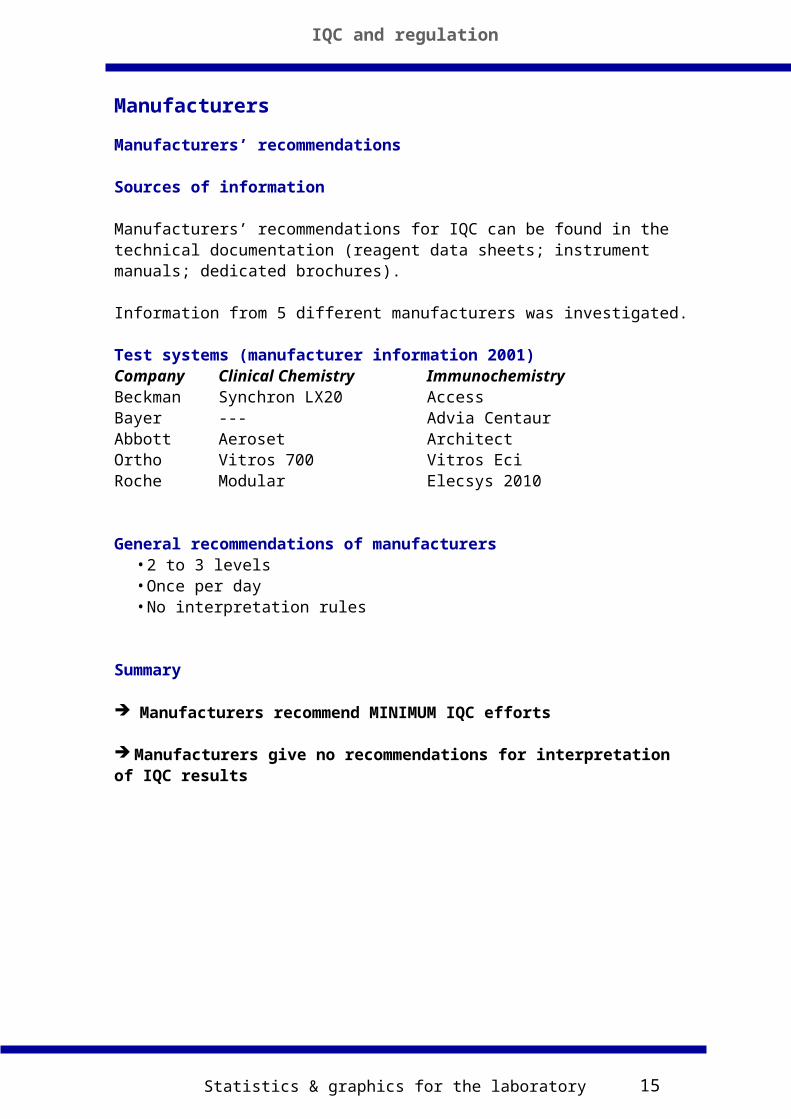
Manufacturers’ recommendations
Sources of information
Manufacturers’ recommendations for IQC can be found in the technical documentation (reagent data sheets; instrument manuals; dedicated brochures).
Information from 5 different manufacturers was investigated.
Test systems (manufacturer information 2001)Company Clinical Chemistry ImmunochemistryBeckman Synchron LX20 AccessBayer --- Advia CentaurAbbott Aeroset ArchitectOrtho Vitros 700 Vitros EciRoche Modular Elecsys 2010
General recommendations of manufacturers• 2 to 3 levels• Once per day• No interpretation rules
Summary
Manufacturers recommend MINIMUM IQC efforts
Manufacturers give no recommendations for interpretation of IQC results
Statistics & graphics for the laboratory 16
Laboratories
IQC and regulation
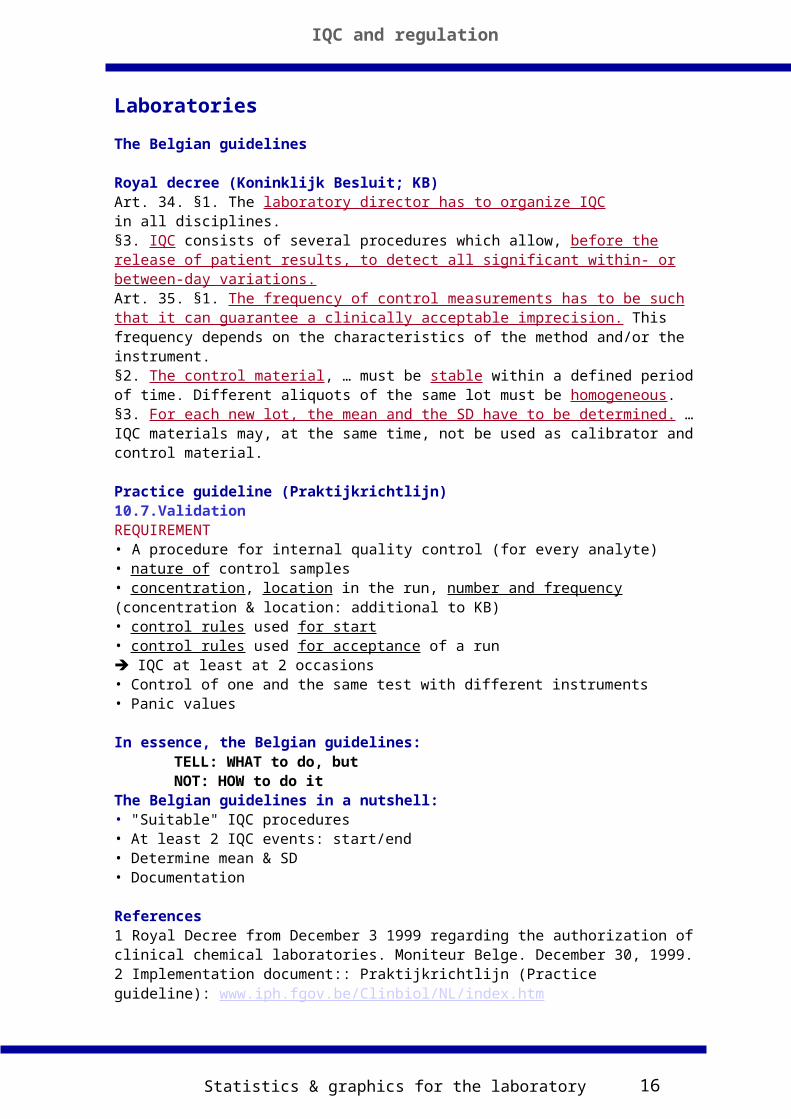
The Belgian guidelines
Royal decree (Koninklijk Besluit; KB)Art. 34. §1. The laboratory director has to organize IQCin all disciplines.§3. IQC consists of several procedures which allow, before the release of patient results, to detect all significant within- or between-day variations.Art. 35. §1. The frequency of control measurements has to be such that it can guarantee a clinically acceptable imprecision. This frequency depends on the characteristics of the method and/or the instrument.§2. The control material, … must be stable within a defined period of time. Different aliquots of the same lot must be homogeneous.§3. For each new lot, the mean and the SD have to be determined. … IQC materials may, at the same time, not be used as calibrator and control material.
Practice guideline (Praktijkrichtlijn)10.7.ValidationREQUIREMENT• A procedure for internal quality control (for every analyte)• nature of control samples• concentration, location in the run, number and frequency (concentration & location: additional to KB) • control rules used for start• control rules used for acceptance of a run IQC at least at 2 occasions• Control of one and the same test with different instruments• Panic values
In essence, the Belgian guidelines:TELL: WHAT to do, butNOT: HOW to do it
The Belgian guidelines in a nutshell:• "Suitable" IQC procedures• At least 2 IQC events: start/end• Determine mean & SD• Documentation
References1 Royal Decree from December 3 1999 regarding the authorization of clinical chemical laboratories. Moniteur Belge. December 30, 1999. 2 Implementation document:: Praktijkrichtlijn (Practice guideline): www.iph.fgov.be/Clinbiol/NL/index.htm
Statistics & graphics for the laboratory 17
Regulation
Overall summary
Regulation gives minimum rules for laboratory IQC• Follow manufacturer• Follow regulation
General: minimum frequency, no rules
Development of an IQC-policy: TASK of the LABORATORY
Requirement:Knowledge of the statistical basis of the analytical process and of IQC.
We look at the“analytical paradigm” and the“IQC paradigm”
IQC and regulation
Statistics & graphics for the laboratory 18
Fundamentals of IQC
• The analytical paradigm• The IQC paradigm
The “analytical-paradigm“We assume that:Analytical procedures give results (xi) that are independent from other results
xi comes from a Gaussian distribution with a mean µ and a standard deviation
Note: An experimentally determined standard deviation (finite number of measurements) is denoted by the symbol s
We assume that:Analytical procedures have periods of stable performance.The performance characteristics (mean, standard deviation) of the stable process are known from sufficiently frequent measurements under stable conditions.
We assume that:In the course of time, analytical procedures tend to instability:
• Measured means deviate from the "true" mean due to the occurrence of systematic error
• Measured s is >"true" s due to increased random error
The “IQC-paradigm“We assume that:IQC can detect process deterioration (increased systematic or random error) at a sufficiently early stage
• By repeated measurement of the same sample• Investigation of the results by statistical methods
Statistical methods (control rules) indicate, for example, whether• The actual mean deviates from the "true" mean• The actual s is > than the "true" s
SummaryWe have to learn:Basic statistics
• Particularly: the Gaussian distributionThe metrological error concept
• Systematic error, random error, total error, …
Before that, we look at somePractical aspects of IQC… repeated measurement of the same sample we look at the sample & other practical aspects of IQC.
Fundamentals of IQC
Statistics & graphics for the laboratory 19
IQC – practical aspects
IQC materials• Nature• Target mean & SD/CV
–Statistical excursion: uncertainty of mean & SD• Frequency and location
Presentation of resultsSoftware & Documentation
IQC materialsNatureMaterials for IQC should resemble the actually measured samples as far as possible.
MatrixSerum analysis should apply materials with a serum-like matrixUrine analysis should apply materials with an urine-like matrixWhole blood should apply materials based on a whole blood matrixNote 1Usually, a compromise has to be made between stability and “nativity”.Note 2Most commercial IQC materials exhibit artificial matrix effects. Therefore, they usually cannot be used for the assessment of trueness.
ConcentrationAnalyte concentrations should be medically relevant (e.g., be in the mid, the upper, and the lower part of the reference range, or near decision points; see www.westgard.com for medical decision levels).
Be compatible with the test
Be stable & homogeneous (bottle to bottle)Lyophilized samples are preferred for long-term stability.Problem associated with lyophilization:-Reconstitution accuracy (particular important for analytes that require tight control limits; e.g., Na, Cl)
Be available in large batches to allow their use over an extended period of time (e.g., two years).
Be purchased overlappingThe new material should be tested for some time together with the old material in order to have continuous experience. This prevents difficulties in problem-solving when they just occur at the moment a new IQC batch is introduced.
IQC – practical aspects
Statistics & graphics for the laboratory 20
IQC materials
Target mean
Notes in advance• The target mean of a control material is particularly important.• Control materials should not be used as calibrators.
Target means should:• Be test-specific• Have negligible uncertainty• Be provided with sufficient digits (adjusted to the precision of the method)
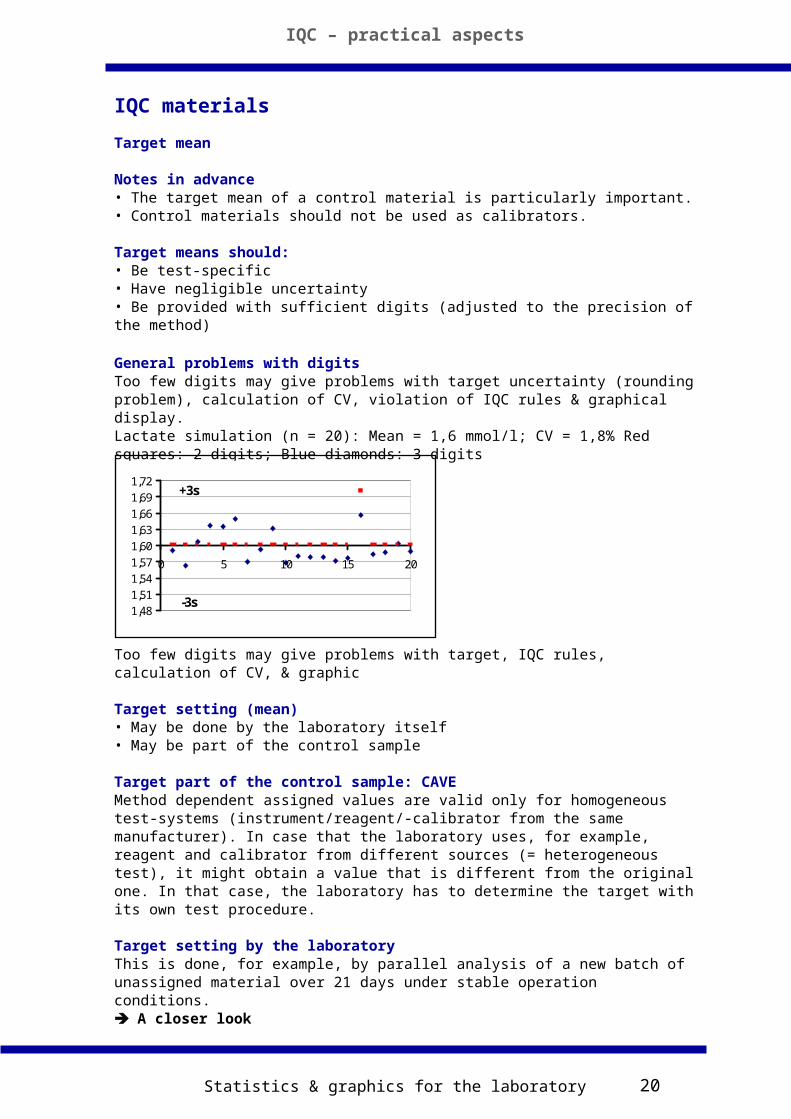
General problems with digitsToo few digits may give problems with target uncertainty (rounding problem), calculation of CV, violation of IQC rules & graphical display.Lactate simulation (n = 20): Mean = 1,6 mmol/l; CV = 1,8% Red squares: 2 digits; Blue diamonds: 3 digits
Too few digits may give problems with target, IQC rules, calculation of CV, & graphic
Target setting (mean)• May be done by the laboratory itself• May be part of the control sample
Target part of the control sample: CAVEMethod dependent assigned values are valid only for homogeneous test-systems (instrument/reagent/-calibrator from the same manufacturer). In case that the laboratory uses, for example, reagent and calibrator from different sources (= heterogeneous test), it might obtain a value that is different from the original one. In that case, the laboratory has to determine the target with its own test procedure.
Target setting by the laboratoryThis is done, for example, by parallel analysis of a new batch of unassigned material over 21 days under stable operation conditions. A closer look
IQC – practical aspects
1,48
1,51
1,54
1,57
1,60
1,63
1,66
1,69
1,72
0 5 10 15 20
+3s
-3s
Statistics & graphics for the laboratory 21
Target setting (mean & SD) by the laboratory
Usually recommended• Measure the control at least 21 times on separate occasions• Calculate the mean and SD Reject outliers (e.g., values more than 3 SDs from the mean) and recalculate the mean and SD In that time, IQC should indicate no problems (be aware of the limitations of your IQC procedure). Care has to be taken that no bias is introduced. Reflect on the uncertainty of the estimates
Calculation of imprecision with undetected shiftBe aware that undetected shift (also drift) increases the magnitude of the “stable” CV and introduces a bias.
Statistical considerations Reflect on the uncertainty of the estimatesNoteThis part is based on the general principles of the Gaussian statistics (see chapter: Statistical basis of IQC).It is treated here because the statistical uncertainty of the target mean and CV of an IQC sample are often underestimated. Statistical excursion
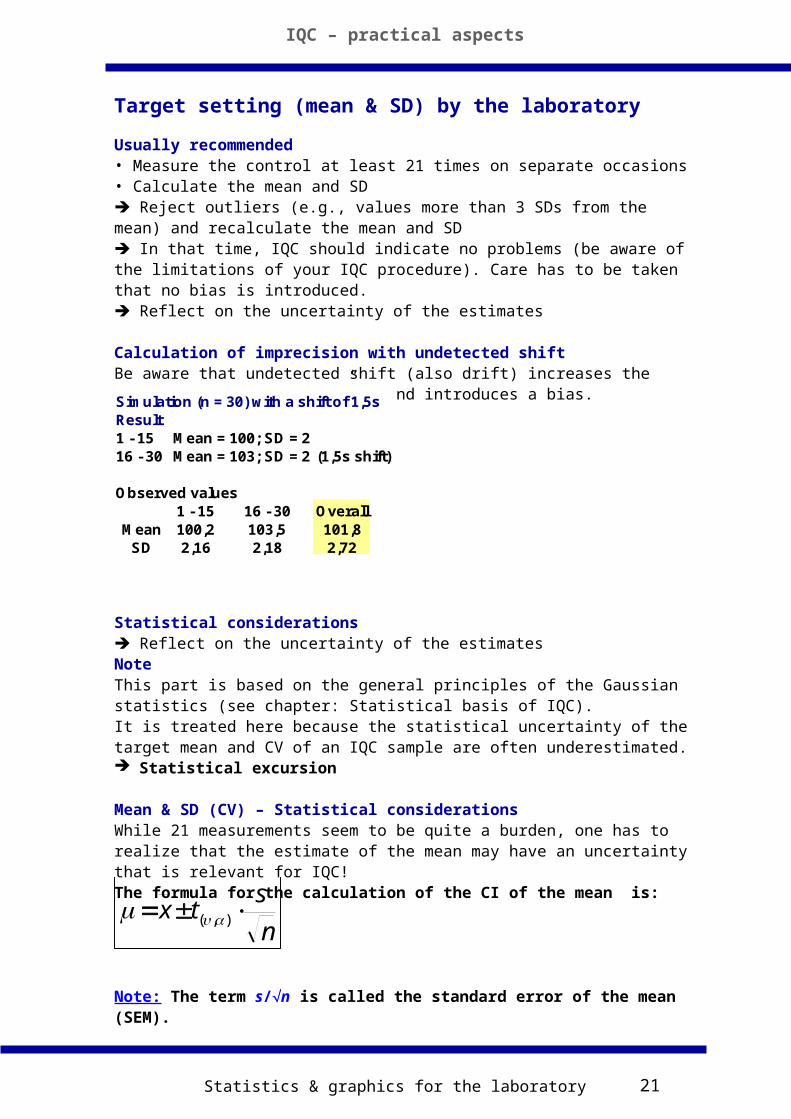
Mean & SD (CV) – Statistical considerationsWhile 21 measurements seem to be quite a burden, one has to realize that the estimate of the mean may have an uncertainty that is relevant for IQC!The formula for the calculation of the CI of the mean is:
Note: The term s/n is called the standard error of the mean (SEM).
Simulation (n = 30) with a shift of 1,5sResult1 - 15 Mean = 100; SD = 216 - 30 Mean = 103; SD = 2 (1,5s shift)
Observed values1 - 15 16 - 30 Overall
Mean 100,2 103,5 101,8SD 2,16 2,18 2,72
IQC – practical aspects
n
stx ),(
Statistics & graphics for the laboratory 22
Relationship confidence interval/confidence limit
The confidence interval (mean ± CI) spans from the lower to the higher confidence limit (CL): CI = - CL < mean < + CL
• CI = ± t • s/n• Lower CL = - t • s/n• Higher CL = + t • s/n
The CI/CL of the mean depends• on the probability level, • on the sort of tail (1-/2-tailed, also called 1-sided, or 2-sided)• on n (, respectively)
, n, and the "sort of tail" determine the magnitude of t• the standard deviation s (also denoted SD in the book)
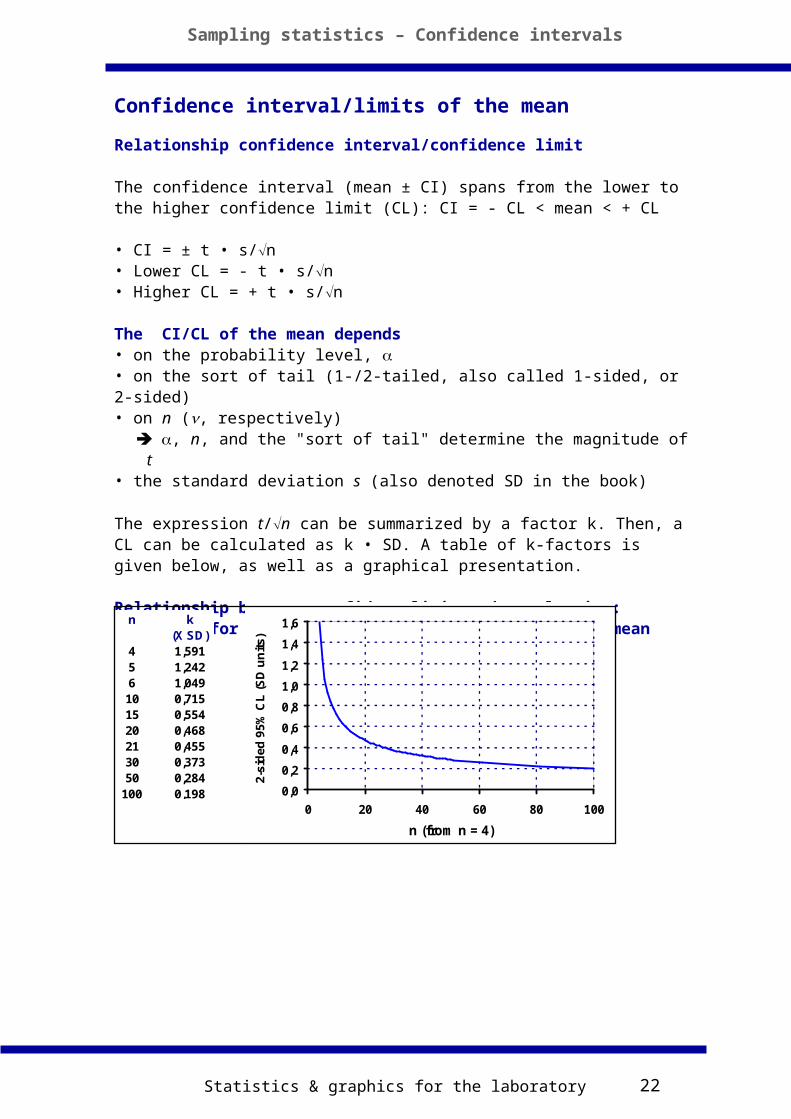
The expression t/n can be summarized by a factor k. Then, a CL can be calculated as k • SD. A table of k-factors is given below, as well as a graphical presentation.
Relationship between confidenc limit and sample size:k-factors for the 2-sided 95% confidence limit of a mean
Confidence interval/limits of the mean
Sampling statistics – Confidence intervals
n k(X SD)
4 1,5915 1,2426 1,04910 0,71515 0,55420 0,46821 0,45530 0,37350 0,284
100 0,198 0,0
0,2
0,4
0,6
0,8
1,0
1,2
1,4
1,6
0 20 40 60 80 100
n (from n = 4)
2-s
ided
95%
CL
(SD
un
its)
Statistics & graphics for the laboratory 23
Confidence interval/limits of s (SD)
The CI/CL of s (SD) depends
• on the probability level, (1-sided, or 2-sided, also called 1-/2-tailed)• on n (, respectively)
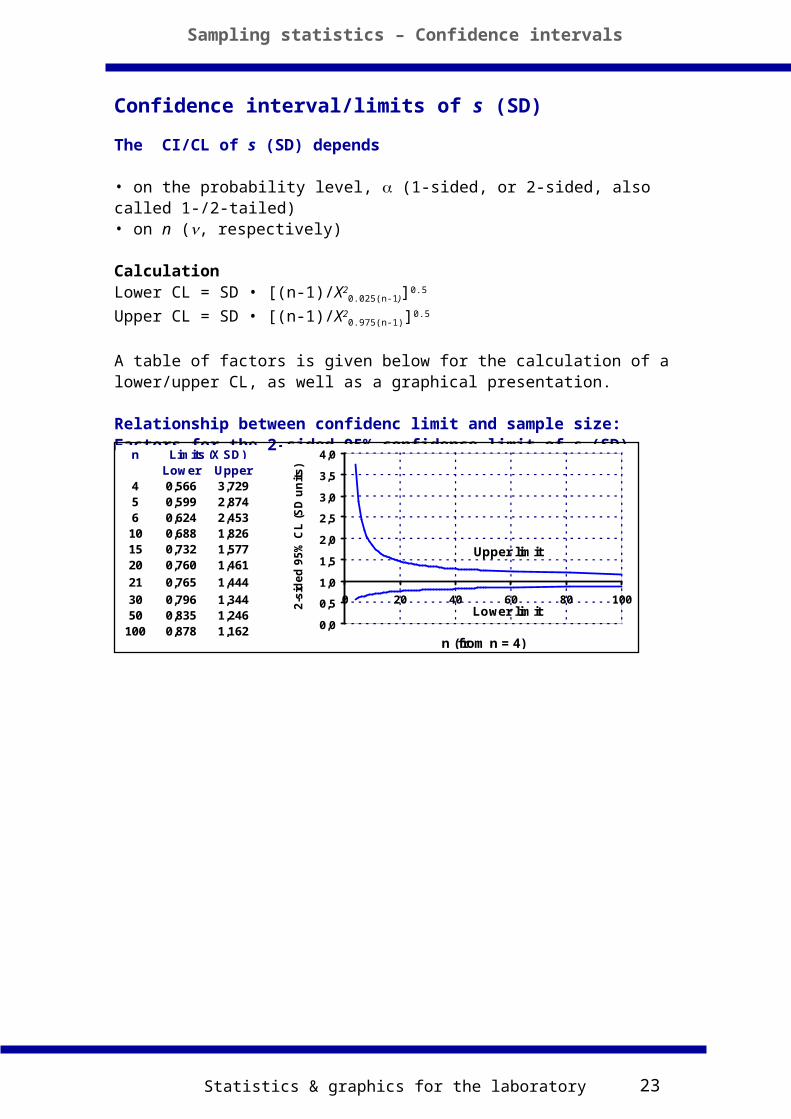
CalculationLower CL = SD • [(n-1)/X2
0.025(n-1)]0.5
Upper CL = SD • [(n-1)/X20.975(n-1)]0.5
A table of factors is given below for the calculation of a lower/upper CL, as well as a graphical presentation.
Relationship between confidenc limit and sample size:Factors for the 2-sided 95% confidence limit of s (SD)
Sampling statistics – Confidence intervals
nLower Upper
4 0,566 3,7295 0,599 2,8746 0,624 2,45310 0,688 1,82615 0,732 1,57720 0,760 1,461
21 0,765 1,444
30 0,796 1,34450 0,835 1,246
100 0,878 1,162
Limits (X SD)
0,0
0,5
1,0
1,5
2,0
2,5
3,0
3,5
4,0
0 20 40 60 80 100
n (from n = 4)
2-s
ide
d 9
5%
CL
(S
D u
nit
s)
Upper limit
Lower limit
Statistics & graphics for the laboratory 24
Target setting (mean & SD) by the laboratory
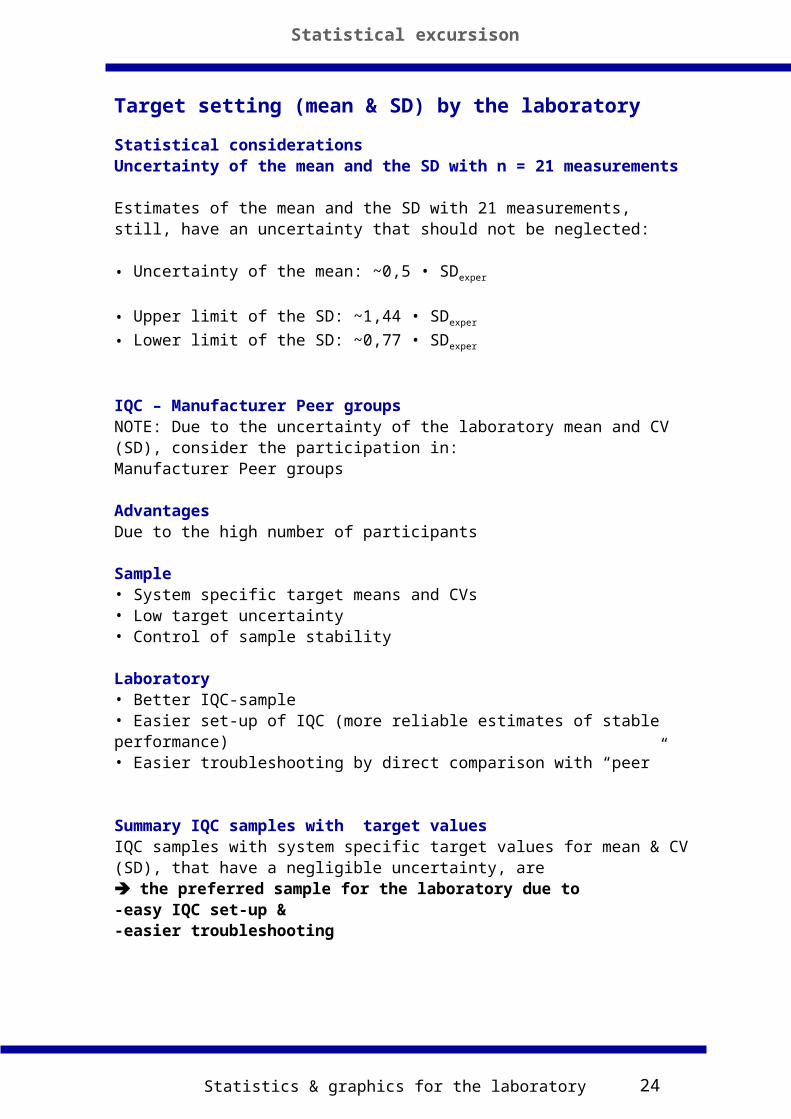
Statistical considerationsUncertainty of the mean and the SD with n = 21 measurements
Estimates of the mean and the SD with 21 measurements, still, have an uncertainty that should not be neglected:
• Uncertainty of the mean: ~0,5 • SDexper
• Upper limit of the SD: ~1,44 • SDexper
• Lower limit of the SD: ~0,77 • SDexper
IQC – Manufacturer Peer groupsNOTE: Due to the uncertainty of the laboratory mean and CV (SD), consider the participation in:Manufacturer Peer groups
AdvantagesDue to the high number of participants
Sample• System specific target means and CVs • Low target uncertainty• Control of sample stability
Laboratory• Better IQC-sample• Easier set-up of IQC (more reliable estimates of stable performance) • Easier troubleshooting by direct comparison with “peer”
Summary IQC samples with target valuesIQC samples with system specific target values for mean & CV (SD), that have a negligible uncertainty, are the preferred sample for the laboratory due to-easy IQC set-up &-easier troubleshooting
Statistical excursison
Statistics & graphics for the laboratory 25
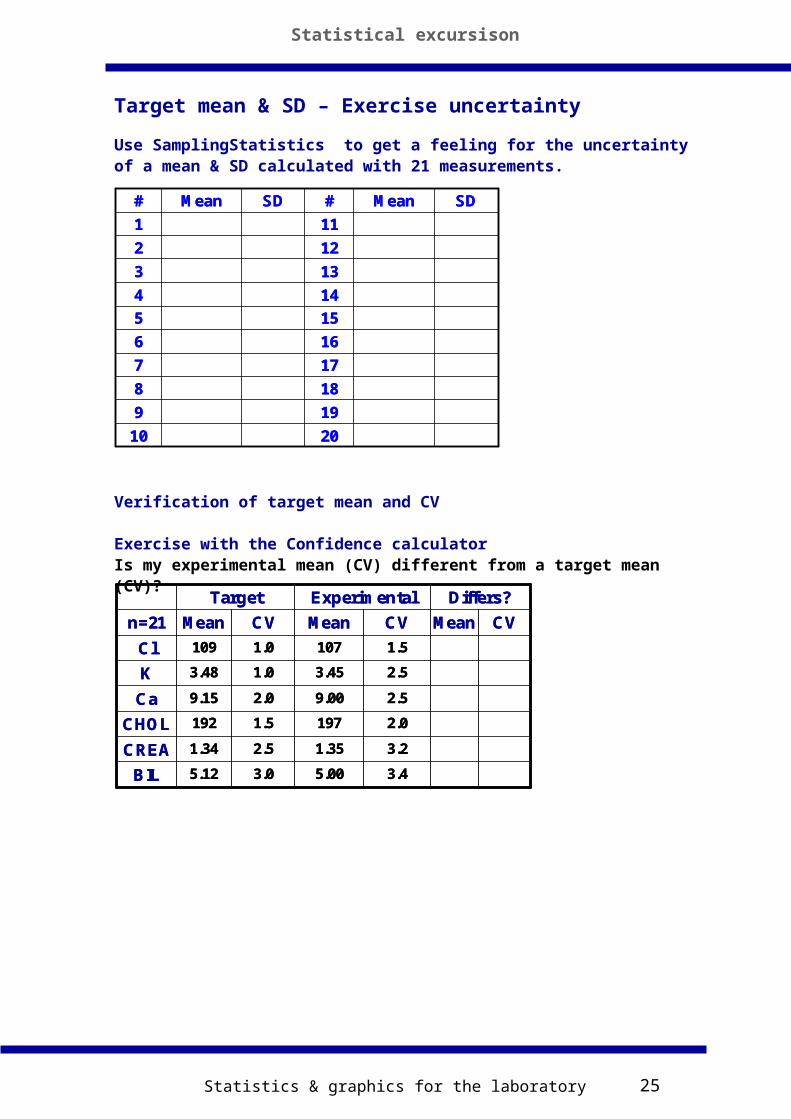
Target mean & SD – Exercise uncertainty
Use SamplingStatistics to get a feeling for the uncertainty of a mean & SD calculated with 21 measurements.
Verification of target mean and CV
Exercise with the Confidence calculatorIs my experimental mean (CV) different from a target mean (CV)?
Statistical excursison
2010
199
188
177
166
155
144
133
122
111
SDMean#SDMean#
2010
199
188
177
166
155
144
133
122
111
SDMean#SDMean#
CVMean
Differs?
3.4
3.2
2.0
2.5
2.5
1.5
CV
5.00
1.35
197
9.00
3.45
107
Mean
Experimental
3.0
2.5
1.5
2.0
1.0
1.0
CV
Target
5.12BIL
1.34CREA
192CHOL
9.15Ca
3.48K
109Cl
Meann=21 CVMean
Differs?
3.4
3.2
2.0
2.5
2.5
1.5
CV
5.00
1.35
197
9.00
3.45
107
Mean
Experimental
3.0
2.5
1.5
2.0
1.0
1.0
CV
Target
5.12BIL
1.34CREA
192CHOL
9.15Ca
3.48K
109Cl
Meann=21
Statistics & graphics for the laboratory 26
Target CV (SD) of the laboratory
Some remarks on its meaning for IQC purposesThe target CV (= stable imprecision) is the cornerstone of IQC. It deserves special attention. All instabilities (random and systematic) are compared relative to the stable imprecision.
Usually, one selects CVa,total for IQC purposes.
CVa,total includes variations from• within-run (-day)• between-run (-day)• [calibration]
“Target CV” and calibration intervals/tolerance Decide whether/or not to include in the “target CV” the between-calibration variation
• Monthly calibration: ?• Weekly calibration: Perhaps• Daily calibration: Yes, but be aware of the tolerance
Know the calibration tolerance• Be aware of “shifts” after calibration• Indicator: the CVtotal/CVwithin ratio
Know the lot variation of calibrators/reagents
“Target CV” and the CVa,total/CVa,within ratio
The CVa,total/CVa,within ratio:
a general indicator for test stability
CVa,total/CVa,within ratios 2.5 may indicate the necessity of special attention to
quality assurance (e.g.; new lots).Also, in order to pick up unwanted variations, one may consider to use a CV lower than CVa,total for IQC.
General remarkIt would be desirable to have in-depth information about instrument and test variation. Ideally, a GUM type variance analysis should be available for all important elements (e.g., calibrator lots, reagent lots).Then, a distinction could be be made which variation one wants to pick up by IQC and which variation is accepted as inherent to the system.
IQC – practical aspects
Statistics & graphics for the laboratory 27
Checklist for the IQC-sample
IQC – practical aspects
Nature• Correspond with patient sample• Compatible with the test
Concentration: medically relevant• Number of levels
Stability (liquid versus lyophilized) Lyophilized
• Variation in fill content• Accuracy of reconstitution
Target mean• Sufficient digits• System specific• Uncertainty
Target SD/CV• Representative for system• Uncertainty
Checklist “stable” imprecision
Gather as much information as possible
Instrument stability(general system robustness), e.g.:• Pipetting• Temperature• Photometer (wavelength/intensity/sensor)
Test stability & reproducibility(individual test robustness)• Total/within-day CV (CVa,tot/CVa,w ratio)
• Calibration tolerance (within/between lot), -function• Reagent (within/between lot)• Test robustness
Statistics & graphics for the laboratory 28
IQC materials – Frequency
IQC – practical aspects
Minimum frequencyLegislation often requires that at least 2 control samples should be measured per analytical run.In consequence, even when only one patient specimen is measured in a run, two controls have to be included.
Note 1The maximum length of a run is 24 hours, or a shift (for hematology, often a maximum run lenght of 8 hours is recommended).Note 2 Control materials should be introduced in regular analytical runs and not be treated separately.
Desirable frequency No general rule can be given
• The laboratory should adapt the number of control samples to the stability of the system and the control rule it applies.
• Realistically, the frequency of control samples may be in the order of …% of the patient samples.
• Consider “dummy” measurements before 1st IQC (system warm-up).
IQC materials – Location
Random versus regular• Random placement gives a better estimate of the CV• Regular placement makes “administration easier”
Small runs Consider to “bracket” the patient sample(s) with 2 controls.
Medium runs Place 2 IQC samples before, in the mid, and after patient samples.
Long runs Measure IQC samples several times (e.g., 1-2% of the samples, dependent on system stability); start and end with IQC.Note: In case that the system is recalibrated, the following measurements have to be considered as a new run.
Statistics & graphics for the laboratory 29
IQC – practical aspects
IQC materials – Location
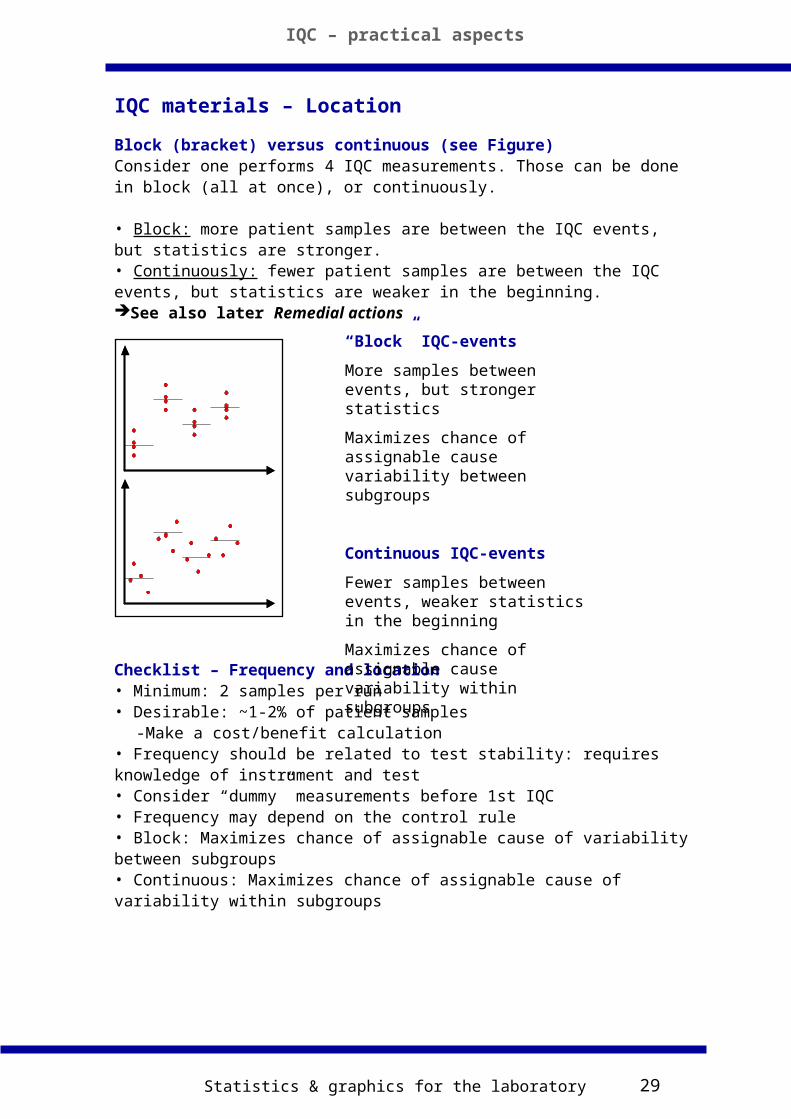
Block (bracket) versus continuous (see Figure)Consider one performs 4 IQC measurements. Those can be done in block (all at once), or continuously.
• Block: more patient samples are between the IQC events, but statistics are stronger.• Continuously: fewer patient samples are between the IQC events, but statistics are weaker in the beginning.See also later Remedial actions
Checklist – Frequency and location• Minimum: 2 samples per run• Desirable: ~1-2% of patient samples
-Make a cost/benefit calculation• Frequency should be related to test stability: requires knowledge of instrument and test• Consider “dummy” measurements before 1st IQC• Frequency may depend on the control rule• Block: Maximizes chance of assignable cause of variability between subgroups• Continuous: Maximizes chance of assignable cause of variability within subgroups
“Block” IQC-events
More samples between events, but stronger statistics
Maximizes chance of assignable cause variability between subgroups
Continuous IQC-events
Fewer samples between events, weaker statistics in the beginning
Maximizes chance of assignable cause variability within subgroups
Statistics & graphics for the laboratory 30
IQC – practical aspects
Presentation of IQC data
In the form of• Tables• Control charts• Histograms (summary data)
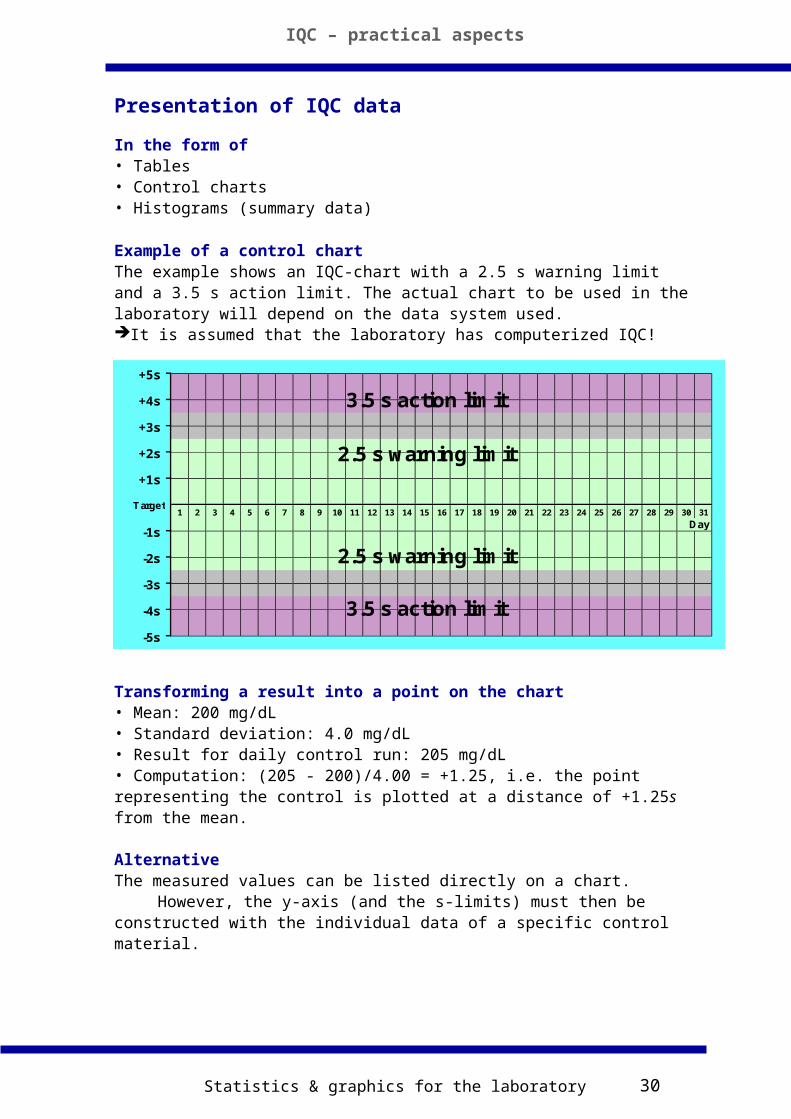
Example of a control chartThe example shows an IQC-chart with a 2.5 s warning limit and a 3.5 s action limit. The actual chart to be used in the laboratory will depend on the data system used.It is assumed that the laboratory has computerized IQC!
Transforming a result into a point on the chart• Mean: 200 mg/dL• Standard deviation: 4.0 mg/dL• Result for daily control run: 205 mg/dL• Computation: (205 - 200)/4.00 = +1.25, i.e. the point representing the control is plotted at a distance of +1.25s from the mean.
AlternativeThe measured values can be listed directly on a chart.
However, the y-axis (and the s-limits) must then be constructed with the individual data of a specific control material.
1 2 3 4 5 6 7 8 9 10 11 12 13 14 15 16 17 18 19 20 21 22 23 24 25 26 27 28 29 30 31
Day
-3s
-4s
-5s
+1s
Target
-1s
-2s
+5s
+4s
+3s
+2s
3.5 s action limit
3.5 s action limit
2.5 s warning limit
2.5 s warning limit
Statistics & graphics for the laboratory 31
Documentation of IQC data
IQC – practical aspects
Some general remarks• IQC data that are stored on electronic media should be printed regularly (e.g., weekly).• IQC data have to be archieved for an adequate peroid of time, respecting the respective regulations.
Content of documents• Identification of the laboratory• Instrument (workplace)• Test• Date• Signature of the operator• Identification of the control material (lot & expiry)• Target & Limits (rules)• Data (individual & summary, e.g., monthly mean & CV)• Accept/reject boxes• Corrective actions taken• New IQC bottle, reagent (lot & expiry), calibrator (lot & expiry)• Instrument calibration or major maintenance• Instrument function checks (temperature, wavelength, etc.)Note: Documentation must be able to identify which IQC-data belong to which patient results.
Statistics & graphics for the laboratory 32
IQC software
IQC – practical aspects
Software
ChecklistAdministrative capabilities-Easy set-up and modification-Online (real time) connection with LIS-Full sample & IQC traceability-“Accreditation-conform” documentation-Up-to-date data safety
“IQC”-capabilities-Transparent & efficient data presentation-Great variety of rules-Rule selection logic-Automatic release-Automatic “flags” and remedial action(but with open decision logic)
Examples• QC Today (IL)• EZ Runs (Westgard)• Unity (BioRad)• Computrol on Line (Sigma)•[System-specific]
Statistics & graphics for the laboratory 33
Statistical basis of IQC
Introduction
Statistics• Basic calculations• Gaussian distribution (standard and cumulated)• Gaussian distribution and %-age of observations• Statistical probabilities• “Rare events”• Summary outside probabilities
Control rules• From outside probabilities to control rules• Control rules – An example• Control rules – basic monitoring principles• Selection of control rules: Fundamental problems• Power function graphs• Construction of the power function for 13s and SE• Construction of the power function for 12s and RE• Power of control rules and s-limits• Power of control rules and n• Comparison of the power of control rules• Control rules: The problem of false rejection (Pfr)• Circumventing the increase in Pfr with n: control rules with variable limits• The ideal control rule• Magnitude of errors detected by IQC
Conclusions from statistical considerations
Statistical basis of IQC
Statistics & graphics for the laboratory 34
The chapter addresses:
Basic statistical knowledge required for understanding the selection of IQC-rules• Main characteristics of the Gaussian (or Normal) distribution,• Power functions for IQC and their importance for the selection of quality control rules,• The problem of false rejections of stable analytical runs.
Statistical basis of IQC
• Basic calculations• Gaussian distribution (standard and cumulated)• Gaussian distribution and %-age of observations• Statistical probabilities• “Rare events”• Summary outside probabilities
Introduction
Statistical basis of IQC
Statistics & graphics for the laboratory 35
Basic calculations
Statistical basis of IQC
REMEMBER• Analytical procedures give results (xi) that are independent from other results
• xi comes from a Gaussian distribution with a mean µ
and a standard deviation
Calculation of• Mean• Standard deviation• Coefficient of variation (CV)>See: Basic statistics
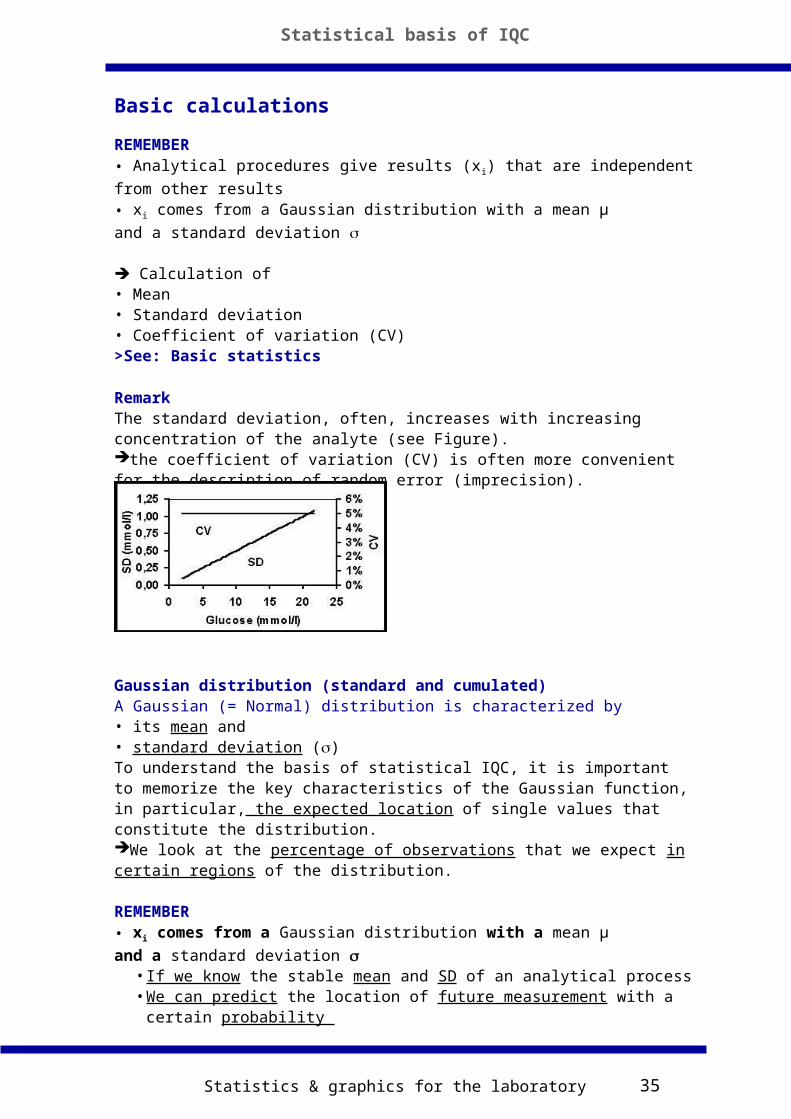
RemarkThe standard deviation, often, increases with increasing concentration of the analyte (see Figure).the coefficient of variation (CV) is often more convenient for the description of random error (imprecision).
Gaussian distribution (standard and cumulated)A Gaussian (= Normal) distribution is characterized by• its mean and• standard deviation ()To understand the basis of statistical IQC, it is important to memorize the key characteristics of the Gaussian function, in particular, the expected location of single values that constitute the distribution.We look at the percentage of observations that we expect in certain regions of the distribution.
REMEMBER• xi comes from a Gaussian distribution with a mean µ
and a standard deviation • If we know the stable mean and SD of an analytical process• We can predict the location of future measurement with a certain probability
Statistics & graphics for the laboratory 36
Graphical presentation of the Gaussian distribution
Gaussian distribution
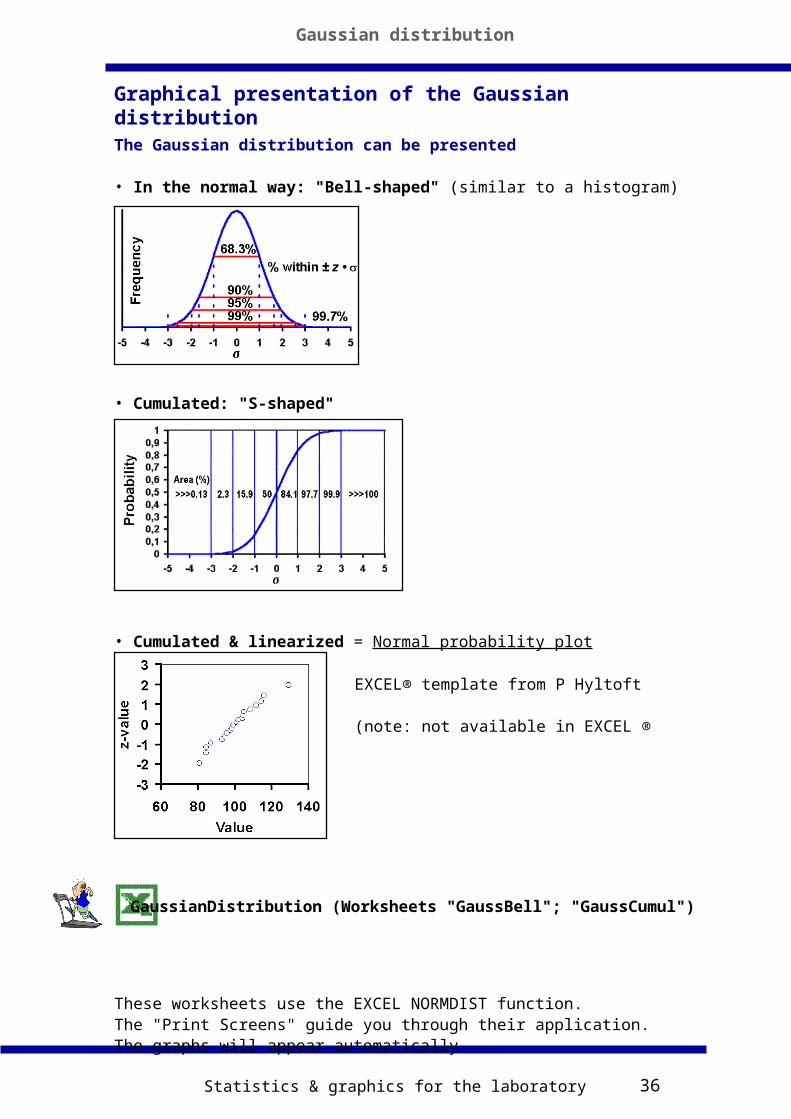
The Gaussian distribution can be presented
• In the normal way: "Bell-shaped" (similar to a histogram)
• Cumulated: "S-shaped"
• Cumulated & linearized = Normal probability plot
EXCEL® template from P Hyltoft Petersen(note: not available in EXCEL ® itself)
These worksheets use the EXCEL NORMDIST function.The "Print Screens" guide you through their application.The graphs will appear automatically.
GaussianDistribution (Worksheets "GaussBell"; "GaussCumul")
Statistics & graphics for the laboratory 37
Gaussian distributions – Probabilities
Gaussian distribution
IMPORTANT NOTEWhen data are Gaussian distributed, we can predict the frequencies (or probabilities) of their occurrence within or outside certain distances (, or z-values) from the mean (see also Figures above).
These probabilities are used in parametric statistical calculations. They are listed in tables, but they also can be calculated with EXCEL®. Of particular importance are probabilities that are used in statistical tests (95%, 99% probabilities).
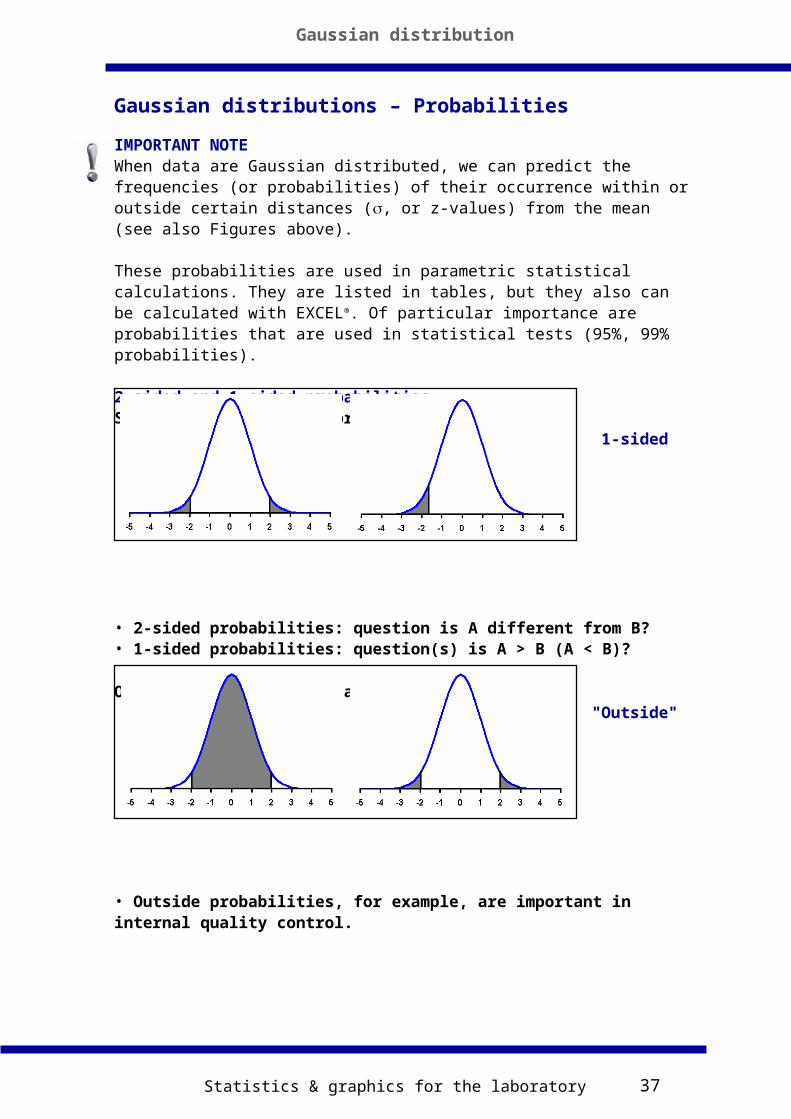
2-sided and 1-sided probabilitiesStatistics distinguish probabilities in
2-sided & 1-sided
• 2-sided probabilities: question is A different from B?• 1-sided probabilities: question(s) is A > B (A < B)?
Of practical importance are probabilities"Inside" & "Outside"
• Outside probabilities, for example, are important in internal quality control.
Statistics & graphics for the laboratory 38
Gaussian distributions – Probabilities
Gaussian distribution
Probabilities at selected (z) values
INSIDE OUTSIDE1-sided 2-sided 1-sided 2-sided
1.65 95% [90 %] 5% [10 %]
1.96 97.5% 95% 2.5% 5%
2.0 97.7% 95.5% 2.3% 4.5%
2.33 99% 98% 1.0% 2.0%
2.58 99.5% 99% 0.5% 1.0%
3.0 99.87% 99.7% 0.13% 0.3%
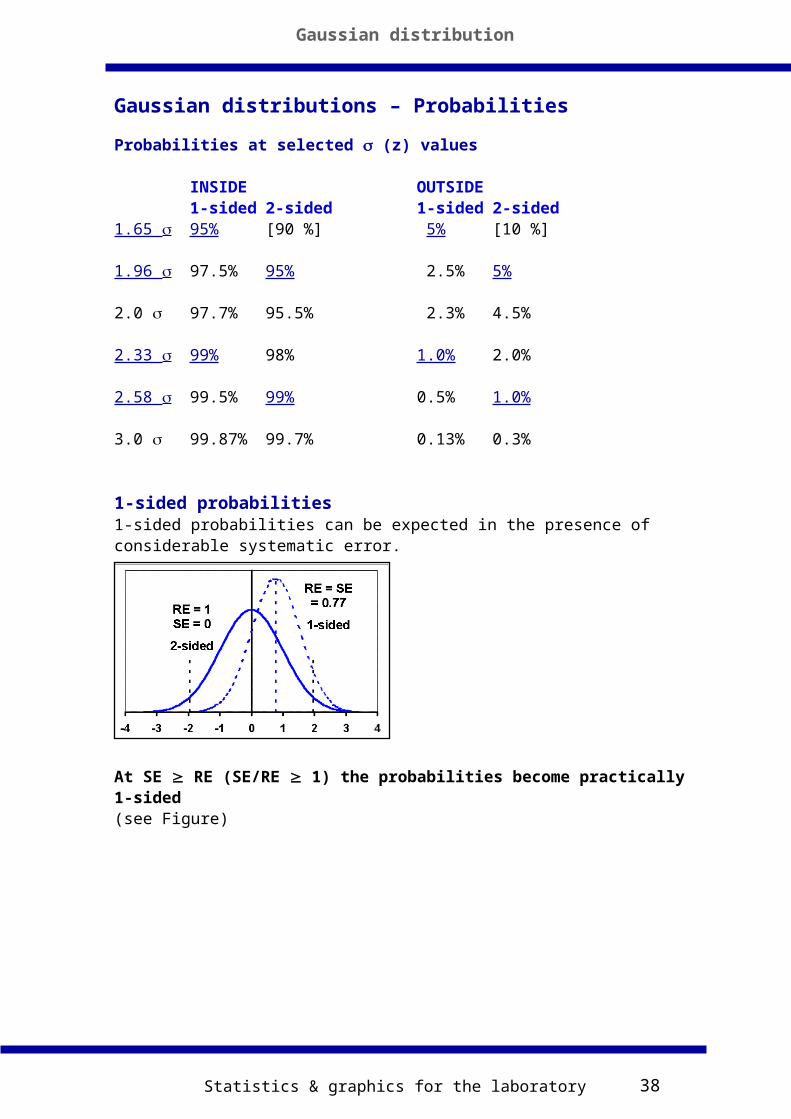
1-sided probabilities1-sided probabilities can be expected in the presence of considerable systematic error.
At SE RE (SE/RE 1) the probabilities become practically 1-sided(see Figure)
Statistics & graphics for the laboratory 39
“Rare events” and outside probabilities
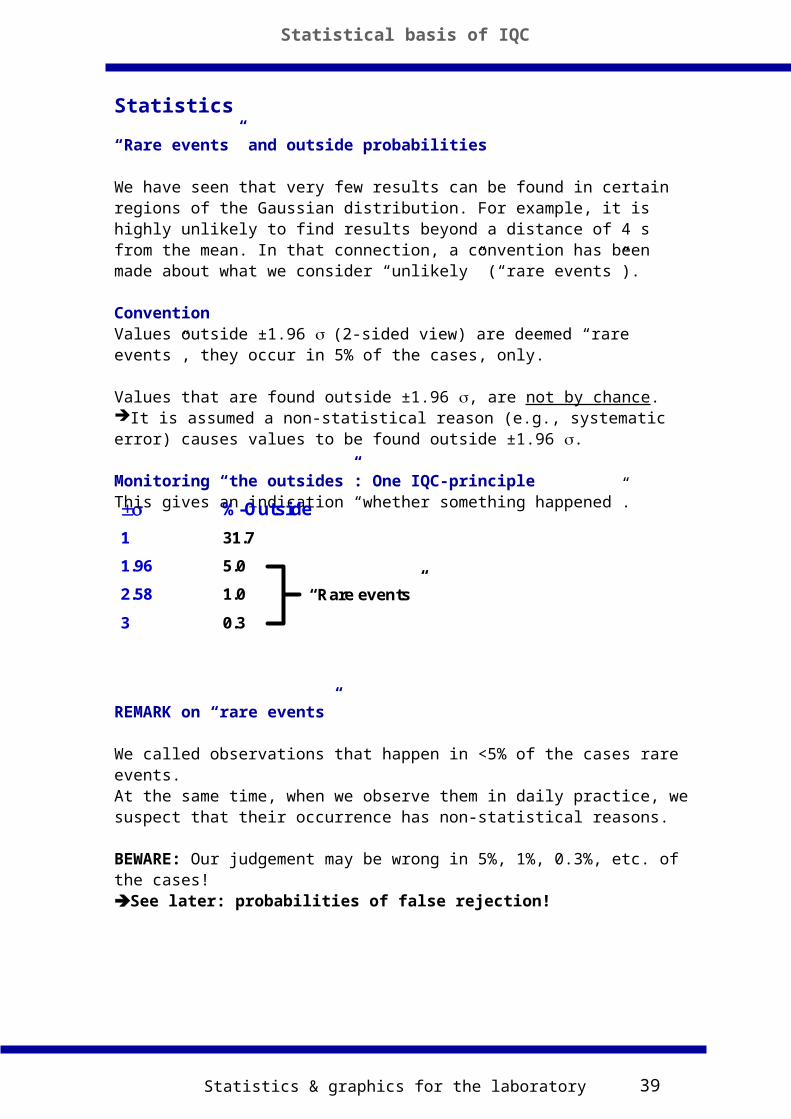
We have seen that very few results can be found in certain regions of the Gaussian distribution. For example, it is highly unlikely to find results beyond a distance of 4 s from the mean. In that connection, a convention has been made about what we consider “unlikely” (“rare events”).
ConventionValues outside ±1.96 (2-sided view) are deemed “rare events”, they occur in 5% of the cases, only.
Values that are found outside ±1.96 , are not by chance. It is assumed a non-statistical reason (e.g., systematic error) causes values to be found outside ±1.96 .
Monitoring “the outsides”: One IQC-principleThis gives an indication “whether something happened”.
REMARK on “rare events”
We called observations that happen in <5% of the cases rare events.At the same time, when we observe them in daily practice, we suspect that their occurrence has non-statistical reasons.
BEWARE: Our judgement may be wrong in 5%, 1%, 0.3%, etc. of the cases!See later: probabilities of false rejection!
Statistics
%-Outside
1 31.7
1.96 5.0
2.58 1.0
3 0.3
“Rare events”
Statistical basis of IQC
Statistics & graphics for the laboratory 40
Calculations• Mean• SD• CV
Gaussian (normal) distribution• Graphic of the usual & the cumulated distribution• Probabilities within certain distances () of the mean• Probabilities outside certain distances () of the mean• 1-sided and 2-sided probabilities• Important values for • Convention on “rare events”• Possibility of wrong decisions• The 1st IQC principle: monitoring the outsides
Exercises with EXCEL®
Tools > Add-ins > Analysis ToolPak & -VBAInstalls Data Analysis
Tools > Data Analysis > Random number generationInvestigate them with > Descriptive Statistics
Normal Simulator
Statistical basis of IQC
Checklist – Basic statistics
Statistics & graphics for the laboratory 41
Control rules
Statistical basis of IQC
From outside probabilities to control rules
REMEMBERMonitoring “the outsides”: One IQC-principleThis principle leads us to a simple family of IQC-rules. Namely, based on a known Gaussian distribution, we monitor in practice whether we observe an IQC result that falls, for example, out of the ±3 s limits of that population. In case that happens (note: the probability is less than 0.3%), we assume that the process became unstable.
the 13s-rule
The 13s-rule
The process is out-of-control when 1 IQC result is outside a distance of ± 3 s from the «true» mean.
It is a member of the family : nz•s
• n: number of observations• z: certain number of standard deviations of the Gaussian distribution (= standard normal deviate)• s: stable (“true”) standard deviation
Basic monitoring principles of IQC-rules• “The outsides” (for example 13s)
• A trend• The location towards the mean (above or below)• A range (difference between results)• The mean (several results)• The imprecision, or variance (several results)
Control rulesSelection of control rules – Fundamental problems• There are many different control rules• Different control rules have different power for error detection• Different control rules have different probabilities of false rejections
The selection of a particular control rule is always a trade-off between error detection and false rejection!
Statistics & graphics for the laboratory 42
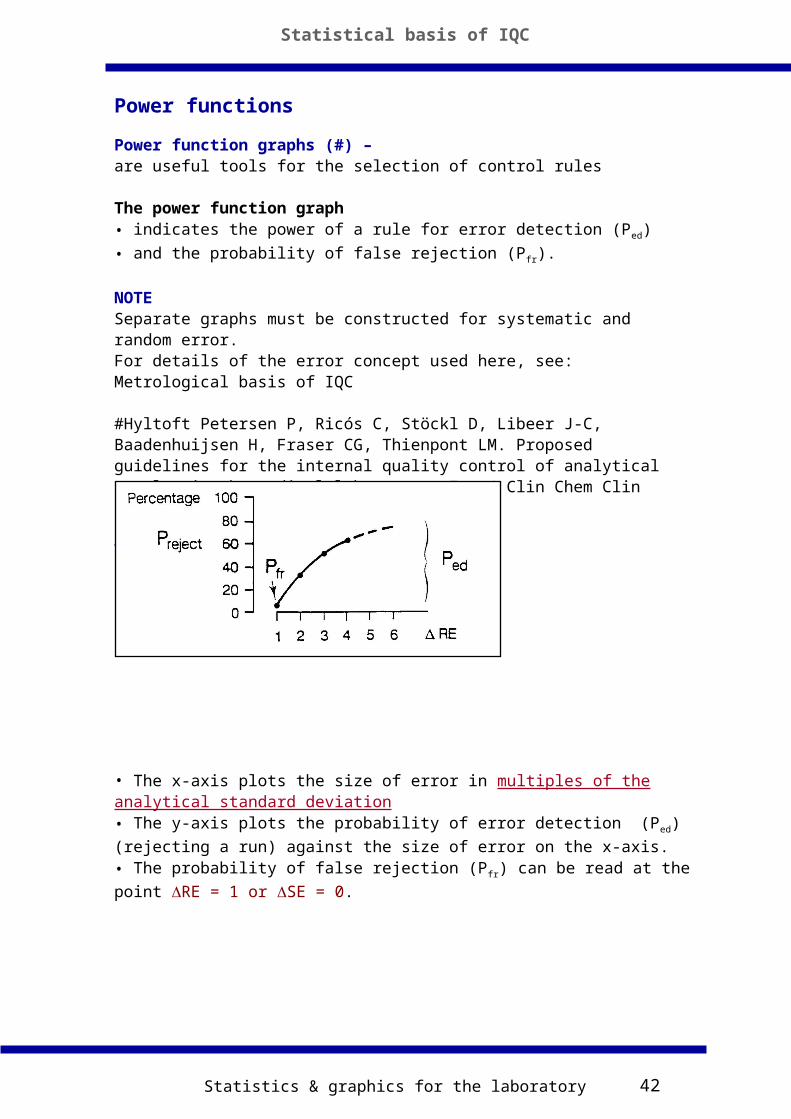
Power function graphs (#) –are useful tools for the selection of control rules The power function graph• indicates the power of a rule for error detection (Ped)
• and the probability of false rejection (Pfr).
NOTESeparate graphs must be constructed for systematic and random error. For details of the error concept used here, see: Metrological basis of IQC
#Hyltoft Petersen P, Ricós C, Stöckl D, Libeer J-C, Baadenhuijsen H, Fraser CG, Thienpont LM. Proposed guidelines for the internal quality control of analytical results in the medical laboratory. Eur J Clin Chem Clin Biochem 1996;34:983-99.
The power function graph
• The x-axis plots the size of error in multiples of the analytical standard deviation• The y-axis plots the probability of error detection (Ped) (rejecting a run) against
the size of error on the x-axis.• The probability of false rejection (Pfr) can be read at the point RE = 1 or SE =
0.
Power functions
Statistical basis of IQC
Statistics & graphics for the laboratory 43
Power functions
Statistical basis of IQC
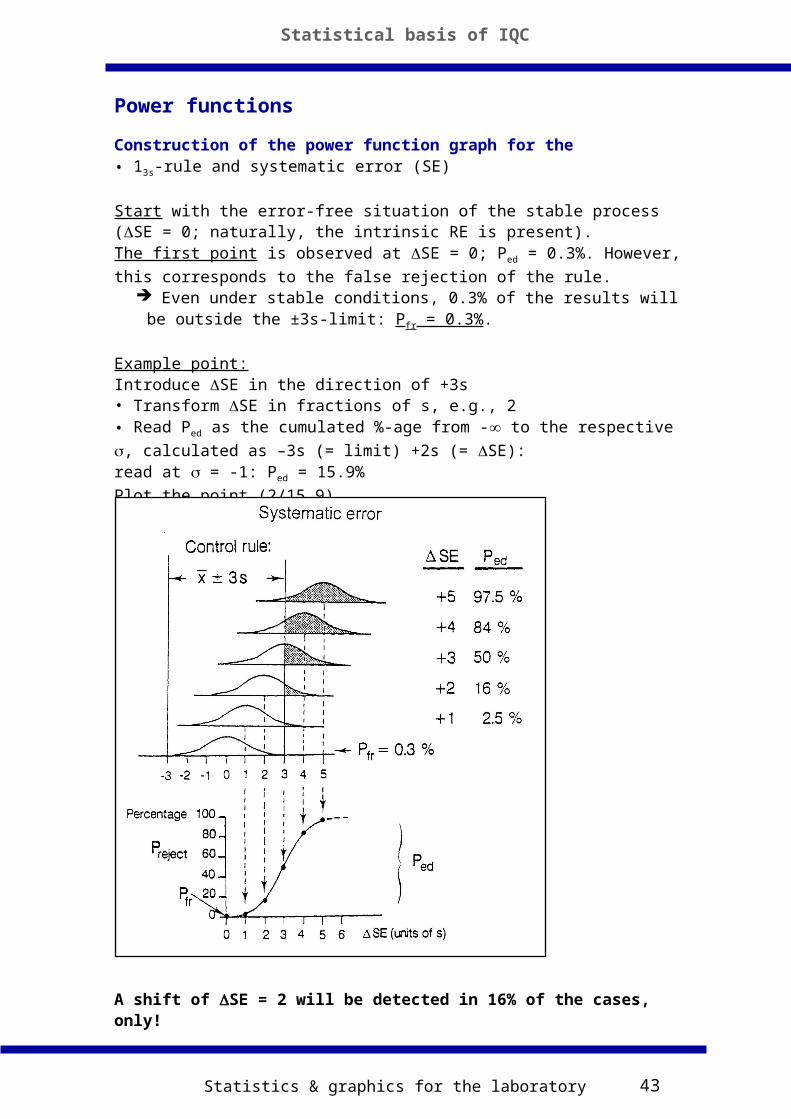
Construction of the power function graph for the• 13s-rule and systematic error (SE)
Start with the error-free situation of the stable process (SE = 0; naturally, the intrinsic RE is present).The first point is observed at SE = 0; Ped = 0.3%. However, this corresponds to
the false rejection of the rule. Even under stable conditions, 0.3% of the results will be outside the ±3s-
limit: Pfr = 0.3%.
Example point:Introduce SE in the direction of +3s• Transform SE in fractions of s, e.g., 2• Read Ped as the cumulated %-age from - to the respective , calculated as –3s
(= limit) +2s (= SE):read at = -1: Ped = 15.9%
Plot the point (2/15.9)
A shift of SE = 2 will be detected in 16% of the cases, only!
Statistics & graphics for the laboratory 44
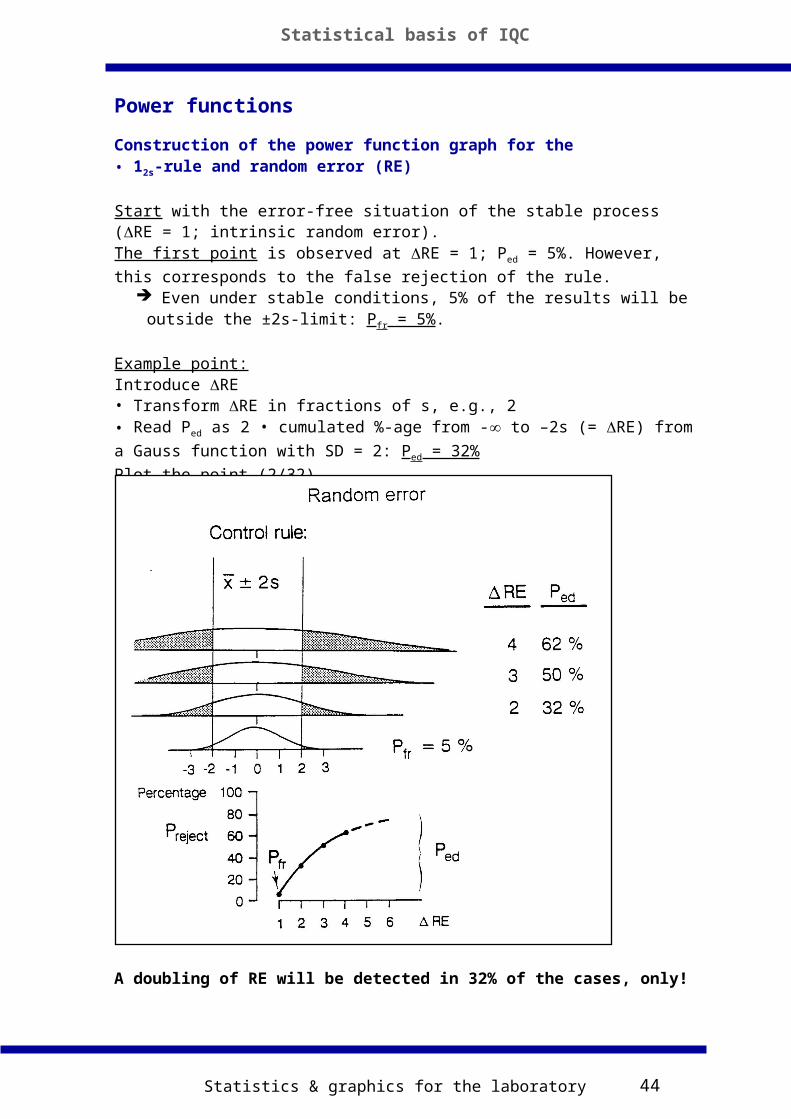
Construction of the power function graph for the• 12s-rule and random error (RE)
Start with the error-free situation of the stable process (RE = 1; intrinsic random error).The first point is observed at RE = 1; Ped = 5%. However, this corresponds to the
false rejection of the rule. Even under stable conditions, 5% of the results will be outside the ±2s-limit:
Pfr = 5%.
Example point:Introduce RE• Transform RE in fractions of s, e.g., 2• Read Ped as 2 • cumulated %-age from - to –2s (= RE) from a Gauss function
with SD = 2: Ped = 32%
Plot the point (2/32)
A doubling of RE will be detected in 32% of the cases, only!
Statistical basis of IQC
Power functions
Statistics & graphics for the laboratory 45
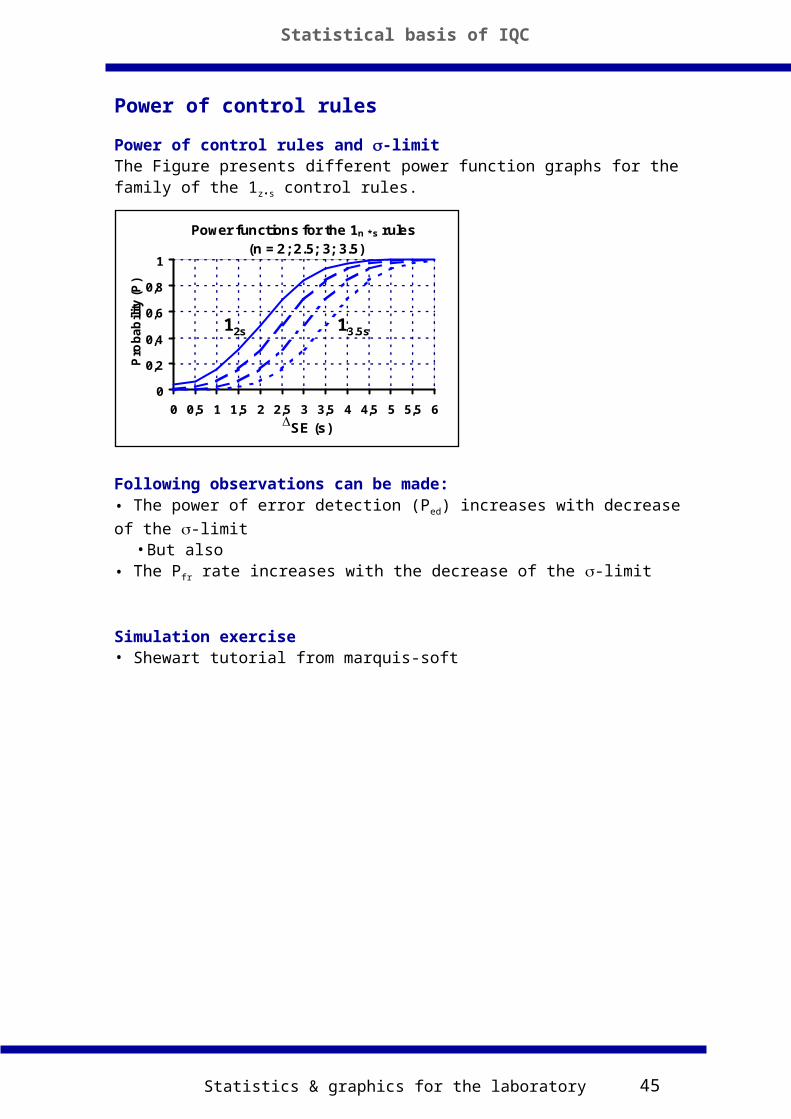
Power of control rules and -limitThe Figure presents different power function graphs for the family of the 1z•s
control rules.
Following observations can be made:• The power of error detection (Ped) increases with decrease of the -limit
• But also• The Pfr rate increases with the decrease of the -limit
Simulation exercise• Shewart tutorial from marquis-soft
Power functions for the 1n * s rules (n = 2; 2.5; 3; 3.5)
0
0,2
0,4
0,6
0,8
1
0 0,5 1 1,5 2 2,5 3 3,5 4 4,5 5 5,5 6
SE (s)
Pro
ba
bili
ty (
P)
12s 13.5s
Power of control rules
Statistical basis of IQC
Statistics & graphics for the laboratory 46
Power of control rules & n
Comparison of the power of control rules
Power of control rules
Statistical basis of IQC
Power functions for the 3s rule(n= 1,2,4,6)
0
0,2
0,4
0,6
0,8
1
1 1,5 2 2,5 3 3,5 4 4,5 5 5,5 6 6,5 7
x(s) ∙ REi
Pro
ba
bili
ty (
P)
n = 6
n = 1
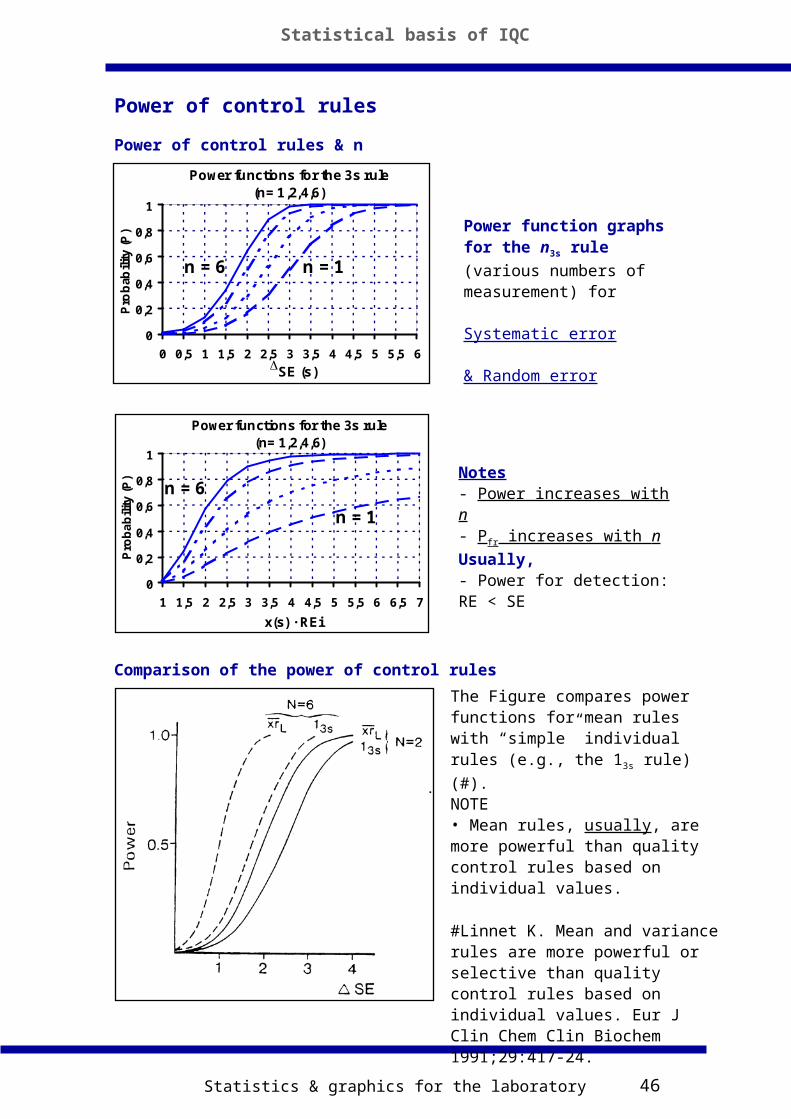
Power function graphs for the n3s rule (various numbers
of measurement) for
Systematic error
& Random error
Notes- Power increases with n- Pfr increases with n
Usually, - Power for detection: RE < SE
Power functions for the 3s rule(n= 1,2,4,6)
0
0,2
0,4
0,6
0,8
1
0 0,5 1 1,5 2 2,5 3 3,5 4 4,5 5 5,5 6
SE (s)
Pro
bab
ility
(P)
n = 1n = 6
The Figure compares power functions for mean rules with “simple” individual rules (e.g., the 13s rule) (#).
NOTE• Mean rules, usually, are more powerful than quality control rules based on individual values.
#Linnet K. Mean and variance rules are more powerful or selective than quality control rules based on individual values. Eur J Clin Chem Clin Biochem 1991;29:417-24.
Statistics & graphics for the laboratory 47
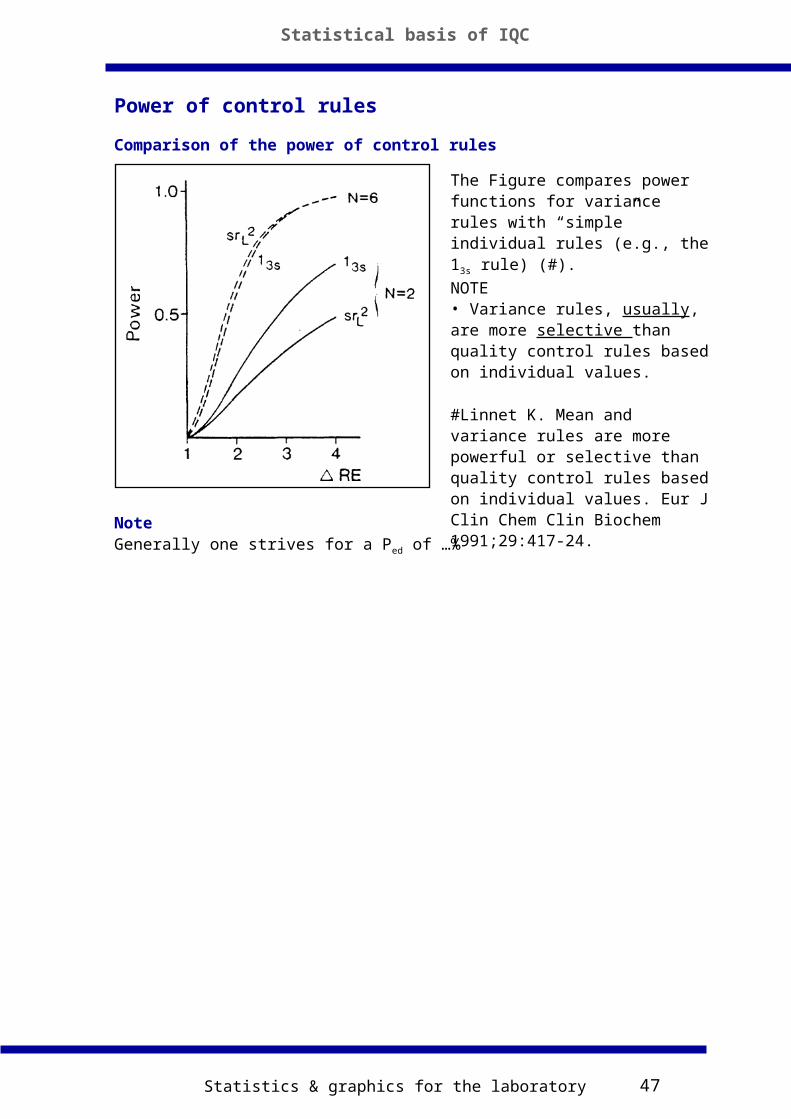
Comparison of the power of control rules
NoteGenerally one strives for a Ped of …%
Power of control rules
Statistical basis of IQC
The Figure compares power functions for variance rules with “simple” individual rules (e.g., the 13s
rule) (#).NOTE• Variance rules, usually, are more selective than quality control rules based on individual values.
#Linnet K. Mean and variance rules are more powerful or selective than quality control rules based on individual values. Eur J Clin Chem Clin Biochem 1991;29:417-24.
Statistics & graphics for the laboratory 48
The problem of false rejection (Pfr)
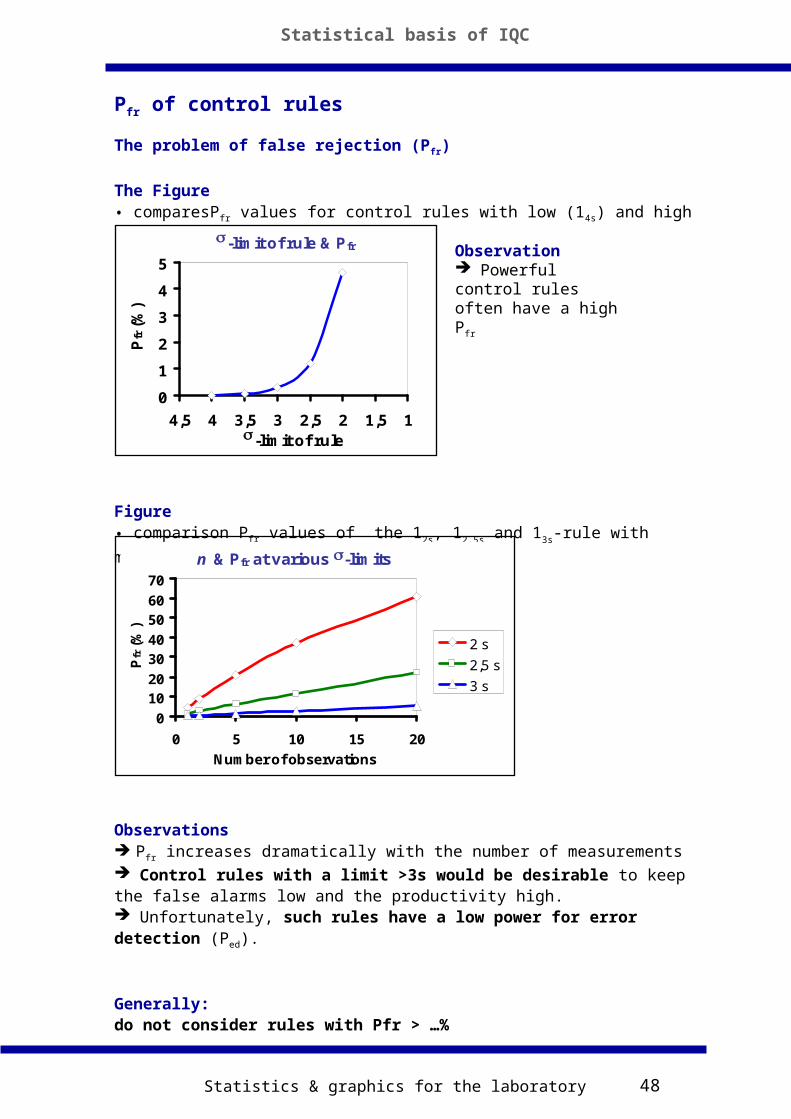
The Figure • comparesPfr values for control rules with low (14s) and high (12s) Ped.
Figure• comparison Pfr values of the 12s, 12.5s and 13s-rule with measurements ranging
from 1 – 20.
Observations
Pfr increases dramatically with the number of measurements Control rules with a limit >3s would be desirable to keep the false alarms low and the productivity high. Unfortunately, such rules have a low power for error detection (Ped).
Generally:do not consider rules with Pfr > …%
n & Pfr at various -limits
0
1020
3040
5060
70
0 5 10 15 20
Number of observations
Pfr (
%)
2 s
2,5 s
3 s
Statistical basis of IQC
Pfr of control rules
-limit of rule & Pfr
0
1
2
3
4
5
11,522,533,544,5-limit of rule
Pfr (
%)
Observation Powerful control rules often have a high Pfr
Statistics & graphics for the laboratory 49
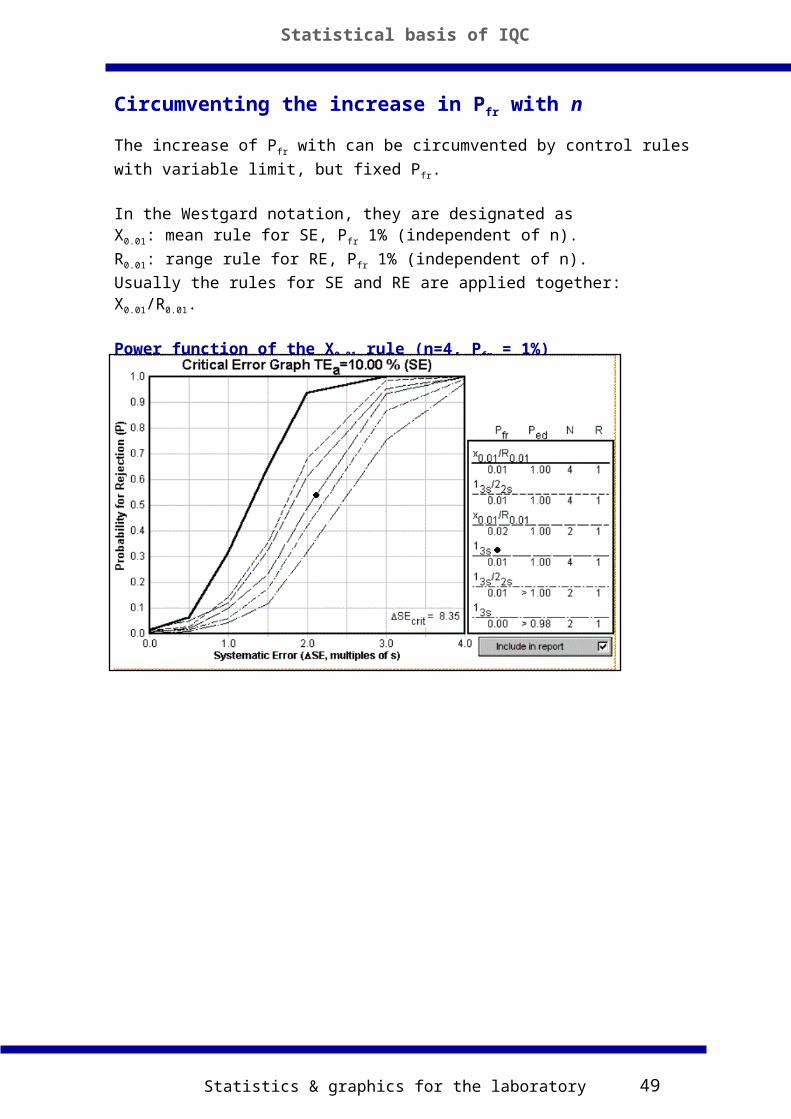
The increase of Pfr with can be circumvented by control rules with variable limit,
but fixed Pfr.
In the Westgard notation, they are designated asX0.01: mean rule for SE, Pfr 1% (independent of n).
R0.01: range rule for RE, Pfr 1% (independent of n).
Usually the rules for SE and RE are applied together: X0.01/R0.01.
Power function of the X0.01 rule (n=4, Pfr = 1%)
For SE: Quite powerful at higher n
Statistical basis of IQC
Circumventing the increase in Pfr with n
Statistics & graphics for the laboratory 50
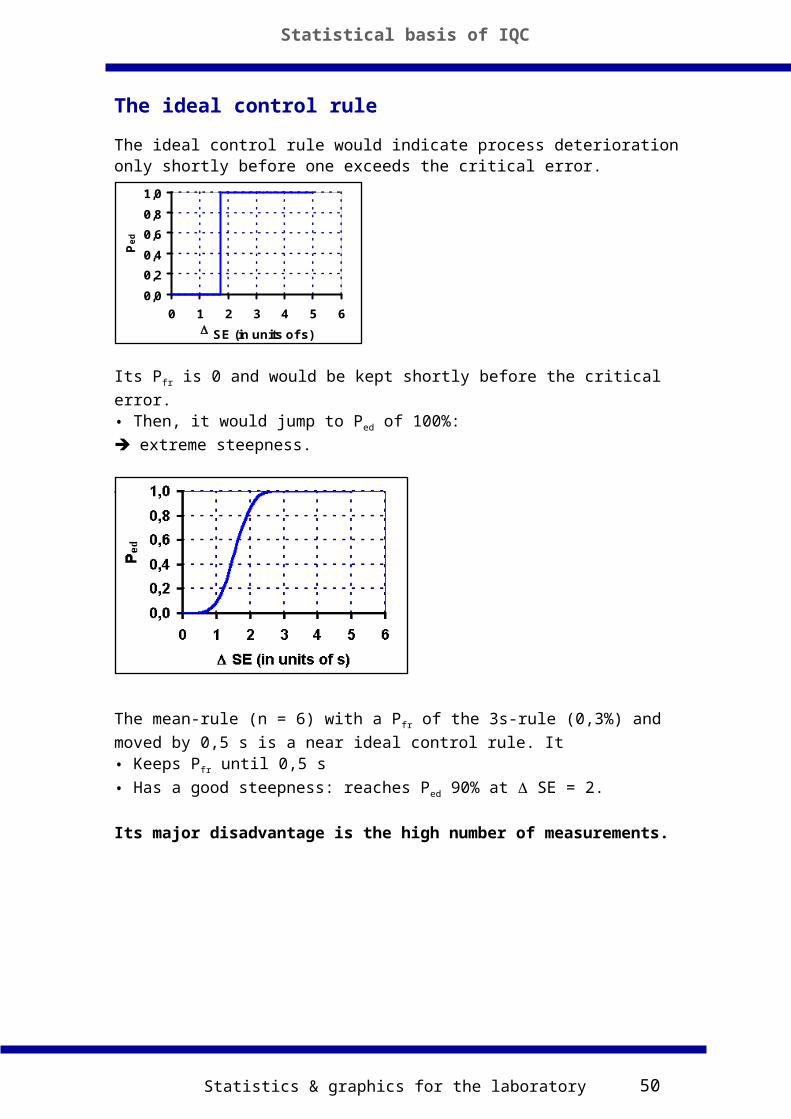
The ideal control rule would indicate process deterioration only shortly before one exceeds the critical error.
Its Pfr is 0 and would be kept shortly before the critical error.
• Then, it would jump to Ped of 100%:
extreme steepness.
A near-ideal control rule
The mean-rule (n = 6) with a Pfr of the 3s-rule (0,3%) and moved by 0,5 s is a
near ideal control rule. It• Keeps Pfr until 0,5 s
• Has a good steepness: reaches Ped 90% at SE = 2.
Its major disadvantage is the high number of measurements.
Statistical basis of IQC
The ideal control rule
0,0
0,2
0,4
0,6
0,8
1,0
0 1 2 3 4 5 6
SE (in units of s)
Pe
d
Statistics & graphics for the laboratory 51
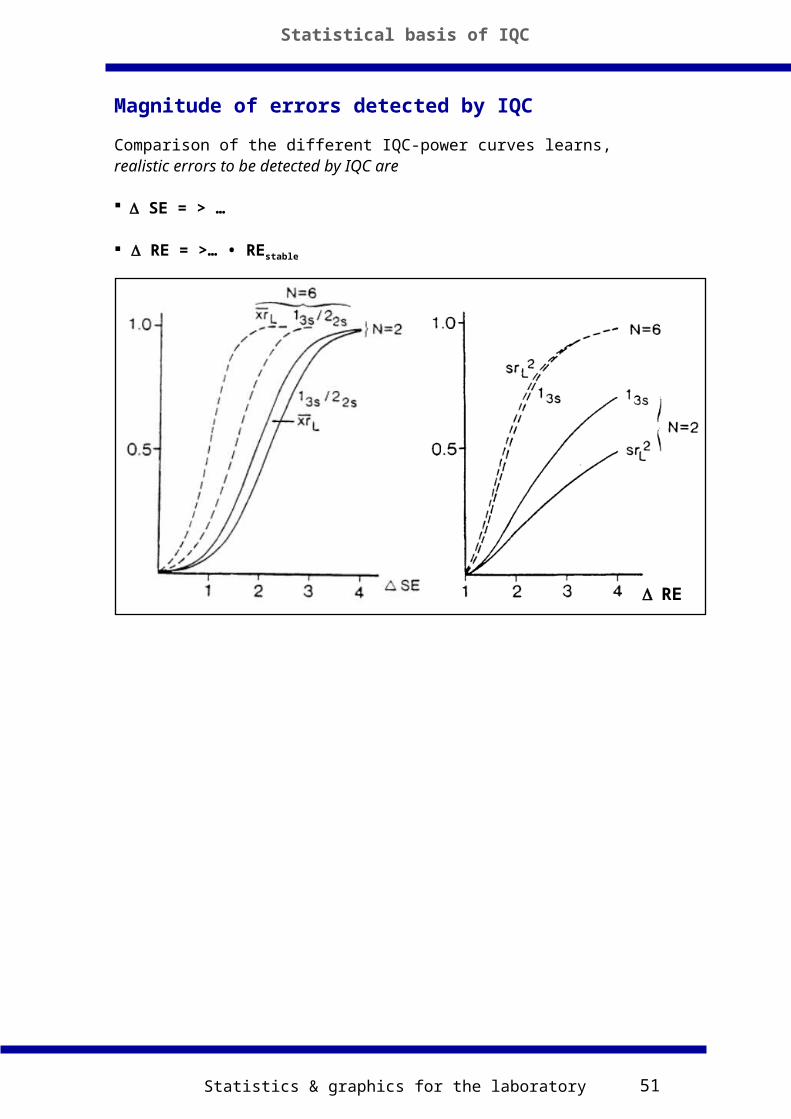
Comparison of the different IQC-power curves learns, realistic errors to be detected by IQC are
SE = > …
RE = >… • REstable
Statistical basis of IQC
Magnitude of errors detected by IQC
RE
Statistics & graphics for the laboratory 52
• Pfr increases dramatically when multiple measurements are performed, or when
many analytes are controlled, for example, on a multichannel analyzer.
• But, also Ped increases with the number of measurements.
• Control rules with a limit >3s would be desirable to keep the false alarms low and the productivity of the process high: low P fr.
• However, rules with a low Pfr, often have a low power for error detection (Ped).
• Multi-rules or mean and variance rules are superior to the single rules.
• Control rules for SE are more powerful than those for RE.
Conclusion: The selection of a control rule always has to compromise between high power for error detection and low probability of false rejection.
Note: Because of the complexity to deal with both random and systematic errors at the same time, separate IQC procedures have to be used for detection of systematic and random error (or multirules).
Checklist – Power of control rules• Ped should be 90%
• Realistic errors to be detected by IQC are• SE = >2• RE = >3 • REstable
• Ped AND Pfr increase with
• lower -limits (2 > 3)• n (note, some rules are connected to the number of materials: multiples of 2,
3 with 2 or 3 materials)• Generally, do not consider rules with Pfr >1%
• Ped increases by combination of rules
• Ped of mean and variance rules > than single or combined rules
• Ped for SE > RE
• Pfr at non-zero can be minimized by movement of the power curve
• The power curve should have a good steepness
Statistical basis of IQC
Conclusions from statistical considerations
Statistics & graphics for the laboratory 53
- www.westgard.com/qctools.html-STT Consulting-www.marquis-soft.com
Exercises with the software tools from MarquisWe set ARL = 370 (= 3s limit)
ARL & probability: ARL = 1/POutside 3s: 0.27%, P = 0.0027; ARL = 1/0.0027 = 370
1. Set SE = 0.5s, let run……………………………………………………………….……………………………………………………………….……………………………………………………………….
2. Set SE = 1.5s, let run……………………………………………………………….……………………………………………………………….……………………………………………………………….
3. Set SE = 1.5s, run until red, repeat several times……………………………………………………………….……………………………………………………………….……………………………………………………………….
Statistical basis of IQC
IQC simulation tools