overview - bcc.cuny.edu · utilize and incorporate basic business technology to produce business...
TRANSCRIPT
Overview
Institution Name Bronx Community College - CUNY
Address 2155 University Avenue, Bronx, NY 10453
Year Accredited 1994
Year Reaffirmed 2014
Years Covered by this Report 2014 - 2016
Date Submitted 01/03/2017
Completed By Clampman, Howard
Phone (718) 289-5590
Email [email protected]
ACBSP Champion Clampman, Howard
ACBSP Co-Champion Jaijairam, Paul

I - Institutional Information
To complete this section, first click on the Edit/Checkout button. Then copy and paste the headings into the Institutional Response box below and enter your information.
O 4. List all accredited programs (as they appear in your catalog).
Note: Listing new programs here does not confer accreditation. New degree programs, majors or emphases must be in effect for at least two years and have graduates and follow the guidance in the process book before accreditation will be granted.
O 5. List all programs that are in your business unit that are not accredited by ACBSP and how you distinguish accurately to the public between programs that have achieved accredited status and those that have not.
O 6. List all campuses where a student can earn a business degree from your institution.
O 7 Person completing report:
Name:
Phone:
Email address:
ACBSP Champion name:
ACBSP Co-Champion name:
Status: Completed | Due Date: Not Set
QA Report
Assigned To
Howard Clampman
Institution Response
4. List all accredited programs (as they appear in your catalog).
Business Administration AS Degree (options in Accounting, Computer Programming, Management and Marketing Management)
Accounting AAS Degree
Computer Information Systems AAS Degree (options in Computer Programming and Web Page Development)
Marketing Management AAS Degree
Medical Office Assistant AAS Degree
Office Administration and Technology AAS Degree
Note: Listing new programs here does not confer accreditation. New degree programs, majors or emphases must be in effect for at least two years and have graduates and follow the guidance in the process book before accreditation will be granted.
5. List all programs that are in your business unit that are not accredited by ACBSP and how you distinguish accurately to the public between programs that have achieved accredited status and those that have not.
Paralegal Studies AAS Degree - Accredited by American Bar Association
Paralegal Studies Certificate - Accredited by American Bar Association
6. List all campuses where a student can earn a business degree from your institution.
All degrees are earned at the sole campus, 2155 University Avenue, Bronx, NY 10453
7. Person completing report:
Name: Professor Howard A. Clampman and Professor Paul Jaijairam
Phone: 718-289-5590 and 718-289-5501
Email address: [email protected] and [email protected]
ACBSP Champion name: Professor Howard A. Clampman
ACBSP Co-Champion name: Professor Paul Jaijairam
Sources
There are no sources.
II - Status Report on Conditions and Notes
O 8. Conditions or Notes to be addressed: You do not need to address Opportunity for Improvement (OFI).
Please explain and provide the necessary documentation/evidence for addressing each condition or note since your last report.
Are you requesting the Board of Commissioners to remove notes or conditions (if the justification for removal is lengthy consider attaching an appendix to QA report):
Remove Note:
Remove Condition:
Do not remove note or condition. Explain the progress made in removing the note or condition:
Status: Completed | Due Date: Not Set
QA Report
Assigned To
Howard Clampman
Institution Response
No conditions or notes were assigned as part of the 2014 Self-Study.
Sources
There are no sources.
III - Public Information
Item III in the QA report applies to Criterion 6.11 in the Standards and Criteria book. Accredited business programs must routinely provide reliable information to the public on their performance, including student achievement. A direct link to aggregate business student results should be placed on your business page website. The following items must be available to the public for accreditation.
Student Learning Outcome Assessment Results: Such as what you report in standard #4, ETS, MFT, accounting assessment, management assessment, critical thinking, communication, etc. A link to Table 2 found in the evidence file must be placed on your website.
Program Results for Business Students: Such as graduation rates, retention rates, job placement, etc. How do you make the results public? A link to Table 7 found in the evidence file must be placed on your website. Ensure the link goes directly to business students' results such as the example in the evidence file above under ACBSP Documents, Good Example of Public Information. This link provides a good example: http://cravencc.edu/office-of-institutional-effectiveness/institutional-accreditation/acbsp-business-programs-accreditation/.
Status: Completed | Due Date: Not Set
QA Report
Assigned To
Howard Clampman
Institution Response
The Department routinely updates links to the ACBSP accreditation reports and correspondence on our page of the Bronx Community College public website. The following files are shown on the Business & Information Systems Department's page:
1. 2010-2012 Quality Assurance Report
2. Academic Year 2012-2013 Self-Study report
3. 2014 ACBSP Reaffirmation Letter
4. 2014-2016 Quality Assurance Report
Sources

There are no sources.
1 - Standard 1 Leadership
Organization
a. List any organizational or administrative personnel changes within the business unit since your last report.
b. List all new sites where students can earn an accredited business degree (international campus, off-campus on-campus, online) that have been added since your last report.
Status: Completed | Due Date: Not Set
QA Report
Assigned To
Howard Clampman
Institution Response
Organization
a. List any organizational or administrative personnel changes within the business unit since your last report.
In October 2014, BCC President Carole Berotte-Joseph stepped down. Dr. Berotte-Joseph was replaced by Interim President, Dr. Eduardo Marti. In June 2015, after a national search, Dr. Thomas Isekenegbe was selected to be BCC's new President. In December 2014, Dr. Rosemary Quinn, who had served as Department Chairperson since 2004, retired from BCC. Prof. Howard Clampman, previously Deputy Chairperson since 2002, was named Interim Chairperson. At the same time, Prof. Paul Jaijairam was named as Deputy Chairperson. In May 2015, Prof. Clampman was elected as Chairperson by departmental election. b. List all new sites where students can earn an accredited business degree (international campus, off-campus on-campus, online) that have been added since your last report. None
Sources
There are no sources.
2 - Standard 2 Strategic Planning
You do not have to respond to Standard #2 Strategic Planning if you do not have any notes or conditions in this standard.
Status: Completed | Due Date: Not Set
QA Report
Assigned To
Howard Clampman
Institution Response
No notes or conditions exist for this standard.
Sources
There are no sources.
3 - Standard 3 Student and Stakeholder Focus
Complete the table for Standard 3 - Student- and Stakeholder-Focused Results, found under the Evidence File tab above in the ACBSP Documents Folder. Provide three or four examples of assessment data, reporting what you consider to be the most important data. It is not necessary to provide results for every process in your QA report.
Status: Completed | Due Date: Not Set
QA Report
Assigned To
Paul Jaijairam
Institution Response
See evidence file attached.
Sources
There are no sources.
4 - Standard 4 Measurement and Analysis of Student Learning and Performance
a. Program Outcomes. List outcomes by accredited programs. Program outcomes should be used as part of a student learning assessment plan and be measurable.
AAS
AS
AS Accounting, etc.
b. Performance Results.Complete Table 2 for Standard 4 Student Learning Results found under the Evidence File in the ACBSP documents folder above.
1. Provide a minimum of three examples of assessment data, reporting what you consider to be the most important data. It is not necessary to provide results for every process.
2. You must have at least one example of results for each accredited program.
Status: Completed | Due Date: 10/1/2016
QA Report
Assigned To
Paul Jaijairam
Institution Response
a. Program Outcomes – upon completion of the degree programs listed below, students will have demonstrated a measurable ability to:
1. Accounting, A.A.S.
a. Discuss general knowledge of topics such as accounting, marketing, business ethics, forms of business entities and global business as they relate to the business environment.
b. Prepare and analyze financial statements for internal and external decision-making.
c. Demonstrate the ability to successfully engage in business research, information gathering and reporting in an individual and/or group setting.
d. Demonstrate accounting skills on an intermediate level.
e. Utilize and incorporate basic business technology to produce business documents, spreadsheets and databases.
f. Demonstrate a proficiency in performing basic mathematical calculations required in a business setting.
2. Business Administration, A.S., Accounting Option
a. Demonstrate the ability to discuss business organizations and management functions in written and oral forms.
b. Prepare and analyze financial statements for internal and external decision-making.
c. Demonstrate accounting skills on an intermediate level.
d. Utilize and incorporate basic business technology to produce business documents, spreadsheets and databases.
e. Demonstrate a proficiency in performing statistical calculations required in a business setting.
3. Business Administration, A.S., Management Option
a. Demonstrate the ability to discuss business organizations and management functions in written and oral forms.
b. Prepare and analyze financial statements for internal and external decision-making.
c. Critically analyze and discuss topics including organizational behavior, finance & international business.
d. Utilize and incorporate basic business technology to produce business documents, spreadsheets and databases.
e. Demonstrate a proficiency in performing statistical calculations required in a business setting.
4. Business Administration, A.S., Marketing Management Option
a. Demonstrate the ability to discuss business organizations and management functions in written and oral forms.
b. Prepare and analyze financial statements for internal and external decision-making.
c. Critically analyze and discuss topics including marketing ethics, the four P’s of marketing and global/domestic marketing strategies.
d. Utilize and incorporate basic business technology to produce business documents, spreadsheets and databases.
e. Demonstrate a proficiency in performing statistical calculations required in a business setting.
5. Business Administration, A.S., Computer Programming Option
a. Demonstrate the ability to discuss business organizations and management functions in written and oral forms.
b. Prepare and analyze financial statements for internal and external decision-making.
c. Prepare computer programs using current business programming languages.
d. Discuss the uses of various computer operating systems.
e. Demonstrate a proficiency in performing statistical calculations required in a business setting.
6. Computer Information Systems, A.A.S, Computer Programming Option
a. Discuss general knowledge of topics such as accounting, marketing, business ethics, forms of business entities and global business as they relate to the business environment.
b. Prepare and analyze financial statements for internal and external decision-making.
c. Prepare computer programs using current business programming languages.
d. Discuss the uses of various computer operating systems.
e. Demonstrate the ability to successfully engage in business research, information gathering and reporting in an individual and/or group setting.
f. Demonstrate a proficiency in performing basic mathematical calculations required in a business setting.
7. Computer Information Systems, A.A.S, Web Page Development Option
a. Discuss general knowledge of topics such as accounting, marketing, business ethics, forms of business entities and global business as they relate to the business environment.
b. Prepare and analyze financial statements for internal and external decision-making.
c. Prepare computer programs using current business programming languages.
d. Discuss the uses of various computer operating systems.
e. Demonstrate the ability to successfully engage in business research, information gathering and reporting in an individual and/or group setting.
f. Utilize and incorporate basic business technology to produce business documents, spreadsheets and databases.
g. Demonstrate a proficiency in performing basic mathematical calculations required in a business setting.
8. Marketing Management, A.A.S.
a. Discuss general knowledge of topics such as accounting, marketing, business ethics, forms of business entities and global business as they relate to the business environment.
b. Prepare and analyze financial statements for internal and external decision-making.
c. Demonstrate the ability to successfully engage in business research, information gathering and reporting in an individual and group setting.
d. Critically analyze and discuss topics including marketing ethics, the four P’s of marketing and global/domestic marketing strategies.
e. Utilize and incorporate basic business technology to produce business documents, spreadsheets and databases.
f. Demonstrate a proficiency in performing basic mathematical calculations required in a business setting.
9. Medical Office Assistant, A.A.S.
a. Demonstrate effective business related written and oral communication skills.
b. Demonstrate a proficiency in performing the duties required in a medical office setting.
c. Utilize and incorporate business technology to produce advanced business documents and spreadsheets and databases.
d. Demonstrate the ability to efficiently perform medical laboratory procedures.
10. Office Administration and Technology, A.A.S.
a. Discuss general knowledge of topics such as accounting, marketing, business ethics, forms of business entities and global business as they relate to the business environment.
b. Demonstrate the ability to successfully engage in business research, information gathering and reporting in an individual and group setting.
c. Demonstrate effective business related written and oral communication skills.
d. Utilize and incorporate business technology to produce basic and advanced business documents, spreadsheets and databases.
b. Performance Results: Embedded in each of the tables included at the end of Standard 4 are links from each of the course assessment measurements to each of these program outcomes. In addition, measurements of B&IS student graduation rates as compared to College-wide rates, surveys of graduates six months after graduation and the results of student perception of learning surveys are also included at the end of Standard 4. The results of these measures are included in our Quality Assurance Report and have a link on the BCC website to allow stakeholders to review the results. The successful completion of the Quality Assurance Report is shared with the Business Advisory Board. Since our program assessment measurements and analysis are in the developmental stages, analysis will be available and reported on the next Quality Assurance Report.
See evidence file attached.
Sources
There are no sources.
5 - Standard 5 Faculty and Staff Focus
a. Faculty and Staff Focus Complete Table 3a Standard 5 - Faculty- and Staff-Focused Results found under the Evidence File above. Provide three or four examples of assessment data, reporting what you consider to be the most important data. It is not necessary to provide results for every process.
b. Faculty Qualifications Complete Table 3b. Standard 5 - New Full-Time and Part-Time Faculty Qualifications found under the Evidence File above. This table is for new full-time and part-time faculty members since your last self-study or QA report. Do not include faculty members previously reported, in accordance with Criterion 5.2 in the Standards and Criteria.
Status: Completed | Due Date: Not Set
QA Report
Assigned To
Howard Clampman
Institution Response
a. Faculty and Staff Focus: See evidence file attached.
b. Faculty Qualifications: See evidence file attached.
Sources
There are no sources.
6 - Standard 6 Educational and Business Process Management
a. Curriculum
1. List any existing accredited degree programs/curricula that have been substantially revised since your last report and attach an updated Table 6 Curriculum Summary found under the Evidence File tab above.
2. List any degree programs that have changed names whether or not there are curriculum changes. This information will be used to update your list of accredited programs on the ACBSP website.
3. List any new degree programs that have been developed since your last report and attach a Table 6 Curriculum Summary found under the Evidence File tab above.
Note: If you have a new degree at a level currently accredited by ACBSP, then report information on: student enrollment, program objectives, instructional resources, facilities and equipment, admissions requirements, graduation statistics, core professional components (CPCs), and the outcomes assessment process to ACBSP. If the new degree is at a higher level than what is currently accredited, the school must complete a self-study to add the degree.
4. List any accredited programs that have been terminated since your last report.
Note: If you do not have any new or revised programs, you do not need to complete Table 6 Curriculum Summary.
5. Provide three or four examples of organizational performance results, reporting what you consider to be the most important data, using Table 7 - Standard 6 - Organizational Performance Results, found under the Evidence File tab above. It is not necessary to provide results for every process.
Status: Completed | Due Date: Not Set
QA Report
Assigned To
Howard Clampman
Institution Response
a. Curriculum: See evidence file attached.
Sources

There are no sources.
Performance Measure:
What is your
performance measure?
What is your goal?
(The goal should be
measurable.)
What is your measurement
instrument or process?
(indicate length of cycle)
Current Results:
What are your
current results?
Analysis of Results:
What did you learn
from your results?
Action Taken or
Improvement Made:
What did you improve
or what is your next
step?
Provide a graph or table of resulting
trends (3-5 data points preferred)
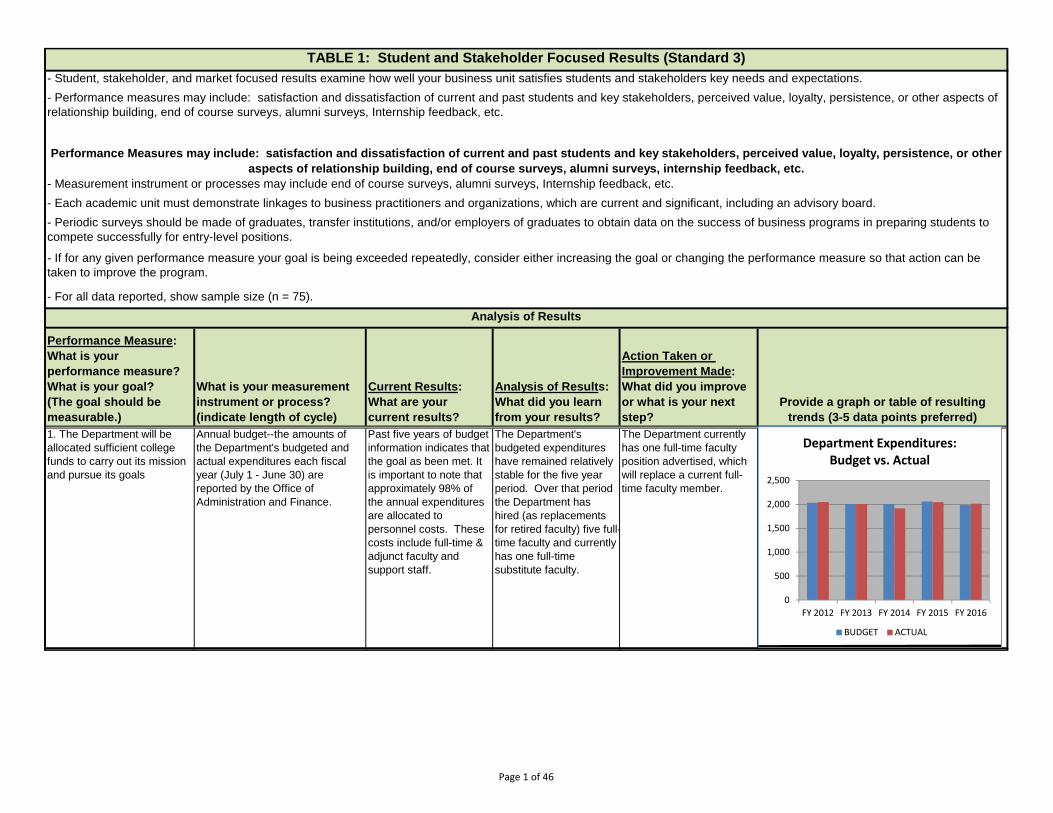
1. The Department will be
allocated sufficient college
funds to carry out its mission
and pursue its goals
Annual budget--the amounts of
the Department's budgeted and
actual expenditures each fiscal
year (July 1 - June 30) are
reported by the Office of
Administration and Finance.
Past five years of budget
information indicates that
the goal as been met. It
is important to note that
approximately 98% of
the annual expenditures
are allocated to
personnel costs. These
costs include full-time &
adjunct faculty and
support staff.
The Department's
budgeted expenditures
have remained relatively
stable for the five year
period. Over that period
the Department has
hired (as replacements
for retired faculty) five full-
time faculty and currently
has one full-time
substitute faculty.
The Department currently
has one full-time faculty
position advertised, which
will replace a current full-
time faculty member.
Performance Measures may include: satisfaction and dissatisfaction of current and past students and key stakeholders, perceived value, loyalty, persistence, or other
aspects of relationship building, end of course surveys, alumni surveys, internship feedback, etc.
TABLE 1: Student and Stakeholder Focused Results (Standard 3)
- Student, stakeholder, and market focused results examine how well your business unit satisfies students and stakeholders key needs and expectations.
- Performance measures may include: satisfaction and dissatisfaction of current and past students and key stakeholders, perceived value, loyalty, persistence, or other aspects of
relationship building, end of course surveys, alumni surveys, Internship feedback, etc.
- Measurement instrument or processes may include end of course surveys, alumni surveys, Internship feedback, etc.
Analysis of Results
- Each academic unit must demonstrate linkages to business practitioners and organizations, which are current and significant, including an advisory board.
- Periodic surveys should be made of graduates, transfer institutions, and/or employers of graduates to obtain data on the success of business programs in preparing students to
compete successfully for entry-level positions.
- If for any given performance measure your goal is being exceeded repeatedly, consider either increasing the goal or changing the performance measure so that action can be
taken to improve the program.
- For all data reported, show sample size (n = 75).
0
500
1,000
1,500
2,000
2,500
FY 2012 FY 2013 FY 2014 FY 2015 FY 2016
Department Expenditures: Budget vs. Actual
BUDGET ACTUAL
Page 1 of 46
Performance Measure:
What is your
performance measure?
What is your goal?
(The goal should be
measurable.)
What is your measurement
instrument or process?
(indicate length of cycle)
Current Results:
What are your
current results?
Analysis of Results:
What did you learn
from your results?
Action Taken or
Improvement Made:
What did you improve
or what is your next
step?
Provide a graph or table of resulting
trends (3-5 data points preferred)
Analysis of Results
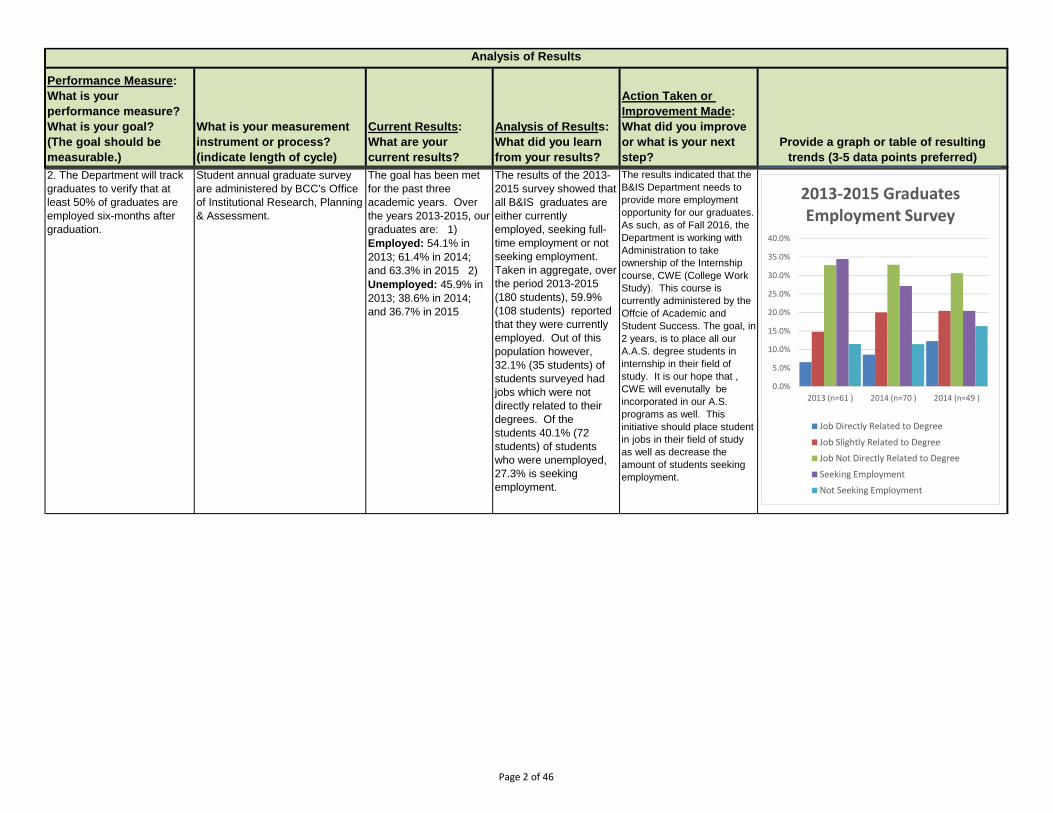
2. The Department will track
graduates to verify that at
least 50% of graduates are
employed six-months after
graduation.
Student annual graduate survey
are administered by BCC's Office
of Institutional Research, Planning
& Assessment.
The goal has been met
for the past three
academic years. Over
the years 2013-2015, our
graduates are: 1)
Employed: 54.1% in
2013; 61.4% in 2014;
and 63.3% in 2015 2)
Unemployed: 45.9% in
2013; 38.6% in 2014;
and 36.7% in 2015
The results of the 2013-
2015 survey showed that
all B&IS graduates are
either currently
employed, seeking full-
time employment or not
seeking employment.
Taken in aggregate, over
the period 2013-2015
(180 students), 59.9%
(108 students) reported
that they were currently
employed. Out of this
population however,
32.1% (35 students) of
students surveyed had
jobs which were not
directly related to their
degrees. Of the
students 40.1% (72
students) of students
who were unemployed,
27.3% is seeking
employment.
The results indicated that the
B&IS Department needs to
provide more employment
opportunity for our graduates.
As such, as of Fall 2016, the
Department is working with
Administration to take
ownership of the Internship
course, CWE (College Work
Study). This course is
currently administered by the
Offcie of Academic and
Student Success. The goal, in
2 years, is to place all our
A.A.S. degree students in
internship in their field of
study. It is our hope that ,
CWE will evenutally be
incorporated in our A.S.
programs as well. This
initiative should place student
in jobs in their field of study
as well as decrease the
amount of students seeking
employment.
0.0%
5.0%
10.0%
15.0%
20.0%
25.0%
30.0%
35.0%
40.0%
2013 (n=61 ) 2014 (n=70 ) 2014 (n=49 )
2013‐2015 Graduates Employment Survey
Job Directly Related to Degree
Job Slightly Related to Degree
Job Not Directly Related to Degree
Seeking Employment
Not Seeking Employment
Page 2 of 46
Performance Indicator
1. Student Learning
Results
Performance Measure:
For each assessment,
identify the following - 1.
Academic Program, 2.
Student Learning
Outcome, 3. Measurable
Goal
What is your
measurement instrument
or process? Do not use
grades. Indicate type of
instrument (e.g. direct,
formative, internal,
comparative)
Current Results:
What are your
current results?
Analysis of Results:
What did you learn
from your results?
Action Taken or
Improvement Made:
What did you improve
or what is your next
step?
Provide a graph or table of resulting trends (3-5
data points preferred)
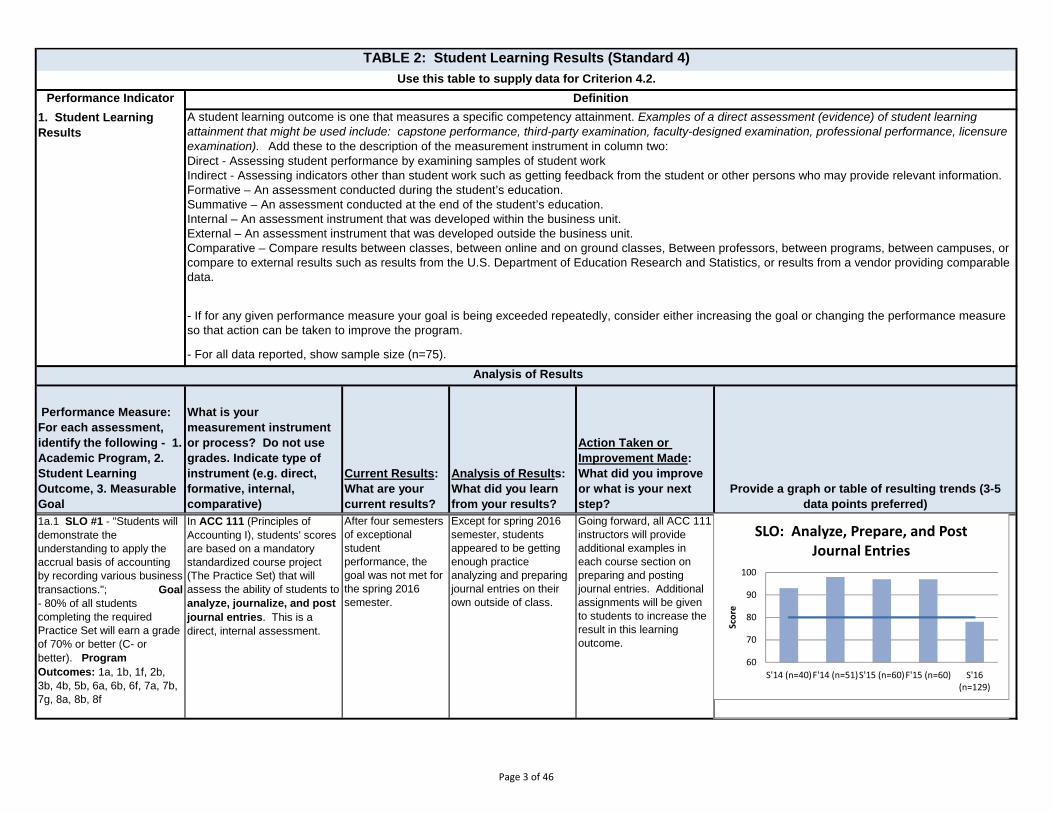
1a.1 SLO #1 - "Students will
demonstrate the
understanding to apply the
accrual basis of accounting
by recording various business
transactions."; Goal
- 80% of all students
completing the required
Practice Set will earn a grade
of 70% or better (C- or
better). Program
Outcomes: 1a, 1b, 1f, 2b,
3b, 4b, 5b, 6a, 6b, 6f, 7a, 7b,
7g, 8a, 8b, 8f
In ACC 111 (Principles of
Accounting I), students' scores
are based on a mandatory
standardized course project
(The Practice Set) that will
assess the ability of students to
analyze, journalize, and post
journal entries. This is a
direct, internal assessment.
After four semesters
of exceptional
student
performance, the
goal was not met for
the spring 2016
semester.
Except for spring 2016
semester, students
appeared to be getting
enough practice
analyzing and preparing
journal entries on their
own outside of class.
Going forward, all ACC 111
instructors will provide
additional examples in
each course section on
preparing and posting
journal entries. Additional
assignments will be given
to students to increase the
result in this learning
outcome.
TABLE 2: Student Learning Results (Standard 4)
Use this table to supply data for Criterion 4.2.
A student learning outcome is one that measures a specific competency attainment. Examples of a direct assessment (evidence) of student learning attainment that might be used include: capstone performance, third-party examination, faculty-designed examination, professional performance, licensure examination). Add these to the description of the measurement instrument in column two:
Direct - Assessing student performance by examining samples of student work
Indirect - Assessing indicators other than student work such as getting feedback from the student or other persons who may provide relevant information.
Formative – An assessment conducted during the student’s education.
Summative – An assessment conducted at the end of the student’s education.
Internal – An assessment instrument that was developed within the business unit.
External – An assessment instrument that was developed outside the business unit.
Comparative – Compare results between classes, between online and on ground classes, Between professors, between programs, between campuses, or
compare to external results such as results from the U.S. Department of Education Research and Statistics, or results from a vendor providing comparable
data.
Definition
Analysis of Results
- For all data reported, show sample size (n=75).
- If for any given performance measure your goal is being exceeded repeatedly, consider either increasing the goal or changing the performance measure
so that action can be taken to improve the program.
60
70
80
90
100
S'14 (n=40)F'14 (n=51)S'15 (n=60)F'15 (n=60) S'16(n=129)
Score
SLO: Analyze, Prepare, and Post Journal Entries
Page 3 of 46
Performance Measure:
For each assessment,
identify the following - 1.
Academic Program, 2.
Student Learning
Outcome, 3. Measurable
Goal
What is your
measurement instrument
or process? Do not use
grades. Indicate type of
instrument (e.g. direct,
formative, internal,
comparative)
Current Results:
What are your
current results?
Analysis of Results:
What did you learn
from your results?
Action Taken or
Improvement Made:
What did you improve
or what is your next
step?
Provide a graph or table of resulting trends (3-5
data points preferred)
Analysis of Results
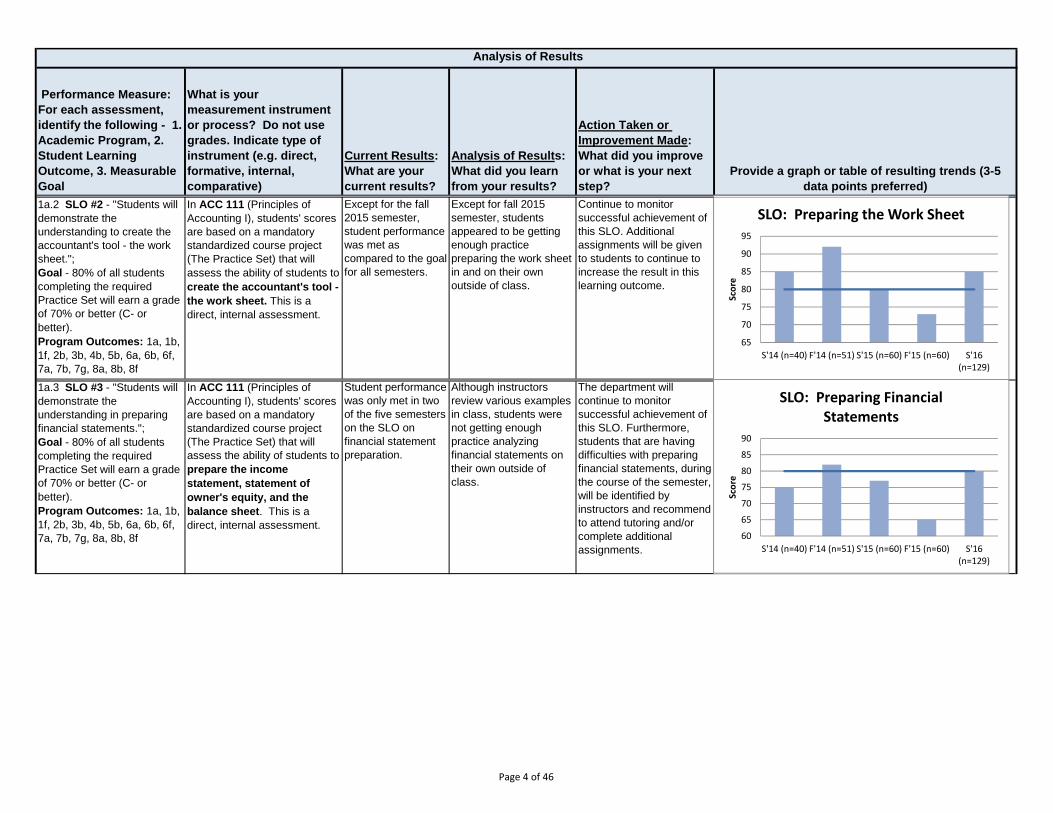
1a.2 SLO #2 - "Students will
demonstrate the
understanding to create the
accountant's tool - the work
sheet.";
Goal - 80% of all students
completing the required
Practice Set will earn a grade
of 70% or better (C- or
better).
Program Outcomes: 1a, 1b,
1f, 2b, 3b, 4b, 5b, 6a, 6b, 6f,
7a, 7b, 7g, 8a, 8b, 8f
In ACC 111 (Principles of
Accounting I), students' scores
are based on a mandatory
standardized course project
(The Practice Set) that will
assess the ability of students to
create the accountant's tool -
the work sheet. This is a
direct, internal assessment.
Except for the fall
2015 semester,
student performance
was met as
compared to the goal
for all semesters.
Except for fall 2015
semester, students
appeared to be getting
enough practice
preparing the work sheet
in and on their own
outside of class.
Continue to monitor
successful achievement of
this SLO. Additional
assignments will be given
to students to continue to
increase the result in this
learning outcome.
1a.3 SLO #3 - "Students will
demonstrate the
understanding in preparing
financial statements.";
Goal - 80% of all students
completing the required
Practice Set will earn a grade
of 70% or better (C- or
better).
Program Outcomes: 1a, 1b,
1f, 2b, 3b, 4b, 5b, 6a, 6b, 6f,
7a, 7b, 7g, 8a, 8b, 8f
In ACC 111 (Principles of
Accounting I), students' scores
are based on a mandatory
standardized course project
(The Practice Set) that will
assess the ability of students to
prepare the income
statement, statement of
owner's equity, and the
balance sheet. This is a
direct, internal assessment.
Student performance
was only met in two
of the five semesters
on the SLO on
financial statement
preparation.
Although instructors
review various examples
in class, students were
not getting enough
practice analyzing
financial statements on
their own outside of
class.
The department will
continue to monitor
successful achievement of
this SLO. Furthermore,
students that are having
difficulties with preparing
financial statements, during
the course of the semester,
will be identified by
instructors and recommend
to attend tutoring and/or
complete additional
assignments.
65
70
75
80
85
90
95
S'14 (n=40) F'14 (n=51) S'15 (n=60) F'15 (n=60) S'16(n=129)
Score
SLO: Preparing the Work Sheet
60
65
70
75
80
85
90
S'14 (n=40) F'14 (n=51) S'15 (n=60) F'15 (n=60) S'16(n=129)
Score
SLO: Preparing Financial Statements
Page 4 of 46
Performance Measure:
For each assessment,
identify the following - 1.
Academic Program, 2.
Student Learning
Outcome, 3. Measurable
Goal
What is your
measurement instrument
or process? Do not use
grades. Indicate type of
instrument (e.g. direct,
formative, internal,
comparative)
Current Results:
What are your
current results?
Analysis of Results:
What did you learn
from your results?
Action Taken or
Improvement Made:
What did you improve
or what is your next
step?
Provide a graph or table of resulting trends (3-5
data points preferred)
Analysis of Results
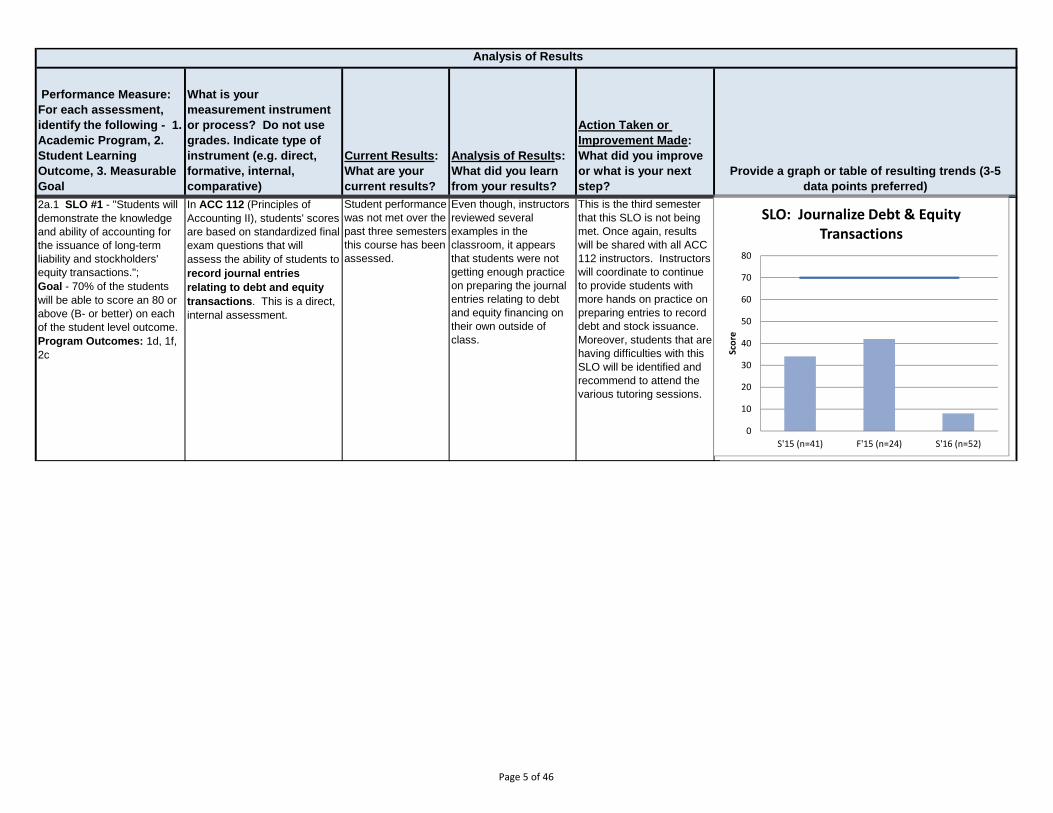
2a.1 SLO #1 - "Students will
demonstrate the knowledge
and ability of accounting for
the issuance of long-term
liability and stockholders'
equity transactions.";
Goal - 70% of the students
will be able to score an 80 or
above (B- or better) on each
of the student level outcome.
Program Outcomes: 1d, 1f,
2c
In ACC 112 (Principles of
Accounting II), students' scores
are based on standardized final
exam questions that will
assess the ability of students to
record journal entries
relating to debt and equity
transactions. This is a direct,
internal assessment.
Student performance
was not met over the
past three semesters
this course has been
assessed.
Even though, instructors
reviewed several
examples in the
classroom, it appears
that students were not
getting enough practice
on preparing the journal
entries relating to debt
and equity financing on
their own outside of
class.
This is the third semester
that this SLO is not being
met. Once again, results
will be shared with all ACC
112 instructors. Instructors
will coordinate to continue
to provide students with
more hands on practice on
preparing entries to record
debt and stock issuance.
Moreover, students that are
having difficulties with this
SLO will be identified and
recommend to attend the
various tutoring sessions.
0
10
20
30
40
50
60
70
80
S'15 (n=41) F'15 (n=24) S'16 (n=52)
Score
SLO: Journalize Debt & Equity Transactions
Page 5 of 46
Performance Measure:
For each assessment,
identify the following - 1.
Academic Program, 2.
Student Learning
Outcome, 3. Measurable
Goal
What is your
measurement instrument
or process? Do not use
grades. Indicate type of
instrument (e.g. direct,
formative, internal,
comparative)
Current Results:
What are your
current results?
Analysis of Results:
What did you learn
from your results?
Action Taken or
Improvement Made:
What did you improve
or what is your next
step?
Provide a graph or table of resulting trends (3-5
data points preferred)
Analysis of Results
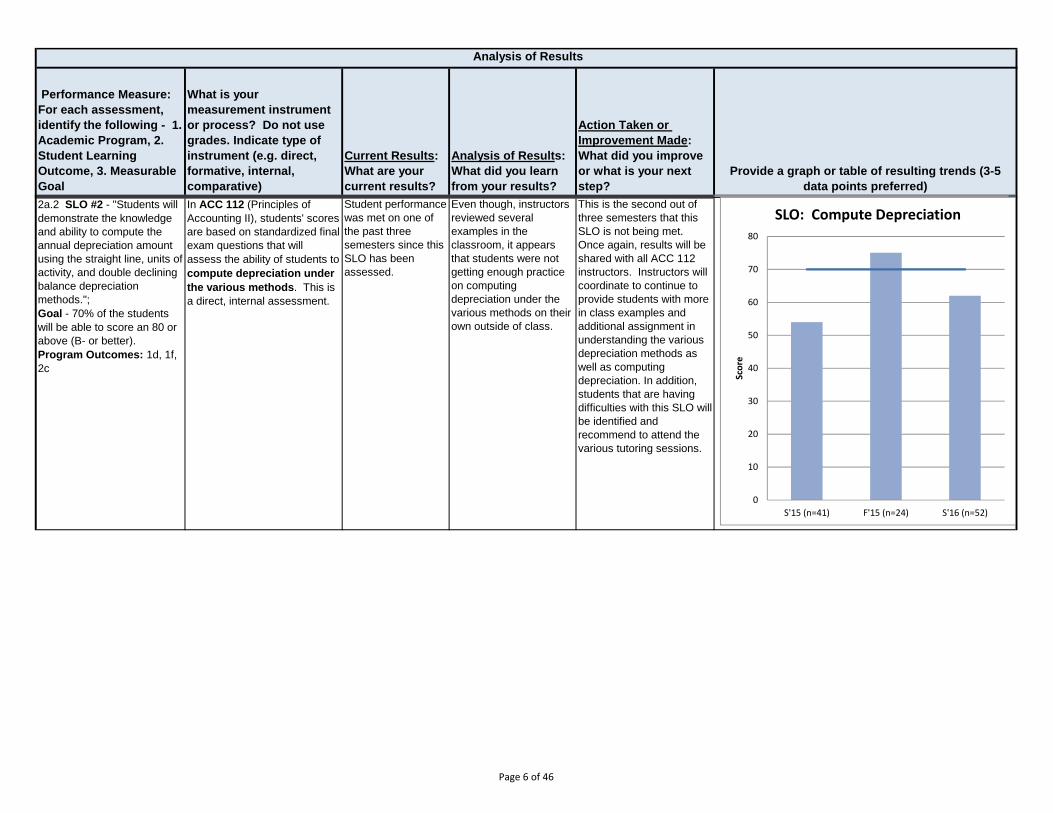
2a.2 SLO #2 - "Students will
demonstrate the knowledge
and ability to compute the
annual depreciation amount
using the straight line, units of
activity, and double declining
balance depreciation
methods.";
Goal - 70% of the students
will be able to score an 80 or
above (B- or better).
Program Outcomes: 1d, 1f,
2c
In ACC 112 (Principles of
Accounting II), students' scores
are based on standardized final
exam questions that will
assess the ability of students to
compute depreciation under
the various methods. This is
a direct, internal assessment.
Student performance
was met on one of
the past three
semesters since this
SLO has been
assessed.
Even though, instructors
reviewed several
examples in the
classroom, it appears
that students were not
getting enough practice
on computing
depreciation under the
various methods on their
own outside of class.
This is the second out of
three semesters that this
SLO is not being met.
Once again, results will be
shared with all ACC 112
instructors. Instructors will
coordinate to continue to
provide students with more
in class examples and
additional assignment in
understanding the various
depreciation methods as
well as computing
depreciation. In addition,
students that are having
difficulties with this SLO will
be identified and
recommend to attend the
various tutoring sessions.
0
10
20
30
40
50
60
70
80
S'15 (n=41) F'15 (n=24) S'16 (n=52)
Score
SLO: Compute Depreciation
Page 6 of 46
Performance Measure:
For each assessment,
identify the following - 1.
Academic Program, 2.
Student Learning
Outcome, 3. Measurable
Goal
What is your
measurement instrument
or process? Do not use
grades. Indicate type of
instrument (e.g. direct,
formative, internal,
comparative)
Current Results:
What are your
current results?
Analysis of Results:
What did you learn
from your results?
Action Taken or
Improvement Made:
What did you improve
or what is your next
step?
Provide a graph or table of resulting trends (3-5
data points preferred)
Analysis of Results
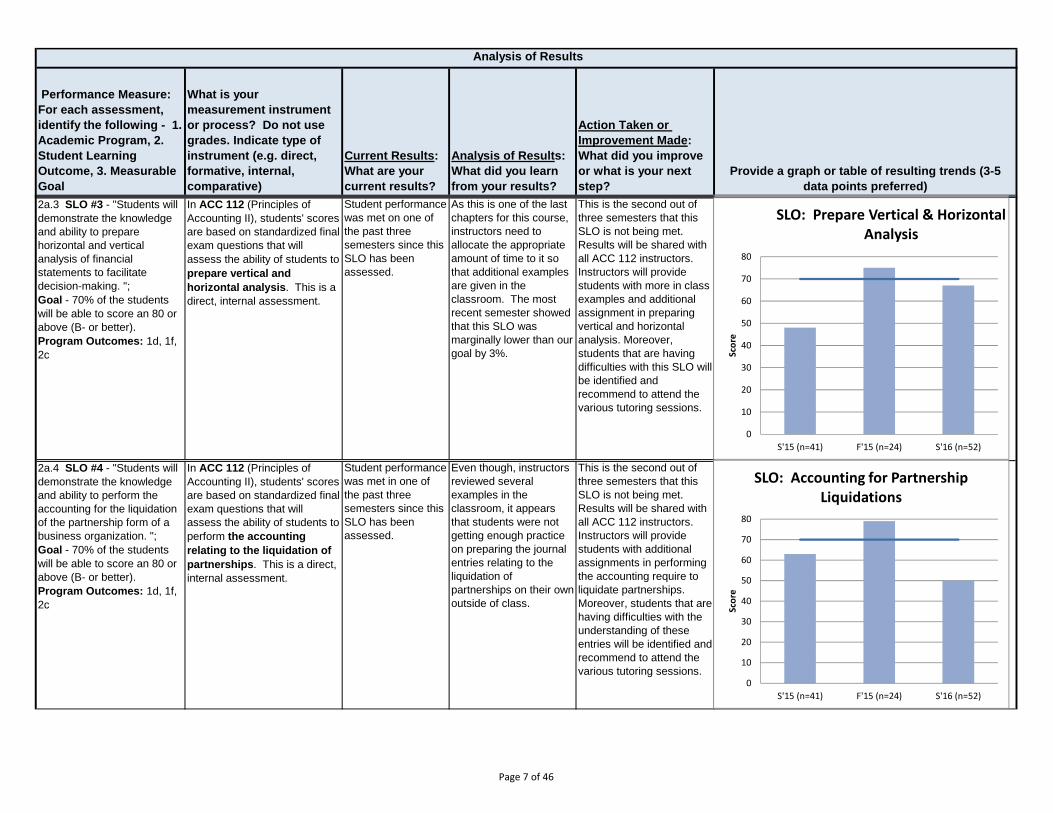
2a.3 SLO #3 - "Students will
demonstrate the knowledge
and ability to prepare
horizontal and vertical
analysis of financial
statements to facilitate
decision-making. ";
Goal - 70% of the students
will be able to score an 80 or
above (B- or better).
Program Outcomes: 1d, 1f,
2c
In ACC 112 (Principles of
Accounting II), students' scores
are based on standardized final
exam questions that will
assess the ability of students to
prepare vertical and
horizontal analysis. This is a
direct, internal assessment.
Student performance
was met on one of
the past three
semesters since this
SLO has been
assessed.
As this is one of the last
chapters for this course,
instructors need to
allocate the appropriate
amount of time to it so
that additional examples
are given in the
classroom. The most
recent semester showed
that this SLO was
marginally lower than our
goal by 3%.
This is the second out of
three semesters that this
SLO is not being met.
Results will be shared with
all ACC 112 instructors.
Instructors will provide
students with more in class
examples and additional
assignment in preparing
vertical and horizontal
analysis. Moreover,
students that are having
difficulties with this SLO will
be identified and
recommend to attend the
various tutoring sessions.
2a.4 SLO #4 - "Students will
demonstrate the knowledge
and ability to perform the
accounting for the liquidation
of the partnership form of a
business organization. ";
Goal - 70% of the students
will be able to score an 80 or
above (B- or better).
Program Outcomes: 1d, 1f,
2c
In ACC 112 (Principles of
Accounting II), students' scores
are based on standardized final
exam questions that will
assess the ability of students to
perform the accounting
relating to the liquidation of
partnerships. This is a direct,
internal assessment.
Student performance
was met in one of
the past three
semesters since this
SLO has been
assessed.
Even though, instructors
reviewed several
examples in the
classroom, it appears
that students were not
getting enough practice
on preparing the journal
entries relating to the
liquidation of
partnerships on their own
outside of class.
This is the second out of
three semesters that this
SLO is not being met.
Results will be shared with
all ACC 112 instructors.
Instructors will provide
students with additional
assignments in performing
the accounting require to
liquidate partnerships.
Moreover, students that are
having difficulties with the
understanding of these
entries will be identified and
recommend to attend the
various tutoring sessions.
0
10
20
30
40
50
60
70
80
S'15 (n=41) F'15 (n=24) S'16 (n=52)
Score
SLO: Prepare Vertical & Horizontal Analysis
0
10
20
30
40
50
60
70
80
S'15 (n=41) F'15 (n=24) S'16 (n=52)
Score
SLO: Accounting for Partnership Liquidations
Page 7 of 46
Performance Measure:
For each assessment,
identify the following - 1.
Academic Program, 2.
Student Learning
Outcome, 3. Measurable
Goal
What is your
measurement instrument
or process? Do not use
grades. Indicate type of
instrument (e.g. direct,
formative, internal,
comparative)
Current Results:
What are your
current results?
Analysis of Results:
What did you learn
from your results?
Action Taken or
Improvement Made:
What did you improve
or what is your next
step?
Provide a graph or table of resulting trends (3-5
data points preferred)
Analysis of Results
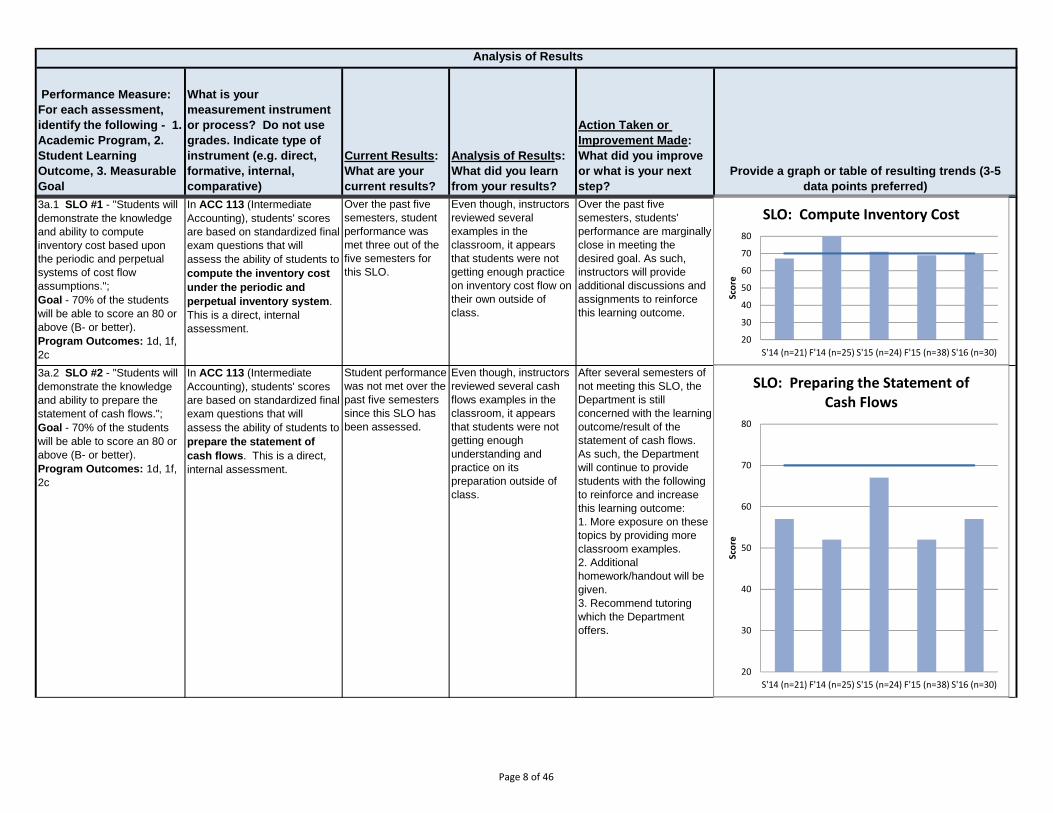
3a.1 SLO #1 - "Students will
demonstrate the knowledge
and ability to compute
inventory cost based upon
the periodic and perpetual
systems of cost flow
assumptions.";
Goal - 70% of the students
will be able to score an 80 or
above (B- or better).
Program Outcomes: 1d, 1f,
2c
In ACC 113 (Intermediate
Accounting), students' scores
are based on standardized final
exam questions that will
assess the ability of students to
compute the inventory cost
under the periodic and
perpetual inventory system.
This is a direct, internal
assessment.
Over the past five
semesters, student
performance was
met three out of the
five semesters for
this SLO.
Even though, instructors
reviewed several
examples in the
classroom, it appears
that students were not
getting enough practice
on inventory cost flow on
their own outside of
class.
Over the past five
semesters, students'
performance are marginally
close in meeting the
desired goal. As such,
instructors will provide
additional discussions and
assignments to reinforce
this learning outcome.
3a.2 SLO #2 - "Students will
demonstrate the knowledge
and ability to prepare the
statement of cash flows.";
Goal - 70% of the students
will be able to score an 80 or
above (B- or better).
Program Outcomes: 1d, 1f,
2c
In ACC 113 (Intermediate
Accounting), students' scores
are based on standardized final
exam questions that will
assess the ability of students to
prepare the statement of
cash flows. This is a direct,
internal assessment.
Student performance
was not met over the
past five semesters
since this SLO has
been assessed.
Even though, instructors
reviewed several cash
flows examples in the
classroom, it appears
that students were not
getting enough
understanding and
practice on its
preparation outside of
class.
After several semesters of
not meeting this SLO, the
Department is still
concerned with the learning
outcome/result of the
statement of cash flows.
As such, the Department
will continue to provide
students with the following
to reinforce and increase
this learning outcome:
1. More exposure on these
topics by providing more
classroom examples.
2. Additional
homework/handout will be
given.
3. Recommend tutoring
which the Department
offers.
20
30
40
50
60
70
80
S'14 (n=21) F'14 (n=25) S'15 (n=24) F'15 (n=38) S'16 (n=30)
Score
SLO: Compute Inventory Cost
20
30
40
50
60
70
80
S'14 (n=21) F'14 (n=25) S'15 (n=24) F'15 (n=38) S'16 (n=30)
Score
SLO: Preparing the Statement of Cash Flows
Page 8 of 46
Performance Measure:
For each assessment,
identify the following - 1.
Academic Program, 2.
Student Learning
Outcome, 3. Measurable
Goal
What is your
measurement instrument
or process? Do not use
grades. Indicate type of
instrument (e.g. direct,
formative, internal,
comparative)
Current Results:
What are your
current results?
Analysis of Results:
What did you learn
from your results?
Action Taken or
Improvement Made:
What did you improve
or what is your next
step?
Provide a graph or table of resulting trends (3-5
data points preferred)
Analysis of Results
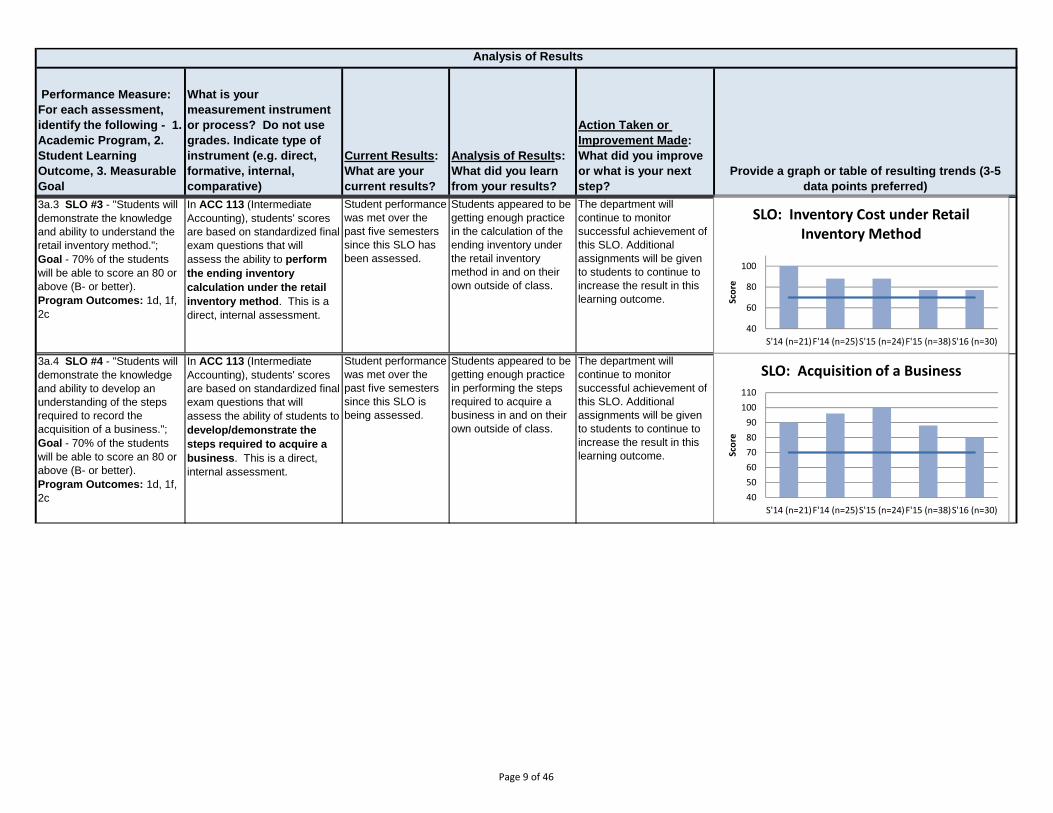
3a.3 SLO #3 - "Students will
demonstrate the knowledge
and ability to understand the
retail inventory method.";
Goal - 70% of the students
will be able to score an 80 or
above (B- or better).
Program Outcomes: 1d, 1f,
2c
In ACC 113 (Intermediate
Accounting), students' scores
are based on standardized final
exam questions that will
assess the ability to perform
the ending inventory
calculation under the retail
inventory method. This is a
direct, internal assessment.
Student performance
was met over the
past five semesters
since this SLO has
been assessed.
Students appeared to be
getting enough practice
in the calculation of the
ending inventory under
the retail inventory
method in and on their
own outside of class.
The department will
continue to monitor
successful achievement of
this SLO. Additional
assignments will be given
to students to continue to
increase the result in this
learning outcome.
3a.4 SLO #4 - "Students will
demonstrate the knowledge
and ability to develop an
understanding of the steps
required to record the
acquisition of a business.";
Goal - 70% of the students
will be able to score an 80 or
above (B- or better).
Program Outcomes: 1d, 1f,
2c
In ACC 113 (Intermediate
Accounting), students' scores
are based on standardized final
exam questions that will
assess the ability of students to
develop/demonstrate the
steps required to acquire a
business. This is a direct,
internal assessment.
Student performance
was met over the
past five semesters
since this SLO is
being assessed.
Students appeared to be
getting enough practice
in performing the steps
required to acquire a
business in and on their
own outside of class.
The department will
continue to monitor
successful achievement of
this SLO. Additional
assignments will be given
to students to continue to
increase the result in this
learning outcome.
40
60
80
100
S'14 (n=21)F'14 (n=25)S'15 (n=24)F'15 (n=38)S'16 (n=30)
Score
SLO: Inventory Cost under Retail Inventory Method
405060708090
100110
S'14 (n=21)F'14 (n=25)S'15 (n=24)F'15 (n=38)S'16 (n=30)
Score
SLO: Acquisition of a Business
Page 9 of 46
Performance Measure:
For each assessment,
identify the following - 1.
Academic Program, 2.
Student Learning
Outcome, 3. Measurable
Goal
What is your
measurement instrument
or process? Do not use
grades. Indicate type of
instrument (e.g. direct,
formative, internal,
comparative)
Current Results:
What are your
current results?
Analysis of Results:
What did you learn
from your results?
Action Taken or
Improvement Made:
What did you improve
or what is your next
step?
Provide a graph or table of resulting trends (3-5
data points preferred)
Analysis of Results
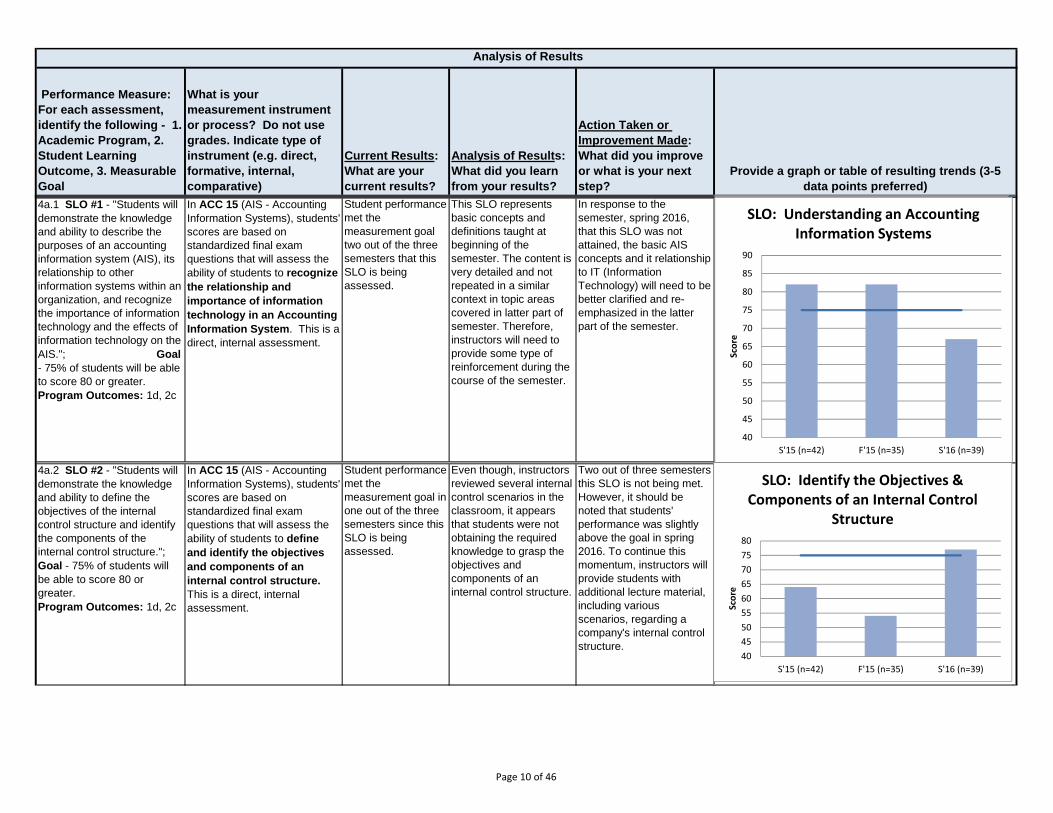
4a.1 SLO #1 - "Students will
demonstrate the knowledge
and ability to describe the
purposes of an accounting
information system (AIS), its
relationship to other
information systems within an
organization, and recognize
the importance of information
technology and the effects of
information technology on the
AIS."; Goal
- 75% of students will be able
to score 80 or greater.
Program Outcomes: 1d, 2c
In ACC 15 (AIS - Accounting
Information Systems), students'
scores are based on
standardized final exam
questions that will assess the
ability of students to recognize
the relationship and
importance of information
technology in an Accounting
Information System. This is a
direct, internal assessment.
Student performance
met the
measurement goal
two out of the three
semesters that this
SLO is being
assessed.
This SLO represents
basic concepts and
definitions taught at
beginning of the
semester. The content is
very detailed and not
repeated in a similar
context in topic areas
covered in latter part of
semester. Therefore,
instructors will need to
provide some type of
reinforcement during the
course of the semester.
In response to the
semester, spring 2016,
that this SLO was not
attained, the basic AIS
concepts and it relationship
to IT (Information
Technology) will need to be
better clarified and re-
emphasized in the latter
part of the semester.
4a.2 SLO #2 - "Students will
demonstrate the knowledge
and ability to define the
objectives of the internal
control structure and identify
the components of the
internal control structure.";
Goal - 75% of students will
be able to score 80 or
greater.
Program Outcomes: 1d, 2c
In ACC 15 (AIS - Accounting
Information Systems), students'
scores are based on
standardized final exam
questions that will assess the
ability of students to define
and identify the objectives
and components of an
internal control structure.
This is a direct, internal
assessment.
Student performance
met the
measurement goal in
one out of the three
semesters since this
SLO is being
assessed.
Even though, instructors
reviewed several internal
control scenarios in the
classroom, it appears
that students were not
obtaining the required
knowledge to grasp the
objectives and
components of an
internal control structure.
Two out of three semesters
this SLO is not being met.
However, it should be
noted that students'
performance was slightly
above the goal in spring
2016. To continue this
momentum, instructors will
provide students with
additional lecture material,
including various
scenarios, regarding a
company's internal control
structure.
40
45
50
55
60
65
70
75
80
85
90
S'15 (n=42) F'15 (n=35) S'16 (n=39)
Score
SLO: Understanding an Accounting Information Systems
404550556065707580
S'15 (n=42) F'15 (n=35) S'16 (n=39)
Score
SLO: Identify the Objectives & Components of an Internal Control
Structure
Page 10 of 46
Performance Measure:
For each assessment,
identify the following - 1.
Academic Program, 2.
Student Learning
Outcome, 3. Measurable
Goal
What is your
measurement instrument
or process? Do not use
grades. Indicate type of
instrument (e.g. direct,
formative, internal,
comparative)
Current Results:
What are your
current results?
Analysis of Results:
What did you learn
from your results?
Action Taken or
Improvement Made:
What did you improve
or what is your next
step?
Provide a graph or table of resulting trends (3-5
data points preferred)
Analysis of Results
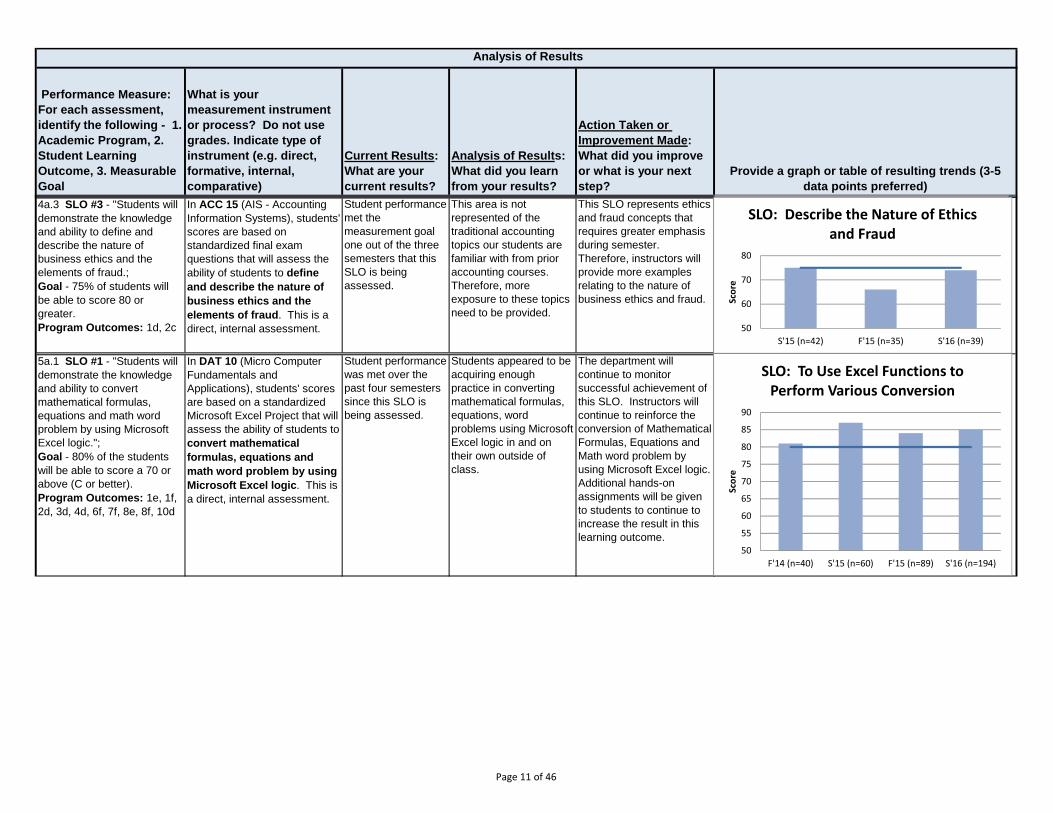
4a.3 SLO #3 - "Students will
demonstrate the knowledge
and ability to define and
describe the nature of
business ethics and the
elements of fraud.;
Goal - 75% of students will
be able to score 80 or
greater.
Program Outcomes: 1d, 2c
In ACC 15 (AIS - Accounting
Information Systems), students'
scores are based on
standardized final exam
questions that will assess the
ability of students to define
and describe the nature of
business ethics and the
elements of fraud. This is a
direct, internal assessment.
Student performance
met the
measurement goal
one out of the three
semesters that this
SLO is being
assessed.
This area is not
represented of the
traditional accounting
topics our students are
familiar with from prior
accounting courses.
Therefore, more
exposure to these topics
need to be provided.
This SLO represents ethics
and fraud concepts that
requires greater emphasis
during semester.
Therefore, instructors will
provide more examples
relating to the nature of
business ethics and fraud.
5a.1 SLO #1 - "Students will
demonstrate the knowledge
and ability to convert
mathematical formulas,
equations and math word
problem by using Microsoft
Excel logic.";
Goal - 80% of the students
will be able to score a 70 or
above (C or better).
Program Outcomes: 1e, 1f,
2d, 3d, 4d, 6f, 7f, 8e, 8f, 10d
In DAT 10 (Micro Computer
Fundamentals and
Applications), students' scores
are based on a standardized
Microsoft Excel Project that will
assess the ability of students to
convert mathematical
formulas, equations and
math word problem by using
Microsoft Excel logic. This is
a direct, internal assessment.
Student performance
was met over the
past four semesters
since this SLO is
being assessed.
Students appeared to be
acquiring enough
practice in converting
mathematical formulas,
equations, word
problems using Microsoft
Excel logic in and on
their own outside of
class.
The department will
continue to monitor
successful achievement of
this SLO. Instructors will
continue to reinforce the
conversion of Mathematical
Formulas, Equations and
Math word problem by
using Microsoft Excel logic.
Additional hands-on
assignments will be given
to students to continue to
increase the result in this
learning outcome.
50
60
70
80
S'15 (n=42) F'15 (n=35) S'16 (n=39)
Score
SLO: Describe the Nature of Ethics and Fraud
50
55
60
65
70
75
80
85
90
F'14 (n=40) S'15 (n=60) F'15 (n=89) S'16 (n=194)
Score
SLO: To Use Excel Functions to Perform Various Conversion
Page 11 of 46
Performance Measure:
For each assessment,
identify the following - 1.
Academic Program, 2.
Student Learning
Outcome, 3. Measurable
Goal
What is your
measurement instrument
or process? Do not use
grades. Indicate type of
instrument (e.g. direct,
formative, internal,
comparative)
Current Results:
What are your
current results?
Analysis of Results:
What did you learn
from your results?
Action Taken or
Improvement Made:
What did you improve
or what is your next
step?
Provide a graph or table of resulting trends (3-5
data points preferred)
Analysis of Results
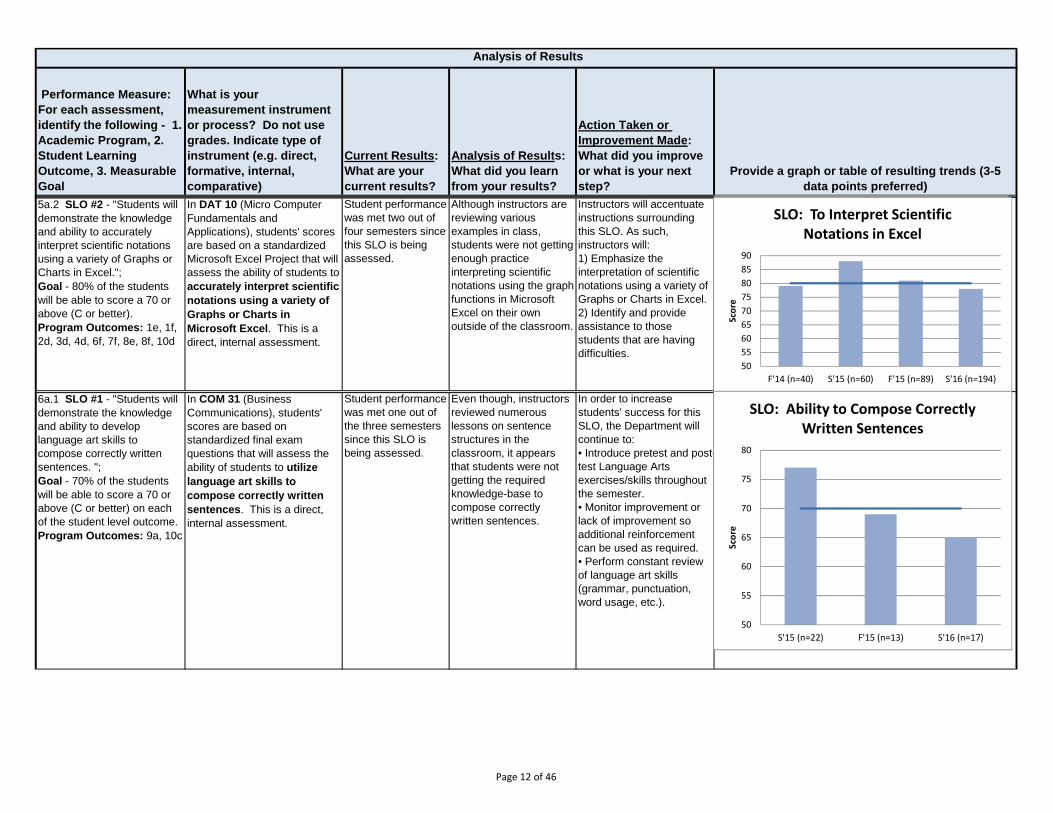
5a.2 SLO #2 - "Students will
demonstrate the knowledge
and ability to accurately
interpret scientific notations
using a variety of Graphs or
Charts in Excel.";
Goal - 80% of the students
will be able to score a 70 or
above (C or better).
Program Outcomes: 1e, 1f,
2d, 3d, 4d, 6f, 7f, 8e, 8f, 10d
In DAT 10 (Micro Computer
Fundamentals and
Applications), students' scores
are based on a standardized
Microsoft Excel Project that will
assess the ability of students to
accurately interpret scientific
notations using a variety of
Graphs or Charts in
Microsoft Excel. This is a
direct, internal assessment.
Student performance
was met two out of
four semesters since
this SLO is being
assessed.
Although instructors are
reviewing various
examples in class,
students were not getting
enough practice
interpreting scientific
notations using the graph
functions in Microsoft
Excel on their own
outside of the classroom.
Instructors will accentuate
instructions surrounding
this SLO. As such,
instructors will:
1) Emphasize the
interpretation of scientific
notations using a variety of
Graphs or Charts in Excel.
2) Identify and provide
assistance to those
students that are having
difficulties.
6a.1 SLO #1 - "Students will
demonstrate the knowledge
and ability to develop
language art skills to
compose correctly written
sentences. ";
Goal - 70% of the students
will be able to score a 70 or
above (C or better) on each
of the student level outcome.
Program Outcomes: 9a, 10c
In COM 31 (Business
Communications), students'
scores are based on
standardized final exam
questions that will assess the
ability of students to utilize
language art skills to
compose correctly written
sentences. This is a direct,
internal assessment.
Student performance
was met one out of
the three semesters
since this SLO is
being assessed.
Even though, instructors
reviewed numerous
lessons on sentence
structures in the
classroom, it appears
that students were not
getting the required
knowledge-base to
compose correctly
written sentences.
In order to increase
students' success for this
SLO, the Department will
continue to:
• Introduce pretest and post-
test Language Arts
exercises/skills throughout
the semester.
• Monitor improvement or
lack of improvement so
additional reinforcement
can be used as required.
• Perform constant review
of language art skills
(grammar, punctuation,
word usage, etc.).
505560657075808590
F'14 (n=40) S'15 (n=60) F'15 (n=89) S'16 (n=194)
Score
SLO: To Interpret Scientific Notations in Excel
50
55
60
65
70
75
80
S'15 (n=22) F'15 (n=13) S'16 (n=17)
Score
SLO: Ability to Compose Correctly Written Sentences
Page 12 of 46
Performance Measure:
For each assessment,
identify the following - 1.
Academic Program, 2.
Student Learning
Outcome, 3. Measurable
Goal
What is your
measurement instrument
or process? Do not use
grades. Indicate type of
instrument (e.g. direct,
formative, internal,
comparative)
Current Results:
What are your
current results?
Analysis of Results:
What did you learn
from your results?
Action Taken or
Improvement Made:
What did you improve
or what is your next
step?
Provide a graph or table of resulting trends (3-5
data points preferred)
Analysis of Results
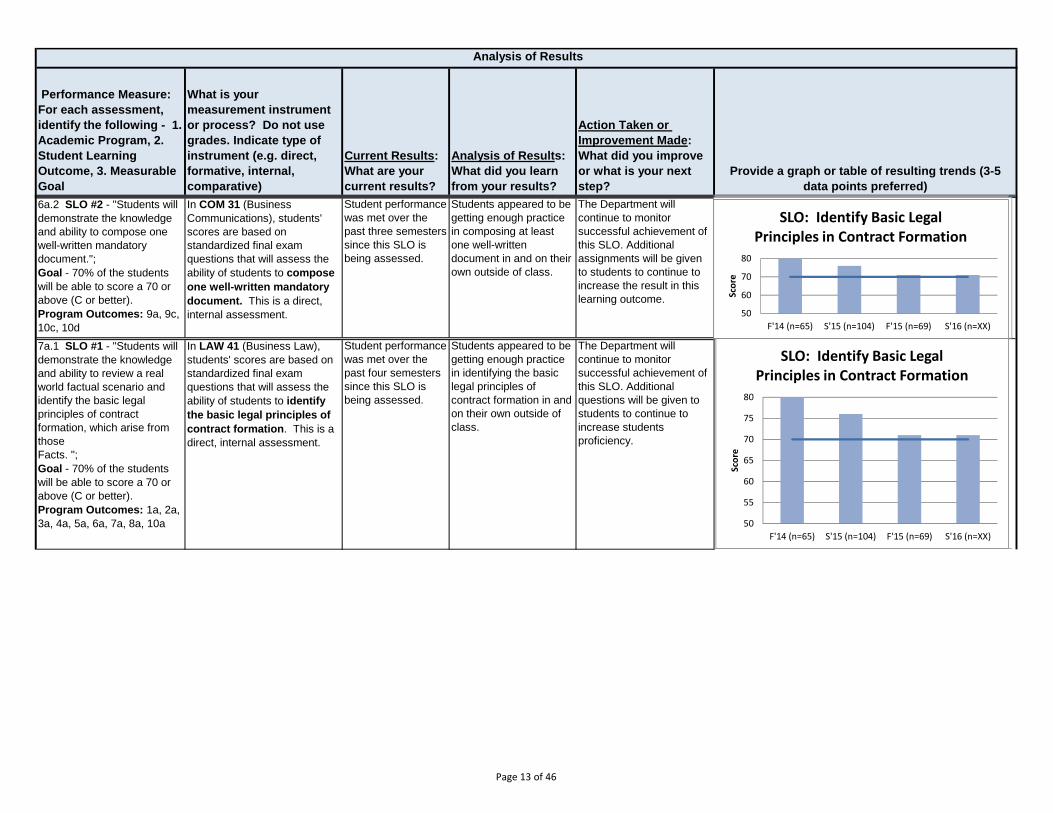
6a.2 SLO #2 - "Students will
demonstrate the knowledge
and ability to compose one
well-written mandatory
document.";
Goal - 70% of the students
will be able to score a 70 or
above (C or better).
Program Outcomes: 9a, 9c,
10c, 10d
In COM 31 (Business
Communications), students'
scores are based on
standardized final exam
questions that will assess the
ability of students to compose
one well-written mandatory
document. This is a direct,
internal assessment.
Student performance
was met over the
past three semesters
since this SLO is
being assessed.
Students appeared to be
getting enough practice
in composing at least
one well-written
document in and on their
own outside of class.
The Department will
continue to monitor
successful achievement of
this SLO. Additional
assignments will be given
to students to continue to
increase the result in this
learning outcome.
7a.1 SLO #1 - "Students will
demonstrate the knowledge
and ability to review a real
world factual scenario and
identify the basic legal
principles of contract
formation, which arise from
those
Facts. ";
Goal - 70% of the students
will be able to score a 70 or
above (C or better).
Program Outcomes: 1a, 2a,
3a, 4a, 5a, 6a, 7a, 8a, 10a
In LAW 41 (Business Law),
students' scores are based on
standardized final exam
questions that will assess the
ability of students to identify
the basic legal principles of
contract formation. This is a
direct, internal assessment.
Student performance
was met over the
past four semesters
since this SLO is
being assessed.
Students appeared to be
getting enough practice
in identifying the basic
legal principles of
contract formation in and
on their own outside of
class.
The Department will
continue to monitor
successful achievement of
this SLO. Additional
questions will be given to
students to continue to
increase students
proficiency.
50
60
70
80
S'15 (n=22) F'15 (n=13) S'16 (n=17)
Score
SLO: Ability to Compose Correctly Written Sentences
50
55
60
65
70
75
80
F'14 (n=65) S'15 (n=104) F'15 (n=69) S'16 (n=XX)
Score
SLO: Identify Basic Legal Principles in Contract Formation
50
60
70
80
F'14 (n=65) S'15 (n=104) F'15 (n=69) S'16 (n=XX)
Score
SLO: Identify Basic Legal Principles in Contract Formation
Page 13 of 46
Performance Measure:
For each assessment,
identify the following - 1.
Academic Program, 2.
Student Learning
Outcome, 3. Measurable
Goal
What is your
measurement instrument
or process? Do not use
grades. Indicate type of
instrument (e.g. direct,
formative, internal,
comparative)
Current Results:
What are your
current results?
Analysis of Results:
What did you learn
from your results?
Action Taken or
Improvement Made:
What did you improve
or what is your next
step?
Provide a graph or table of resulting trends (3-5
data points preferred)
Analysis of Results
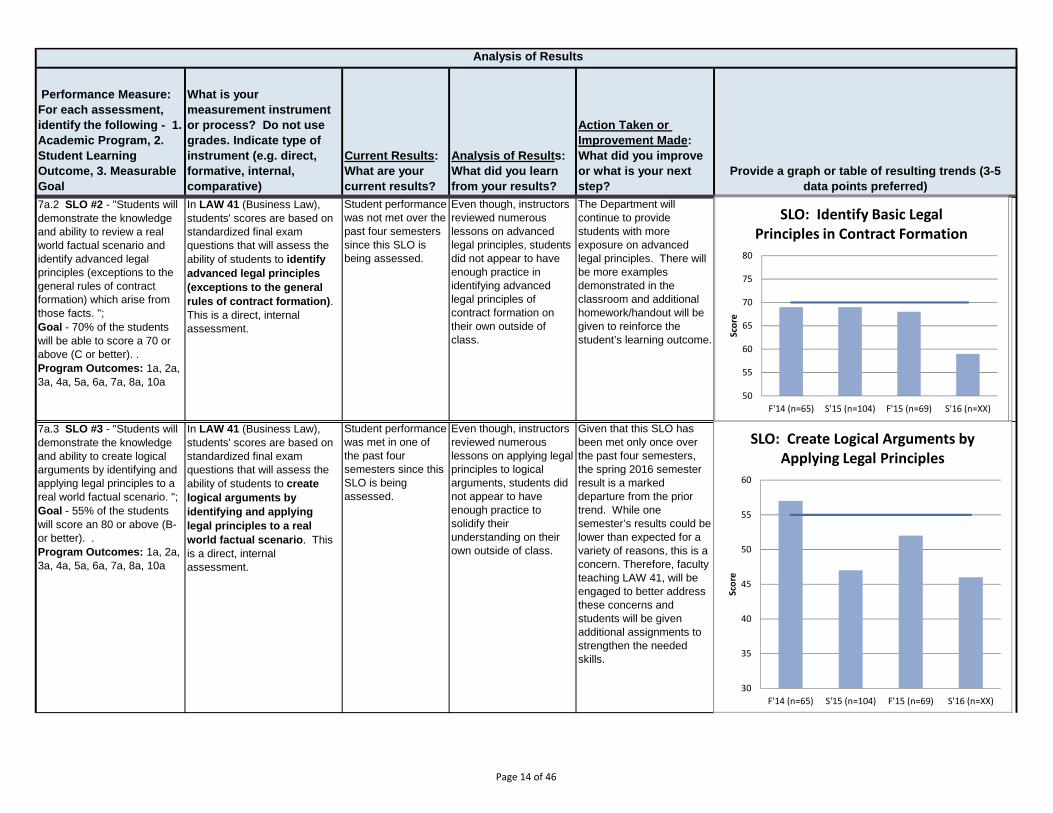
7a.2 SLO #2 - "Students will
demonstrate the knowledge
and ability to review a real
world factual scenario and
identify advanced legal
principles (exceptions to the
general rules of contract
formation) which arise from
those facts. ";
Goal - 70% of the students
will be able to score a 70 or
above (C or better). .
Program Outcomes: 1a, 2a,
3a, 4a, 5a, 6a, 7a, 8a, 10a
In LAW 41 (Business Law),
students' scores are based on
standardized final exam
questions that will assess the
ability of students to identify
advanced legal principles
(exceptions to the general
rules of contract formation).
This is a direct, internal
assessment.
Student performance
was not met over the
past four semesters
since this SLO is
being assessed.
Even though, instructors
reviewed numerous
lessons on advanced
legal principles, students
did not appear to have
enough practice in
identifying advanced
legal principles of
contract formation on
their own outside of
class.
The Department will
continue to provide
students with more
exposure on advanced
legal principles. There will
be more examples
demonstrated in the
classroom and additional
homework/handout will be
given to reinforce the
student’s learning outcome.
7a.3 SLO #3 - "Students will
demonstrate the knowledge
and ability to create logical
arguments by identifying and
applying legal principles to a
real world factual scenario. ";
Goal - 55% of the students
will score an 80 or above (B-
or better). .
Program Outcomes: 1a, 2a,
3a, 4a, 5a, 6a, 7a, 8a, 10a
In LAW 41 (Business Law),
students' scores are based on
standardized final exam
questions that will assess the
ability of students to create
logical arguments by
identifying and applying
legal principles to a real
world factual scenario. This
is a direct, internal
assessment.
Student performance
was met in one of
the past four
semesters since this
SLO is being
assessed.
Even though, instructors
reviewed numerous
lessons on applying legal
principles to logical
arguments, students did
not appear to have
enough practice to
solidify their
understanding on their
own outside of class.
Given that this SLO has
been met only once over
the past four semesters,
the spring 2016 semester
result is a marked
departure from the prior
trend. While one
semester’s results could be
lower than expected for a
variety of reasons, this is a
concern. Therefore, faculty
teaching LAW 41, will be
engaged to better address
these concerns and
students will be given
additional assignments to
strengthen the needed
skills.
50
55
60
65
70
75
80
F'14 (n=65) S'15 (n=104) F'15 (n=69) S'16 (n=XX)
Score
SLO: Identify Advanced Legal Principles in Contract Formation
30
35
40
45
50
55
60
F'14 (n=65) S'15 (n=104) F'15 (n=69) S'16 (n=XX)
Score
SLO: Create Logical Arguments by Applying Legal Principles
50
55
60
65
70
75
80
F'14 (n=65) S'15 (n=104) F'15 (n=69) S'16 (n=XX)
Score
SLO: Identify Basic Legal Principles in Contract Formation
Page 14 of 46
Performance Measure:
For each assessment,
identify the following - 1.
Academic Program, 2.
Student Learning
Outcome, 3. Measurable
Goal
What is your
measurement instrument
or process? Do not use
grades. Indicate type of
instrument (e.g. direct,
formative, internal,
comparative)
Current Results:
What are your
current results?
Analysis of Results:
What did you learn
from your results?
Action Taken or
Improvement Made:
What did you improve
or what is your next
step?
Provide a graph or table of resulting trends (3-5
data points preferred)
Analysis of Results
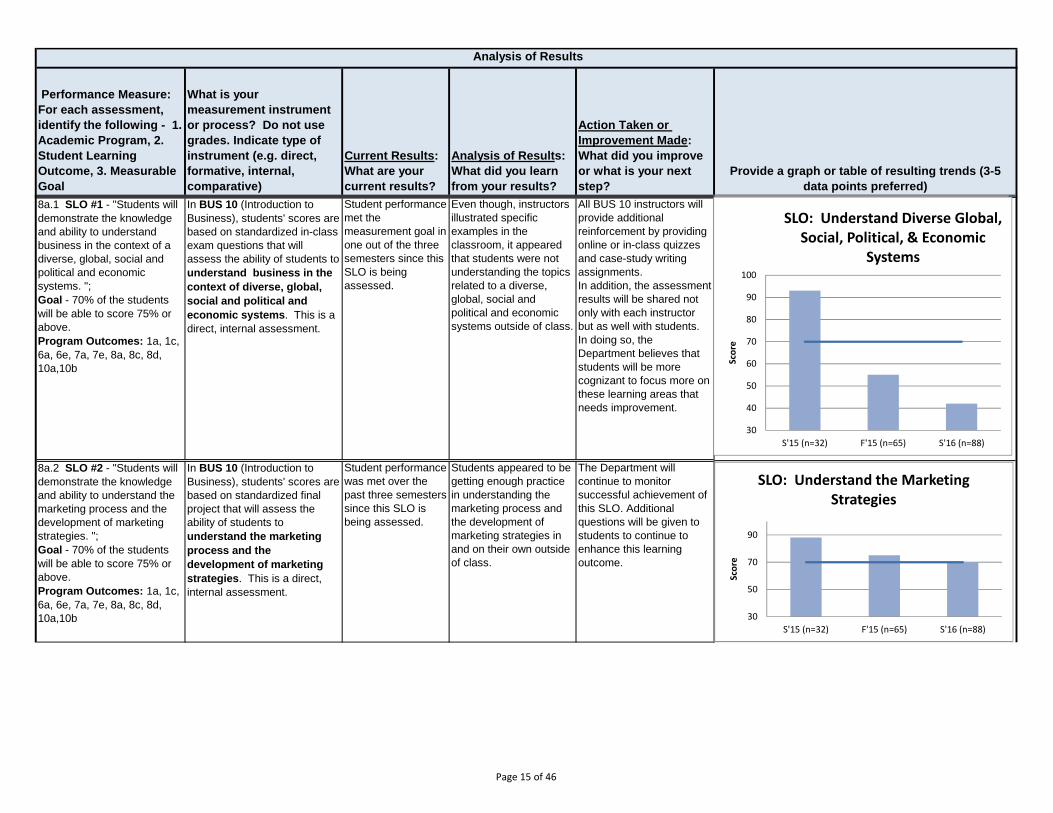
8a.1 SLO #1 - "Students will
demonstrate the knowledge
and ability to understand
business in the context of a
diverse, global, social and
political and economic
systems. ";
Goal - 70% of the students
will be able to score 75% or
above.
Program Outcomes: 1a, 1c,
6a, 6e, 7a, 7e, 8a, 8c, 8d,
10a,10b
In BUS 10 (Introduction to
Business), students' scores are
based on standardized in-class
exam questions that will
assess the ability of students to
understand business in the
context of diverse, global,
social and political and
economic systems. This is a
direct, internal assessment.
Student performance
met the
measurement goal in
one out of the three
semesters since this
SLO is being
assessed.
Even though, instructors
illustrated specific
examples in the
classroom, it appeared
that students were not
understanding the topics
related to a diverse,
global, social and
political and economic
systems outside of class.
All BUS 10 instructors will
provide additional
reinforcement by providing
online or in-class quizzes
and case-study writing
assignments.
In addition, the assessment
results will be shared not
only with each instructor
but as well with students.
In doing so, the
Department believes that
students will be more
cognizant to focus more on
these learning areas that
needs improvement.
8a.2 SLO #2 - "Students will
demonstrate the knowledge
and ability to understand the
marketing process and the
development of marketing
strategies. ";
Goal - 70% of the students
will be able to score 75% or
above.
Program Outcomes: 1a, 1c,
6a, 6e, 7a, 7e, 8a, 8c, 8d,
10a,10b
In BUS 10 (Introduction to
Business), students' scores are
based on standardized final
project that will assess the
ability of students to
understand the marketing
process and the
development of marketing
strategies. This is a direct,
internal assessment.
Student performance
was met over the
past three semesters
since this SLO is
being assessed.
Students appeared to be
getting enough practice
in understanding the
marketing process and
the development of
marketing strategies in
and on their own outside
of class.
The Department will
continue to monitor
successful achievement of
this SLO. Additional
questions will be given to
students to continue to
enhance this learning
outcome.
30
40
50
60
70
80
90
100
S'15 (n=32) F'15 (n=65) S'16 (n=88)
Score
SLO: Understand Diverse Global, Social, Political, & Economic
Systems
30
50
70
90
S'15 (n=32) F'15 (n=65) S'16 (n=88)
Score
SLO: Understand the Marketing Strategies
Page 15 of 46
Performance Measure:
For each assessment,
identify the following - 1.
Academic Program, 2.
Student Learning
Outcome, 3. Measurable
Goal
What is your
measurement instrument
or process? Do not use
grades. Indicate type of
instrument (e.g. direct,
formative, internal,
comparative)
Current Results:
What are your
current results?
Analysis of Results:
What did you learn
from your results?
Action Taken or
Improvement Made:
What did you improve
or what is your next
step?
Provide a graph or table of resulting trends (3-5
data points preferred)
Analysis of Results
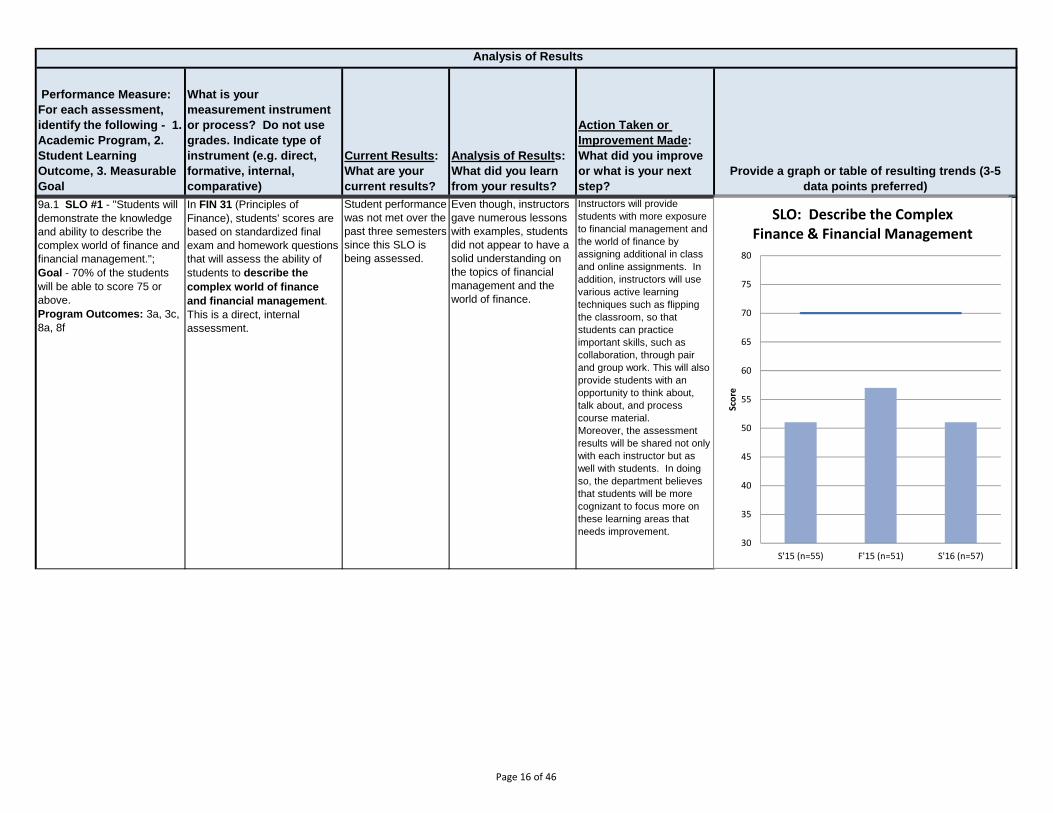
9a.1 SLO #1 - "Students will
demonstrate the knowledge
and ability to describe the
complex world of finance and
financial management.";
Goal - 70% of the students
will be able to score 75 or
above.
Program Outcomes: 3a, 3c,
8a, 8f
In FIN 31 (Principles of
Finance), students' scores are
based on standardized final
exam and homework questions
that will assess the ability of
students to describe the
complex world of finance
and financial management.
This is a direct, internal
assessment.
Student performance
was not met over the
past three semesters
since this SLO is
being assessed.
Even though, instructors
gave numerous lessons
with examples, students
did not appear to have a
solid understanding on
the topics of financial
management and the
world of finance.
Instructors will provide
students with more exposure
to financial management and
the world of finance by
assigning additional in class
and online assignments. In
addition, instructors will use
various active learning
techniques such as flipping
the classroom, so that
students can practice
important skills, such as
collaboration, through pair
and group work. This will also
provide students with an
opportunity to think about,
talk about, and process
course material.
Moreover, the assessment
results will be shared not only
with each instructor but as
well with students. In doing
so, the department believes
that students will be more
cognizant to focus more on
these learning areas that
needs improvement. 30
35
40
45
50
55
60
65
70
75
80
S'15 (n=55) F'15 (n=51) S'16 (n=57)
Score
SLO: Describe the Complex Finance & Financial Management
Page 16 of 46
Performance Measure:
For each assessment,
identify the following - 1.
Academic Program, 2.
Student Learning
Outcome, 3. Measurable
Goal
What is your
measurement instrument
or process? Do not use
grades. Indicate type of
instrument (e.g. direct,
formative, internal,
comparative)
Current Results:
What are your
current results?
Analysis of Results:
What did you learn
from your results?
Action Taken or
Improvement Made:
What did you improve
or what is your next
step?
Provide a graph or table of resulting trends (3-5
data points preferred)
Analysis of Results
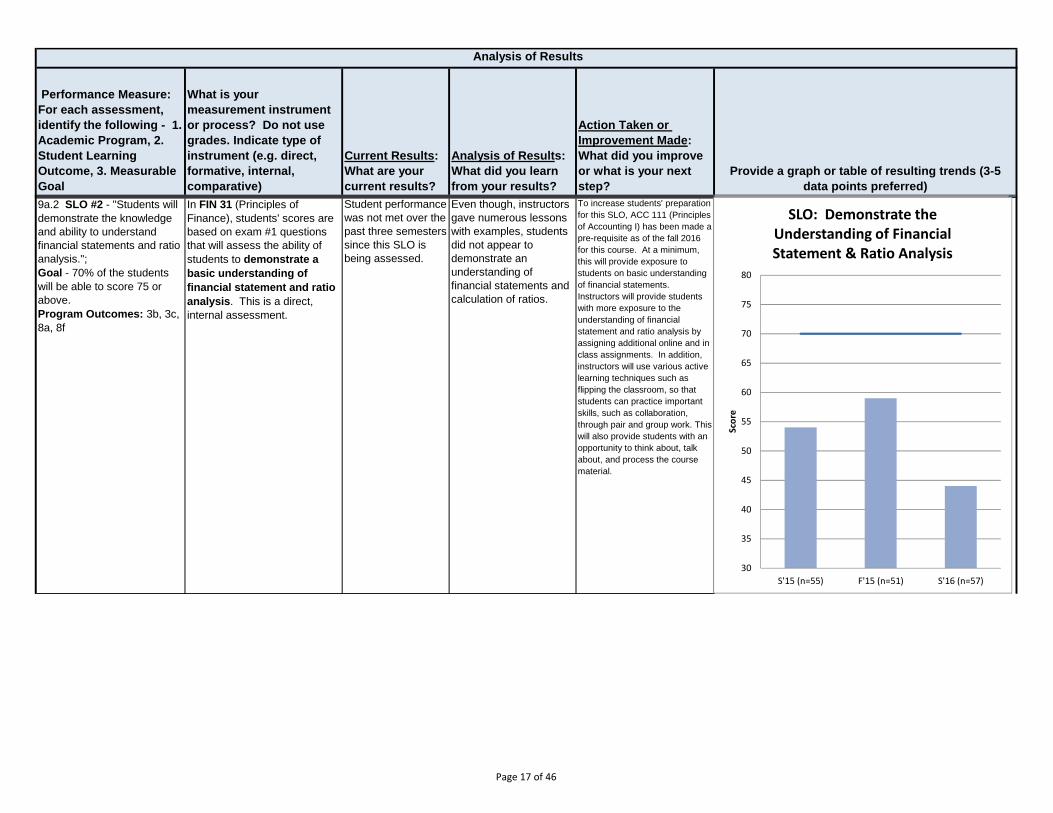
9a.2 SLO #2 - "Students will
demonstrate the knowledge
and ability to understand
financial statements and ratio
analysis.";
Goal - 70% of the students
will be able to score 75 or
above.
Program Outcomes: 3b, 3c,
8a, 8f
In FIN 31 (Principles of
Finance), students' scores are
based on exam #1 questions
that will assess the ability of
students to demonstrate a
basic understanding of
financial statement and ratio
analysis. This is a direct,
internal assessment.
Student performance
was not met over the
past three semesters
since this SLO is
being assessed.
Even though, instructors
gave numerous lessons
with examples, students
did not appear to
demonstrate an
understanding of
financial statements and
calculation of ratios.
To increase students' preparation
for this SLO, ACC 111 (Principles
of Accounting I) has been made a
pre-requisite as of the fall 2016
for this course. At a minimum,
this will provide exposure to
students on basic understanding
of financial statements.
Instructors will provide students
with more exposure to the
understanding of financial
statement and ratio analysis by
assigning additional online and in
class assignments. In addition,
instructors will use various active
learning techniques such as
flipping the classroom, so that
students can practice important
skills, such as collaboration,
through pair and group work. This
will also provide students with an
opportunity to think about, talk
about, and process the course
material.
30
35
40
45
50
55
60
65
70
75
80
S'15 (n=55) F'15 (n=51) S'16 (n=57)
Score
SLO: Demonstrate the Understanding of Financial Statement & Ratio Analysis
Page 17 of 46
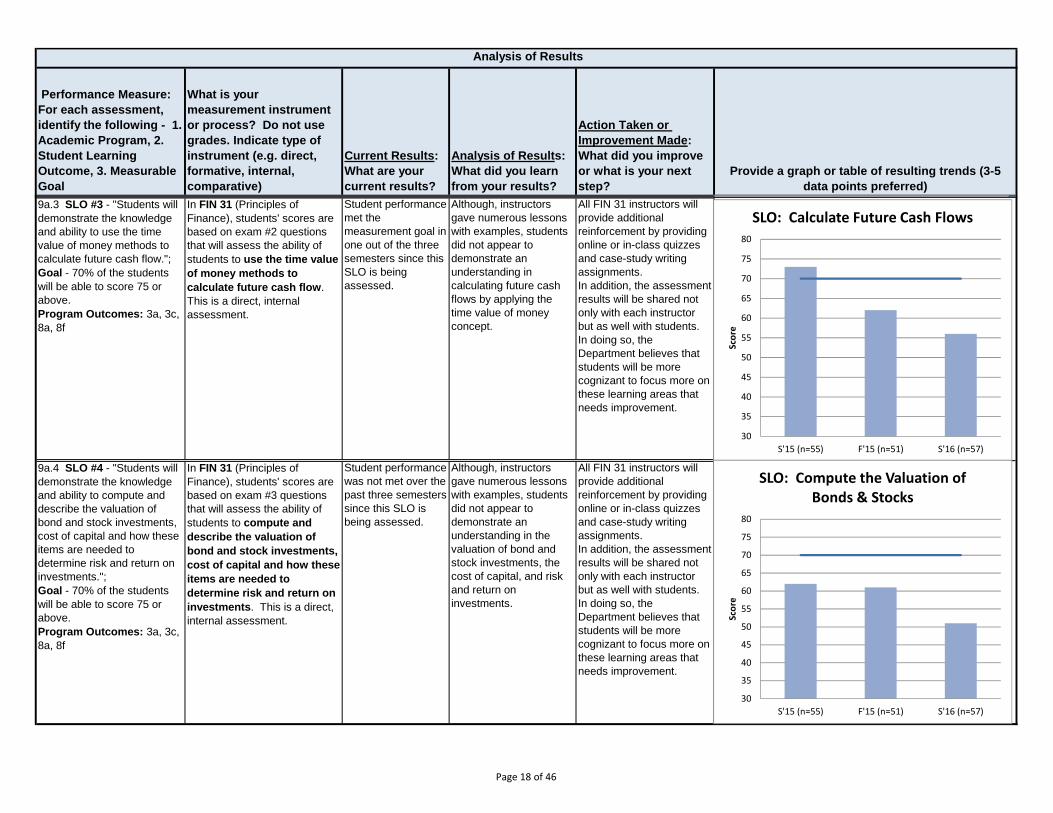
Performance Measure:
For each assessment,
identify the following - 1.
Academic Program, 2.
Student Learning
Outcome, 3. Measurable
Goal
What is your
measurement instrument
or process? Do not use
grades. Indicate type of
instrument (e.g. direct,
formative, internal,
comparative)
Current Results:
What are your
current results?
Analysis of Results:
What did you learn
from your results?
Action Taken or
Improvement Made:
What did you improve
or what is your next
step?
Provide a graph or table of resulting trends (3-5
data points preferred)
Analysis of Results
9a.3 SLO #3 - "Students will
demonstrate the knowledge
and ability to use the time
value of money methods to
calculate future cash flow.";
Goal - 70% of the students
will be able to score 75 or
above.
Program Outcomes: 3a, 3c,
8a, 8f
In FIN 31 (Principles of
Finance), students' scores are
based on exam #2 questions
that will assess the ability of
students to use the time value
of money methods to
calculate future cash flow.
This is a direct, internal
assessment.
Student performance
met the
measurement goal in
one out of the three
semesters since this
SLO is being
assessed.
Although, instructors
gave numerous lessons
with examples, students
did not appear to
demonstrate an
understanding in
calculating future cash
flows by applying the
time value of money
concept.
All FIN 31 instructors will
provide additional
reinforcement by providing
online or in-class quizzes
and case-study writing
assignments.
In addition, the assessment
results will be shared not
only with each instructor
but as well with students.
In doing so, the
Department believes that
students will be more
cognizant to focus more on
these learning areas that
needs improvement.
9a.4 SLO #4 - "Students will
demonstrate the knowledge
and ability to compute and
describe the valuation of
bond and stock investments,
cost of capital and how these
items are needed to
determine risk and return on
investments.";
Goal - 70% of the students
will be able to score 75 or
above.
Program Outcomes: 3a, 3c,
8a, 8f
In FIN 31 (Principles of
Finance), students' scores are
based on exam #3 questions
that will assess the ability of
students to compute and
describe the valuation of
bond and stock investments,
cost of capital and how these
items are needed to
determine risk and return on
investments. This is a direct,
internal assessment.
Student performance
was not met over the
past three semesters
since this SLO is
being assessed.
Although, instructors
gave numerous lessons
with examples, students
did not appear to
demonstrate an
understanding in the
valuation of bond and
stock investments, the
cost of capital, and risk
and return on
investments.
All FIN 31 instructors will
provide additional
reinforcement by providing
online or in-class quizzes
and case-study writing
assignments.
In addition, the assessment
results will be shared not
only with each instructor
but as well with students.
In doing so, the
Department believes that
students will be more
cognizant to focus more on
these learning areas that
needs improvement.
30
35
40
45
50
55
60
65
70
75
80
S'15 (n=55) F'15 (n=51) S'16 (n=57)
Score
SLO: Calculate Future Cash Flows
30
35
40
45
50
55
60
65
70
75
80
S'15 (n=55) F'15 (n=51) S'16 (n=57)
Score
SLO: Compute the Valuation of Bonds & Stocks
Page 18 of 46
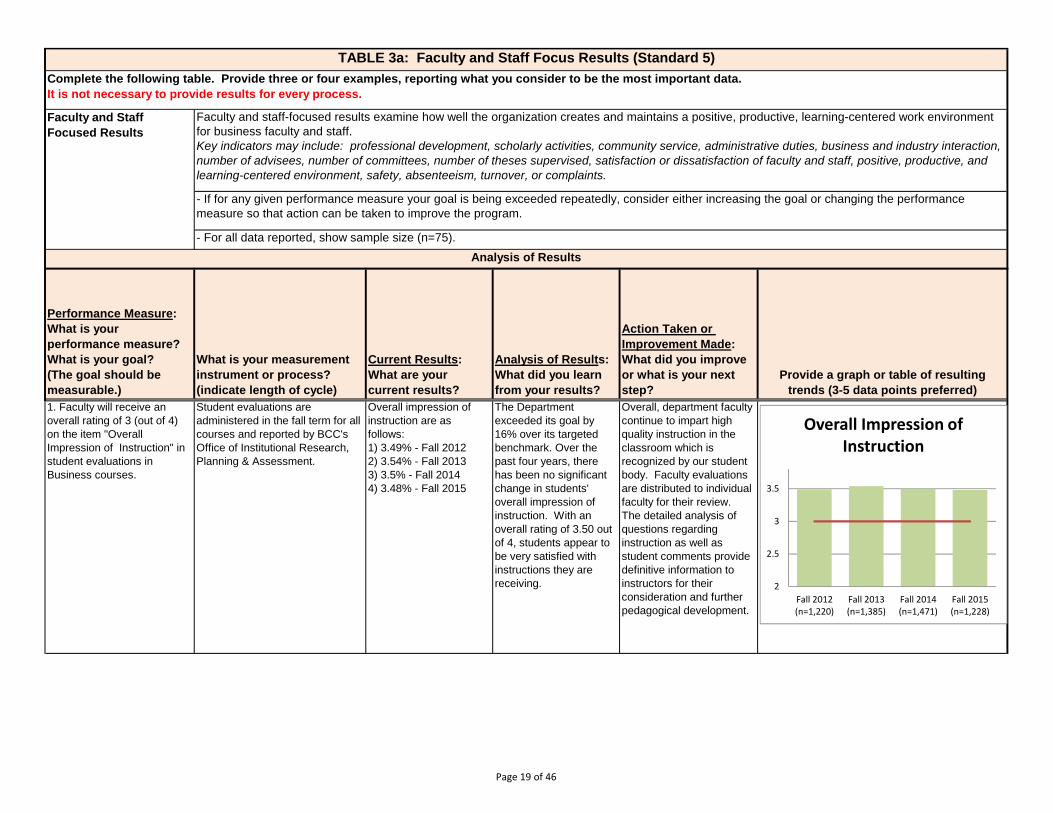
Faculty and Staff
Focused Results
Performance Measure:
What is your
performance measure?
What is your goal?
(The goal should be
measurable.)
What is your measurement
instrument or process?
(indicate length of cycle)
Current Results:
What are your
current results?
Analysis of Results:
What did you learn
from your results?
Action Taken or
Improvement Made:
What did you improve
or what is your next
step?
Provide a graph or table of resulting
trends (3-5 data points preferred)
1. Faculty will receive an
overall rating of 3 (out of 4)
on the item "Overall
Impression of Instruction" in
student evaluations in
Business courses.
Student evaluations are
administered in the fall term for all
courses and reported by BCC's
Office of Institutional Research,
Planning & Assessment.
Overall impression of
instruction are as
follows:
1) 3.49% - Fall 2012
2) 3.54% - Fall 2013
3) 3.5% - Fall 2014
4) 3.48% - Fall 2015
The Department
exceeded its goal by
16% over its targeted
benchmark. Over the
past four years, there
has been no significant
change in students'
overall impression of
instruction. With an
overall rating of 3.50 out
of 4, students appear to
be very satisfied with
instructions they are
receiving.
Overall, department faculty
continue to impart high
quality instruction in the
classroom which is
recognized by our student
body. Faculty evaluations
are distributed to individual
faculty for their review.
The detailed analysis of
questions regarding
instruction as well as
student comments provide
definitive information to
instructors for their
consideration and further
pedagogical development.
Analysis of Results
TABLE 3a: Faculty and Staff Focus Results (Standard 5)
Complete the following table. Provide three or four examples, reporting what you consider to be the most important data.
It is not necessary to provide results for every process.
Faculty and staff-focused results examine how well the organization creates and maintains a positive, productive, learning-centered work environment
for business faculty and staff.
Key indicators may include: professional development, scholarly activities, community service, administrative duties, business and industry interaction, number of advisees, number of committees, number of theses supervised, satisfaction or dissatisfaction of faculty and staff, positive, productive, and learning-centered environment, safety, absenteeism, turnover, or complaints.
- If for any given performance measure your goal is being exceeded repeatedly, consider either increasing the goal or changing the performance
measure so that action can be taken to improve the program.
- For all data reported, show sample size (n=75).
2
2.5
3
3.5
Fall 2012(n=1,220)
Fall 2013(n=1,385)
Fall 2014(n=1,471)
Fall 2015(n=1,228)
Overall Impression of Instruction
Page 19 of 46
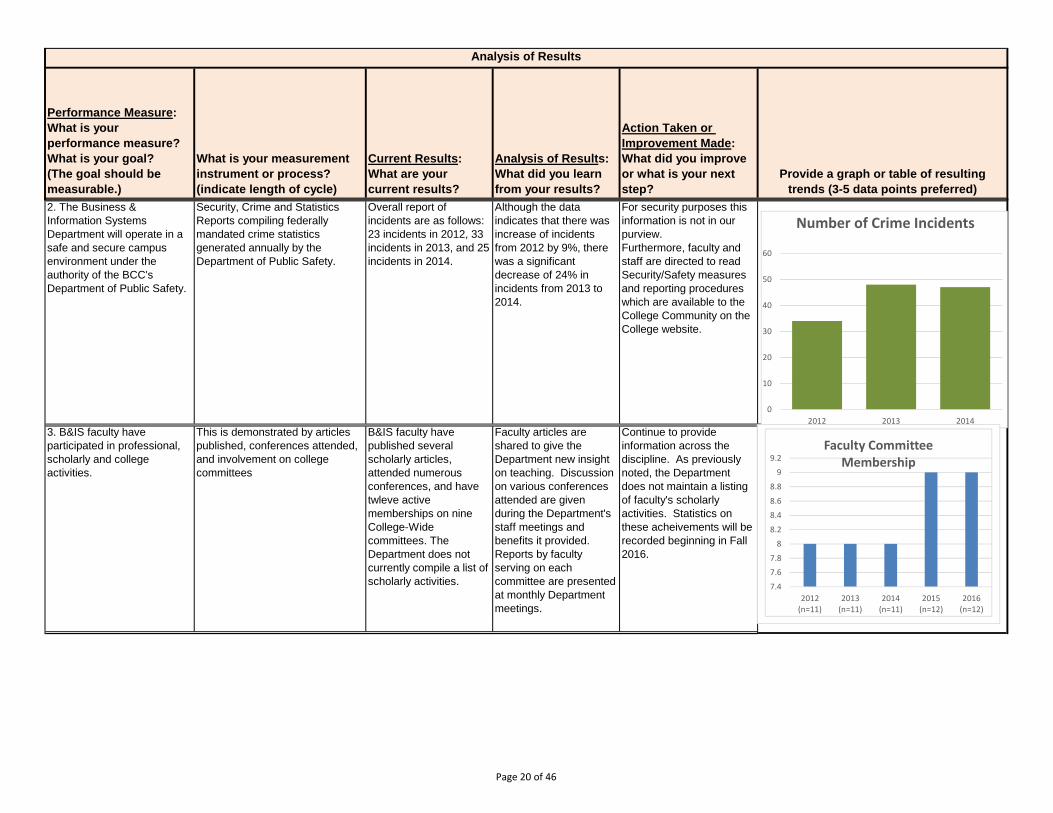
Performance Measure:
What is your
performance measure?
What is your goal?
(The goal should be
measurable.)
What is your measurement
instrument or process?
(indicate length of cycle)
Current Results:
What are your
current results?
Analysis of Results:
What did you learn
from your results?
Action Taken or
Improvement Made:
What did you improve
or what is your next
step?
Provide a graph or table of resulting
trends (3-5 data points preferred)
Analysis of Results
2. The Business &
Information Systems
Department will operate in a
safe and secure campus
environment under the
authority of the BCC's
Department of Public Safety.
Security, Crime and Statistics
Reports compiling federally
mandated crime statistics
generated annually by the
Department of Public Safety.
Overall report of
incidents are as follows:
23 incidents in 2012, 33
incidents in 2013, and 25
incidents in 2014.
Although the data
indicates that there was
increase of incidents
from 2012 by 9%, there
was a significant
decrease of 24% in
incidents from 2013 to
2014.
For security purposes this
information is not in our
purview.
Furthermore, faculty and
staff are directed to read
Security/Safety measures
and reporting procedures
which are available to the
College Community on the
College website.
3. B&IS faculty have
participated in professional,
scholarly and college
activities.
This is demonstrated by articles
published, conferences attended,
and involvement on college
committees
B&IS faculty have
published several
scholarly articles,
attended numerous
conferences, and have
twleve active
memberships on nine
College-Wide
committees. The
Department does not
currently compile a list of
scholarly activities.
Faculty articles are
shared to give the
Department new insight
on teaching. Discussion
on various conferences
attended are given
during the Department's
staff meetings and
benefits it provided.
Reports by faculty
serving on each
committee are presented
at monthly Department
meetings.
Continue to provide
information across the
discipline. As previously
noted, the Department
does not maintain a listing
of faculty's scholarly
activities. Statistics on
these acheivements will be
recorded beginning in Fall
2016.
0
10
20
30
40
50
60
2012 2013 2014
Number of Crime Incidents
7.4
7.6
7.8
8
8.2
8.4
8.6
8.8
9
9.2
2012(n=11)
2013(n=11)
2014(n=11)
2015(n=12)
2016(n=12)
Faculty Committee Membership
Page 20 of 46
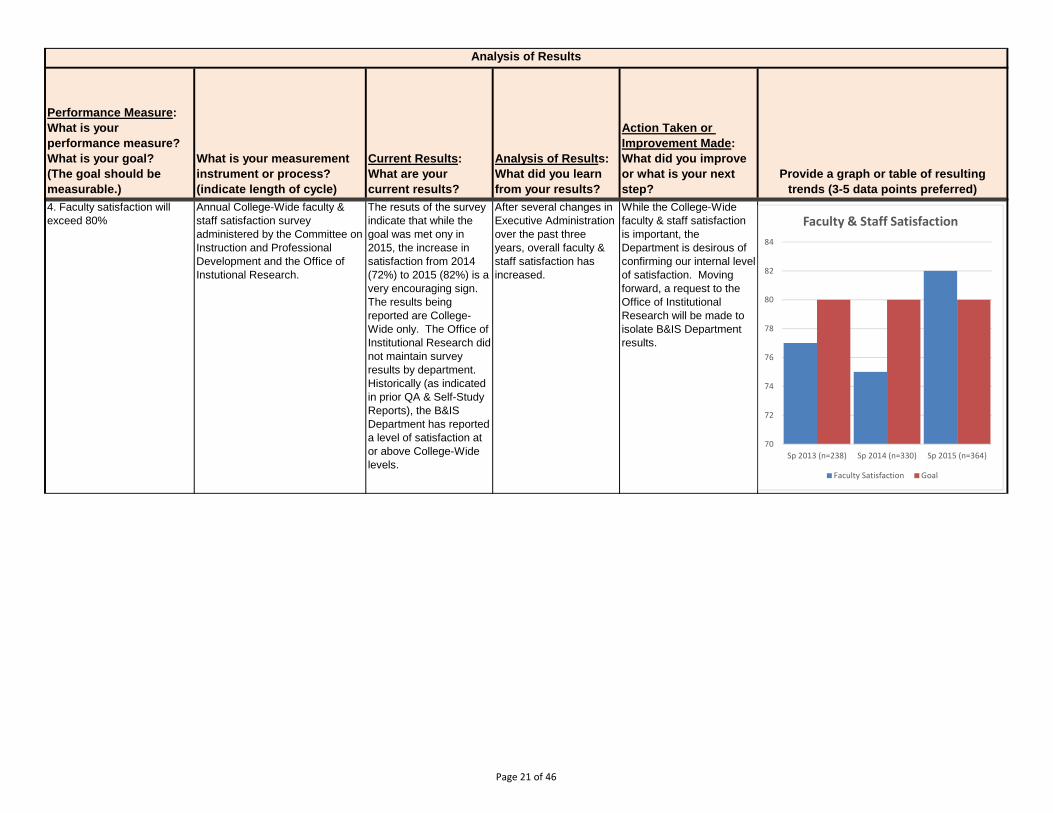
Performance Measure:
What is your
performance measure?
What is your goal?
(The goal should be
measurable.)
What is your measurement
instrument or process?
(indicate length of cycle)
Current Results:
What are your
current results?
Analysis of Results:
What did you learn
from your results?
Action Taken or
Improvement Made:
What did you improve
or what is your next
step?
Provide a graph or table of resulting
trends (3-5 data points preferred)
Analysis of Results
4. Faculty satisfaction will
exceed 80%
Annual College-Wide faculty &
staff satisfaction survey
administered by the Committee on
Instruction and Professional
Development and the Office of
Instutional Research.
The resuts of the survey
indicate that while the
goal was met ony in
2015, the increase in
satisfaction from 2014
(72%) to 2015 (82%) is a
very encouraging sign.
The results being
reported are College-
Wide only. The Office of
Institutional Research did
not maintain survey
results by department.
Historically (as indicated
in prior QA & Self-Study
Reports), the B&IS
Department has reported
a level of satisfaction at
or above College-Wide
levels.
After several changes in
Executive Administration
over the past three
years, overall faculty &
staff satisfaction has
increased.
While the College-Wide
faculty & staff satisfaction
is important, the
Department is desirous of
confirming our internal level
of satisfaction. Moving
forward, a request to the
Office of Institutional
Research will be made to
isolate B&IS Department
results.
70
72
74
76
78
80
82
84
Sp 2013 (n=238) Sp 2014 (n=330) Sp 2015 (n=364)
Faculty & Staff Satisfaction
Faculty Satisfaction Goal
Page 21 of 46
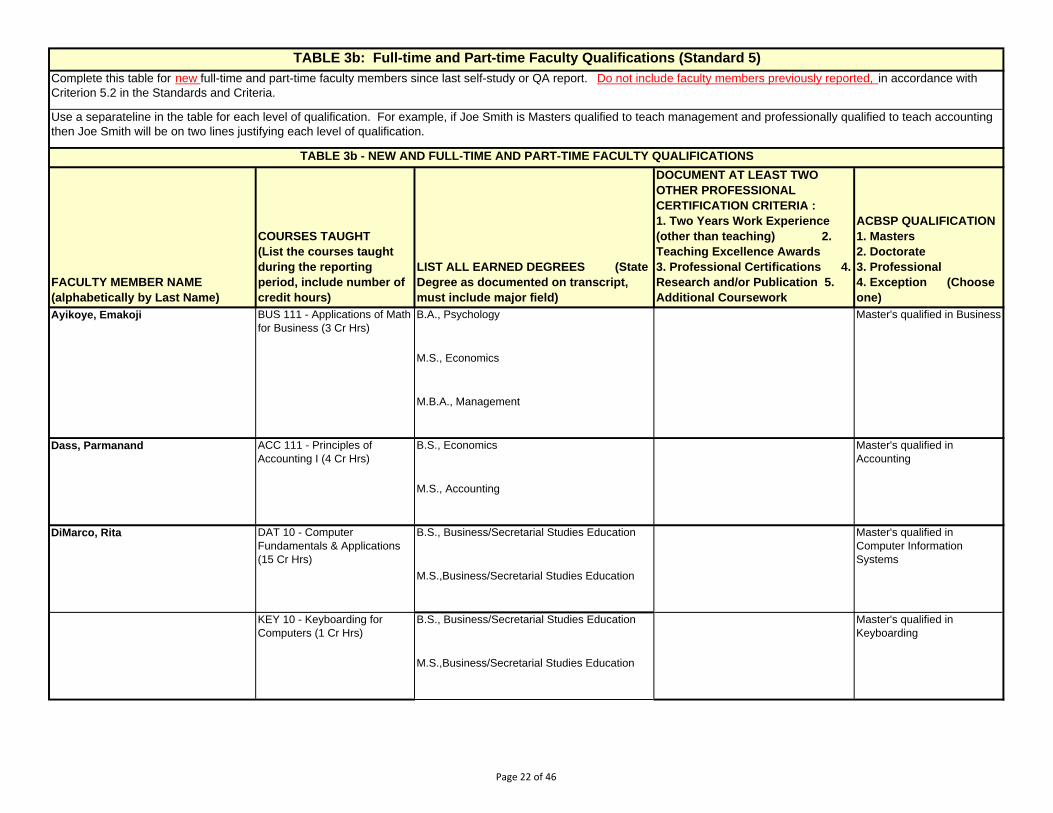
FACULTY MEMBER NAME
(alphabetically by Last Name)
COURSES TAUGHT
(List the courses taught
during the reporting
period, include number of
credit hours)
LIST ALL EARNED DEGREES (State
Degree as documented on transcript,
must include major field)
DOCUMENT AT LEAST TWO
OTHER PROFESSIONAL
CERTIFICATION CRITERIA :
1. Two Years Work Experience
(other than teaching) 2.
Teaching Excellence Awards
3. Professional Certifications 4.
Research and/or Publication 5.
Additional Coursework
ACBSP QUALIFICATION
1. Masters
2. Doctorate
3. Professional
4. Exception (Choose
one)
Ayikoye, Emakoji BUS 111 - Applications of Math
for Business (3 Cr Hrs)
B.A., Psychology Master's qualified in Business
M.S., Economics
M.B.A., Management
Dass, Parmanand ACC 111 - Principles of
Accounting I (4 Cr Hrs)
B.S., Economics Master's qualified in
Accounting
M.S., Accounting
DiMarco, Rita DAT 10 - Computer
Fundamentals & Applications
(15 Cr Hrs)
B.S., Business/Secretarial Studies Education Master's qualified in
Computer Information
Systems
M.S.,Business/Secretarial Studies Education
KEY 10 - Keyboarding for
Computers (1 Cr Hrs)
B.S., Business/Secretarial Studies Education Master's qualified in
Keyboarding
M.S.,Business/Secretarial Studies Education
TABLE 3b - NEW AND FULL-TIME AND PART-TIME FACULTY QUALIFICATIONS
TABLE 3b: Full-time and Part-time Faculty Qualifications (Standard 5)
Complete this table for new full-time and part-time faculty members since last self-study or QA report. Do not include faculty members previously reported, in accordance with
Criterion 5.2 in the Standards and Criteria.
Use a separateline in the table for each level of qualification. For example, if Joe Smith is Masters qualified to teach management and professionally qualified to teach accounting
then Joe Smith will be on two lines justifying each level of qualification.
Page 22 of 46
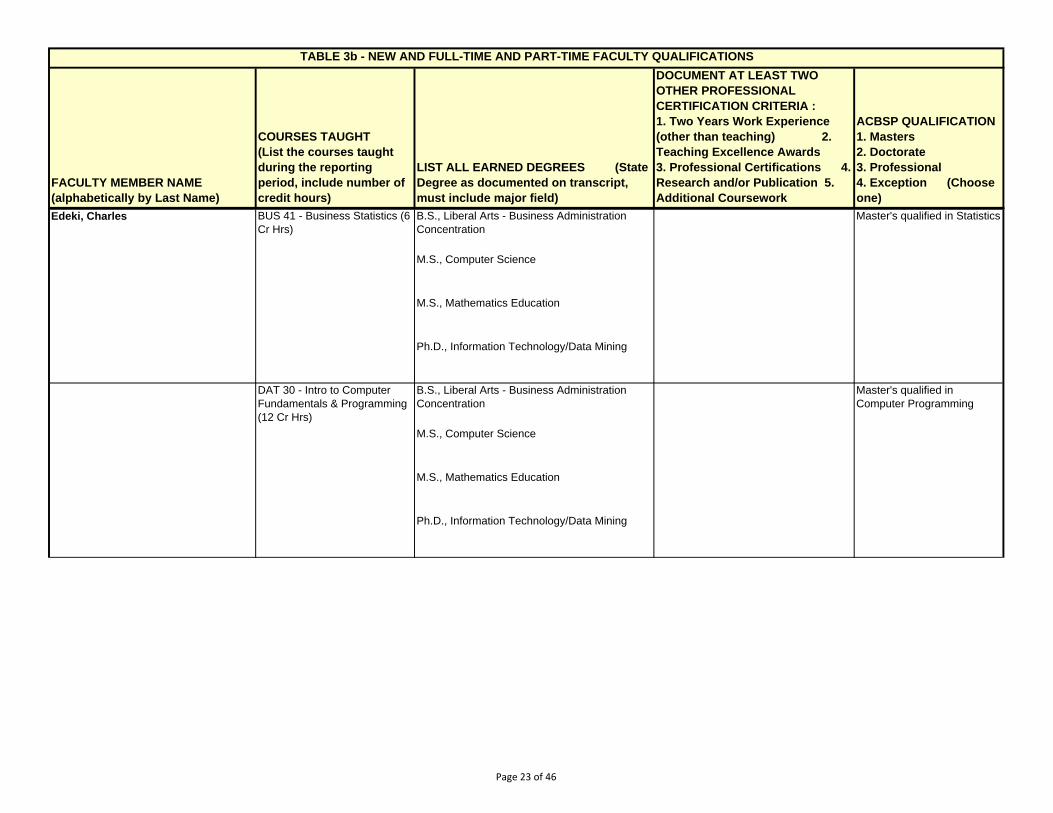
FACULTY MEMBER NAME
(alphabetically by Last Name)
COURSES TAUGHT
(List the courses taught
during the reporting
period, include number of
credit hours)
LIST ALL EARNED DEGREES (State
Degree as documented on transcript,
must include major field)
DOCUMENT AT LEAST TWO
OTHER PROFESSIONAL
CERTIFICATION CRITERIA :
1. Two Years Work Experience
(other than teaching) 2.
Teaching Excellence Awards
3. Professional Certifications 4.
Research and/or Publication 5.
Additional Coursework
ACBSP QUALIFICATION
1. Masters
2. Doctorate
3. Professional
4. Exception (Choose
one)
TABLE 3b - NEW AND FULL-TIME AND PART-TIME FACULTY QUALIFICATIONS
Edeki, Charles BUS 41 - Business Statistics (6
Cr Hrs)
B.S., Liberal Arts - Business Administration
Concentration
Master's qualified in Statistics
M.S., Computer Science
M.S., Mathematics Education
Ph.D., Information Technology/Data Mining
DAT 30 - Intro to Computer
Fundamentals & Programming
(12 Cr Hrs)
B.S., Liberal Arts - Business Administration
Concentration
Master's qualified in
Computer Programming
M.S., Computer Science
M.S., Mathematics Education
Ph.D., Information Technology/Data Mining
Page 23 of 46
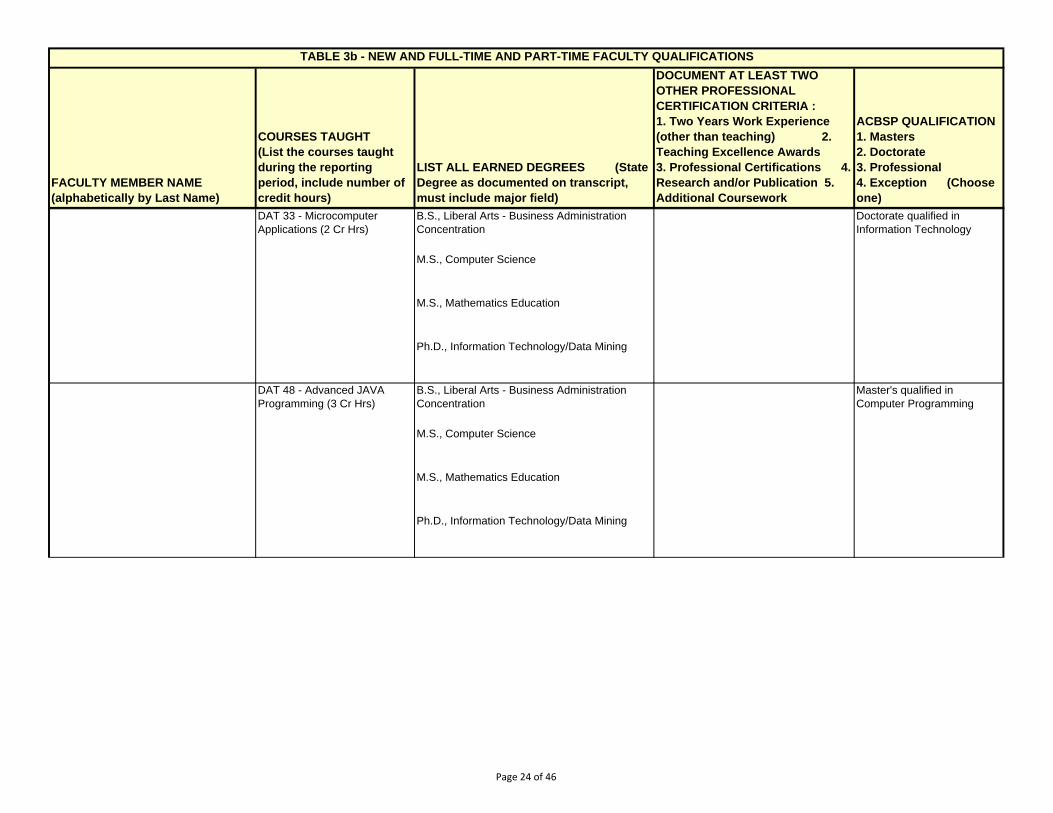
FACULTY MEMBER NAME
(alphabetically by Last Name)
COURSES TAUGHT
(List the courses taught
during the reporting
period, include number of
credit hours)
LIST ALL EARNED DEGREES (State
Degree as documented on transcript,
must include major field)
DOCUMENT AT LEAST TWO
OTHER PROFESSIONAL
CERTIFICATION CRITERIA :
1. Two Years Work Experience
(other than teaching) 2.
Teaching Excellence Awards
3. Professional Certifications 4.
Research and/or Publication 5.
Additional Coursework
ACBSP QUALIFICATION
1. Masters
2. Doctorate
3. Professional
4. Exception (Choose
one)
TABLE 3b - NEW AND FULL-TIME AND PART-TIME FACULTY QUALIFICATIONS
DAT 33 - Microcomputer
Applications (2 Cr Hrs)
B.S., Liberal Arts - Business Administration
Concentration
Doctorate qualified in
Information Technology
M.S., Computer Science
M.S., Mathematics Education
Ph.D., Information Technology/Data Mining
DAT 48 - Advanced JAVA
Programming (3 Cr Hrs)
B.S., Liberal Arts - Business Administration
Concentration
Master's qualified in
Computer Programming
M.S., Computer Science
M.S., Mathematics Education
Ph.D., Information Technology/Data Mining
Page 24 of 46
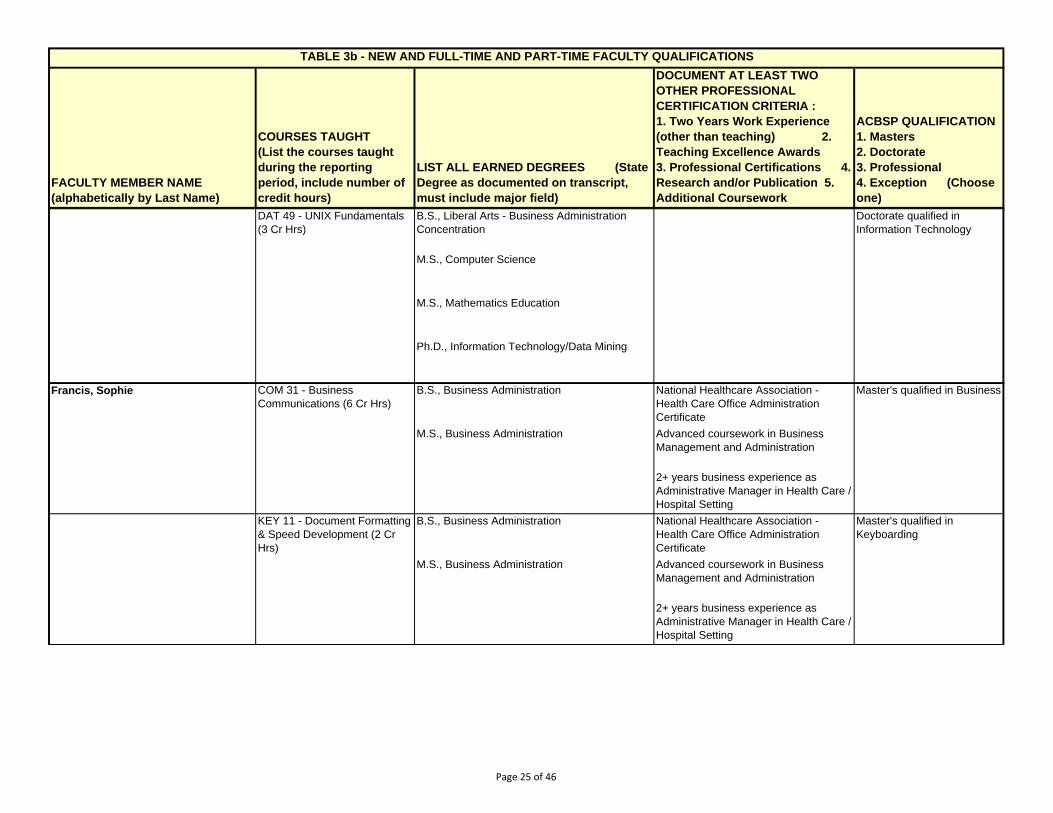
FACULTY MEMBER NAME
(alphabetically by Last Name)
COURSES TAUGHT
(List the courses taught
during the reporting
period, include number of
credit hours)
LIST ALL EARNED DEGREES (State
Degree as documented on transcript,
must include major field)
DOCUMENT AT LEAST TWO
OTHER PROFESSIONAL
CERTIFICATION CRITERIA :
1. Two Years Work Experience
(other than teaching) 2.
Teaching Excellence Awards
3. Professional Certifications 4.
Research and/or Publication 5.
Additional Coursework
ACBSP QUALIFICATION
1. Masters
2. Doctorate
3. Professional
4. Exception (Choose
one)
TABLE 3b - NEW AND FULL-TIME AND PART-TIME FACULTY QUALIFICATIONS
DAT 49 - UNIX Fundamentals
(3 Cr Hrs)
B.S., Liberal Arts - Business Administration
Concentration
Doctorate qualified in
Information Technology
M.S., Computer Science
M.S., Mathematics Education
Ph.D., Information Technology/Data Mining
Francis, Sophie COM 31 - Business
Communications (6 Cr Hrs)
B.S., Business Administration National Healthcare Association -
Health Care Office Administration
Certificate
Master's qualified in Business
M.S., Business Administration Advanced coursework in Business
Management and Administration
2+ years business experience as
Administrative Manager in Health Care /
Hospital Setting
KEY 11 - Document Formatting
& Speed Development (2 Cr
Hrs)
B.S., Business Administration National Healthcare Association -
Health Care Office Administration
Certificate
Master's qualified in
Keyboarding
M.S., Business Administration Advanced coursework in Business
Management and Administration
2+ years business experience as
Administrative Manager in Health Care /
Hospital Setting
Page 25 of 46
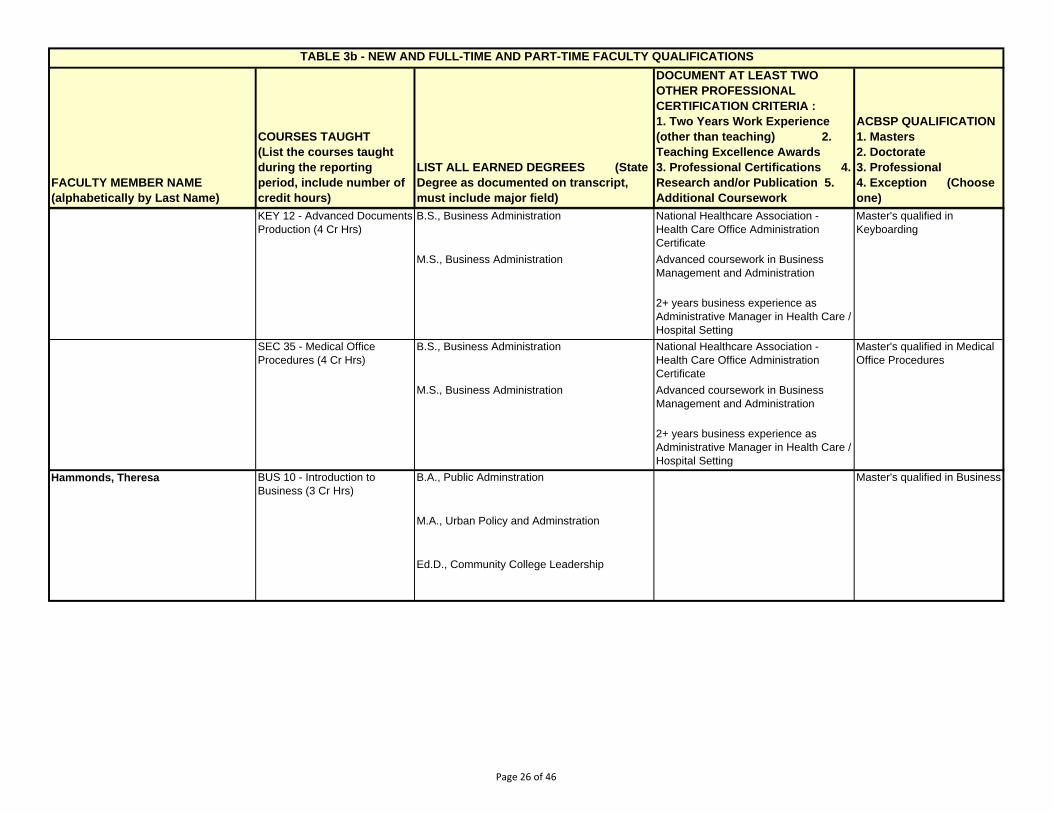
FACULTY MEMBER NAME
(alphabetically by Last Name)
COURSES TAUGHT
(List the courses taught
during the reporting
period, include number of
credit hours)
LIST ALL EARNED DEGREES (State
Degree as documented on transcript,
must include major field)
DOCUMENT AT LEAST TWO
OTHER PROFESSIONAL
CERTIFICATION CRITERIA :
1. Two Years Work Experience
(other than teaching) 2.
Teaching Excellence Awards
3. Professional Certifications 4.
Research and/or Publication 5.
Additional Coursework
ACBSP QUALIFICATION
1. Masters
2. Doctorate
3. Professional
4. Exception (Choose
one)
TABLE 3b - NEW AND FULL-TIME AND PART-TIME FACULTY QUALIFICATIONS
KEY 12 - Advanced Documents
Production (4 Cr Hrs)
B.S., Business Administration National Healthcare Association -
Health Care Office Administration
Certificate
Master's qualified in
Keyboarding
M.S., Business Administration Advanced coursework in Business
Management and Administration
2+ years business experience as
Administrative Manager in Health Care /
Hospital Setting
SEC 35 - Medical Office
Procedures (4 Cr Hrs)
B.S., Business Administration National Healthcare Association -
Health Care Office Administration
Certificate
Master's qualified in Medical
Office Procedures
M.S., Business Administration Advanced coursework in Business
Management and Administration
2+ years business experience as
Administrative Manager in Health Care /
Hospital Setting
Hammonds, Theresa BUS 10 - Introduction to
Business (3 Cr Hrs)
B.A., Public Adminstration Master's qualified in Business
M.A., Urban Policy and Adminstration
Ed.D., Community College Leadership
Page 26 of 46
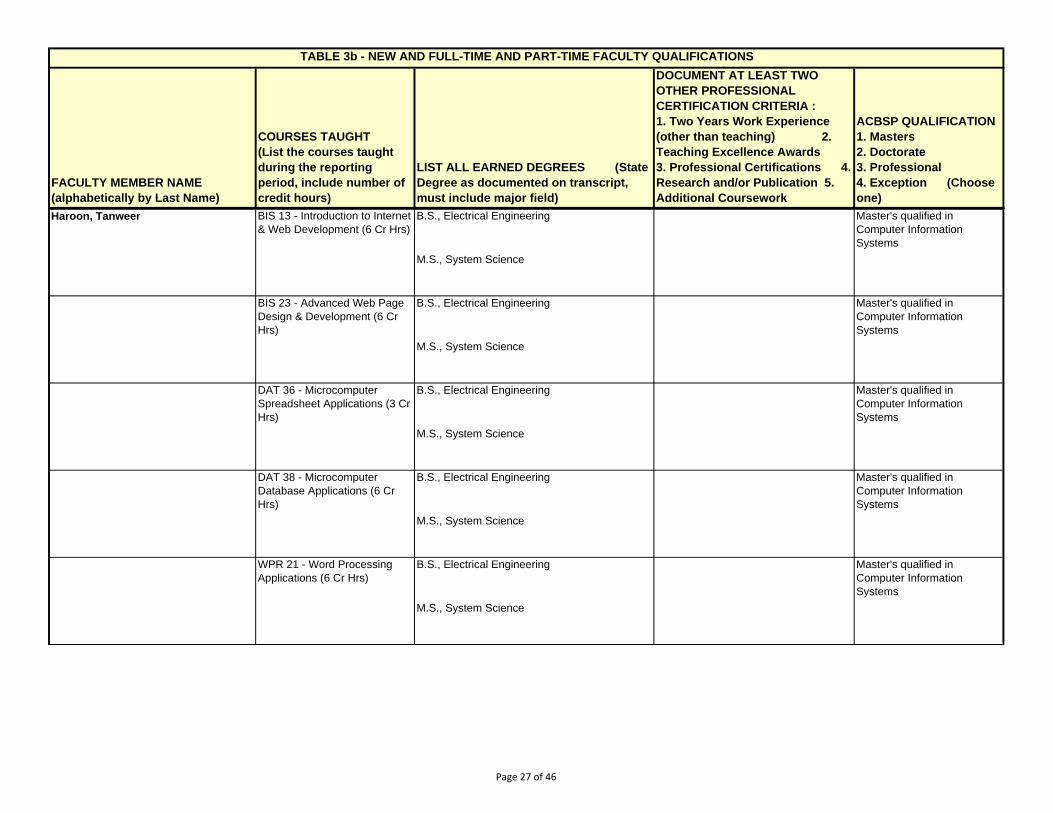
FACULTY MEMBER NAME
(alphabetically by Last Name)
COURSES TAUGHT
(List the courses taught
during the reporting
period, include number of
credit hours)
LIST ALL EARNED DEGREES (State
Degree as documented on transcript,
must include major field)
DOCUMENT AT LEAST TWO
OTHER PROFESSIONAL
CERTIFICATION CRITERIA :
1. Two Years Work Experience
(other than teaching) 2.
Teaching Excellence Awards
3. Professional Certifications 4.
Research and/or Publication 5.
Additional Coursework
ACBSP QUALIFICATION
1. Masters
2. Doctorate
3. Professional
4. Exception (Choose
one)
TABLE 3b - NEW AND FULL-TIME AND PART-TIME FACULTY QUALIFICATIONS
Haroon, Tanweer BIS 13 - Introduction to Internet
& Web Development (6 Cr Hrs)
B.S., Electrical Engineering Master's qualified in
Computer Information
Systems
M.S., System Science
BIS 23 - Advanced Web Page
Design & Development (6 Cr
Hrs)
B.S., Electrical Engineering Master's qualified in
Computer Information
Systems
M.S., System Science
DAT 36 - Microcomputer
Spreadsheet Applications (3 Cr
Hrs)
B.S., Electrical Engineering Master's qualified in
Computer Information
Systems
M.S., System Science
DAT 38 - Microcomputer
Database Applications (6 Cr
Hrs)
B.S., Electrical Engineering Master's qualified in
Computer Information
Systems
M.S., System Science
WPR 21 - Word Processing
Applications (6 Cr Hrs)
B.S., Electrical Engineering Master's qualified in
Computer Information
Systems
M.S., System Science
Page 27 of 46
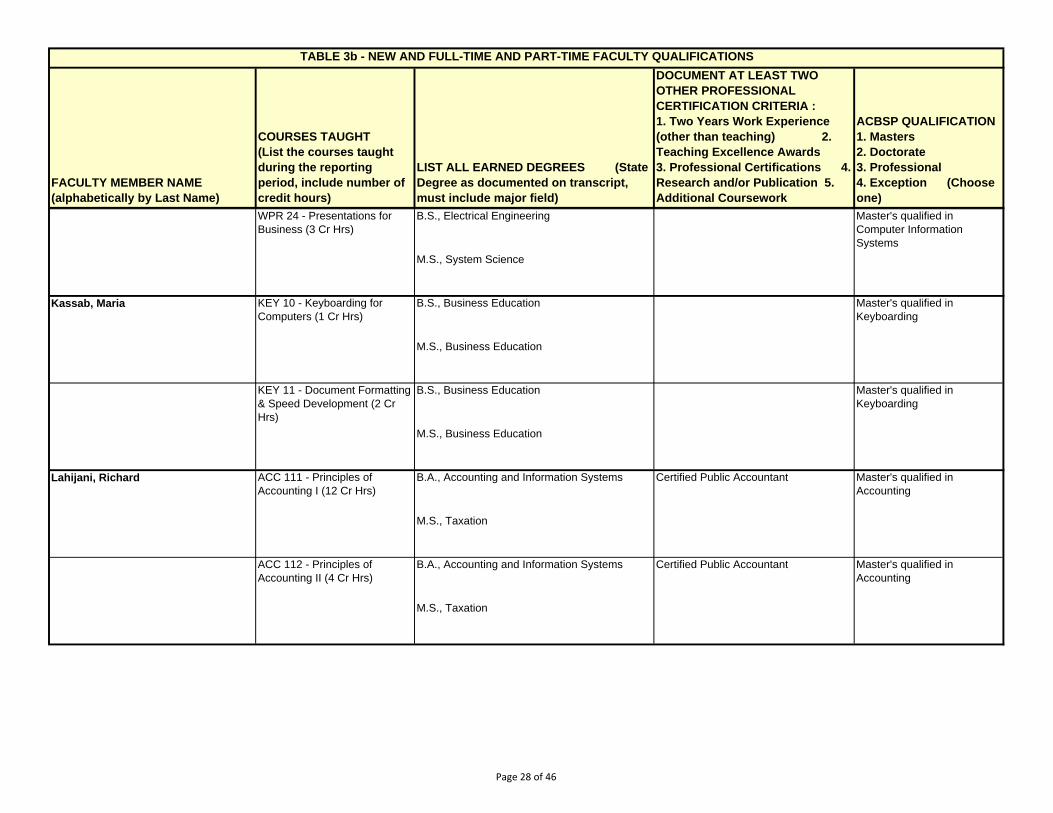
FACULTY MEMBER NAME
(alphabetically by Last Name)
COURSES TAUGHT
(List the courses taught
during the reporting
period, include number of
credit hours)
LIST ALL EARNED DEGREES (State
Degree as documented on transcript,
must include major field)
DOCUMENT AT LEAST TWO
OTHER PROFESSIONAL
CERTIFICATION CRITERIA :
1. Two Years Work Experience
(other than teaching) 2.
Teaching Excellence Awards
3. Professional Certifications 4.
Research and/or Publication 5.
Additional Coursework
ACBSP QUALIFICATION
1. Masters
2. Doctorate
3. Professional
4. Exception (Choose
one)
TABLE 3b - NEW AND FULL-TIME AND PART-TIME FACULTY QUALIFICATIONS
WPR 24 - Presentations for
Business (3 Cr Hrs)
B.S., Electrical Engineering Master's qualified in
Computer Information
Systems
M.S., System Science
Kassab, Maria KEY 10 - Keyboarding for
Computers (1 Cr Hrs)
B.S., Business Education Master's qualified in
Keyboarding
M.S., Business Education
KEY 11 - Document Formatting
& Speed Development (2 Cr
Hrs)
B.S., Business Education Master's qualified in
Keyboarding
M.S., Business Education
Lahijani, Richard ACC 111 - Principles of
Accounting I (12 Cr Hrs)
B.A., Accounting and Information Systems Certified Public Accountant Master's qualified in
Accounting
M.S., Taxation
ACC 112 - Principles of
Accounting II (4 Cr Hrs)
B.A., Accounting and Information Systems Certified Public Accountant Master's qualified in
Accounting
M.S., Taxation
Page 28 of 46
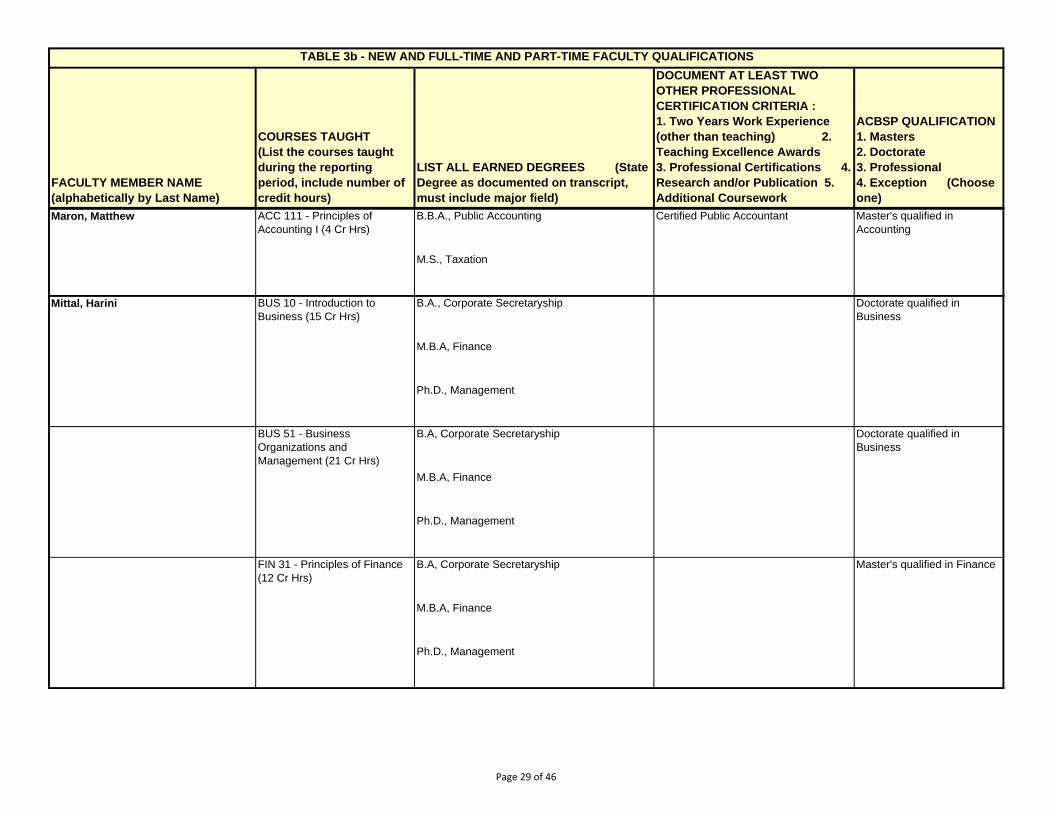
FACULTY MEMBER NAME
(alphabetically by Last Name)
COURSES TAUGHT
(List the courses taught
during the reporting
period, include number of
credit hours)
LIST ALL EARNED DEGREES (State
Degree as documented on transcript,
must include major field)
DOCUMENT AT LEAST TWO
OTHER PROFESSIONAL
CERTIFICATION CRITERIA :
1. Two Years Work Experience
(other than teaching) 2.
Teaching Excellence Awards
3. Professional Certifications 4.
Research and/or Publication 5.
Additional Coursework
ACBSP QUALIFICATION
1. Masters
2. Doctorate
3. Professional
4. Exception (Choose
one)
TABLE 3b - NEW AND FULL-TIME AND PART-TIME FACULTY QUALIFICATIONS
Maron, Matthew ACC 111 - Principles of
Accounting I (4 Cr Hrs)
B.B.A., Public Accounting Certified Public Accountant Master's qualified in
Accounting
M.S., Taxation
Mittal, Harini BUS 10 - Introduction to
Business (15 Cr Hrs)
B.A., Corporate Secretaryship Doctorate qualified in
Business
M.B.A, Finance
Ph.D., Management
BUS 51 - Business
Organizations and
Management (21 Cr Hrs)
B.A, Corporate Secretaryship Doctorate qualified in
Business
M.B.A, Finance
Ph.D., Management
FIN 31 - Principles of Finance
(12 Cr Hrs)
B.A, Corporate Secretaryship Master's qualified in Finance
M.B.A, Finance
Ph.D., Management
Page 29 of 46
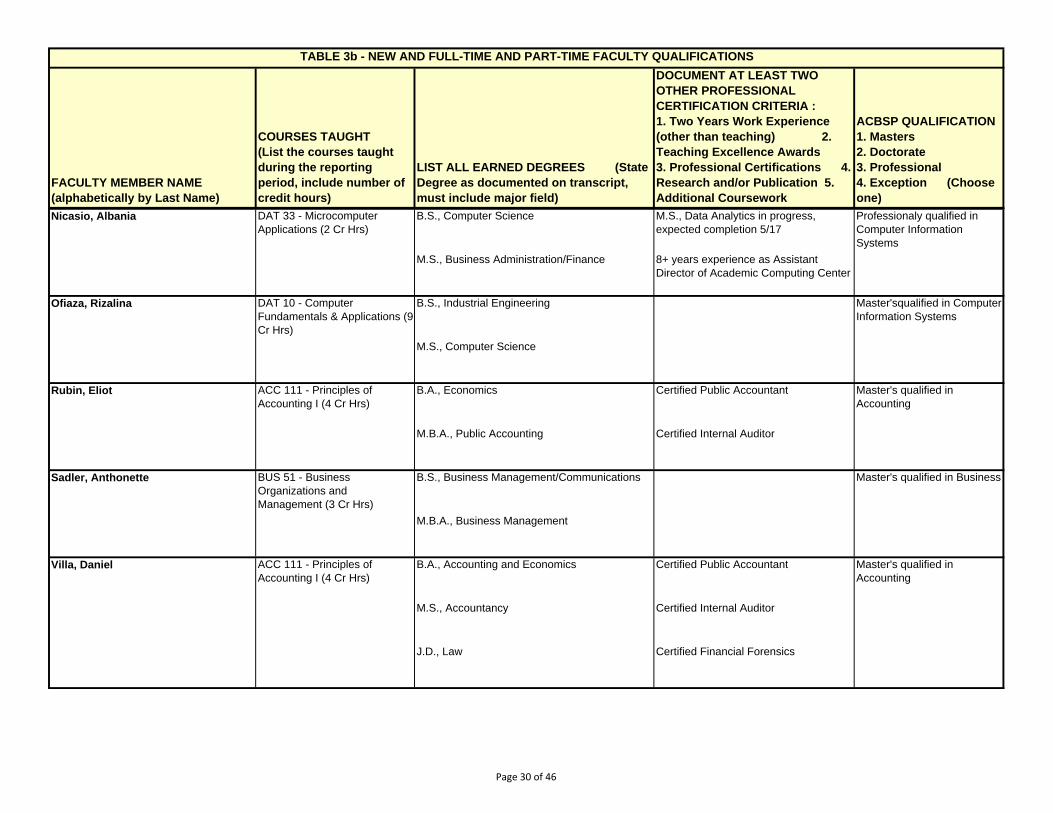
FACULTY MEMBER NAME
(alphabetically by Last Name)
COURSES TAUGHT
(List the courses taught
during the reporting
period, include number of
credit hours)
LIST ALL EARNED DEGREES (State
Degree as documented on transcript,
must include major field)
DOCUMENT AT LEAST TWO
OTHER PROFESSIONAL
CERTIFICATION CRITERIA :
1. Two Years Work Experience
(other than teaching) 2.
Teaching Excellence Awards
3. Professional Certifications 4.
Research and/or Publication 5.
Additional Coursework
ACBSP QUALIFICATION
1. Masters
2. Doctorate
3. Professional
4. Exception (Choose
one)
TABLE 3b - NEW AND FULL-TIME AND PART-TIME FACULTY QUALIFICATIONS
Nicasio, Albania DAT 33 - Microcomputer
Applications (2 Cr Hrs)
B.S., Computer Science M.S., Data Analytics in progress,
expected completion 5/17
Professionaly qualified in
Computer Information
Systems
M.S., Business Administration/Finance 8+ years experience as Assistant
Director of Academic Computing Center
Ofiaza, Rizalina DAT 10 - Computer
Fundamentals & Applications (9
Cr Hrs)
B.S., Industrial Engineering Master'squalified in Computer
Information Systems
M.S., Computer Science
Rubin, Eliot ACC 111 - Principles of
Accounting I (4 Cr Hrs)
B.A., Economics Certified Public Accountant Master's qualified in
Accounting
M.B.A., Public Accounting Certified Internal Auditor
Sadler, Anthonette BUS 51 - Business
Organizations and
Management (3 Cr Hrs)
B.S., Business Management/Communications Master's qualified in Business
M.B.A., Business Management
Villa, Daniel ACC 111 - Principles of
Accounting I (4 Cr Hrs)
B.A., Accounting and Economics Certified Public Accountant Master's qualified in
Accounting
M.S., Accountancy Certified Internal Auditor
J.D., Law Certified Financial Forensics
Page 30 of 46
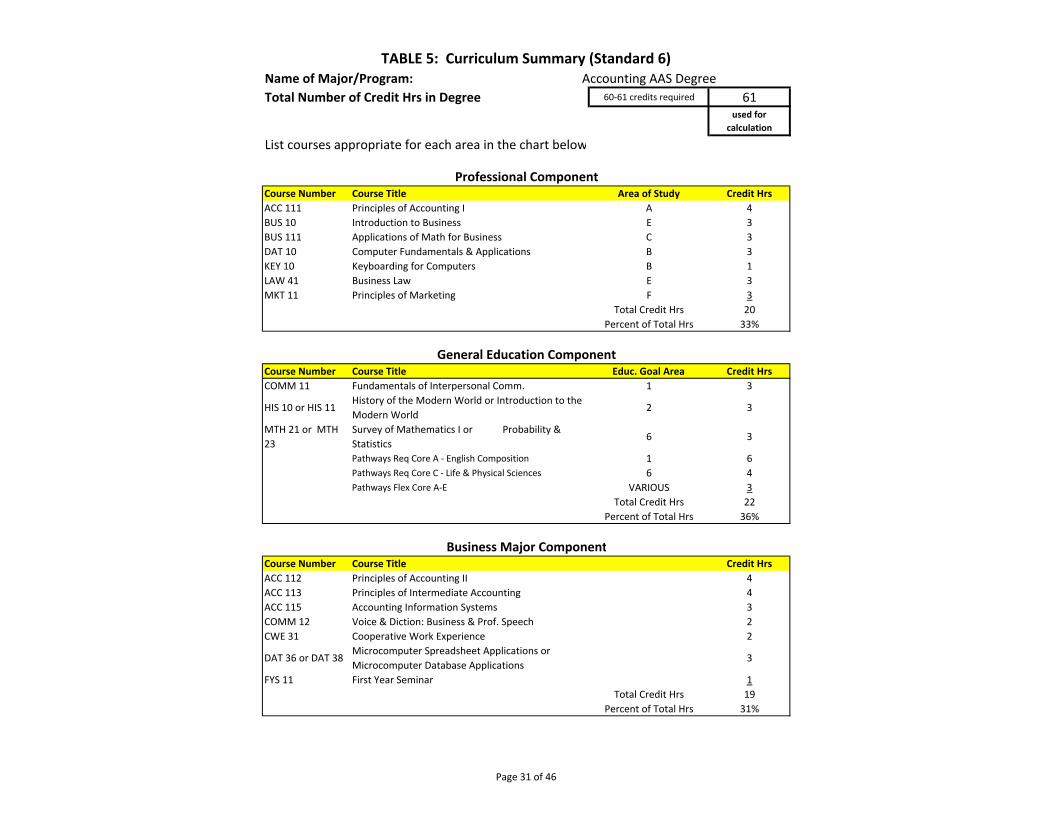
Name of Major/Program: Accounting AAS DegreeTotal Number of Credit Hrs in Degree 60‐61 credits required 61
used for calculation
List courses appropriate for each area in the chart below
Course Number Course Title Area of Study Credit HrsACC 111 Principles of Accounting I A 4BUS 10 Introduction to Business E 3BUS 111 Applications of Math for Business C 3DAT 10 Computer Fundamentals & Applications B 3KEY 10 Keyboarding for Computers B 1LAW 41 Business Law E 3MKT 11 Principles of Marketing F 3
Total Credit Hrs 20Percent of Total Hrs 33%
Course Number Course Title Educ. Goal Area Credit HrsCOMM 11 Fundamentals of Interpersonal Comm. 1 3
HIS 10 or HIS 11History of the Modern World or Introduction to the Modern World
2 3
MTH 21 or MTH 23
Survey of Mathematics I or Probability & Statistics
6 3
Pathways Req Core A ‐ English Composition 1 6Pathways Req Core C ‐ Life & Physical Sciences 6 4Pathways Flex Core A‐E VARIOUS 3
Total Credit Hrs 22Percent of Total Hrs 36%
Course Number Course Title Credit HrsACC 112 Principles of Accounting II 4ACC 113 Principles of Intermediate Accounting 4ACC 115 Accounting Information Systems 3COMM 12 Voice & Diction: Business & Prof. Speech 2CWE 31 Cooperative Work Experience 2
DAT 36 or DAT 38Microcomputer Spreadsheet Applications or Microcomputer Database Applications
3
FYS 11 First Year Seminar 1Total Credit Hrs 19
Percent of Total Hrs 31%
TABLE 5: Curriculum Summary (Standard 6)
Professional Component
General Education Component
Business Major Component
Page 31 of 46
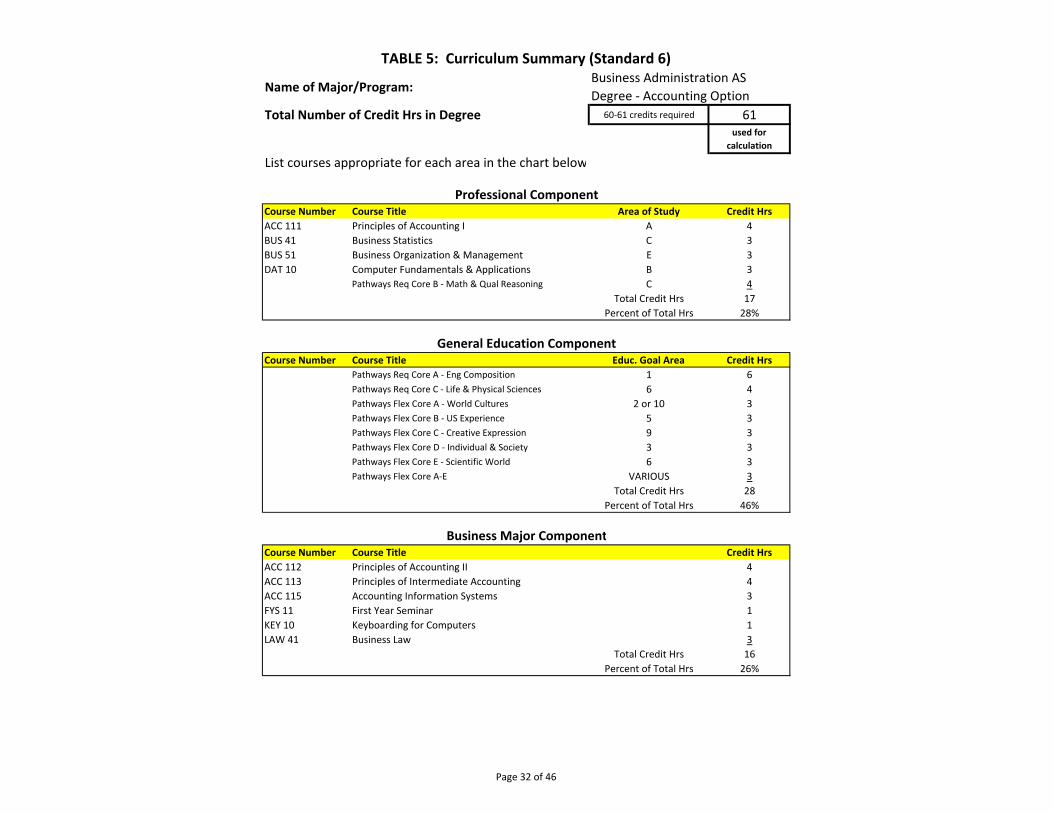
Name of Major/Program:
Total Number of Credit Hrs in Degree 60‐61 credits required 61used for
calculation
List courses appropriate for each area in the chart below
Course Number Course Title Area of Study Credit HrsACC 111 Principles of Accounting I A 4BUS 41 Business Statistics C 3BUS 51 Business Organization & Management E 3DAT 10 Computer Fundamentals & Applications B 3
Pathways Req Core B ‐ Math & Qual Reasoning C 4Total Credit Hrs 17
Percent of Total Hrs 28%
Course Number Course Title Educ. Goal Area Credit HrsPathways Req Core A ‐ Eng Composition 1 6Pathways Req Core C ‐ Life & Physical Sciences 6 4Pathways Flex Core A ‐ World Cultures 2 or 10 3Pathways Flex Core B ‐ US Experience 5 3Pathways Flex Core C ‐ Creative Expression 9 3Pathways Flex Core D ‐ Individual & Society 3 3Pathways Flex Core E ‐ Scientific World 6 3Pathways Flex Core A‐E VARIOUS 3
Total Credit Hrs 28Percent of Total Hrs 46%
Course Number Course Title Credit HrsACC 112 Principles of Accounting II 4ACC 113 Principles of Intermediate Accounting 4ACC 115 Accounting Information Systems 3FYS 11 First Year Seminar 1KEY 10 Keyboarding for Computers 1LAW 41 Business Law 3
Total Credit Hrs 16Percent of Total Hrs 26%
TABLE 5: Curriculum Summary (Standard 6)Business Administration AS Degree ‐ Accounting Option
Professional Component
General Education Component
Business Major Component
Page 32 of 46
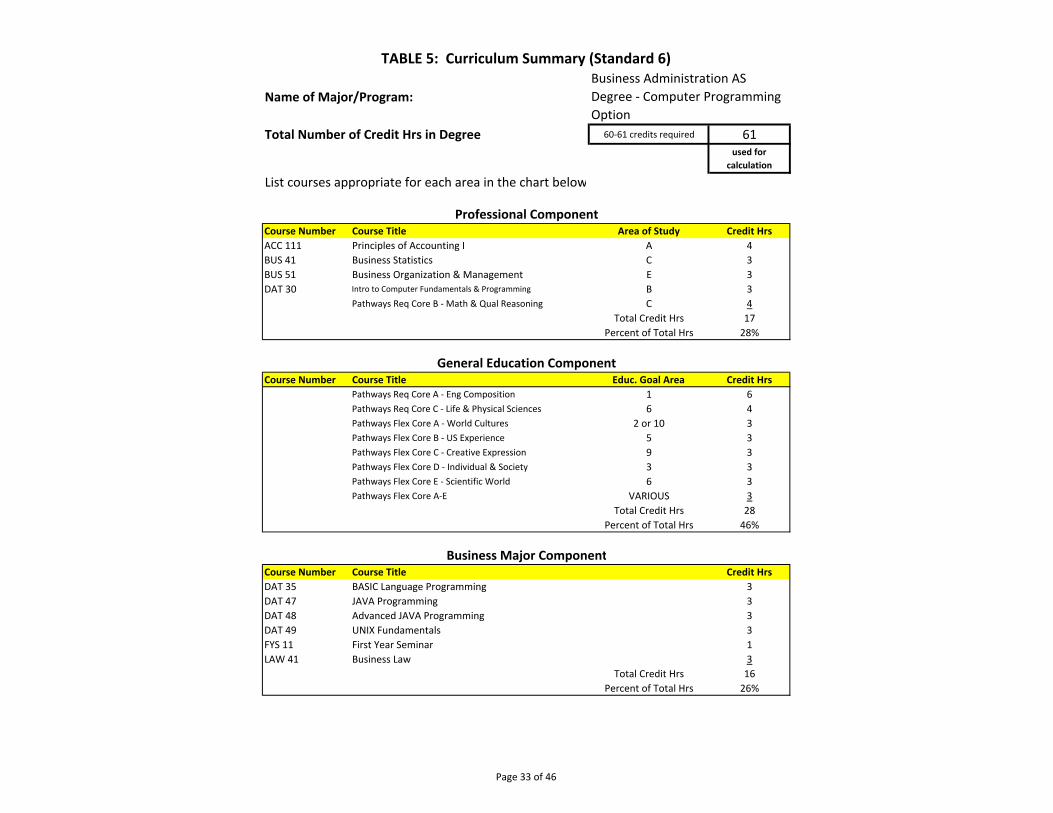
Name of Major/Program:
Total Number of Credit Hrs in Degree 60‐61 credits required 61used for
calculation
List courses appropriate for each area in the chart below
Course Number Course Title Area of Study Credit HrsACC 111 Principles of Accounting I A 4BUS 41 Business Statistics C 3BUS 51 Business Organization & Management E 3DAT 30 Intro to Computer Fundamentals & Programming B 3
Pathways Req Core B ‐ Math & Qual Reasoning C 4Total Credit Hrs 17
Percent of Total Hrs 28%
Course Number Course Title Educ. Goal Area Credit HrsPathways Req Core A ‐ Eng Composition 1 6Pathways Req Core C ‐ Life & Physical Sciences 6 4Pathways Flex Core A ‐ World Cultures 2 or 10 3Pathways Flex Core B ‐ US Experience 5 3Pathways Flex Core C ‐ Creative Expression 9 3Pathways Flex Core D ‐ Individual & Society 3 3Pathways Flex Core E ‐ Scientific World 6 3Pathways Flex Core A‐E VARIOUS 3
Total Credit Hrs 28Percent of Total Hrs 46%
Course Number Course Title Credit HrsDAT 35 BASIC Language Programming 3DAT 47 JAVA Programming 3DAT 48 Advanced JAVA Programming 3DAT 49 UNIX Fundamentals 3FYS 11 First Year Seminar 1LAW 41 Business Law 3
Total Credit Hrs 16Percent of Total Hrs 26%
TABLE 5: Curriculum Summary (Standard 6)Business Administration AS Degree ‐ Computer Programming Option
Professional Component
General Education Component
Business Major Component
Page 33 of 46
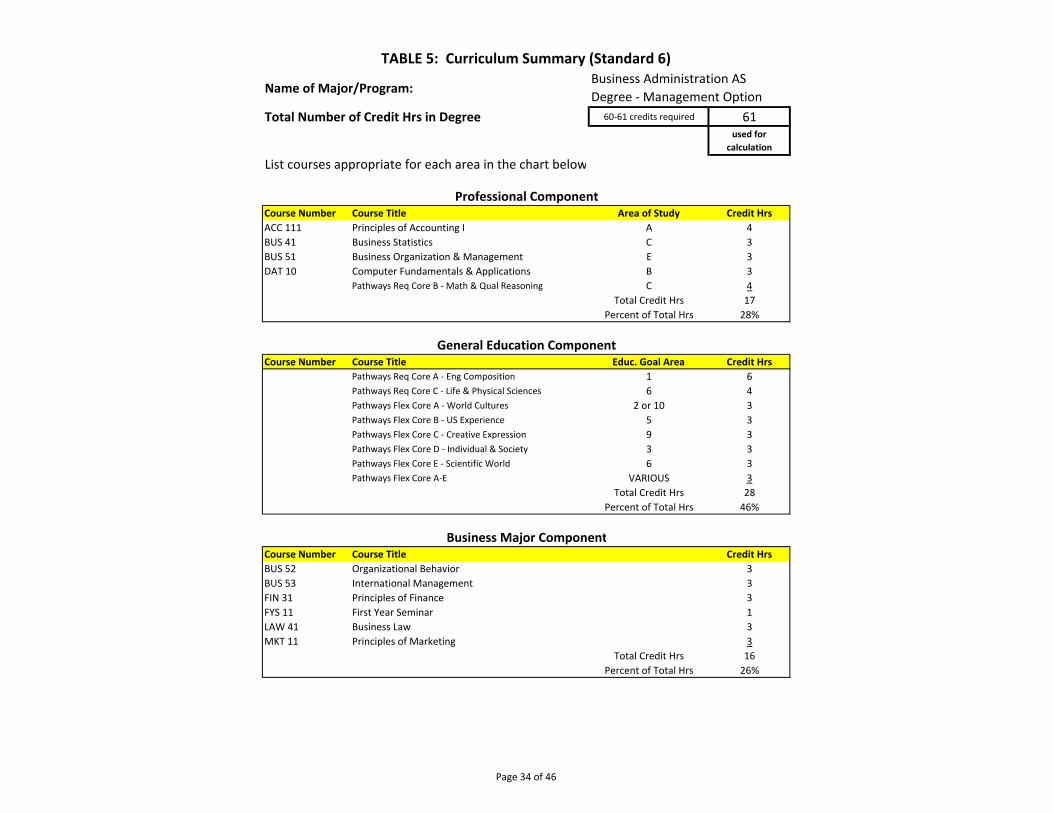
Name of Major/Program:
Total Number of Credit Hrs in Degree 60‐61 credits required 61used for
calculation
List courses appropriate for each area in the chart below
Course Number Course Title Area of Study Credit HrsACC 111 Principles of Accounting I A 4BUS 41 Business Statistics C 3BUS 51 Business Organization & Management E 3DAT 10 Computer Fundamentals & Applications B 3
Pathways Req Core B ‐ Math & Qual Reasoning C 4Total Credit Hrs 17
Percent of Total Hrs 28%
Course Number Course Title Educ. Goal Area Credit HrsPathways Req Core A ‐ Eng Composition 1 6Pathways Req Core C ‐ Life & Physical Sciences 6 4Pathways Flex Core A ‐ World Cultures 2 or 10 3Pathways Flex Core B ‐ US Experience 5 3Pathways Flex Core C ‐ Creative Expression 9 3Pathways Flex Core D ‐ Individual & Society 3 3Pathways Flex Core E ‐ Scientific World 6 3Pathways Flex Core A‐E VARIOUS 3
Total Credit Hrs 28Percent of Total Hrs 46%
Course Number Course Title Credit HrsBUS 52 Organizational Behavior 3BUS 53 International Management 3FIN 31 Principles of Finance 3FYS 11 First Year Seminar 1LAW 41 Business Law 3MKT 11 Principles of Marketing 3
Total Credit Hrs 16Percent of Total Hrs 26%
TABLE 5: Curriculum Summary (Standard 6)Business Administration AS Degree ‐ Management Option
Professional Component
General Education Component
Business Major Component
Page 34 of 46
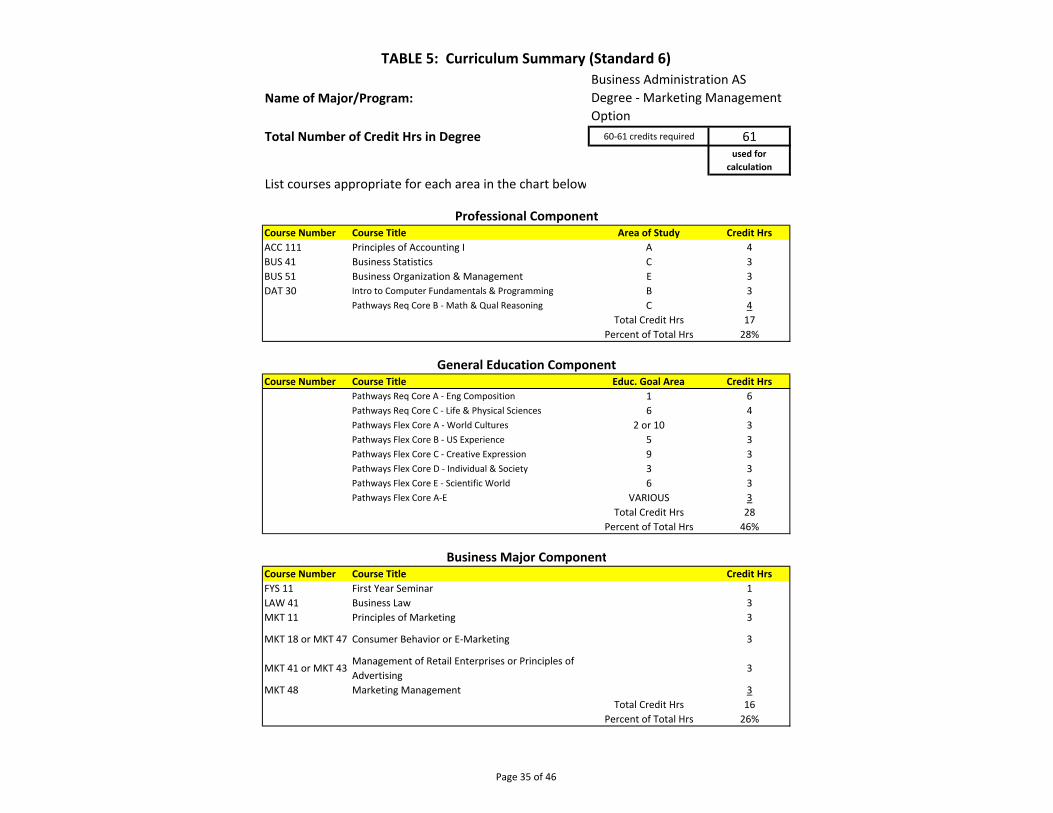
Name of Major/Program:
Total Number of Credit Hrs in Degree 60‐61 credits required 61used for
calculation
List courses appropriate for each area in the chart below
Course Number Course Title Area of Study Credit HrsACC 111 Principles of Accounting I A 4BUS 41 Business Statistics C 3BUS 51 Business Organization & Management E 3DAT 30 Intro to Computer Fundamentals & Programming B 3
Pathways Req Core B ‐ Math & Qual Reasoning C 4Total Credit Hrs 17
Percent of Total Hrs 28%
Course Number Course Title Educ. Goal Area Credit HrsPathways Req Core A ‐ Eng Composition 1 6Pathways Req Core C ‐ Life & Physical Sciences 6 4Pathways Flex Core A ‐ World Cultures 2 or 10 3Pathways Flex Core B ‐ US Experience 5 3Pathways Flex Core C ‐ Creative Expression 9 3Pathways Flex Core D ‐ Individual & Society 3 3Pathways Flex Core E ‐ Scientific World 6 3Pathways Flex Core A‐E VARIOUS 3
Total Credit Hrs 28Percent of Total Hrs 46%
Course Number Course Title Credit HrsFYS 11 First Year Seminar 1LAW 41 Business Law 3MKT 11 Principles of Marketing 3
MKT 18 or MKT 47 Consumer Behavior or E‐Marketing 3
MKT 41 or MKT 43Management of Retail Enterprises or Principles of Advertising
3
MKT 48 Marketing Management 3Total Credit Hrs 16
Percent of Total Hrs 26%
TABLE 5: Curriculum Summary (Standard 6)Business Administration AS Degree ‐ Marketing Management Option
Professional Component
General Education Component
Business Major Component
Page 35 of 46
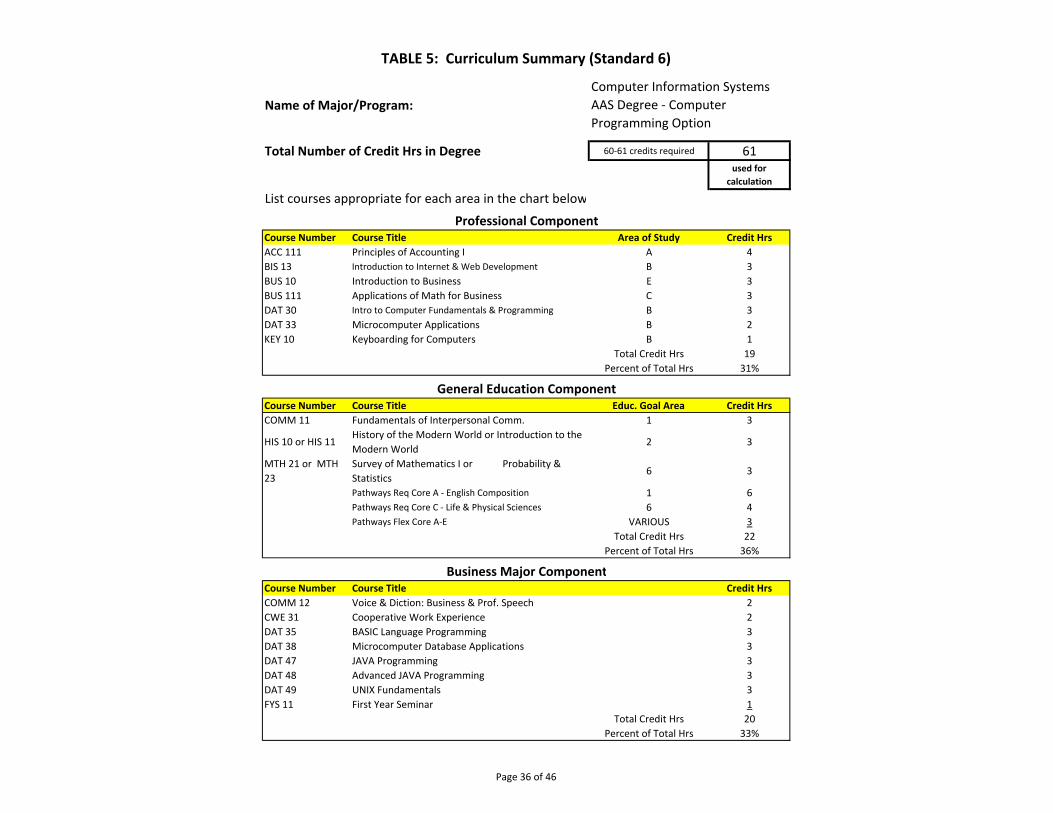
Name of Major/Program:
Total Number of Credit Hrs in Degree 60‐61 credits required 61used for
calculation
List courses appropriate for each area in the chart below
Course Number Course Title Area of Study Credit HrsACC 111 Principles of Accounting I A 4BIS 13 Introduction to Internet & Web Development B 3BUS 10 Introduction to Business E 3BUS 111 Applications of Math for Business C 3DAT 30 Intro to Computer Fundamentals & Programming B 3DAT 33 Microcomputer Applications B 2KEY 10 Keyboarding for Computers B 1
Total Credit Hrs 19Percent of Total Hrs 31%
Course Number Course Title Educ. Goal Area Credit HrsCOMM 11 Fundamentals of Interpersonal Comm. 1 3
HIS 10 or HIS 11History of the Modern World or Introduction to the Modern World
2 3
MTH 21 or MTH 23
Survey of Mathematics I or Probability & Statistics
6 3
Pathways Req Core A ‐ English Composition 1 6Pathways Req Core C ‐ Life & Physical Sciences 6 4Pathways Flex Core A‐E VARIOUS 3
Total Credit Hrs 22Percent of Total Hrs 36%
Course Number Course Title Credit HrsCOMM 12 Voice & Diction: Business & Prof. Speech 2CWE 31 Cooperative Work Experience 2DAT 35 BASIC Language Programming 3DAT 38 Microcomputer Database Applications 3DAT 47 JAVA Programming 3DAT 48 Advanced JAVA Programming 3DAT 49 UNIX Fundamentals 3FYS 11 First Year Seminar 1
Total Credit Hrs 20Percent of Total Hrs 33%
TABLE 5: Curriculum Summary (Standard 6)
Computer Information Systems AAS Degree ‐ Computer Programming Option
Professional Component
General Education Component
Business Major Component
Page 36 of 46
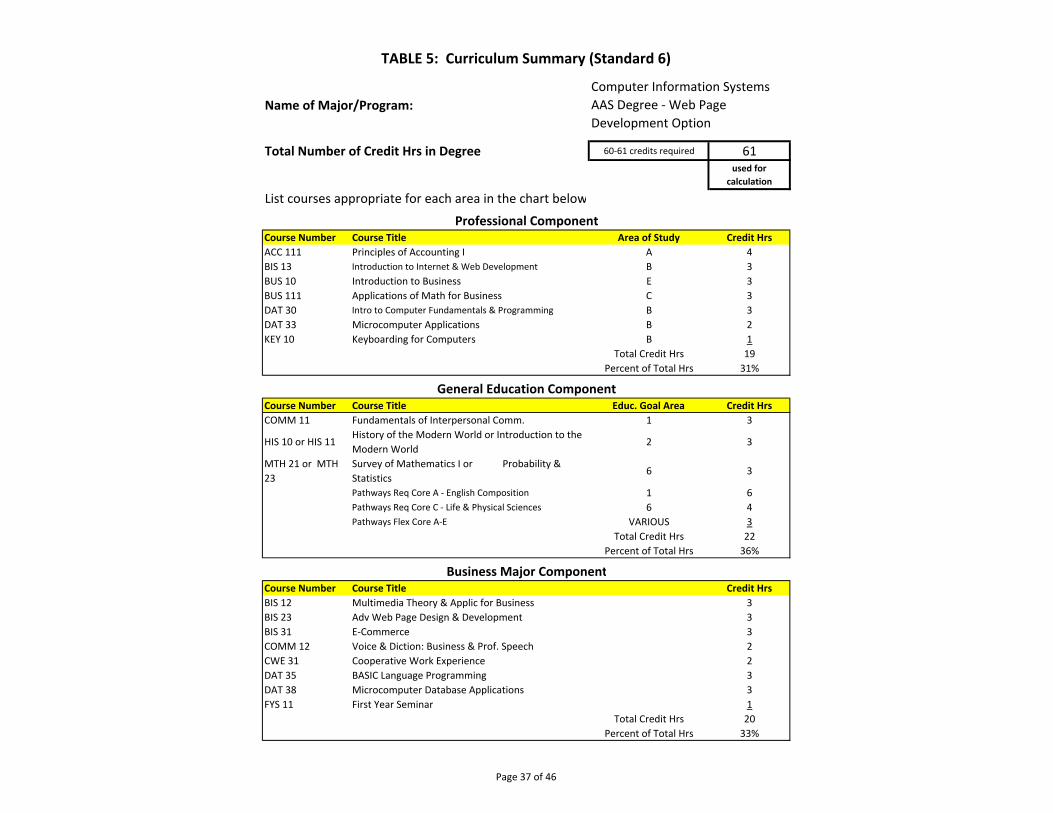
Name of Major/Program:
Total Number of Credit Hrs in Degree 60‐61 credits required 61used for
calculation
List courses appropriate for each area in the chart below
Course Number Course Title Area of Study Credit HrsACC 111 Principles of Accounting I A 4BIS 13 Introduction to Internet & Web Development B 3BUS 10 Introduction to Business E 3BUS 111 Applications of Math for Business C 3DAT 30 Intro to Computer Fundamentals & Programming B 3DAT 33 Microcomputer Applications B 2KEY 10 Keyboarding for Computers B 1
Total Credit Hrs 19Percent of Total Hrs 31%
Course Number Course Title Educ. Goal Area Credit HrsCOMM 11 Fundamentals of Interpersonal Comm. 1 3
HIS 10 or HIS 11History of the Modern World or Introduction to the Modern World
2 3
MTH 21 or MTH 23
Survey of Mathematics I or Probability & Statistics
6 3
Pathways Req Core A ‐ English Composition 1 6Pathways Req Core C ‐ Life & Physical Sciences 6 4Pathways Flex Core A‐E VARIOUS 3
Total Credit Hrs 22Percent of Total Hrs 36%
Course Number Course Title Credit HrsBIS 12 Multimedia Theory & Applic for Business 3BIS 23 Adv Web Page Design & Development 3BIS 31 E‐Commerce 3COMM 12 Voice & Diction: Business & Prof. Speech 2CWE 31 Cooperative Work Experience 2DAT 35 BASIC Language Programming 3DAT 38 Microcomputer Database Applications 3FYS 11 First Year Seminar 1
Total Credit Hrs 20Percent of Total Hrs 33%
TABLE 5: Curriculum Summary (Standard 6)
Computer Information Systems AAS Degree ‐ Web Page Development Option
Professional Component
General Education Component
Business Major Component
Page 37 of 46
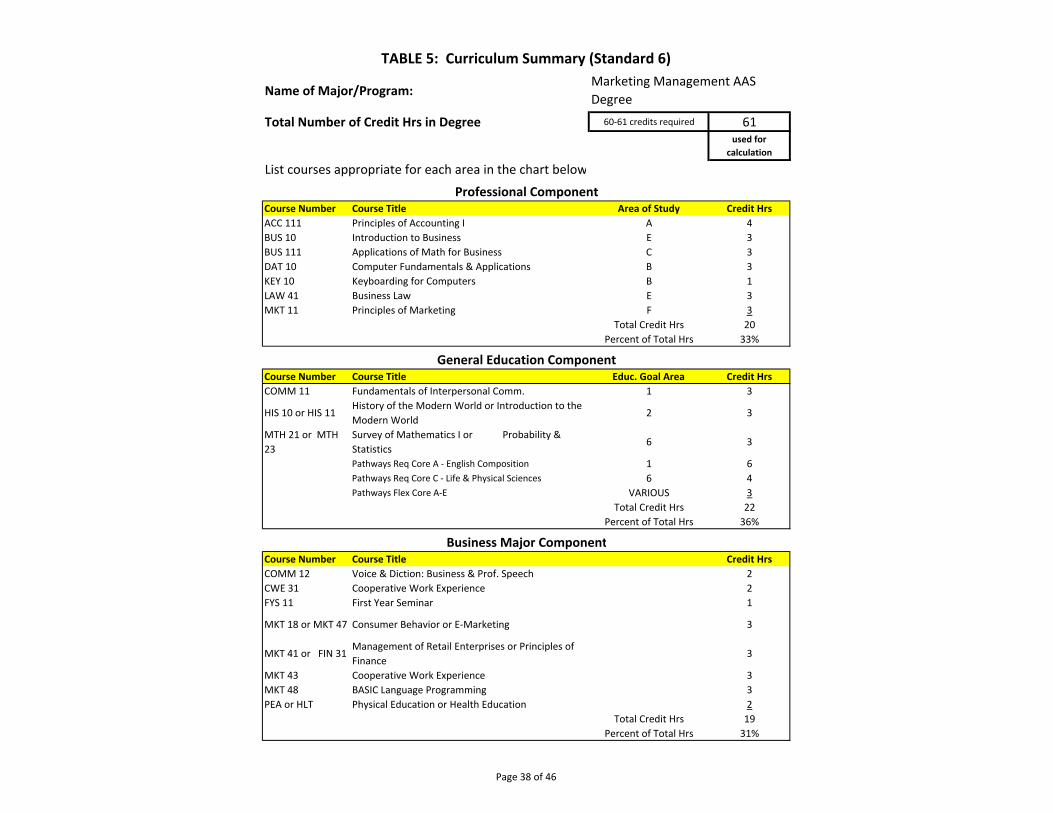
Name of Major/Program:
Total Number of Credit Hrs in Degree 60‐61 credits required 61used for
calculation
List courses appropriate for each area in the chart below
Course Number Course Title Area of Study Credit HrsACC 111 Principles of Accounting I A 4BUS 10 Introduction to Business E 3BUS 111 Applications of Math for Business C 3DAT 10 Computer Fundamentals & Applications B 3KEY 10 Keyboarding for Computers B 1LAW 41 Business Law E 3MKT 11 Principles of Marketing F 3
Total Credit Hrs 20Percent of Total Hrs 33%
Course Number Course Title Educ. Goal Area Credit HrsCOMM 11 Fundamentals of Interpersonal Comm. 1 3
HIS 10 or HIS 11History of the Modern World or Introduction to the Modern World
2 3
MTH 21 or MTH 23
Survey of Mathematics I or Probability & Statistics
6 3
Pathways Req Core A ‐ English Composition 1 6Pathways Req Core C ‐ Life & Physical Sciences 6 4Pathways Flex Core A‐E VARIOUS 3
Total Credit Hrs 22Percent of Total Hrs 36%
Course Number Course Title Credit HrsCOMM 12 Voice & Diction: Business & Prof. Speech 2CWE 31 Cooperative Work Experience 2FYS 11 First Year Seminar 1
MKT 18 or MKT 47 Consumer Behavior or E‐Marketing 3
MKT 41 or FIN 31Management of Retail Enterprises or Principles of Finance
3
MKT 43 Cooperative Work Experience 3MKT 48 BASIC Language Programming 3PEA or HLT Physical Education or Health Education 2
Total Credit Hrs 19Percent of Total Hrs 31%
TABLE 5: Curriculum Summary (Standard 6)Marketing Management AAS Degree
Professional Component
General Education Component
Business Major Component
Page 38 of 46
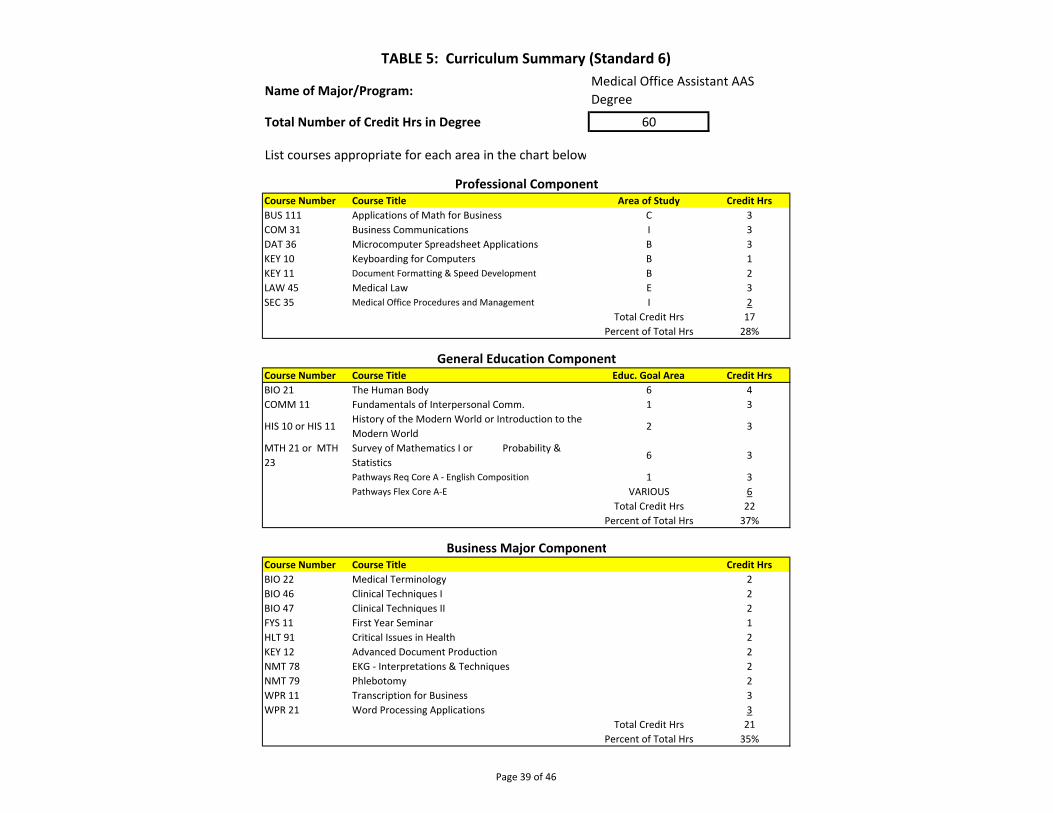
Name of Major/Program:
Total Number of Credit Hrs in Degree 60
List courses appropriate for each area in the chart below
Course Number Course Title Area of Study Credit HrsBUS 111 Applications of Math for Business C 3COM 31 Business Communications I 3DAT 36 Microcomputer Spreadsheet Applications B 3KEY 10 Keyboarding for Computers B 1KEY 11 Document Formatting & Speed Development B 2LAW 45 Medical Law E 3SEC 35 Medical Office Procedures and Management I 2
Total Credit Hrs 17Percent of Total Hrs 28%
Course Number Course Title Educ. Goal Area Credit HrsBIO 21 The Human Body 6 4COMM 11 Fundamentals of Interpersonal Comm. 1 3
HIS 10 or HIS 11History of the Modern World or Introduction to the Modern World
2 3
MTH 21 or MTH 23
Survey of Mathematics I or Probability & Statistics
6 3
Pathways Req Core A ‐ English Composition 1 3Pathways Flex Core A‐E VARIOUS 6
Total Credit Hrs 22Percent of Total Hrs 37%
Course Number Course Title Credit HrsBIO 22 Medical Terminology 2BIO 46 Clinical Techniques I 2BIO 47 Clinical Techniques II 2FYS 11 First Year Seminar 1HLT 91 Critical Issues in Health 2KEY 12 Advanced Document Production 2NMT 78 EKG ‐ Interpretations & Techniques 2NMT 79 Phlebotomy 2WPR 11 Transcription for Business 3WPR 21 Word Processing Applications 3
Total Credit Hrs 21Percent of Total Hrs 35%
TABLE 5: Curriculum Summary (Standard 6)Medical Office Assistant AAS Degree
Professional Component
General Education Component
Business Major Component
Page 39 of 46
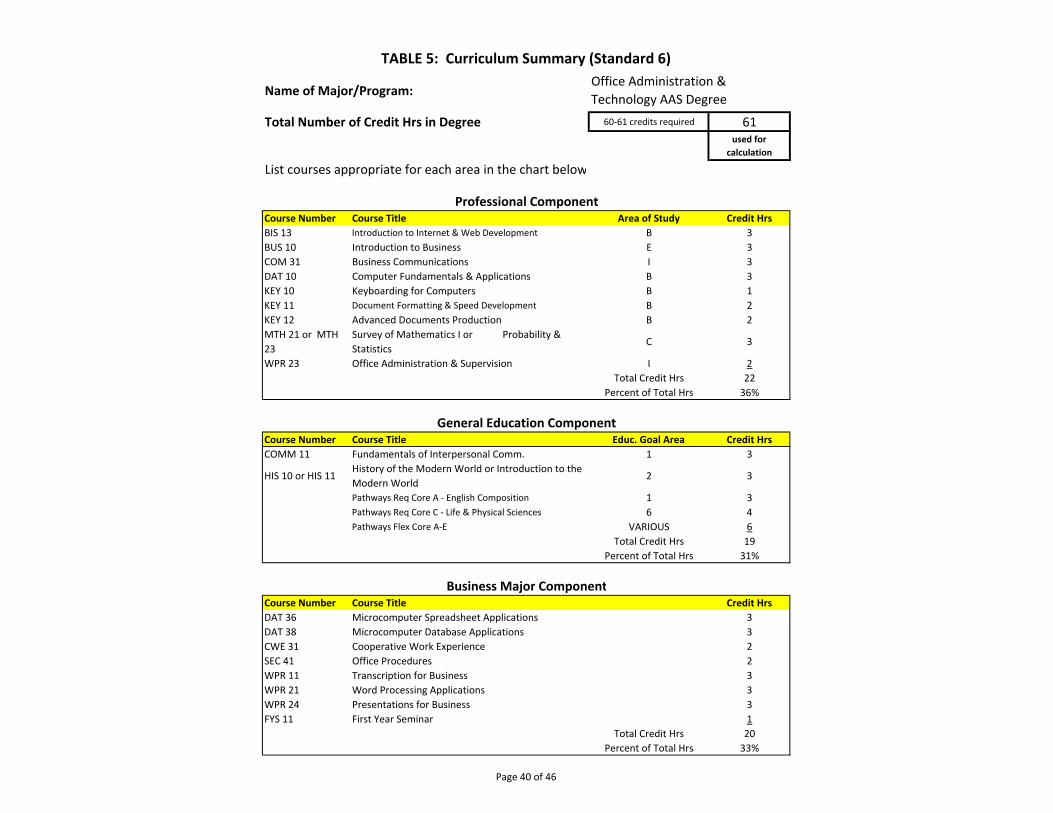
Name of Major/Program:
Total Number of Credit Hrs in Degree 60‐61 credits required 61used for
calculation
List courses appropriate for each area in the chart below
Course Number Course Title Area of Study Credit HrsBIS 13 Introduction to Internet & Web Development B 3BUS 10 Introduction to Business E 3COM 31 Business Communications I 3DAT 10 Computer Fundamentals & Applications B 3KEY 10 Keyboarding for Computers B 1KEY 11 Document Formatting & Speed Development B 2KEY 12 Advanced Documents Production B 2MTH 21 or MTH 23
Survey of Mathematics I or Probability & Statistics
C 3
WPR 23 Office Administration & Supervision I 2Total Credit Hrs 22
Percent of Total Hrs 36%
Course Number Course Title Educ. Goal Area Credit HrsCOMM 11 Fundamentals of Interpersonal Comm. 1 3
HIS 10 or HIS 11History of the Modern World or Introduction to the Modern World
2 3
Pathways Req Core A ‐ English Composition 1 3Pathways Req Core C ‐ Life & Physical Sciences 6 4Pathways Flex Core A‐E VARIOUS 6
Total Credit Hrs 19Percent of Total Hrs 31%
Course Number Course Title Credit HrsDAT 36 Microcomputer Spreadsheet Applications 3DAT 38 Microcomputer Database Applications 3CWE 31 Cooperative Work Experience 2SEC 41 Office Procedures 2WPR 11 Transcription for Business 3WPR 21 Word Processing Applications 3WPR 24 Presentations for Business 3FYS 11 First Year Seminar 1
Total Credit Hrs 20Percent of Total Hrs 33%
Office Administration & Technology AAS Degree
Professional Component
General Education Component
Business Major Component
TABLE 5: Curriculum Summary (Standard 6)
Page 40 of 46
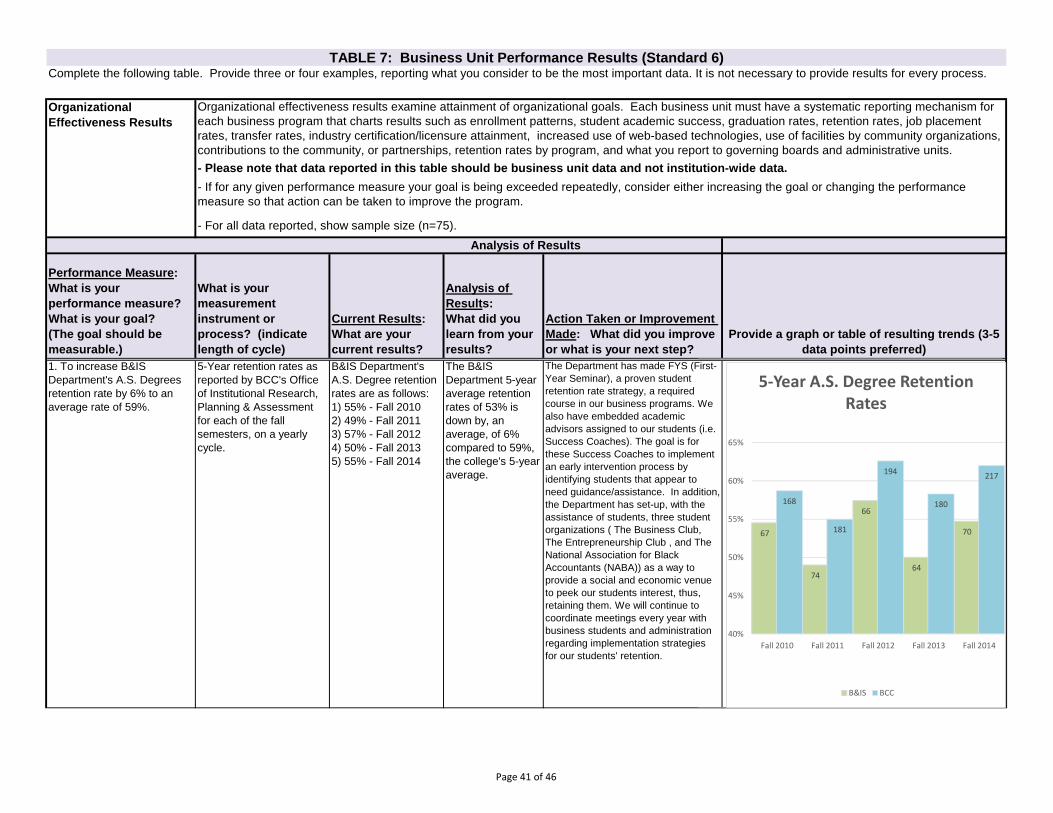
Organizational
Effectiveness Results
Performance Measure:
What is your
performance measure?
What is your goal?
(The goal should be
measurable.)
What is your
measurement
instrument or
process? (indicate
length of cycle)
Current Results:
What are your
current results?
Analysis of
Results:
What did you
learn from your
results?
Action Taken or Improvement
Made: What did you improve
or what is your next step?
Provide a graph or table of resulting trends (3-5
data points preferred)
1. To increase B&IS
Department's A.S. Degrees
retention rate by 6% to an
average rate of 59%.
5-Year retention rates as
reported by BCC's Office
of Institutional Research,
Planning & Assessment
for each of the fall
semesters, on a yearly
cycle.
B&IS Department's
A.S. Degree retention
rates are as follows:
1) 55% - Fall 2010
2) 49% - Fall 2011
3) 57% - Fall 2012
4) 50% - Fall 2013
5) 55% - Fall 2014
The B&IS
Department 5-year
average retention
rates of 53% is
down by, an
average, of 6%
compared to 59%,
the college's 5-year
average.
The Department has made FYS (First-
Year Seminar), a proven student
retention rate strategy, a required
course in our business programs. We
also have embedded academic
advisors assigned to our students (i.e.
Success Coaches). The goal is for
these Success Coaches to implement
an early intervention process by
identifying students that appear to
need guidance/assistance. In addition,
the Department has set-up, with the
assistance of students, three student
organizations ( The Business Club,
The Entrepreneurship Club , and The
National Association for Black
Accountants (NABA)) as a way to
provide a social and economic venue
to peek our students interest, thus,
retaining them. We will continue to
coordinate meetings every year with
business students and administration
regarding implementation strategies
for our students' retention.
Analysis of Results
TABLE 7: Business Unit Performance Results (Standard 6)Complete the following table. Provide three or four examples, reporting what you consider to be the most important data. It is not necessary to provide results for every process.
Organizational effectiveness results examine attainment of organizational goals. Each business unit must have a systematic reporting mechanism for
each business program that charts results such as enrollment patterns, student academic success, graduation rates, retention rates, job placement
rates, transfer rates, industry certification/licensure attainment, increased use of web-based technologies, use of facilities by community organizations,
contributions to the community, or partnerships, retention rates by program, and what you report to governing boards and administrative units.
- Please note that data reported in this table should be business unit data and not institution-wide data.
- If for any given performance measure your goal is being exceeded repeatedly, consider either increasing the goal or changing the performance
measure so that action can be taken to improve the program.
- For all data reported, show sample size (n=75).
67
74
66
64
70
168
181
194
180
217
40%
45%
50%
55%
60%
65%
Fall 2010 Fall 2011 Fall 2012 Fall 2013 Fall 2014
5‐Year A.S. Degree Retention Rates
B&IS BCC
Page 41 of 46
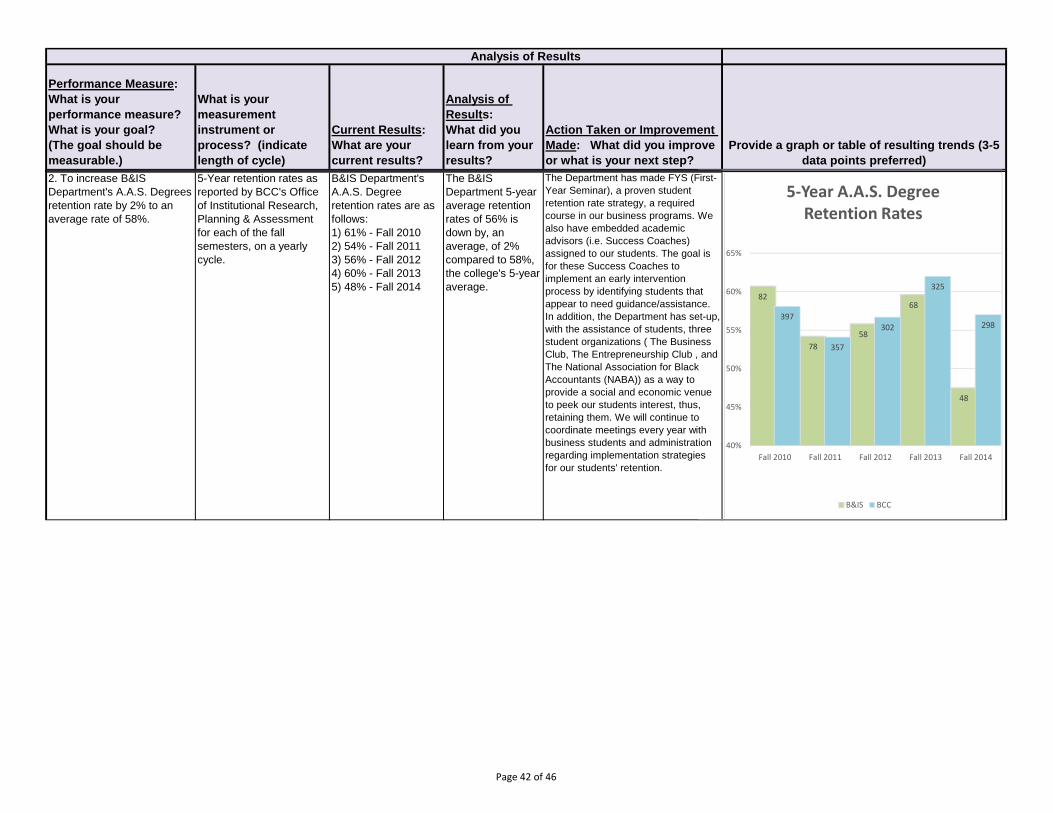
Performance Measure:
What is your
performance measure?
What is your goal?
(The goal should be
measurable.)
What is your
measurement
instrument or
process? (indicate
length of cycle)
Current Results:
What are your
current results?
Analysis of
Results:
What did you
learn from your
results?
Action Taken or Improvement
Made: What did you improve
or what is your next step?
Provide a graph or table of resulting trends (3-5
data points preferred)
Analysis of Results
2. To increase B&IS
Department's A.A.S. Degrees
retention rate by 2% to an
average rate of 58%.
5-Year retention rates as
reported by BCC's Office
of Institutional Research,
Planning & Assessment
for each of the fall
semesters, on a yearly
cycle.
B&IS Department's
A.A.S. Degree
retention rates are as
follows:
1) 61% - Fall 2010
2) 54% - Fall 2011
3) 56% - Fall 2012
4) 60% - Fall 2013
5) 48% - Fall 2014
The B&IS
Department 5-year
average retention
rates of 56% is
down by, an
average, of 2%
compared to 58%,
the college's 5-year
average.
The Department has made FYS (First-
Year Seminar), a proven student
retention rate strategy, a required
course in our business programs. We
also have embedded academic
advisors (i.e. Success Coaches)
assigned to our students. The goal is
for these Success Coaches to
implement an early intervention
process by identifying students that
appear to need guidance/assistance.
In addition, the Department has set-up,
with the assistance of students, three
student organizations ( The Business
Club, The Entrepreneurship Club , and
The National Association for Black
Accountants (NABA)) as a way to
provide a social and economic venue
to peek our students interest, thus,
retaining them. We will continue to
coordinate meetings every year with
business students and administration
regarding implementation strategies
for our students' retention.
82
7858
68
48
397
357
302
325
298
40%
45%
50%
55%
60%
65%
Fall 2010 Fall 2011 Fall 2012 Fall 2013 Fall 2014
5‐Year A.A.S. Degree Retention Rates
B&IS BCC
Page 42 of 46
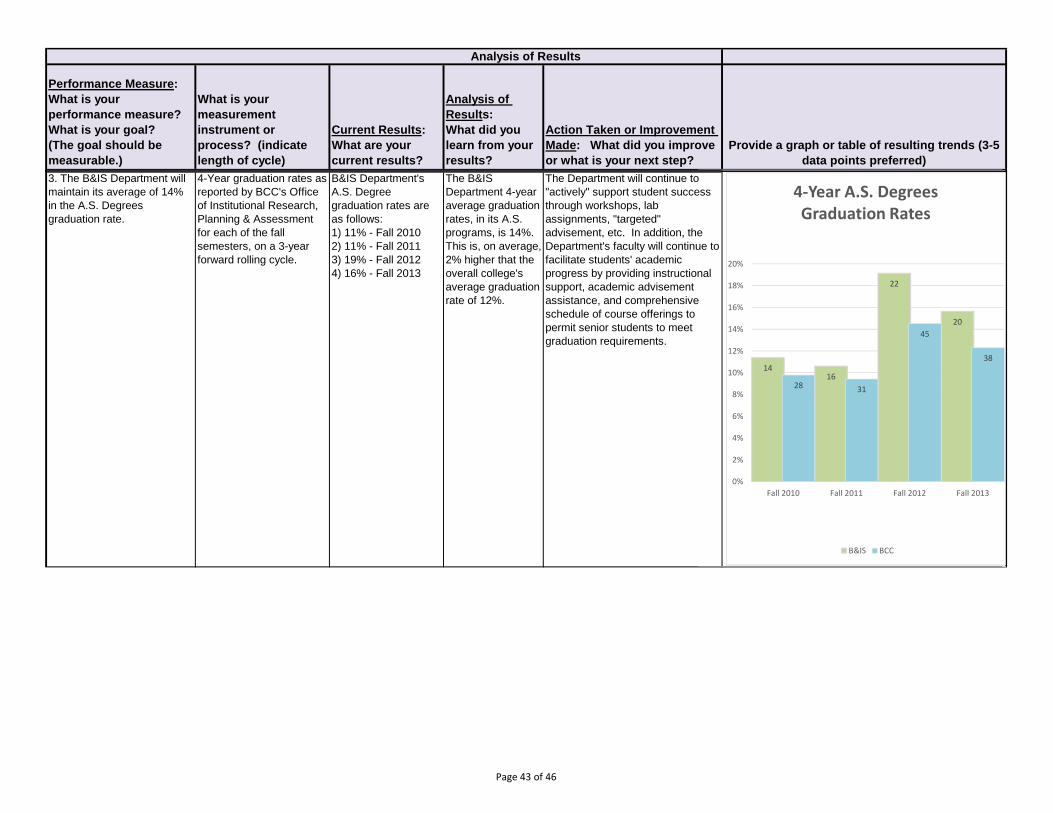
Performance Measure:
What is your
performance measure?
What is your goal?
(The goal should be
measurable.)
What is your
measurement
instrument or
process? (indicate
length of cycle)
Current Results:
What are your
current results?
Analysis of
Results:
What did you
learn from your
results?
Action Taken or Improvement
Made: What did you improve
or what is your next step?
Provide a graph or table of resulting trends (3-5
data points preferred)
Analysis of Results
3. The B&IS Department will
maintain its average of 14%
in the A.S. Degrees
graduation rate.
4-Year graduation rates as
reported by BCC's Office
of Institutional Research,
Planning & Assessment
for each of the fall
semesters, on a 3-year
forward rolling cycle.
B&IS Department's
A.S. Degree
graduation rates are
as follows:
1) 11% - Fall 2010
2) 11% - Fall 2011
3) 19% - Fall 2012
4) 16% - Fall 2013
The B&IS
Department 4-year
average graduation
rates, in its A.S.
programs, is 14%.
This is, on average,
2% higher that the
overall college's
average graduation
rate of 12%.
The Department will continue to
"actively" support student success
through workshops, lab
assignments, "targeted"
advisement, etc. In addition, the
Department's faculty will continue to
facilitate students' academic
progress by providing instructional
support, academic advisement
assistance, and comprehensive
schedule of course offerings to
permit senior students to meet
graduation requirements.
1416
22
20
28 31
45
38
0%
2%
4%
6%
8%
10%
12%
14%
16%
18%
20%
Fall 2010 Fall 2011 Fall 2012 Fall 2013
4‐Year A.S. Degrees Graduation Rates
B&IS BCC
Page 43 of 46
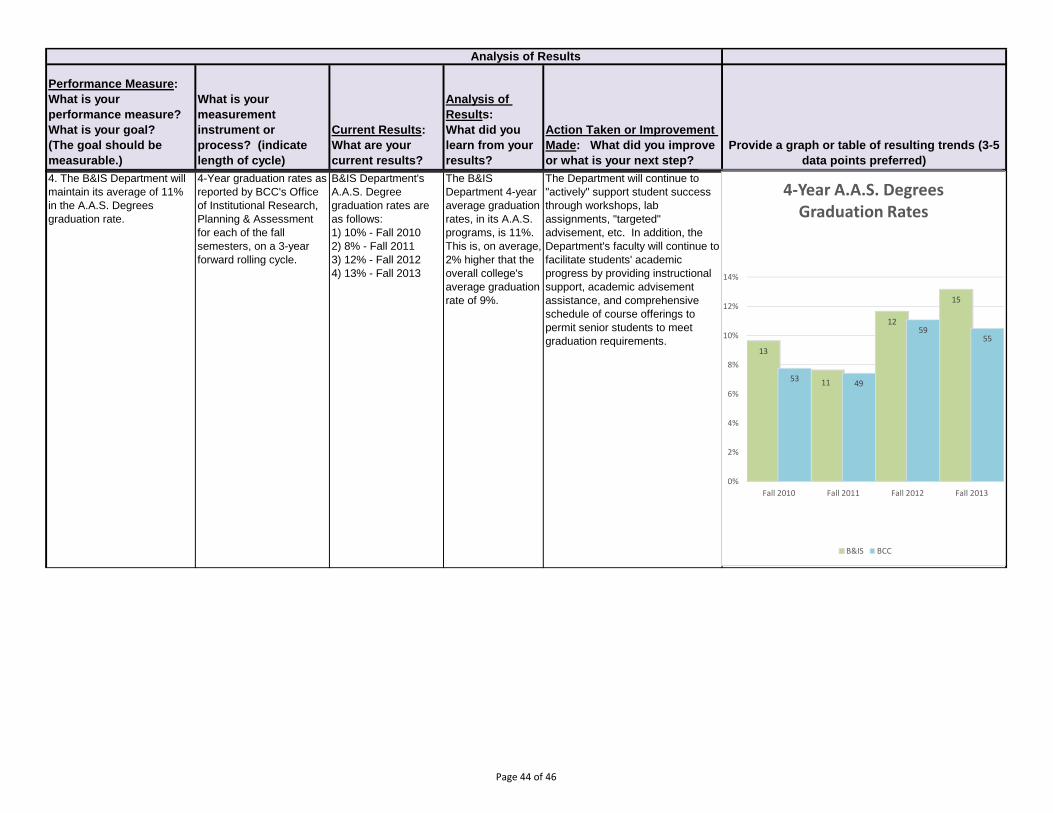
Performance Measure:
What is your
performance measure?
What is your goal?
(The goal should be
measurable.)
What is your
measurement
instrument or
process? (indicate
length of cycle)
Current Results:
What are your
current results?
Analysis of
Results:
What did you
learn from your
results?
Action Taken or Improvement
Made: What did you improve
or what is your next step?
Provide a graph or table of resulting trends (3-5
data points preferred)
Analysis of Results
4. The B&IS Department will
maintain its average of 11%
in the A.A.S. Degrees
graduation rate.
4-Year graduation rates as
reported by BCC's Office
of Institutional Research,
Planning & Assessment
for each of the fall
semesters, on a 3-year
forward rolling cycle.
B&IS Department's
A.A.S. Degree
graduation rates are
as follows:
1) 10% - Fall 2010
2) 8% - Fall 2011
3) 12% - Fall 2012
4) 13% - Fall 2013
The B&IS
Department 4-year
average graduation
rates, in its A.A.S.
programs, is 11%.
This is, on average,
2% higher that the
overall college's
average graduation
rate of 9%.
The Department will continue to
"actively" support student success
through workshops, lab
assignments, "targeted"
advisement, etc. In addition, the
Department's faculty will continue to
facilitate students' academic
progress by providing instructional
support, academic advisement
assistance, and comprehensive
schedule of course offerings to
permit senior students to meet
graduation requirements.13
11
12
15
53 49
5955
0%
2%
4%
6%
8%
10%
12%
14%
Fall 2010 Fall 2011 Fall 2012 Fall 2013
4‐Year A.A.S. Degrees Graduation Rates
B&IS BCC
Page 44 of 46
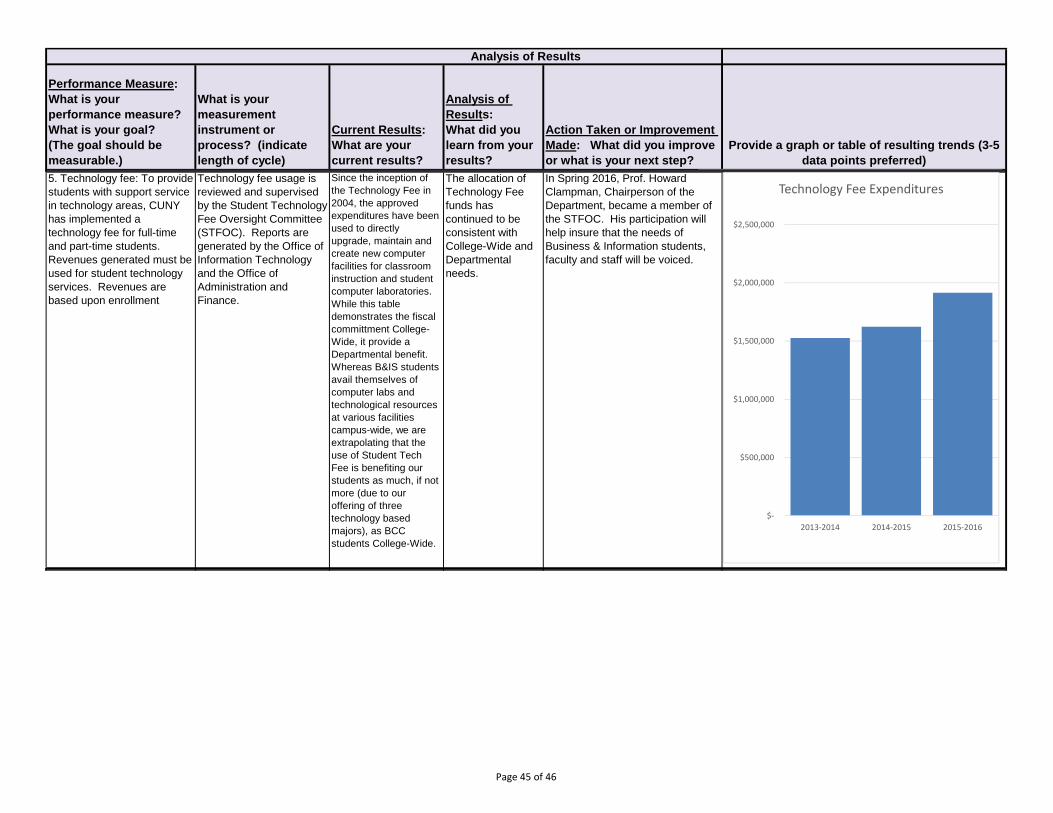
Performance Measure:
What is your
performance measure?
What is your goal?
(The goal should be
measurable.)
What is your
measurement
instrument or
process? (indicate
length of cycle)
Current Results:
What are your
current results?
Analysis of
Results:
What did you
learn from your
results?
Action Taken or Improvement
Made: What did you improve
or what is your next step?
Provide a graph or table of resulting trends (3-5
data points preferred)
Analysis of Results
5. Technology fee: To provide
students with support service
in technology areas, CUNY
has implemented a
technology fee for full-time
and part-time students.
Revenues generated must be
used for student technology
services. Revenues are
based upon enrollment
Technology fee usage is
reviewed and supervised
by the Student Technology
Fee Oversight Committee
(STFOC). Reports are
generated by the Office of
Information Technology
and the Office of
Administration and
Finance.
Since the inception of
the Technology Fee in
2004, the approved
expenditures have been
used to directly
upgrade, maintain and
create new computer
facilities for classroom
instruction and student
computer laboratories.
While this table
demonstrates the fiscal
committment College-
Wide, it provide a
Departmental benefit.
Whereas B&IS students
avail themselves of
computer labs and
technological resources
at various facilities
campus-wide, we are
extrapolating that the
use of Student Tech
Fee is benefiting our
students as much, if not
more (due to our
offering of three
technology based
majors), as BCC
students College-Wide.
The allocation of
Technology Fee
funds has
continued to be
consistent with
College-Wide and
Departmental
needs.
In Spring 2016, Prof. Howard
Clampman, Chairperson of the
Department, became a member of
the STFOC. His participation will
help insure that the needs of
Business & Information students,
faculty and staff will be voiced.
$‐
$500,000
$1,000,000
$1,500,000
$2,000,000
$2,500,000
2013‐2014 2014‐2015 2015‐2016
Technology Fee Expenditures
Page 45 of 46
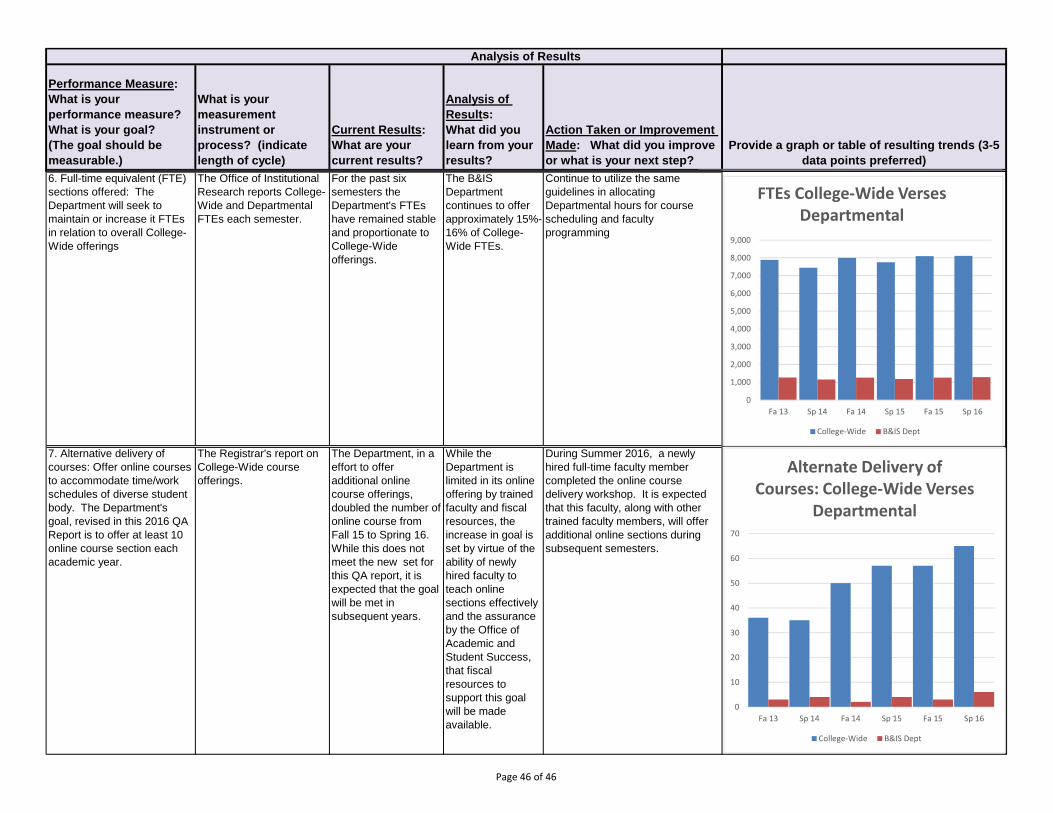
Performance Measure:
What is your
performance measure?
What is your goal?
(The goal should be
measurable.)
What is your
measurement
instrument or
process? (indicate
length of cycle)
Current Results:
What are your
current results?
Analysis of
Results:
What did you
learn from your
results?
Action Taken or Improvement
Made: What did you improve
or what is your next step?
Provide a graph or table of resulting trends (3-5
data points preferred)
Analysis of Results
6. Full-time equivalent (FTE)
sections offered: The
Department will seek to
maintain or increase it FTEs
in relation to overall College-
Wide offerings
The Office of Institutional
Research reports College-
Wide and Departmental
FTEs each semester.
For the past six
semesters the
Department's FTEs
have remained stable
and proportionate to
College-Wide
offerings.
The B&IS
Department
continues to offer
approximately 15%-
16% of College-
Wide FTEs.
Continue to utilize the same
guidelines in allocating
Departmental hours for course
scheduling and faculty
programming
7. Alternative delivery of
courses: Offer online courses
to accommodate time/work
schedules of diverse student
body. The Department's
goal, revised in this 2016 QA
Report is to offer at least 10
online course section each
academic year.
The Registrar's report on
College-Wide course
offerings.
The Department, in a
effort to offer
additional online
course offerings,
doubled the number of
online course from
Fall 15 to Spring 16.
While this does not
meet the new set for
this QA report, it is
expected that the goal
will be met in
subsequent years.
While the
Department is
limited in its online
offering by trained
faculty and fiscal
resources, the
increase in goal is
set by virtue of the
ability of newly
hired faculty to
teach online
sections effectively
and the assurance
by the Office of
Academic and
Student Success,
that fiscal
resources to
support this goal
will be made
available.
During Summer 2016, a newly
hired full-time faculty member
completed the online course
delivery workshop. It is expected
that this faculty, along with other
trained faculty members, will offer
additional online sections during
subsequent semesters.
0
10
20
30
40
50
60
70
Fa 13 Sp 14 Fa 14 Sp 15 Fa 15 Sp 16
Alternate Delivery of Courses: College‐Wide Verses
Departmental
College‐Wide B&IS Dept
0
1,000
2,000
3,000
4,000
5,000
6,000
7,000
8,000
9,000
Fa 13 Sp 14 Fa 14 Sp 15 Fa 15 Sp 16
FTEs College‐Wide Verses Departmental
College‐Wide B&IS Dept
Page 46 of 46
&ƌŽŵ ƌĞƉŽƌƚƐΛĂĐďƐƉŽƌŐ^ĞŶƚ dƵĞƐĚĂLJ:ĂŶƵĂƌLJϯϮϬϭϳϭϭϯϱDdŽ ΖŚŽǁĂƌĚĐůĂŵƉŵĂŶΛďĐĐĐƵŶLJĞĚƵΖфŚŽǁĂƌĚĐůĂŵƉŵĂŶΛďĐĐĐƵŶLJĞĚƵхĐ ΖƌŽƐĞŵĂƌLJƋƵŝŶŶΛďĐĐĐƵŶLJĞĚƵΖфƌŽƐĞŵĂƌLJƋƵŝŶŶΛďĐĐĐƵŶLJĞĚƵхŝĂŶĂ,ĂůůĞƌƵĚфĚŝĂŶĂŚĂůůĞƌƵĚΛĂĐďƐƉŽƌŐхΖĂƌŝ,ƵŶnjŝŬĞƌΖфĐŚƵŶnjŝŬĞƌΛĂĐďƐƉŽƌŐх^ƵďũĞĐƚ ^WY&ĞĞĚďĂĐŬϮϬϭϲƌŽŶdžŽŵŵƵŶŝƚLJŽůůĞŐĞͲ hEz/ŵƉŽƌƚĂŶĐĞ ,ŝŐŚĞĂƌ,ŽǁĂƌĚzŽƵƌŶĞdžƚYƌĞƉŽƌƚŝƐĚƵĞϵϭϱϮϬϭϴzŽƵƌƌĞĂĨĨŝƌŵĂƚŝŽŶŝƐĚƵĞϮϬϭϰdŚĞďŽĂƌĚŽĨĐŽŵŵŝƐƐŝŽŶĞƌƐŵĞĞƚEŽǀĞŵďĞƌϭϱϮϬϭϲĂŶĚƉƌŽǀŝĚĞĚƚŚĞĨŽůůŽǁŝŶŐĨĞĞĚďĂĐŬdŚĞďŽĂƌĚŽĨĐŽŵŵŝƐƐŝŽŶĞƌƐŝĚĞŶƚŝĨŝĞĚLJŽƵƌƉƌŽĐĞƐƐĂƐĂďĞƐƚƉƌĂĐƚŝĐĞĨŽƌ^ƚĂŶĚĂƌĚϰͲ ^ƚĂŶĚĂƌĚϰDĞĂƐƵƌĞŵĞŶƚĂŶĚŶĂůLJƐŝƐŽĨ^ƚƵĚĞŶƚ>ĞĂƌŶŝŶŐĂŶĚWĞƌĨŽƌŵĂŶĐĞ
^ƚĂŶĚĂƌĚϰKǀĞƌĂůůĂŶĞdžĐĞůůĞŶƚũŽďŝŶĚĞĨŝŶŝŶŐŐŽĂůƐĂŶĚŵĞĂƐƵƌĂďůĞŽƵƚĐŽŵĞƐ WůĞĂƐĞŵĂŬĞƐƵƌĞƚŽŝŶĐůƵĚĞƚŚĞƉƌŽŐƌĂŵŶĂŵĞǁŝƚŚŝŶƚŚĞĨŝƌƐƚĐŽůƵŵŶ;WĞƌĨŽƌŵĂŶĐĞDĞĂƐƵƌĞͿǁŝƚŚŝŶƚŚĞƚĂďůĞĂƐƌĞƋƵĞƐƚĞĚŝŶƚŚĞƚĂďůĞŝŶƐƚƌƵĐƚŝŽŶƐ^ƚĂŶĚĂƌĚηϯͲ dŚĞĨŝƌƐƚŐŽĂůĐŽŶĐĞƌŶŝŶŐΗƐƵĨĨŝĐŝĞŶƚďƵĚŐĞƚΗŝƐŶŽƚŵĞĂƐƵƌĂďůĞdŚĞƌĞŶĞĞĚƐƚŽďĞĂĚŽůůĂƌĨŝŐƵƌĞĂƚƚĂĐŚĞĚ ůƐŽƚŚĞƌĞĂƌĞŽŶůLJϮŐŽĂůƐůŝƐƚĞĚϯǁŽƵůĚŐŝǀĞĂďĞƚƚĞƌŵĞĂƐƵƌĞŽĨƉĞƌĨŽƌŵĂŶĐĞ^ƚĂŶĚĂƌĚηϱͲ 'ŽĂůϭŚĂƐďĞĞŶĞĂƐŝůLJŵĞƚĨŽƌƚŚĞƉĂƐƚƐĞǀĞƌĂůLJĞĂƌƐŝƚŵŝŐŚƚďĞƚŝŵĞƚŽƌĂŝƐĞƚŚĞďĂƌŽƌĐŚĂŶŐĞƚŽĂĚŝĨĨĞƌĞŶƚŐŽĂů 'ŽĂůϮ;ĂŵƉƵƐ^ĂĨĞƚLJͿŝƐŶŽƚƐŽŵĞƚŚŝŶŐĐŽŶƚƌŽůůĂďůĞďLJƚŚĞƵƐŝŶĞƐƐhŶŝƚĂŶĚƐŽĂŐŽĂůŵŽƌĞƌĞůĂƚĞĚƚŽƚŚĞŝƌƵŶŝƚǁŽƵůĚƐĞƌǀĞďĞƚƚĞƌ^ƚĂŶĚĂƌĚηϲͲ 'ŽĂůƐϯĂŶĚϰƵƐĞƚŚĞǁŽƌĚΗŵĂŝŶƚĂŝŶΗŝŶƐƚĞĂĚŽĨŝŶĐƌĞĂƐĞƐŽŝƚĚŽĞƐŶŽƚĂƉƉĞĂƌĂƐŝĨĐŽŶƚŝŶƵŽƵƐŝŵƉƌŽǀĞŵĞŶƚŝƐƚŚĞƚĂƌŐĞƚ dŚĞƵƐĞŽĨĨƵŶĚƐĨƌŽŵƚŚĞΗdĞĐŚŶŽůŽŐLJ&ĞĞΗŝŶ'ŽĂůϱĚŽĞƐŶŽƚĂƉƉĞĂƌƚŽďĞĂŶĂƉƉƌŽƉƌŝĂƚĞƉĞƌĨŽƌŵĂŶĐĞŵĞĂƐƵƌĞĨŽƌƚŚĞďƵƐŝŶĞƐƐƵŶŝƚĂƐ/ƚŝƐĂĐŽůůĞŐĞͲǁŝĚĞďĞŶĞĨŝƚĂƐƚŚĞLJŶŽƚĞ