overview and preview tools for navigating the world-wide web sils
TRANSCRIPT
Overview and Preview Tools ForNavigating the World-Wide Web
SILS Technical Report TR-1999-03By: Benjamin D. Brunk
July, 1999

Benjamin D. Brunk Animated Web Overviews
1
CONTEXT AND PROBLEM STATEMENT ......................................................................................2
RELATED WORK ................................................................................................................................4
WHAT IS A “WEB SITE?”........................................................................................................................4SITEMAPS ...............................................................................................................................................5
ANIMATED PREVIEWS ...................................................................................................................26
FIRST PROTOTYPE ...............................................................................................................................27FEASIBILITY STUDY..............................................................................................................................28SECOND PROTOTYPE (FUTURE WORK) ...............................................................................................30
CONCLUSION ....................................................................................................................................31
ACKNOWLEDGMENTS ...................................................................................................................31
REFERENCES ....................................................................................................................................32
APPENDIX A: URLS TO COMMERCIAL PRODUCT SITES ......................................................34
Benjamin D. Brunk Animated Web Overviews
2
Abstract
This paper examines the problems inherent in navigating the World-Wide Web. It discusses thework done by others in crafting techniques, software products, and research prototypes thatattempt to improve the browsing experience through the application of information visualizationin the form of sitemaps. This paper also describes an animated technique to generate previewsand overviews of a web site in order to get a better understanding of its contents. The finalsection includes a technical description of an early prototype tool that uses this animatedtechnique, with preliminary findings from an informal feasibility study involving 19 subjects.
Keywords
Web browsing; alternative user interfaces; web navigation; previews; overviews; web crawler;searching
Context and Problem Statement
The World-Wide Web is a constantly evolving maze of HTML, DHTML, XML, Java,JavaScript, CGI, Active Server Pages, Shockwave, Flash, and other means of generatinghypertext content. It is an extremely “messy” information space:
“This medium is overloaded with information, polluted with redundant, erroneous andlow quality information, it progresses toward disorder according to the principle ofentropy and it has no aggregate structure which organizes distinct web localities.Furthermore, users have no global view of the entire WWW from which to forage forrelevant pages” (Abrams, 1997).
This quote may be slightly overstated, but the casual browser and expert ‘net jockey are bothsubject to the frustrations of navigating the web. Current browsing tools have evolved far fromtheir humble beginnings and have become the framework for all manner of add-ons, buthypertext navigation technology has yet to address some of its most fundamental usabilityproblems. Browsing hypertext has not changed much since the web became mainstream in theearly 1990s—essentially you scroll through a page and click on a link and jump to a new page.Conklin noted that there are two fundamental problems to navigating hypertext: Disorientationand cognitive overhead (Conklin, 1987). Disorientation is the tendency to lose one’s sense ofdirection while navigating hyperspace (the term comes from early hypertext literature and refersto hypertext space, the outstanding example of which is of course today’s World-Wide Web).Jakob Nielsen sums up disorientation with the quote: “The jumping metaphor leaves the userwith no context as to where they are in hyperspace” (Nielsen, 1990). Cognitive overhead refersto the additional effort and concentration necessary to maintain several tasks or trails at one time.Essentially, it’s the underlying cause of car accidents for those trying to read a map whiledriving. They get so caught up in trying to find their way, they become totally unable toconcentrate on the main task. Luckily, web browsing has a wider margin of error than driving anautomobile has. Conklin concluded that these issues "may ultimately limit the usefulness of

Benjamin D. Brunk Animated Web Overviews
3
hypertext." While Conklin reported these issues more than a decade ago, they remain a majordilemma for the designers and users of web documents.
One very popular means of finding information on the web is through the use of a search portal(e.g. Lycos) or categorical directory service (e.g. Yahoo). These facilities are fairly good athelping people find information, but searchers always end up browsing: A list of potentiallyrelevant documents (pages) is generated, and then the searcher uses their web browser to poreover the list, page by page, making heavy use of the “back” button. The result set may or maynot contain anything useful. The only way to find out is to perform a sort of triage of the searchresults and decide which ones to visit based on the URL, the page title, and a meager textdescription. The searcher has to make a decision based on very limited information and can onlyverify it by actually visiting each site to see what is there. This is a time-consuming process, andsearchers often find that the information about a page in the search result proves to be inaccurateonce they get to the page (Amento, 1999), which leads to frustration. To be at all exhaustive orcomprehensive, the searcher must try more than one search portal or use a meta-search tool suchas WebFerret (FerretSoft, 1999) to query a number of search portals. They end up with hundredsor even thousands of ‘hits’ to explore. As the number of hits to explore increases, the amount oftime available to thoroughly look at each one decreases. Due to the immense data overload ofsearch results, most searchers do not take the time to explore a site further than the link given tothem in the result set—it simply takes too much time. Because the web is a random-accessmedium, when a searcher follows a link, most of the time it does not take them to the main pagefor the site, but usually a sub-page from somewhere in the site’s hierarchy of pages. This is goodwhen the page the searcher initially navigates to has exactly what they are looking for. But thedownside is that if the first page navigated to has no relevant information, the searcher may giveup on the whole site before even looking at the rest of it. Research by Amento showed that mostsearchers made their judgment of whether a site is useful or not by viewing only its front [main]page (Amento, 1999). It is not a significant jump in logic to infer that: “The first page a searchernavigates to at a given site affects their overall judgment of the site and their decision to continuebrowsing it."
The disorientation of jumping from page to page makes it too easy for searchers to bypasspotentially relevant information that resides on a page within a particular site. But what can bedone to fix this problem? One thing to do is add more navigational features to the sub-pages (orthe pages that could possibly be ‘hits’ in a search). One very obvious and low-tech solution tothis is to have every sub-page link back to the main page. Having the main page always oneclick away makes it much more likely people who enter at a sub-page will actually go to themain page also. Why is it so important to get people headed towards a site’s main page?Because current design practices dictate that a site’s main page is designed to be the focal pointof the whole site. It gives the visitor an initial impression of the site’s overall quality. A well-designed main page also has a more subtle but arguably more important role: It gives people agood understanding of what is and is not available there, the structure of what is available, andthe control mechanisms for exploring and extracting the information. The rest of the site’s pagesdo not perform this role. Their purpose is to contain the actual substance. The main page ismore or less analogous to the cover of a book and the table of contents, while the rest of the siteis the manuscript. Refer to the literature review section for further discussion and clarificationof this point.
Benjamin D. Brunk Animated Web Overviews
4
Once a searcher arrives at the site’s main page, they are more likely to find and make use ofwhatever navigational aids are there. A great number of web sites already have every sub-pagelinking back to the main page just for this reason. However, this technique requires users tomake a conscious decision and is tantamount to unnecessary, added cognitive overhead. A bettersolution would be to change the way the search process works. If you change the navigationmechanism then you change how a searcher arrives at a site, which automatically affects thesearcher’s impression and understanding of a site. One way to change navigation is by adding astep between scrolling through a set of search results and navigating to the pages themselves.This in-between step could provide some kind of automated preview or overview of the page andthe overall site. Fast, automated access to preview or overview information would give thesearcher a better viewpoint, including (but not limited to) a look at the site’s main page. Ifimplemented well, this could reduce navigation time through a reduction of disorientation andcognitive overhead. Also, the searcher need not leave the page of search results or jump to a newpage to find out about a given site. Less time spent backing up (using the ‘back’ button) meansmore time for finding relevant information.
The concepts of previews and overviews have arisen from the Information Science literature indiscussions addressing the problem of information overload in digital libraries. Previews andoverviews are graphic or textual representations of objects of interest (Greene, 1999). A previewis a direct extraction from an object and acts as a surrogate for that object. For example, apreview of a film consists of interesting clips and audio from the actual film. An overview is aconstruction or aggregation that stands in place of another object or collection of objects. Anexample of an overview is a college course catalog. Both forms add value to the original objector collection of objects by enhancing human accessibility to and understanding of the things theyrepresent. Previews and overviews promise to be very important to the web now and in thefuture. They can help speed up the process of finding and making decisions about objects on theweb, just as they do in the physical world.
The next section will illustrate current techniques for providing previews and overviews of websites in the form of sitemaps. The role of information visualizations and techniques forgenerating previews and overviews will also be examined. The final section discusses anexperimental technique for creating overviews and previews using animation.
Related Work
What is a “Web Site?”
People throw around the term “Web Site” without defining what it means. For the purposes ofthis paper, a web site is a subset of the World Wide Web. The boundaries of what constitutes a‘site’ are rather abstract. A site can range in size from a single lowly page up to hundreds oreven thousands of individual pages. A site has a Universal Resource Locator (URL). The URLconsists of several parts: The protocol (usually http), the base WWW address (either as a name,such as ils.unc.edu or the IP address, to which the name gets resolved to, such as 152.2.81.1), the
Benjamin D. Brunk Animated Web Overviews
5
port number (e.g. port 80), and the name of the file to open (e.g. index.html). By default, a site’sweb server usually maps the base URL to a home page (also called the welcome page, start page,front page or the main page, named index.html or main.html) whether the filename of the mainpage is specified or not. The main page contains hypertext links to other pages. These linksare uni-directional and can do one of three things:
• Jump to another place in the same page• Jump to another page within the site (relative to the base URL)• Jump to another website (a different base URL)
As a result of the overwhelming commercial success of the web, hypertext design tools andtechniques have evolved rapidly. The task of site design has shifted from the realm of thecomputer scientist to that of graphic artists, designers, professional writers, and marketingspecialists. Technically inclined individuals are increasingly taking on the role of enabling theback-end processing, such as writing scripts, setting up and managing databases, and ensuringsite uptime, availability, and security. This shift in web design responsibility has had measurableeffects: The amount of web site content has increased and its quality is much higher. Vastamounts of information has become available, as well as online shopping, travel planning,government access, stock-trading—the list is endless. Companies employ small armies of peopleto maintain their web sites or outsource the job for a hefty price. The focus is on bringing trafficto a site and creating appealing and memorable pages. Not surprisingly, navigability often takesa back seat. Because of the constraints imposed by time, manifest in the form of projectdeadlines, there is a trade-off between having a stylish, good-looking web site and having onethat is intuitive and easy to navigate. Since every web site is unique, visitors must spend timeadapting to the site’s navigational features. Scrolling and jumping are a reliable constant, buteverything else is variable: Colors, menus, frames, mouse-overs, image maps, animation, formsand applets all complicate the browsing experience. Every site contains a different mix of thesefeatures. That guarantees that every browsing experience will be different.
Sitemaps
It would not be desirable for every web site to look and work the same way. Different audiencesrequire different designs and the web seems to thrive on diversity. One thing that has proven tobe helpful to visitors is the addition of a sitemap. Most moderate-to-large size web sites alreadyprovide a sitemap of some kind. In practice, a sitemap is not always a map in the geographicsense, but often consists of an index or a table of contents. Sitemaps provide overviews andpreviews of a site’s content.
Simple textual sitemaps can be generated using standard HTML. Most of these depict a one ortwo-level hierarchy view of links. Other sitemaps use event-driven software application-styleinterfaces through the use of scripts or compiled or interpreted programs. Site maps can be handmade or data-driven, and rely on text, graphics or both. As will be discussed later, recentresearch in the field of Information Visualization has produced web overviews using novelgraphical visualization techniques.

Benjamin D. Brunk Animated Web Overviews
6
Sitemaps all have one thing in common—they are server-side entities set up by the webmastersof each individual site. There are no standards for creating sitemaps, though some guidelinesexist (Rosenfeld, 1998). It appears that in 1996, Microsoft tried to standardize their ownapproach to creating sitemaps, but this work seems to have fallen by the wayside for somereason. Evidence exists that a sitemap tool add-on was proposed for version 4.0 of the MicrosoftInternet Explorer browser, along with a standardized mechanism for administrators to map theirsites (Unknown, 1996). No recent information about their technique, the add-on, or their overallintentions is currently available, however. The whole endeavor seems to have been abandoned,at least for now.
The simplest sitemaps employ HTML-only lists of headings and links that emulate a table ofcontents or index. Users can click on the links to go to the various pages at the site. Oneexample comes from the Texas Department of Economic Development (TDED, 1998).
Figure 1: Texas Dept. of Economic Development Sitemap
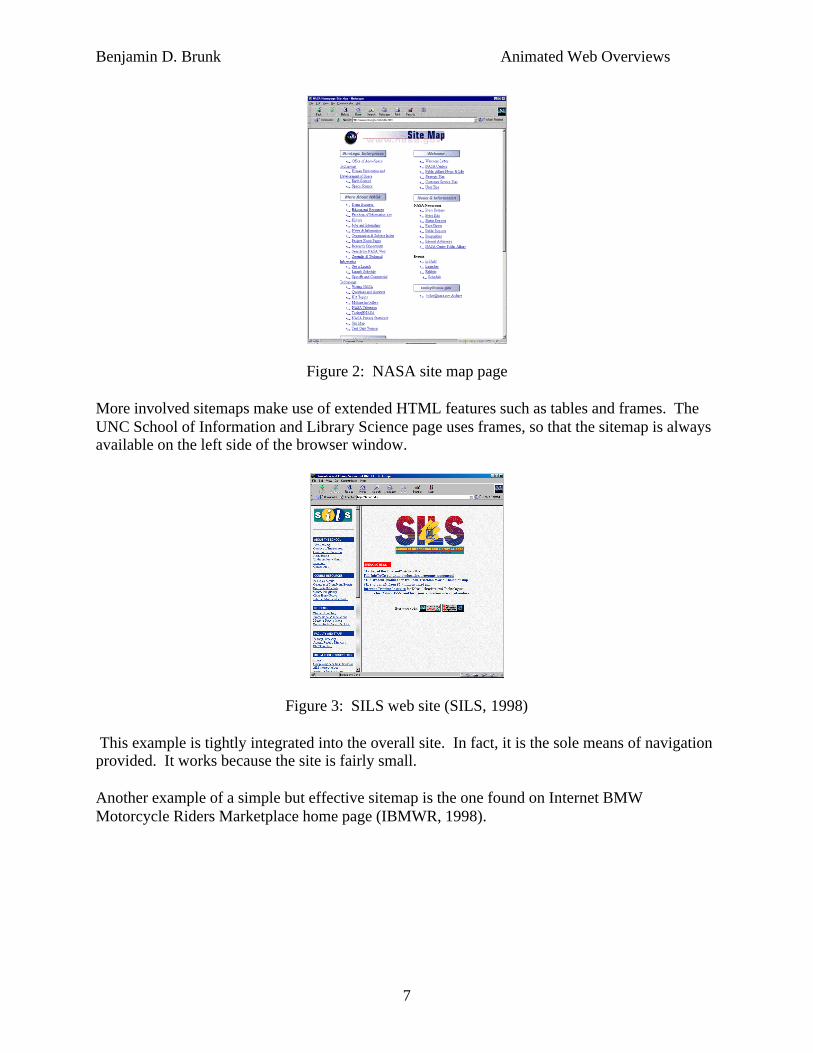
Another example is the NASA web site index (NASA, 1998). The important difference to noticeabout the NASA sitemap is that although it represents a site consisting of thousands of pages, thesitemap showcases only a select subset of them. We do not know how the NASA site’sdesigners arrived at the decision of which pages to include, we can only trust their expertjudgment.
Benjamin D. Brunk Animated Web Overviews
7
Figure 2: NASA site map page
More involved sitemaps make use of extended HTML features such as tables and frames. TheUNC School of Information and Library Science page uses frames, so that the sitemap is alwaysavailable on the left side of the browser window.
Figure 3: SILS web site (SILS, 1998)
This example is tightly integrated into the overall site. In fact, it is the sole means of navigationprovided. It works because the site is fairly small.
Another example of a simple but effective sitemap is the one found on Internet BMWMotorcycle Riders Marketplace home page (IBMWR, 1998).
Benjamin D. Brunk Animated Web Overviews
8
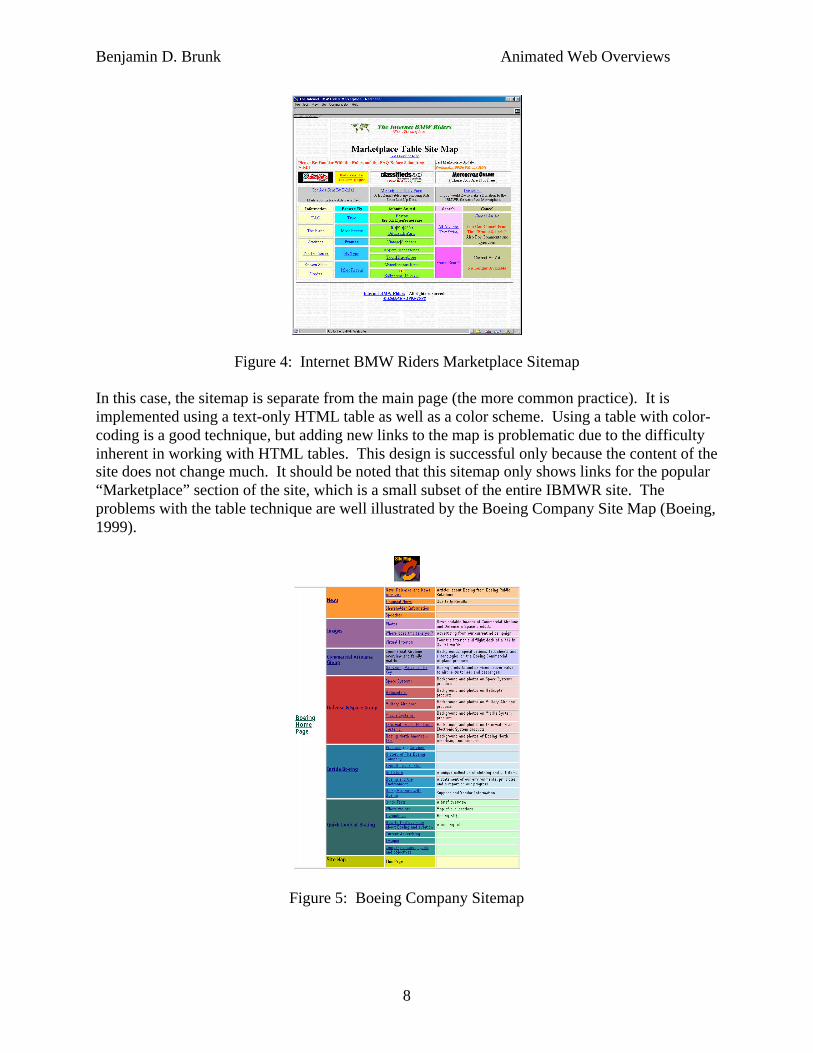
Figure 4: Internet BMW Riders Marketplace Sitemap
In this case, the sitemap is separate from the main page (the more common practice). It isimplemented using a text-only HTML table as well as a color scheme. Using a table with color-coding is a good technique, but adding new links to the map is problematic due to the difficultyinherent in working with HTML tables. This design is successful only because the content of thesite does not change much. It should be noted that this sitemap only shows links for the popular“Marketplace” section of the site, which is a small subset of the entire IBMWR site. Theproblems with the table technique are well illustrated by the Boeing Company Site Map (Boeing,1999).
Figure 5: Boeing Company Sitemap

Benjamin D. Brunk Animated Web Overviews
9
The Boeing example makes it clear that the table technique is not scaleable. The Boeing sitemapincludes long textual descriptions of each link, making it too big for the browser window. Thisforces the user to have to scroll. Scrolling down a page isn’t that serious, but how muchscrolling is too much when the purpose of a sitemap is to provide quick, concise overviews?Each link includes a lot of text, but not a lot of information about what can actually be foundunder the links listed in the table. In addition, how much of the Boeing web site is actuallyshown here? The designers seem to have missed the point, because this “sitemap” is really anorganizational chart of the company, not a map of the web site.
Yet another form for a sitemap is a clickable image map, like the one for the Coral SkyAmphitheater (Coral Sky, 1998).
Figure 5: Coral Sky Amphitheater Image Map
Clickable image maps are used to combine graphics with underlying “hot-spots” that map tohypertext links when the mouse is rolled over them. Clickable images maps are an evolutionary,if not revolutionary step in the HTML standard. For the first time, hyper-links and graphicscould be combined. However, the original technique suffers from myriad problems: imagemaps are hard to create without the help of specialized “image map” tools. Because of this, theyare also difficult to change once they are created. More importantly, they do not provide the userwith adequate feedback, and the large monolithic images cause lengthy download times. Mostsites with clickable image maps also have to provide separate, text-based HTML links to thesame pages as boilerplate to ensure that the links have meaning even if the image doesn’t load orif a non-graphical browser is being used.
The emergence of scripting languages such as JavaScript have fostered a new and better way tocreate clickable image maps. This technique uses nested, invisible HTML tables whose cellscontain smaller, individual images that, when put together, look like a seamless large image.When combined with a scripting language like JavaScript, it is possible to provide users withappropriate visual feedback via the built-in graphics manipulation capabilities of the language.This technique has resolved the problem caused by downloading one large, high-resolutiongraphic. Many interesting possibilities for previews and look-aheads also arise from thiscombination of tables, graphic images and the JavaScript language.
Clickable image maps introduce many sitemapping possibilities. Hand-drawn network graphs,and metaphorical diagrams can be created using them. These sitemaps are effective in depictinga hierarchical structure, or laying out links spatially according to categories.
Benjamin D. Brunk Animated Web Overviews
10
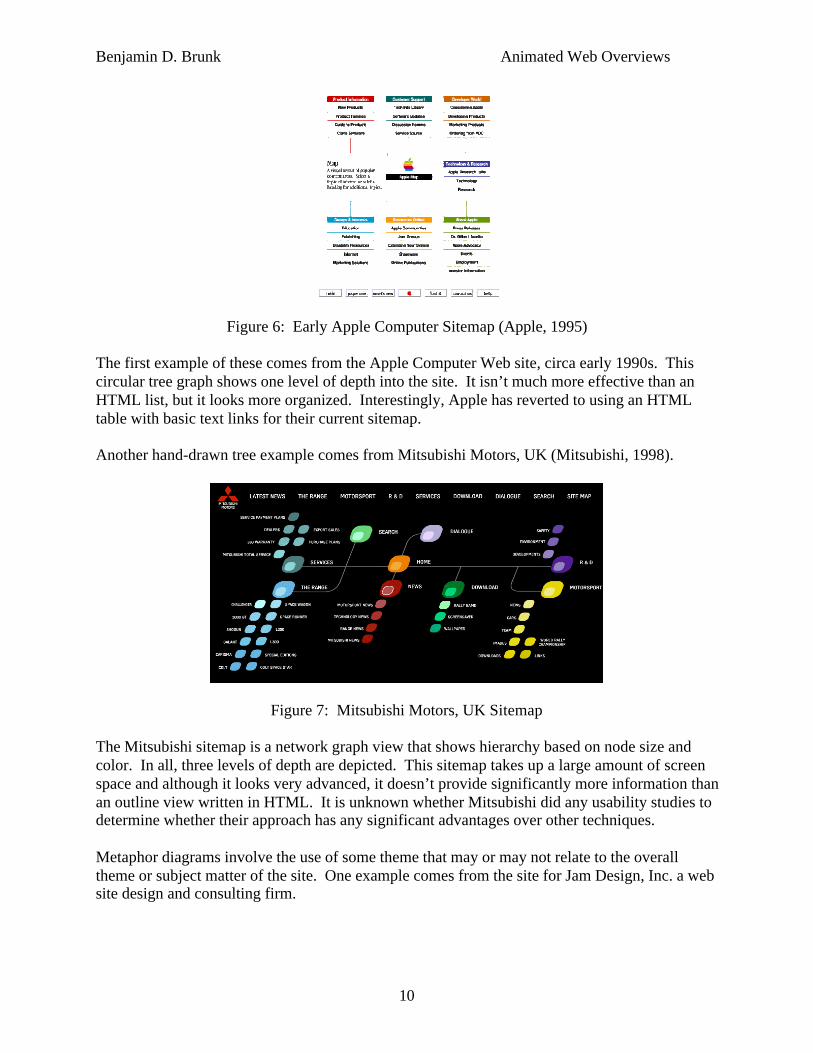
Figure 6: Early Apple Computer Sitemap (Apple, 1995)
The first example of these comes from the Apple Computer Web site, circa early 1990s. Thiscircular tree graph shows one level of depth into the site. It isn’t much more effective than anHTML list, but it looks more organized. Interestingly, Apple has reverted to using an HTMLtable with basic text links for their current sitemap.
Another hand-drawn tree example comes from Mitsubishi Motors, UK (Mitsubishi, 1998).
Figure 7: Mitsubishi Motors, UK Sitemap
The Mitsubishi sitemap is a network graph view that shows hierarchy based on node size andcolor. In all, three levels of depth are depicted. This sitemap takes up a large amount of screenspace and although it looks very advanced, it doesn’t provide significantly more information thanan outline view written in HTML. It is unknown whether Mitsubishi did any usability studies todetermine whether their approach has any significant advantages over other techniques.
Metaphor diagrams involve the use of some theme that may or may not relate to the overalltheme or subject matter of the site. One example comes from the site for Jam Design, Inc. a website design and consulting firm.
Benjamin D. Brunk Animated Web Overviews
11
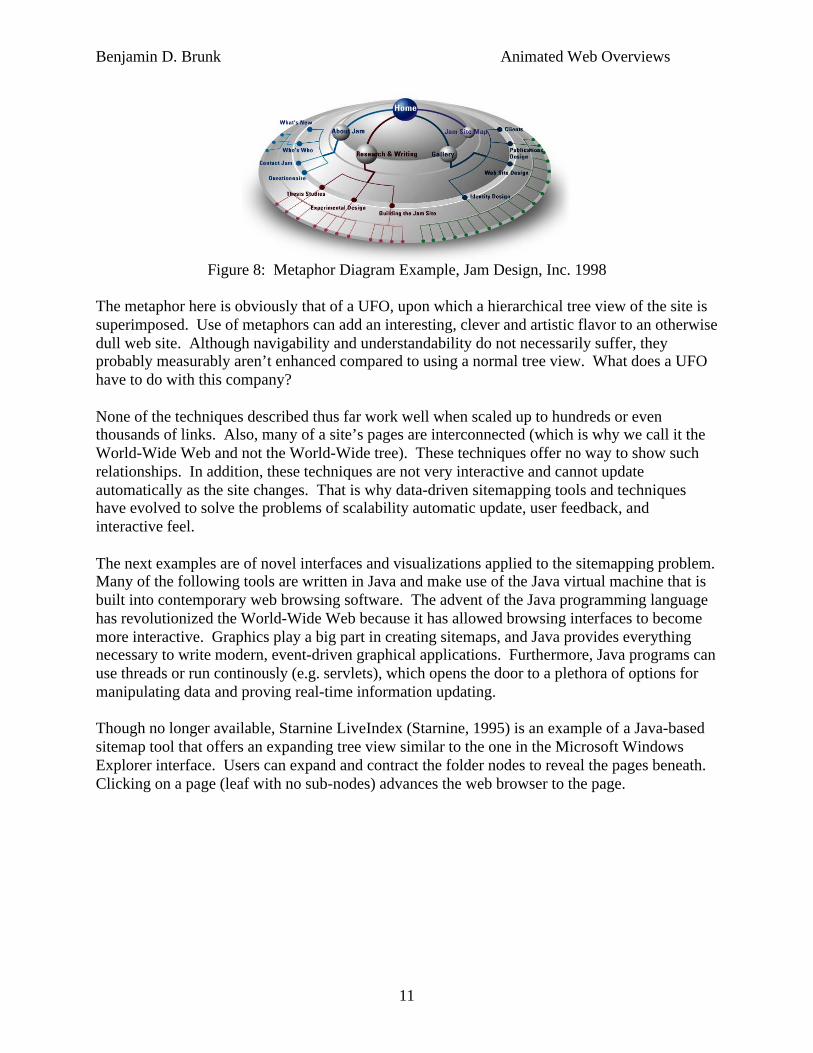
Figure 8: Metaphor Diagram Example, Jam Design, Inc. 1998
The metaphor here is obviously that of a UFO, upon which a hierarchical tree view of the site issuperimposed. Use of metaphors can add an interesting, clever and artistic flavor to an otherwisedull web site. Although navigability and understandability do not necessarily suffer, theyprobably measurably aren’t enhanced compared to using a normal tree view. What does a UFOhave to do with this company?
None of the techniques described thus far work well when scaled up to hundreds or eventhousands of links. Also, many of a site’s pages are interconnected (which is why we call it theWorld-Wide Web and not the World-Wide tree). These techniques offer no way to show suchrelationships. In addition, these techniques are not very interactive and cannot updateautomatically as the site changes. That is why data-driven sitemapping tools and techniqueshave evolved to solve the problems of scalability automatic update, user feedback, andinteractive feel.
The next examples are of novel interfaces and visualizations applied to the sitemapping problem.Many of the following tools are written in Java and make use of the Java virtual machine that isbuilt into contemporary web browsing software. The advent of the Java programming languagehas revolutionized the World-Wide Web because it has allowed browsing interfaces to becomemore interactive. Graphics play a big part in creating sitemaps, and Java provides everythingnecessary to write modern, event-driven graphical applications. Furthermore, Java programs canuse threads or run continously (e.g. servlets), which opens the door to a plethora of options formanipulating data and proving real-time information updating.
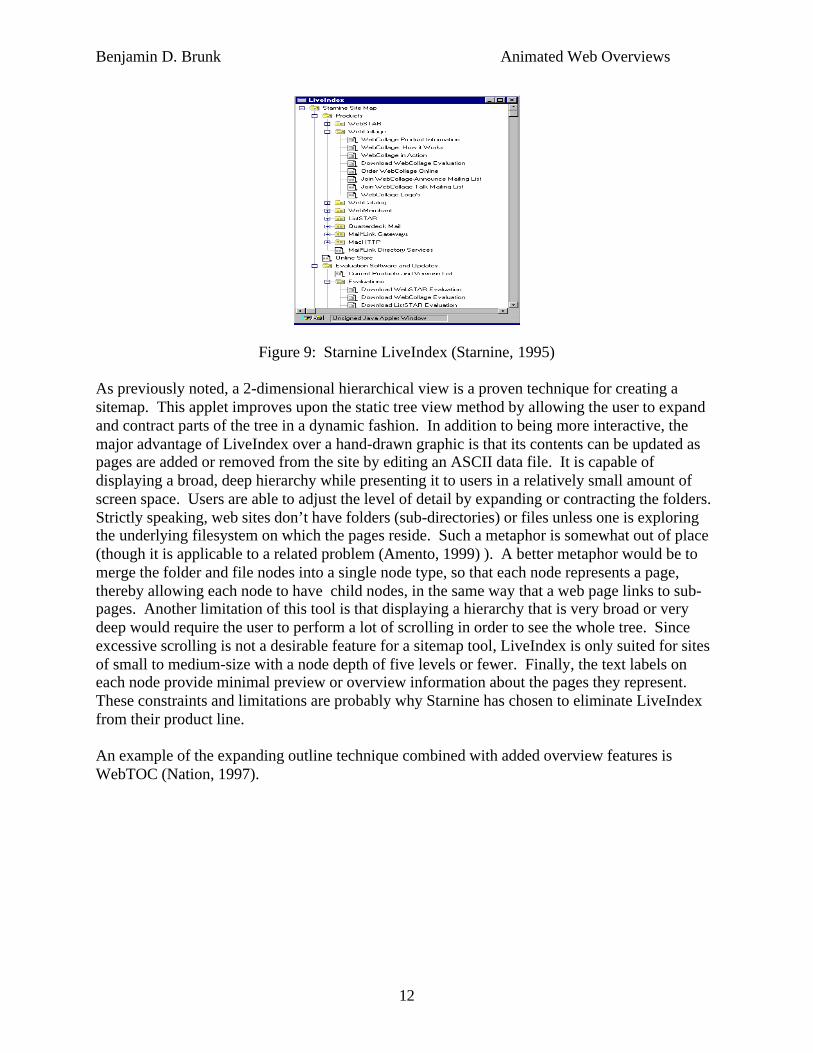
Though no longer available, Starnine LiveIndex (Starnine, 1995) is an example of a Java-basedsitemap tool that offers an expanding tree view similar to the one in the Microsoft WindowsExplorer interface. Users can expand and contract the folder nodes to reveal the pages beneath.Clicking on a page (leaf with no sub-nodes) advances the web browser to the page.
Benjamin D. Brunk Animated Web Overviews
12
Figure 9: Starnine LiveIndex (Starnine, 1995)
As previously noted, a 2-dimensional hierarchical view is a proven technique for creating asitemap. This applet improves upon the static tree view method by allowing the user to expandand contract parts of the tree in a dynamic fashion. In addition to being more interactive, themajor advantage of LiveIndex over a hand-drawn graphic is that its contents can be updated aspages are added or removed from the site by editing an ASCII data file. It is capable ofdisplaying a broad, deep hierarchy while presenting it to users in a relatively small amount ofscreen space. Users are able to adjust the level of detail by expanding or contracting the folders.Strictly speaking, web sites don’t have folders (sub-directories) or files unless one is exploringthe underlying filesystem on which the pages reside. Such a metaphor is somewhat out of place(though it is applicable to a related problem (Amento, 1999) ). A better metaphor would be tomerge the folder and file nodes into a single node type, so that each node represents a page,thereby allowing each node to have child nodes, in the same way that a web page links to sub-pages. Another limitation of this tool is that displaying a hierarchy that is very broad or verydeep would require the user to perform a lot of scrolling in order to see the whole tree. Sinceexcessive scrolling is not a desirable feature for a sitemap tool, LiveIndex is only suited for sitesof small to medium-size with a node depth of five levels or fewer. Finally, the text labels oneach node provide minimal preview or overview information about the pages they represent.These constraints and limitations are probably why Starnine has chosen to eliminate LiveIndexfrom their product line.
An example of the expanding outline technique combined with added overview features isWebTOC (Nation, 1997).
Benjamin D. Brunk Animated Web Overviews
13
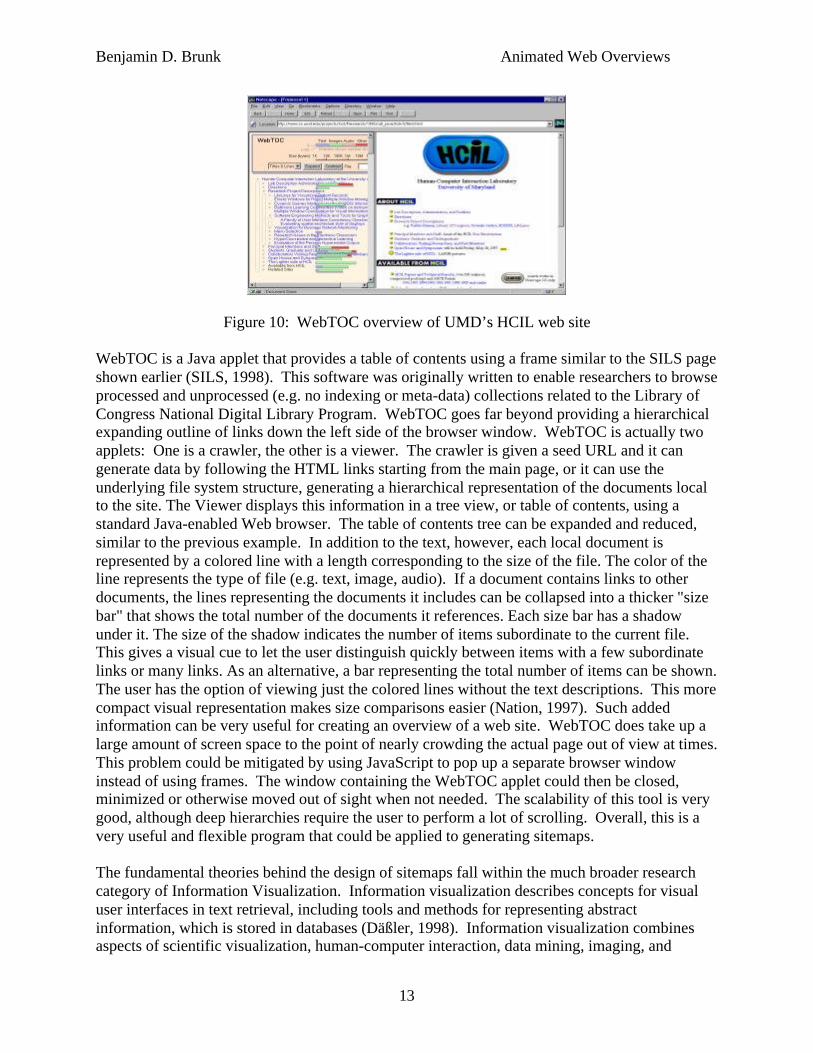
Figure 10: WebTOC overview of UMD’s HCIL web site
WebTOC is a Java applet that provides a table of contents using a frame similar to the SILS pageshown earlier (SILS, 1998). This software was originally written to enable researchers to browseprocessed and unprocessed (e.g. no indexing or meta-data) collections related to the Library ofCongress National Digital Library Program. WebTOC goes far beyond providing a hierarchicalexpanding outline of links down the left side of the browser window. WebTOC is actually twoapplets: One is a crawler, the other is a viewer. The crawler is given a seed URL and it cangenerate data by following the HTML links starting from the main page, or it can use theunderlying file system structure, generating a hierarchical representation of the documents localto the site. The Viewer displays this information in a tree view, or table of contents, using astandard Java-enabled Web browser. The table of contents tree can be expanded and reduced,similar to the previous example. In addition to the text, however, each local document isrepresented by a colored line with a length corresponding to the size of the file. The color of theline represents the type of file (e.g. text, image, audio). If a document contains links to otherdocuments, the lines representing the documents it includes can be collapsed into a thicker "sizebar" that shows the total number of the documents it references. Each size bar has a shadowunder it. The size of the shadow indicates the number of items subordinate to the current file.This gives a visual cue to let the user distinguish quickly between items with a few subordinatelinks or many links. As an alternative, a bar representing the total number of items can be shown.The user has the option of viewing just the colored lines without the text descriptions. This morecompact visual representation makes size comparisons easier (Nation, 1997). Such addedinformation can be very useful for creating an overview of a web site. WebTOC does take up alarge amount of screen space to the point of nearly crowding the actual page out of view at times.This problem could be mitigated by using JavaScript to pop up a separate browser windowinstead of using frames. The window containing the WebTOC applet could then be closed,minimized or otherwise moved out of sight when not needed. The scalability of this tool is verygood, although deep hierarchies require the user to perform a lot of scrolling. Overall, this is avery useful and flexible program that could be applied to generating sitemaps.
The fundamental theories behind the design of sitemaps fall within the much broader researchcategory of Information Visualization. Information visualization describes concepts for visualuser interfaces in text retrieval, including tools and methods for representing abstractinformation, which is stored in databases (Däßler, 1998). Information visualization combinesaspects of scientific visualization, human-computer interaction, data mining, imaging, and

Benjamin D. Brunk Animated Web Overviews
14
graphics. Research in this area is currently very popular due to the increasing need to findmethods for displaying larger and larger amounts of text and other data in efficient ways.Furnas proposed a set of criteria for designing and evaluating representations of informationstructures in support of traversal and navigation (Furnas, 1997). An information visualizationpioneer, one of his early works extends the idea of balancing local detail within a global contextand merging it into a single view by using what he termed a fisheye view (Furnas, 1986). Thefisheye view is analogous to a wide-angle camera lens. Furnas’ idea was to show “local” detailin full, and then provide context to that detail all around it, but in successively less detail. Hedescribed a generalized degree of interest function, where the interest value of a node in a graphis a function of both its a priori importance and its distance from the user’s current focus. Thereare three methods for creating a fisheye view: Graphical distortion of the context areas, partialviews through filtering, or by using smaller or simpler abstractions such as icons in the contextareas. This technique could be adapted to provide a global overview or a preview of a web site,since fisheye views are capable of representing large, non-hierarchical information spaces.
Other early visualization work emerged from a trio of individuals, Card, Robertson andMackinlay, at the Xerox Palo Alto Research Center (PARC). Cone trees (Robertson, 1991), thePerspective Wall (Mackinlay, Robertson, & Card, 1991) and the 3D Information VisualizerWorkspace (Card, Robertson, & Mackinlay, 1991) were projects in information visualizationcarried out by these individuals. The types of visualizations they created are best at depictinghierarchical, tree-type data relationships. These early prototypes include many of the featuresdesirable for creating interactive, graphical sitemap tools.
Figure 11: Cone Tree Visualization Example (Mukherjea, 1995)
Inxight software (a Xerox PARC spin-off) has recently released a hyperbolic tree visualizationproduct called VizControls (Inxight Software, 1998). Hyperbolic trees work in a fashion similarto cone trees, but can be used to display up to 10 times as many nodes as a conventional 2Dbrowser in the same amount of space, according to Lamping and Rao (Lamping & Rao, 1996).The hyperbolic tree uses a non-euclidean geometry that enables it to lay out large hierarchiesuniformly. It uses animation and dynamic focus, similar to a cone tree. Also similar to conetrees, it suffers from an inherent dependence on hierarchical relationships. It’s major advantageis that it is able to represent all the pages of a very large web site in a clear, consistent and easilynavigable manner while minimizing screen real-estate.
Benjamin D. Brunk Animated Web Overviews
15
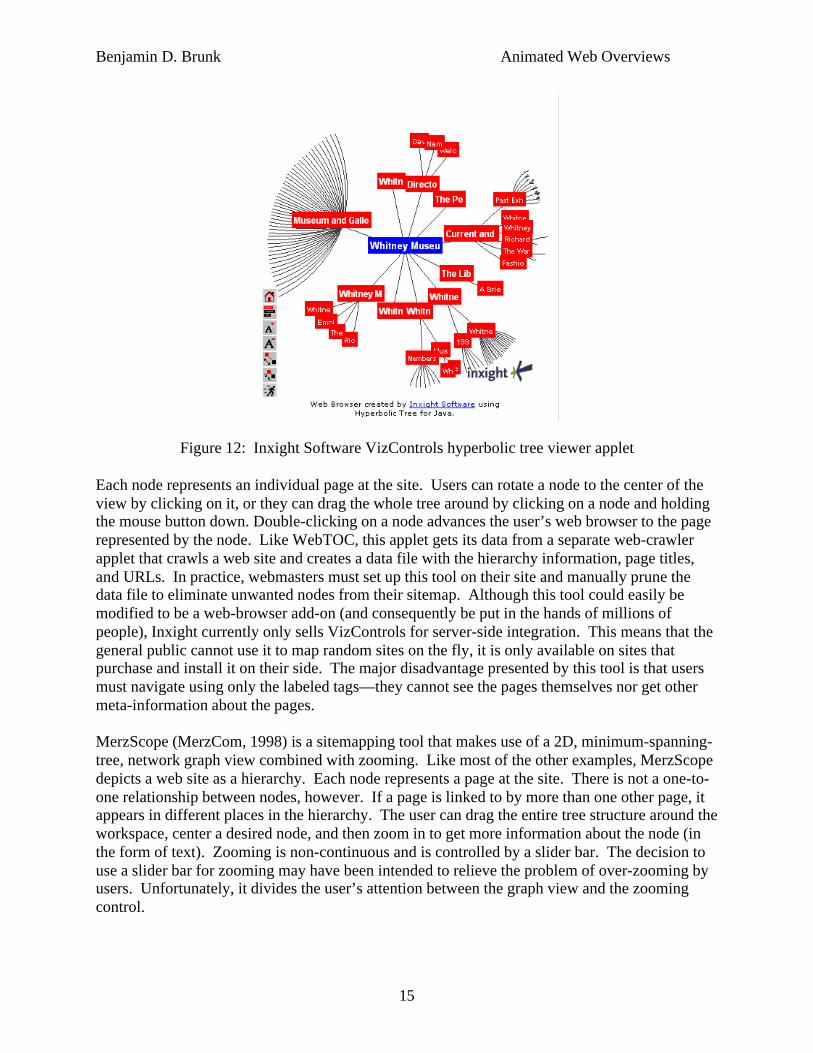
Figure 12: Inxight Software VizControls hyperbolic tree viewer applet
Each node represents an individual page at the site. Users can rotate a node to the center of theview by clicking on it, or they can drag the whole tree around by clicking on a node and holdingthe mouse button down. Double-clicking on a node advances the user’s web browser to the pagerepresented by the node. Like WebTOC, this applet gets its data from a separate web-crawlerapplet that crawls a web site and creates a data file with the hierarchy information, page titles,and URLs. In practice, webmasters must set up this tool on their site and manually prune thedata file to eliminate unwanted nodes from their sitemap. Although this tool could easily bemodified to be a web-browser add-on (and consequently be put in the hands of millions ofpeople), Inxight currently only sells VizControls for server-side integration. This means that thegeneral public cannot use it to map random sites on the fly, it is only available on sites thatpurchase and install it on their side. The major disadvantage presented by this tool is that usersmust navigate using only the labeled tags—they cannot see the pages themselves nor get othermeta-information about the pages.
MerzScope (MerzCom, 1998) is a sitemapping tool that makes use of a 2D, minimum-spanning-tree, network graph view combined with zooming. Like most of the other examples, MerzScopedepicts a web site as a hierarchy. Each node represents a page at the site. There is not a one-to-one relationship between nodes, however. If a page is linked to by more than one other page, itappears in different places in the hierarchy. The user can drag the entire tree structure around theworkspace, center a desired node, and then zoom in to get more information about the node (inthe form of text). Zooming is non-continuous and is controlled by a slider bar. The decision touse a slider bar for zooming may have been intended to relieve the problem of over-zooming byusers. Unfortunately, it divides the user’s attention between the graph view and the zoomingcontrol.

Benjamin D. Brunk Animated Web Overviews
16
Figure 13: MerzScope view of the Teleglobe web site
Though a very compelling concept, in execution MerzScope suffers from a few user interfaceproblems. Moving the graph and zooming the view require a great deal of practice (themappings of the mouse buttons are particularly vexing). Like the hyperbolic tree browser,MerzScope uses indistinguishable nodes and vague text tags that are not very indicative of theweb pages they represent. More information is made available as the user zooms into aparticular node, but the time the user spends zooming in and out is wasteful. It is actually fasterto left-click on the node and navigate to the actual page than it is to zoom in and read the text-only description of a selected page. Worst of all, someone has to generate all those little titlesand descriptions, they are not previews extracted from the pages. The addition of an automatedpreview mechanism that extracts descriptive information from the pages themselves (including ascreen-shot) would make MerzScope more user-friendly and less labor-intensive.These are problems that could be fixed in the next version, hopefully after some more usabilitytesting.
Treemaps are yet another visualization technique that can be applied to the web. The treemaptechnique was conceived by Ben Shneiderman in 1991 as a means of visualizing a computer’sfilesystem (Shneiderman, 1992). This approach uses a 2D space-filling algorithm in which eachnode is a rectangle whose area is proportional to some attribute such as node size. In thisapplication, the files are leaf nodes and the subdirectories are interior nodes. Later work addedcolor-coding and node proximity as well as some esoteric features such as zooming, sound (as aredundant or independent code, for example, larger files had a lower pitched sound),hue/saturation control, many border variations, and labeling control. The initial prototype wascapable of visualizing 5,000 node hierarchies in a relatively compact amount of screen space.Many applications for treemaps have surfaced since 1991. A different approach to area filling isone introduced by Xia Lin of Drexel University. Lin has designed a program entitled VisualSiteMap. This software uses a variation of the treemap visualization. In his own words:
“Through a web crawler, SiteMap first traverses every link of the web site, collectsstatistical data, and indexes all the words and pages of the site. Based on the statisticaldata and the indexing, SiteMap converts each page of the site into a vector, and uses these

Benjamin D. Brunk Animated Web Overviews
17
vectors to train a neural network. As the outcome, the trained neural network presents thesite in an organized map: subject areas are identified and labeled; their sizes andlocations are determined by relationships among the subjects and by their occurrence andco-occurrence frequencies. Links are clustered and located within their respective subjectareas, represented by colored dots. Some patterns of the site are clearly revealed” (Lin,1999).
Figure 14: Visual SiteMap applet
Visual SiteMap is written in Java and consists of three separate executables: A web crawlerapplet that indexes a site; a neural network training procedure that organizes the site; and theuser interface applet. Essentially, SiteMap uses its AI to self-organize a web site by subject,placing similar pages closer to one another. Treemap-type views have been used successfully inmany other application domains. Such an interface may remain a tool for experts though as thesheer power of the tool can be overwhelming and confusing. Usability research has shown thatnew users required 10-15 minutes of training before they could effectively use such a tool.Some users will undoubtedly get turned off before they understand its value. Another currentself-organizing system similar to SiteMap is Websom, produced by a research group in Helsinki,Finland (Honkela, 1998). More information about treemaps can be found at:http://www.cs.umd.edu/hcil/treemaps and http://ai2.BPA.arizona.edu/ent/
Dynamic Diagrams Inc. has produced a product called MAPA, which generates what are calledz-factor or isometric interactive maps. Z-factor maps are essentially 3D perspective views ofhierarchies where the nodes are depicted as flat, 2D rectangles of various colors. Each rectanglerepresents a web page and clicking on them advances the web browser to the actual page.

Benjamin D. Brunk Animated Web Overviews
18
Figure 15: Dynamic Diagrams MAPA software (Dynamic Diagrams, 1999)
According to the marketing literature, the Java-based MAPA software is capable of mappingweb sites in excess of 2,000 pages and displaying the entire hierarchy in a single view. If this isaccurate, then Z-factors diagrams represent a very powerful visualization technique. Two-dimensional visualizations suffer from lack of scalability, while three-dimensional visualizationshave usability issues that limit their effectiveness. Z-factor diagrams overcomes theselimitations by borrowing the best elements of 2D and 3D visualization to produce a hybridbetween the two (2.5D?). This technique takes a 2D hierarchy and places the user’s point of viewabove the horizon and off-center at a 45 degree angle, as if they were sitting on top of a buildinglooking at an intersection two blocks away. But a comfortable amount of “2D-ness” is retainedthrough the use of flat shapes as the nodes. In most 3D visualizations, the objects or nodes are3D shapes. Here, the nodes are flat, 2D rectangles, as if pieces of paper were standing on edge.Using flat shapes in a 3D view allows for extremely high-density stacking of pages.
While the Z-factor concept seems promising, MAPA isn’t perfect. It lacks sufficient userfeedback, though further development could easily fix this problem. Overall, the currentinterface is straightforward and does not overwhelm the user with fancy graphics and features.Novice users should not have very much trouble navigating around a site using MAPA.The thickness of the nodes can also be used to represent an attribute such as file length or to giveusers some idea of how many hyperlinks are on a page. Electrum Multimedia sells a productsimilar to MAPA called PowerMapper. PowerMapper is worthy of mention because it is morerefined than MAPA, including better user feedback, expandable nodes, and a hybrid collectionof different 2D and 3D sitemapping techniques including an isometric (z-factor) map.Powermapper uses thumbnails of the web pages themselves as the nodes in the diagrams,allowing users to see not only the page titles, but the actual pages themselves.
Benjamin D. Brunk Animated Web Overviews
19
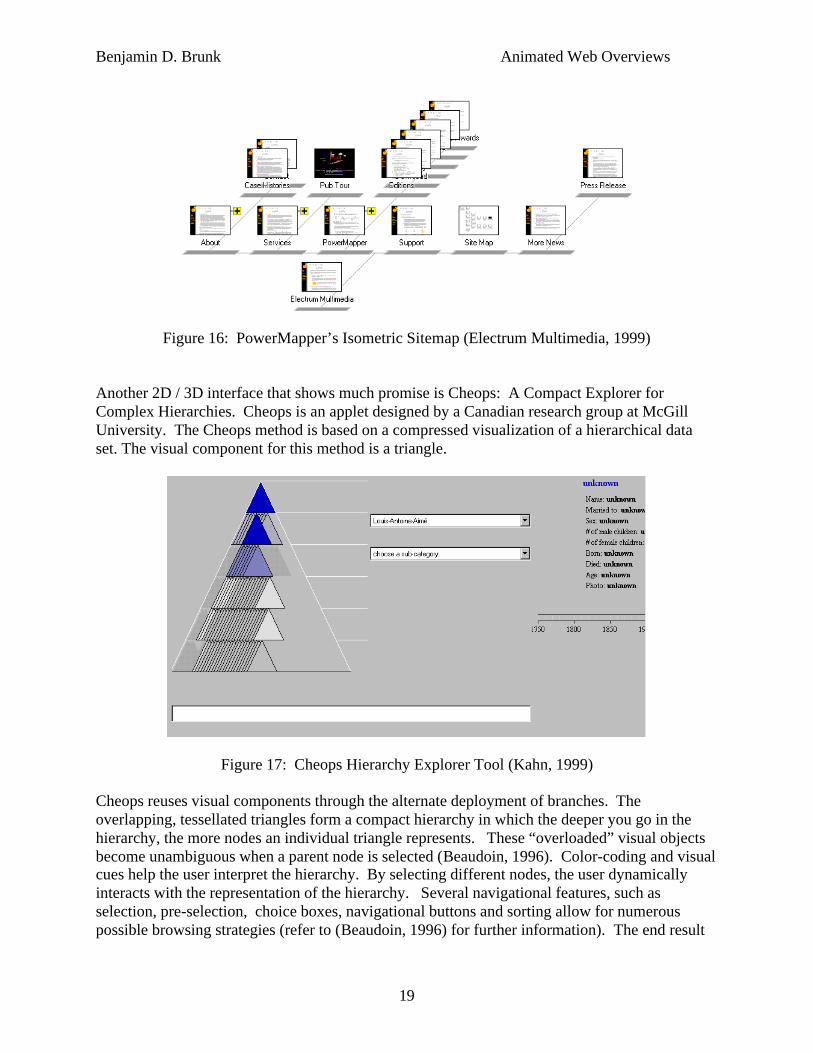
Figure 16: PowerMapper’s Isometric Sitemap (Electrum Multimedia, 1999)
Another 2D / 3D interface that shows much promise is Cheops: A Compact Explorer forComplex Hierarchies. Cheops is an applet designed by a Canadian research group at McGillUniversity. The Cheops method is based on a compressed visualization of a hierarchical dataset. The visual component for this method is a triangle.
Figure 17: Cheops Hierarchy Explorer Tool (Kahn, 1999)
Cheops reuses visual components through the alternate deployment of branches. Theoverlapping, tessellated triangles form a compact hierarchy in which the deeper you go in thehierarchy, the more nodes an individual triangle represents. These “overloaded” visual objectsbecome unambiguous when a parent node is selected (Beaudoin, 1996). Color-coding and visualcues help the user interpret the hierarchy. By selecting different nodes, the user dynamicallyinteracts with the representation of the hierarchy. Several navigational features, such asselection, pre-selection, choice boxes, navigational buttons and sorting allow for numerouspossible browsing strategies (refer to (Beaudoin, 1996) for further information). The end result
Benjamin D. Brunk Animated Web Overviews
20
of all this is impressive: Calculations show that a 10x10 hierarchy using 1.2cm triangles onlyoccupies 12cm from left to right (Beaudoin, 1996). Navigation is intuitive and users canmaintain a clear context of the hierarchy while focusing on a single node. Currently, the onlyapplication for Cheops is as a document query system. Since this application is quite similar toweb-browsing, Cheops could be adapted to the application of sitemap tool or alternativebrowsing client with relative easy. If users could see the actual web pages of a site simply byhighlighting a triangle in the hierarchy, this software has the potential of becoming a first-ratesitemap tool. It would be interesting to see if Cheops could be adapted to display non-hierarchical, web-type network graph relationships as well.
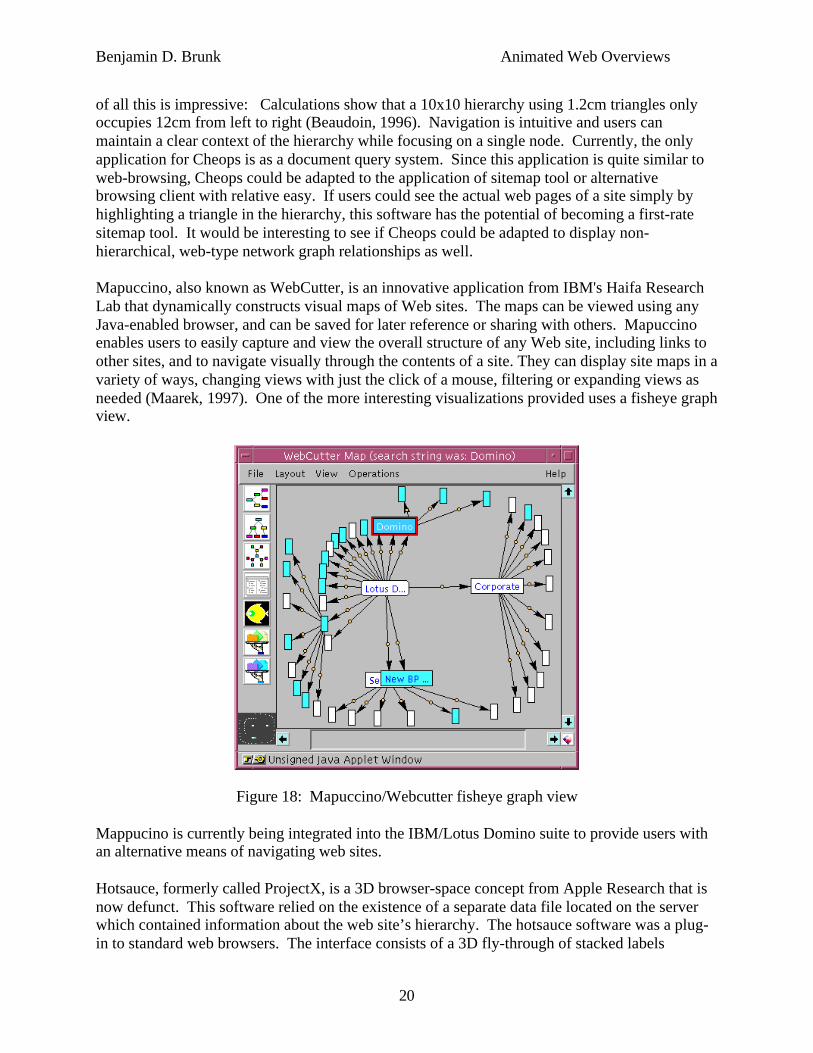
Mapuccino, also known as WebCutter, is an innovative application from IBM's Haifa ResearchLab that dynamically constructs visual maps of Web sites. The maps can be viewed using anyJava-enabled browser, and can be saved for later reference or sharing with others. Mapuccinoenables users to easily capture and view the overall structure of any Web site, including links toother sites, and to navigate visually through the contents of a site. They can display site maps in avariety of ways, changing views with just the click of a mouse, filtering or expanding views asneeded (Maarek, 1997). One of the more interesting visualizations provided uses a fisheye graphview.
Figure 18: Mapuccino/Webcutter fisheye graph view
Mappucino is currently being integrated into the IBM/Lotus Domino suite to provide users withan alternative means of navigating web sites.
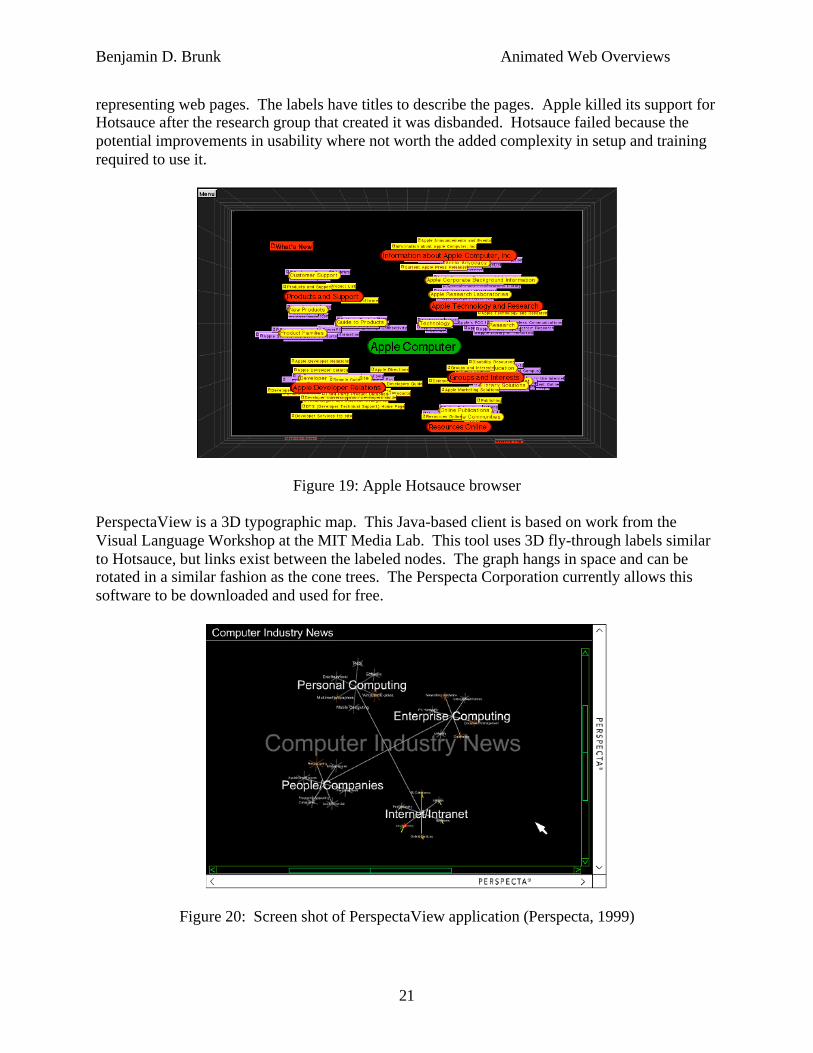
Hotsauce, formerly called ProjectX, is a 3D browser-space concept from Apple Research that isnow defunct. This software relied on the existence of a separate data file located on the serverwhich contained information about the web site’s hierarchy. The hotsauce software was a plug-in to standard web browsers. The interface consists of a 3D fly-through of stacked labels
Benjamin D. Brunk Animated Web Overviews
21
representing web pages. The labels have titles to describe the pages. Apple killed its support forHotsauce after the research group that created it was disbanded. Hotsauce failed because thepotential improvements in usability where not worth the added complexity in setup and trainingrequired to use it.
Figure 19: Apple Hotsauce browser
PerspectaView is a 3D typographic map. This Java-based client is based on work from theVisual Language Workshop at the MIT Media Lab. This tool uses 3D fly-through labels similarto Hotsauce, but links exist between the labeled nodes. The graph hangs in space and can berotated in a similar fashion as the cone trees. The Perspecta Corporation currently allows thissoftware to be downloaded and used for free.
Figure 20: Screen shot of PerspectaView application (Perspecta, 1999)
Benjamin D. Brunk Animated Web Overviews
22
PerspectaView is more interesting as a tool for mining information from non-web Internetsources such as Usenet News.
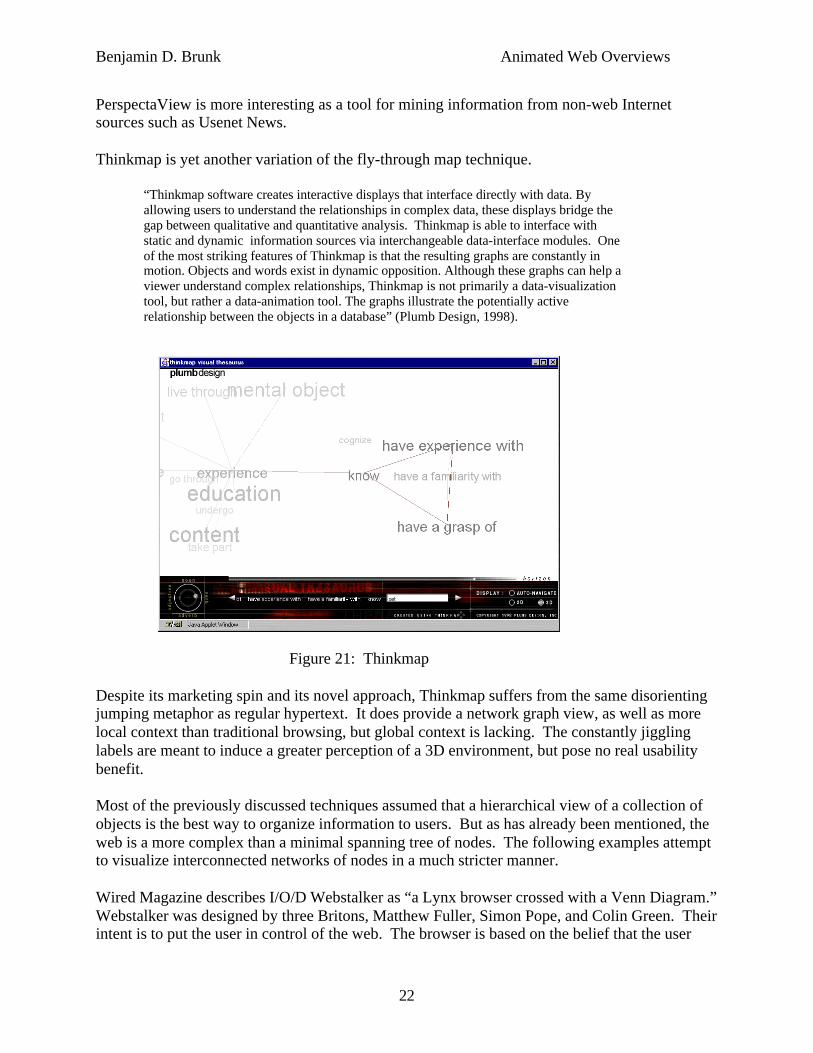
Thinkmap is yet another variation of the fly-through map technique.
“Thinkmap software creates interactive displays that interface directly with data. Byallowing users to understand the relationships in complex data, these displays bridge thegap between qualitative and quantitative analysis. Thinkmap is able to interface withstatic and dynamic information sources via interchangeable data-interface modules. Oneof the most striking features of Thinkmap is that the resulting graphs are constantly inmotion. Objects and words exist in dynamic opposition. Although these graphs can help aviewer understand complex relationships, Thinkmap is not primarily a data-visualizationtool, but rather a data-animation tool. The graphs illustrate the potentially activerelationship between the objects in a database” (Plumb Design, 1998).
Figure 21: Thinkmap
Despite its marketing spin and its novel approach, Thinkmap suffers from the same disorientingjumping metaphor as regular hypertext. It does provide a network graph view, as well as morelocal context than traditional browsing, but global context is lacking. The constantly jigglinglabels are meant to induce a greater perception of a 3D environment, but pose no real usabilitybenefit.
Most of the previously discussed techniques assumed that a hierarchical view of a collection ofobjects is the best way to organize information to users. But as has already been mentioned, theweb is a more complex than a minimal spanning tree of nodes. The following examples attemptto visualize interconnected networks of nodes in a much stricter manner.
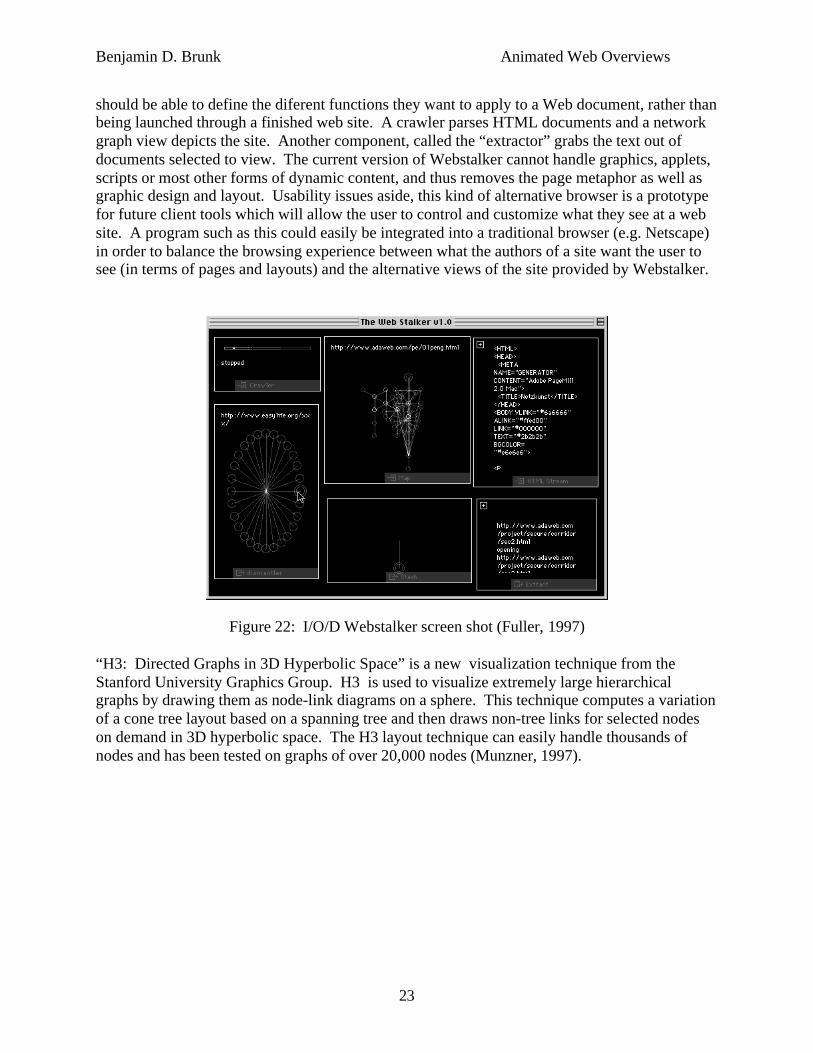
Wired Magazine describes I/O/D Webstalker as “a Lynx browser crossed with a Venn Diagram.”Webstalker was designed by three Britons, Matthew Fuller, Simon Pope, and Colin Green. Theirintent is to put the user in control of the web. The browser is based on the belief that the user
Benjamin D. Brunk Animated Web Overviews
23
should be able to define the diferent functions they want to apply to a Web document, rather thanbeing launched through a finished web site. A crawler parses HTML documents and a networkgraph view depicts the site. Another component, called the “extractor” grabs the text out ofdocuments selected to view. The current version of Webstalker cannot handle graphics, applets,scripts or most other forms of dynamic content, and thus removes the page metaphor as well asgraphic design and layout. Usability issues aside, this kind of alternative browser is a prototypefor future client tools which will allow the user to control and customize what they see at a website. A program such as this could easily be integrated into a traditional browser (e.g. Netscape)in order to balance the browsing experience between what the authors of a site want the user tosee (in terms of pages and layouts) and the alternative views of the site provided by Webstalker.
Figure 22: I/O/D Webstalker screen shot (Fuller, 1997)
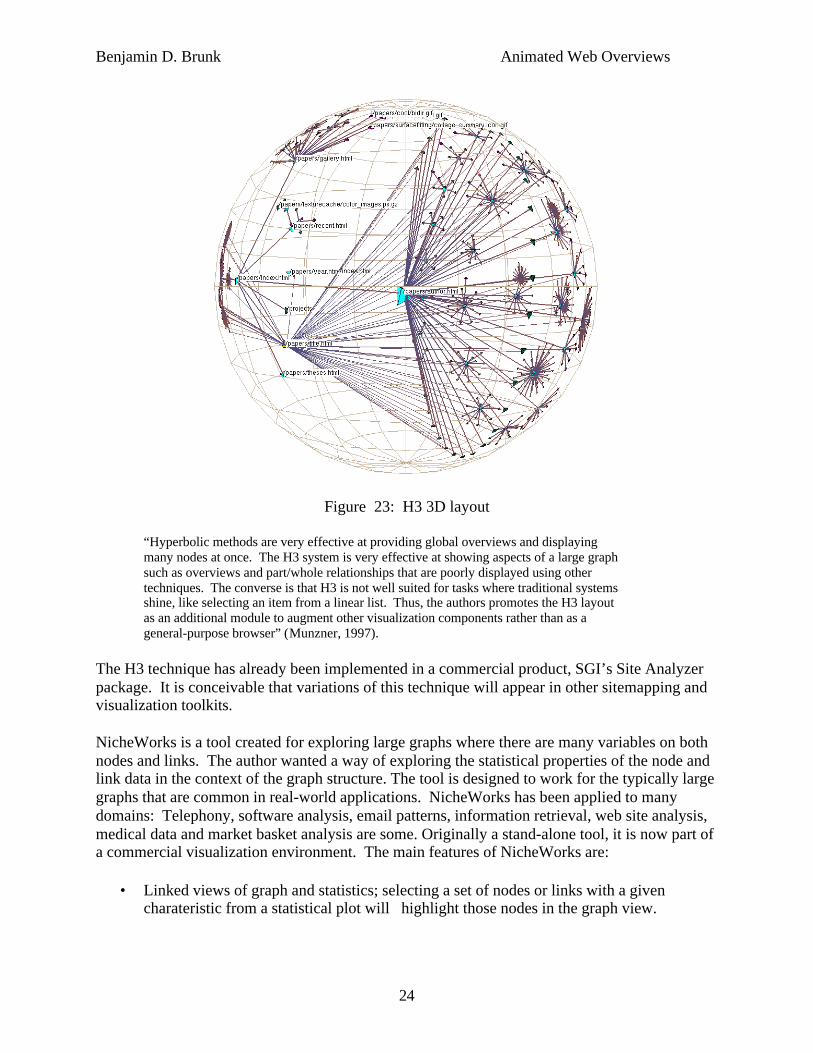
“H3: Directed Graphs in 3D Hyperbolic Space” is a new visualization technique from theStanford University Graphics Group. H3 is used to visualize extremely large hierarchicalgraphs by drawing them as node-link diagrams on a sphere. This technique computes a variationof a cone tree layout based on a spanning tree and then draws non-tree links for selected nodeson demand in 3D hyperbolic space. The H3 layout technique can easily handle thousands ofnodes and has been tested on graphs of over 20,000 nodes (Munzner, 1997).
Benjamin D. Brunk Animated Web Overviews
24
Figure 23: H3 3D layout
“Hyperbolic methods are very effective at providing global overviews and displayingmany nodes at once. The H3 system is very effective at showing aspects of a large graphsuch as overviews and part/whole relationships that are poorly displayed using othertechniques. The converse is that H3 is not well suited for tasks where traditional systemsshine, like selecting an item from a linear list. Thus, the authors promotes the H3 layoutas an additional module to augment other visualization components rather than as ageneral-purpose browser” (Munzner, 1997).
The H3 technique has already been implemented in a commercial product, SGI’s Site Analyzerpackage. It is conceivable that variations of this technique will appear in other sitemapping andvisualization toolkits.
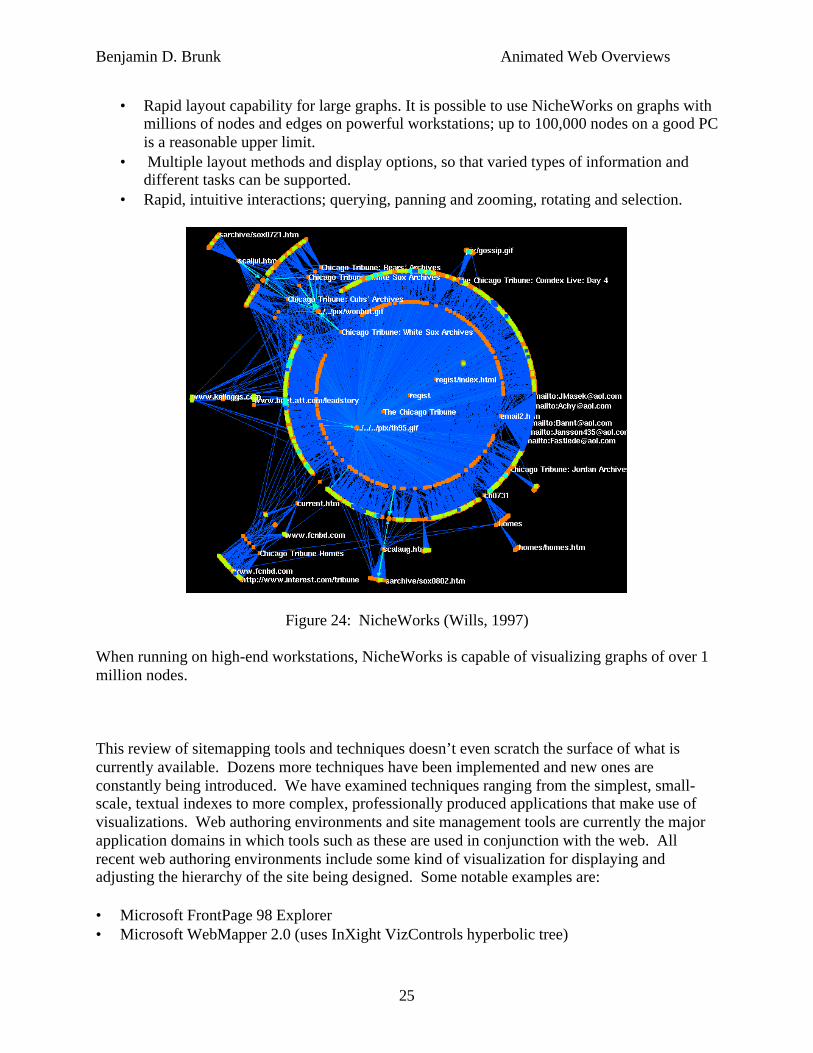
NicheWorks is a tool created for exploring large graphs where there are many variables on bothnodes and links. The author wanted a way of exploring the statistical properties of the node andlink data in the context of the graph structure. The tool is designed to work for the typically largegraphs that are common in real-world applications. NicheWorks has been applied to manydomains: Telephony, software analysis, email patterns, information retrieval, web site analysis,medical data and market basket analysis are some. Originally a stand-alone tool, it is now part ofa commercial visualization environment. The main features of NicheWorks are:
• Linked views of graph and statistics; selecting a set of nodes or links with a givencharateristic from a statistical plot will highlight those nodes in the graph view.
Benjamin D. Brunk Animated Web Overviews
25
• Rapid layout capability for large graphs. It is possible to use NicheWorks on graphs withmillions of nodes and edges on powerful workstations; up to 100,000 nodes on a good PCis a reasonable upper limit.
• Multiple layout methods and display options, so that varied types of information anddifferent tasks can be supported.
• Rapid, intuitive interactions; querying, panning and zooming, rotating and selection.
Figure 24: NicheWorks (Wills, 1997)
When running on high-end workstations, NicheWorks is capable of visualizing graphs of over 1million nodes.
This review of sitemapping tools and techniques doesn’t even scratch the surface of what iscurrently available. Dozens more techniques have been implemented and new ones areconstantly being introduced. We have examined techniques ranging from the simplest, small-scale, textual indexes to more complex, professionally produced applications that make use ofvisualizations. Web authoring environments and site management tools are currently the majorapplication domains in which tools such as these are used in conjunction with the web. Allrecent web authoring environments include some kind of visualization for displaying andadjusting the hierarchy of the site being designed. Some notable examples are:
• Microsoft FrontPage 98 Explorer• Microsoft WebMapper 2.0 (uses InXight VizControls hyperbolic tree)

Benjamin D. Brunk Animated Web Overviews
26
• Macromedia Dreamweaver/Allaire HomeSite• InContext WebAnalyzer 2.0• ClearWeb• Mercury Interactive Astra Site Manager• Visual Web• IXACTA Ixsite• SoftQuad’s HoTMetaL Pro (also uses InXight VizControls)• SGI Site Manager
It is not necessary to review all of these authoring tools individually since the marketingliterature for each of them is readily available. Most of them use variations of the techniquesalready discussed. Some, such as IXACTA’s Ixsite and Mercury Interactive’s Astra SiteManager use novel techniques not discussed. Curious readers should refer to Appendix A at theend of this paper for the web site addresses of these companies.
To conclude, the biggest limitation of hand-made sitemaps as a whole is that can only depict amodest number of pages and they rely on the skill, inventiveness, and thoroughness of theircreators. In comparison, data driven techniques are more scaleable. Data-driven sitemappingtools are usually software programs. While these tools require less work and less creativity to setup, many are not cheap and all have to be installed and tested by someone working on the server-side. The data-driven products are mostly prototypes, and those that are commercially availablesuffer from user interface problems. Only a few of the data-driven tools have found their wayinto browser add-ons or stand-alone, alternative web navigation tools. Sophisticated webauthoring environments are one place where users can get access to automatic sitemapping tools.Unfortunately, the average user of the web does not have access to authoring tools and would notunderstand how to use their sitemapping features. Moreover, it is not desirable to use a webauthoring environment as a navigational tool solely to reap the benefits of their sitemappingfeatures.
The final section of this paper introduces a technique using animation to present previewinformation of a web site’s content. The goal is to approach sitemapping in a temporal, ratherthan spatial manner. Our intent is not to supersede or replace any of the tools and techniquesdescribed in the literature review, but rather to use it in conjunction with those other techniquesin order to bolster their effectiveness as web navigation and sitemapping tools. The overall goalis to give every user of the web a selection of readily accessible and sophisticated sitemapping,preview, overview and alternative browsing mechanisms. This is one small step towards thatgoal.
Animated Previews
Today, nearly all web pages include some form of distinguishable graphics (e.g. a companylogo) that users might associate in memory with that page (Czerwinski, 1999). It is notnecessary to see them in full-size to recognize what they are, but they do have to be visible. Website visitors should be able to get a general idea of subject matter and what is available there by‘flying’ above the site and overviewing it from one vantage point. The region of interest is any

Benjamin D. Brunk Animated Web Overviews
27
collection or logical subset of a site someone might want to get a preview or overview of. Just asan airborne traffic reporter can see a whole city or focus on a smaller area that is of immediateinterest, it would be helpful for a web site’s visitors to be able to selectively preview andoverview the entire site as a whole, or a chosen subset of pages.
This paper has examined numerous tools and techniques for mapping web sites and improvingweb navigation. We have seen that server-side sitemapping is somewhat limited by the lack ofstandards and other problems. As a response to that, we approach the problem from the clientside instead. This Java applet provides people browsing a web site the ability to get a quick,animated preview of a site’s content by actually looking at the pages themselves. Its overallconcept is to trade space for time, providing users with a temporal view of a web site’s hierarchyof hypertext pages. It animates through a series of reduced (zoomed out) images of the pagesavailable at the site. It is a slide show, of sorts, with short text descriptions associated with eachpage displayed. The user has control over the speed at which the frames are presented. Whenthe user moves the cursor over the thumbnail of a page, the animation pauses. Clicking on theimage causes their web browser to display the selected page in full size.
One application envisioned for this tool is to change the way that users interact with web searchfacilities. Currently, users performing a search get back a long list of URLs and have to click oneach one to examine the site for the information they are looking for. Instead of doing this, theanimated preview tool can be used to crawl all or part of a site and generate on-the-fly previewsand overviews of it. The user can then look at the preview and overview information of severalof the entries in their list, using this information to decide whether the site is relevant to them ornot. When they find something that is relevant, the tool will allow them to quickly navigate tothe actual site in a regular browser window and browse normally from there.
First Prototype
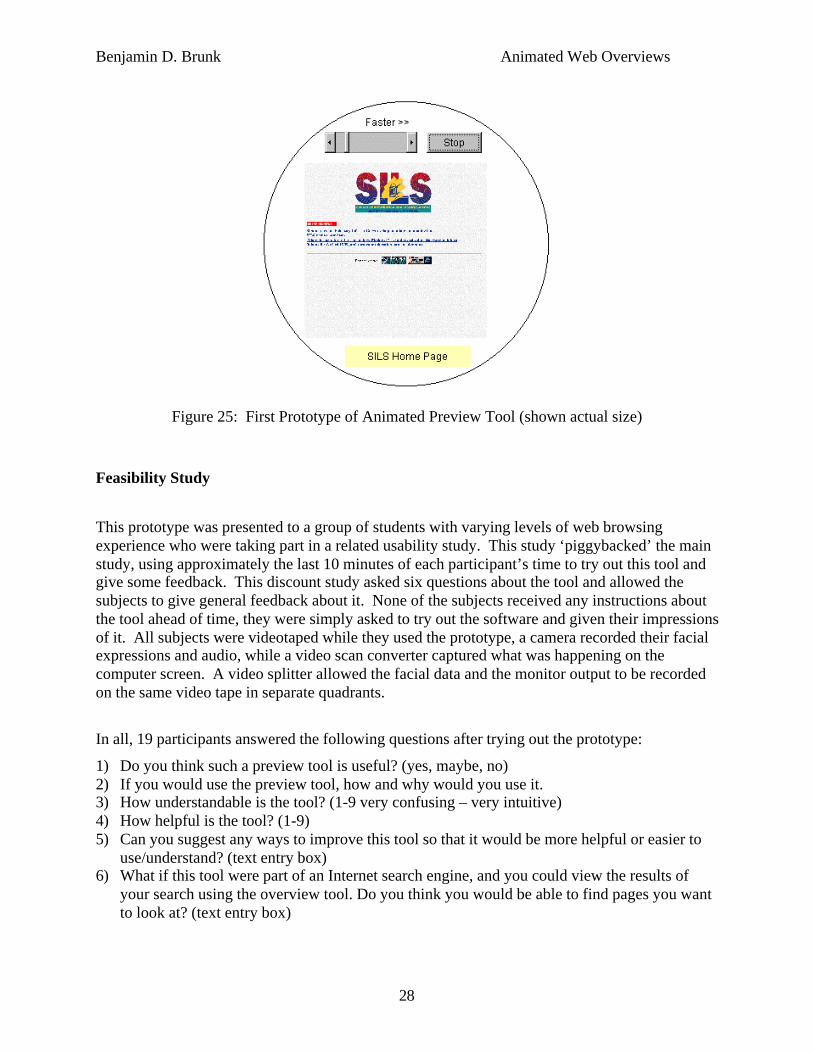
The first prototype of this tool was created in January, 1999. An example of this tool can beviewed at: http://squash.ils.unc.edu/overview/s1.html. This example provides an overwiew ofthe UNC School of Information and Library Science (SILS) web site, http://ils.unc.edu. Itprovided the functionality described above, but was hard-coded to preview only the SILS site.This prototype displayed a continuous loop of web pages stored as jpeg images that weregathered by hand from the site using an image capture tool. The collection of images mirroredthe site’s hypertext sitemap. Every page from the sitemap was shown in the order it was listedfrom the top of the page to the bottom, along with a short text description of the page, whichnormally consisted of the page’s title. After all the pages were shown, the “show” immediatelyrestarted from the main page. Users of the tool had only rudimentary control of the action: Theycould control the rate of animation (from full stop to 5ms per image--imperceptibly fast) andthey could stop the animation by putting the mouse pointer over the image or by clicking on thestop/restart button. Clicking on the image caused their web browser to open a new window atthe actual page, allowing them a full-size, normal hypertext view of it.
Benjamin D. Brunk Animated Web Overviews
28
Figure 25: First Prototype of Animated Preview Tool (shown actual size)
Feasibility Study
This prototype was presented to a group of students with varying levels of web browsingexperience who were taking part in a related usability study. This study ‘piggybacked’ the mainstudy, using approximately the last 10 minutes of each participant’s time to try out this tool andgive some feedback. This discount study asked six questions about the tool and allowed thesubjects to give general feedback about it. None of the subjects received any instructions aboutthe tool ahead of time, they were simply asked to try out the software and given their impressionsof it. All subjects were videotaped while they used the prototype, a camera recorded their facialexpressions and audio, while a video scan converter captured what was happening on thecomputer screen. A video splitter allowed the facial data and the monitor output to be recordedon the same video tape in separate quadrants.
In all, 19 participants answered the following questions after trying out the prototype:
1) Do you think such a preview tool is useful? (yes, maybe, no)2) If you would use the preview tool, how and why would you use it.3) How understandable is the tool? (1-9 very confusing – very intuitive)4) How helpful is the tool? (1-9)5) Can you suggest any ways to improve this tool so that it would be more helpful or easier to
use/understand? (text entry box)6) What if this tool were part of an Internet search engine, and you could view the results of
your search using the overview tool. Do you think you would be able to find pages you wantto look at? (text entry box)

Benjamin D. Brunk Animated Web Overviews
29
The results of the study were encouraging, even for such a primitive prototype. For the firstquestion, 8 subjects responded yes, 9 were less committal, answering maybe, and only 2 felt thatsuch a tool would not be at all useful. Bear in mind that no explanation was given to the subjectsabout the eventual functionality that might be added.
The answers to the second question indicate that the subjects understood the possibleapplications for a fully featured preview program.
Some example answers were:
“You are capable of getting a quick overview (or slow) for possiblethings that would interest you. It takes the point and click part outfor you.”
“To get a quick overview of what is on a website.”
“I would use it if I were familiar with a website already. That way itcould flip through all the pages and I could quickly get to what Iwanted.”
“To get an overall idea of what the site addresses.”
“I would use it to quickly peruse a web site's content. To see ifthere were any useful links or pages that I might be missing out on.”
“[I would use it] so I could quickly evaluate what is on the websiteand determine whether it is going to be useful to my research.”
The results for question three marginally supports the conclusion that users understand thepossible uses for such a tool. The mean rating was 5.9 on a 1-9 scale.
Question four mirrored question three, asking how helpful they felt the tool was, also on a 1-9scale. The mean answer was 5.6. One interpretation is that some subjects understood that thiswas only a prototype and could grasp its future potential while others only considered the actualfeatures of the prototype.
The fifth question asked for suggestions about how to improve the tool. Nearly all subjects madesome comment about the size of the preview image being too small or the text too blurry to read.Some excerpts follow:
“Make it slightly larger so that you can actually read what is on thepage a little bit (not necessarily details, just enough to get a betteridea of what's on the page).”
Benjamin D. Brunk Animated Web Overviews
30
“Perhaps make the pages a bit bigger. Or maybe a little moredetail on the subject headings at the bottom of the images.”
“Make the overview tool bigger so the contents of each page wouldbe more discernible.”
Answers to the final question were also enlightening:
“I think I would, but I might waste time by missing the page that Iwas looking for, and then sitting through the rotation again.”
“Possibly. If you could see the headings of the pages instead of thefull page in the small confines of the tool. Make it larger and easierto read the headings of the pages.”
“I think I could find the pages I wanted.”
“No, because unless you're familiar with the sites, you don't knowwhich site is the best or the better site(s).”
“Maybe. It would be helpful if I could see the overview of a site toknow what type of site it was, without having to read a descriptionfrom a search engine. I could have looked at the overview for eachof the applicable pages that came up in my search, and then usethat overview to eliminate inapplicable page[s].”
Though in retrospect, not all the questions were properly worded, the results do indicate thatthese subjects understood the potential of the animated previews technique. Thus, furtherdevelopment of the prototype is warranted.
Second Prototype (Future Work)
Clearly, the first prototype was extremely limited in features.
After the first proof of concept, the goals for the next version are quite clear:
1) Make relevant hierarchical information visible by providing a second view of the site in theform of a table of contents or hierarchical tree view (a la Windows Explorer).
2) Decrease the time it takes to look at a site or group of pages.3) Allow the user to select a subset of pages at a site and then provide a quick overview of them.4) Slightly increase the size of the images so text is readable and graphics are more clear. Or
allow users to choose the size (include some kind of zooming feature).5) Tie this functionality to a web search engine.6) Allow users to load their bookmarks file instead of a search result list.

Benjamin D. Brunk Animated Web Overviews
31
The next version of the tool will be more fully-featured and capable of being used with any website published on the Internet. The actual user interface features are still being considered, butthe major components have already been specified. The most important feature will be that of alive web browser engine receiving data from a web crawler component. Future technical reportsand papers will describe the complete design and will include a far more exhaustive user study aswell.
Conclusion
The need for new visualization tools and alternative browsing techniques for navigating theWorld Wide Web has never been more important. People of all skill levels require better toolsfor searching and browsing on the web. One way to achieve this is to standardize web sitemapsso that all web sites can conform to some kind of sitemap standard. However, standardizingsitemaps will not be easy, nor will it be very popular given the free-form nature of the web circa1999. Another option is to create browsing software with built-in alternative viewingmechanisms that can be uniformly applied to any web site. Alternative browsing tools allowusers to generate their own previews and overviews of sites and not have to rely solely on thenavigation features furnished by a site’s designers.
Acknowledgments
Special thanks to Gary Marchionini, Greg Newby, Paul Kahn (whose online lecture provided abasis for the literature review) and the folks who run cybergeography.org, Martin Dodge et al(the Atlas of Cyberspace).

Benjamin D. Brunk Animated Web Overviews
32
References
Abrams, D. B., Ron. (1997). How People Use WWW Bookmarks. Paper presented at the ACMSIG CHI 97.
Amento, B. H., Will; Terveen, Loren; Hix, Deborah; Ju, Peter. (1999). An Empirical Evaluationof User Interfaces for Topic Management of Web Sites. Proceedings of CHI 99, 552-559.
Apple, C. I. (1995). Apple Computer Corporate Web Site Sitemap. Available:http://www.apple.com/find.
Beaudoin, L. P., Marc-Antoine; Vroomen, Louis C. (1996). Cheops: A Compact Explorer forComplex Hierarchies. Available: http://www.crim.ca/hci/cheops/paper.html.
Boeing. (1999). The Boeing Company Site Map. Available:http://www.boeing.com/utilities/sitemap/sitemap.htm.
Card, S. K., Robertson, G. G., & Mackinlay, J. D. (1991). The Information Visualizer, AnInformation Workspace. Proceedings of ACM CHI '91 Conference on Human Factors inComputing Systems, 181-188.
Conklin, J. E. (1987). Hypertext: An Introduction and Survey. IEEE Computer, 20, 17-41.Coral Sky. (1998). Coral Sky Amphitheater Sitemap. Available: http://www.coralsky.com/.Czerwinski, M. D., Susan; Robertson, George; Dziadosz, Susan; Tiernan, Scott; van Dantzich,
Maarten. (1999). Visualizing Implicit Queries For Information Management andRetrieval. Proceedings of CHI 99, 560-567.
Däßler, R. (1998). Visual Metaphors for Representing Information, Lecture Notes . FH Potsdam,Germany.
Dynamic Diagrams, I. (1999). Dynamic Diagrams MAPA Software. Available:http://www.dynamicdiagrams.com.
Electrum Multimedia, I. (1999). PowerMapper 2.0. Available: http://www.be.com/jobs/listings-mp.html.
FerretSoft, I. (1999). Web Ferret. Available: http://www.ferretsoft.com/netferret/index.html.Fuller, M. P., Simon; Green, Colin. (1997). I/O/D Webstalker. I/O/D. Available:
http://www.backspace.org/iod/index.html.Furnas, G. W. (1986). Generalized Fisheye Views. Proceedings of ACM CHI '86 Conference on
Human Factors in Computer Systems, 16-23.Furnas, G. W. (1997). Effective View Navigation. Proceedings of ACM CHI97, 367-374.Greene, S. M., Gary; Plaisant, Catherine ; Shneiderman, Ben. (1999). Previews and Overviews in
Digital Libraries: Designing Surrogates to Support Visual Information Seeking. .Honkela, T. K., S.; Kohonen, T.; Lagus, K. (1998). Self-organizing maps of very large
document collections: Justification for the WEBSOM method. In I. M. Balderjahn, R.,;Schader, M (Ed.), Classification, Data Analysis, and Data Highways (pp. 245-252).Berlin: Springer.
IBMWR. (1998). Internet BMW Rider's Marketplace. Available:http://www.concentric.net/~mdnolan/market/.
Inxight Software, I. (1998). Inxight Hyperbolic Tree Demos. Inxight Software, Inc. Available:http://www.inxight.com.
Kahn, P. (1999). Mapping Web Sites -- Planning Diagrams to Site Maps, [WWW]. Available:http://dynamicdiagrams.com/seminars/mapping/maptoc.htm.
Lamping, J., & Rao, R. (1996). Visualizing Large Trees Using the Hyperbolic Browser.Proceedings of CHI '96.

Benjamin D. Brunk Animated Web Overviews
33
Lin, X. (1999). Visual SiteMap. Available: http://faculty.cis.drexel.edu/sitemap/index.html.Maarek, Y. S. J., Michal; Shtalhaim, Menachem; Ur, Sigalit; Zernik, Dror; Shaul, Israel Z. Ben.
(1997). WebCutter: A System for Dynamic and Tailorable Site Mapping. Available:http://decweb.ethz.ch/WWW6/Technical/Paper040/Paper40.html.
Mackinlay, J. D., Robertson, G. G., & Card, S. K. (1991). The Perspective Wall: Detail andContext Smoothly Integrated. Proceedings of ACM CHI '91 Conference on HumanFactors in Computing Systems, 173-179.
MerzCom. (1998). MerzScope Sitemap Tool. MerzCom Inc. Available:http://www.merzcom.com/try/index.html.
Mitsubishi, M., Inc. UK. (1998). Mitsubishi Motors, UK Sitemap. .Mukherjea, S. F., James D. (1995). Visualizing the World-Wide Web with the Navigational
View Builder. Proceedings of ACM CHI95.Munzner, T. (1997). H3: Laying Out Large Directed Graphs in 3D Hyperbolic Space.
Proceedings of IEEE Symposium on Information Visualization, 2-10.NASA. (1998). NASA Home Page Sitemap. Available: http://www.nasa.gov/siteindex.html.Nation, D. A. P., Catherine;Marchionini, Gary;Komlodi, Anita. (1997). Visualizing websites
using a hierarchical table of contents browser: WebTOC. Conference on Designing forthe Web, Practice & Reflections.
Nielsen, J. (1990). Hypertext & Hypermedia. San Diego, CA: Academic Press.Perspecta, I. (1999). PerspectaView Software. Available: http://www.perspecta.com/.Plumb Design, I. (1998). Thinkmap. Available: http://www.thinkmap.com.Robertson, G. G. (1991). Cone Trees: Animated 3D visualizations of hierarchical information.
Proceedings of ACM CHI '91 Conference on Human Factors in Computing Systems, 189-194.
Rosenfeld, L. M., Peter. (1998). Information Architecture for the World Wide Web. Sebastopol,CA: O'Reilly & Associates, Inc.
Shneiderman, B. (1992). Tree visualization with Tree-maps: A 2-d space-filling approach. ACMTransactions on Graphics, 11(1 (Jan. 1992)), 92-99.
SILS. (1998). School of Information and Library Science Home Page, UNC Chapel Hill.Available: http://ils.unc.edu/.
Starnine. (1995). Starnine LiveIndex Applet. Available: http://www.starnine.com.TDED. (1998). Texas Dept. of Economic Development Sitemap. Available:
http://www.tded.state.tx.us/site-map.htm.Unknown. (1996). IE 4.0 Sitemap tool. Microsoft Corporation. Available:
http://www.mindspring.com/~ggking3/pages/sitemap.htm.Wills, G. J. (1997). NicheWorks - Interactive Visualization of Very Large Graphs. Lucent
Technologies. Available: http://www.bell-labs.com/user/gwills/NICHEguide/niche.html.
Benjamin D. Brunk Animated Web Overviews
34
Appendix A: URLs to commercial product sites
• Microsoft FrontPage 98 Explorer http://www.microsoft.com/frontpage• Microsoft Site Analyst / WebMapper 2.0 (uses InXight VizControls hyperbolic tree)
http://www.microsoft.com/backoffice/default2.htm• Macromedia Dreamweaver/Allaire HomeSite http://www.macromedia.com• InContext WebAnalyzer 2.0 http://www.incontext.com• ClearWeb http://www.clearweb.com• Mercury Interactive Astra Site Manager http://www.merc-int.com/products/astrasitemanager• Visual Web http://world.isg.de/World/2_Internet/Visual_Web/index.html• IXACTA Ixsite http://www.ixacta.com• SoftQuad’s HoTMetaL Pro (also uses InXight VizControls) http://www.softquad.com• SGI Site Manager (uses the H3 technology) http://www.sgi.com/software/sitemgr.html