overview 3 radiation r.a.ms final - oak ridge national ... · protection agency (epa), administered...
TRANSCRIPT

Overview of
Radiation
Risk and
Dose
Assessment
Models for
Overview of Radiation Risk and Dose
Assessment Models for Radioactively
Contaminated Sites and Selected Default
Input Parameters
By
Nasser Shubayr, PhD
U.S. EPA Research Fellow, ORISE
October, 2017

ACKNOWLEDGMENTS
This project was supported in part by an appointment to the Research Participation Program at
the Office of Superfund Remediation and Technology Innovation, U.S. Environmental
Protection Agency (EPA), administered by the Oak Ridge Institute for Science and Education
(ORISE), through an interagency agreement between the U.S. Department of Energy and EPA.
This project was under the supervision of Mr. Stuart Walker of the EPA. Special thanks to all of
the reviewers, listed below, for their valuable inputs and critiques that improved this paper.
-Karessa L. Manning, University of Tennessee/Oak Ridge National Laboratory
-Fredrick G. Dolislager, University of Tennessee/Oak Ridge National Laboratory
-Debra J. Stewart, University of Tennessee/Oak Ridge National Laboratory
i
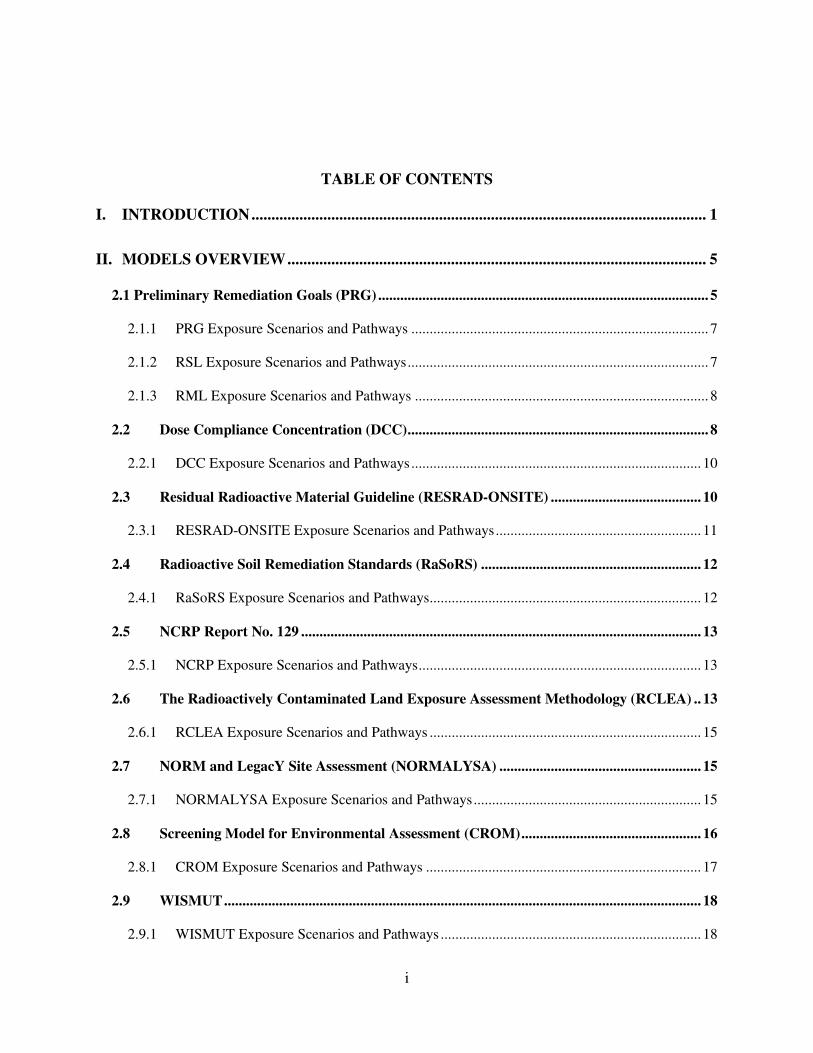
TABLE OF CONTENTS
I. INTRODUCTION .................................................................................................................. 1
II. MODELS OVERVIEW ......................................................................................................... 5
2.1 Preliminary Remediation Goals (PRG) .......................................................................................... 5
2.1.1 PRG Exposure Scenarios and Pathways ................................................................................. 7
2.1.2 RSL Exposure Scenarios and Pathways .................................................................................. 7
2.1.3 RML Exposure Scenarios and Pathways ................................................................................ 8
2.2 Dose Compliance Concentration (DCC) .................................................................................. 8
2.2.1 DCC Exposure Scenarios and Pathways ............................................................................... 10
2.3 Residual Radioactive Material Guideline (RESRAD-ONSITE) ......................................... 10
2.3.1 RESRAD-ONSITE Exposure Scenarios and Pathways ........................................................ 11
2.4 Radioactive Soil Remediation Standards (RaSoRS) ............................................................ 12
2.4.1 RaSoRS Exposure Scenarios and Pathways .......................................................................... 12
2.5 NCRP Report No. 129 ............................................................................................................. 13
2.5.1 NCRP Exposure Scenarios and Pathways ............................................................................. 13
2.6 The Radioactively Contaminated Land Exposure Assessment Methodology (RCLEA) .. 13
2.6.1 RCLEA Exposure Scenarios and Pathways .......................................................................... 15
2.7 NORM and LegacY Site Assessment (NORMALYSA) ....................................................... 15
2.7.1 NORMALYSA Exposure Scenarios and Pathways .............................................................. 15
2.8 Screening Model for Environmental Assessment (CROM) ................................................. 16
2.8.1 CROM Exposure Scenarios and Pathways ........................................................................... 17
2.9 WISMUT .................................................................................................................................. 18
2.9.1 WISMUT Exposure Scenarios and Pathways ....................................................................... 18

ii
III. DEFAULT INPUT PARAMETERS .................................................................................. 19
3.1 Physiological Factors ............................................................................................................... 20
3.2 Occupancy Factors .................................................................................................................. 23
3.3 Dietary Factors for Human Food Consumption ................................................................... 26
3.3.1 Drinking Water Intake ........................................................................................................... 26
3.3.2 Fruits, Vegetables and Grains Consumption Rates ............................................................... 28
3.3.3 Milk/ Dairy and Meat Consumption Rates............................................................................ 32
3.3.4 Fish & Seafood Consumption Rates ..................................................................................... 38
3.4 Animal Consumption Rates .................................................................................................... 41
3.5 Soil Consumption Rates: ......................................................................................................... 45
3.6 Shielding Factors ..................................................................................................................... 49
3.7 Mass Loading Factors ............................................................................................................. 50
IV. CONCLUSION ..................................................................................................................... 52
REFERENCES: .......................................................................................................................... 59
APPENDIX A: PRG/DCC ......................................................................................................... 61
APPENDIX B: RESRAD ........................................................................................................... 64
APPENDIX C: NORMALYSA ................................................................................................. 65
APPENDIX D: CROM ............................................................................................................... 67
APPENDIX E: RCLEA .............................................................................................................. 68
APPENDIX F: RaSoRS .............................................................................................................. 70
APPENDIX G: WISMUT .......................................................................................................... 71
APPENDIX H: NCRP ................................................................................................................ 73
iii
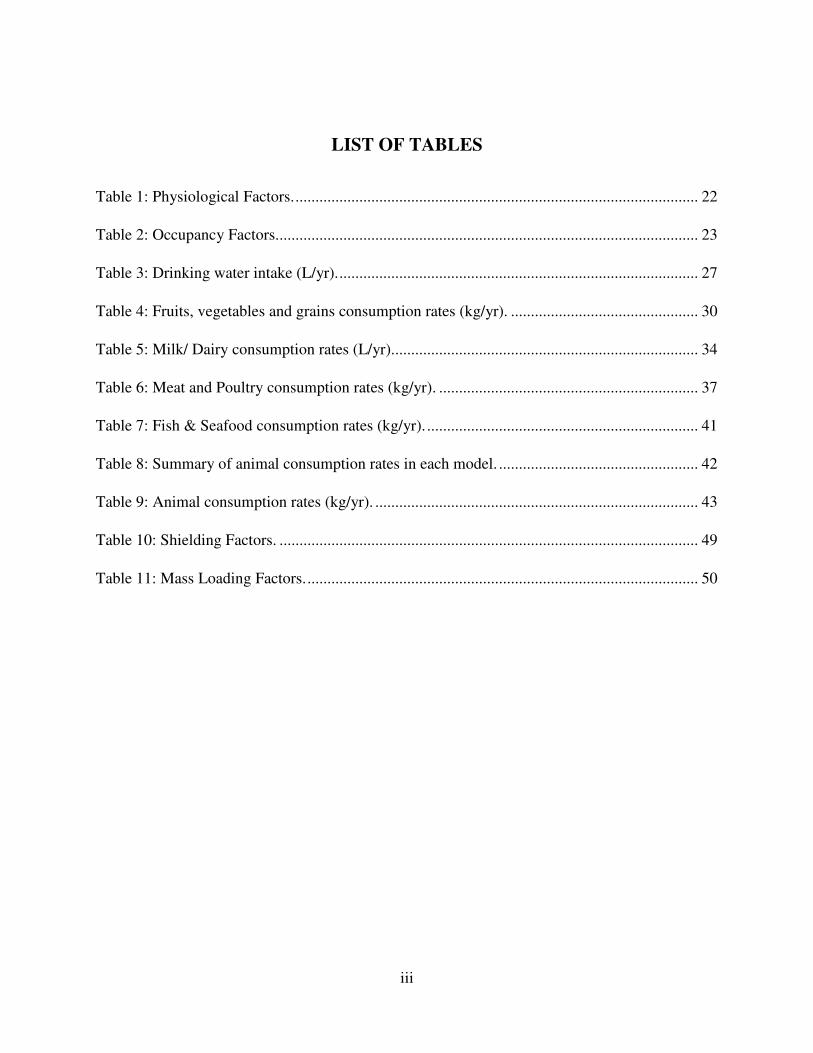
LIST OF TABLES
Table 1: Physiological Factors. ..................................................................................................... 22
Table 2: Occupancy Factors. ......................................................................................................... 23
Table 3: Drinking water intake (L/yr). .......................................................................................... 27
Table 4: Fruits, vegetables and grains consumption rates (kg/yr). ............................................... 30
Table 5: Milk/ Dairy consumption rates (L/yr)............................................................................. 34
Table 6: Meat and Poultry consumption rates (kg/yr). ................................................................. 37
Table 7: Fish & Seafood consumption rates (kg/yr). .................................................................... 41
Table 8: Summary of animal consumption rates in each model. .................................................. 42
Table 9: Animal consumption rates (kg/yr). ................................................................................. 43
Table 10: Shielding Factors. ......................................................................................................... 49
Table 11: Mass Loading Factors. .................................................................................................. 50

iv
LIST OF FIGURES
Figure 1: PRG calculator website homepage. ................................................................................. 5
Figure 2: DCC calculator website homepage. ................................................................................ 9
Figure 3: RESRAD-ONSITE. ....................................................................................................... 11
Figure 4: RaSoRS spreadsheet. ..................................................................................................... 12
Figure 5: RCLEA spreadsheet. ..................................................................................................... 14
Figure 6: NORMALYSA. ............................................................................................................. 16
Figure 7: CROM. .......................................................................................................................... 17
Figure 8: Number of crop types included in each model. ............................................................. 30
Figure 9: Milk/ Dairy consumption rates (L/yr). .......................................................................... 33
Figure 10: Meat and Poultry consumption rates for adult (kg/yr). ............................................... 35
Figure 11: Meat and Poultry consumption (child & infant) (kg/yr). ............................................ 36
Figure 12: Fish & Seafood consumption for adult........................................................................ 39
Figure 13: Fish & Seafood consumption for infant and child. ..................................................... 40
Figure 14: Fodder, soil and water consumption rates for Cattle. .................................................. 44
Figure 15: Soil consumption rates for adult (kg/yr)...................................................................... 46
Figure 16: Soil consumption rates for child (orange) and infant (gray) (kg/yr). .......................... 47
Figure 17: Models categories. ....................................................................................................... 53
Figure 18: PRG/DCC Soil to Plant Transfer Factor. .................................................................... 57
Figure 19: PRG/DCC Soil Transfer Factors. ................................................................................ 58
1
I. INTRODUCTION
The release of radioactive materials to the environment or the atmosphere can pose risks to
ecosystems and people. Heavily radioactively contaminated sites have been found in many
countries, where drinking water and soil are threatened due to the radioactive contamination. The
potential risks from radionuclides have become a well-known problem. People can be exposed
via different media (soil, water and air). Many agencies have developed and/or recommended
particular radiation risk or dose assessment models for addressing contaminated sites, which
become an important tool for decision makers. Other Agencies have developed look-up tables in
reports for soil screening guidelines.
Modeling and monitoring are necessary to comply with regulations and to determine the
need for remediation, in case a contaminated site constitutes a danger for people or the
environment. The radiation risk assessment models are usually used to analyze the exposure
sources and scenarios in order to produce guidelines for remediation and clean up actions.
Generic assessment requires minimal information about the contaminated site, and the default
input parameters may be used. Advanced assessment requires site-specific data for the relevant
scenarios and pathways. Site-specific data can reduce uncertainties and make the assessment
more realistic.
There are many radiation risk assessment models used in the United States and other
countries; however, they do not have identical assumptions, scenarios or calculations. Some
models are fairly simple to use and address a more narrow scope of scenarios; others are more
technically advanced and deal with a wide range of scenarios. Generally, the models use a set of
calculations, where the inputs are the parameters for the relevant exposure scenario described by
mathematical equations and the output is risk or dose. They are simplified by technical and

2
scientific assumptions to represent a real-world environmental problem. They are also associated
with uncertainties of scenarios and parameters. The general components of the models are
similar in terms of selecting radionuclides, media, type and scenario of exposure, receptor and
output (risk/dose). Some models have been developed as software and others as an Excel
spreadsheet or reports.
This document is an overview of radiation risk and dose assessment models, including the
exposure scenarios and pathways and review of selected default input parameters used by each
model. The objective of this overview is to make recommendations on technical and practical
issues to the U.S. Environmental Protection Agency (EPA) Office of Superfund Remediation and
Technology Innovation (OSRTI), facilitating better understanding of each agency’s modeling
approach and identifying the similarities and differences between these agencies in the risk and
dose assessment of radioactively contaminated sites. This document is not intended to be a direct
comparison between models, because each model was formed and derived based on a specific
regulatory frame that could be different from one agency to another.
This document also discusses several models issued for chemical risk assessment that are
generally consistent with the agencies’ radiation models. The radiation sites addressed by OSRTI
also have chemical contamination, and its regulations and policies for Superfund sites call for
risk assessments to demonstrate that the selected remedy will meet the one in 10,000 to one in a
million cancer (10-4 to 10-6) risk range for all carcinogens. This means the cancer risks from
chemical carcinogens and radionuclides are summed. Since it has been EPA’s longstanding
policy that similar models should be used for the chemical and radionuclide risk assessments so
that the results are consistent when summed, it was deemed prudent to include, in this study,
chemical models issued by governmental entities that also have radionuclide models.

3
This study did not look at transport functions of some of the models. The models issued by
EPA for Superfund chemical and radionuclide risk assessments are steady state models without
source depletion from mechanisms such as runoff, as are the risk assessment approaches for
Superfund sites issued by state regulatory programs. Therefore, it was determined that looking at
such aspects in other models, which are generally not used in Superfund risk assessments, would
not be useful to the study sponsors.
This study focused on models that were issued or recommended by regulatory programs.
The study sponsors were most interested in reviewing the default parameters and risk assessment
approaches that other governmental agencies had adopted. Attempting to include every model
that has been used for radiation risk or dose assessment at a site would have greatly expanded the
scope of the project and hindered its completion.
This study also focused solely on deterministic, rather than probabilistic, models. The
models issued and recommended by EPA for radiation risk and dose assessment are
deterministic models. EPA’s policy for Superfund radiation risk assessment states that
probabilistic risk assessment may be used to provide quantitative estimates of the uncertainties in
the risk assessment; however, probabilistic estimates of risk may then be presented as a
supplement to, not instead of, the deterministic methods.
During the study development, this project was discussed with different groups to see if
there was further information/models that would be useful to include. This research project was
presented or discussed in the following conferences and meetings:
• Health Physics Society Meeting, 22 January 2017, Bethesda, MD, USA
• Waste Management Conference, March 5, 2017, Phoenix, AZ, USA

4
• The Interagency Performance & Risk Assessment Community of Practice (P&RA CoP),
hosted by the US Department of Energy, April 19, 2017, USA
• IAEA MODARIA II Working Group 1: Assessment and Decision Making of Existing
Exposure Situations for NORM and Nuclear Legacy Sites, June 30, 2017, Brussels,
Belgium

5
II. MODELS OVERVIEW
2.1 Preliminary Remediation Goals (PRG)
Preliminary Remediation Goals for Radionuclide Contaminants at Superfund Sites (PRG)
is an electronic calculator developed by the U.S. Environmental Protection Agency. The PRG
calculator presents risk-based standardized exposure parameters and equations that should be
used for calculating radionuclide PRGs for residential, commercial/industrial, and agricultural
land use exposures from soil, tap water, air and biota (Figure 1).
Figure 1: PRG calculator website homepage.

6
The calculator also presents PRGs to protect groundwater, which are determined by
calculating the concentration of radioactively contaminated water leaching from radioactively
contaminated soil to groundwater that will meet maximum contaminant levels (MCLs) or risk-
based concentrations. Calculated PRGs can be produced generically (considered to be protective
for humans, including the most sensitive groups) or using site-specific data for 1255
radionuclides in the PRG calculator which may be found at: https://epa-
prgs.ornl.gov/radionuclides/. The PRG calculator was first issued in 2002 and last updated in
2017. [1]
The PRG calculator is also consistent with EPA’s Regional Screening Level for Chemical
Contaminants at Superfund Sites (RSL) calculator, which is the recommended risk assessment
model for chemicals in soil, water, and air and may be found at:
https://www.epa.gov/risk/regional-screening-levels-rsls. The RSL calculator is almost identical
to the chemical risk assessment calculator for emergency and time-critical removal actions,
called the Regional Removal Management Levels for Chemicals (RMLs), which may be found
at: https://epa-rals.ornl.gov/.
7
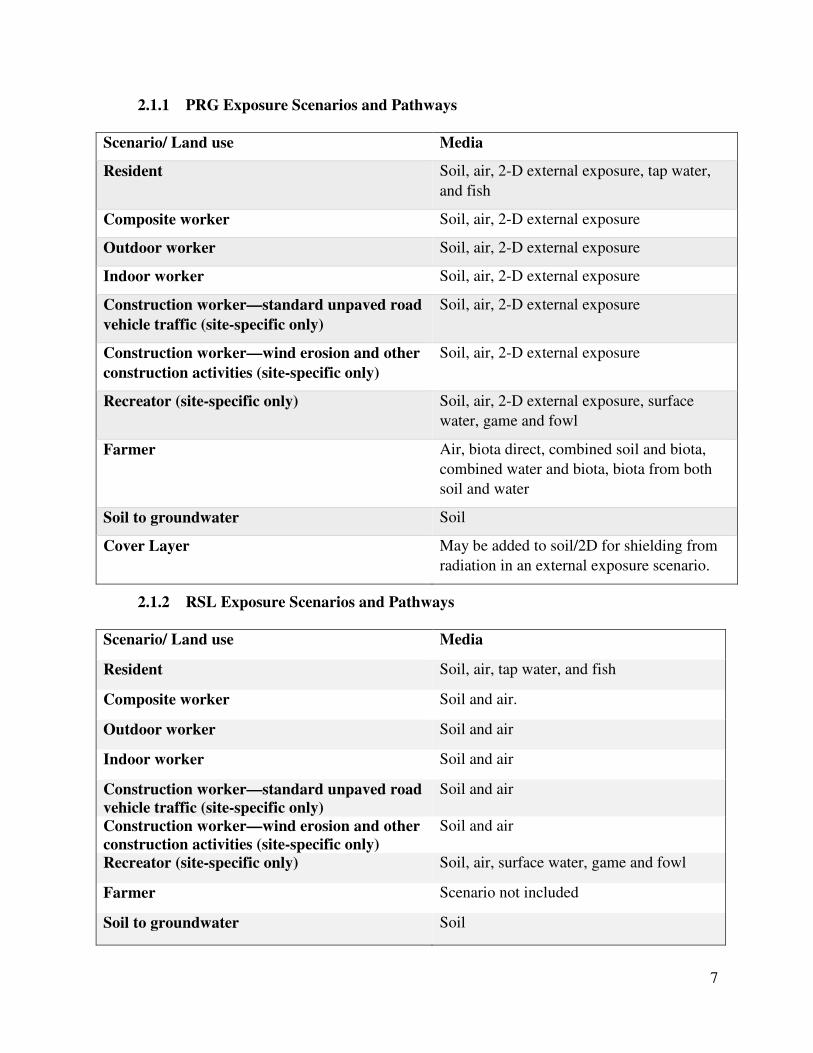
2.1.1 PRG Exposure Scenarios and Pathways
Scenario/ Land use Media
Resident Soil, air, 2-D external exposure, tap water,
and fish
Composite worker Soil, air, 2-D external exposure
Outdoor worker Soil, air, 2-D external exposure
Indoor worker Soil, air, 2-D external exposure
Construction worker—standard unpaved road
vehicle traffic (site-specific only)
Soil, air, 2-D external exposure
Construction worker—wind erosion and other
construction activities (site-specific only)
Soil, air, 2-D external exposure
Recreator (site-specific only) Soil, air, 2-D external exposure, surface
water, game and fowl
Farmer Air, biota direct, combined soil and biota,
combined water and biota, biota from both
soil and water
Soil to groundwater Soil
Cover Layer May be added to soil/2D for shielding from
radiation in an external exposure scenario.
2.1.2 RSL Exposure Scenarios and Pathways
Scenario/ Land use Media
Resident Soil, air, tap water, and fish
Composite worker Soil and air.
Outdoor worker Soil and air
Indoor worker Soil and air
Construction worker—standard unpaved road
vehicle traffic (site-specific only)
Soil and air
Construction worker—wind erosion and other
construction activities (site-specific only)
Soil and air
Recreator (site-specific only) Soil, air, surface water, game and fowl
Farmer Scenario not included
Soil to groundwater Soil
8
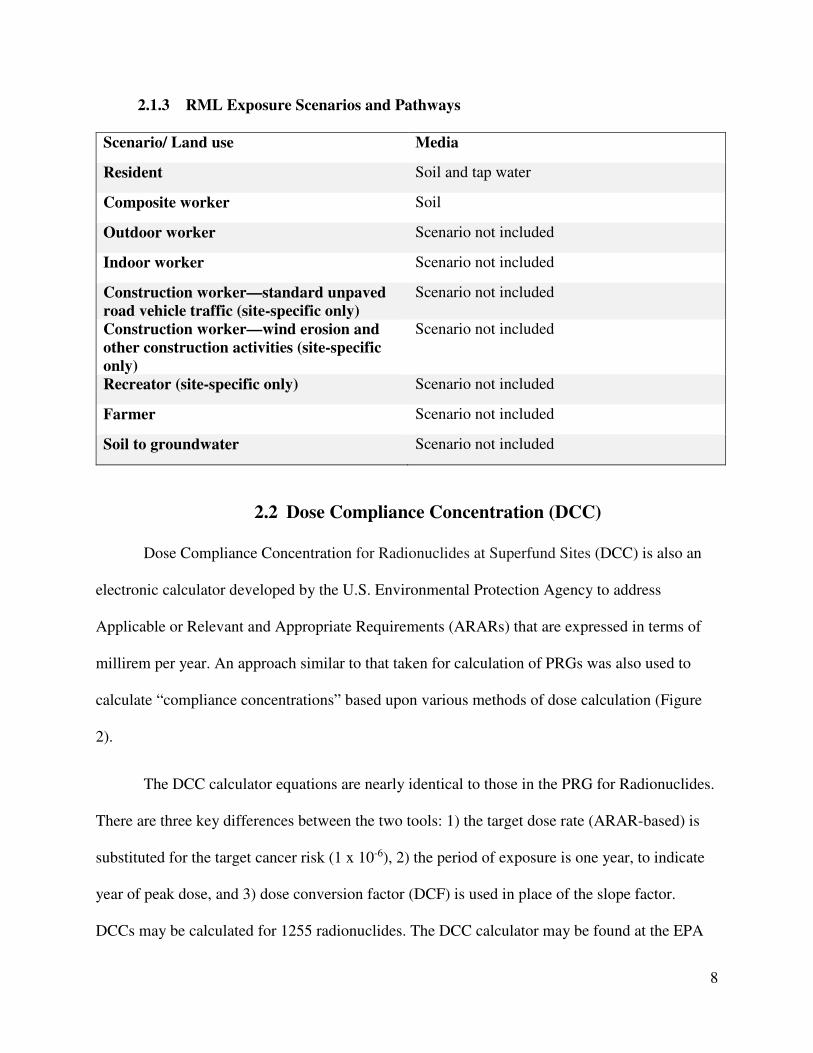
2.1.3 RML Exposure Scenarios and Pathways
Scenario/ Land use Media
Resident Soil and tap water
Composite worker Soil
Outdoor worker Scenario not included
Indoor worker Scenario not included
Construction worker—standard unpaved
road vehicle traffic (site-specific only)
Scenario not included
Construction worker—wind erosion and
other construction activities (site-specific
only)
Scenario not included
Recreator (site-specific only) Scenario not included
Farmer Scenario not included
Soil to groundwater Scenario not included
2.2 Dose Compliance Concentration (DCC)
Dose Compliance Concentration for Radionuclides at Superfund Sites (DCC) is also an
electronic calculator developed by the U.S. Environmental Protection Agency to address
Applicable or Relevant and Appropriate Requirements (ARARs) that are expressed in terms of
millirem per year. An approach similar to that taken for calculation of PRGs was also used to
calculate “compliance concentrations” based upon various methods of dose calculation (Figure
2).
The DCC calculator equations are nearly identical to those in the PRG for Radionuclides.
There are three key differences between the two tools: 1) the target dose rate (ARAR-based) is
substituted for the target cancer risk (1 x 10⁻⁶), 2) the period of exposure is one year, to indicate
year of peak dose, and 3) dose conversion factor (DCF) is used in place of the slope factor.
DCCs may be calculated for 1255 radionuclides. The DCC calculator may be found at the EPA

9
website: https://epa-dccs.ornl.gov/. The DCC calculator was first issued in 2004 and last updated
in 2017. [2]
Figure 2: DCC calculator website homepage.

10
2.2.1 DCC Exposure Scenarios and Pathways
Scenario/ Land use Media
Resident Soil, air, 2-D external exposure, tap water,
and fish
Composite worker Soil, air, 2-D external exposure
Outdoor worker Soil, air, 2-D external exposure
Indoor worker Soil, air, 2-D external exposure
Construction worker—standard unpaved
road vehicle traffic (site-specific only)
Soil, air, 2-D external exposure
Construction worker—wind erosion and
other construction activities (site-specific
only)
Soil, air, 2-D external exposure
Recreator (site-specific only) Soil, air, 2-D external exposure, surface
water, game and fowl
Farmer Air, biota direct, combined soil and biota,
combined water and biota, biota from both
soil and water
Soil to groundwater
Cover Layer
Soil
May be added to soil/ 2D for shielding
from radiation in an external exposure
scenario.
2.3 Residual Radioactive Material Guideline (RESRAD-ONSITE)
RESidual RADioactive material guidelines (RESRAD-ONSITE) is a computer model
developed by Argonne National Laboratory for the U.S. Department of Energy (DOE) to
calculate site-specific guidelines, radiation doses and excess lifetime cancer risk to a receptor
chronically exposed on-site to residual radioactive materials (Figure 3). Although DOE is not
regulating non-DOE sites, RESRAD-ONSITE is included in this study, since NRC
recommendeds its use for NRC licensed sites as well as NRC’s DandD code. RESRAD-ONSITE
was first issued in 1989 and updated last in 2016. RESRAD-ONSITE can be downloaded at:
http://www.evs.anl.gov/resrad/. [3]

11
Figure 3: RESRAD-ONSITE.
2.3.1 RESRAD-ONSITE Exposure Scenarios and Pathways
RESRAD-ONSITE has major exposure pathways; direct exposure to external radiation
from the contaminated soil material; Internal exposure from inhalation of airborne radionuclides;
Internal exposure from inhalation of radon progeny; and internal exposure from ingestion of:
plant foods grown in the contaminated soil and irrigated with contaminated water, meat and milk
from livestock fed with contaminated fodder and water, drinking water from a contaminated well
or pond, fish from a contaminated pond, and contaminated soil.
12
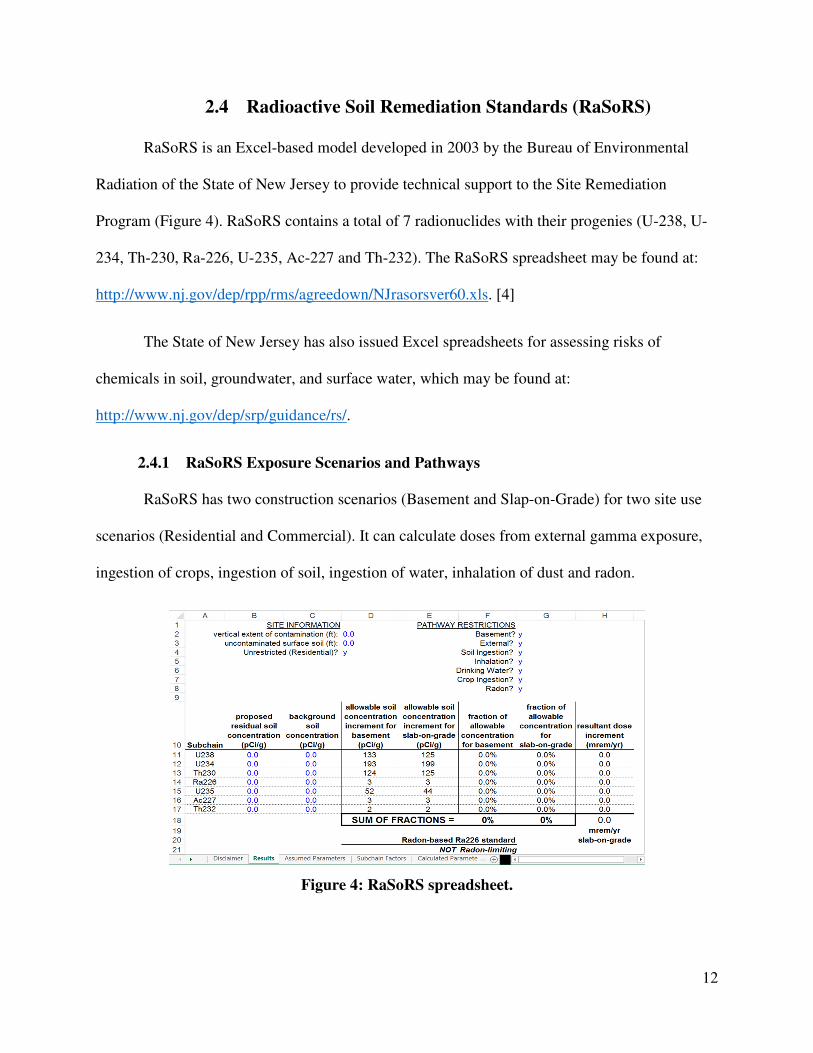
2.4 Radioactive Soil Remediation Standards (RaSoRS)
RaSoRS is an Excel-based model developed in 2003 by the Bureau of Environmental
Radiation of the State of New Jersey to provide technical support to the Site Remediation
Program (Figure 4). RaSoRS contains a total of 7 radionuclides with their progenies (U-238, U-
234, Th-230, Ra-226, U-235, Ac-227 and Th-232). The RaSoRS spreadsheet may be found at:
http://www.nj.gov/dep/rpp/rms/agreedown/NJrasorsver60.xls. [4]
The State of New Jersey has also issued Excel spreadsheets for assessing risks of
chemicals in soil, groundwater, and surface water, which may be found at:
http://www.nj.gov/dep/srp/guidance/rs/.
2.4.1 RaSoRS Exposure Scenarios and Pathways
RaSoRS has two construction scenarios (Basement and Slap-on-Grade) for two site use
scenarios (Residential and Commercial). It can calculate doses from external gamma exposure,
ingestion of crops, ingestion of soil, ingestion of water, inhalation of dust and radon.
Figure 4: RaSoRS spreadsheet.

13
2.5 NCRP Report No. 129
The National Council on Radiation Protection and Measurements (NCRP) published a
report entitled “Recommended Screening Limits for Contaminated Surface Soil and Review of
Factors Relevant to Site Specific Studies”, report No. 129. It lists screening guidance for over
200 radionuclides with half-lives greater than 30 days. The limits were calculated by dividing
0.25 mSv by the calculated maximum screening total dose per unit soil concentration in Sieverts.
[5]
2.5.1 NCRP Exposure Scenarios and Pathways
The NCRP report no. 129 contains soil guidelines for several Land-Use Scenarios, such
as Agricultural (AG), Heavily Vegetated Pasture (PV), Sparsely Vegetated Pasture (PS), Heavily
Vegetated Rural (RV), Sparsely Vegetated Rural (RS), Suburban (SU), No Food Suburban (SN),
and Construction, Commercial, Industrial (CC). The exposure pathways considered in NCRP
include external radiation exposure, beta-ray skin dose, ingestion of contaminated foodstuffs,
direct and indirect ingestion of soil by human and animals, and both indoor and outdoor
inhalation of resuspended material. [5]
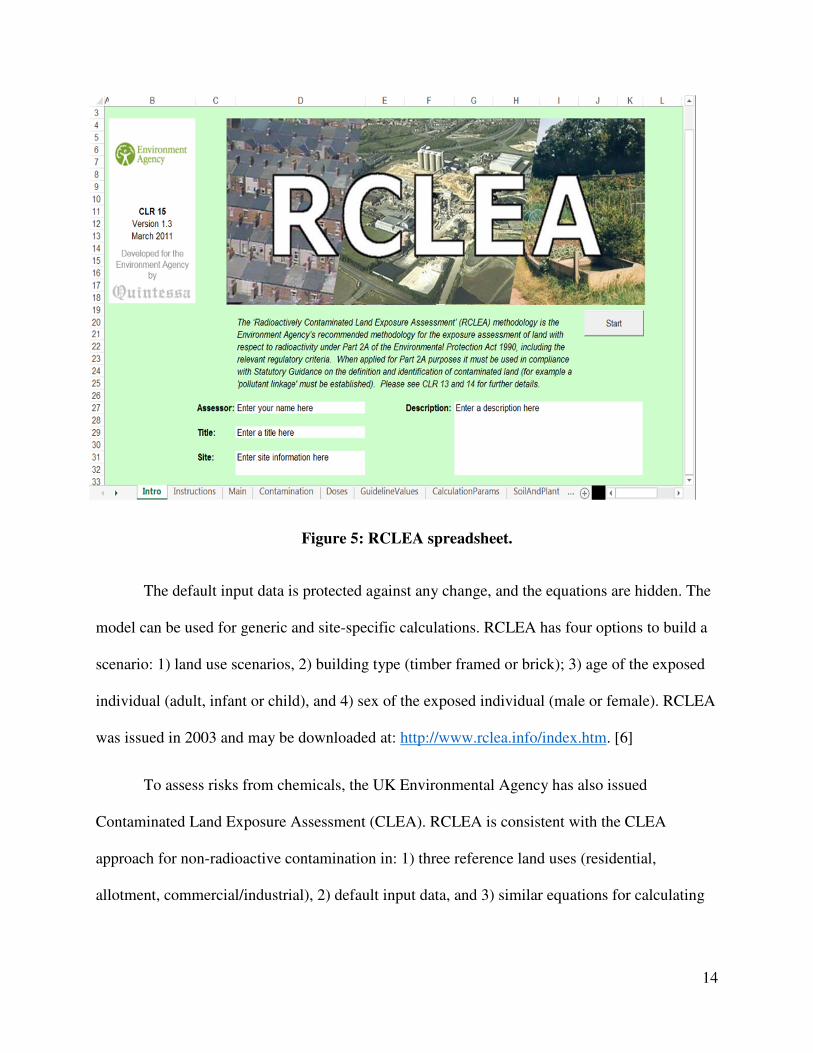
2.6 The Radioactively Contaminated Land Exposure Assessment
Methodology (RCLEA)
The Radioactively Contaminated Land Exposure Assessment Methodology (RCLEA) is a
mathematical model developed by Quintessa in support of the U.K. Government Department for
Environment, Food and Rural Affairs (DEFRA) Part IIA for managing contaminated land in the
UK. RCLEA is an Excel file with a collection of worksheets that contain all input data and
results (Figure 5).
14
Figure 5: RCLEA spreadsheet.
The default input data is protected against any change, and the equations are hidden. The
model can be used for generic and site-specific calculations. RCLEA has four options to build a
scenario: 1) land use scenarios, 2) building type (timber framed or brick); 3) age of the exposed
individual (adult, infant or child), and 4) sex of the exposed individual (male or female). RCLEA
was issued in 2003 and may be downloaded at: http://www.rclea.info/index.htm. [6]
To assess risks from chemicals, the UK Environmental Agency has also issued
Contaminated Land Exposure Assessment (CLEA). RCLEA is consistent with the CLEA
approach for non-radioactive contamination in: 1) three reference land uses (residential,
allotment, commercial/industrial), 2) default input data, and 3) similar equations for calculating

15
the potential intake of radionuclides in contaminated soil. CLEA may be downloaded at:
https://www.gov.uk/government/publications/contaminated-land-exposure-assessment-clea-tool.
2.6.1 RCLEA Exposure Scenarios and Pathways
RCLEA contains four scenarios: Residential with Home-Grown Produce, Residential
without Home-Grown Produce, Allotments, and Commercial/Industrial. It can calculate doses
from whole body external irradiation, ingestion, dermal contact, inhalation, consumption of
homegrown produce, and inhalation of Rn-222 gas indoors. [6]
2.7 NORM and LegacY Site Assessment (NORMALYSA)
NORMALYSA is risk assessment model developed by the International Atomic Energy
Agency (IAEA) MODARIA I, Working Group 3, to assess radiological impacts arising from
NORM and radioactively contaminated legacy sites to support remediation (Figure 6).
NORMALYSA library of models consists of four components: Sources (radionuclide releases to
ecosystems), Transport pathways, Receptors, and Dose (exposed human) [7].
2.7.1 NORMALYSA Exposure Scenarios and Pathways
SOURCE TRANSPORT RECEPTOR DOSE
Tailing without cover Groundwater Cropland Occupancy
Tailing with Cover Surface runoff Garden Ingestion
Atmospheric Pastureland Total
Forest
Land
Marine
Freshwater body
Well
House

16
Figure 6: NORMALYSA.
2.8 Screening Model for Environmental Assessment (CROM)
CROM is a model developed by the University of Madrid and the Environmental Impact
of the Energy Department (CIEMAT) to calculate radionuclide concentrations in different
environments and their impact in the nutritional chain as well as dose in human beings
(Figure 7).
The model is based on Safety Report Series No. 19, published by the International
Atomic Energy Agency (IAEA), “Generic Models for Use in Assessing the Impact of Discharges
of Radioactive Substances to the Environment”. CROM has a default database with 151
Radionuclides and can be used for continuous and prolonged release to the environment. CROM

17
was first issued in 2011 and updated last in 2016. The latest version may be downloaded from:
ftp://ftp.ciemat.es/pub/CROM/CROM_8/. [8]
Figure 7: CROM.
2.8.1 CROM Exposure Scenarios and Pathways
CROM can be used for residence and farm land uses. It can assess the release of
radionuclides to the environment for eight scenarios: Atmospheric dispersion, Dispersion in
rivers, Dispersion in estuaries, Dispersion in coastal waters, Dispersion in small lakes and ponds,
Hypothetical critical groups and food concentrations, Human doses, and Biota assessment.
Radiation dose can be calculated for irradiation from: air submersion, ground deposition, water
immersion while swimming, shore sediments, intake due to food ingestion, intake due to water
ingestion, and incorporation due to inhalation.
18
2.9 WISMUT
The WISMUT model, “Calculation Guide Mining”, is developed by the Germany Federal
Laender and the WISMUT GmbH to assess radiation exposure for the public and workers due to
environmental radioactivity resulting from mining. The name “WISMUT” refers to the areas in
Saxony and Thuringia in Germany that were adversely affected by more than 40 years of
unrestrained mining and processing of uranium ores. The WISMUT model is developed with
special considerations for the WISMUT region, such as levels of natural background for all
relevant environmental media in the area. It is applicable for remediation, decommissioning,
reuse of mining plants and installations. The WISMUT model is not available in English and not
accessible due to a copyright agreement [9]; however, an English language version of the
WISMUT model User Guide was provided for this analysis.
2.9.1 WISMUT Exposure Scenarios and Pathways
WISMUT can be used for the following scenarios: indoors (dwellings and public
buildings), commercial buildings, underground workplaces (only inhalation of radon and its
short-lived decay products), outdoors, ingestion of breast milk, and locally produced food
(vegetable and animal products, as well as water). It can calculate doses from external exposure
to gamma radiation from soil, exposure from inhalation of dust, exposure from inhalation of
radon and its short-lived decay products, exposure from ingestion of breast milk, exposure from
ingestion of locally produced foods (drinking water, fish, milk and milk products, meat and meat
products, leafy vegetables and other vegetable products), and exposure from direct soil ingestion.
[9]

19
III. DEFAULT INPUT PARAMETERS
Radiation risk assessment models have default input parameters for relevant exposure
scenarios and pathways that can be used for the initial assessment. The default input parameters
are an important part of the models that may be used for generic assessment and when site-
specific data is not available. Sometimes, acquiring site-specific data is costly. It requires field
measurements and public surveys, which require more time and effort. Certain parameters are
not readily obtained, and risk assessors need to apply these parameters to run the models, so they
would use the default input parameters. Default parameters in models, issued and/or
recommended by regulatory agencies, usually provide users with the ability to run a model that
will result in concentrations that should be suitable for regulatory compliance or screening
purposes from risk or dose limits for a given land use. If the default parameters in a model are
conservative, then the regulator may allow the use of some site-specific parameters to replace
defaults when sufficiently justified.
The default input parameters used by the models have different numerical values. There
are a number of considerations that can lead to this variability, such as inter individual variability
(age, sex, and human behavior and habits, where intake can vary between different groups of
humans), spatial variability, and temporal variability [10]. In addition, regulatory scheme can
affect the values of some parameters. For example, the EPA uses the consumption rate for the
Reasonable Maximum Exposed (RME) for an individual, which is a mixture of 50th and 95th or
90th percentile parameters for an upper bound exposure, while the US Nuclear Regulatory
Commission (NRC) uses the parameters for average group member of the critical group. NRC
tends to select unrestricted land use. EPA uses the reasonably anticipated land use, which is
usually a restricted land use with less exposure.

20
The variability of the default input parameters would influence the output of the
assessment. Also, some models have parameters that are not considered by other models. The
following section is an overview of the default input parameters of the models. This overview
shows the variability of selected parameters. Parameters have been converted to be in the same
units. For PRG/DCC, the unit for consumption rate for food is per day; the consumption is
converted to a year based on 350 days/yr assumed in the calculators for the farmer and resident
scenarios. Same names and categories of parameters from each model have been listed in the
tables below and graphed for better presentation. The default input parameters for PRG/DCC,
RESRAD-ONSITE, RCLEA and CROM were obtained from the models, user’s manuals, and
the main references used to develop the models. NOMALYSA has no user’s manual, so the
parameters were taken directly from the model. Parameters for RaSoRS were obtained from the
Excel spreadsheet. WISMUT is not available in English but has a user’s manual in English,
which was used to find the related parameters. NCRP report 129 was the source of the NCRP
default parameters that are listed in this document. Appendices at the end of this document list
the original default input parameters from sources before conversions to similar units.
3.1 Physiological Factors
Physiological factors in this document focus on sex, age and breathing rate.
The only model that differentiates in the sex of receptors is RCLEA. For age, all models have
parameters for both children and adults except RESRAD-ONSITE, RaSoRS and NCRP. These
three models have only default input parameters for adult. NCRP has only one parameter for
children, which is the soil consumption rate. Breathing rate is usually the most important factor
for determining the inhalation dose. Adults have higher breathing rates than children in a given
context. The breathing rates are much higher for adults based on the occupation. For instance,

21
construction worker has a higher breathing rate than farmer. RESRAD-ONSITE has breathing
rates for four scenarios (Resident Farmer, Suburban Resident, Industrial Worker, Recreationist).
NORMALYSA and CROM have two parameters for breathing rate (infant/child and adult).
RCLEA has numerous default input parameters for breathing rate for active and passive
breathing for different ages and sexes. RCLEA contains a total of 12 default input parameters for
breathing rates. The male adults have the highest active breathing rate compared to female adults
and male child/infants. RaSoRS has two different adult breathing rate parameters for indoor and
outdoor; it is the only model that differentiates between indoor and outdoor breathing rate.
WISUMT usually contains seven parameters for breathing rate that increase with age. NCRP has
outdoor breathing rates for all NCRP land uses and indoor breathing rates only for heavily
vegetated rural, sparsely vegetated rural, and suburban land uses.

22
Table 1: Physiological Factors.
Model Sex Age Breathing Rates (m³/h)
PRG, DCC, RSL
N/A
Child 0.41 Resident, Recreator, Farmer
Adult 0.83 Resident, Recreator, Farmer
2.5 Construction & Composite Worker
RESRAD
(ON-SITE)
N/A
Adult
Resident
Farmer
Suburban
Resident
Industrial Worker Recreationist
0.95 0.95 1.3 1.6
NORMALYSA N/A Infant 0.92
Child 0.64
RCLEA*
Male
Active Passive
Infant 0.339 0.124
Child 1.103 0.404
Adult 1.456 0.485
Female
Infant 0.32 0.117
Child 1.1 0.403
Adult 1.234 0.411
CROM
N/A
Adult 0.95
Infant 0.16
0-1 0.16
1--2 0.22
2--7 0.36
7--12 0.64
12--17 0.84
>17 0.95
RaSoRS
N/A
Adult Indoor on site Outdoor on site
Residential 0.63 1.4
Commercial 1.4 1.4
WISMUT
N/A
≤ 1 0.12
1 - 2 0.22
2 - 7 0.36
7 - 12 0.64
12 -17 0.84
> 17 0.93
Worker 1.2
NCRP N/A Adult
Land-use Outdoor Indoor
Agricultural 1.4 -
Heavily Vegetated Pasture 1.4 -
Sparsely vegetated pasture 1.4 -
Heavily Vegetated rural 1.25 0.83
Sparsely Vegetated rural 1.25 0.83
Suburban 1.04 0.83
Construction, etc. 1.4 -
* Note that the breathing rates are consistent with the CLEA methodology. [11]
23
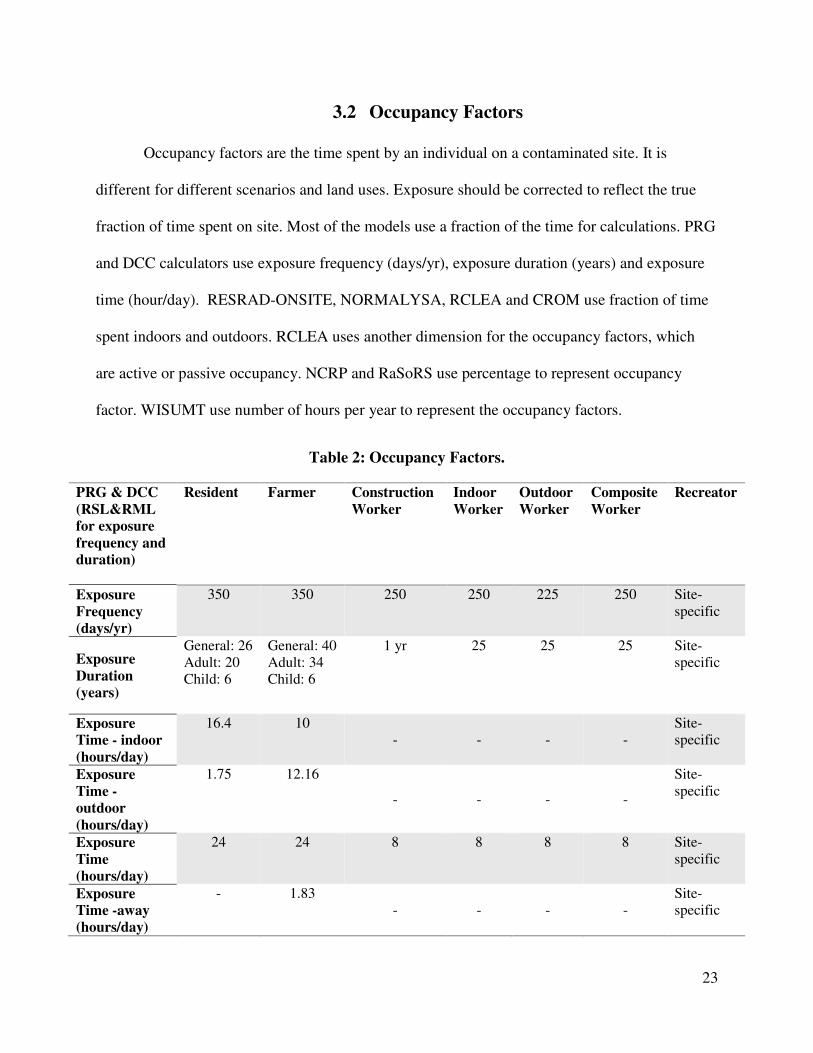
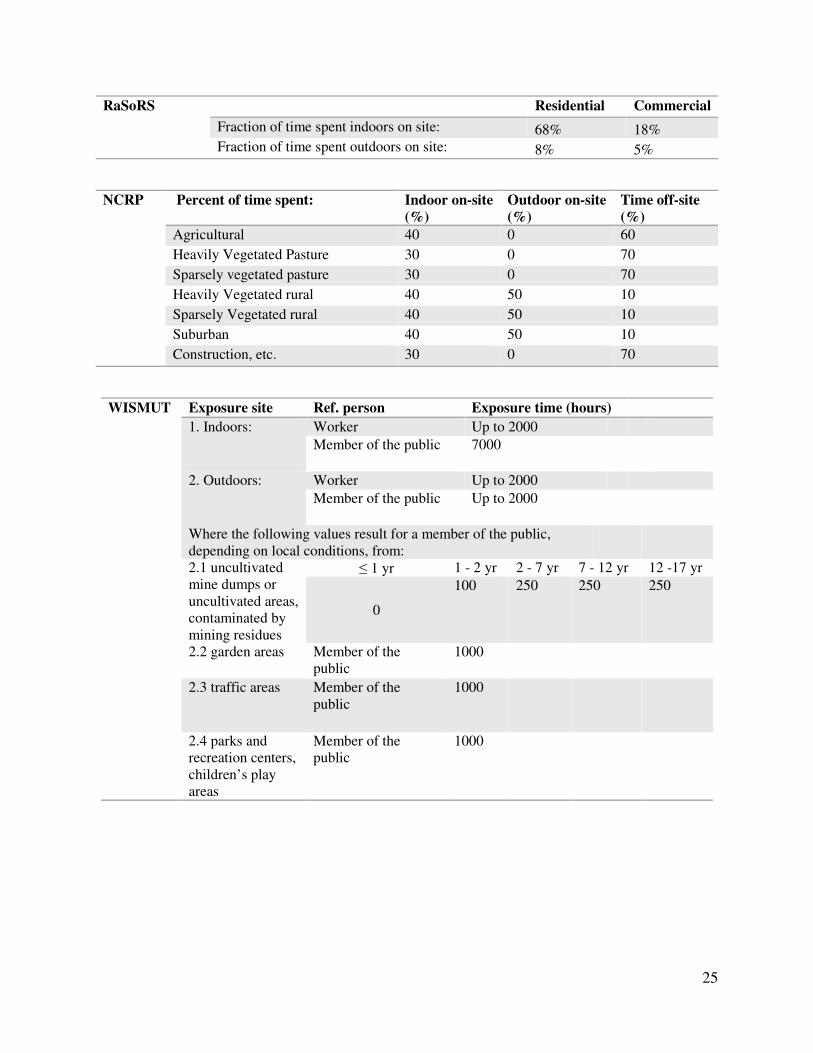
3.2 Occupancy Factors
Occupancy factors are the time spent by an individual on a contaminated site. It is
different for different scenarios and land uses. Exposure should be corrected to reflect the true
fraction of time spent on site. Most of the models use a fraction of the time for calculations. PRG
and DCC calculators use exposure frequency (days/yr), exposure duration (years) and exposure
time (hour/day). RESRAD-ONSITE, NORMALYSA, RCLEA and CROM use fraction of time
spent indoors and outdoors. RCLEA uses another dimension for the occupancy factors, which
are active or passive occupancy. NCRP and RaSoRS use percentage to represent occupancy
factor. WISUMT use number of hours per year to represent the occupancy factors.
Table 2: Occupancy Factors.
PRG & DCC
(RSL&RML
for exposure
frequency and
duration)
Resident Farmer Construction
Worker
Indoor
Worker
Outdoor
Worker
Composite
Worker
Recreator
Exposure
Frequency
(days/yr)
350 350 250 250 225 250 Site-
specific
Exposure
Duration
(years)
General: 26
Adult: 20
Child: 6
General: 40
Adult: 34
Child: 6
1 yr 25 25 25 Site-
specific
Exposure
Time - indoor
(hours/day)
16.4 10
- - - -
Site-
specific
Exposure
Time -
outdoor
(hours/day)
1.75 12.16
- - - -
Site-
specific
Exposure
Time
(hours/day)
24 24 8 8 8 8 Site-
specific
Exposure
Time -away
(hours/day)
- 1.83
- - - -
Site-
specific

24
RESRAD-ONSITE
Fraction of time spent indoor 6.55E-01
Fraction of time spent outdoor 2.5E-01
NORMALYSA All groups
Fraction of time spent outdoor 0.25
CROM
External Exposure Adult Infant
(Hour/yr) Fraction (Hour/yr) Fraction
Surface contaminated owing to air deposition 8760 1 8760 1
Working /playing over contaminated sediment 1600 0.18 1000 0.12
Submersion in air 8760 1 8760 1
Garden and ground exposure from irrigation 500 0.06 500 0.06
RCLEA
Adult Child Infant
Fraction of time spent: Active Passive Active Passive Active Passive
Residential with Home-
Grown Produce, indoor
0.125 0.708 0.083 0.667 0.125 0.750
Residential with Home-
Grown Produce,
outdoor
37.96 0.063 0.083 0 0.083 0.042
Residential without
Home-Grown Produce,
indoor
0.125 0.708 0.083 0.667 0.125 0.750
Residential without
Home-Grown Produce,
outdoor
37.96 0.063 0.083 0 0.083 0.042
Allotments, indoor 0.125 0.708 0.083 0.667 0.125 0.750
Allotments, outdoor 34.675 0.047 0.012 0.012 13.14 0.018
Commercial/Industrial,
indoor
0.052 0.144 - - - -
Commercial/Industrial,
outdoor
0.013 0.006 - - - -
-Occupancy Assumptions for the Residential Land Use; Note that Infants adopt 1 to 2 year old
characteristics from CLEA, Children adopt the 10 to 11 year old characteristics and Adults
adopt the 59 to 70 year old characteristics to maximize the exposure duration. Values based on
CLR 10 Tables 4.3 and 4.4. [11]
-Occupancy Assumptions for the Allotment Land Use; Note that Infants adopt 1 to 2 year old
characteristics from CLEA, Children adopt the 10 to 11 year old characteristics and Adults
adopt the 59 to 70 year old characteristics to maximize the exposure duration. Values based on
CLR 10 Tables 4.8, 4.9 and 4.10. [11]
-Occupancy Assumptions for the Commercial/Industrial Land Use; Values based on CLR 10 Table
4.13, which are presented for female workers aged 16 to 59. [11]
25
RaSoRS
Residential Commercial
Fraction of time spent indoors on site: 68% 18%
Fraction of time spent outdoors on site: 8% 5%
NCRP
Percent of time spent: Indoor on-site
(%)
Outdoor on-site
(%)
Time off-site
(%)
Agricultural 40 0 60
Heavily Vegetated Pasture 30 0 70
Sparsely vegetated pasture 30 0 70
Heavily Vegetated rural 40 50 10
Sparsely Vegetated rural 40 50 10
Suburban 40 50 10
Construction, etc. 30 0 70
WISMUT
Exposure site Ref. person Exposure time (hours)
1. Indoors: Worker Up to 2000
Member of the public 7000
2. Outdoors: Worker Up to 2000
Member of the public Up to 2000
Where the following values result for a member of the public,
depending on local conditions, from:
2.1 uncultivated
mine dumps or
uncultivated areas,
contaminated by
mining residues
≤ 1 yr 1 - 2 yr 2 - 7 yr 7 - 12 yr 12 -17 yr
0
100 250 250 250
2.2 garden areas Member of the
public
1000
2.3 traffic areas Member of the
public
1000
2.4 parks and
recreation centers,
children’s play
areas
Member of the
public
1000
26
3.3 Dietary Factors for Human Food Consumption
3.3.1 Drinking Water Intake
The consumption of contaminated water is a significant radionuclide ingestion pathway
that contributes to internal exposure. This contribution should be considered in the derivation of
the dose from ingestion. The external exposure from contaminated water is mostly negligible,
compared with internal exposure. Source and amount of water consumed plays an important role
in calculation of internal dose. The source of water can be groundwater or surface water or both.
Individuals on site could consume 100%, or a fraction thereof, contaminated water. Some of the
models use a value for drinking water consumption that assumes the water is completely
contaminated with radionuclides, such as WISMUT. A fraction of contaminated water can be
used for PRG/ DCC or RESRAD-ONSITE. Some other models do not use a fraction
contamination parameter for drinking water, such as RCLEA and NCRP. The consideration for a
resident that has access to water from the uncontaminated municipal water should be different
from a farmer using well water on contaminated sites. The fraction and the amount of water
consumed should reflect these considerations.
The default value of the amount of drinking water consumed is usually obtained from public
surveys. The concentration of activity in drinking water assumed in the models is usually
overestimated, because water can be filtered and treated before consumption. The coagulation
and filtration of water could reduce the concentration of radionuclides and in turn reduce the
internal exposure. [12]
Table 3 lists drinking water intake in units of L/yr for the models. PRG and DCC
calculators use different scenarios, such as farmer, resident, and recreator, for both adult and
child. Farmer and resident consume the same amount of tap water per year. Adults in the farmer

27
and resident scenarios have higher tap water consumption per year compared to child for the
same scenarios. The farmer/resident adult ingests 875 L/yr, and the child ingests 273 L/yr (based
on 350 d/yr). In the case of adult and child recreator, the intake of surface water is 0.071 L/hr and
0.12 L/yr, respectively. The adult is more careful of ingesting the surface water compared to the
child. For RESRAD-ONSITE, individuals ingest an equal amount of water yearly. People,
irrespective of age and occupation, have equal chances of being exposed to contaminated water.
In RESRAD-ONSITE, a fraction of water can be used if the drinking water is not totally
contaminated. In NORMALYSA, the default consumption stands at 375 L/yr for adult and
lactating mother, while the water intake for child/infant is 76 L/yr. In the CROM model, adult
water intake is 600 L/yr while infant is 260 L/yr. RaSoRS only works for adults. In this model,
the water ingestion per year stands at 700 L/yr. In WISMUT, water consumption increases with
age; however, the overall consumption for adults in WISMUT is lower than all other models in
the table.
Table 3: Drinking water intake (L/yr).
PRG, DCC and RSL Farmer/ Resident, Adult 875 Tap water ingestion
Farmer/ Resident, Child 273 Tap water ingestion
Recreator, Adult* 0.071 (L/hr) Surface water
Recreator, Child* 0.12 (L/hr) Surface water
RESRAD-ONSITE Adult 510
NORMALYSA Adult and Lactating mother 375
Child, Infant 76
CROM Adult 600 Water and beverages
Infant 260 Water and beverages
RaSoRS Adult 700
WISMUT Reference person
≤ 1 yr 55
1 - 2 yr 100
2 - 7 yr 100
7 - 12 yr 150
12 -17 yr 200 > 17 yr 350
* Recreator scenario in PRG/DCC calculators is site-specific with no assumed default occupancy factors, such as
how many hr/day and days/yr.

28
3.3.2 Fruits, Vegetables and Grains Consumption Rates
Fruits, vegetables and grains can uptake radionuclides from contaminated sites by root
uptake from contaminated soil and contaminated irrigation water or leaves uptake from the
deposition of contaminated dust and contaminated irrigation water. Consumption of
contaminated food is a major ingestion pathway and has a significant impact on the result of the
assessment. Default input parameters of food consumption rate depend on the behavioral
characteristics of potential receptors, age, sex and harvesting season. The parameters can be
obtained from public dietary surveys.
Most of the radiation risk assessment models make a difference between children and
adults, when calculating the consumption rates of fruits, vegetables, and grains. This is not done
by RESRAD-ONSITE and RaSoRS. Also, different scenarios have different consumption rates.
For example, the farmer scenario consumes more contaminated food than the industrial scenario.
The fraction of the fruits, vegetables, and grains that are contaminated by radionuclides from the
contaminated zone is determined by the fraction raised locally and the area of the contaminated
zone.
The category of the consumption also differs between models. Some models provide the
number of crops; other models use a general category. More types of plants provide more options
and reduce uncertainties. In Table 4, the consumption of fruits, vegetables, and grains is
presented in kilograms per year. Figure 8 shows the number crop types that are included in each
model. DCC and PRG have 24 different crops. For each of these 24 crops, the PRG and DCC
have Fresh Weight (FW) consumption rates as a default, but users can click a button for Cooked
Weight (CW) consumption rates, which are generally more appropriate for Americans and which
should be selected if users have determined their site does not have a sensitive subpopulation

29
with higher than normal intakes of a particular crop. Adults and children have different
consumption rates depending on crops. From the table, the consumptions by adults are higher
compared to that of children. Lifestyle contributes to different rates of crop consumption. For
example, a farmer adult consumes more apples than a resident adult; however, the amount of
berry consumed is equal for both farmer and resident adult. In some cases, the amount consumed
is higher for the resident adult as compared to farmer adult. For example, the resident adult
consumption of carrots is greater than farmer adult. RESRAD-ONSITE has only two main
classifications: leafy vegetable and fruit and vegetable and grains. In NORMALYSA, crops are
classified as cereals, leafy vegetables, legumes, roots, berries, mushrooms, garden food and
fruits. The main consideration here is age. Adults consume more of the crops than children and
infants; however, there is a scenario where adults consume less than children. For example,
children consume an average of 40 kg/yr of roots, and adults consume an average of 39 kg/yr.
RCLEA uses different dimensions for food consumption rates. The food consumption rate is
expressed as kg of fresh weight of crops per kg of the body weight of the individual per year, (kg
(fw)/kg (bw)/yr). Body weights for male/female adult, child, and infant are provided in RCLEA.
In Table 4, the values of fruit and vegetables consumption rates are converted to kg/yr by
multiplying the body weight (kg) for each individual by the value of the consumption (kg
(fw)/kg (bw)/yr). RCLEA indicates increase in consumption as the age increases. CROM put the
consumption rate of fruit and vegetables at 410 kg/yr and 150 kg/yr for adults and infants,
respectively. RaSoRS indicates that adults consume an average 17 kg/yr. WISMUT content in
various crops increases as the age increases except for fresh fruit, fruit products, and juice, where
adults >17 consume less than 1 – 17 year-olds. NCRP has a combined consumption rate of 300
kg/yr for vegetables, fruits, roots, and grains.

30
Figure 8: Number of crop types included in each model.
Table 4: Fruits, vegetables and grains consumption rates (kg/yr).
PRG & DCC
(yr=350 days)
Crop Resident Adult Resident Child Farmer Adult Farmer Child
FW CW FW CW FW CW FW CW
Apple 25.8 13.4 25.3 13.1 29.6 15.4 29.0 15.1
Citrus 108.3 56.1 67.9 35.2 108.3 56.1 68.0 35.2
Berry 12.4 6.4 8.4 4.3 12.4 6.4 8.4 4.3
Peach 40.5 21.0 39.0 20.2 36.1 18.7 34.8 18.0
Pear 18.2 9.4 23.3 12.1 21.0 10.9 26.9 14.0
Strawberry 14.2 7.4 8.9 4.6 14.2 7.4 8.9 4.6
Asparagus 13.8 9.4 4.2 2.9 13.8 9.4 4.2 2.9
Beet 11.9 8.1 1.4 0.9 11.9 8.1 1.4 0.9
Broccoli 11.2 7.7 4.6 3.1 12.4 8.4 5.0 3.5
Cabbage 32.2 22.0 4.3 2.9 30.0 20.5 4.0 2.7
Carrot 9.6 6.5 5.2 3.6 8.5 5.8 4.7 3.2
Corn 20.9 14.3 8.3 5.7 28.7 19.6 11.4 7.8
Cucumber 28.8 19.7 8.9 6.1 19.2 13.1 5.9 4.0
Lettuce 13.1 9.0 1.5 1.0 13.1 9.0 1.5 1.0
Lima Bean 11.8 8.1 2.3 1.6 11.8 8.1 2.3 1.6
Okra 10.6 7.2 1.9 1.3 10.6 7.2 1.9 1.3
Onion 7.6 5.2 2.0 1.4 9.5 6.5 2.5 1.7
Pea 12.4 8.5 11.2 7.7 11.1 7.6 10.0 6.9
Pumpkin 22.7 15.5 15.8 10.8 22.7 15.5 15.8 10.8
Snap Bean 18.9 12.9 9.6 6.5 19.0 13.0 9.6 6.6
Tomato 28.1 19.2 10.4 7.1 33.0 22.5 12.2 8.3
White Potato 44.7 30.6 18.1 12.4 49.6 33.9 20.1 13.7
Rice - 25.6 - 10.1 - 31.0 - 12.2
Cereal Grain - 26.6 - 13.3 - 32.2 - 16.1
RESRAD-ONSITE Leafy vegetable 14
Fruit, Vegetable and Grains 160
24
2
6
11
1 1
5
1

31
NORMALYSA
Crop Adult Child Infant
Cereals 52.04 53.69 64.92
Leafy Vegetables 21.30 6.44 5.98
Legume 2.19 0.73 0.73
Roots 39.77 40.10 28.59
Berries 6.64 3.33 3.33
Mushrooms 0.45 0.15 0.15
Garden Food
Fruits 3.52 1.77 3.23
Garden Berries 0.78 0.78 0.78
Leafy Vegetables 21.30 6.44 5.98
Legumes 2.19 0.73 0.73
Roots 39.77 40.10 28.59
RCLEA*
Crop Adult Child Infant
male female male/female male/female
Brussels Sprouts 20.74 17.41 9.25 5.17
Cabbage 19.85 16.66 8.51 5.94
Carrot 19.20 16.12 13.32 7.15
Leafy Salads 14.50 12.17 7.03 4.40
Onion (shallots and leeks) 13.04 10.95 8.51 3.63
Potato 100.44 84.32 76.96 30.03 *Note that these values in RCLEA represent the 95th percentile of the CLEA distributions and are derived from
Table 6.3 of the Contaminated Land Report-10 (CLR 10). [11]
CROM Fruits, vegetables and grains Adult Infant
410 150
WISMUT
Crop Reference Person
≤ 1 yr 1 - 2 yr 2 - 7 yr 7 - 12 yr 12 -17 yr > 17 yr
Cereals, cereal
products 12 30 80 95 110 110
Fresh fruit, fruit
products, juice 25 45 65 65 60 35
Potatoes, root
vegetables, juice 30 40 45 55 55 55
Leafy vegetables 3 6 7 9 11 13
Vegetables,
vegetable products,
juice
5 17 30 35 35 40
NCRP Vegetables, Fruits, roots, grains Adult
300
RaSoRS Homegrown crop Adult
17.136

32
3.3.3 Milk/ Dairy and Meat Consumption Rates
People living in rural areas often raise livestock to provide most of their meat and milk.
When livestock graze on contaminated areas, the radionuclides in vegetation, soil, water and air
transfer into their system. Consequently, the produced meat and milk from these animals would
be contaminated. The radionuclide intakes by animals depends on the type of animal, age,
growth rate of the animal, and grazing season [3]. Meat and milk consumption contributes to the
exposure from ingestion pathways. The contribution is different based on the scenario. For
example, industrial workers usually do not consume any contaminated meat or milk, but the
farmer may consume a large fraction of his daily need of milk and meat from the livestock raised
on a contaminated site.
Table 5 shows milk/dairy consumption in unit L/yr. PRG and DCC calculators have dairy
consumption rates only for the adult and child farmer scenario. The dairy consumption rate
includes milk, cheese, ice cream and yogurt. The PRG and DCC dairy consumption rates are in
units of g/day. The density of milk (1.03 kg/L) was used to convert the unit to L/yr. RESRAD-
ONSITE put both the child and adult at equal rates of 92 L/yr. NORMALYSA indicates
consumption of cow products decreases as age increases. With CROM, an adult consumes 250
L/yr, while infants consume 300 L/yr. WISMUT milk consumption increases with age until age
17, then the consumption decreases. RCLEA and RaSoRS have no parameters for milk
consumption rates. The highest milk consumption rate parameter is assumed by NCRP at
200 L/yr.

33
Figure 9: Milk/ Dairy consumption rates (L/yr).
230
338
92
31.32
53.69 55.264
250
300
45
160 160170 170
130
200

34
Table 5: Milk/ Dairy consumption rates (L/yr).
PRG & DCC Adult 236.7 Farmer Dairy Ingestion Rate
Child 348.2 Farmer Dairy Ingestion Rate
RESRAD-ONSITE Adult 92
NORMALYSA Adult 31.32 Cow
Child 53.69 Cow
Infant 55.26 Cow
CROM
Adult 250
Infant 300
WISMUT ≤ 1 yr 45
1 - 2 yr 160
2 - 7 yr 160
7 - 12 yr 170
12 -17 yr 170
> 17 yr 130
NCRP Adult 200
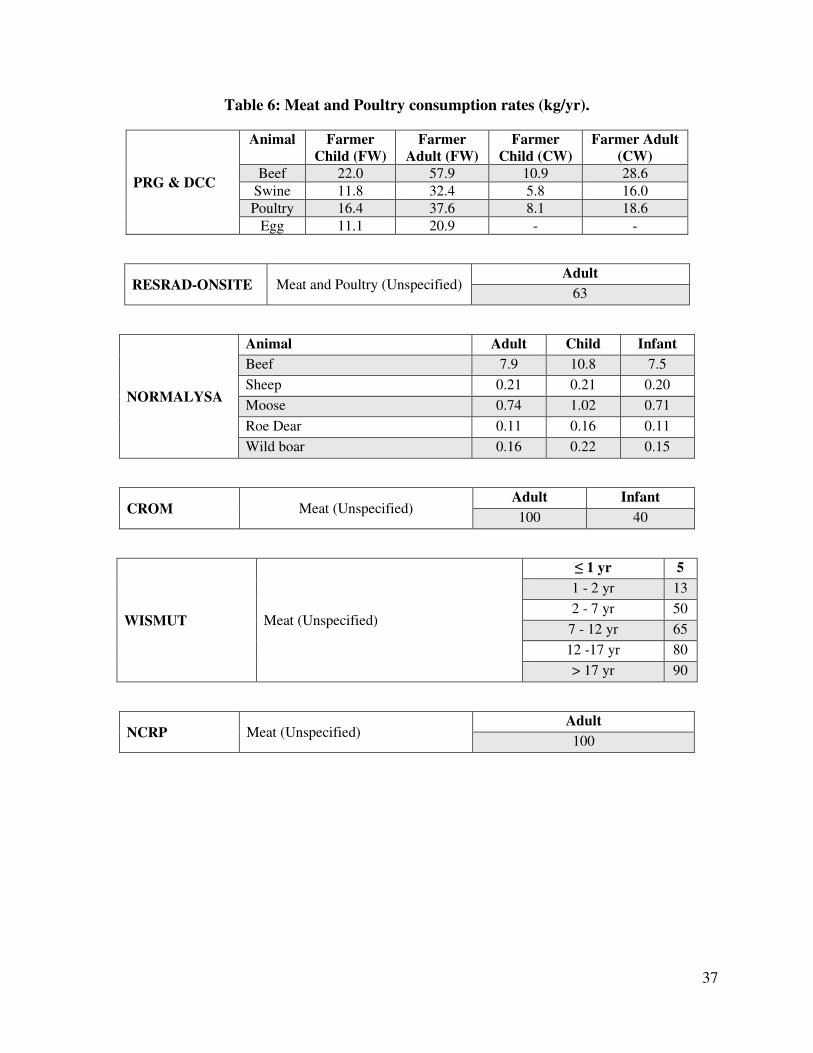
Table 6 considers meat and poultry consumption rates in kilograms per year. PRG and
DCC have parameters for only the farmer scenario. The consumption includes beef, poultry,
swine, and egg for adult and child. According to PRG and DCC parameters, farmers consume
beef, poultry, swine and egg in descending order, where an adult consumes more than a child.
RESRAD-ONSITE put one value for meat consumption at 63 kg/yr. In NORMALYSA, the
default input parameters for meat consumption (beef, sheep, moose, roe dear, and wild boar)
assume a child consumes more meat than an adult or an infant. WISMUT shows an increase in
consumption as age increases. CROM and NCRP assume a 100 kg/yr meat consumption rate for
adult, which is the highest value among the models.

35
Figure 10: Meat and Poultry consumption rates for adult (kg/yr).
57.8
37.6
32.4
21
63
7.9
0.208 0.74 0.11 0.16
100
80
90
100
28.6
1618.6
Meat and Poultry Consumption (Adult)
(kg/year)
FW CW

36
Figure 11: Meat and Poultry consumption (child & infant) (kg/yr).
22
16.45
11.8 11 10.8
0.21 0.15 0.2
40
5
13
50
65
7.5
0.19 0.71 0.11 0.15
10.885
5.818.12
Meat and Poultry Consumption (Child & Infant)
(kg/year)
Child Infant CW
37
Table 6: Meat and Poultry consumption rates (kg/yr).
PRG & DCC
Animal Farmer
Child (FW)
Farmer
Adult (FW)
Farmer
Child (CW)
Farmer Adult
(CW)
Beef 22.0 57.9 10.9 28.6
Swine 11.8 32.4 5.8 16.0
Poultry 16.4 37.6 8.1 18.6
Egg 11.1 20.9 - -
RESRAD-ONSITE Meat and Poultry (Unspecified) Adult
63
NORMALYSA
Animal Adult Child Infant
Beef 7.9 10.8 7.5
Sheep 0.21 0.21 0.20
Moose 0.74 1.02 0.71
Roe Dear 0.11 0.16 0.11
Wild boar 0.16 0.22 0.15
CROM Meat (Unspecified) Adult Infant
100 40
WISMUT Meat (Unspecified)
≤ 1 yr 5
1 - 2 yr 13
2 - 7 yr 50
7 - 12 yr 65
12 -17 yr 80
> 17 yr 90
NCRP Meat (Unspecified) Adult
100
38
3.3.4 Fish & Seafood Consumption Rates
Consumption of fish and seafood / aquatic food from a pond that has been contaminated
by radionuclides is another important ingestion pathway that is considered when assessing a
contaminated site. Radionuclides in water and sediment transfer to aquatic biota and then to
humans. The consumption of these species contributes to the internal exposure to humans.
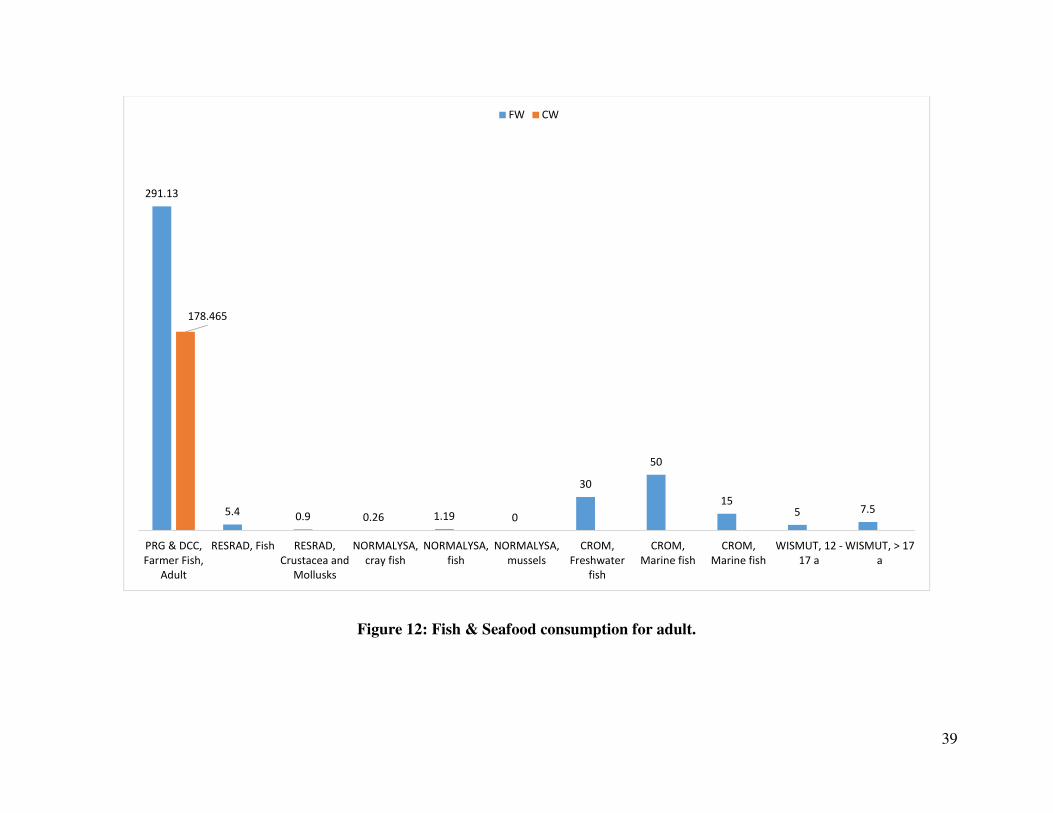
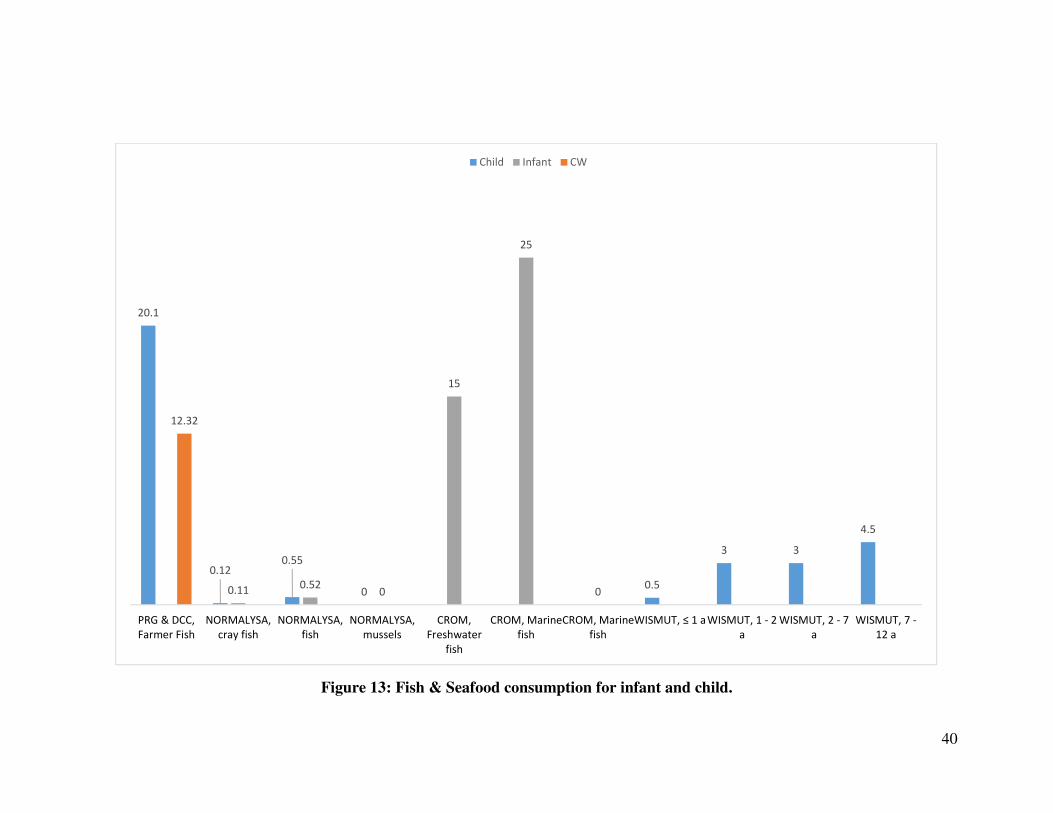
Table 7 shows fish and seafood consumption rates in units of kg/yr. PRG & DCC
calculators have consumption rates for the adult and child farmer scenarios. The default input
parameters for fish consumption are fresh weight (FW) at values of 291.13 kg/yr for adult and
20.09 kg/yr for child. This amount of fish is much higher than the fish consumption rate in the
other models. Fish, Crustacea and Molluscs are the categories available in RESRAD-ONSITE.
NORMALYSA divides the seafood consumption as marine and freshwater consumption. Both
categories have subcategories of Cray Fish, Fish, and Mussels with same ingestion rate for adult,
child and infant. CROM categorizes the consumption rate of aquatic species as freshwater fish,
marine fish and marine shellfish. WISMUT has consumption for all six age ranges in the model.
The consumption rates increase with age. RCLEA, RaSoRS and NCRP have no parameters for
fish and seafood consumption rates.
39
Figure 12: Fish & Seafood consumption for adult.
291.13
5.4 0.9 0.26 1.19 0
30
50
155 7.5
178.465
PRG & DCC,
Farmer Fish,
Adult
RESRAD, Fish RESRAD,
Crustacea and
Mollusks
NORMALYSA,
cray fish
NORMALYSA,
fish
NORMALYSA,
mussels
CROM,
Freshwater
fish
CROM,
Marine fish
CROM,
Marine fish
WISMUT, 12 -
17 a
WISMUT, > 17
a
FW CW
40
Figure 13: Fish & Seafood consumption for infant and child.
20.1
0.120.55
00.5
3 3
4.5
0.110.52
0
15
25
0
12.32
PRG & DCC,
Farmer Fish
NORMALYSA,
cray fish
NORMALYSA,
fish
NORMALYSA,
mussels
CROM,
Freshwater
fish
CROM, Marine
fish
CROM, Marine
fish
WISMUT, ≤ 1 aWISMUT, 1 - 2
a
WISMUT, 2 - 7
a
WISMUT, 7 -
12 a
Child Infant CW

41
Table 7: Fish & Seafood consumption rates (kg/yr).
PRG/DCC
Farmer
Child (FW)
Farmer Adult
(FW)
Farmer Child
(CW)
Farmer Adult
(CW)
Fish 20.1 291.1 12.3 178.5
RESRAD-ONSITE Fish 5.4
Crustacea and Mollusks 0.9
NORMALYSA
Marine/ Freshwater Adult Child Infant
Cray fish 0.26 0.12 0.11
Fish 1.19 0.55 0.51
Mussels 0 0 0
CROM
Adult Infant
Freshwater fish 30 15
Marine fish 50 25
Marine shellfish 15 0
WISMUT
≤ 1 yr 0.5
1 - 2 yr 3
2 - 7 yr 3
7 - 12 yr 4.5
12 -17 yr 5
> 17 yr 7.5
3.4 Animal Consumption Rates
Table 9 presents the animal consumption rates of fodder, soil and water in kg/yr. The
PRG and DCC calculators contain default input parameters for 11 types of animals (Beef, Dairy,
Goat, Goat Milk, Chicken, Duck, Turkey, Goose, Sheep, Sheep Milk, and Swine). The animals
that feed mostly on fodder and water the most are the beef or dairy animals, while the least is the

42
chicken. The highest for those consuming soil is the sheep milk, while the least is chicken.
RESRAD-ONSITE has animal consumption rate default input parameters for beef for meat and
milk. Both consume the same amount of soil. Beef for meat consume more fodder and less water
compared to beef for milk. NORMALYSA has parameters for the same categories as RESRAD-
ONSITE, but Cow for meat consumes more fodder, soil and water compared to Cow for milk.
CROM considers fodder and water consumption rates for large animals only; there is no
classification of these large animals. For small animals, the default input parameter is one-tenth
the consumption of that for large animals. WISMUT only provides parameters for Cattle (Beef).
The soil consumption rate by cows in WISMUT agrees with RESRAD-ONSITE and PRG&DCC
values at 182.5 kg/yr (Figure 14). NCRP has a fodder consumption rate for six animals (Milk
cows, Beef cattle, Pigs, Calves, Lamb and Chicken). RCLEA and RaSoRS have no parameters
for animal consumption rate. The following table presents animal consumption rates for each
model.
Table 8: Summary of animal consumption rates in each model.
Fodder Soil Water
PRG & DCC yes yes yes
RESRAD-ONSITE yes yes yes
NORMALYSA yes yes yes
RCLEA no no no
CROM yes no yes
RaSoRS no no no
WISMUT yes yes yes
NCRP yes no no

43
Table 9: Animal consumption rates (kg/yr).
PRG & DCC
Animal Fodder Soil Water (L/yr)
Beef 4,296.1 182.5 19,345.0
Dairy 7,409.5 146.0 33,580.0
Goat 463.6 84.0 1,390.7
Goat Milk 580.4 105.9 3,193.8
Chicken 73.0 8.0 146.0
Duck 87.6 8.8 175.2
Turkey 248.2 24.8 496.4
Goose 120.5 12.0 240.9
Sheep 638.8 116.8 1,916.3
Sheep Milk 1,149.8 208.1 3,796.0
Swine 1,715.5 135.1 4,161.0
RESRAD
(ON-SITE)
Livestock (Beef) for meat 24,820.0 182.5 18,2500.0
Livestock (Beef) for milk 20,075.0 182.5 58,400.0
NORMALYSA Cow for meat 4,161.0 255.5 21,915.0
Cow for milk 3,321.5 219.0 14,610.0
CROM Large animal for milk 5,840.0 - 21,900.0
Large animal for meat 4,380.0 - 14,600.0
Small Animal such as goat and sheep, one tenth of these quantities
should be used as a default
WISMUT Cattle 23,725.0 182.5 27,375.0
NCRP Milk cows 5,840.0 - -
Beef cattle, game 2,920.0 - -
Pigs 876.0 - -
Calves 693.5 - -
Lamb 401.5 - -
Chicken 25.6 - -

44
Figure 14: Fodder, soil and water consumption rates for Cattle.
4296.057409.5
24820
20075
4161 3321.55840
4380
23725
58402920
182.5 146 182.5 182.5 255.5 219 182.5
19345
33580
18250
58400
21915
14610
21900
14600
27375
PR
G&
DC
C,
Be
ef
PR
G&
DC
C,
Da
iry
RE
SR
AD
, Ii
ve
sto
ck (
Be
ef)
fo
r m
ea
t
RE
SR
AD
, Ii
ve
sto
ck (
Be
ef)
fo
r m
ilk
NO
RM
ALY
SA
, C
ow
fo
r m
ea
t
NO
RM
ALY
SA
, C
ow
fo
r m
ilk
CR
OM
, La
rg A
nim
al fo
r m
ilk
CR
OM
, La
rg A
nim
al fo
r m
ea
t
WIS
MU
T,
Ca
ttle
NC
RP
, M
ilk c
ow
s
NC
RP
, B
ee
f ca
ttle
, g
am
e
Fodder (kg/yr) Soil (kg/yr) Water (L/year)
45
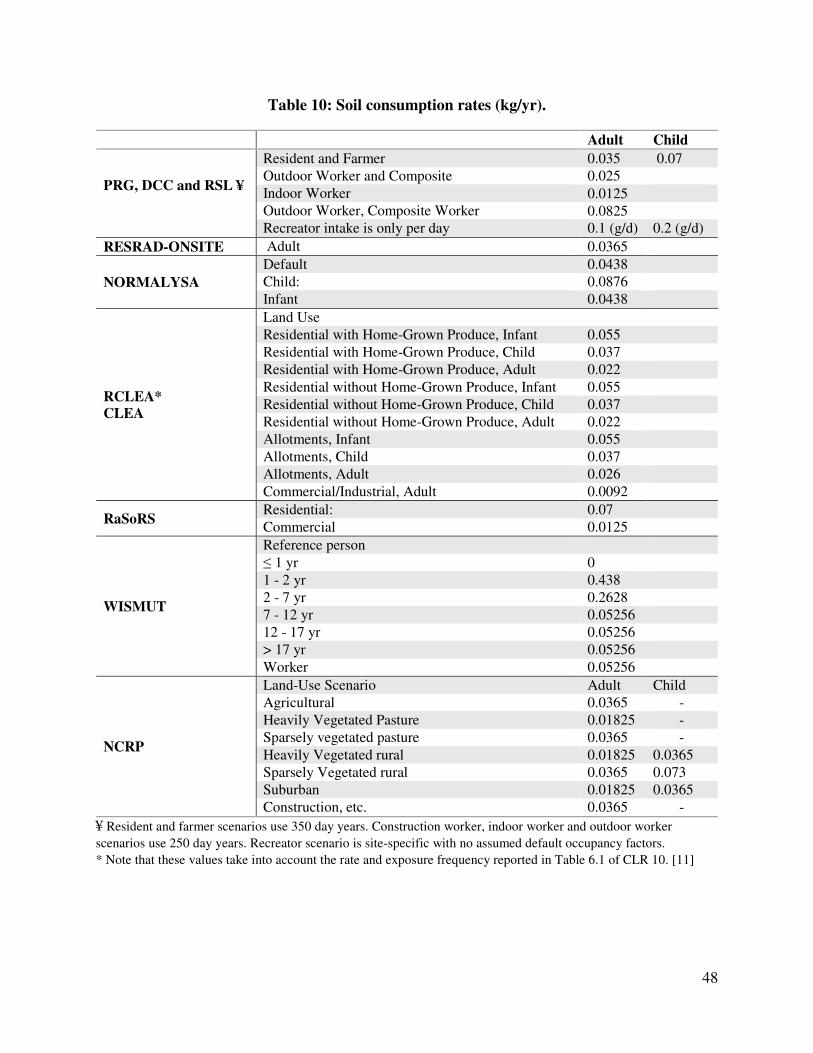
3.5 Soil Consumption Rates:
The soil ingestion pathway is the direct ingestion of soil by individuals in a contaminated
site. The amount of soil ingested and the concentration of radionuclides in soil are the factors
that determine the dose from ingestion of soil. The soil ingestion pathway is a major pathway for
infants/children, who are known to have significantly higher ingestion rates for non-food objects.
[13]. Another aspect that determines the amount of consumption of soil is outdoor activities,
where individuals are exposed to dust and soil more than indoor.
The soil consumption rates are presented in Table 10 in units of kg/yr. The soil
consumption rates are almost equal for adult. PRG/DCC (Resident, Recreator, Farmer, Outdoor
Worker, Composite), RESRAD-ONSITE, and NCRP (Agricultural, Sparsely Vegetated rural,
Construction) use a soil consumption rate of 0.0365 kg/yr for a 365 day year. PRG/DCC,
however, uses a year of 350 days for resident and farmer scenarios and 250 days for indoor
worker, outdoor worker, composite and construction worker. By converting the units, the soil
consumption rate will decrease. In general, most of the models use higher values for infant and
child scenarios than adult. In PRG and DCC, the indoor worker consumes less soil compared to
the construction worker, which is a normal result of the amount of soil/dust in the sounding
environment. CROM has no soil consumption parameters; however, according to the main
reference that was used to develop CROM, “The effect of radionuclide intake through
inadvertent soil ingestion by humans or grazing animals is implicitly taken into account within
the element specific values selected for the soil to plant uptake coefficient” (IAEA Reports
Series No. 19, 2001) [14].
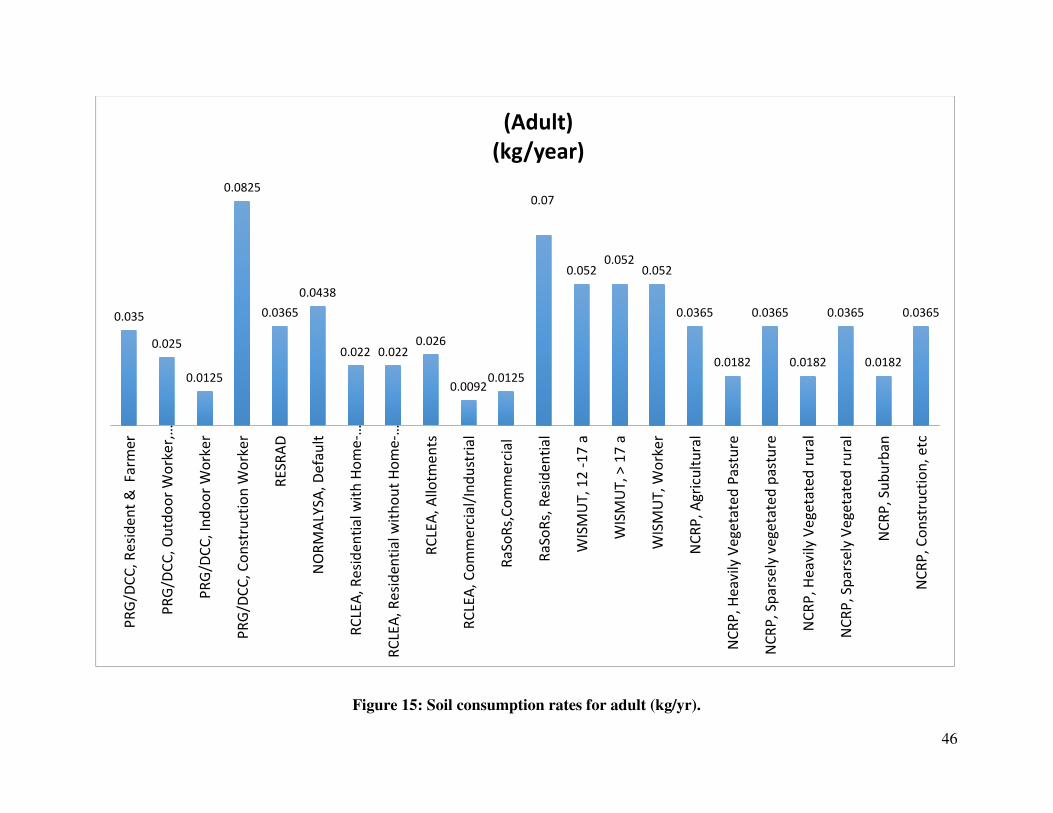
46
Figure 15: Soil consumption rates for adult (kg/yr).
0.035
0.025
0.0125
0.0825
0.0365
0.0438
0.022 0.0220.026
0.00920.0125
0.07
0.0520.052
0.052
0.0365
0.0182
0.0365
0.0182
0.0365
0.0182
0.0365
PR
G/D
CC
, R
esi
de
nt
& F
arm
er
PR
G/D
CC
, O
utd
oo
r W
ork
er,
…
PR
G/D
CC
, In
do
or
Wo
rke
r
PR
G/D
CC
, C
on
stru
ctio
n W
ork
er
RE
SR
AD
NO
RM
ALY
SA
, D
efa
ult
RC
LEA
, R
esi
de
nti
al
wit
h H
om
e-…
RC
LEA
, R
esi
de
nti
al
wit
ho
ut
Ho
me
-…
RC
LEA
, A
llo
tme
nts
RC
LEA
, C
om
me
rcia
l/In
du
stri
al
Ra
So
Rs,
Co
mm
erc
ial
Ra
So
Rs,
Re
sid
en
tia
l
WIS
MU
T,
12
-1
7 a
WIS
MU
T,
> 1
7 a
WIS
MU
T,
Wo
rke
r
NC
RP
, A
gri
cult
ura
l
NC
RP
, H
ea
vily
Ve
ge
tate
d P
ast
ure
NC
RP
, S
pa
rse
ly v
eg
eta
ted
pa
stu
re
NC
RP
, H
ea
vily
Ve
ge
tate
d r
ura
l
NC
RP
, S
pa
rse
ly V
eg
eta
ted
ru
ral
NC
RP
, S
ub
urb
an
NC
RP
, C
on
stru
ctio
n,
etc
(Adult)
(kg/year)

47
Figure 16: Soil consumption rates for child (orange) and infant (gray) (kg/yr).
0.073
0.0365
0.0876
0.438
0.0550.037
0.0550.037
0.0550.037
0
0.438
0.2628
0.052560.0365
0.073
So
il c
on
sum
pti
on
(kg
/ye
ar)
PR
G &
DC
C,
Re
s.,
Fa
r.
RE
SR
AD
NO
RM
ALY
SA
, C
hild
NO
RM
ALY
SA
, In
fan
t
RC
LEA
, R
esi
de
nti
al
wit
h H
om
e-G
row
n
Pro
du
ce
RC
LEA
, R
esi
de
nti
al
wit
h H
om
e-G
row
n
Pro
du
ce
RC
LEA
, R
esi
de
nti
al
wit
ho
ut
Ho
me
-Gro
wn
Pro
du
ce
RC
LEA
, R
esi
de
nti
al
wit
ho
ut
Ho
me
-Gro
wn
Pro
du
ce RC
LEA
, A
llo
tme
nts
RC
LEA
, A
llo
tme
nts
WIS
MU
T, ≤
1 a
WIS
MU
T,
1 -
2 a
WIS
MU
T,
2 -
7 a
WIS
MU
T,
7 -
12
a
NC
RP
, H
ea
vily
Ve
ge
tate
d r
ura
l
NC
RP
, S
pa
rse
ly V
eg
eta
ted
ru
ral
(Child & Infant)
(kg/year)
48
Table 10: Soil consumption rates (kg/yr).
Adult Child
PRG, DCC and RSL ¥
Resident and Farmer 0.035 0.07 Outdoor Worker and Composite 0.025 Indoor Worker 0.0125 Outdoor Worker, Composite Worker 0.0825 Recreator intake is only per day 0.1 (g/d) 0.2 (g/d)
RESRAD-ONSITE Adult 0.0365
NORMALYSA Default 0.0438 Child: 0.0876 Infant 0.0438
RCLEA* CLEA
Land Use Residential with Home-Grown Produce, Infant 0.055 Residential with Home-Grown Produce, Child 0.037 Residential with Home-Grown Produce, Adult 0.022 Residential without Home-Grown Produce, Infant 0.055 Residential without Home-Grown Produce, Child 0.037 Residential without Home-Grown Produce, Adult 0.022 Allotments, Infant 0.055 Allotments, Child 0.037 Allotments, Adult 0.026 Commercial/Industrial, Adult 0.0092
RaSoRS Residential: 0.07 Commercial 0.0125
WISMUT
Reference person ≤ 1 yr 0 1 - 2 yr 0.438 2 - 7 yr 0.2628 7 - 12 yr 0.05256 12 - 17 yr 0.05256 > 17 yr 0.05256 Worker 0.05256
NCRP
Land-Use Scenario Adult Child Agricultural 0.0365 - Heavily Vegetated Pasture 0.01825 - Sparsely vegetated pasture 0.0365 - Heavily Vegetated rural 0.01825 0.0365 Sparsely Vegetated rural 0.0365 0.073 Suburban 0.01825 0.0365 Construction, etc. 0.0365 -
¥ Resident and farmer scenarios use 350 day years. Construction worker, indoor worker and outdoor worker
scenarios use 250 day years. Recreator scenario is site-specific with no assumed default occupancy factors.
* Note that these values take into account the rate and exposure frequency reported in Table 6.1 of CLR 10. [11]
49
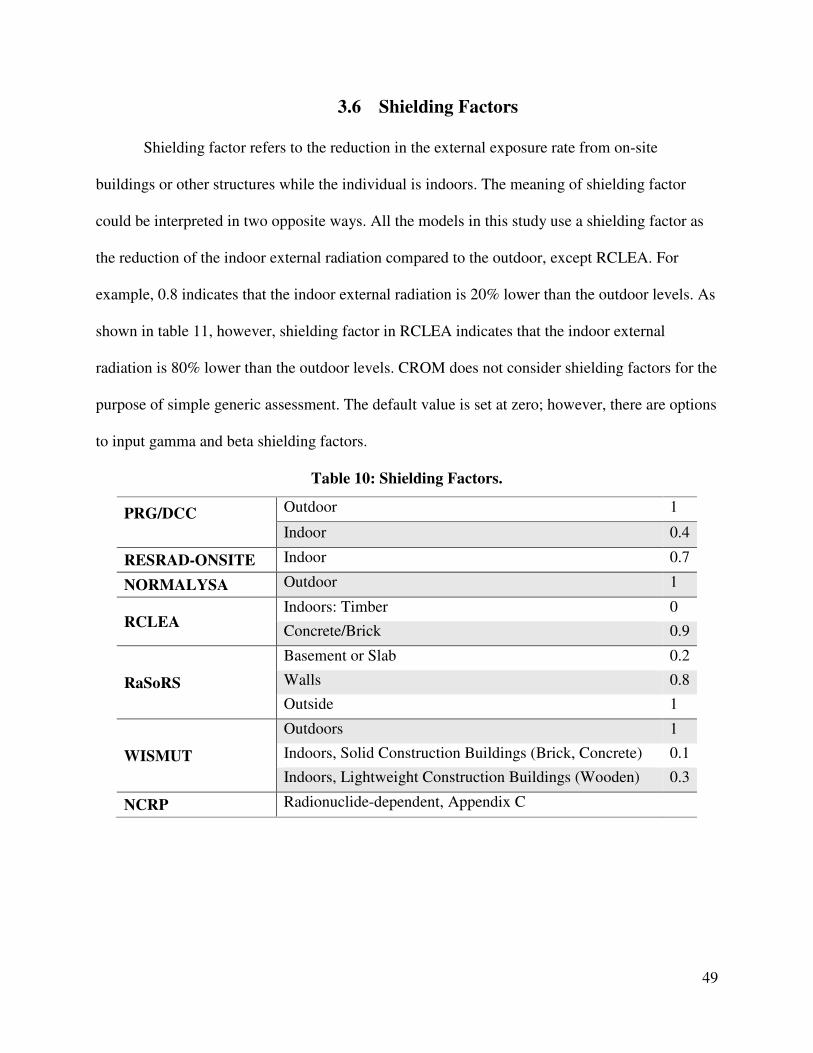
3.6 Shielding Factors
Shielding factor refers to the reduction in the external exposure rate from on-site
buildings or other structures while the individual is indoors. The meaning of shielding factor
could be interpreted in two opposite ways. All the models in this study use a shielding factor as
the reduction of the indoor external radiation compared to the outdoor, except RCLEA. For
example, 0.8 indicates that the indoor external radiation is 20% lower than the outdoor levels. As
shown in table 11, however, shielding factor in RCLEA indicates that the indoor external
radiation is 80% lower than the outdoor levels. CROM does not consider shielding factors for the
purpose of simple generic assessment. The default value is set at zero; however, there are options
to input gamma and beta shielding factors.
Table 10: Shielding Factors.
PRG/DCC
Outdoor 1
Indoor 0.4
RESRAD-ONSITE Indoor 0.7
NORMALYSA Outdoor 1
RCLEA Indoors: Timber 0
Concrete/Brick 0.9
RaSoRS
Basement or Slab 0.2
Walls 0.8
Outside 1
WISMUT
Outdoors 1
Indoors, Solid Construction Buildings (Brick, Concrete) 0.1
Indoors, Lightweight Construction Buildings (Wooden) 0.3
NCRP Radionuclide-dependent, Appendix C

50
3.7 Mass Loading Factors
A Mass Loading Factor parameter is the amount of soil deposited on the surface of plants
before consumption. PRG/DCC calculators use Mass Loading Factors (MLF) in units of g soil /
g fresh plant. PRG/DCC calculators provide plant-specific soil mass loading factors for 24
different kinds of crops. The MLF in PRG/DCC calculators are obtained from different sources:
(1) Hinton, (2) EA and (3) Pinder and McLeod [15]. Source (2) is the Updated Technical
Background to the CLEA Model that is used by RCLEA. PRG/DCC calculators and RCLEA
share the same MLF source. [16]; however, RCLEA uses mass loading factors for only six kinds
of crops in units of kg soil (dry weight) / kg crops (fresh weight). Table 12 lists MLFs for both
models.
Table 11: Mass Loading Factors.
PRG & DCC Mass Loading Factors (g of soil/ g of fresh plant) Apples 1.60E-04 Broccoli 1.01E-03 Onions 9.70E-05
Citrus 1.57E-04 Cabbage 1.05E-04 Peas 1.78E-04
Berries other than
Strawberries 1.66E-04 Carrots 9.70E-05 Pumpkins 5.80E-05
Peaches 1.50E-04 Corn 1.45E-04 Snap Beans 5.00E-03
Pears 1.60E-04 Cucumbers 4.00E-05 Tomatoes 1.59E-03
Strawberries 8.00E-05 Lettuce 1.35E-02 White Potatoes 2.10E-04
Asparagus 7.90E-05 Lima Beans 3.83E-03 Cereal Grains 2.50E-01
Beets 1.38E-04 Okra 8.00E-05 Rice 2.50E-01
Pasture 2.50E-01
RCLEA/CLEA*: Origin of Food and Amount of Soil on Vegetables
Soil Contamination of Home-Grown Vegetables
Crop (kg (dw)/kg(fw))
Brussels Sprouts 0.001
Cabbage 0.001
Carrot 0.0001
Leafy Salads 0.001
Onion (shallots and leeks) 0.001
Potato 0.0002
*Note that the values are adopted from Table 6.2 of CLR 10, where the value for leeks is cautiously adopted for
onions and shallots. [12]

51
RESRAD-ONSITE uses a mass loading factor for inhalation and a mass loading factor
for foliar deposition, both with a value of 1.0E-04 g/m3. The use and definition of MLF in
RESRAD-ONSITE are different from PRG/DCC calculators and RCLEA. RESRAD-ONSITE
defines the MLF as the concentration of soil particles in the air and uses MLF to estimate the
airborne dust concentration near the source (Dust Concentration). PRG/DCC calculators use
different parameters for this purpose, such as soil resuspension multiplier (g dry soil per g fresh
plant, it is equivalent to MLF for pasture and produce) and Particulate Emission Factor (PEF).
There are a few types of PEFs in PRG/DCC calculators. They represent an estimate of the
relationship between soil contaminant concentrations and the concentration of these
contaminants in air as a consequence of particle resuspension from wind erosion or construction
activities. The unit of PEF (m3/kg) is the inverse of RESRAD-ONSITE MLF (g/m3). RaSoRS
uses an Outdoor Mass Loading Factor, which is defined as the concentration of resuspended soil.
The model has two values for residential and commercial scenarios, at values 100 and 200
µg/m³, respectively. RESRAD-ONSITE and RaSoRS use the name “mass loading” to express
the resuspension. RaSoRS uses RESRAD as the reference for MLF used in the model.
NORMALYSA, CROM, WISMUT and NCRP have different approach for mass loading factors,
which may be included in transfer factors and mass interception factors.

52
IV. CONCLUSION
Radiation risk assessment models are important tools for decision makers. They are used
to assess risk and dose for the public and workers due to radioactivity resulting from
radioactively contaminated sites. These models can be used for remediation, decommissioning,
decontamination, etc. Models are constructed in different ways, as shown in Figure 17. This
document shows an overview for some of the models that are used in the United States and
internationally. It also shed some light on the default input parameters used by the models. This
document is not intended to be a comparison between the models but rather a brief overview for
the models and the default input parameters. It does not endorse any of the models or justify
using certain default input parameters. The default input parameters are mainly used for the
initial assessment. Different values of the default input parameters would produce different
results for the assessment of a contaminated site. It is important to note that the regulatory frame
of the agency that developed the models can affect the value of the parameters. To use a model,
the regulatory frame under which the model was developed and parameter names and meanings
should be taken into consideration. Models and their parameters cannot be used out of the
context of the modeling approach and the regulatory frame.
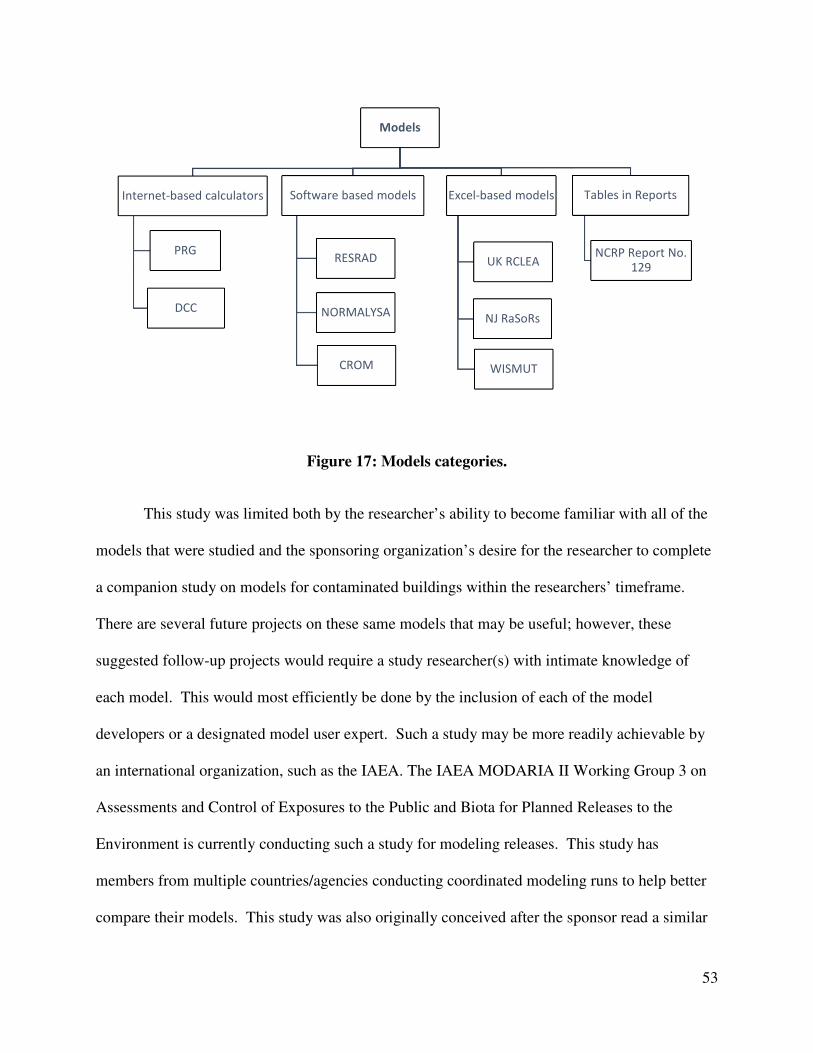
53
Figure 17: Models categories.
This study was limited both by the researcher’s ability to become familiar with all of the
models that were studied and the sponsoring organization’s desire for the researcher to complete
a companion study on models for contaminated buildings within the researchers’ timeframe.
There are several future projects on these same models that may be useful; however, these
suggested follow-up projects would require a study researcher(s) with intimate knowledge of
each model. This would most efficiently be done by the inclusion of each of the model
developers or a designated model user expert. Such a study may be more readily achievable by
an international organization, such as the IAEA. The IAEA MODARIA II Working Group 3 on
Assessments and Control of Exposures to the Public and Biota for Planned Releases to the
Environment is currently conducting such a study for modeling releases. This study has
members from multiple countries/agencies conducting coordinated modeling runs to help better
compare their models. This study was also originally conceived after the sponsor read a similar
Models
Internet-based calculators
PRG
DCC
Software based models
RESRAD
NORMALYSA
CROM
Excel-based models
UK RCLEA
NJ RaSoRs
WISMUT
Tables in Reports
NCRP Report No. 129

54
report on chemical risk assessment models issued by the European Commission in 2007, entitled
“Derivation Methods of Soil Screening Values in Europe. A Review and Evaluation of National
Procedures Towards Harmonisation”. For such a future report for radiation models suitable for
site remediation, there are three recommendations.
First, run each of the models using default parameters and several common scenarios for
radionuclides that are common risk/cost drivers for the remediation of legacy sites. The
scenarios that would most likely be suitable are subsistence farmer, suburban/urban residential,
and outside commercial/industrial workers. A list of radionuclides that are common legacy
contaminants can be found by looking at the lists used by the EPA Superfund program as
“Common Superfund Contaminants” and those selected by NRC for their lookup tables, which
are collectively: Ac-227, Am-241, C-14, Ca-45, Cl-36, Cm-242, Cm-243, Co-57, Co-60, Cs-134,
Cs-137, Eu-152, Eu-154, Fe-55, H-3, I-129, I-131, Ir-192, Mn-54, Nb-94, Ni-59, Ni-63, Pb-210,
Pu-238, Pu-239, Pu-240, Ra-226, Ra-228, S-35, Sc-46, Sr-90, Tc-99, Th-228, Th-230, Th-232,
U-234, U-235, and U-238.
Second, run each model with the same scenarios and radionuclides but modified to use as
consistent parameters as possible. Note that the models cannot match up all of their parameters,
since the choices of parameters differ within each model.
Third, include other parameters, which may have been too difficult or time-consuming to
ascertain for inclusion in this study. For example, the transfer factors used to estimate root
uptake into plants from the soil or from the consumption of plants and water by farm animals
may vary by different plant/animal types and elements within the models. In the PRG and DCC
calculators, the following hierarchy of source documents for transfer factors was used:
55
1. Milk transfer factor (TFdairy (day/L). IAEA, EA, NCRP, RESRAD. TFdairy is the
volumetric activity density in milk (pCi/L) divided by the daily intake of radionuclide
(pCi/day).
2. Beef transfer factor (TFbeef (day/kg). IAEA, EA, NCRP, RESRAD. TFbeef is the mass
activity density in beef (pCi/kg fresh weight) divided by the daily intake of
radionuclide (in pCi/d).
3. Fish bioconcentration factor (BCF (L/kg). IAEA, RESRAD. BCF is the ratio of the
radionuclide concentration in the fish tissue (pCi/kg fresh weight) from all exposure
pathways relative to that in water (pCi/L).
4. Poultry transfer factor (TFpoultry (day/kg). IAEA. TFpoultry is the mass activity density in
poultry (pCi/kg fresh weight) divided by the daily intake of radionuclide (in pCi/d).
5. Egg transfer factor (TFegg (day/kg). IAEA. TFegg is the mass activity density in egg
(pCi/kg fresh weight) divided by the daily intake of radionuclide (in pCi/d).
6. Swine transfer factor (TFswine (day/kg). IAEA. TFswine is the mass activity density in
swine (pCi/kg fresh weight) divided by the daily intake of radionuclide (in pCi/d).
7. Sheep Milk transfer factor (TFsheep-milk (day/L). IAEA. TFsheep-milk is the volumetric
activity density in sheep milk (pCi/L) divided by the daily intake of radionuclide
(pCi/day).
8. Sheep transfer factor (TFsheep (day/kg). IAEA, EA. TFsheep is the mass activity density
in sheep (pCi/kg fresh weight) divided by the daily intake of radionuclide (in pCi/d).
9. Goat Milk transfer factor (TFgoat-milk (day/L). IAEA. TFgoat-milk is the volumetric activity
density in goat milk (pCi/L) divided by the daily intake of radionuclide (pCi/day).

56
10. Goat transfer factor (TFgoat (day/kg). IAEA. TFgoat is the mass activity density in goat
(pCi/kg fresh weight) divided by the daily intake of radionuclide (in pCi/d).
11. Soil to water partition coefficient (Kd (mg/kg-soil per mg/L water or simplified =
L/kg). EPAKD, IAEA, SSL, RESRAD, BAES. (Kd is the ratio of the mass activity
density (pCi/kg) of the specified solid phase (usually on a dry mass basis) to the
volumetric activity density (Bq/L) of the specified liquid phase.
12. Soil to plant transfer factor-wet (Bvwet (pCi/g plant per pCi/g soil). IAEA, EA, NCRP,
SSL, RESRAD, BAES. The values for cereal grain are used from IAEA. (Bvwet is the
ratio of the activity concentration of radionuclide in the plant (pCi/kg wet mass) to that
in the soil (pCi/kg dry mass). Note: Some Bvwet values were derived from
Bvdry sources, assuming the ratio of dry mass to fresh mass was presented in the source
documents. (For carbon, the only value in the hierarchy is found in RESRAD. This
value is excluded as it over estimates root uptake. See section 2.5.4 for a detailed
discussion of the carbon transfer factor derivation).
13. Soil to plant transfer factor-dry (Bvdry (pCi/g plant per pCi/g soil). IAEA, EA, NCRP,
SSL, RESRAD, BAES. The values for cereal grain are used. (Bvdry is the ratio of the
activity concentration of radionuclide in the plant (pCi/kg dry mass) to that in the soil
(pCi/kg dry mass). Note: Some Bvdry values were derived from Bvwet sources,
assuming the ratio of dry mass to fresh mass was presented in the source documents.
(For carbon, the only value in the hierarchy is found in RESRAD. This value is
excluded as it over estimates root uptake. See section 2.5.4 for a detailed discussion of
the carbon transfer factor derivation).

57
This hierarchy of source documents, when summarized by produce and animal type, is shown in these illustrations:
Figure 18: PRG/DCC Soil to Plant Transfer Factor.

58
Figure 19: PRG/DCC Soil Transfer Factors.

59
REFERENCES:
1. US EPA. [2002 (last updated in 2017)]. Preliminary Remediation Goal (PRG). Retrieved
from: http://epa-prgs.ornl.gov/cgi-bin/radionuclides/rprg_search .
2. US EPA. [2004 (last updated in 2017)]. Dose Compliance Concentration (DCC).
Retrieved from: http://epa-dccs.ornl.gov/cgi-bin/dose_search .
3. ANL. (2001). User’s manual for RESRAD version 6. Environmental Assessment
Division, Argonne National Laboratory, Argonne. Retrieved from
https://web.evs.anl.gov/resrad/RESRAD_Family/.
4. Bureau of Environmental Radiation, NJ. (2003). Radioactive Soil Remediation Standards
(RaSoRS). Retrieved from http://www.nj.gov/dep/rpp/rms/rad_cleanups.htm .
5. NCRP. (1999). Recommended Screening Limits For Contaminated Surface Soil and
Review of Factors Relevant To Site-Specific Studies, NCRP Report No. 129.
6. U.K. DEFRA . (2003). The Radioactively Contaminated Land Exposure Assessment
Methodology (RCLEA). Retrieved from:
https://www.gov.uk/government/publications/rclea-software-application.
7. IAEA. (2015). NORM And LegacY Site Assessment (NORMALYSA). Retrieved from:
http://project.facilia.se/normalysa/software.html .
8. CIEMAT. [2011 (last updated in 2016)]. Screening Model for Environmental Assessment
(CROM). Retrieved from: ftp://ftp.ciemat.es/pub/CROM/CROM_8/
9. Department Radiation Protection and Environment. (2011). Calculation Guide for the
Determination of Radiation Exposure due to Environmental Radioactivity Resulting from
Mining. Germany.
10. Cullen, A.C and Frey, H.C. (1999). Probabilistic Techniques in Exposure Assessment- A
Handbook for Dealing with Variability and Uncertainty in Models and Inputs. Plenum,
New York.
11. Defra and Environment Agency. (2002). Contaminated Land Exposure Assessment
Model (CLEA): Technical Basis and Algorithms. Environment Agency R&D Publication
CLR 10.
12. Dionian, J, and Linsley, G S. (1983). Models for The Transfer of Radionuclides from
Atmosphere into Drinking Water Supplies. NRPB-M90. NRPB Chilton.
13. US EPA. (1984). Risk Analysis of TCDD Contaminated Soil, Office of Health and the
Envrimenet Assessment. Washington, D.C.
14. International Atomic Energy Agency (2001). Generic models for use in assessing the
impact of discharges of radioactive substances to the environment. IAEA Safety Reports
Series No. 19. Vienna, Austria.

60
15. ORNL. (2016). Biota Modeling in EPA's Preliminary Remediation Goal and Dose
Compliance Concentration Calculators for Use in EPA Superfund Risk Assessment:
Explanation of Intake Rate Derivation, Transfer Factor Compilation, and Mass Loading
Factor Sources Center for Radiation Protection Knowledge. November 2016, Oak Ridge,
TN.
16. E.A. (2009). Updated Technical Background to the CLEA Model. Environment Agency,
Bristol, U.K. SC050021/SR3.

61
APPENDIX A: PRG/DCC
Drinking Water Intake
Farmer/ Resident, Adult 2.5 L/day Tap water ingestion
Farmer/ Resident, Child 0.78 L/day Tap water ingestion
Recreator, Adult 0.071 L/hr Surface water
Recreator, Child 0.12 L/hr Surface water
Fruit, Vegetables and Grains Consumption Rates (g/day)
Crop Resident Adult Resident Child Farmer Adult Farmer Child
FW CW FW CW FW CW FW CW
Apple 73.7 38.2 72.2 37.4 84.7 43.9 82.9 43
Citrus 309.4 160.4 194.1 100.6 309.4 160.4 194.4 100.6
Berry 35.4 18.3 23.9 12.4 35.4 18.3 23.9 12.4
Peach 115.7 60 111.4 57.7 103.1 53.5 99.3 51.5
Pear 51.9 26.9 66.7 34.6 59.9 31.1 76.9 39.9
Strawberry 40.5 21 25.3 13.1 40.5 21 25.3 13.1
Asparagus 39.3 26.8 12 8.2 39.3 26.8 12 8.2
Beet 33.9 23.2 3.9 2.7 33.9 23.2 3.9 2.7
Broccoli 32 21.9 13.1 8.9 35.3 24.1 14.4 9.9
Cabbage 92.1 62.9 12.3 8.4 85.7 58.6 11.5 7.8
Carrot 27.3 18.7 14.9 10.2 24.4 16.6 13.3 9.1
Corn 59.8 40.9 23.8 16.3 82 56 32.7 22.3
Cucumber 82.4 56.3 25.4 17.3 54.9 37.5 16.9 11.5
Lettuce 37.5 25.6 4.2 2.9 37.5 25.6 4.2 2.9
Lima Bean 33.8 23.1 6.5 4.5 33.8 23.1 6.5 4.5
Okra 30.2 20.7 5.3 3.6 30.2 20.7 5.3 3.6
Onion 21.8 14.9 5.8 4 27.2 18.6 7.2 4.9
Pea 35.4 24.2 32.1 21.9 31.7 21.7 28.7 19.6
Pumpkin 64.8 44.2 45.2 30.9 64.8 44.2 45.2 30.9
Snap Bean 53.9 36.8 27.3 18.7 54.2 37 27.5 18.8
Tomato 80.3 54.8 29.7 20.3 94.2 64.4 34.9 23.8
White Potato 127.8 87.3 51.7 35.3 141.8 96.9 57.3 39.1
Rice - 73.2 - 28.8 88.5 - 34.8
Cereal Grain - 76.0 - 38.0 - 91.9 - 46.0

62
Fish Consumption Rates (g/day)
Farmer
Child (FW)
Farmer
Adult (FW)
Farmer
Child (CW)
Farmer
Adult (CW)
57.4 831.8 35.2 509.9
Animal Consumption Rates (g/day)
Animal Fodder Soil Water (L/day)
Beef 11.77 0.5 53
Dairy 20.3 0.4 92
Goat 1.27 0.23 3.81
Goat Milk 1.59 0.29 8.75
Chicken 0.2 0.022 0.4
Duck 0.24 0.024 0.48
Turkey 0.68 0.068 1.36
Goose 0.33 0.033 0.66
Sheep 1.75 0.32 5.25
Sheep Milk 3.15 0.57 10.4
Swine 4.7 0.37 11.4
Soil Consumption (mg/day)
Resident, Recreator, Farmer, Outdoor Worker, Composite, Adult 100
Resident, Recreator, Farmer, Child 200
Indoor Worker 50
Construction Worker 330
Meat and Poultry Consumption Rates (g/day)
Farmer
Child
(FW)
Farmer
Adult
(FW)
Resident
Child
(FW)
Resident
Adult
(FW)
Farmer
Child
(CW)
Farmer
Adult
(CW)
Dairy 994.7 676.4 n/a n/a n/a n/a
Beef 62.8 165.3 n/a n/a 31.1 81.7
Swine 33.7 92.5 n/a n/a 16.6 45.7
Poultry 46.9 107.4 n/a n/a 23.2 53.1
Egg 31.7 59.6 n/a n/a n/a n/a
Breathing Rates (m³/day) Resident, Recreator, Farmer, Child 10
Resident, Recreator, Farmer, Adult 20
Construction & Composite Worker 60
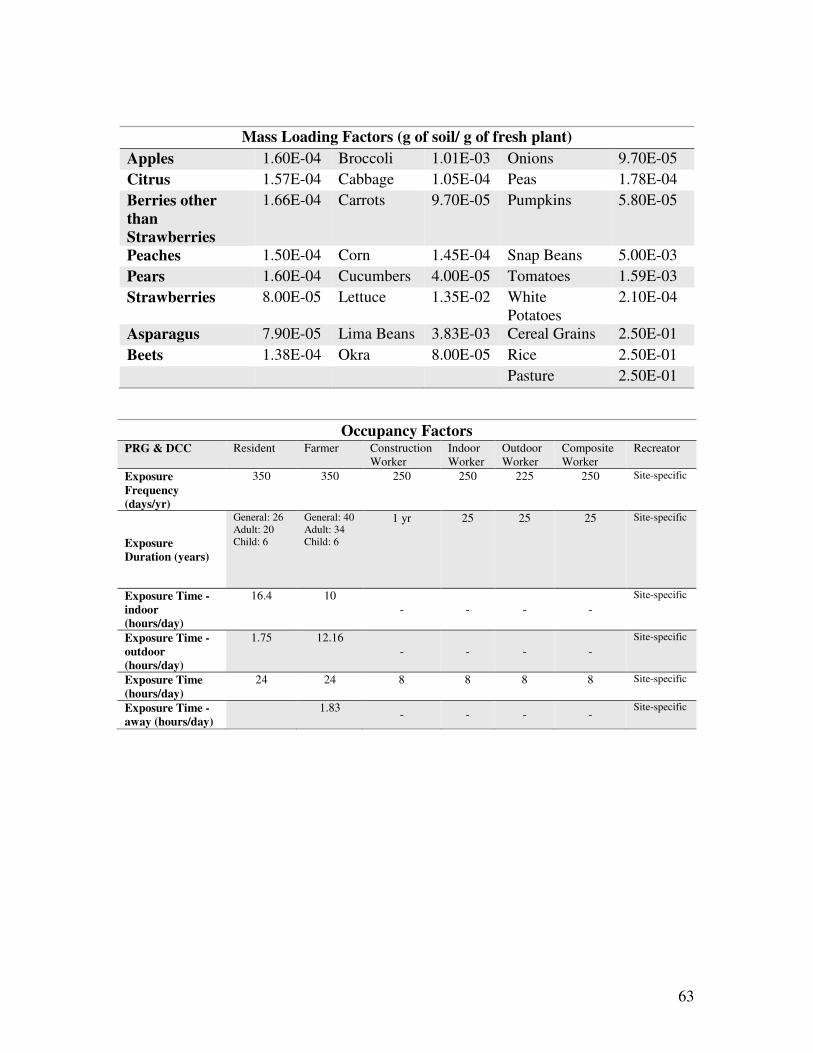
63
Mass Loading Factors (g of soil/ g of fresh plant)
Apples 1.60E-04 Broccoli 1.01E-03 Onions 9.70E-05
Citrus 1.57E-04 Cabbage 1.05E-04 Peas 1.78E-04
Berries other
than
Strawberries
1.66E-04 Carrots 9.70E-05 Pumpkins 5.80E-05
Peaches 1.50E-04 Corn 1.45E-04 Snap Beans 5.00E-03
Pears 1.60E-04 Cucumbers 4.00E-05 Tomatoes 1.59E-03
Strawberries 8.00E-05 Lettuce 1.35E-02 White
Potatoes
2.10E-04
Asparagus 7.90E-05 Lima Beans 3.83E-03 Cereal Grains 2.50E-01
Beets 1.38E-04 Okra 8.00E-05 Rice 2.50E-01
Pasture 2.50E-01
Occupancy Factors PRG & DCC
Resident Farmer Construction
Worker
Indoor
Worker
Outdoor
Worker
Composite
Worker
Recreator
Exposure
Frequency
(days/yr)
350 350 250 250 225 250 Site-specific
Exposure
Duration (years)
General: 26
Adult: 20
Child: 6
General: 40
Adult: 34
Child: 6
1 yr 25 25 25 Site-specific
Exposure Time -
indoor
(hours/day)
16.4 10
- - - -
Site-specific
Exposure Time -
outdoor
(hours/day)
1.75 12.16
- - - -
Site-specific
Exposure Time
(hours/day)
24 24 8 8 8 8 Site-specific
Exposure Time -
away (hours/day)
1.83 - - - -
Site-specific
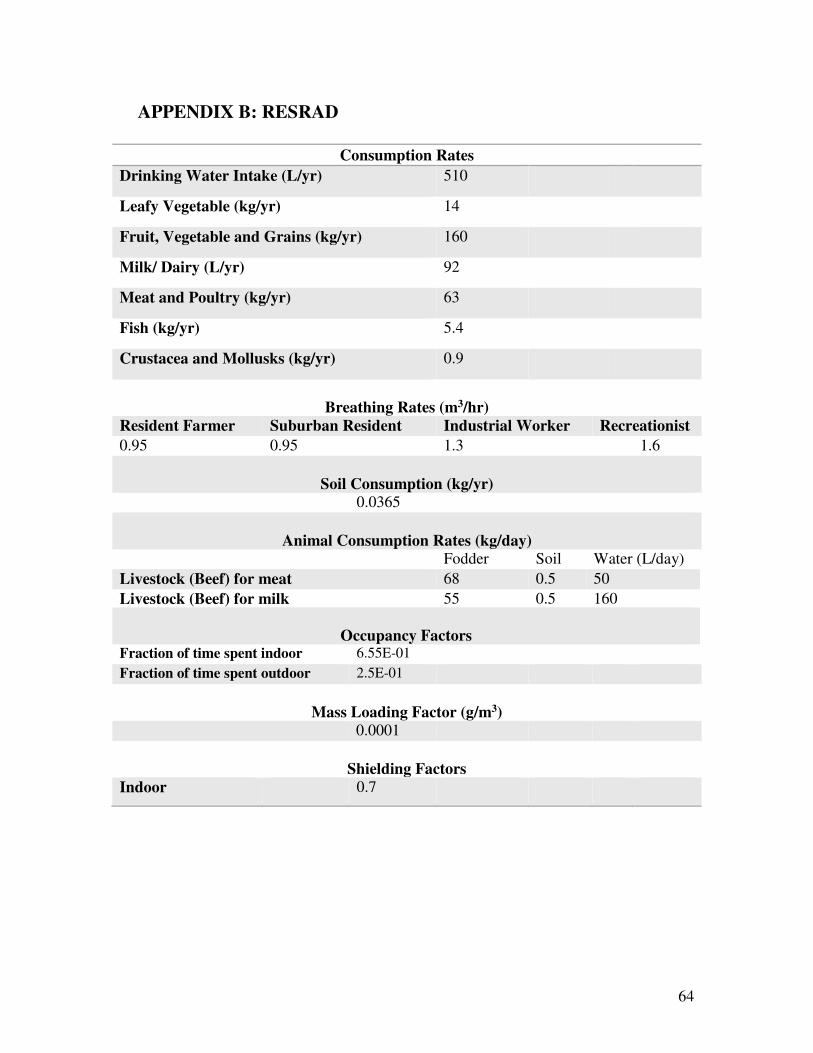
64
APPENDIX B: RESRAD
Consumption Rates
Drinking Water Intake (L/yr) 510
Leafy Vegetable (kg/yr) 14
Fruit, Vegetable and Grains (kg/yr) 160
Milk/ Dairy (L/yr) 92
Meat and Poultry (kg/yr) 63
Fish (kg/yr) 5.4
Crustacea and Mollusks (kg/yr) 0.9
Breathing Rates (m3/hr)
Resident Farmer Suburban Resident Industrial Worker Recreationist
0.95 0.95 1.3 1.6
Soil Consumption (kg/yr)
0.0365
Animal Consumption Rates (kg/day)
Fodder Soil Water (L/day)
Livestock (Beef) for meat 68 0.5 50
Livestock (Beef) for milk 55 0.5 160
Occupancy Factors Fraction of time spent indoor 6.55E-01
Fraction of time spent outdoor 2.5E-01
Mass Loading Factor (g/m3)
0.0001
Shielding Factors
Indoor 0.7

65
APPENDIX C: NORMALYSA
Drinking Water Intake (m3/yr)
Adult, Lactating mother 0.375
Child, Infant 0.076
Fruits, Vegetables and Grains Consumption Rates (kg/yr)
Crop Adult Child Infant
Cereals 52.048125 53.69175 64.9231875
Leafy vegetables 21.306915 6.44301 5.982795
Legume 2.1915 0.7305 0.7305
Roots 39.775725 40.10445 28.599075
Berries 6.64 3.33 3.33
Mushrooms 0.45 0.15 0.15
Garden food
Fruits 3.52416 1.77096 3.23196
Garden berries 0.783 0.783 0.783
Leafy vegetables 21.306915 6.44301 5.982795
Legumes 2.1915 0.7305 0.7305
Roots 39.775725 40.10445 28.599075
Milk Consumption Rates (L/yr)
Adult 31.32 Cow
Child 53.69 Cow
Infant 55.264 Cow
Meat Consumption Rates (kg/yr)
Adult Child Infant
Beef 7.9 10.8 7.5
Sheep 0.208 0.208 0.198
Moose 0.74302968 1.01797604 0.70978558
Roe Dear 0.11483186 0.15732357 0.10969414
Wild boar 0.16211557 0.22210386 0.15486231
Fish &Seafood Consumption Rates (kg/yr)
Marine/ Freshwater Adult Child Infant
Cray fish 0.26240987 0.12111225 0.11438379
Fish 1.19055463 0.54948675 0.51895971
Mussels 0 0 0
Breathing Rates (m³/h)
Infant/ Child 0.92
Adult 0.64

66
Soil Consumption Rates (kg/hr)
Adult 5.0E-6
Child 1.0E-5
Infant 5.0E-5
Animal Consumption Rates (kgDW/day)
Ingestion of pasture by meat animals 11.4 Cow
Ingestion rate of pasture by milk animals 9.1 Cow
Ingestion rate of soil by meat animals 0.7 Cow
Ingestion rate of soil by milk animals 0.6 Cow
Ingestion rate of water by meat animals (m3/d) 0.06 Cow
Ingestion rate of water by milk animals (m3/d) 0.04 Cow
Occupancy Factors
Fraction of time exposed outdoors 0.25 For all groups
Shielding Factors
1

67
APPENDIX D: CROM
Drinking Water Intake (m3/yr)
Adult 0.600 Water and Beverages
Infant 0.260 Water and Beverages
Fruits, Vegetables and Grains including potatoes (kg/yr)
Adult 410
Infant 150
Milk Consumption Rates (L/yr)
Adult 250
Infant 300
Meat Consumption Rates (kg/yr)
Adult 100
Infant 40
Fish & Seafood Consumption Rates (kg/yr)
Adult Infant
Freshwater fish 30 15
Marine fish 50 25
Marine fish 15 0
Inhalation Rates (m³/yr)
0-1 1400
1--2 1898
2--7 3197
7--12 5577
12--17 7337
>17 8322
Animal Consumption Rates (kg/yr)
Fodder kg dw/day Water m3/day
Large Animal for milk 16 0.06
Large Animal for meat 12 0.04
Occupancy Factors
Adult Infant
External Exposure (Hour/yr) Fraction (Hour/yr) Fraction
Surface contaminated owing to air
deposition
8760 1 8760 1
Working /playing over
contaminated sediment
1600 0.18 1000 0.12
Submersion in air 8760 1 8760 1
Garden and ground exposure
from irrigation
500 0.06 500 0.06

68
APPENDIX E: RCLEA
Fruits, Vegetables and Grains Consumption Rates (kg fw/ kg body weight /yr)
Adult Child Infant
Brussels Sprouts 0.2555 0.2482 0.4745
Cabbage 0.24455 0.22995 0.5475
Carrot 0.23725 0.365 0.657
Leafy Salads 0.17885 0.19345 0.4015
Onion (shallots and leeks) 0.1606 0.22995 0.3358
Potato 1.24 2.0805 2.7375
Breathing Rates (m³/h)
Active Passive
Male Infant 0.339 0.124
Male Child 1.103 0.404
Male Adult 1.456 0.485
Female Infant 0.32 0.117
Female Child 1.1 0.403
Female Adult 1.234 0.411
Soil Consumption Rates (kg dw/yr)
Land Use
Residential with Home-Grown
Produce, Infant
0.055
Residential with Home-Grown
Produce, Child
0.037
Residential with Home-Grown
Produce, Adult
0.022
Residential without Home-Grown Produce,
Infant
0.055
Residential without Home-Grown Produce, Child 0.037
Residential without Home-Grown Produce, Adult 0.022
Allotments, Infant 0.055
Allotments, Child 0.037
Allotments, Adult 0.026
Commercial/Industrial, Adult 0.0092
Shielding Factors
Indoors: Timber 0
Indoors: Concrete/Brick 0.9

69
Origin of Food and Amount of Soil on Vegetables
Soil Contamination of Home-Grown Vegetables
Crop (kg(dw)/kg(fw))
Brussels Sprouts 0.001
Cabbage 0.001
Carrot 0.0001
Leafy Salads 0.001
Onion (shallots and
leeks)
0.001
Potato 0.0002
Occupancy Factors
Adult Child Infant
Fraction of time spent: Active Passive Active Passive Active Passive
Residential with Home-Grown
Produce, indoor
0.125 0.708 0.083 0.667 0.125 0.750
Residential with Home-Grown
Produce, outdoor
37.96 0.063 0.083 0 0.083 0.042
Residential without Home-
Grown Produce, indoor
0.125 0.708 0.083 0.667 0.125 0.750
Residential without Home-
Grown Produce, outdoor
37.96 0.063 0.083 0 0.083 0.042
Allotments, indoor 0.125 0.708 0.083 0.667 0.125 0.750
Allotments, outdoor 34.675 0.047 0.012 0.012 13.14 0.018
Commercial/Industrial, indoor 0.052 0.144 - - - -
Commercial/Industrial,
outdoor
0.013 0.006 - - - -
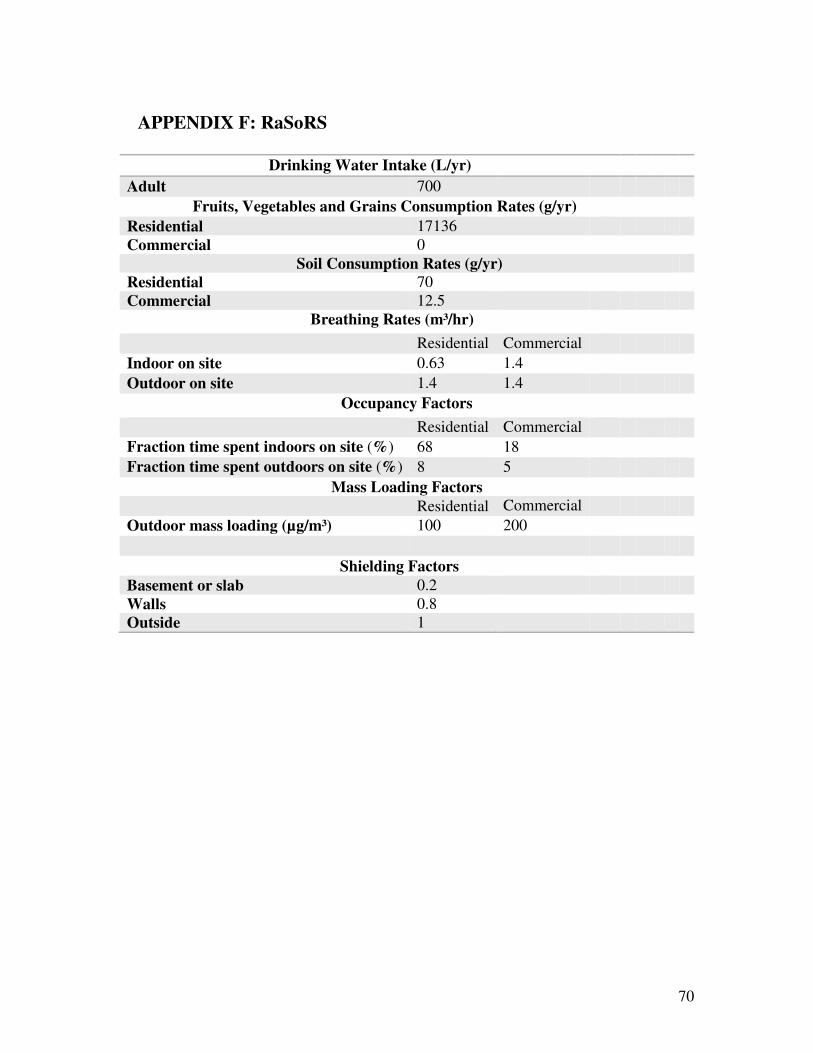
70
APPENDIX F: RaSoRS
Drinking Water Intake (L/yr)
Adult 700
Fruits, Vegetables and Grains Consumption Rates (g/yr)
Residential 17136
Commercial 0
Soil Consumption Rates (g/yr)
Residential 70
Commercial 12.5
Breathing Rates (m³/hr)
Residential Commercial
Indoor on site 0.63 1.4
Outdoor on site 1.4 1.4
Occupancy Factors
Residential Commercial
Fraction time spent indoors on site (%) 68 18
Fraction time spent outdoors on site (%) 8 5
Mass Loading Factors
Residential Commercial
Outdoor mass loading (µg/m³) 100 200
Shielding Factors
Basement or slab 0.2
Walls 0.8
Outside 1

71
APPENDIX G: WISMUT
Consumption Rates
Reference Person ≤ 1 yr 1 - 2 yr 2 - 7 yr 7 - 12 yr 12 -17 yr > 17 yr Worker
Drinking Water Intake
(L/yr)
55 100 100 150 200 350
Milk Including Milk
products (L/yr)
45 160 160 170 170 130
Meat Including meat
products (kg/yr)
5 13 50 65 80 90
Fish &Seafood
consumption (kg/yr)
0.5 3 3 4.5 5 7.5
Vegetable products 75 138 227 259 271 253
Cereals, cereal products
(kg/yr)
12 30 80 95 110 110
Fresh fruit, fruit
products, juice (kg/yr) 25 45 65 65 60 35
Potatoes, root
vegetables, juice (kg/yr)
30 40 45 55 55 55
Leafy vegetables 3 6 7 9 11 13
Vegetables, vegetable
products, juice (kg/yr)
5 17 30 35 35 40
Soil consumption
(kg/yr)
0 5 E-5 3E-5 6E-6 6E-6 6E-6 6E-6
Breathing Rates (m³/h) 0.12 0.22 0.36 0.64 0.84 0.93 1.2
Animal Consumption Rates (kg/day)
Fodder Soil Water (L/day)
Cattle 65 0.5 75
Shielding Factors
Outdoors 1
Indoors, solid construction buildings (brick, concrete) 0.1
Indoors, lightweight construction buildings (wooden) 0.3
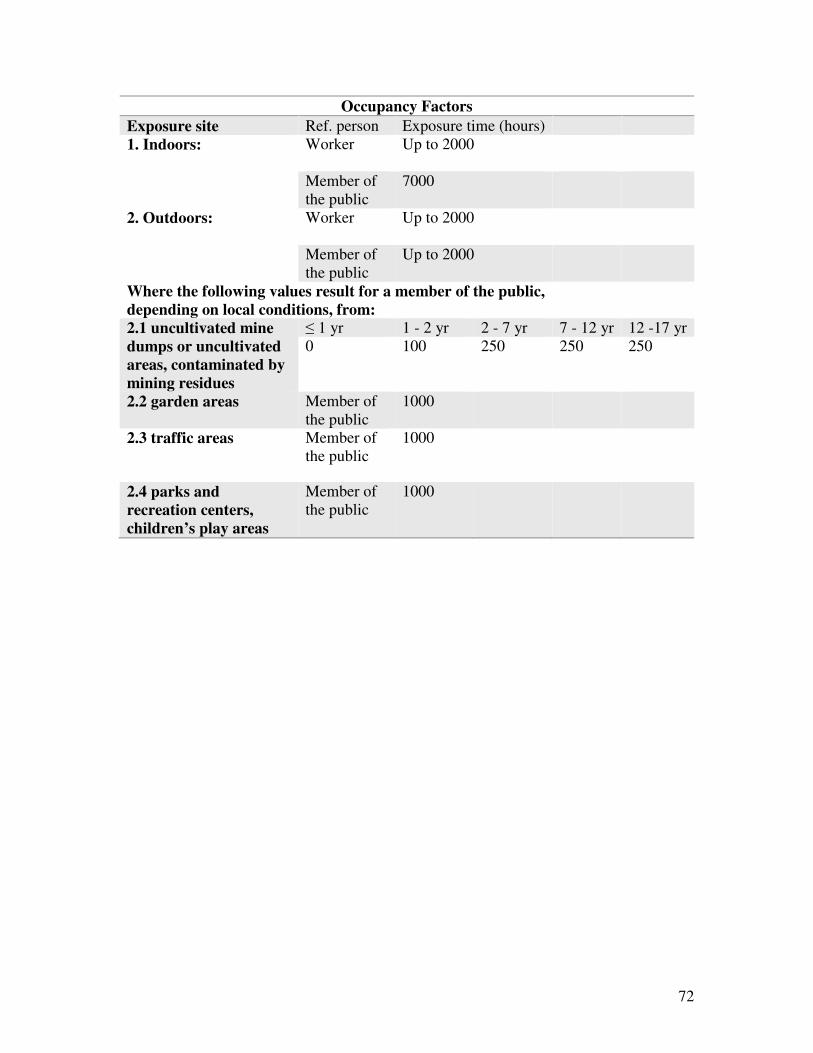
72
Occupancy Factors
Exposure site Ref. person Exposure time (hours)
1. Indoors: Worker Up to 2000
Member of
the public
7000
2. Outdoors: Worker Up to 2000
Member of
the public
Up to 2000
Where the following values result for a member of the public,
depending on local conditions, from:
2.1 uncultivated mine
dumps or uncultivated
areas, contaminated by
mining residues
≤ 1 yr 1 - 2 yr 2 - 7 yr 7 - 12 yr 12 -17 yr
0 100 250 250 250
2.2 garden areas Member of
the public
1000
2.3 traffic areas Member of
the public
1000
2.4 parks and
recreation centers,
children’s play areas
Member of
the public
1000

73
APPENDIX H: NCRP
Fruit, Vegetable and Grains (kg/yr) 300
Milk consumption (L/yr) 200
Meat and poultry consumption (kg/yr) 100
Inhalation Rates (m3/day)
Land-use Outdoor Indoor
Agricultural 35 -
Heavily Vegetated Pasture 35 -
Sparsely vegetated pasture 35 -
Heavily Vegetated rural 30 20
Sparsely Vegetated rural 30 20
Suburban 25 20
Construction, etc. 35 -
Soil Consumption Rates (g/day)
Land-Use Scenario Adult Child
Agricultural 0.1 -
Heavily Vegetated Pasture 0.05 -
Sparsely vegetated pasture 0.1 -
Heavily Vegetated rural 0.05 0.1
Sparsely Vegetated rural 0.1 0.2
Suburban 0.05 0.1
Construction, etc. 0.1 -
Animal Consumption Rates (kg/day)
Fodder Soil Water
Milk cows 16 - -
Beef cattle, game 8 - -
Pigs 2.4 - -
Calves 1.9 - -
Lamb 1.1 - -
Chicken 0.07 - -
Occupancy Factors
Percent of time spent: Indoor on-site (%) Outdoor on-site (%) Time off-site (%)
Agricultural 40 0 60
Heavily Vegetated Pasture 30 0 70
Sparsely vegetated pasture 30 0 70
Heavily Vegetated rural 40 50 10
Sparsely Vegetated rural 40 50 10
Suburban 40 50 10
Construction, etc. 30 0 70
Shielding Factors
Radionuclides dependents, Appendix C