overtopped wave loads on walls (walowa) numerical … · the project was a cooperation of ghent...
TRANSCRIPT

Proceedings of the HYDRALAB+ Joint User Meeting, Bucharest, May 2019
1
OVERTOPPED WAVE LOADS ON WALLS (WALOWA) – NUMERICAL AND PHYSICAL
MODELLING OF LARGE-SCALE EXPERIMENTS IN THE DELTA FLUME Maximilian Streicher (1) & Andreas Kortenhaus (1) & Vincent Gruwez (1) & Tomohiro Suzuki (2) & Corrado Altomare (3) & Alessandra Saponieri (4) & Davide Pasquali (5) & Nico Valentini (4) & Giuseppe Tripepi (6) & Daniele Celli (6) & Marcello Di Risio (5) & Francesco Aristodemo (6) & Leonardo Damiani (4) & Lorenzo Cappietti (7) & Mark Klein Breteler (8) & Dorothea Kaste (8)
(1) Ghent University, Belgium, E-mail: [email protected]
(2) Flanders Hydraulics Research, Belgium, E-mail: [email protected] (3) Universitat Politecnica de Catalunya, Spain, E-mail: [email protected]
(4) Politecnico di Bari, Italy, E-mail: [email protected] (5) Università degli Studi dell’Aquila, Italy, E-mail: [email protected]
(6) Università della Calabria, Italy, E-mail: [email protected] (7) Università degli Studi di Firenze, Italy, E-mail: [email protected]
(8) Deltares, The Netherlands, E-mail: [email protected]
Large-scale experiments on overtopping wave impact loads on dike mounted walls were conducted in the Deltares Delta Flume for mildly sloping foreshore and shallow water conditions. The experiments were accompanied by a set of numerical model tools in order to help design the experimental set-up, extend the measured data by the high resolution output of the numerical models and to numerically remodel a change in geometry. The methods used for the hybrid modelling approach and first results are herein discussed.
1. INTRODUCTION AND OBJECTIVES
For the research project WALOWA (WAve LOads on WAlls), carried out within the EU program HYDRALAB+, model tests in the Deltares Delta Flume in Delft (The Netherlands) were conducted in March 2017. The project was a cooperation of Ghent University (Belgium), TU Delft (The Netherlands), RWTH Aachen (Germany), Polytechnic University of Bari, University of L’Aquila, University of Calabria, University of Florence (Italy) and Flanders Hydraulics Research (Belgium). It was the aim to study overtopping wave impacts on storm walls and buildings situated on top of a dike and for mild foreshore conditions. A major second objective was to use the measured data and validate numerical models in terms of water surface elevation over the mild foreshore (SWASH), morphological foreshore evolution (XBeach) and wave impact forces and pressures on the wall (SWASH, DualSPHysics and OpenFOAM). Furthermore a detailed simulation of the overtopped flow field formation, in terms of flow layer thickness and velocity, on the promenade and the complex interaction between incoming and reflected flow, should be enabled with the numerical model results from SWASH, DualSPHysics and OpenFOAM. The detailed objectives regarding the hybrid modelling approach involved:
1. To study the morphology bed evolution of the sandy foreshore before the experiment with the numerical model XBeach in order to estimate the expected profile changes and erosion depth at the dike toe. To measure the profile change during the experiment and validate the XBeach model with the measured data.
2. To calibrate the numerical model SWASH based on the surface elevation measurements from the wave gauges and perform numerical simulations for a situation without the dike present in order to obtain the incident wave conditions (without reflections from the dike or wall).
3. To re-model the water surface elevation at the dike toe and the flow field formation on the promenade in high-resolution with the numerical models SWASH, DualSPHysics and OpenFOAM. To validate the results with the measurements from the physical model and enable an inter-comparison between the models.
2. EXPERIMENTAL SET-UP
The model geometry was divided into four parts (see Figure 1): (1) A sandy foreshore with a combined slope cot(n) = 10 at the beginning and cot(θ) = 35 seaward of the toe of the dike, along reaches of 19.5 m and 61.6 m, respectively. The total foreshore volume was comprised of

Proceedings of the HYDRALAB+ Joint User Meeting, Bucharest, May 2019
2
~1000 m³ of sand spread over the 5 m flume width. (2) Attached to the foreshore a concrete dike with a cot(α) = 2 slope and (3) a 2.35 m-wide promenade with an offshore slope of 1-to-100 to drain the water. (4) At the end of the promenade a vertical 1.6 m-high steel wall was built to measure the impact loads with pressure sensors and load cells. The model dimensions were given in model scale using Froude similarity and length scale factor 1-to-4.3 (see Table 1). A more detailed description of the model and measurement set-up was given by Streicher et al. (2017).
Table 1: Geometrical parameters for WALOWA model set-up
The test program in chronological order is given in Table 2. The asterix behind the testID indicates after which test a profile measurement was carried out. The profile measurements are numbered accordingly from 0-16, with 0 as the initial conditions before the test.
3. STUDY OF MORPHOLOGICAL SAND BED EVOLUTION
The numerical model XBeach was used to design the physical experiment and to estimate the scour depth at the dike toe and the profile evolution of the sandy foreshore in front of the dike in a first step. Profile measurements were taken during the physical experiments and the morphological evolution in front of the storm seawall was discussed in terms of bed scour at the dike toe and its temporal evolution. In order to analyze the performance of the XBeach model in simulating bed evolution in front of the dike in such particular foreshore conditions, the measured data were used and compared to the numerical results in a second step. A more detailed description of the procedure can be found in Saponieri et al. 2018. 3.1 Measurement of sand bed profile evolution Cross-shore bed profiles were measured by means of a mechanical profiler after 16 tests (see superscript number for the testID in Table 2). Five sections were considered, along the centerline and at 0.2 m and 0.4 m to both sides of the centerline. The mechanical profiler (see Figure 2, left), developed by Deltares, consisted of a wheel which was attached to a measurement hinge/arm fixed to the measurement carriage, moving in both long-shore and cross-shore directions. The wheel, with a diameter equal to 10 cm, was able to measure the bed profile by moving with a low and constant velocity along the selected section. Both cross-shore distances and relative bed elevations were acquired.
Model scale
L; H; B cot(n); cot(θ); cot(α)
l1; l2; l3; l4 h1, h2; h3; hw Gc
- m ° m m m
1-to-4.3 275.5; 9.5; 5 10; 35; 2 93.98; 19.5; 61.6; 1.07 1.95; 3.73; 0.53; 1.6 2.35
Figure 1: WALOWA model geometry as a side-view (upper figure) and a top-view (lower figure) drawing.

Proceedings of the HYDRALAB+ Joint User Meeting, Bucharest, May 2019
3
Table 2: Test program for WALOWA experiments with measured parameters (model scale) in chronological order. Superscripts for the testID indicate that after this test a profile measurement of the foreshore was carried out.
testID Waves hpaddle htoe Ac Hm0,off Hm0,toe Tm-1,0,off Tm-1,0,toe htoe/Hm0,off
- - m m m m m s s -
Bi_1_4 ~18 3.99 0.28 0.25 1.11 0.36 6.76 19.89 0.25
Bi_1_5*2 ~18 4.00 0.29 0.24 1.29 0.42 6.99 21.55 0.22
Bi_1_6 ~18 4.01 0.30 0.23 1.23 0.40 7.40 21.44 0.24
Bi_2_4*3 ~18 4.13 0.42 0.11 1.17 0.44 6.10 19.36 0.36
Irr_1_F*4 ~1000 3.99 0.28 0.25 1.05 0.30 5.80 12.30 0.27
Irr_2_F*5 ~3000 4.00 0.29 0.24 0.92 0.29 5.36 10.39 0.32
Irr_2_S*6 ~3000 3.99 0.28 0.25 0.92 0.29 5.38 9.35 0.30
Irr_3_F*7 ~3000 4.12 0.41 0.12 0.92 0.36 5.36 7.98 0.45
Bi_2_5 ~18 4.14 0.43 0.10 1.27 0.49 6.16 17.31 0.34
Bi_2_6 ~18 4.14 0.43 0.10 1.30 0.51 6.24 17.14 0.33
Bi_2_6_R*8 ~18 4.14 0.43 0.10 1.31 0.50 6.19 17.26 0.33
Irr_8_F*9 ~1000 4.13 0.42 0.11 0.49 0.35 3.83 4.85 0.86
Irr_4_F*10 ~1000 3.79 0.08 0.45 0.87 0.22 5.41 12.05 0.09
Irr_5_F*11 ~1000 3.78 0.07 0.46 1.05 0.26 5.82 13.55 0.07
Irr_1_F_R*12 ~1000 4.01 0.30 0.23 1.06 0.35 5.80 10.43 0.28
Irr_7_F*13 ~1000 4.00 0.29 0.24 0.65 0.29 4.65 7.00 0.45
Irr_2_F_R*14 ~3000 4.01 0.30 0.23 0.92 0.32 5.36 8.55 0.33
Bi_1_6_R ~18 4.01 0.30 0.23 1.34 0.48 6.07 17.50 0.22
Bi_3_6 ~18 3.77 0.06 0.47 1.05 0.31 6.52 22.79 0.05
Bi_3_6_1 ~18 3.77 0.06 0.47 1.16 0.34 6.64 21.71 0.05
Bi_3_6_2*15 ~18 3.76 0.05 0.48 1.28 0.35 6.36 19.59 0.04
Irr_6_F*16 ~1000 3.77 0.06 0.47 0.65 0.19 4.68 10.05 0.09
The location in x-direction (flume main axis direction) was determined by using a laser distance meter targeting to a fixed point at the end of the flume. After each test, the foreshore was not restored to its initial configuration. For the purpose of clarity, the sketch of the scour and the main geometrical parameters used for the analyses were shown in Figure 2 (right). In the following, S (m) and Ls (m) refer to the maximum scour depth from the initial profile (scour trough) and its horizontal extension, respectively. The parameter Δzmean [m] was used to describe the mean scour depth. Ae (m2) is the scour area, Dd (m) is the distance of the scour trough from the dike toe, β indicates the bed slope, d (cm) is the initial offshore water depth. Analyses was carried out by comparing the measured initial and final profiles before and after the test. Morphodynamic evolution of the beach profiles was investigated by observing scour formation at the dike toe induced by the different wave conditions tested during the campaign. With reference to WALOWA tests program (see Table 2), there was a temporal mixing between monochromatic and irregular waves, not suitable for studying long-term morphodynamics. The analysis of bed profiles was therefore carried out for transient conditions.
Figure 2: Mechanical profiler deployed in the Delta Flume (left figure). Sketch of parameter definitions for scour evolution at the dike toe (right figure).

Proceedings of the HYDRALAB+ Joint User Meeting, Bucharest, May 2019
4
Figure 3 shows an example of bed profile evolution evaluated for the central flume section, after the first 4 tests of the test program (3 bi-chromatic and 1 irregular wave test). A rough estimate of the maximum scour depth was 0.3 m for the WALOWA laboratory scale, corresponding to a prototype depth of about 1.3 m. The scour velocity of the erosion process at the dike toe was higher at the beginning of the experiments, mainly during irregular wave attacks. Then, the buildup of the scour hole decelerated. Despite the transient wave conditions, the scour geometry reached a quasi-equilibrium state, after 11 h of wave forcing. The final area affected by scour has a cross-shore length of Ls = 9 m, a relative mean scour depth of Δzmean = 0.2 m and the eroded volume is about 8 m3.
3.2 Numerical modelling of sand bed profile evolution with XBeach Numerical modeling was employed in two steps. In the first step, the XBeach model was used to support the design of the experiments and estimate the expected amount and location of erosion/ accretion (Step-1). Then, the same XBeach model set-up was used with the boundary conditions from the physical experiment and the results compared to the measurements (Step-2). In Step-1 a sensitivity analysis of the model morphodynamics predictive skills was performed by varying both grid spatial discretization and boundary conditions. The simulations were carried out by imposing stationary wave boundary conditions (STAT) and wave groups based on JONSWAP spectra (VAR). The offshore and inshore boundary conditions were set absorbing and impermeable. The duration of each simulation was selected to be equal to the foreseen experimental one. Only for wave group simulations (VAR) a 15 minutes warm-up interval was used during which the whole domain was considered as a fixed bottom. During the large-scale physical experiments it was expected that the bed profile could not be re-profiled after each test. Hence, an extended series of simulations were performed with XBeach, to estimate the cumulative erosion/accretion pattern and scour depth at the dike toe without (numerically) re-profiling at the end of each simulation in both stationary and wave group conditions. In Step-2 the numerical model XBeach was further validated with the obtained profile measurements from the physical experiments, by setting the model according to the outcomes derived from the sensitivity analysis. A 2D uniform computational grid was used with a spatial discretization equal to 0.20 m, forced with a non-stationary JONSWAP (or bi-chromatic) wave boundary condition with a warm-up time of 900 s, imposing as absorbing both offshore and inshore boundaries. A validation of the XBeach model for such particular conditions, characterized by frequent occurrence of breaking waves, suspension mode of sediment transport and presence of very shallow to extremely shallow foreshore, was achieved in two steps. First, the test program for the XBeach model was set equal with that detailed in Table 2. Secondly, the profile evolution between numerical model and measurement was studied and the maximum S and mean Δzmean scour depth at the dike toe compared (see Figure 5). The x-label in the figure indicates the measured profile number (superscripts for testID in Table 2). It was observed that the XBeach model was able to catch the general trend of the scour evolution over time and was able to correctly reproduce the magnitude of long term scour evolution (more than 18000 waves).
Figure 3: Example of bottom foreshore evolution for the first 4 tests from the test program (see Table 2).

Proceedings of the HYDRALAB+ Joint User Meeting, Bucharest, May 2019
5
4. STUDY OF WATER SURFACE ELEVATION AND WAVE PARAMETERS For the purpose of design guidance the incident wave parameters at the dike toe are of key importance. To eliminate most of the reflection occurring from the dike and wall, often experiments featuring the same wave train were conducted but removing the dike, promenade and wall in the experimental set-up. Due to cost and construction constraints this was not feasible in the physical large-scale experiment in the Delta Flume. It was decided to use the numerical SWASH model to calculate the incident wave parameters, which was already successfully applied for the computation of spectral wave parameters in shallow water and mild foreshore conditions (Suzuki et al. 2014). The SWASH model was calibrated based on the wave measurements in test Bi_2_6 from the test program (see Table 2) in a first step. In a second step the calibrated SWASH model was used to artificially remove the dike, promenade and wall in the numerical simulation and derive the incident spectral wave parameters for the dike toe location (without reflections from the dike and wall). 4.1 Measurement of water surface elevation The water surface elevation was measured with wave gauges WG1-WG7 at several locations along the flume (see Table 4). A first location was in the flat bottom part of the flume, close to the wave paddle, to measure the deep water surface elevation. This was done with 3 wave gauges (WG1-WG3), to allow for reflection analysis of the signal using the method of Mansard and Funke (1980). Along the foreshore 3 wave gauges (WG4-WG6) were deployed. They mainly served to monitor the change in wave parameters, wave breaking and shift in spectral wave energy towards lower frequency components (Hofland et al. 2017). Lastly, a wave gauge was deployed just 0.35m in front of the at the dike toe (WG7), to measure the incident water surface elevation at the dike toe.
Table 4: Location of wave gauges in flume length direction, with the origin (x=0) at the wave paddle
In-house made resistive type wave gauges were installed at the right flume wall, when looking towards the paddle. A reference electrode was used to compensate for changes in the water conductivity due to salinity or temperature during the experiment. Wave analysis of the measured water surface elevation was carried out using Wavelab Version 3.7. The time-series of the incident water surface elevation and incident spectral wave parameters Hm0,o [m] and Tm-1,0 [s] at the WG1-WG3 location were obtained using the method of Mansard and Funke (1980), to distinguish incident and reflected components. A spectra independent high-pass filter at 0.03Hz and a spectra dependent low-pass filter at 3/Tp Hz were used. Additionally, the fft block size was selected automatically and the taper width and overlap set to 20%. Furthermore a number of data points
Paddle WG1 WG2 WG3 WG4 WG5 WG6 WG7 Dike toe
m m m m m m m m m
0 43.5 49.5 61.5 107.89 126.42 155.66 174.73 175.08
Figure 5: Scour evolution related to profile number in terms of maximum (S) and relative mean (Δzmean) depth. The solid line with circles refers to experimental results and the orange line with squares to the numerical results.

Proceedings of the HYDRALAB+ Joint User Meeting, Bucharest, May 2019
6
were skipped at the beginning and end of each time-series to focus the wave analysis on a fully developed wave field. Next, the measured time-series and spectral wave parameters for the other wave gauges were derived by simply analyzing the signal of each individual wave gauge (no separation of incident and reflected waves was possible). The calibrated numerical model SWASH was then used to calculate the incident water surface elevation and incident wave parameters at the dike toe, key for the design of coastal structures. 4.2 Numerical modelling of water surface elevation with SWASH The input at the wave boundary of SWASH was the incident wave time-series obtained by the reflection analysis of Mansard and Funke (1980) method (see Section 4.1). Note, that the distance of the three wave gauges (WG1-WG3) was not optimized for the bichromaic wave Bi_2_6 test. Still, a reasonable time-series was achieved after reflection analysis. The SWASH domain was modelled from x=43.5 to 206.4 m flume length (see Figure 1). The grid size of dx=0.2 m was used. The vertical wall was modelled by activating BOTCel SHIFT mode in SWASH, so that the wall was expressed correctly (i.e. no interpolation). As stated above, the boundary input came from time-series of water surface elevation, and the type of the wave boundary in SWASH was the weakly reflective boundary condition which was functioning the same as an Active Wave Absorption Systems (AWAS). The Manning bottom friction parameter n=0.019 m-1/3s was applied for the entire domain, for both sand bottom and dike. The used SWASH version was 4.01. The number of layers in SWASH was selected by the kh value (where k is wavenumber and h is depth at the three wave gauge location). In this condition the kh value was below 1, and therefore one layer approach was used as a standard case. The setting described above was decided based on sensitivity analyses. Firstly, the sensitivity analysis was focused on the incident wave time-series: one time-series was taken as the measured time-series from wave gauge WG1 at x=43.5 m (Figure 6, left) and the other time-series was taken from the time-series obtained after reflection analysis (Figure 6, right). The former was less accurate compared to the measurements. A possible reason for this could be that the raw time-series at one wave gauge still contained the reflection from the foreshore. Even though
the reflection coefficient was small, the influence of the reflected waves on the time-series was not negligible. Secondly, a sensitivity analysis for the grid size was conducted. Grid sizes in flume length direction of dx=0.1, 0.2, 0.4 and 0.8 m were tested. Grid size dx=0.2 m resulted in the best fit comparison between measured and computed water surface elevation and was selected for the simulation. Wave transformation wise, the dx=0.1 and 0.2 m cases gave similar results, so dx=0.2 m was used as it is computationally faster. Finally, a sensitivity analysis of the number of layers used for the computation was conducted. Both, one layer and two layer approach gave similar results. This was explained by the kh number as stated above; One layer calculation was considered accurate enough for the wave propagation and selected for the computation.
Figure 6: Sensitivity analysis on time-series input (left: time-series from the wave gauge at x=43.5 m, right: time-series of incident waves). One layer and dx=0.2 was applied to this analysis.

Proceedings of the HYDRALAB+ Joint User Meeting, Bucharest, May 2019
7
5. STUDY OF OVERTOPPING FLOW THICKNESS AND VELOCITY
Overtopping flow thicknesses η [m] and velocities u [m/s] were measured on top of the promenade. The measurement of overtopping flow thickness and velocity is extremely difficult in alternating wet and dry conditions and for highly turbulent and aerated flows. None of the conventional devices to measure water surface elevations (wave gauges, ultra-sonic distance sensors) or velocities (paddle wheels, micro propellers, acoustic doppler velocimeter, electro-magnetic current meter) was designed to measure in this conditions. Hence, a redundant measurement set-up was aimed for. Furthermore, it was the objective to use calibrated numerical models to compute the high-resolution flow parameters along the promenade until the wall. In this way a study of the flow field and transformation of the flow field along the promenade was enabled. Numerical modelling of the overtopping flow parameters for the same bichromatic wave test investigated in Section 4 (Bi_2_6) was done using SWASH, DualSPHysics and OpenFOAM. The SWASH numerical model and model setup was described in Section 4.2. The remaining models and model setups were discussed in Section 5.2 together with the first results. 5.1 Measurement of flow thickness and velocity The overtopping flow parameters thickness η [m] and velocity u [m/s] were measured by instruments attached to a wooden frame installed 1m above of the promenade on the right flume side when looking towards the paddle (see Figure 8, left). The flow thickness was obtained by 4 resistance-type wave gauges (WLDM1-WLDM4). The measurement principle was similar to the water surface elevation measurement along the foreshore (see Section 4.1), measuring the change in conductivity between two metal electrodes according to the water level. The wave gauge foot with the reference electrode was submerged 5cm below the elevation of the promenade, in a 12cm deep bucket of water. The flow velocity was obtained by 4 Airmar S300 ow meter paddle wheels (PW1-PW4), measuring only the incoming flow velocity. Two paddles attached to a rotational axis
and mounted in a half open housing were rotated by the incoming overtopping flow. Depending on the rotation speed the flow velocity was derived. The paddle wheels were measuring at 0.03m above the promenade. Both types of instruments (WLDM and PW) were installed in two lines parallel to the flume wall 0.24m apart from each other. Detailed locations of the measurement devices measuring the flow parameters on the promenade can be found in Cappietti et al. (2018). Additionally, an electromagnetic current meter (Valeport 802) was installed to measure the flow velocity and 4 ultra-sonic distance sensor (3 MaxSonar HRXL, 1 Honeywell 943 M18), to obtain a non-intrusive measurement of the flow thickness. The ultra-sonic distance sensors often lost the signal, due to spray which would touch the sensor surface. The time-series of the wave gauges installed on the promenade was used to determine the flow layer thicknesses on the promenade. It was further noted that the overtopping flow at location 1 was often affected by the overtopping splash. Hence, it was decided to use the measurements from WLDM2 (see Figure 8, right), to compare to the numerical model simulations.
Figure 8: The measurement of flow thickness and velocity on the promenade in the Deltares Delta Flume. Ultrasonic distance sensors (UDS) and resistive type wave gauges (WLDM) were used to measure the flow thickness and electro-magnetic current meter (EMS) and paddle wheel (PW) to measure the flow velocities.

Proceedings of the HYDRALAB+ Joint User Meeting, Bucharest, May 2019
8
5.2 Numerical modelling of layer thickness with OpenFOAM, DualSPHysics and SWASH OpenFOAM® (Weller et al., 1998) is a library of applications and solvers including interFoam, a Navier-Stokes equations solver following an Eulerian mesh-based method for two incompressible, isothermal immiscible fluids using a Volume-of-Fluid (VOF) phase-fraction based interface capturing approach. In this work OpenFOAM v6 was applied, using the solver interFoam (for a detailed description it is referred to Larsen et al. 2018) with the boundary conditions for wave generation and absorption provided by olaFlow (Higuera, 2017), hereafter simply referred to as OpenFOAM. Turbulence was modelled by the Reynolds-Averaged Navier-Stokes equations (RANS) coupled with the turbulence closure model k-ω SST (k is the turbulent kinetic energy density, ω is the specific dissipation rate). The k- ω SST model that was stabilized in nearly potential flow regions by Larsen and Fuhrman (2018) was used. The OpenFOAM model domain started at the wave paddle zero position, and included the foreshore and dike geometry as measured in the experiment up to the vertical wall. The model was run in a vertical two-dimensional (2DV) configuration (cross-shore section of the wave flume). To optimise the computational time, a variable grid resolution was applied. The structured mesh had a grid resolution of 0.18 m in the air phase and 0.09 m in the water phase. The mesh was further refined in the zone of the surface elevation up to the dike toe (dx = dz = 0.045 m) and on the dike up to the wall (dx = dz = 0.0225 m), which led to a grid with 314,482 cells. Waves were generated by applying a Dirichlet-type boundary condition: the experimental wave paddle displacement was first converted to a wave paddle velocity, which was then applied to the water phase at the stationary boundary (x = 0 m). Active wave absorption (as implemented in olaFlow) was activated to prevent re-reflection of reflected waves. DualSPHysics is a numerical model based on the Smoothed Particle Hydrodynamics (SPH) method (for a detailed description it is referred to Crespo et al., 2015). SPH is a Lagrangian and mesh-less method where the fluid is discretised into a set of particles that are nodal points where physical quantities (such as position, velocity, density, pressure) are computed as an interpolation of the values of the neighbouring particles. The contribution of these neighbours is weighted using a kernel function (W) that measures that contribution starting from the initial particle spacing. This distance between particles is normalized using the smoothing length (hSPH), which is the characteristic length that defines the area of influence of the kernel. The kernel presents compact support, so that the contribution of particles beyond a cut-off distance (here 2hSPH) is not considered. The DualSPHysics 2DV model domain also extended from the wave paddle, over the foreshore up to the vertical wall on top of the dike and promenade. However, only the water phase was modelled, with an initial particle spacing of dp = 0.01 m, leading to a total of 5,245,337 particles in the model domain. Waves were generated by a moving boundary, which exactly reproduced the recorded experimental wave paddle displacement, including active wave absorption. A comparison of model performance for the modelling of the surface elevation at the dike toe and on the promenade (i.e. flow layer thickness) is shown in Figure 8.
Figure 8: Comparison between the numerical model results (SWASH: green line, DualSPHysics: red line, OpenFOAM: blue line) and the experiment (black line) of the surface elevation at the dike toe wave gauge
location (WG7) in the upper figure and for the second gauge (WLDM2) on the promenade in the lower figure.
Surface elevation at dike toe: x=174.73 m (WG7)
Surface elevation on promenade: x=176.92 m (WLDM2)
Proceedings of the HYDRALAB+ Joint User Meeting, Bucharest, May 2019
9
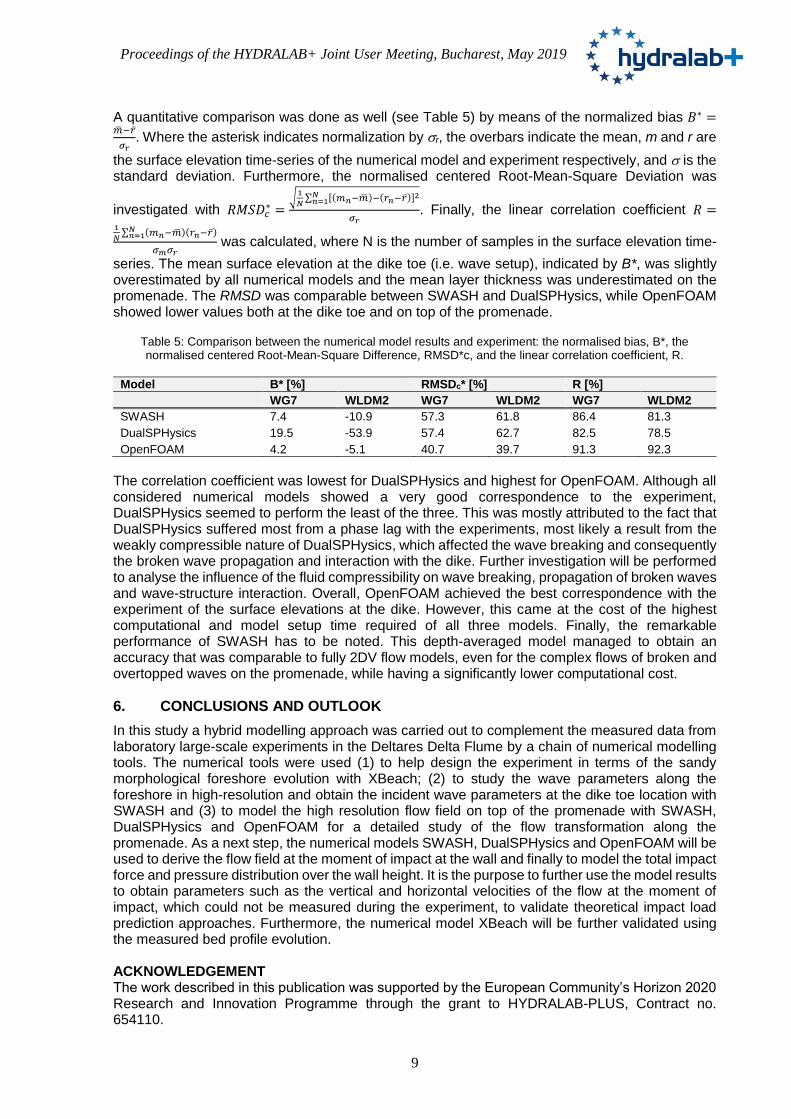
A quantitative comparison was done as well (see Table 5) by means of the normalized bias 𝐵∗ =�̅�−�̅�
𝜎𝑟. Where the asterisk indicates normalization by r, the overbars indicate the mean, m and r are
the surface elevation time-series of the numerical model and experiment respectively, and is the standard deviation. Furthermore, the normalised centered Root-Mean-Square Deviation was
investigated with 𝑅𝑀𝑆𝐷𝑐∗ =
√1
𝑁∑ [(𝑚𝑛−�̅�)−(𝑟𝑛−�̅�)]
2𝑁𝑛=1
𝜎𝑟. Finally, the linear correlation coefficient 𝑅 =
1
𝑁∑ (𝑚𝑛−�̅�)𝑁𝑛=1 (𝑟𝑛−�̅�)
𝜎𝑚𝜎𝑟 was calculated, where N is the number of samples in the surface elevation time-
series. The mean surface elevation at the dike toe (i.e. wave setup), indicated by B*, was slightly overestimated by all numerical models and the mean layer thickness was underestimated on the promenade. The RMSD was comparable between SWASH and DualSPHysics, while OpenFOAM showed lower values both at the dike toe and on top of the promenade.
Table 5: Comparison between the numerical model results and experiment: the normalised bias, B*, the normalised centered Root-Mean-Square Difference, RMSD*c, and the linear correlation coefficient, R.
Model B* [%] RMSDc* [%] R [%]
WG7 WLDM2 WG7 WLDM2 WG7 WLDM2
SWASH 7.4 -10.9 57.3 61.8 86.4 81.3
DualSPHysics 19.5 -53.9 57.4 62.7 82.5 78.5
OpenFOAM 4.2 -5.1 40.7 39.7 91.3 92.3
The correlation coefficient was lowest for DualSPHysics and highest for OpenFOAM. Although all considered numerical models showed a very good correspondence to the experiment, DualSPHysics seemed to perform the least of the three. This was mostly attributed to the fact that DualSPHysics suffered most from a phase lag with the experiments, most likely a result from the weakly compressible nature of DualSPHysics, which affected the wave breaking and consequently the broken wave propagation and interaction with the dike. Further investigation will be performed to analyse the influence of the fluid compressibility on wave breaking, propagation of broken waves and wave-structure interaction. Overall, OpenFOAM achieved the best correspondence with the experiment of the surface elevations at the dike. However, this came at the cost of the highest computational and model setup time required of all three models. Finally, the remarkable performance of SWASH has to be noted. This depth-averaged model managed to obtain an accuracy that was comparable to fully 2DV flow models, even for the complex flows of broken and overtopped waves on the promenade, while having a significantly lower computational cost.
6. CONCLUSIONS AND OUTLOOK
In this study a hybrid modelling approach was carried out to complement the measured data from laboratory large-scale experiments in the Deltares Delta Flume by a chain of numerical modelling tools. The numerical tools were used (1) to help design the experiment in terms of the sandy morphological foreshore evolution with XBeach; (2) to study the wave parameters along the foreshore in high-resolution and obtain the incident wave parameters at the dike toe location with SWASH and (3) to model the high resolution flow field on top of the promenade with SWASH, DualSPHysics and OpenFOAM for a detailed study of the flow transformation along the promenade. As a next step, the numerical models SWASH, DualSPHysics and OpenFOAM will be used to derive the flow field at the moment of impact at the wall and finally to model the total impact force and pressure distribution over the wall height. It is the purpose to further use the model results to obtain parameters such as the vertical and horizontal velocities of the flow at the moment of impact, which could not be measured during the experiment, to validate theoretical impact load prediction approaches. Furthermore, the numerical model XBeach will be further validated using the measured bed profile evolution. ACKNOWLEDGEMENT The work described in this publication was supported by the European Community’s Horizon 2020 Research and Innovation Programme through the grant to HYDRALAB-PLUS, Contract no. 654110.

Proceedings of the HYDRALAB+ Joint User Meeting, Bucharest, May 2019
10
REFERENCES Cappietti, L., Simonetti, I., Esposito, A., Streicher, M., Kortenhaus, A., Scheres, B., Schuettrumpf,
H., Hirt, M., Hofland, B., Chen, X. (2018). Large-scale experiments of wave-overtopping loads on walls: Layer thicknesses and velocities, Proceedings of the 37th International conference on ocean, offshore and arctic engineering, Madrid, Spain, 6 pp.
Crespo, A.J.C., Domínguez, J.M., Rogers, B.D., Gómez-Gesteira, M., Longshaw, S., Canelas, R., Vacondio, R., Barreiro, A., García-Feal, O. (2015). DualSPHysics: open-source parallel CFD solver on Smoothed Particle Hydrodynamics (SPH), Computer Physics Communications, 187: 204-216, 13pp.
Higuera, P. (2017). olaFlow: CFD for waves, https://doi.org/10.5281/zenodo.1297013. Hofland, B., Chen, X., Altomare, C., Oosterlo, P. (2017). Prediction formula for the spectral period
Tm-1,0 on mildly sloping shallow foreshores, Coastal Engineering 123, 21-28. Larsen, B.E., Fuhrman, D.R., Roenby, J. (2018). Performance of interFoam on the simulation of
progressive waves, arXiv:1804.01158v1 [physics.flu-dyn], 03 April 2018, 18pp. Larsen, B.E. and Fuhrman, D.R. (2018). On the over-production of turbulence beneath surface
waves in Reynolds-averaged Navier–Stokes models, Journal of Fluid Mechanics, 853:419-460, 42pp.
Mansard, E.P.D. and Funke, E.R. (1980). The measurement of incident and reflected spectra using a least squares method, Proceedings of 17th International conference on coastal engineering, Hamburg, Germany, 154-169, 16pp.
Saponieri, A., Di Risio, M., Pasquali, D., Valentini, N., Aristodemo, F., Tripepi, G., Celli, D., Streicher, M., Damiani, L. (2018). Beach profile evolution in front of storm seawalls: A physical and numerical study, Proceedings of 36th International conference on coastal engineering, Baltimore, US, 13pp.
Streicher, M., A. Kortenhaus, C. Altomare, V. Gruwez, B. Hofland, X. Chen, K. Marinov, B. Scheres, H. Schüttrumpf, M. Hirt, L. Cappietti, A. Esposito, A. Saponieri, N. Valentini, G. Tripepi, D. Pasquali, M. D. Risio, F. Aristodemo, L. Damiani, M. Willems., D. Vanneste, T.Suzuki, M. Klein Breteler, D. Kaste. (2017). WALOWA (Wave Loads on Walls) – Large-scale experiments in the Delta Flume, Proceedings of the 8th SCACR conference, Santander, Spain, 2017, 11pp, doi: 10.5281/zenodo.834874.
Suzuki, T. Altomare, C., Verwaest, T., Trouw, K., Zijlema, M. (2015). Two-dimensional wave overtopping calculation over a dike in shallow foreshore by SWASH, Proceedings of the 34th International Conference on Coastal Engineering, Seoul, South-Korea, 12pp, doi=10.9753/icce.v34.forward.1
Weller, H.G., Tabor, G., Jasak, H., Fureby, C. (1998). A tensorial approach to computational continuum mechanics using object-oriented techniques, Computers in Physics, 12:620-631, 12pp.
DISCLAIMER This document reflects only the authors' views and not those of the European Community. This work may rely on data from sources external to the HYDRALAB-PLUS project Consortium. Members of the Consortium do not accept liability for loss or damage suffered by any third party as a result of errors or inaccuracies in such data. The information in this document is provided "as is" and no guarantee or warranty is given that the information is fit for any particular purpose. The user thereof uses the information at its sole risk and neither the European Community nor any member of the HYDRALAB-PLUS Consortium is liable for any use that may be made of the information.