overpressure. part 2: the ternary u + h 2 o (l) + d 2
TRANSCRIPT

Banos, A., Hallam, K. R., & Scott, T. B. (2019). Corrosion of uraniumin liquid water under contained conditions with a headspace deuteriumoverpressure. Part 2: The ternary U + H 2 O (l) + D 2 system.Corrosion Science, 152, 261-270.https://doi.org/10.1016/j.corsci.2019.02.016
Publisher's PDF, also known as Version of recordLicense (if available):CC BYLink to published version (if available):10.1016/j.corsci.2019.02.016
Link to publication record in Explore Bristol ResearchPDF-document
This is the final published version of the article (version of record). It first appeared online via Elsevier athttps://doi.org/10.1016/j.corsci.2019.02.016 . Please refer to any applicable terms of use of the publisher.
University of Bristol - Explore Bristol ResearchGeneral rights
This document is made available in accordance with publisher policies. Please cite only thepublished version using the reference above. Full terms of use are available:http://www.bristol.ac.uk/red/research-policy/pure/user-guides/ebr-terms/

Contents lists available at ScienceDirect
Corrosion Science
journal homepage: www.elsevier.com/locate/corsci
Corrosion of uranium in liquid water under contained conditions with aheadspace deuterium overpressure. Part 2: The ternary U + H2O(l) + D2
system
A. Banos⁎, K.R. Hallam, T.B. ScottUniversity of Bristol, Interface Analysis Centre, School of Physics, HH Wills Physics Laboratory, Tyndall Avenue, Bristol, BS8 1TL, United Kingdom
A R T I C L E I N F O
Keywords:UraniumWater corrosionBulk-UH3
Threshold pressureFIB
A B S T R A C T
The reaction of unirradiated-U with liquid water under deuterium overpressure was studied by conducting nineseparate reactions at different temperatures. Post-corrosion examination of the surfaces was conducted usingFIB, SIMS and XRD. Measurements of the reacting-water pH and sample degassing were made after the ex-periments were stopped. Isotopic labelling allowed better investigation of the mechanisms occurring in thissystem. The analyses showed that bulk-UH3 forms at the metal-oxide interface. The observed gas evolutionreduction in the headspace was attributed to gas suppression of hydrogen generated through oxidation, and notD2 gas migration through the water. This suppression facilitates UH3 formation.
1. Introduction
There are legacy ponds and silos at Sellafield, accommodating mostall historically generated British intermediate level waste (ILW) con-taining uranium metal. These facilities which were initially meant forinterim storage of material waiting to be reprocessed are now decadesold and there is an increasing urgency for this material to be safelyretrieved and prepared for long-term storage and disposal. ILW ismainly comprised of activated and contaminated metals and materials,such as reactor components, fuel-cladding and conditioned fuel parts[1]. This waste is stored either in containers immersed in water (sludgeponds) or as unsorted debris piles within containment cells e.g. silos,where both vapour and liquid water are abundant [2]. Uranium metalwould initially have been found in significant quantities in this ILW.Thus, uranium and uranium-containing components have been exposedto differing corrosion conditions over prolonged periods, under water-immersed and/or contained storage conditions. Uranium will readilyreact with water to produce uranium dioxide (UO2) and hydrogen gas(H2) (Eq. 1). If H2 does not escape to dilute in the atmosphere but in-stead remains trapped in the near vicinity of the metal, a complexternary U-H2O-H2 reaction system will establish itself. If H2 build up inhigh concentrations it will react with uranium to form uranium hydride(UH3) (Eq. 2).
+ → +U H O UO H2 2s l s g( ) 2 ( ) 2( ) 2( ) (1)
+ →U H UH2 3 2s g s( ) 2( ) 3( ) (2)
UH3 is regarded as being unstable in air and pyrophoric undercertain conditions (e.g. high surface area and mass) [3,4]. Thus, itsformation is undesirable and generates serious safety and technicalchallenges for the nuclear industry. In the literature there is a con-troversy over whether UH3 can form, concurrent with UO2, as part ofthe uranium-water reaction [5–17] or not [18–21]. In reality, UH3
formation in such a system depends on a number of parameters such aswhether it is an enclosed/sealed system [5,9,16] or not [7,19], thetemperature of the reaction [5], or the physical state of the reactingwater (solid, liquid, vapour/steam) [5], etc.
In previous works [22], we have examined the corrosion of uraniumunder water immersion conditions in sealed cells in which the head-space volume was initially evacuated. From the analysis, it was con-firmed that along with UO2 formation, UH3 also forms as a solid pro-duct of corrosion. It was also observed that above a certain headspacepressure of hydrogen, the rate of continuing gas evolution into theheadspace, arising from corrosion, was significantly decreased. Thiswas ascribed to the onset of substantial UH3 formation on the reactedsamples and was evidenced by combining the data arising from post-reaction examination of the reacted surface, with reaction rate beha-viour (through H2 evolution). In this current work, we have made anexperimental attempt to monitor the mechanisms of reaction as well asreaction rates in the earlier stages of corrosion. By introducing deu-terium (D2) at a known pressure into the system gas space instead of
https://doi.org/10.1016/j.corsci.2019.02.016Received 18 September 2018; Received in revised form 13 February 2019; Accepted 14 February 2019
⁎ Corresponding author.E-mail address: [email protected] (A. Banos).
Corrosion Science 152 (2019) 261–270
Available online 19 February 20190010-938X/ © 2019 The Authors. Published by Elsevier Ltd. This is an open access article under the CC BY license (http://creativecommons.org/licenses/BY/4.0/).
T

hydrogen, the isotopic-labelling could be used to track the movement ofD2 within the system. This isotopic spiking was hoped to better eluci-date the mechanisms for corrosion within the ternary system.
There is only a very limited amount of published experimental workexamining the ternary uranium-water-hydrogen corrosion system,especially under water-immersed conditions. Baker et al. [23] ex-amined the effect of hydrogen overpressure on a water-immersed ur-anium sample and found no significant effect of this pressure to thecorrosion rate or the arising reaction products, even up to 6 atm (or˜609750 Pa) gas pressure. However, Baker adopted an experimental set-up where the sealed reaction system was periodically opened for ther-mogravimetric analysis to be performed. Thus, the system was keptunder sealed conditions for only a limited amount of time. Furthermore,this work did not provide any information about the headspace volume,mass of sample and volume of water utilised, which for an extendedtime period, could immensely affect the kinetics and products of thereaction [9]. In the same work, other bystander gases such as N2
(1013.3 mbar or 101325 Pa) and CO2 (˜71 to 2027mbar or7100–202700 Pa) were introduced in the headspace, with the formershowing no effect on the rate and the latter showing a substantialslowing of the corrosion rate to as much as half the original value. ForCO2, formation of carbonate ions on the oxide surface was suggested asresponsible for diffusion at blocking of H2 to reach the gas headspace.In our previous work [22], it was inferred that after the headspacepressure reached a critical value, (which specifically for the parametersof our systems was calculated in the 500-mbar range), the rate of H2 gasevolution became suppressed and/or water - hydrogen exchange oc-curred in the system, leading to UH3 formation [22]. Above the‘threshold pressure’, suppression of H2 gas release out from the outer-most oxide surface, through the water and into the headspace, wasconsidered highly possible, since water molecules chemisorb on theavailable surface sites blocking outwards diffusion of hydrogen, gen-erated at the metal-oxide interface. Additionally, above the ‘thresholdpressure’, hydrogen concentration in the headspace will be equal to orhigher than the hydrogen concentration at the metal-oxide interface,thereby promoting UH3 formation. The opposite process, which was themigration of the gas from the headspace into water and eventually tothe metal surface was regarded as thermodynamically less favoured.This is because chemisorbed water will inhibit further chemisorptionand dissociation of H2 at the oxide surface, by blocking all availablesorption sites [24]. Of course, strain and disruption on the oxide surfacecaused either by an originally strained metal surface [25] or by volumeexpansion (loss of coherence), would lead to more available and directdiffusion pathways for hydrogen to reach the metal and react with theuranium. Hence, this process cannot be ruled out. Based on the previoussuccess of using isotopic waters to study metal/hydride corrosion [26],isotopic labelling of the starting headspace gas was considered a viableexperimental option for better investigating the mechanistic processesoccurring in this ternary corrosion system. Thus, in this work, the ex-perimental set-up of our former work [22] was repeated, but this timeD2 gas of known starting pressure was introduced to the free headspacevolume from the outset of the experiment. Maintaining the same re-action conditions, experimental procedure and methods of examinationwas imperative to secure reliable and comparable conclusions withrespect to the mechanisms driving the ternary system, while also ver-ifying the previously reported findings of [22].
2. Materials and experimental methods
2.1. Sample preparation
A total of nine samples were prepared for this work, all originatingfrom the same batch of as-cast Magnox-U metal. Extensive descriptionof the metal was provided in previous publications [22,27–29]. Table 1integrates the initial sample parameters for the corrosion experiments.The letter ‘W’ was used to designate the liquid reactant, ‘D’ was used to
denote the gas reactant (D2) filling the headspace volume; the accom-panying numbers denote the temperature of the reaction and the endingletter denote the headspace pressure, with ‘L’ denoting low, ‘M’mediumand ‘H’ high pressure of D2, respectively. Low D2 pressure was con-sidered as an initially established headspace pressure in the 250-mbarrange, medium in the 500-mbar range and high in the 750-mbar range.Thus, for a sample that was reacted with water at 45 °C, with high D2
headspace pressure, the denotation WD45H was used.
2.2. Reactant water
The same freeze-vacuum-melt process described in [22] was fol-lowed for the preparation of the reaction water used in this work. Thepurpose of this preparation was to remove dissolved oxygen from thewater, which would complicate determination of the reaction me-chanisms. It is recognised that deliberate alteration of pH, ‘oxygenpoisoning’ and/or introduction of salts would have altered the aqueouscorrosion rates, but understanding these interactions was not the aim ofthe experiment.
2.3. Headspace gas (D2)
The gas used to fill the headspace volume for the start of each re-action was 99.99% pure D2, provided by BOC gases. The gas was storedin a LaNi5 bed to reduce gas impurities and was introduced into thevolume by connecting the reaction pot cell to the gas control rig (andassociated pressure controller).
2.4. Experimental apparatus
The reaction pot cells constructed for the experimental work of [22]were also used for this work. More extensive description of the set-upcan be found in [22].
2.5. Experimental method
The experimental procedure described in [22] was also followed inthe present work, with one additional step included in the process.Immediately after the third stage of the freeze-vacuum-melt process andevacuation, the cell was opened and the sample was positioned on topof the solidified water (ice) in the crucible. The cell was then sealed andimmersed in liquid N2 to be evacuated for a final time. After suitablevacuum was reached (≤ 1×10⁻⁶ mbar), the set-up was connected to adata logging system for measuring changes in cell pressure and tem-perature. The cell was subsequently placed in an oven for heating to thedesired reaction temperature. The pressure was then closely monitoredto determine when the contained ice was fully melted, and the set-upwas then briefly withdrawn from the oven, connected to a gas controlrig and D2 was admitted at a set pressure. If we consider the ‘threshold’pressure value always close to the ˜500mbar range [22], then forhigher reaction temperature less initial D2 pressure was needed to beintroduced to the cell volume to achieve that value. The average time
Table 1Preliminary parameters (weight & surface area) of the samples.
Sample Mass (g) Surface area (cm2)
WD25L 1.58 1.38WD25M 3.02 2.35WD45L 4.43 3.54WD45M 5.1 3.7WD45H 1.93 1.86WD55L 4.44 3.68WD55M 1.35 1.35WD55H 4.5 3.59WD70M 4.8 3.55
A. Banos, et al. Corrosion Science 152 (2019) 261–270
262

needed for D2 admission was approximately 2min. The measuredpressure after D2 filling, was considered to represent the water vapourpressure prior to D2 admission plus the admitted D2 gas. The cell wasthen quickly placed back into the oven. An overall gas pressure in therange of 500mbar (medium pressure) at the desired reaction tem-perature was targeted for all the initial experimental runs. High(˜750mbar) and low (˜250mbar) D2 pressures were admitted in thesubsequent experiments. In all cases the reaction was halted by openingthe cell and carefully retrieving the sample (in air) from the ceramiccrucible containing the water. Partial mass loss was inevitable at thisstage of the process when significant thicknesses of corrosion productshad accumulated (Fig. 1). The sample was left in laboratory air to dryfor 2–3min s and placed in an inert atmosphere (Ar-filled glovebox),awaiting post-examination and analysis.
2.6. Post-reaction examination
We ensured that our experimental setup was identical to prior ex-periments [22], since direct comparison or results was desired. Theprotocol for post-reaction analysis was maintained for the same reason.Thus, focused ion beam (FIB) milling and sectioning, secondary ionmass spectrometry (SIMS), X-ray diffraction (XRD) and temperature-programmed desorption (TPD) combined with residual gas analysis(RGA) were the methods utilised for sample examination.
2.7. Assumptions
The assumptions identified in previous experiments [22] wereadopted for this work. Notably, α-U was assumed to be the only phaseon the sample, ignoring the fact that Magnox natural-U has a carboncontent of ˜1000 carbides. mm−2.
For determining the U oxidation rate, only gaseous H2 and soliduranium dioxide (UO2) were assumed to be produced according to Eq.1. UH3 which may be produced though Eq. 2 was deliberately excludedfrom our calculations. Subsequently any observed mismatch betweenthe oxidation rates derived by different methods (H2 generation versusdirect oxide thickness measurements), could imply UH3 formation
within the system in addition to UO2.Other significant assumptions were that (1) no significant reaction is
taking place on the uranium surface during the time needed to completeD2 gas filling and reach the desired reaction temperature; (2) negligibleamounts of D2 gas, (in comparison to the overall gas pressure) is dis-solved in the reaction water. For the former assumption, this shortpreparation period is regarded as negligible when compared to the totalreaction time of each system (on the order of 100’s of hours). For thelatter assumption, blank tests using identical conditions but without asample in the cell (not shown here) demonstrated that after initialequilibrium was reached, the headspace gas pressure remained constantfor 100’s of hours.
3. Results
Not all specimens were examined with all techniques/methods, withcertain analysis on later samples being deliberately skipped to minimisecumulative damage.
3.1. Reaction rate determinations via gas generation
Sample reaction rates were calculated using the recorded gas pres-sure changes with time. Pressure change was ascribed to H2 generationfrom water oxidation, through Eq. 1. The moles of H2 generated wereconverted, (through Eq. 1) to moles of reacted U per unit area with time(mgU. cm−2. h-1). Fig. 2 illustrates a representative reaction plot for asample corroding at 70 °C under a starting D2 pressure of 448mbar for516 h. Plots at other temperatures displayed similar reaction profiles.
Multiple reaction rate regimes may be observed from the graph(Fig. 2). The various reaction rate regimes, as derived from the graphs,are displayed in Table 2 (middle columns). The average reaction rate,shown in the last column of Table 2, was derived from the average of:(a) the average values of differential rates derived every hour and (b)the rate which was derived from the total U mass consumption, per unitarea, divided by the total reaction time. The table also includes theinitial D2 pressure introduced to the cell at the start of the reaction.
3.1.1. Reaction rate line behaviourFor samples reacted at 25 and 45 °C reactions (not shown here), the
recorded samples exhibited two poorly discriminated rate regimes, withthe first being slightly higher than the other indicating more rapid in-itial oxidation. For samples corroded at 55 and 70 °C, an example ofwhich is shown in Fig. 2, the recorded reaction profiles were very
Fig. 1. An opened experimental cell immediately after reaction completion. Thesample was flaked-off and powderised, with clearly observable (black) reactionproducts, spread across the base of the ceramic crucible containing the water.Figure reproduced from [26].
Fig. 2. Corrosion progress of uranium immersed in water with D2 overpressurefor WD70M sample. The rate was derived from pressure changes (ascribed toH2 generation), converted to milligrams of reacted U per unit area, over time.Figure reproduced from [26].
A. Banos, et al. Corrosion Science 152 (2019) 261–270
263
similar, exhibiting an (1) initial linear/parabolic rate of gas generationfollowed by (2) a linear rate of gas production which eventuallyswitches to (3) constant gas production but at a higher linear rate.
3.1.2. Average rate - Comparison to a U + H2O reaction systemThe average reaction rate values for all temperatures (Table 2),
determined from measured headspace H2 increases, were significantlylower in comparison to those determined from a directly comparableset of experiments exploring the binary U + H2O system [22]. For the25 °C regime, the average rate was 2 to 3 times slower in comparison tothe U + H2O system [22]. At 45 °C, recorded rates were still lower thanthe binary system, but with final reaction rate periods (regime 3) beingdirectly comparable. At 55 °C, the overall corrosion rate was 28–45 %lower than for the binary system. Finally, at 70 °C, the average corro-sion rate was up to ˜90% slower than the equivalent binary system [22].Thus, it can be inferred that the initial headspace gas overpressure hada significant effect on the rate of H2 generation into the headspace. Thisis consistent with the observation made in [22] where the observedreaction rates were observed to switch to a slower rate regime once acritical ‘threshold pressure’ had been reached in the cell headspace.
3.1.3. Effect of D2 overpressureBased on the previous study of the binary system [22], where a
‘threshold pressure’ between 450 - 550-mbar was observed to alter thegas generation rate from U oxidation, the current experiments delib-erately selected starting headspace pressures above, at and below thisobserved threshold. Sample reaction temperatures of 45 °C and 55 °Cwere arbitrarily chosen, with an additional run was also conducted forthe 25 °C regime, with the overall pressure lying below the 0.5 barrange (sample WD25 L).
Compared to the other samples reacting at 25 °C that had a startingheadspace pressure of 500mbar, the average reaction rate measured forWD25 L was higher, indicating that the threshold suppression remainedtrue. At 45 °C, the average rate was also higher for sample WD45 L(starting below threshold pressure) in comparison to WD45H (startingabove threshold pressure). Sample WD45M exhibited a more complexrate profile with a surprisingly low average reaction rate. At 55 °C, thesamples starting below and at the threshold pressure (WD55 L andWD55M) yielded similar average rates. As expected, sample WD55 Lexhibited a higher reaction rate in the last 500 h of reaction, with aheadspace pressure remaining below the threshold pressure (Table 2).Sample WD55H which had a starting headspace pressure above500mbar exhibited significantly lower reaction rates than WD55M orWD55 L. Overall, a trend was observed for declining gas generationrates from U oxidation with increasing headspace pressure. This implieseither (i) oxidation rates are supressed by the gas overpressure or (ii)oxidation rates are not supressed but instead a proportion of the hy-drogen released is consumed by hydride (UH3) formation.
3.2. Oxide thickness layer calculations - Rate determination
An alternative method for determining the U oxidation rate was viadirect measurement of corrosion layer thickness at the end of eachexperiment. This was achieved using FIB to make several cross-sectionalcuts on each sample and directly measure the thickness of the corrosionlayer.
At the time of measurement this layer was assumed to be exclusivelyUO2. The derived average of multiple thickness measurements was thenused to calculate an overall reaction rate for each sample that could bedirectly compared to the rate determined by gas generation. If for anysample, the reaction rate derived from corrosion layer thickness mea-surements was significantly higher than that derived from gas genera-tion, it is highly probable that UH3 (in addition to UO2) has formed atthe metal-oxide interface. Even though both these corrosion products,UO2 and UH3, have a very similar density, the latter will grow inthickness without releasing any hydrogen into the gas phase (Eq. 2).Thus, if a hydride layer is inadvertently assigned to UO2 formation thiswould lead to an overestimation of the oxidation rate, in comparison tothe rate derived from H2 evolution. Additionally, if UH3 is formed itcould potentially be identified through physical observation of the in-terface, though as shown in [22], this is very challenging, especially onheavily corroded samples where the accumulated corrosion layer issubstantial.
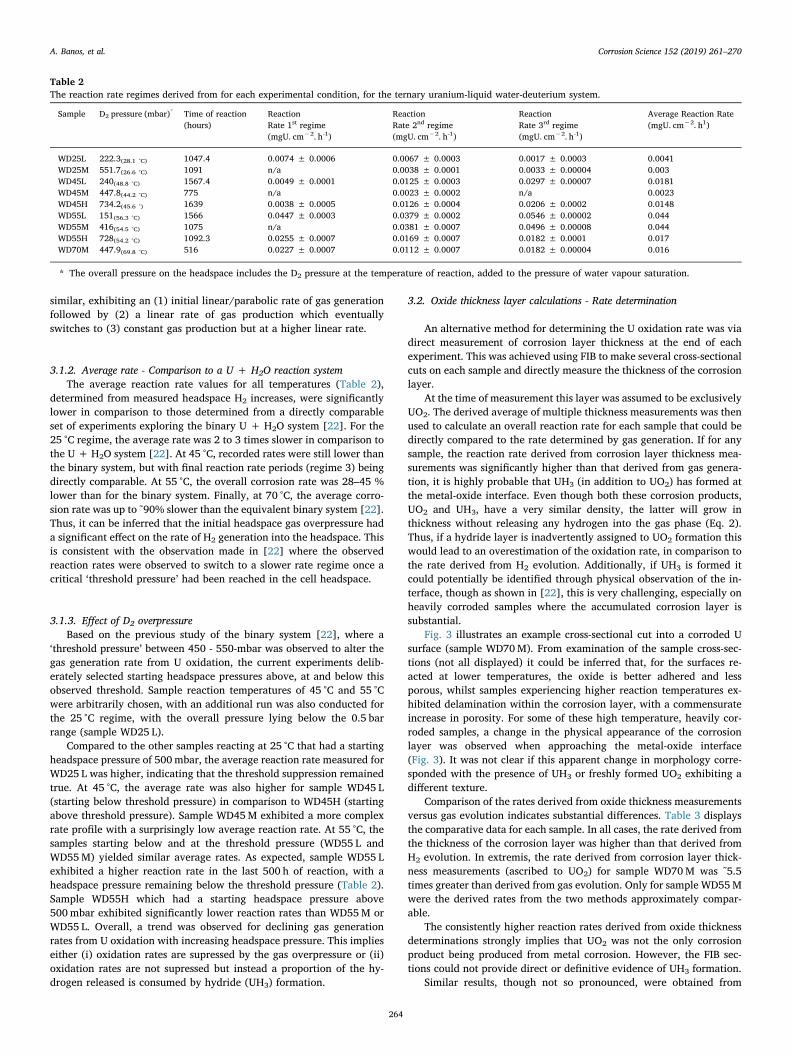
Fig. 3 illustrates an example cross-sectional cut into a corroded Usurface (sample WD70M). From examination of the sample cross-sec-tions (not all displayed) it could be inferred that, for the surfaces re-acted at lower temperatures, the oxide is better adhered and lessporous, whilst samples experiencing higher reaction temperatures ex-hibited delamination within the corrosion layer, with a commensurateincrease in porosity. For some of these high temperature, heavily cor-roded samples, a change in the physical appearance of the corrosionlayer was observed when approaching the metal-oxide interface(Fig. 3). It was not clear if this apparent change in morphology corre-sponded with the presence of UH3 or freshly formed UO2 exhibiting adifferent texture.
Comparison of the rates derived from oxide thickness measurementsversus gas evolution indicates substantial differences. Table 3 displaysthe comparative data for each sample. In all cases, the rate derived fromthe thickness of the corrosion layer was higher than that derived fromH2 evolution. In extremis, the rate derived from corrosion layer thick-ness measurements (ascribed to UO2) for sample WD70M was ˜5.5times greater than derived from gas evolution. Only for sample WD55Mwere the derived rates from the two methods approximately compar-able.
The consistently higher reaction rates derived from oxide thicknessdeterminations strongly implies that UO2 was not the only corrosionproduct being produced from metal corrosion. However, the FIB sec-tions could not provide direct or definitive evidence of UH3 formation.
Similar results, though not so pronounced, were obtained from
Table 2The reaction rate regimes derived from for each experimental condition, for the ternary uranium-liquid water-deuterium system.
Sample D2 pressure (mbar)* Time of reaction(hours)
ReactionRate 1st regime(mgU. cm−2. h-1)
ReactionRate 2nd regime(mgU. cm−2. h-1)
ReactionRate 3rd regime(mgU. cm−2. h-1)
Average Reaction Rate(mgU. cm−2. h1)
WD25L 222.3(28.1 °C) 1047.4 0.0074 ± 0.0006 0.0067 ± 0.0003 0.0017 ± 0.0003 0.0041WD25M 551.7(26.6 °C) 1091 n/a 0.0038 ± 0.0001 0.0033 ± 0.00004 0.003WD45L 240(48.8 °C) 1567.4 0.0049 ± 0.0001 0.0125 ± 0.0003 0.0297 ± 0.00007 0.0181WD45M 447.8(44.2 °C) 775 n/a 0.0023 ± 0.0002 n/a 0.0023WD45H 734.2(45.6 °) 1639 0.0038 ± 0.0005 0.0126 ± 0.0004 0.0206 ± 0.0002 0.0148WD55L 151(56.3 °C) 1566 0.0447 ± 0.0003 0.0379 ± 0.0002 0.0546 ± 0.00002 0.044WD55M 416(54.5 °C) 1075 n/a 0.0381 ± 0.0007 0.0496 ± 0.00008 0.044WD55H 728(54.2 °C) 1092.3 0.0255 ± 0.0007 0.0169 ± 0.0007 0.0182 ± 0.0001 0.017WD70M 447.9(69.8 °C) 516 0.0227 ± 0.0007 0.0112 ± 0.0007 0.0182 ± 0.00004 0.016
* The overall pressure on the headspace includes the D2 pressure at the temperature of reaction, added to the pressure of water vapour saturation.
A. Banos, et al. Corrosion Science 152 (2019) 261–270
264
analyses of samples from [22]. Three processes may be invoked aspotential causes for the observed difference between the determinedreaction rates for each sample. The most probable cause for this dif-ference may be ascribed to UH3 formation, according to Eq. 2. Lesslikely, is that the ‘missing’ hydrogen is incorporated within hydroxidephases at the oxide surface, which could be verified by SIMS and/orXRD analysis. The final option is that the hydrogen could be dissolvedin the reaction water. This option may be substantially discountedconsidering the extremely limited reported solubility of hydrogen inwater [30]. This could be confirmed by post-reaction analysis of thereaction waters.
3.3. pH analysis of arising reaction waters
The reaction water of seven out of nine samples was measuredimmediately after the reaction was ceased and the cell was opened toair. By comparing the difference in measured pH for each sample pre-and post-reaction, the concentration of H+ could be calculated. Thisconcentration was ascribed in totality to hydrogen generated from theoxidation of uranium (even though other entities such as dissolved UO2
or CO2 would contribute to the pH drop) which was converted to molesof H2. Through the ideal gas law, moles of H2 dissolved in the water,could then be converted to an equivalent H2 gas pressure if it had in-stead entered the headspace as gas (assuming complete release).Table 4 displays the results from pH analysis, showing that in eachexperiment the reaction waters showed a drop in pH. This implies thatsome hydrogen had dissolved in the water, which was not unexpectedsince prior to experiment it was purged of all dissolved gases by thepreparatory vacuum-freeze-thaw process. However, the calculated massof hydrogen (moles) in each case would contribute an insignificantincrease in the overall headspace pressure if it were degassed from thewater. Thus, it can be assumed that dissolved gas, accounted for only anextremely limited amount of the free hydrogen in the system andtherefore was an insubstantial storage sink compared to the gaseous orsolid phases.
3.4. SIMS analysis of the reacted samples
SIMS analysis allowed chemical identification of the corrosion layercomposition, starting from the outermost layers and progressivelymoving deeper towards the metal-oxide interface, through reactive ion-sputtering. Mass spectrum analysis was conducted on the surface ofeach sample prior to any targeted depth profiling.
Fig. 4 illustrates an example mass spectrum recorded from sampleWD70M. Hydrides and/or deuterides are indicated, with complexUOCHD+ ion clusters and associated carbide-nitride-oxygen clustersalso identified alongside uranium dioxide (from UO+ and UO2
+ clus-ters) which dominated the sample surface. Depth profiling combinedwith literature reports on previous similar SIMS experiments were usedto resolve isobaric interferences in the recorded mass spectra. Forma-tion of hydroxides and carbide-hydroxide phases/clusters, as part ofwater corrosion, have been previously reported by Totemeier et al. [31]and Harker [32]. Fig. 5 illustrates representative mass ion depth pro-files for each system.
Deuteride, hydride and hydroxide ion clusters provided a strongindication that the outermost surface of the samples was hydrated i.e.had both physi- and chemisorbed water. This was most prominentlyevidenced by the appearance of ion clusters ascribed to arise from hy-droxide phases such as UO2H3
+ ion clusters. However, the ion clusteryield and thickness of these hydrated layers were limited in their extent,implying that only the outermost surfaces (< 1 μm) were rich in hy-droxide and higher oxide phases of U. The contribution of these phases
Fig. 3. Focused ion beam (FIB) milling image showing the cross-sectional viewof WD70M sample. Multiple images were produced and stitched together todemonstrate the thickness of the layer. In an effort to show the oxide on thecross-section, the periphery of the cut was inevitably saturated. Figure re-produced from [26].
Table 3Oxide thickness vs H2 generation derived rate for the ternary reaction systems.
Sample Corrosion layerthickness(μm)
Reaction rate derivedfrom average corrosion layerthickness measurements(ascribed to UO2)(mgU. cm−2. h-1)
Reaction ratederivedfrom H2 generation(mgU. cm−2. h-1)
WD25M 6.36 0.0056 0.003WD45L 71.23 0.0439 0.0181WD45M 2.71 0.0034 0.0023WD45H 64.05 0.0378 0.0148WD55L 86.24 0.0533 0.044WD55M 52.44 0.0472 0.044WD55H 60.39 0.0535 0.017WD70M 47.04 0.0882 0.016
A. Banos, et al. Corrosion Science 152 (2019) 261–270
265

to the observed headspace H2 deficiency would therefore be insignif-icant. The appearance of the UO2D3 ion cluster (276 Amu) in the outerlayers of the oxide surface (Fig. 5a) indicated that some deuterium fromthe gas phase had managed to reach the surface of the sample. Thiscould imply either continuous exchange between the reaction water
and D2 gas or initial interaction of this gas with the water immediatelyafter admission, before initial thermodynamic equilibrium is reached inthe system. The latter appears to be a more probable scenario sinceblank H2O(l) + D2 tests yielded constant gas pressure in the headspaceover many 100’s of hours.
Previous studies have used SIMS analysis to provide definitiveconfirmation of hydride formation on U metal surfaces [27–29]. In thecurrent work, it was expected that evidence for hydride formationwould be expressed in the SIMS depth profiles as a ‘spike’ in the re-corded UH+ and UH2
+ (or UD+) ion cluster yields, close to the metal-oxide interface. This behaviour was clearly observed in at least five ofthe nine samples. The UH+ and UH2
+ (or UD+) intensity signals at 239and 240 Amu respectively, yielded almost identical intensity profilesfor the majority of depth profiles (Figs. 5a & b), indicating hydrideformation at the metal oxide interface. However, it was not possible tomake a clear distinction between UH3 and UD3 formation since the lineprofile at 240 Amu could equally be assigned to UH2 or UD. This couldeither imply that the mass peak recorded at 240 Amu is the UD+ clusteror that the UH2
+ cluster becomes more distinct on more heavily hy-drided samples. Though the SIMS provided definitive evidence for hy-dride formation, it could not differentiate whether the source of hy-drogen was arising from (i) the water, through oxidation or (ii) theheadspace gas, via diffusion. For the heavily corroded samples, whereevidence for UH3 formation was not definitive, we cannot rule outhydride formation. It may be that hydride formation was patchy(forming as isolated spots across the surface) or that the metal interfacewas buried to deeply for reliable results to be withdrawn via SIMS.
Table 4Reaction water pH measurements and H2 concentration calculation (as pressure increase if in the gas phase), for all ternary system experiments.
Sample pH of water at averagetemperature of reaction*
pH of reactant water ataverage temperature ofreaction
Difference in concentration of H+
between original and reactant water(mol/lt)**
Difference in H2 inreactant water(mmol)***
Working/reaction volume(cm3)****
Pressure increase ifexcess H2 diffused out tothe gas phase(mbar)
WD25L 6.83 6.62 9.31E-08 1.86E-07 84.81 0.00005WD25M n/a Not measured n/a n/a n/a n/aWD45L 6.53 5.91 9.45E-07 1.89E-06 84.63 0.0006WD45M n/a Not measured n/a n/a n/a n/aWD45H 6.53 6.22 3.13E-07 6.26E-07 84.77 0.0002WD55L 6.44 5.87 9.78E-07 1.95E-06 84.62 0.0006WD55M 6.44 5.91 8.71E-07 1.74E-06 180.45 0.0003WD55H 6.44 6.13 3.75E-07 7.5E-07 80.75 0.0003WD70M 6.29 5.7 1.49E-06 2.97E-06 80.73 0.001
* pH at 25.2 °C, 6.86. Linear extrapolation to the temperature of reaction and thus approximate value.** Volume of water= 4ml.*** If all excess H+ coupled to form H2.**** Inconsiderable change in the working volume due to sample’s volume expansion and liquid water consumption.
Fig. 4. Post-reaction mass spectrum analysis (230–280 Amu) for sampleWD70M. Hydrides and/or deuterides, hydroxides, uranium-oxide-deuterium-hydrogen complex phases, carbide-nitride-oxygen-deuterium clusters alongwith oxides can be seen in the spectrum. Figure reproduced from [26].
Fig. 5. Secondary ion mass spectrometry (SIMS) depth profiles for a) WD45 L and b) WD70M sample. The analysis was performed with a Ga+ primary ion beam,25 keV voltage, 3 nA beam current, and 45° angle of incidence. Figures reproduced from [26].
A. Banos, et al. Corrosion Science 152 (2019) 261–270
266

Further analysis was required to establish whether hydride had formedon all samples, and if so, the contribution from UH3 versus UD3.
3.5. XRD analysis
X-ray diffraction analysis was used to investigate four of the cor-roded U samples: WD45 L, WD55 L, WD55H and WD70M. Fig. 6 dis-plays an example XRD spectrum recorded for sample WD70M.
For samples WD55 L and WD55H (not shown here), the recordeddiffraction profiles displayed only peaks associated with UO2, no Umetal or hydride peaks were observed, which was unsurprising giventhat the corrosion layer thickness far exceeded the sampling depth ofthe diffraction measurements. By comparison, the samples that could becharacterised down to the metal surface (WD45 L and WD70M), ex-hibited diffraction peaks that could be assigned to U, UO2 and UH3
(Figs. 6). For sample WD45 L (not displayed), the recorded uraniummetal and hydride peaks had a very low intensity, while on WD70M,which had significant corrosion layer spallation, these phases weremuch more clearly observed. For WD70M, five UH3 peaks were iden-tified between 25–52.5 ° (2θ) (Fig. 6). XRD analysis therefore providedfurther confirmation for the existence of UH3 on the corroded metalsurfaces.
3.6. TPD - RGA analysis
Through thermal desorption with concurrent analysis of evolvedgases, it was possible to provide further evidence for hydride formationas well as indicating the D:H ratio in the formed hydride. The thermalprocess followed here, was identical that conducted in [22]. Thethermal cycle included the following stages:
Step 1: Temperature increase to 120≤ T ≤ 150 °C for ˜17 h undercontinual vacuum. This was considered sufficient time for each sampleto release water, hydroxyl, CO, etc. entities from the near surface. Themajority of physi- and chemisorbed waters (with associated phases)were considered to be removed by this initial thermal step.
Step 2: Temperature increase to ˜220 °C under static vacuum. Theworking volume was then isolated from the vacuum pumping system toobserve any subsequent pressure increase with heating and ensure thatno other gases are released close to the lower temperature limit of UH3
decomposition (˜250 °C). In some cases, the gas profile showed furtherrelease, with gas analysis resolving a mixture of various gases. H2, H2Oand OH− were the dominating entities at this stage. In almost all casesat that stage, H2 constituted ≤ 25% of the overall gas evolved. Thetemperature was kept constant until no further pressure increase was
observed and the volume was then quickly evacuated to 1×10⁻⁷ mbarand then isolated again.
Step 3: Temperature increase of the system to 360–440 °C.The ratio of H2 to the sum of evolved gases was calculated for each
sample. RGA analysis was initially conducted for samples WD25M,WD45M, WD55M, WD70M and a reference non-reacted uraniumsample. Apart from H2, gases such as CH4, H2O, CO2, N2 were generatedmainly during the first two stages of the thermal process, ascribed todegassing of surface water and organic contaminants associated withinitial sample preparation. When the temperature was raised higherthan ˜220 - 250 °C (step 3 of thermal process), hydrogen was evolved insignificant quantities and dominated the gas composition (> 99%) asshown in Fig. 7. Since hydrogen was almost exclusively generated instep 3 of the thermal process, it was decided not to analyse the gascomposition arising from the remaining samples but to assume that itwas exclusively H2 for this stage of the TPD process. Pressure-tem-perature (P–T) profiles were generated for all remaining samples. Fig. 7illustrates the P–T profile for sample WD55M, exhibiting significant gasevolution in stage 3 of the TPD. This was the same behaviour for allsamples, indicating that hydride had formed in some quantity on all thesamples. Hydrogen evolved in earlier stages of the TPD, could eitherevolve from surface water decomposition [16] or hydride degradation(via oxidation) and accordingly these quantities were not included inour calculations. Subsequent derivations of the hydride mass formed oneach sample must be considered conservative (Fig. 8).
It is significant to note that during TPD, no D2 (mass peak 4) wasevolved for any sample. This is a critical finding as it implies that no
Fig. 6. Raw X-ray diffraction (XRD) spectra for WD70M sample. The analysiswere performed with a Cu-kα source at 8 keV, between 25 and 52.5° angle 2θ,0.05 step and 5 s dwell time. Figure reproduced from [26].
Fig. 7. Pressure vs. Temperature (P–T) plot from the thermal process (sampledegassing) of WD55M sample. The H2:SUM gas ratio (highlighted in blue) wasalso included in the plot. Pressure increase due to H2 generation is pre-dominantly occurring when temperature is increased above 220 °C. Hydrogengeneration at this stage is ascribed to UH3 decomposition. Figures reproducedfrom [26] (For interpretation of the references to colour in this figure legend,the reader is referred to the web version of this article).
Fig. 8. Showing the conceptual movement and generation of hydrogen andhydride in the corrosion system.
A. Banos, et al. Corrosion Science 152 (2019) 261–270
267

UD3 formed within the system; only UH3 had formed. By calibrating thevolume of the cell where decomposition took place and knowing thefinal temperature of the system, the total pressure of gas (ascribed toH2) could be converted to moles of H2 through the ideal gas lawequation. Thus, the amount of UH3 in the sample could be quantifiedthrough the reverse of the reaction given in Eq. 2. However, as ex-plained already in [22], there were three types of UH3 decomposingbetween 225–450 °C: (a) primordial UH3, formed through the initialmetal fabrication process; (b) interfacial hydride, forming as a very thinlayer at the metal-oxide interface during water corrosion; and (c) bulk-hydride formation through water corrosion [22]. Bulk-UH3 whichpresents the most ‘harmful’ type of hydride, was the one targeted to bequantified. To subtract the contribution of ‘pre-existing’ hydride, mul-tiple reference uranium samples (polished and non-reacted) underwentthe same TPD process and the amount of hydrogen generated was re-lated to the mass of the sample. This correction was then applied to allthe corroded samples to provide the corrected quantity of bulk-UH3 ineach system (Table 5).
High relative bulk-hydride percentages were derived for samplesWD25M and WD45M, calculated as 31.95% and 21.75% of the totalcorrosion product, respectively. This correlates with the very low re-action rate regimes recorded from H2 gas evolution indicating that ahigher quantity of oxidation-formed H+ was reacting to form UH3
(through Eq. 2) instead of diffusing into the headspace as H2. Similarlyto the binary system previously reported [22], the percentage of bulk-hydride present in the solid reaction products decreased with increasingreaction temperature, even though the absolute amount of UH3 in thehigher temperature reacting samples was greater.
Reaction time could potentially have had an effect on the percen-tage of UH3 on samples reacting at 45 °C, with WD45M showing asignificantly higher percentage for a shorter reaction time. One verysignificant finding from the analysis of samples reacting at 45 and 55 °Cwas that the UH3 percentage was significantly lower on the sampleswith initial headspace pressures below the ‘threshold pressure’, incomparison to those above the threshold pressure. The argument thatthis could be solely an effect of the more extended reaction time (andnot also the threshold pressure), would not hold since samples WD45 Land WD45H were reacted for very similar time periods.
4. Discussion and conclusions
The results clearly indicate that bulk hydride formation had oc-curred on all the reacted U samples, determined both directly and in-directly. As displayed in Table 5, it was found that the amount of UH3 asa percentage of the total mass of corrosion product for each sample wasrelated to (a) the reaction temperature, (b) the reaction time period and(c) the initial headspace D2 pressure in the reaction system. Higher
reaction temperatures resulted in a smaller proportion of the corrosionproduct being UH3, even though the absolute mass of UH3 generatedwas greater. This was attributable to the enhanced oxidation kinetics athigher temperatures, leading to more substantial sample oxidation overa given period for lower reaction temperatures. The duration of cor-rosion was also found to somewhat affect the proportion of UH3 in thecorrosion products. Extended reaction periods resulted in a smallerproportion of UH3, especially in the higher temperature regimes (e.g.samples WD55 L and WD55H – Table 5). From physical observation ofthe reacted samples, it was inferred that higher reaction temperatureslead to thicker (due to faster kinetics), but more poorly consolidatedand adhered oxide on the surface. This porous structure would enablewater to directly react with the UH3 buried under the oxide, convertingit to UO2 (Eq. 3). The same effects of temperature and time were ob-served for previous corrosion experiments conducted on the binaryuranium-water system [22].
+ → +UH H O UO H2 4 2 73 2 2 2 (3)
In [22] a headspace ‘threshold pressure’ was suggested, abovewhich the rate of H2 liberation into the headspace volume from Ucorrosion was decreased. It was suggested that this marked rate changeindicated the onset of bulk-UH3 formation in the system. This pressurewas found to be in the 0.5 bar range. Here, for the 45 and 55 °C reac-tion, the D2 headspace pressures were chosen deliberately below (de-noted as L), at (denoted as M) and above (denoted as H) this ‘thresholdpressure’ to accelerate the onset of UH3 formation to different extents.From Table 6, it was found that the proportion of UH3 in the arisingcorrosion product was higher for the samples with starting D2 pressuresabove this previously identified ‘threshold pressure’. This effectivelyverified the proposition made in [22] with regards to facilitation of UH3
formation above this ‘threshold pressure’.A further purpose of the present experiments was to validate whe-
ther the previously observed hydride formation was attributable to (i)hydrogen gas diffusing through the water from the headspace to reactat the metal surface or (ii) hydrogen derived from splitting of water orhydroxyl ions at the metal surface concurrent with oxide formation (Eq.1).
Most significant in verifying the contributor to hydride formationwas the TPD-RGA degassing analysis of the corroded samples. The re-sults clearly indicated that the hydrogen attributable to hydride for-mation was chemically derived from the water and not the headspacegas, because no significant detectable D2 was recorded during hydridedecomposition. In future work, it would be logical to test this attribu-tion by reversing the hydrogen isotopes in the experimental system andusing heavy water (D2O) with a cover gas of hydrogen (H2).
This is a significant observation and indicates that the mechanismfor hydride formation involves the headspace gas performing the role of
Table 5Bulk-hydride quantification for all reaction samples. The percentage ratio of UH3 to overall solid reaction products was also calculated.
Sample Reaction time(hours)
Workingvolume (cm3)
Final T ofdecomposition (K)
Pressure increasedue to UH3
decomposition (mbar)
mmol of interlayerhydride (for avg.thickness of 5 nm)
mmol ofbulk UH3
*mmol of UO2
(derived fromEq.1)
Percentage ratio ofUH3 tooverallsolid corrosion products(assuming only UO2 andUH3 are produced)(%)
WD25M 1091 108.4 675.2 12.84 5.34E-05 0.0147 0.0314 31.95WD45L 1567.4 213.2 675.2 10.44 8.04E-05 0.0238 0.4175 5.39WD45M 775 108.3 705.6 8.11 8.39E-05 0.0072 0.026 21.75WD45H 1639 213.3 678.4 12.02 4.22E-05 0.0289 0.192 13.11WD55L 1566 213.2 663.7 21.05 8.37E-05 0.0514 1.079 4.55WD55M 1075 108.4 708.7 4.35 3.07E-05 0.0043 0.2682 1.58WD55H 1092.3 213.2 667.9 11.63 8.15E-05 0.027 0.2878 8.59WD70M 516 108.3 678.4 6.37 8.05E-05 0.0055 0.1226 4.27
* molesfinal= molesgas phase - molesinterlayer hydride – molesstored UH3.
A. Banos, et al. Corrosion Science 152 (2019) 261–270
268
reversing or balancing the hydrogen pressure gradient in the corrosionsystem. At below the 500-mbar threshold headspace pressure it is in-ferred that the highest hydrogen pressure in the system is at the ur-anium oxide-metal interface. Hence any evolved hydrogen (from cor-rosion) diffuses out from the interface through the oxide and coverwater, into the lower-pressure headspace. At above 500mbar, thepressure gradient starts to tip in the opposite direction, causing hy-drogen released by oxidative corrosion to persist in greater quantities atthe uranium surface causing hydride formation.
This is of course an oversimplification of the processes likely oc-curring. Initially it is more thermodynamically favourable for water toprovide the hydrogen source for hydride formation, as water was thespecie immediately contacting the outermost sample surface. However,it would be inevitable that deuterium from the headspace would sub-sequently dissolve into the reaction water and even reach the oxidesurface and contribute to hydride formation, as evidenced by our SIMSanalyses. However, our TPD analysis indicates that deuterium, whilst itmay be present in the hydride, was an insignificant contributor. Thisbehaviour may partly be explained by the work of Tiferet et al. [24]whose study showed that chemisorption of hydrogen onto uranium inthe presence of water vapour is very limited, due to domination ofsurface adsorption sites by dissociated water.
From the findings of this work, corresponding with [22], the reac-tion of uranium in liquid water with a sealed headspace D2 overpressure(U+H2O+D2) may be described by the following steps:
1) Initial oxidation of the sample by water. At this stage oxide thick-ening occurs on the sample surface, combined with H+ ion forma-tion at the metal-oxide interface, liberated during partial dissocia-tion of water (H+ −OH−) at the oxide surface and oxide formationthrough anionic movement of OH− through the oxide lattice (pre-valent diffusing entity). Through that mechanism [9] the H+ ionseither couple with each other to form molecular hydrogen and dif-fuse to the outer surface of the sample or remain at the metal-oxideinterface where they build up in pressure to eventually react withthe metal and form UH3. At the start of the experiment, before theD2 could achieve an equilibrium saturation with the water, H+
liberated by U oxidation is assumed to have diffused outwards intothe water and hydride formation would not have occurred. Hydrideformation cannot be excluded at this step of the process, but itconsidered less likely as the hydrogen pressure at the metal-oxideinterface is likely higher than in the water irrespective of theheadspace gas pressure.
2) Subsequently, with continued corrosion where a critical headspacepressure is reached, referred to as the ‘threshold pressure’, thegenerated H+ from U oxidation by water will begin to contribute tobulk-UH3 formation (alongside continued oxide formation), withless H+ being contributed to the gas phase. This was manifested by adecrease in the rate of H2 gas evolution in the cell headspace. This‘threshold pressure’ was calculated in [22] to be ˜500mbar, in-cluding the coexisting water vapour pressure. Our experiments in-itiated with headspace D2 below, at and over the ‘threshold pres-sure’, have confirmed this threshold switch in corrosion behaviour.It is important to note that UH3 formation could occur prior to the‘threshold pressure’ being achieved. However, above this pressure,H2 gas evolution deceleration will facilitate if not accelerate thephenomenon of UH3 formation, since the concentration of H+ at themetal-oxide interface will be higher because the accumulatedheadspace gas essentially balances (or reverses) the hydrogenpressure across the system.
3) Over prolonged periods of corrosion (> 100′s hours) the accumu-lated oxide which initially protects the underlying hydride that isforming, becomes more poorly protective due to cracking andspallation. Exposed UH3 will readily react with water to form UO2,releasing H2 as a by-product. This was manifested in our experi-ments as a switch to a higher gas generation rate (Fig. 2-3rd reaction
regime). By comparing the amount of UH3 produced relative to theamount of UO2 for each system it was found that longer reactionperiods resulted in proportionally smaller amount of UH3. This wasexpected as the water will readily oxidise the UH3 in addition to themetal.
The current study has revealed an interesting set of dynamics for theU+H2O+H2 corrosion system, using D2 as a tracking isotope. Theobservation of a threshold pressure for ‘switching on’ bulk-UH3 is sig-nificant and it is not currently understood if this observed influence oncorrosion exerted by exceeding the 500mbar H2 threshold pressure inthe headspace, will be reproduced by other gas mixtures e.g. a 1 bar80:20 N2-H2 mixture or a 1 bar 4:18:78 H2-O2-N2 mixture analogous tothe threshold explosive concentration of hydrogen in air.Understanding this behaviour is considered important for predicting thecorrosion state of uranium in existing storage facilities and for ‘inerting’activities that are planned during legacy material retrievals atSellafield. This will form the basis for ongoing experiments.
To summarize, the low temperature corrosion reaction of uraniumwith liquid water under a D2 headspace overpressure was investigatedunder immersed conditions with a sealed volume. Nine samples wereexamined at four different temperatures (25, 45, 55 and 70 °C), and byvarying reaction time and headspace overpressure. The rate of the re-action was derived from monitoring progressive pressure changes in thereaction cell (ascribed to H2 generation from oxidation). Post-reactionexamination of the corroded uranium surfaces was conducted usingFIB, SIMS and XRD analysis. Commensurate pH measurements of theresidual reaction waters were also conducted to examine gas dissolu-tion. Finally, the samples were degassed using a three-step thermaldesorption-decomposition process, to verify any UH3 formation anddetermine the mass formed in each system. Residual gas analysis (RGA)of the desorbed gases was used to determine the composition of theevolved gases.
From the analyses, it was concluded that:
i Bulk UH3 forms at the metal-oxide interface, on the majority of thesamples. This was established through SIMS, XRD and TPD analysis.
ii UH3 as a proportion of the overall solid reaction products on eachsample (UH3 and UO2) was derived for each system. It was foundthat lower temperature reaction conditions yielded higher propor-tions of UH3 in the arising corrosion products. However, the abso-lute UH3 quantities were higher for the samples reacted at highertemperatures. It was observed that for higher temperatures, theformed oxide is thicker but more poorly adhered to the surface, withsignificant delamination and spallation. Alongside enhanced oxi-dation kinetics at higher temperatures, this facilitates water con-tacting and oxidizing bulk hydride, leading to proportional reduc-tion of the UH3 within the system.
iii Extended reaction periods resulted in smaller proportions of UH3 inthe overall mass of corrosion products, especially in the highertemperature regimes (samples WD55 L and WD55H – Table 5).
iv By using D2 in the headspace at pressures below, at and above the‘threshold pressure’ (˜500mbar) suggested by [22] a switch in therate of gas liberation from U water corrosion was observed. Throughthe use of isotopic labelling it was established that hydrogen gen-erated through oxidation of U by water, and not D2 gas migrationfrom the headspace, was responsible for hydride formation.
Acknowledgements
The authors would like to thank the Engineering and PhysicalSciences Research Council (EPSRC) and Sellafield Ltd for funding thisproject as part of 42-month PhD research studentship (Ref: 1338575),at the Interface Analysis Centre (IAC), School of Physics, University ofBristol. We would also like to thank Mr John Jowsey and Dr AnnaAdamska from the Sellafield Centre for Expertise in Uranium and
A. Banos, et al. Corrosion Science 152 (2019) 261–270
269
Reactive Metals (URM) for contextual guidance and technical input.
References
[1] Nuclear decommissioning authority (NDA), Radioactive Wastes in the UK: aSummary of the 2016 Inventory, Nuclear decommissioning authority (NDA),Cumbria, 2016.
[2] Pile Fuel Storage Pond, Sellafield Ltd, Cumbria, 2013www.sellafieldsites.com.[3] C. Ablitzer, F. Le Guyadec, J. Raynal, X. Génin, A. Duhart-Barone, Influence of
superficial oxidation on the pyrophoric behaviour of uranium hydride and uraniumpowders in air, J. Nucl. Mater. 432 (2013) 135–145.
[4] F. Le Guyadec, X. Génin, J. Bayle, O. Dugne, A. Duhart-Barone, C. Ablitzer,Pyrophoric behaviour of uranium hydride and uranium powders, J. Nucl. Mater.396 (2010) 294–302.
[5] J. Frank, A. Roebuck, Crevice Corrosion of Uranium and Uranium Alloys, (ANL-5380), Argonne National Laboratory, Lemont, Illinois, 1955.
[6] J. Draley, W. Ruther, Some unusual effects of hydrogen in corrosion reactions, J.Electrochem. Soc. 104 (1957) 329–333.
[7] B. Hopkinson, Kinetics of the uranium‐steam reaction, J. Electrochem. Soc. 106(1959) 102–106.
[8] T. Kondo, E. Verink, F. Beck, M. Fontana, Gas chromatographic and gravimetricstudies of uranium oxidation mechanism, Corrosion 20 (1964) 314t–320t.
[9] M.M. Baker, L. Less, S. Orman, Uranium + water reaction. Part 1.- Kinetics, pro-ducts and mechanism, Trans. Faraday Soc. 62 (1966) 2513–2524.
[10] T. Kondo, F. Beck, M. Fontana, A Gas chromatographic study on the kinetics ofuranium oxidation in moist environments, Corrosion 30 (1974) 330–341.
[11] M. Bennett, B. Myatt, D. Silvester, J. Antill, The oxidation behaviour of uranium inair at 50-300° C, J. Nucl. Mater. 57 (1975) 221–236.
[12] K. Winer, C. Colmenares, R. Smith, F. Wooten, Interaction of water vapour withclean and oxygen-covered ur anium surfaces, Surf. Sci. 183 (1987) 67–99.
[13] S.C. Marschman, T. Pyecha, J. Abrefah, Metallographic Examination of Damaged NReactor Spent Nuclear Fuel Element SFEC5, 4378, Pacific Northwest Laboratory,Richland, WA (United States), 1997.
[14] J. Abrefah, R.L. Sell, Oxidation of K-west Basin Spent Nuclear Fuel in Moist HeliumAtmosphere, (No. PNNL-12167), Pacific Northwest National Laboratory, Richland,WA (US), 1999.
[15] T.C. Totemeier, R.G. Pahl, S.M. Frank, Oxidation kinetics of hydride-bearing ur-anium metal corrosion products, J. Nucl. Mater. 265 (1999) 308–320.
[16] A. Danon, J. Koresh, M. Mintz, Temperature programmed desorption
characterization of oxidized uranium surfaces: relation to some gas-uranium reac-tions, Langmuir 15 (1999) 5913–5920.
[17] C.H. Delegard, A.J. Schmidt, Uranium Metal Reaction Behaviour in Water, Sludge,and Grout Matrices, (No. PNNL-17815), Pacific Northwest National Laboratory,2008.
[18] J. Waber, A Review of the Corrosion Behaviour of Uranium, Los Alamos ScientificLaboratory, New Mexico, 1956.
[19] C. Colmenares, R. Howell, T. McCreary, Oxidation of Uranium Studied byGravimetric and Positron Annihilation Techniques, (No. UCRL-85549; CONF-810332-2), Lawrence Livermore National Laboratory, CA (USA), 1981.
[20] J.M. Haschke, Reactions of Plutonium and Uranium With Water: Kinetics andPotential Hazards, (No. LA–13069-MS), Los Alamos National Laboratory, 1995.
[21] M. Kaminski, Batch Tests with unirradiated uranium metal fuel program report,(No. ANL-01/33), Argonne National Laboratory, Illinois (USA, 2002.
[22] A. Banos, K.R. Hallam, T. Scott, Corrosion of Uranium in Liquid Water UnderVacuum Contained Conditions. The Initial Binary U + H2O(l) system., UnderSubmission, (2018).
[23] M.M. Baker, L. Less, S. Orman, Uranium + water reaction. Part 2. - Effect of oxygenand other gases, Trans. Faraday Soc. 62 (1966) 2525–2530.
[24] E. Tiferet, M. Mintz, I. Jacob, N. Shamir, Inhibition of hydrogen chemisorption onuranium surfaces by traces of water vapour, Surf. Sci. 601 (2007) 4925–4930.
[25] E. Tiferet, M. Mintz, S. Zalkind, I. Jacob, N. Shamir, Heat treatment effects on thesurface chemisorption behaviour of strained uranium: The H2O/U reaction, J.Alloys. Compd. 444 (2007) 177–183.
[26] A. Banos, Investigation of Uranium Corrosion Under Mixed Water-hydrogenEnvironments, PhD thesis University of Bristol, Bristol, 2017.
[27] A. Banos, C.P. Jones, T.B. Scott, The effect of work-hardening and thermal an-nealing on the early stages of the uranium-hydrogen corrosion reaction, Corros. Sci.131 (2018) 147–155.
[28] A. Banos, C. Stitt, T. Scott, The effect of sample preparation on uranium hydriding,Corros. Sci. 113 (2016) 91–103.
[29] A. Banos, T.B. Scott, Statistical analysis of UH3 initiation using electron back-scattered diffraction (EBSD), Solid State Ion. 296 (2016) 137–145.
[30] E. Wilhelm, R. Battino, R.J. Wilcock, Low-pressure solubility of gases in liquidwater, Chem. Rev. 77 (1977) 219–262.
[31] T.C. Totemeier, A Review of the Corrosion and Pyrophoricity Behaviour of Uraniumand Plutonium, Government Research Announcements and Index, (1995) USA 45.
[32] N. Harker, The Corrosion of Uranium in Sealed Environments Containing Oxygenand Water Vapour, PhD thesis University of Bristol, Bristol, 2012.
A. Banos, et al. Corrosion Science 152 (2019) 261–270
270