overall frequency distribution by total score - … · overall frequency distribution by total...
TRANSCRIPT
Seventh Grade – 2003 pg. 1
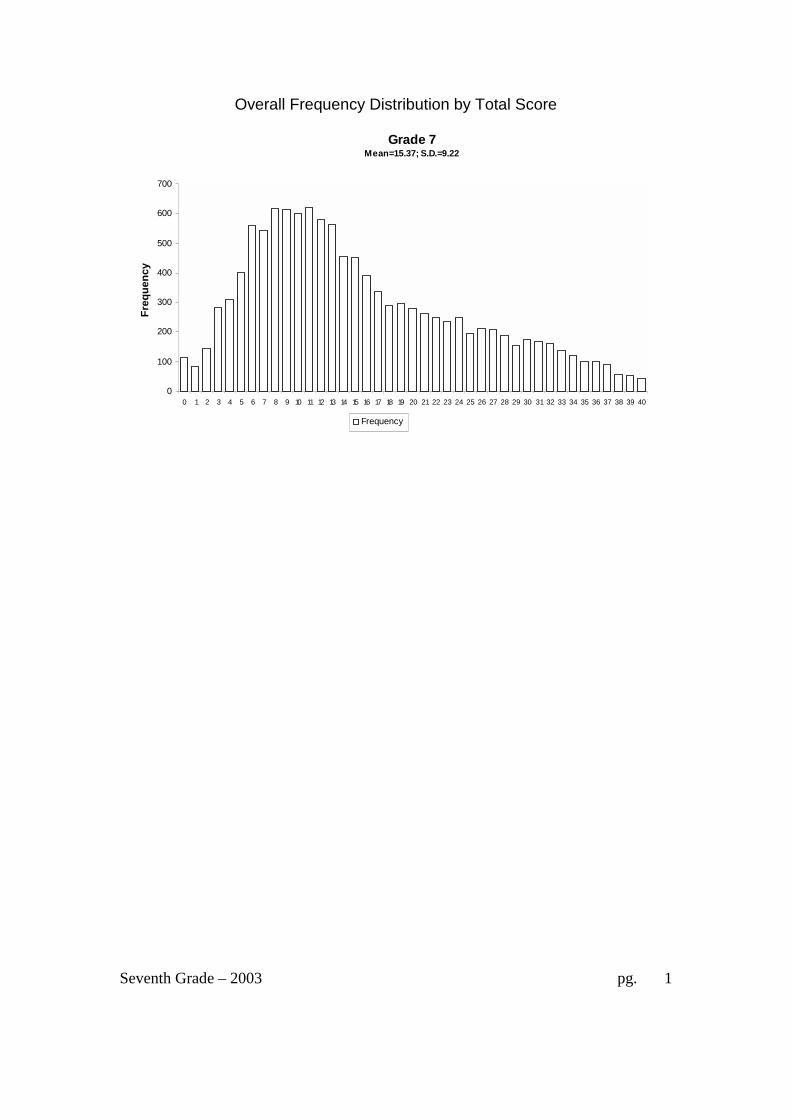
Overall Frequency Distribution by Total Score
Grade 7 Mean=15.37; S.D.=9.22
0
100
200
300
400
500
600
700
0 1 2 3 4 5 6 7 8 9 10 11 12 13 14 15 16 17 18 19 20 21 22 23 24 25 26 27 28 29 30 31 32 33 34 35 36 37 38 39 40
Freq
uenc
y
Frequency

Seventh Grade – 2003 pg. 2
Level Frequency Distribution Chart and Frequency Distribution
2003 - Numbers of students tested:
Grade 7: 11715
Grade 7 1999 - 2001 Level % at ('99) % at least
('99) % at ('00) % at least
('00) % at ('01) % at least
('01) 1 22% 100% 16% 100% 23% 100% 2 41% 78% 39% 74% 37% 77% 3 24% 37% 29% 45% 26% 40% 4 13% 13% 16% 16% 14% 14%
Grade 7 2002 - 2003 Level % at ('02) % at least
('02) % at ('03) % at least
('03) 1 31% 100% 31% 100% 2 37% 69% 42% 69% 3 24% 32% 14% 27% 4 8% 8% 13% 13%
0
500
1000
1500
2000
2500
3000
3500
4000
4500
5000
5500
Freq
uenc
y
Frequency 3677 4865 1614 1559
0-9 1 Minimal Success
10-20 2 Below Standard
21-27 3 At Standard
28-40 4 High Standard

Seventh Grade – 2003 pg. 3
7th grade Task 1 Mixing Paint Student Task
Use ratios and percents to solve a practical problem involving the mixing of paint.
Core Idea 1 Number and Operations
Understand number systems and ways of representing number, relationships, and number systems.
• Develop, analyze and explain methods for solving problems involving proportional reasoning, such as scaling and finding equivalent ratios
• Understand the meaning and effects of operations with rational numbers.
• Develop and use strategies to estimate the results of rational number computations, and judge the reasonableness of results.
• Work flexibly with fractions, decimals, and percents to solve problems.

Seventh Grade – 2003 pg. 4

Seventh Grade – 2003 pg. 5

Seventh Grade – 2003 pg. 6
Looking at Student Work – Mixing Paints Mixing Paints was a difficult task for students. A little more than half the students in the sample scored no points on this task, even though 85% of the zeros attempted the task. Therefore it is important to look carefully at strategies that helped successful students and ways they clarified their explanations. Student A makes an area model diagram to keep track of the parts and whole. It makes it easy to see the relative sizes of the different components of the paint. Student A

Seventh Grade – 2003 pg. 7
Student B does a very thorough job of showing all the calculations necessary for each step of the process, including the portioning of brown into yellow and violet. The student shows an understanding operations and calculations with fractions. Student B
Seventh Grade – 2003 pg. 8
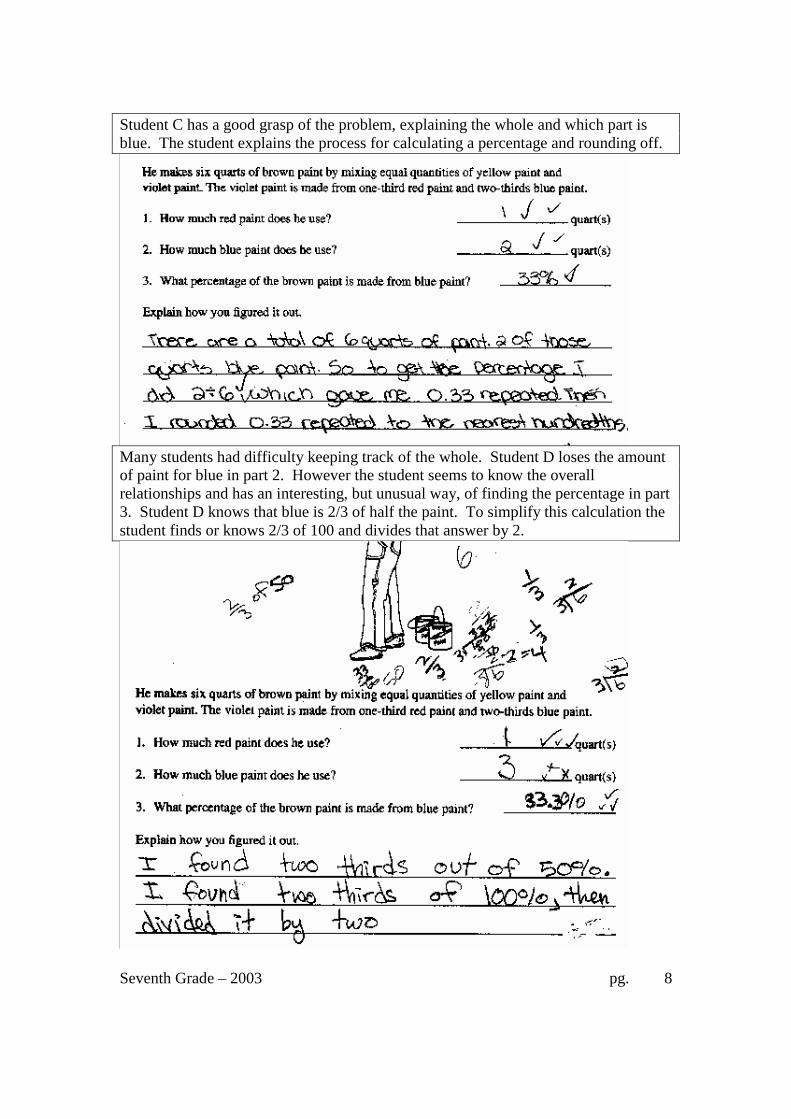
Student C has a good grasp of the problem, explaining the whole and which part is blue. The student explains the process for calculating a percentage and rounding off.
Many students had difficulty keeping track of the whole. Student D loses the amount of paint for blue in part 2. However the student seems to know the overall relationships and has an interesting, but unusual way, of finding the percentage in part 3. Student D knows that blue is 2/3 of half the paint. To simplify this calculation the student finds or knows 2/3 of 100 and divides that answer by 2.

Seventh Grade – 2003 pg. 9
The most common error is to lose track of the total amount of paint. Student E correctly finds the amount of red and blue paint, but forgets that the total amount of paint is 6 quarts instead of two quarts. Student E
Teacher Notes:

Seventh Grade – 2003 pg. 10
Frequency Distribution for each Task – Grade 7 Grade 7 – Mixing Paints
Score: 0 1 2 3 4 5 % < = 50.7% 56.0% 73.5% 77.7% 81.3% 100.0% % > = 100.0% 49.3% 44.0% 26.5% 22.3% 18.7%
The maximum score available on this task is 5 points. The cut score for a level 3 response is 2 points. A little less than half the students could find the amount of red or blue paint needed. Less than 20% could find the amount of red and blue paint and calculate the percentage of total paint that represented. A little more than 50% of the students scored zero points on this task. About 7% of all the students did not attempt this task, even though it was the first problem in the test. 43% of the students attempted the task with no success.
Mixing PaintsMean: 1.61, S.D.: 1.95
0
1000
2000
3000
4000
5000
6000
7000
Score
Freq
uenc
y
Frequency 5940 616 2054 492 428 2185
0 1 2 3 4 5

Seventh Grade – 2003 pg. 11
Mixing Paints
Points Understandings Misunderstandings 0 85% of the students with this
score attempted the task. The most common error was to give a fraction rather than convert to quarts. About 1/5 of the students gave the response 1/3 and 2/3. A less frequent error was to put 2 quarts of red and 4 quarts of blue.
1 Students with this score could either find the amount of red or blue paint.
2 Students could find both the amount for red or blue paint.
They had difficulty finding the percent of blue paint. Students did not recognize that the violet paint was only half of the total paints. Therefore most students thought the percentage was 66% instead of 33%.
5 Students could keep track of part/whole relationships, calculate the amount of red and blue paint needed, and find the percentage of blue paint. Some students were able to make good use of diagrams. Other students demonstrated a facility with operations with fractions.
Based on teacher observations, this is what seventh grade students knew and were able to do:
• Find the fractional amount of red or blue paint and use that to find the number of quarts
Areas of difficulty for seventh graders, seventh grade students struggled with: • Understanding the whole in a multi-step problem • Calculating percentages • Tracking part/whole relationships • Using fractions instead of taking a fractional part of the whole
Seventh Grade – 2003 pg. 12
Questions for Reflection on Mixing Paints: • Did your students seem to know the difference between a fraction of a whole
and the quantity the fractional part represented? (Could they find the amount of red and blue paint?)
• Did students seem comfortable working with fractions? Did they use multiplication or diagrams to help make sense of the problem?
• Do students seem to know landmark percents or did they calculate the percentage of blue paint?
• Would their procedure for finding percents have been correct if they had started with the correct fraction?
Teacher Notes: Instructional Implications: Students need strategies to help them make sense of problem situations. Being able to draw a picture or make a model helps them see part/whole relationships. Until the student can see how the parts fit together, the student cannot calculate with fractions or find percentages for the different components. Students need more experiences working with problems in which “the whole” changes. Students need more experience using information from problems to get the answer instead of repeating numerical information that has been given in the problem. Too many students thought the numbers in the text of the problem were the solutions. Students at this grade level should be able to convert mentally between common fractions and percents. At this grade level, students should “just know” the relationship between common fractions and the equivalent percents. Teacher Notes:

Seventh Grade – 2003 pg. 13
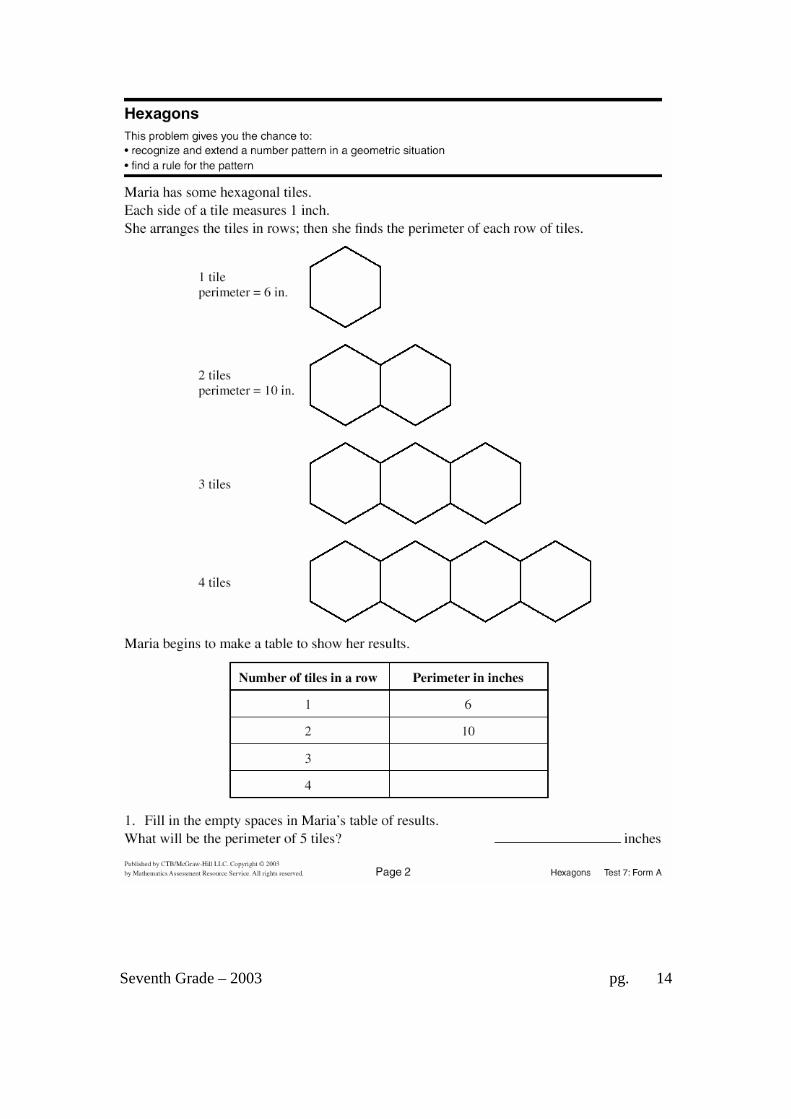
7th grade Task 2 Hexagons Student Task
Find and extend a number pattern in the context of hexagonal designs. Give a rule or formula for determining the perimeter of each growing design.
Core Idea 2 Algebra and Functions
Understand relations and functions, analyze mathematical situations and use models to solve problems involving quantity and change.
• Represent, analyze, and generalize a variety of functions including linear relationships
• Express mathematical relationships using expressions and equations
• Use symbolic algebra to represent situations to solve problems
Seventh Grade – 2003 pg. 14
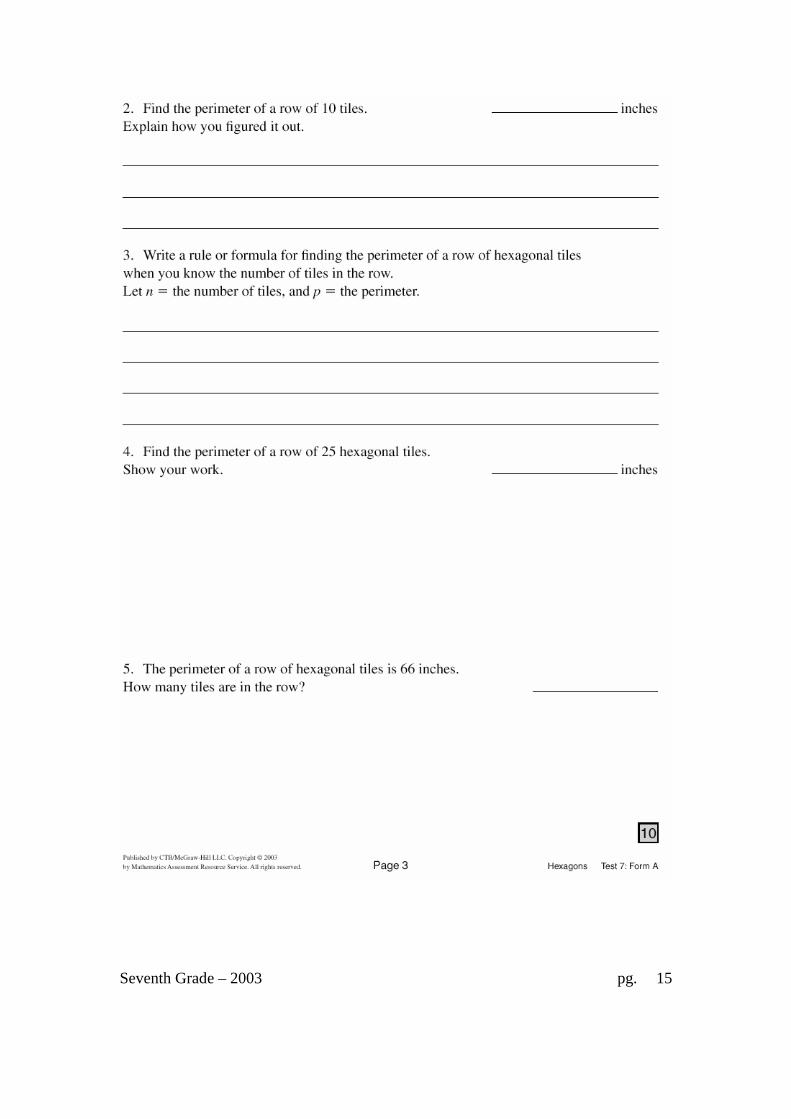
Seventh Grade – 2003 pg. 15

Seventh Grade – 2003 pg. 16
Seventh Grade – 2003 pg. 17
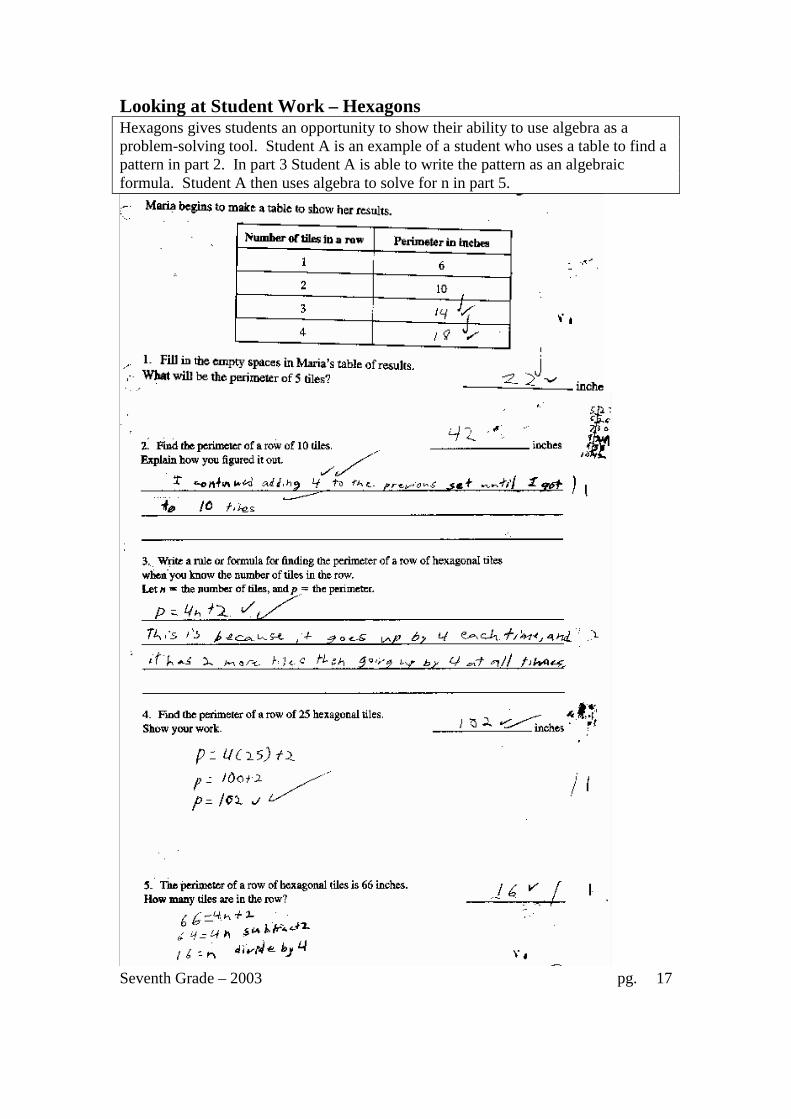
Looking at Student Work – Hexagons Hexagons gives students an opportunity to show their ability to use algebra as a problem-solving tool. Student A is an example of a student who uses a table to find a pattern in part 2. In part 3 Student A is able to write the pattern as an algebraic formula. Student A then uses algebra to solve for n in part 5.
Seventh Grade – 2003 pg. 18
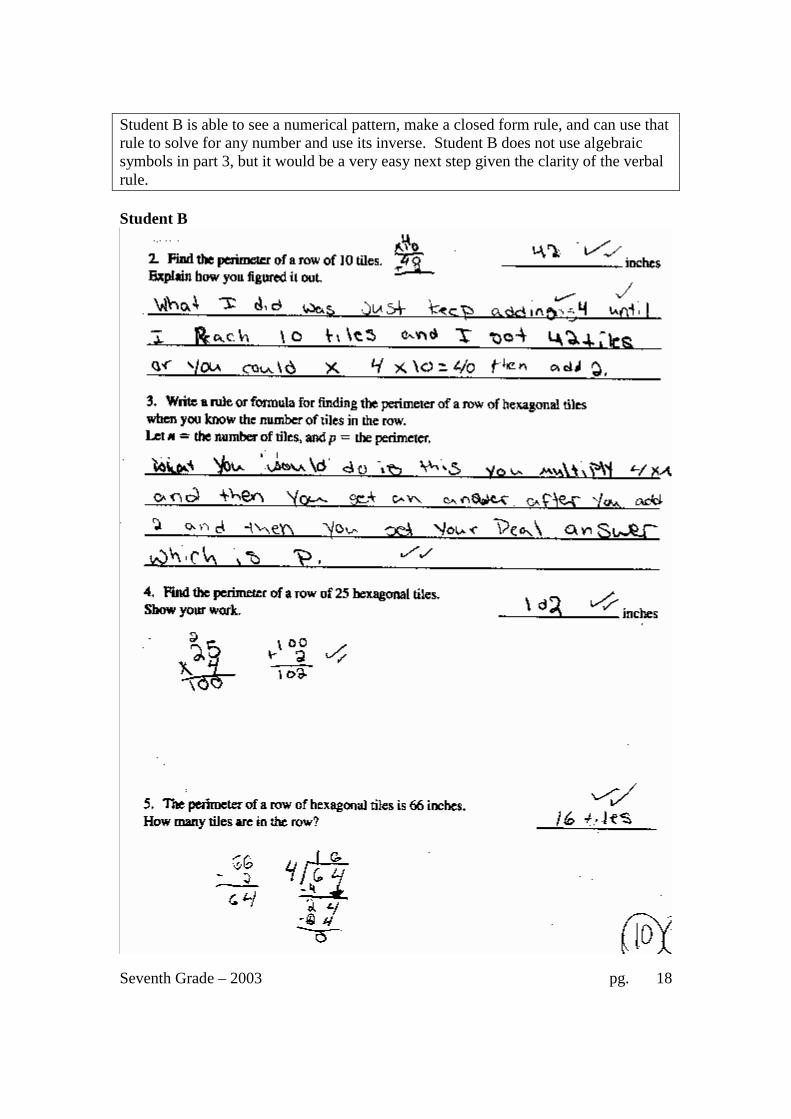
Student B is able to see a numerical pattern, make a closed form rule, and can use that rule to solve for any number and use its inverse. Student B does not use algebraic symbols in part 3, but it would be a very easy next step given the clarity of the verbal rule. Student B
Seventh Grade – 2003 pg. 19
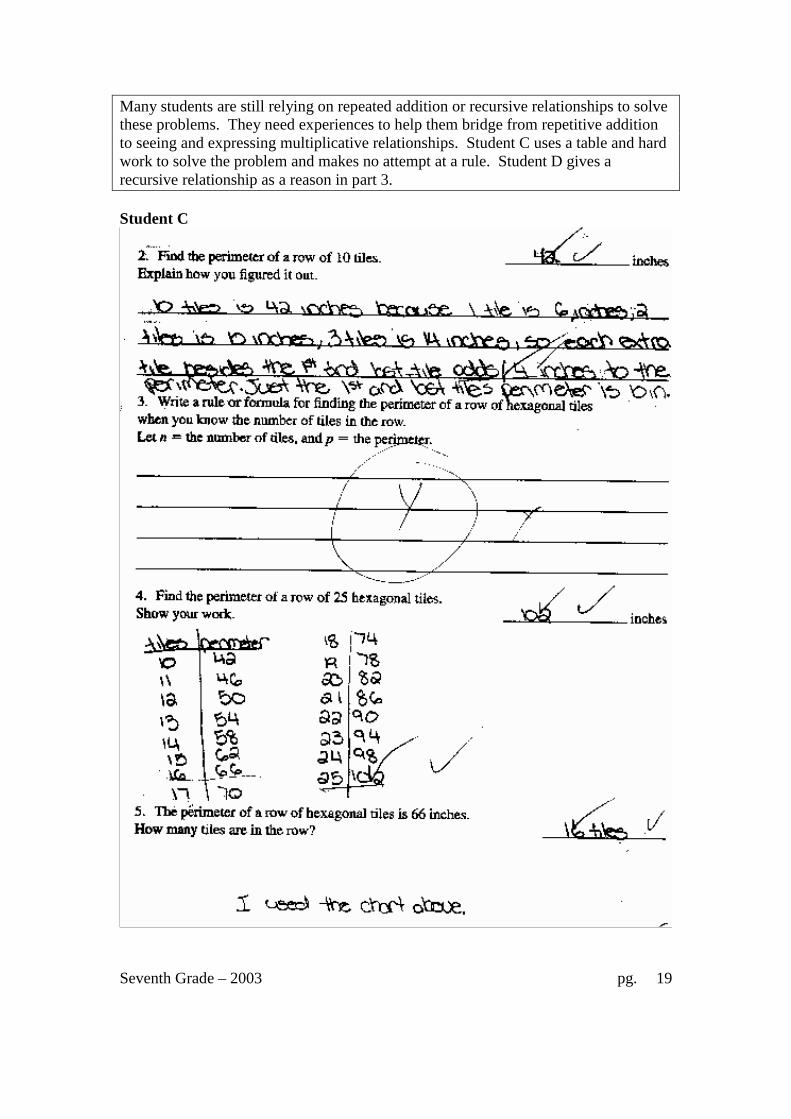
Many students are still relying on repeated addition or recursive relationships to solve these problems. They need experiences to help them bridge from repetitive addition to seeing and expressing multiplicative relationships. Student C uses a table and hard work to solve the problem and makes no attempt at a rule. Student D gives a recursive relationship as a reason in part 3. Student C

Seventh Grade – 2003 pg. 20
Student D

Seventh Grade – 2003 pg. 21
Other students have not bridged from drawing and counting strategies to repeated addition or thinking multiplicatively. This is not only cumbersome, but can lead to many errors. See the work of Student E, question 4. Student E

Seventh Grade – 2003 pg. 22
Students at this grade level need to understand the difference between a constant and a variable term. Students who have had experiences with patterns and functions should be aware that unless the relationship is proportional, you can’t add 2 parts together without considering change in the constant. In part 5, the student calculated the amount of border for ten tiles twice, but does not consider the constant is added twice. Students need to understand the difference between linear functions with constants and proportional functions.
Seventh Grade – 2003 pg. 23
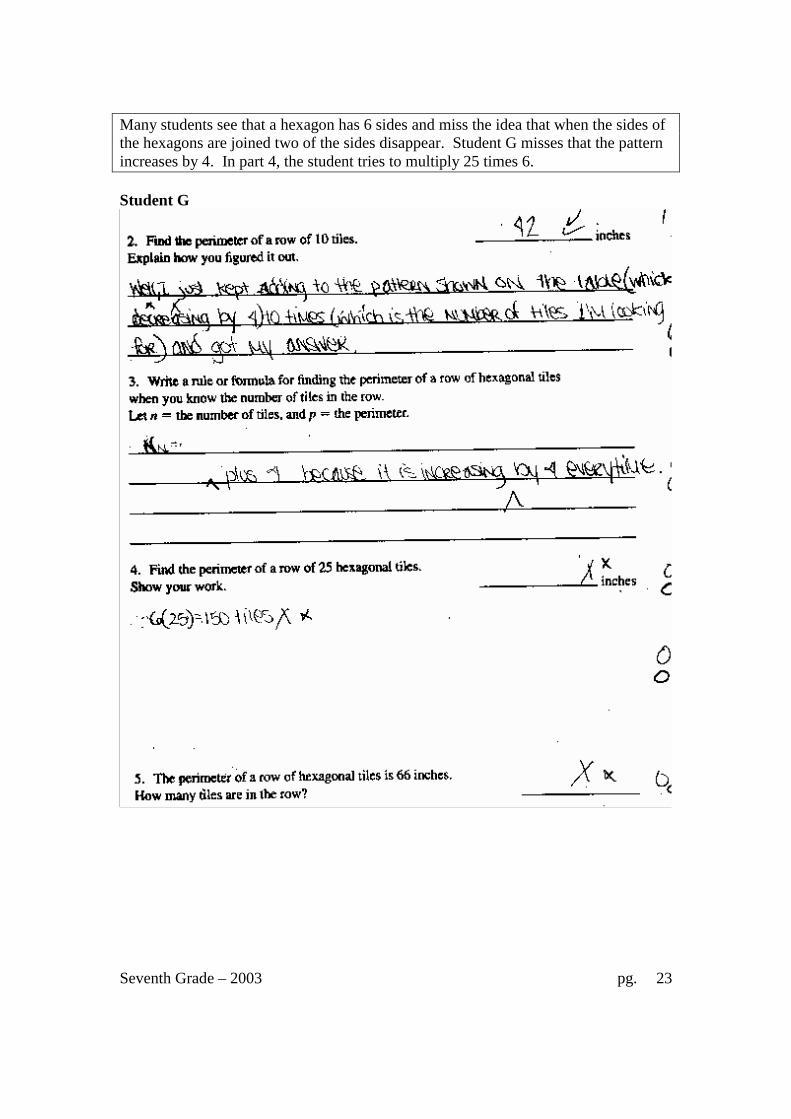
Many students see that a hexagon has 6 sides and miss the idea that when the sides of the hexagons are joined two of the sides disappear. Student G misses that the pattern increases by 4. In part 4, the student tries to multiply 25 times 6. Student G

Seventh Grade – 2003 pg. 24
Student H doesn’t verify the answers given in the table and misses the fact that the pattern is increasing by 4 instead of 6. This makes all further work incorrect. Student H
Teacher Notes:

Seventh Grade – 2003 pg. 25
Grade 7 – Hexagons
Score: 0 1 2 3 4 5 6 7 8 9 10 % < = 8.2% 10.3% 16.6% 32.3% 39.2% 50.0% 57.6% 64.8% 78.0% 82.5% 100.0% % > = 100.0% 91.8% 89.7% 83.4% 67.7% 60.8% 50.0% 42.4% 35.2% 42.4% 17.5%
The maximum score available on this task is 10 points. The cut score for a level 3 response is 6 points. Most students (about 92%) could look at a geometric pattern and continue it on a table. About half the students could extend the pattern in a table and slightly beyond the numbers in the table and find the perimeter for a row of 66 tiles.(score of 6 or above). Almost 18% of the students could meet all the demands of the task including writing a rule for extending the pattern in words or algebraic notation. 8% of the students scored no points on this task.
HexagonsMean: 5.60, S.D.: 3.15
0
500
1000
1500
2000
2500
Score
Freq
uenc
y
Frequency 964 240 743 1834 817 1260 895 842 1539 531 2050
0 1 2 3 4 5 6 7 8 9 10

Seventh Grade – 2003 pg. 26
Hexagons Points Understandings Misunderstandings
0 Most students with this score attempted the problem.
Students could not add accurately or thought the pattern was increasing by 5 or 6 instead of 4.
2 Students could correctly extend the pattern in the table.
Students made addition errors in extending the pattern beyond the table.
4 Students could do all of part one and either get the answer for 10 tiles or describe a procedure for finding the perimeter of 10 tiles; but not both.
Many students at this level were using a drawing or counting strategy or used repeated addition which makes errors likely as the pattern gets larger. In part 4 almost 10% of the students were trying to multiply by 5 or 6. They had not noticed that the hexagon pattern was growing by 4’s. 18% still relied on drawing a picture. About 20% continued the table or used repeated addition. Another 10% do not understand the role of the constant in this type of function and tried to add quantities within the table like 10 tiles =42, so 20 tiles would equal a perimeter of 84.
6 Students can extend a pattern in a table and beyond and find number of tiles to make a perimeter of 66.
7 Students could extend a pattern up to 10 tiles and 25 tiles.
Students could not write a rule. The procedures were recursive such as adding four every time. About 19% of the students wrote rules of plus 4. They did not see a relationship between the independent and dependent variables. They also could not work backwards from the perimeter to the number of tiles.
8 Students could extend a pattern and use inverse relationships to go from perimeter to number of tiles.
They are still not noticing the relationship between the independent and dependent variables. They are still thinking in recursive modes.
10 Students could extend a pattern and use inverse relationships. They could write a rule or formula to express finding any number in the pattern. About 20% of the students could use algebra to solve for part 5.
Seventh Grade – 2003 pg. 27
Based on teacher observations, this is what seventh graders seemed to know and be able to do:
• Find a geometric pattern and extend it using a table. • Extend a geometric pattern beyond the table using drawing or repeated
addition. Areas of difficulties for seventh graders, seventh grade students struggled with:
• Bridging from drawing, extending tables, and repeated addition to using multiplicative relationships
• Seeing the connections between independent and dependent variables to write rules or formulas, instead of writing recursive relationships
• Understanding the role of constants in functions to know that unless the relationship is a proportion different numbers in the table cannot be added to find further numbers in the pattern without considering the change in the constant
• Using inverse relationships or algebra to work from the perimeter (dependent variable) to the number of tiles (independent variable)
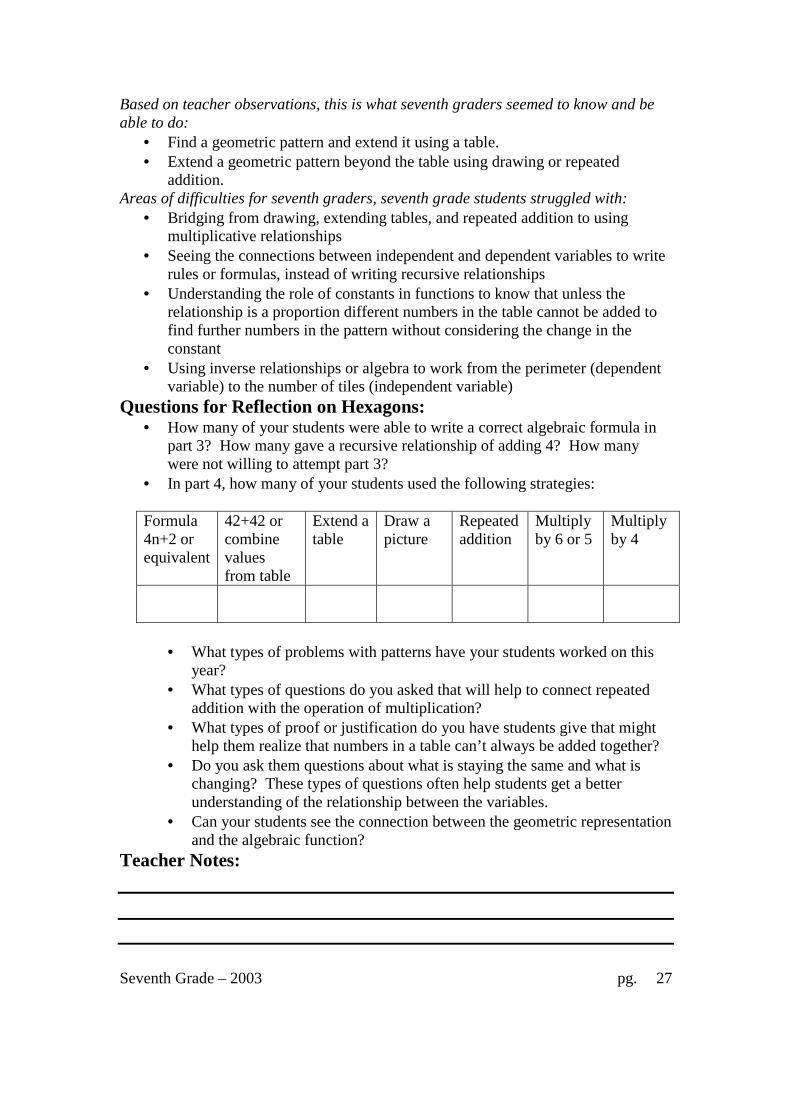
Questions for Reflection on Hexagons: • How many of your students were able to write a correct algebraic formula in
part 3? How many gave a recursive relationship of adding 4? How many were not willing to attempt part 3?
• In part 4, how many of your students used the following strategies: Formula 4n+2 or equivalent
42+42 or combine values from table
Extend a table
Draw a picture
Repeated addition
Multiply by 6 or 5
Multiply by 4
• What types of problems with patterns have your students worked on this
year? • What types of questions do you asked that will help to connect repeated
addition with the operation of multiplication? • What types of proof or justification do you have students give that might
help them realize that numbers in a table can’t always be added together? • Do you ask them questions about what is staying the same and what is
changing? These types of questions often help students get a better understanding of the relationship between the variables.
• Can your students see the connection between the geometric representation and the algebraic function?
Teacher Notes:

Seventh Grade – 2003 pg. 28
Implications for Instruction: When students look at pattern problems, it is helpful to visualize what is changing and what is staying the same. As they progress through the grades this information could be used to help them write a rule or formula. At this grade level, they should no longer rely on drawing pictures or doing repeated addition to find the solutions to complex problems. They should develop the ability to see and use multiplicative relationships. Students also need experience working backward with patterns to knowing the dependent variable and using it to find the independent variable. Students at this grade level should be proficient at solving a variety of questions about growing patterns. Teacher Notes:

Seventh Grade – 2003 pg. 29
7th grade Task 3 Pattern Student Task
Determine symmetrical properties of shape. Calculate lengths and angles in symmetrical figures.
Core Idea 3 Geometry and Measurement
Apply congruence and similarity to analyze mathematical situations. Apply appropriate techniques, tools, and formulas to determine measurements.
• Understand relationships among the angles, side lengths, perimeters, and the areas of similar objects
• Develop and critique inductive and deductive arguments concerning geometric ideas and relationships.
• Understand line of symmetry. (6th grade) • Investigate and reason about the results of subdividing,
combining, and transforming shapes. (6th grade)

Seventh Grade – 2003 pg. 30
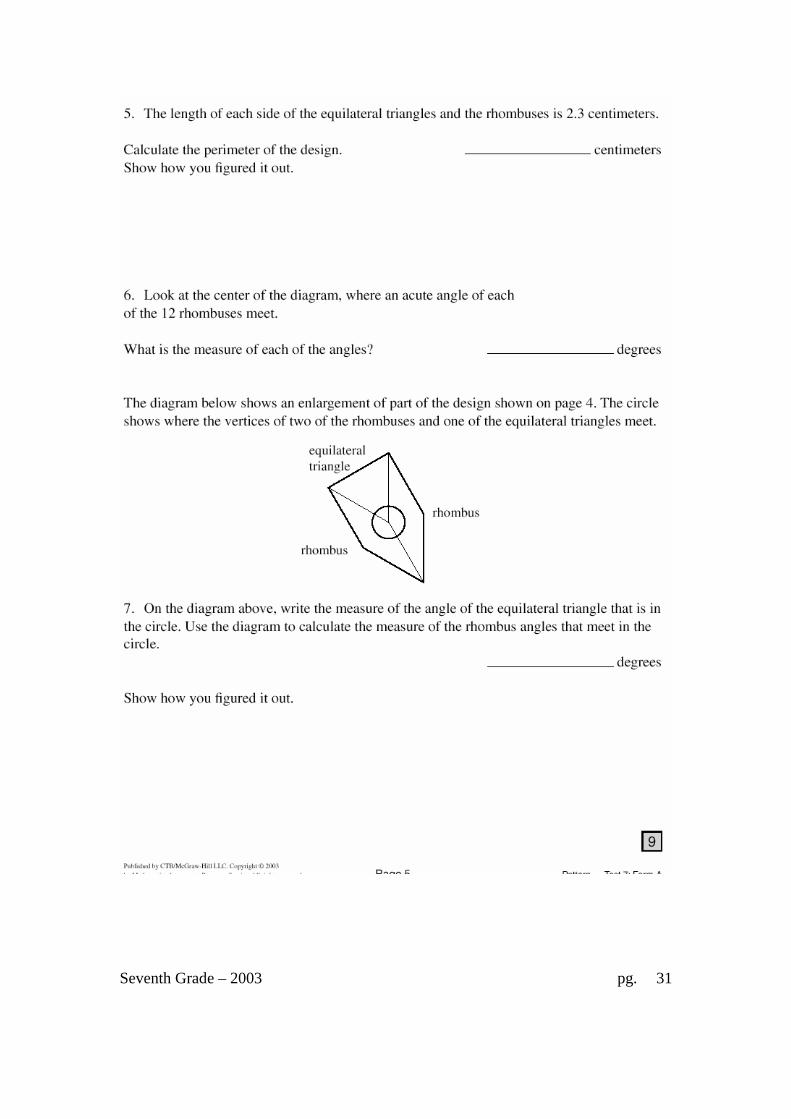
Seventh Grade – 2003 pg. 31

Seventh Grade – 2003 pg. 32

Seventh Grade – 2003 pg. 33
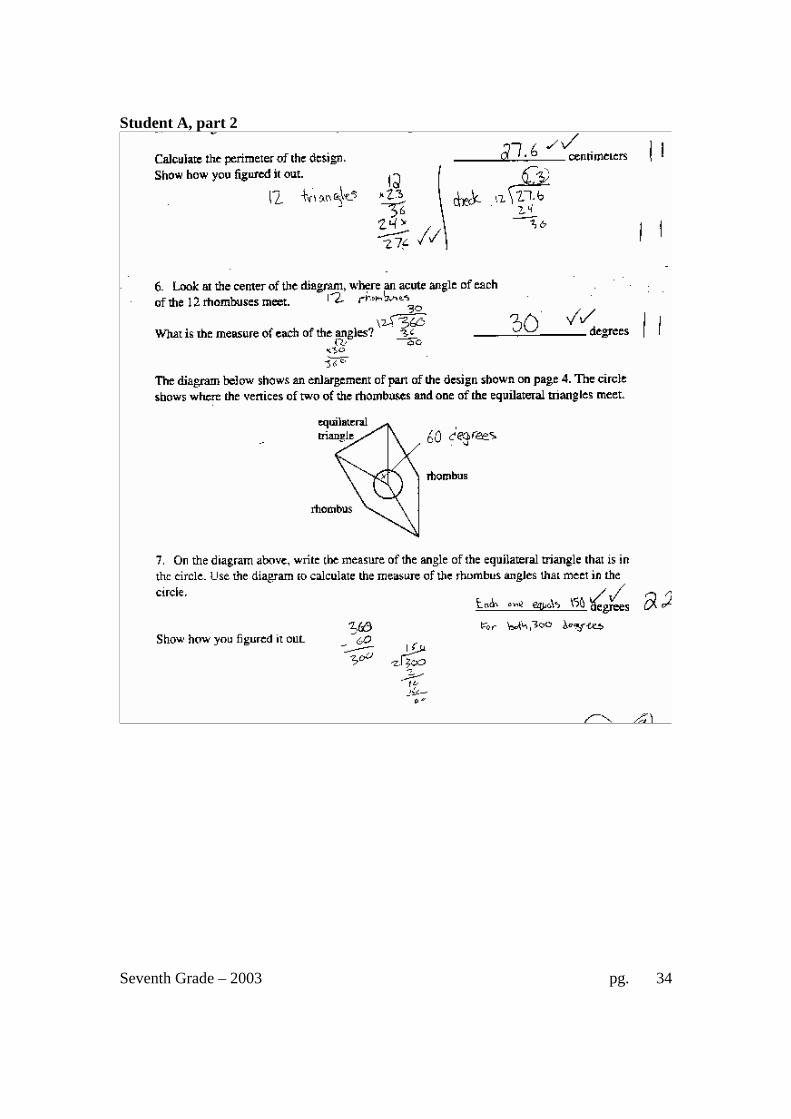
Looking at Student Work – Pattern Pattern was a very difficult problem for students. Many of the errors in Pattern seem to be more an issue of opportunity to learn than misunderstandings. For example, question 4 is the most likely part that students miss to make a difference between getting an 8 or a 9, but it is the second most likely part to be correctly answered by students getting only one point. Student A shows a completely correct response. On the first page the student details how he figured out the degrees in an equilateral triangle, drew and specified the number of lines of symmetry in part 2 and 3, and showed and counted the lines of symmetry in part large design. This clearly shows that while the line of symmetry touches the perimeter twice, the line is only counted one time. The work on the second page is also clearly labeled so that the logic is easily followed by the reader. Student A
Seventh Grade – 2003 pg. 34
Student A, part 2

Seventh Grade – 2003 pg. 35
Student B does a nice job of distinguishing the lines of symmetry for the individual pieces in the large design from the lines of symmetry for the overall design. A common error was for students to confuse these two different ideas and come up with an overall total of 60 lines of symmetry. Student B is a little unclear about the rigor of a mathematical justification. On the second page of the task the student makes a visual assumption about the parts of the design that make up 90 degrees in part 6. While this holds true for this particular case, the student should not assume that because an angle appears to be 90 degrees that it is 90 degrees. In part 7, Student B again makes a visual argument about the size of the angles, rather than making a sound geometric argument. Student B

Seventh Grade – 2003 pg. 36
Student B
Seventh Grade – 2003 pg. 37
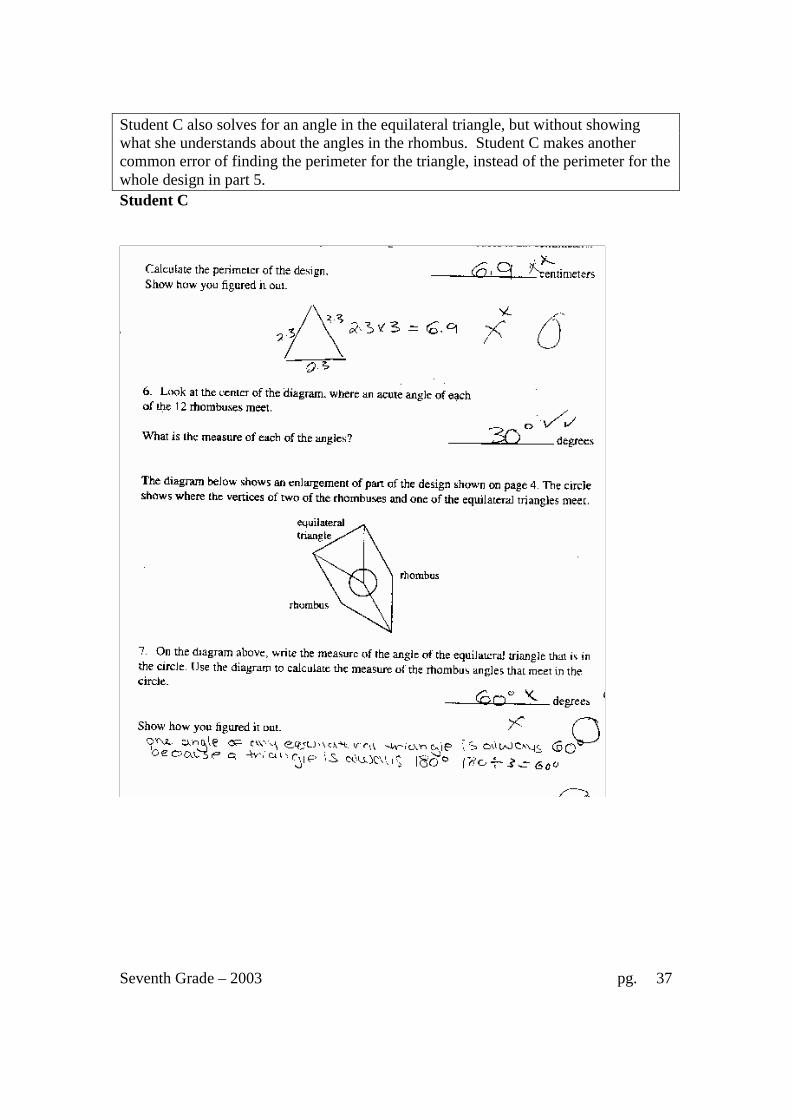
Student C also solves for an angle in the equilateral triangle, but without showing what she understands about the angles in the rhombus. Student C makes another common error of finding the perimeter for the triangle, instead of the perimeter for the whole design in part 5. Student C

Seventh Grade – 2003 pg. 38
Student D shows no understanding of lines of symmetry. In part 2 and 3 the markings on the angles and sides indicate some formal training in geometry, but are unrelated to the issue of symmetry. The responses about angle size also indicate no knowledge about angle size. Student D

Seventh Grade – 2003 pg. 39
Student D, part 2

Seventh Grade – 2003 pg. 40
Student E also shows no knowledge of symmetry or angles. In part 2 and 3 the student draws an angle instead of a line of symmetry. In part 1, 6, and 7 the student confuses measurement of length with measurement of angles. In part 5 the student finds the perimeter for a piece of the design rather than the whole design. Student E

Seventh Grade – 2003 pg. 41
Student E, part 2

Seventh Grade – 2003 pg. 42
Student F mistakenly counts both sides of the same line when trying to determine the total lines of symmetry in part 4. This was a very common error.
Student G mistakes drawing a line of symmetry with making the shape symmetrical in part 2 and 3. Student G
Teacher Notes:
Seventh Grade – 2003 pg. 43
Grade 7 – Pattern
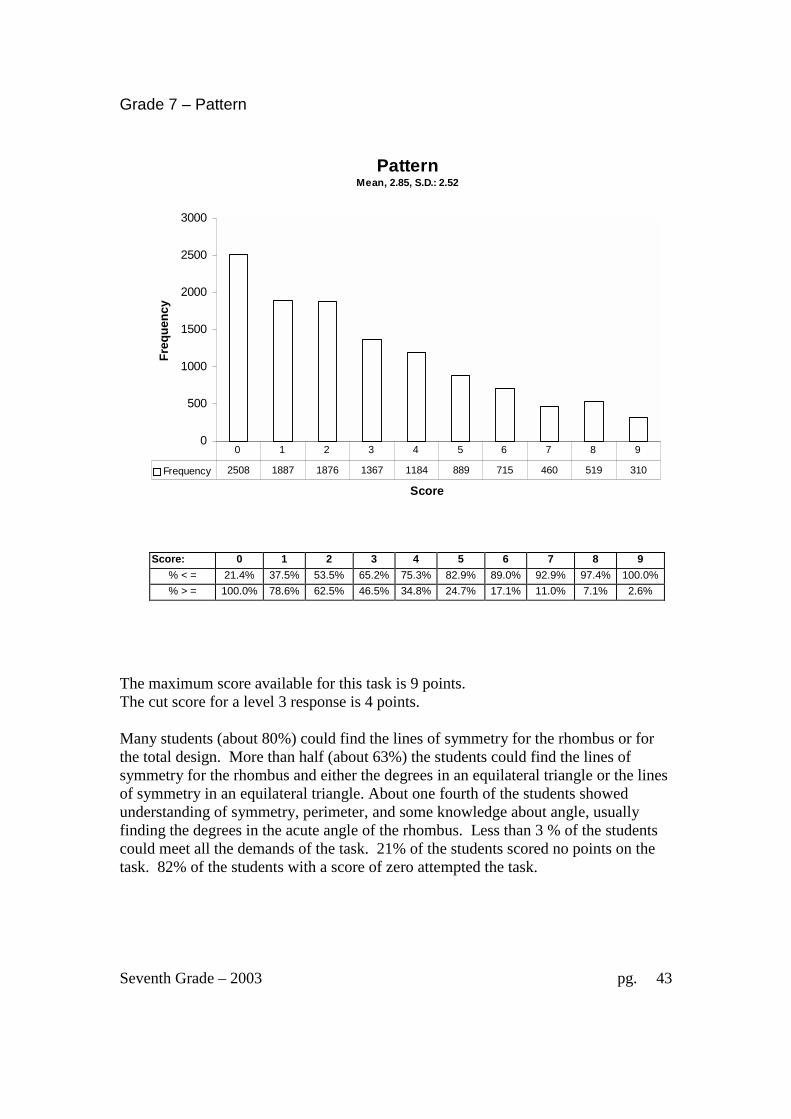
Score: 0 1 2 3 4 5 6 7 8 9 % < = 21.4% 37.5% 53.5% 65.2% 75.3% 82.9% 89.0% 92.9% 97.4% 100.0%% > = 100.0% 78.6% 62.5% 46.5% 34.8% 24.7% 17.1% 11.0% 7.1% 2.6%
The maximum score available for this task is 9 points. The cut score for a level 3 response is 4 points. Many students (about 80%) could find the lines of symmetry for the rhombus or for the total design. More than half (about 63%) the students could find the lines of symmetry for the rhombus and either the degrees in an equilateral triangle or the lines of symmetry in an equilateral triangle. About one fourth of the students showed understanding of symmetry, perimeter, and some knowledge about angle, usually finding the degrees in the acute angle of the rhombus. Less than 3 % of the students could meet all the demands of the task. 21% of the students scored no points on the task. 82% of the students with a score of zero attempted the task.
PatternMean, 2.85, S.D.: 2.52
0
500
1000
1500
2000
2500
3000
Score
Freq
uenc
y
Frequency 2508 1887 1876 1367 1184 889 715 460 519 310
0 1 2 3 4 5 6 7 8 9

Seventh Grade – 2003 pg. 44
Pattern Points Understandings Misunderstandings
0 82% of the students with this score attempted the task.
Many students confused linear measures with angle measures. They did not understand lines of symmetry. They may have put just one line of symmetry instead of all the lines of symmetry, particularly for the equilateral triangle. They may have tried to put three lines of symmetry for the rhombus, trying to make a vertical, horizontal, and diagonal line.
1 Students with this score attained it in every way except part 7 of the task. The most common way was to draw the 2 lines of symmetry for the rhombus in part 3.
The variety of ways students could get the one point suggests more an opportunity to learn issue than a problem with a ramp up in difficulty. While many students got part 4 correct for one point, it was also the hold back between getting an 8 and a 9.
2 In general students could draw the appropriate lines of symmetry in part 2 and 3 of the task.
Many students showed no understanding of angles. They may have guessed at incorrect numbers or tried to add the lengths of the sides to calculate the degrees.
4 Students generally knew that there were 60 degrees in an angle for an equilateral triangle, could draw the correct line of symmetry for either the triangle or the rhombus, and find and show the work for the perimeter for the whole design.
Many students tried to find the perimeter of just the triangle, rhombus, or a small portion of the design instead of the total design.
5 Students could draw the lines of symmetry for the triangle and rhombus, calculate the perimeter of the design, and find the degrees in the acute angle of the rhombus. They knew there were 360 degrees in a circle, which is different from knowing the degrees in a triangle.
Students missed the number of degrees in the equilateral triangle, the number of lines of symmetry in the whole design, and the degrees in the angle of the rhombus in part 7. The most common error for part 4 was to count both ends of the line of symmetry as they counted around the shape to get 24 instead of 12.Another common error in part 4 was to add the number of lines of symmetry for all the triangles and rhombi together to get 60 instead of looking at the lines of symmetry for the whole shape.
Seventh Grade – 2003 pg. 45
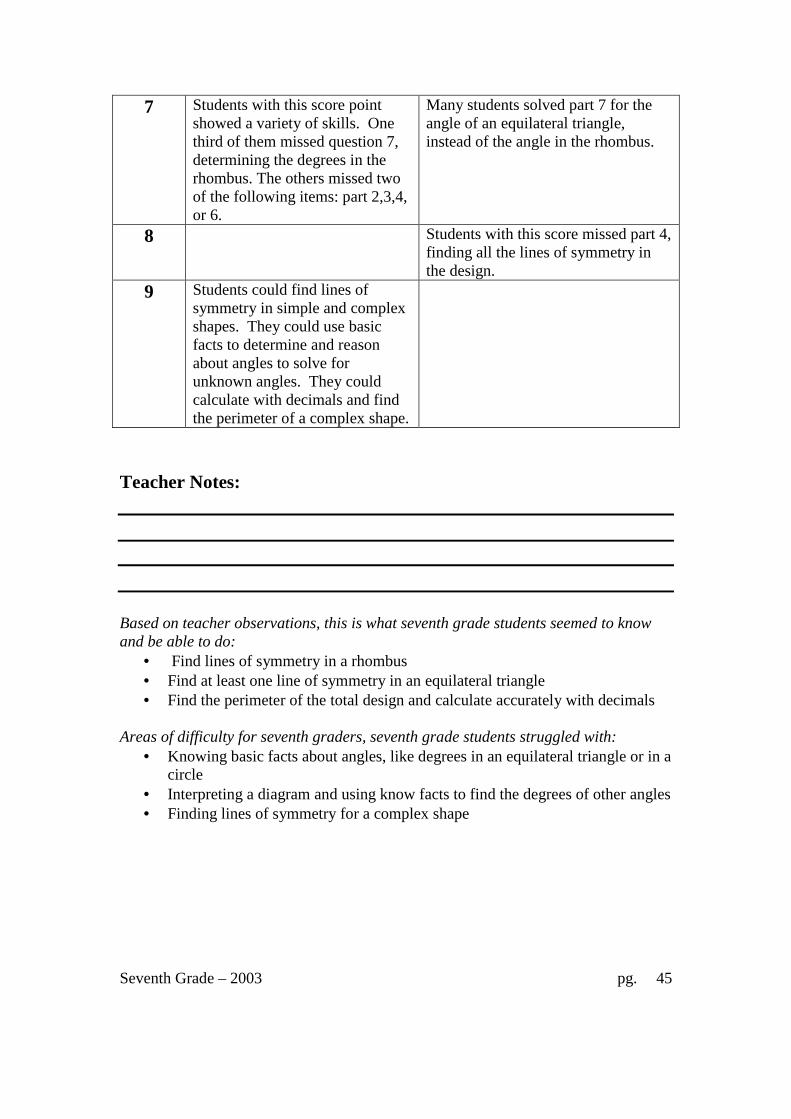
7 Students with this score point showed a variety of skills. One third of them missed question 7, determining the degrees in the rhombus. The others missed two of the following items: part 2,3,4, or 6.
Many students solved part 7 for the angle of an equilateral triangle, instead of the angle in the rhombus.
8 Students with this score missed part 4, finding all the lines of symmetry in the design.
9 Students could find lines of symmetry in simple and complex shapes. They could use basic facts to determine and reason about angles to solve for unknown angles. They could calculate with decimals and find the perimeter of a complex shape.
Teacher Notes: Based on teacher observations, this is what seventh grade students seemed to know and be able to do:
• Find lines of symmetry in a rhombus • Find at least one line of symmetry in an equilateral triangle • Find the perimeter of the total design and calculate accurately with decimals
Areas of difficulty for seventh graders, seventh grade students struggled with:
• Knowing basic facts about angles, like degrees in an equilateral triangle or in a circle
• Interpreting a diagram and using know facts to find the degrees of other angles • Finding lines of symmetry for a complex shape

Seventh Grade – 2003 pg. 46
Questions for Reflection on Pattern: • What opportunities have your students had to work with geometry this year? • Do they get opportunities to work with interpreting complex diagrams and
solving for angle measurements? • Do students in your class work with protractors or estimating angle size? • Have students worked with symmetry this year? • When presenting geometric shapes, do you make a point to change orientation
of shapes so that the edges are not always aligned with the edges of the paper or book?
• What are some of the things you want to remember to improve your unit for next year?
Teacher Notes: Instructional Implications: Students need more opportunities to analyze compound geometric figures. Students need a variety of experiences such as folding papers, building designs with blocks, using mirrors to illustrate line of symmetry. Students had difficulty identifying which part of a complex design related to the perimeter of the shape. Some students tried to find the perimeter of all the individual pieces, instead of thinking about the shape as a whole unit. Students also struggled with angle measurement. They could not apply information about the number of degrees in a triangle or number of degrees in a circle to a problem-solving situation. Students at this grade level should be comfortable working with much more complex ideas about angles and angle properties, like understanding vertical angles and alternating angles. Even student guesses showed limited knowledge of basic angle measurement, such as previous experience with protractors. Even if answers were considered estimates, they were often too far off to be reasonable. Teacher Notes:

Seventh Grade – 2003 pg. 47
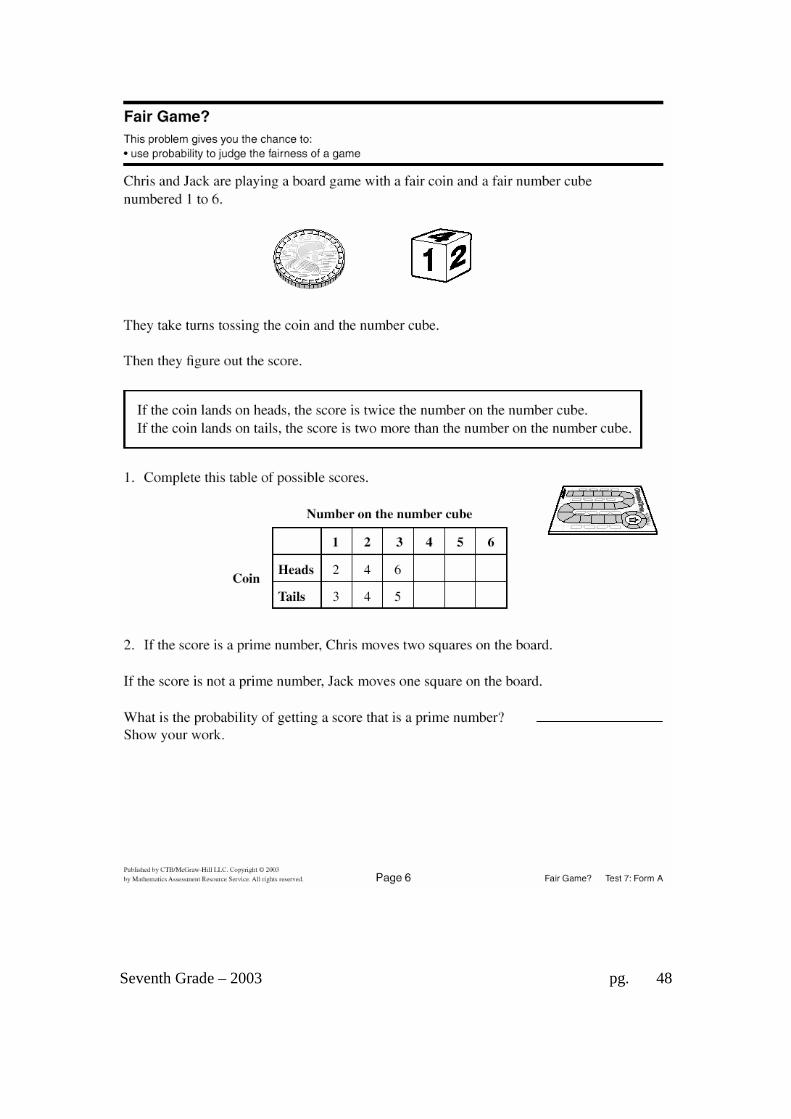
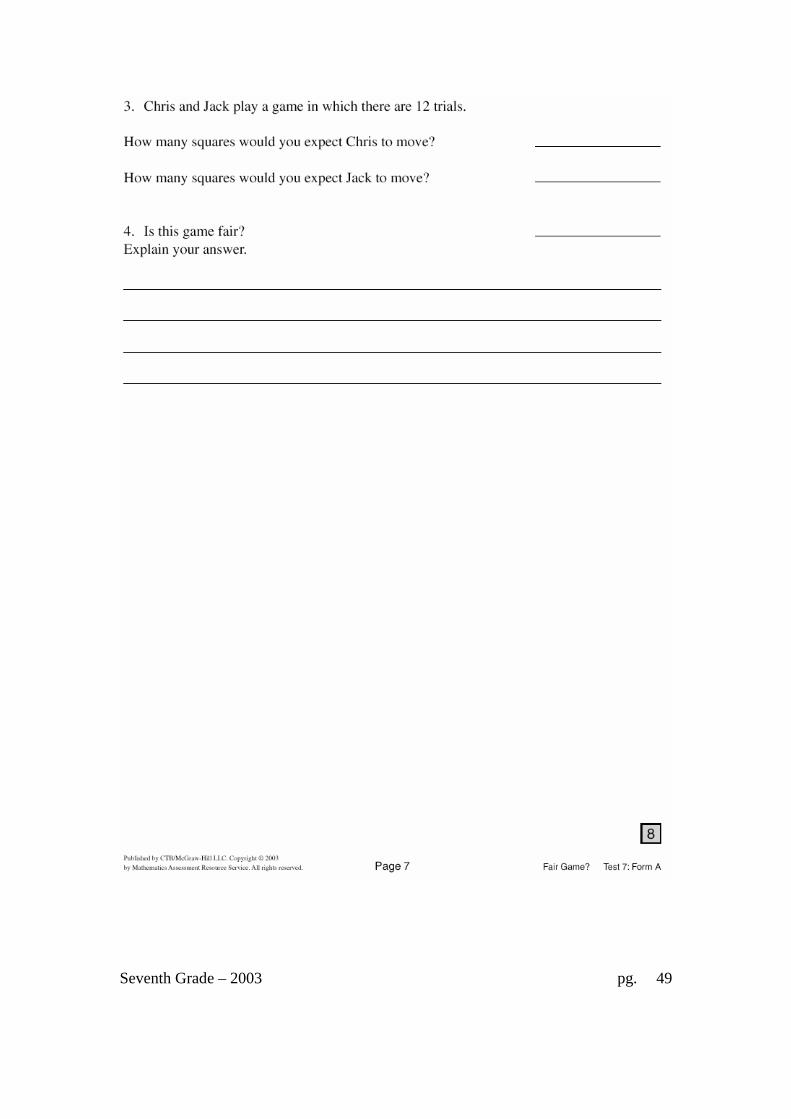
7th grade Task 4 Fair Game? Student Task
Use probability to judge the fairness of a game involving a dice and coin toss.
Core Idea 2 Probability
Apply and deepen the understanding of theoretical and empirical probability.
• Represent the sample space for simple and compound events in an organized way (table, diagram, organized list, and tree diagram) and express the theoretical probability of each outcome.
• Use data to estimate the probability of future events. • Know the relationship between the probability of an event
and its complement (i.e., if the probability of an event is P, then the probability of the event not occurring is 1-P.
• Determine theoretical probabilities and use these to make predictions about events.
Seventh Grade – 2003 pg. 48
Seventh Grade – 2003 pg. 49

Seventh Grade – 2003 pg. 50

Seventh Grade – 2003 pg. 51
Fair Game California State Standards and Textbooks expect mastery of probability in 6th grade and retention of those skills to last until the high school exit exam. However, results show that many students need more than one year to learn this concept. Student A shows a nice job of listing all the outcomes in the sample space and clearly defining the prime numbers in part 2. Student A also shows facility with multiplying fractions and applying the rules of the game in part 3. The student does a good job of explaining the relationship between the rules for spaces moved and the differing probabilities to make the game fair. Student A

Seventh Grade – 2003 pg. 52
Student B also demonstrates a complete knowledge of probability. The only error in her thinking is to forget that 2 is a prime number in part 2 of the task. This error in finding probability affects further calculations. Student B
Seventh Grade – 2003 pg. 53
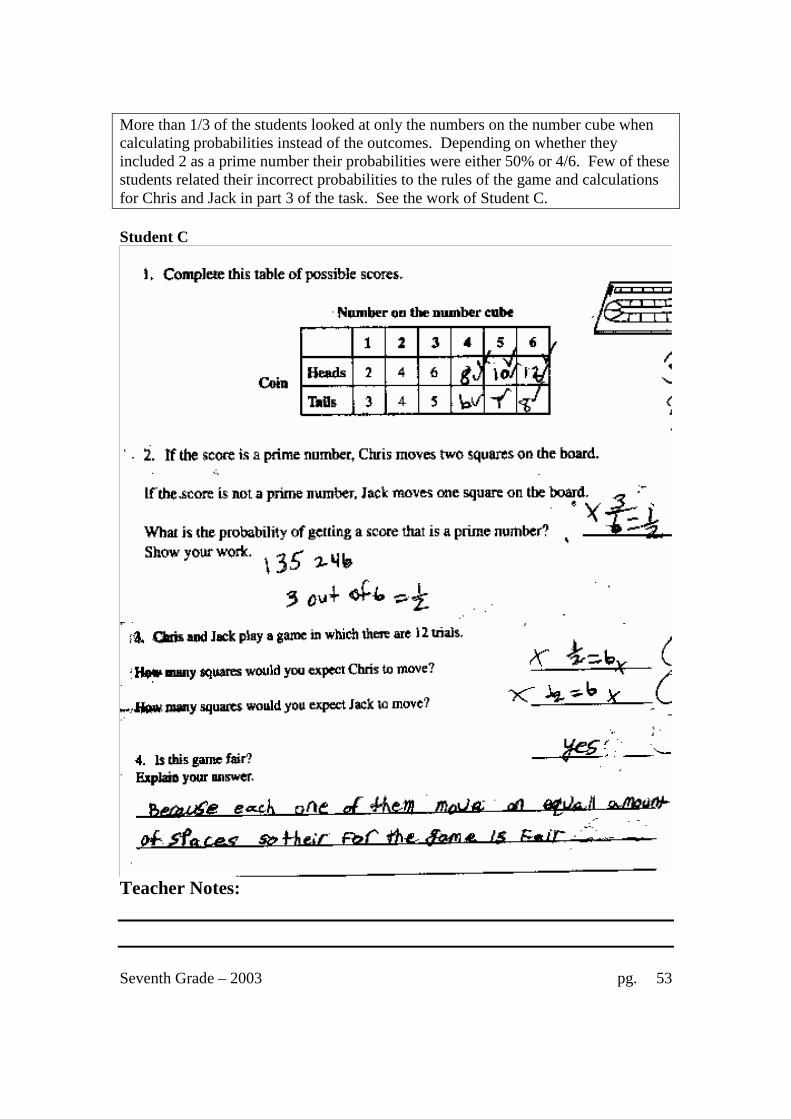
More than 1/3 of the students looked at only the numbers on the number cube when calculating probabilities instead of the outcomes. Depending on whether they included 2 as a prime number their probabilities were either 50% or 4/6. Few of these students related their incorrect probabilities to the rules of the game and calculations for Chris and Jack in part 3 of the task. See the work of Student C. Student C
Teacher Notes:

Seventh Grade – 2003 pg. 54
Grade 7 – Fair Game?
Score: 0 1 2 3 4 5 6 7 8 % < = 9.6% 12.9% 14.4% 67.6% 80.1% 86.8% 92.0% 93.6% 100.0% % > = 100.0% 90.4% 87.1% 85.6% 32.4% 19.9% 19.9% 8.0% 6.4%
The maximum score available for this task is 8 points. The cut score for a level 3 response is 4 points. Many students (about 85%) could apply the two different rules to fill out the table of outcomes. Less than 20% could find the number of primes and correctly calculate the probability for getting a prime. Less than 10% of the students could meet all the demands of the task. 10% of the students scored no points on this task. 5% of the students appeared to have run out of time, because there is no work on task 4 or task 5.
Fair Game?Mean, 3.43, S.D.: 1.88
0
1000
2000
3000
4000
5000
6000
7000
Score
Freq
uenc
y
Frequency 1129 380 178 6234 1458 786 611 186 753
0 1 2 3 4 5 6 7 8

Seventh Grade – 2003 pg. 55
Fair Game? Points Understandings Misunderstandings
0 About half the students with this score attempted the problem. The other half appear to have run out of time.
Students with this score did not read the rules carefully for getting heads and tails. Many just made a pattern of even numbers and odd numbers or going up one every time.
1 Students could get the table right for heads.
Students did not understand the rules for changing the number of the cube is a tails was tossed.
3 Students could fill out the table correctly.
About 22% of the students calculated the probability of based on the numbers on the cube instead of the numbers in the table. Most also forgot that 2 was a prime number, so their probability was 1/2 or 50%. Another 14% used the table but forgot to count 2 as a prime number and therefore had 1/4 or 3/12 as their probability. 14% of the students wrote probabilities as whole numbers.
4 Students could fill out the table and explain why the game is fair in part 4.
5 Students could fill out the table and show correct thinking for finding the probability in part 2.
Students could not use their probabilities (right or wrong) to find theoretical probabilities and then correctly apply the rules for moving to determine the outcome of the game. There was not a consistent pattern for these errors. In some cases the students just added two to one persons score, doubled both scores, thought the total moves should be 12, or other strategies.
8 Students could fill out the table using different rules for heads and tails, find the probability of getting a prime number, and find the theoretical probability of each student moving in 12 turns and apply the different rules for their movement. Students could clearly explain why the game was fair even though the 2 players had different probabilities for getting to move.
Seventh Grade – 2003 pg. 56
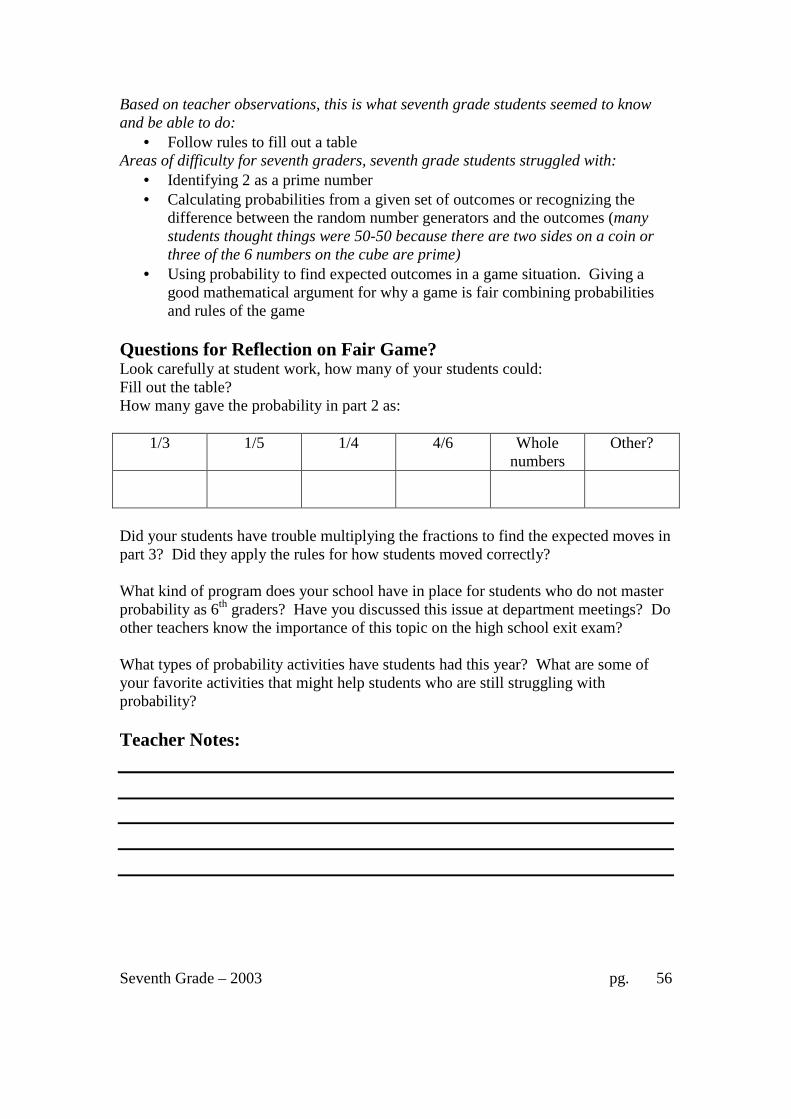
Based on teacher observations, this is what seventh grade students seemed to know and be able to do:
• Follow rules to fill out a table Areas of difficulty for seventh graders, seventh grade students struggled with:
• Identifying 2 as a prime number • Calculating probabilities from a given set of outcomes or recognizing the
difference between the random number generators and the outcomes (many students thought things were 50-50 because there are two sides on a coin or three of the 6 numbers on the cube are prime)
• Using probability to find expected outcomes in a game situation. Giving a good mathematical argument for why a game is fair combining probabilities and rules of the game
Questions for Reflection on Fair Game? Look carefully at student work, how many of your students could: Fill out the table? How many gave the probability in part 2 as:
1/3 1/5 1/4 4/6 Whole numbers
Other?
Did your students have trouble multiplying the fractions to find the expected moves in part 3? Did they apply the rules for how students moved correctly? What kind of program does your school have in place for students who do not master probability as 6th graders? Have you discussed this issue at department meetings? Do other teachers know the importance of this topic on the high school exit exam? What types of probability activities have students had this year? What are some of your favorite activities that might help students who are still struggling with probability? Teacher Notes:

Seventh Grade – 2003 pg. 57
Instructional Implications: Students need more experiences with games and probability. Students do not know how to combine two events, like tossing a coin and a number cube, to find the probability. They confuse the random number generators with the outcomes. While students can complete tables showing what is possible, they have difficulty determining how to answer questions based on that table. When it is possible to move a different number of spaces for each player, they don’t know how to use that information to determine who has a better chance of winning. Students do not understand that probability or expected outcomes are determined by a large number of events. To compare whether a game is fair, the outcomes of several games needs to be considered. Students also needed to know mathematical vocabulary like prime number, fair, and trial to work this problem successfully. Teacher Notes:
Seventh Grade – 2003 pg. 58
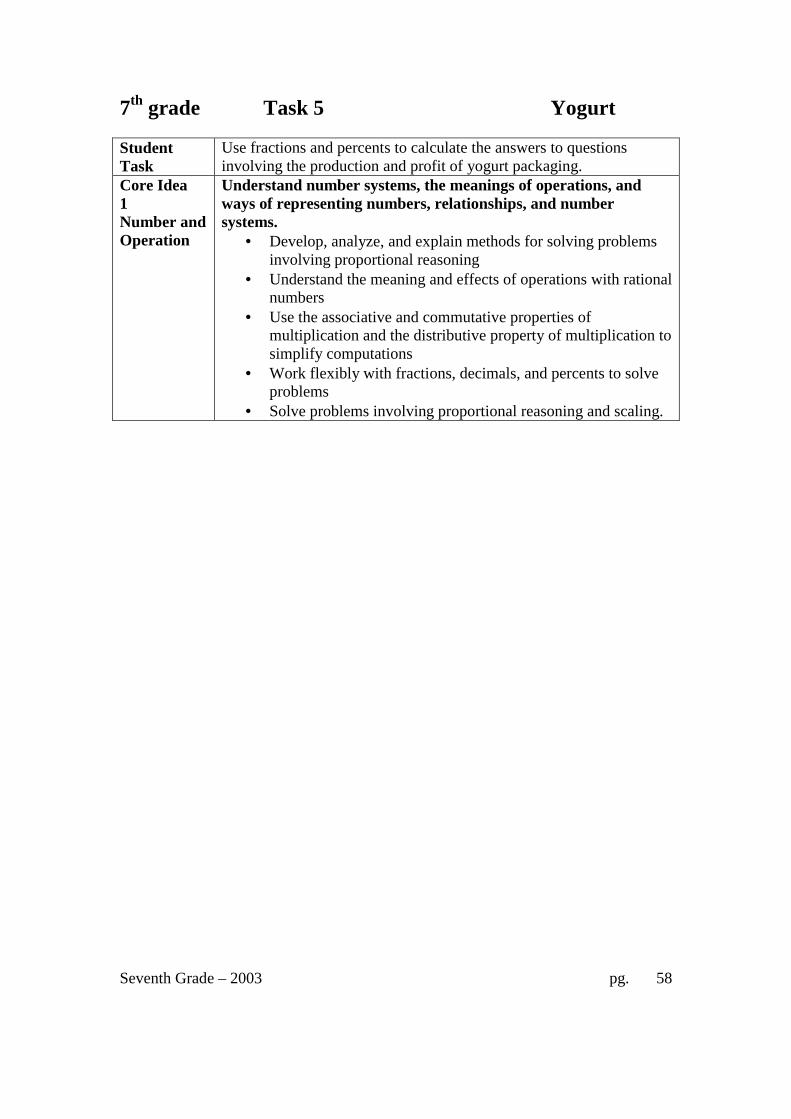
7th grade Task 5 Yogurt Student Task
Use fractions and percents to calculate the answers to questions involving the production and profit of yogurt packaging.
Core Idea 1 Number and Operation
Understand number systems, the meanings of operations, and ways of representing numbers, relationships, and number systems.
• Develop, analyze, and explain methods for solving problems involving proportional reasoning
• Understand the meaning and effects of operations with rational numbers
• Use the associative and commutative properties of multiplication and the distributive property of multiplication to simplify computations
• Work flexibly with fractions, decimals, and percents to solve problems
• Solve problems involving proportional reasoning and scaling.

Seventh Grade – 2003 pg. 59

Seventh Grade – 2003 pg. 60

Seventh Grade – 2003 pg. 61

Seventh Grade – 2003 pg. 62
Looking at Student Work – Yogurt There are four big ideas in the Yogurt problem: a) the ability to use knowledge of rate, b) choosing an appropriate operation for converting measurements, c) understanding percents, and d) being able to find percent increase. Student A does a good job of explaining procedures for each step of the task and giving a rational for each step. In part 2 of the task, the student clearly labels each step in the conversion from 1/2-cup containers to gallons. Student A is one of many students who struggle with percents in part 4. It was quite common to get answers in gallons or dollars instead of percents.
Student A

Seventh Grade – 2003 pg. 63
Student A

Seventh Grade – 2003 pg. 64
Some students forgot that the yogurt came in 1/2-cup containers. Those students divided by 16 instead of 32. See the work of Student B. Note that Student B also misreads the percent of profit.
Student B
One of the most common errors was to ignore most of the conversion factors and just use the 4 quarts equals one gallon. Students didn’t stop to think, “What size quantity am I starting with?” See the work of Student C. Student C

Seventh Grade – 2003 pg. 65
Many students could not conceptualize the idea that as the units change from smaller to larger, the quantity of the unit would decrease. They incorrectly chose division instead of multiplication. Student D has correctly reasoned about the relationship between the different quantities. Student D
Seventh Grade – 2003 pg. 66
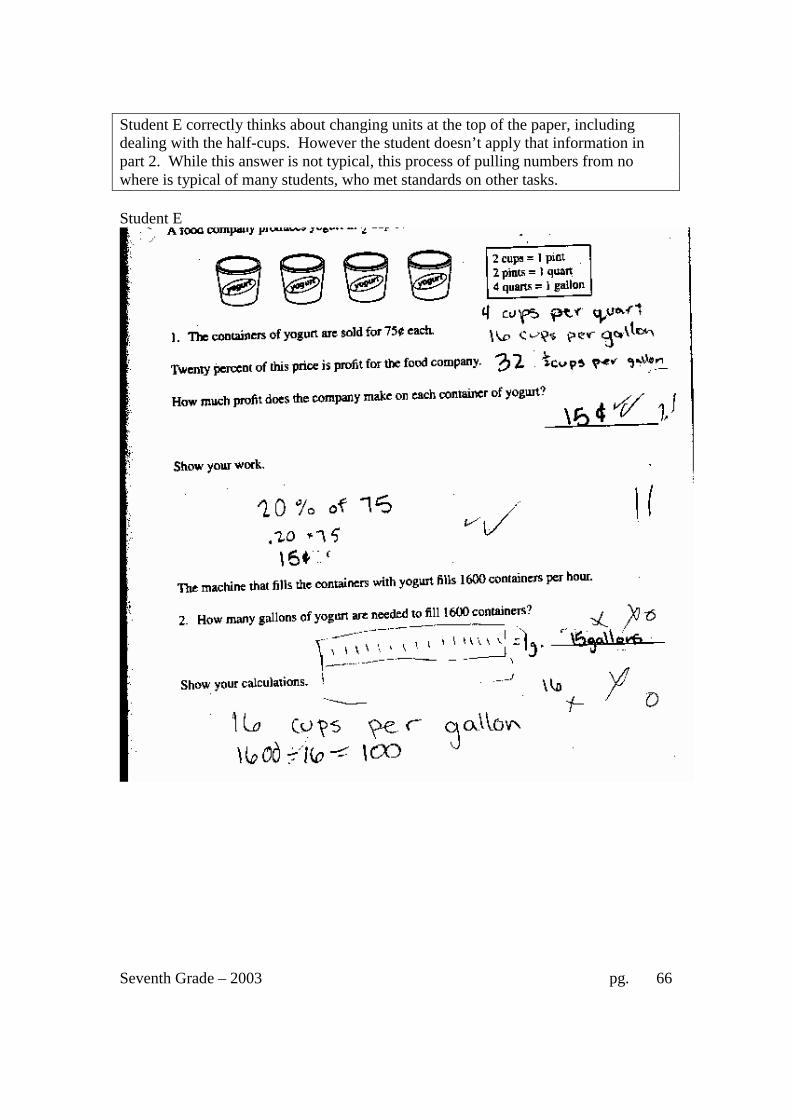
Student E correctly thinks about changing units at the top of the paper, including dealing with the half-cups. However the student doesn’t apply that information in part 2. While this answer is not typical, this process of pulling numbers from no where is typical of many students, who met standards on other tasks. Student E
Seventh Grade – 2003 pg. 67
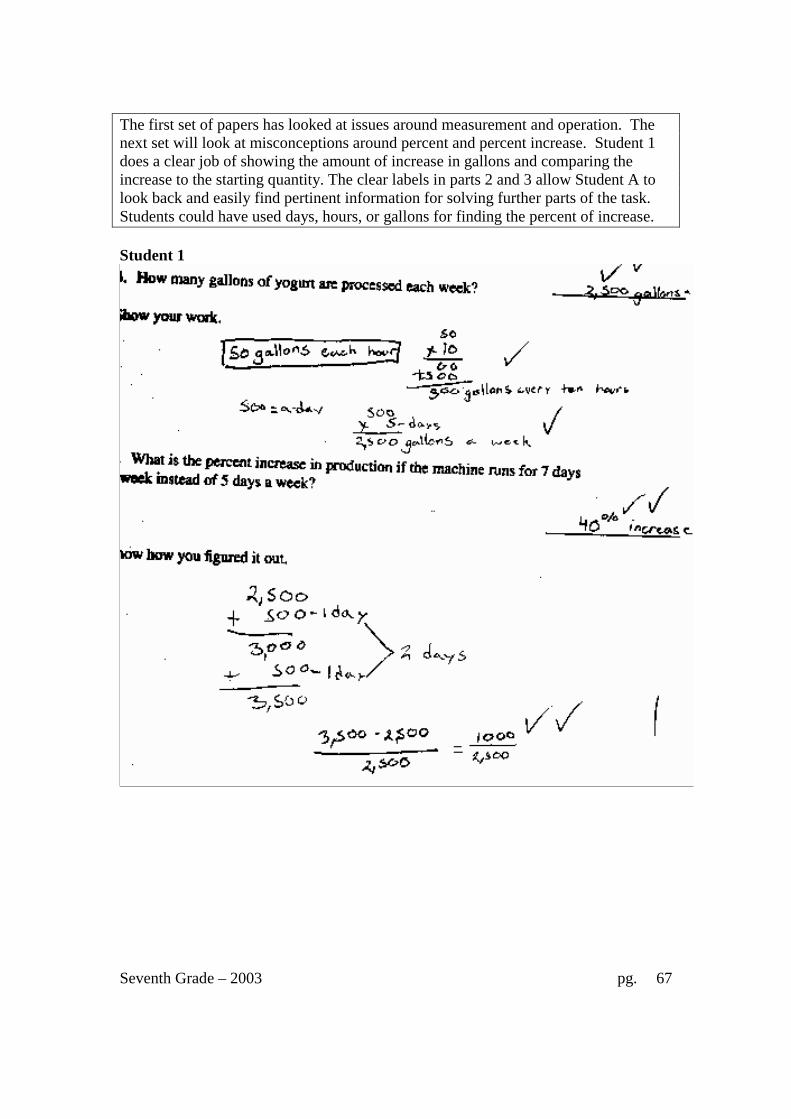
The first set of papers has looked at issues around measurement and operation. The next set will look at misconceptions around percent and percent increase. Student 1 does a clear job of showing the amount of increase in gallons and comparing the increase to the starting quantity. The clear labels in parts 2 and 3 allow Student A to look back and easily find pertinent information for solving further parts of the task. Students could have used days, hours, or gallons for finding the percent of increase. Student 1

Seventh Grade – 2003 pg. 68
Because the relationships between 5 days and 7 days remains constant, errors in conversion do not affect the outcome for finding percents. See the work of Student 2. Student 2

Seventh Grade – 2003 pg. 69
Many students failed to find the amount of increase. Student 3 shows that the relationship between gallons and days is the same. The student fails to subtract to find amount of increase and uses the final amount for calculating the percentage instead of using the starting amount as the base. Student 3 also fails to change the ratio to a percent. Student 4 makes one of the most frequent errors getting 71% or trying to find an increase and getting 29%. Student 3
Student 4

Seventh Grade – 2003 pg. 70
Student 5 finds the correct number of gallons for 7 days, but fails to compare that to the gallons for 5 days. Student 6 does find the amount of increase, but does not know how to calculate a percentage. Student 5
Student 6
Seventh Grade – 2003 pg. 71
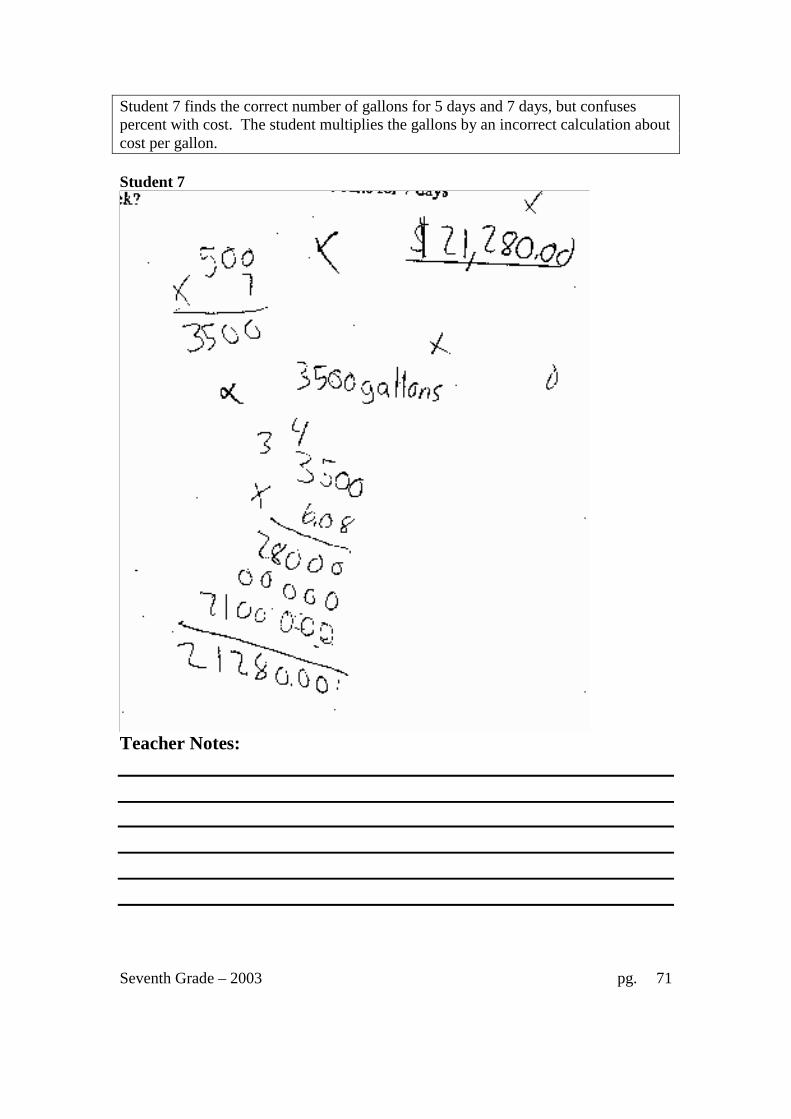
Student 7 finds the correct number of gallons for 5 days and 7 days, but confuses percent with cost. The student multiplies the gallons by an incorrect calculation about cost per gallon. Student 7
Teacher Notes:

Seventh Grade – 2003 pg. 72
Grade 7 – Yogurt
Score: 0 1 2 3 4 5 6 7 8 % < = 50.3% 54.9% 70.8% 73.5% 85.0% 86.6% 95.3% 96.0% 100.0% % > = 100.0% 49.7% 45.1% 29.2% 26.5% 15.0% 15.0% 4.7% 4.0%
The maximum score available for this task is 7 points. The cut score for a level 3 response is 4 points. About half the students could find 20% of a number, although there might have been errors in monetary notation. Some students used a percent sign for the answer instead of cents. Others combined decimal points and cent signs. About 30% of the students could correctly find 20% of a number using correct monetary notation and find the correct relationship between gallons per hour and gallons for 5 days or could correctly convert from 1/2-cup containers to gallons per hour to gallons per week. Less than 5% of the students could meet all the demands of the task. Almost 50% of the students scored no points on this task. While time may have been an issue for some students with this score, almost 80% of the students with a score of zero attempted the task.
YogurtMean: 1.88, S.D.: 2.38
0
1000
2000
3000
4000
5000
6000
7000
Score
Freq
uenc
y
Frequency 5888 547 1859 315 1344 191 1021 87 463
0 1 2 3 4 5 6 7 8

Seventh Grade – 2003 pg. 73
Yogurt Points Understandings Misunderstandings
0 Almost 50% of all students received this score. 80% of those students attempted the task.
Students misread twenty percent and found 25%. Students did not know how to find 20% of a number. Students confused percents and cents or could not use monetary notation. In doing conversions, they may have added numbers in the table to get 8 instead of seeing the relationship as multiplicative.
2 About 60% of the students with this score, could multiply an incorrect answer in part 2 by 10 and then by 5 to find the gallons per week. Forty percent of the students with this score could find 20% profit and use proper monetary notation.
Many students forgot to make the conversion from half-cups to whole cups. Others only used the 4 qts. = 1 gall and divided by 4. Many students picked multiplication instead of division as the operation for converting from half-cups to gallons.
4 Students could find the correct gallons in part 2 and 3 or they could find 20% profit and do the correct process in part 3.
Students do not understand percentage increase. Many students gave an answer in gallons or dollars for part 4.
6 Most students could successfully complete parts 1,2, and 3.
Students could not understand all the parts of finding percent increase. They usually tried to compare the amount for 5 days to the amount for 7 days. Few did the subtraction to find the amount of increase or knew to use the starting amount for calculating the percentage.
8 Students could find percent profit and percent increase. Students could recognize the relationships between size of units and pick appropriate operation for converting among units.

Seventh Grade – 2003 pg. 74
Based on teacher observations, this is what seventh grade students seemed to be able to do:
• Convert from gallons per hour to gallons per week • Find 20% profit and use correct monetary notation
Areas of difficulty for seventh graders, seventh grade students struggled with:
• Converting among different units of measurement • Choosing the appropriate operation for converting between units of
measurement • Calculating the amount of increase before attempting to calculate the percent
of increase • Using the final amount to calculate the percent of increase instead of using the
starting amount as the base • Knowing how to calculate a percentage
Questions for Reflection on Yogurt: • Did you allow adequate time for your students to do all the tasks on the test? • Did your students have calculators available to use on the test? • Could your students find the 20% of a number? Did any of them mislabel
their answers with % or decimal and a cent sign? Looking at their work in part 4, how many of the students were able to do some of the steps in finding the percent increase? Made attempt to find quantity for 7 days (gal, hours, days)
Found the amount of increase
Compared the increase to the amount for 5 days
Compared the amount for 5 days to the amount for 7 days
Gave a response in gallons or $ instead of a percentage
Other
• How do you teach students percents in a way that helps them make sense
of the meaning? Do students see percents as a way of comparing sizes and change? What might be some things you were like to do differently when you teach next year? Do you know any good resources to help students understand the meaning of percents as tools rather than memorizing a definition of parts out of 100?
• What opportunities do students have to work with units of measurement and conversion among measurement this year?
• Do you use any types of modeling to help students make sense of operation when doing conversions? What other sense-making strategies do you use to help students with this process? What surprised you when you looked at student work?
• What experiences do students have distinguishing between finding a percent, percent increase, and percent discount? What types of models do they have to help them make sense of these different situations?

Seventh Grade – 2003 pg. 75
Teacher Notes: Instructional Implications: Students need more practice converting between different measurements. Many students are unfamiliar with cups, pints, quarts, and gallons. Students also have trouble working with detailed calculations. They need a strategy like labeling, to help them keep track of what their answer means, what quantity they have calculated, and what is still left to do. They also need more work around number operations. Many students multiplied instead of dividing to make their conversions. Students also need to develop a conceptual understanding of percents in a variety of contexts. They should have a variety of strategies for thinking and reasoning about percents. Further students do not show an understanding of looking at increase and comparing it to the base amount. They need to develop an understanding of percent as a tool for comparing quantities and understanding change, not as just parts of 100 or an algorithm. They need to do more reasoning on the use and purpose for percents.