overall design report of sediment monitoring system
TRANSCRIPT
SANAKHAM HYDROPOWER PROJECT
Overall Design Report of Sediment Monitoring System
October 2018

Sanakham Hydropower Project Overall Design Report of Sediment Monitoring System
I
Contents
1 Outline ............................................................................................................................................ 1
1.1About the Project ................................................................................................................. 1
1.2 Sediment Issues and Reservoir Desilting Operation Mode ................................................. 1
1.3 Automatic System of Hydrological Data Acquisition and Transmission ............................ 3
2 Purposes and Contents of Sediment Monitoring Plan .................................................................... 4
2.1 System Purposes ................................................................................................................. 4
2.2 Design Principles and Bases ............................................................................................... 4
2.3 Main Monitoring Contents .................................................................................................. 5
3 Sediment Monitoring Programming .............................................................................................. 5
3.1 Sediment monitoring at inflow stations and outflow stations ............................................. 5
3.1.1Arrangement of monitoring stations ......................................................................... 5
3.1.2 Equipment configuration and civil works ................................................................ 6
3.2 Dam-front and Reservoir Area Water Surface Profiles Monitoring .................................... 8
3.2.1 Layout of stations ..................................................................................................... 8
3.2.2 Equipment installation and civil works .................................................................... 9
3.3 Reservoir baseline survey ................................................................................................... 9
3.4 Damsite Area Topography Monitoring (Power Intake & Approach Channel) .................. 10
3.5 Downstream River Course Topography Monitoring ......................................................... 11
3.6 Reservoir Area Landslide Deformation Body Monitoring ................................................ 11
3.7 Monitoring Requirements ................................................................................................. 11
3.8 Main Monitoring Results .................................................................................................. 12
4 Staffing ................................................................................................................................. 12
5 Cost Estimate ....................................................................................................................... 12

Sanakham Hydropower Project Overall Design Report of Sediment Monitoring System
II
List of Tables
Name of Tables Page
Table 1.1 List of telemetry stations of ASHDCT of Sanakham HPP 3
Table 3.1 List of instruments and civil works for inflow station 6
Table 3.2 List of level gauging instruments/equipment and civil works 9
Table 3.3 List of survey instruments and software 10
Table 5.1 Cost estimate for sediment monitoring program at Sanakham reservoir
(CNY) 14
List of Figures
Name of Figures Page
Figure 1.1 Hydrological (gauging) station network distribution map 4

Sanakham Hydropower Project Overall Design Report of Sediment Monitoring System
1
1 Outline
1.1About the Project
Sanakham Hydropower Project is the 5th cascade project planned on the main stream of the Mekong
River in Laos. The project site is located on the main stream of the Mekong River 1.4km upstream of
Village Pakheung in District Kenthao, Province Sayaburi, Lao People's Democratic Republic. The
Mekong River at the project site is on border of Province Sayaburi and Province Vientiane, District
Kenthao of Province Sayaburi is located at the right bank, District Sanakham of Vientiane Province is
located at the left river bank. The dam site is located about 1737km away from the Mekong estuary,
about 155km away from the downstream Vientiane, 99km away from the upstream of the Pak Lay
project, and about 25km to the Sanakham county seat. There is a simple access road linking to the dam
site. The outbound condition is rather convenient. The river course at the dam site is broad and wide,
and the area in vicinity of the project area is sparsely populated.
Sanakham Hydropower Project is developed mainly for power generation that will be of benefit to river
navigation and fish pass, the major structures include powerhouse, sluice gate, 500t navigation lock, fish
pass and etc. Normal water level is 220MSL, total installed capacity of the power station is 684MW,
average annual energy output is 3.803 TW.h with annual utilization 5560h. A total of 12 bulb turbines
with a discharge of 5801m3/s are intended.
1.2 Sediment Issues and Reservoir Desilting Operation Mode
(1)Sediment issues
Sanakham reservoir has the design normal water level of El. 220 m, which corresponds to a storage
capacity of 827 million m3. As the ratio of reservoir volume to the oncoming sediment is 15, it should
belong to a reservoir with serious sediment problem. But the sediment concentration of inflow is low
(averagely, 0.496 kg/m3); it is a river-like reservoir; dammed water depth is small (about 16 m in the
case of mean annual discharge, and about 11 m in the case of mean flood season discharge); and sediment
delivery rate is larger when the reservoir is in operation (the yearly average sediment delivery ratio
during initial operating stage exceeds 70%, and the average sediment delivery ratio during the first 50
years exceeds 90%). Reservoir sedimentation shall be so design as to keep it well controlled, reduce
backwater inundation and inundation extent, and enable reservoir backwater in good connection with
the tail water of upstream Pak Lay Hydropower Station. In order to study the influence of operating
mode on the reservoir backwater extent under sedimentation, backwater calculation shall be carried out
under different operating alternatives for the comparison of characteristic water levels. Since the dam
has a longer water intake section, and the intakes are low in elevation, sediment flushing outlets should
be furnished beneath the intakes to remove the sediments deposited before the intakes, ensuring the safe
operation of the project.
(2)Reservoir desilting operation mode
According to the CNR independent review comments as well as the expert's review comments on the
updated Feasibility Study Report in 2016, the general layout of the project structures has been adjusted as

Sanakham Hydropower Project Overall Design Report of Sediment Monitoring System
2
follows:
The major structures are arranged in sequence from left bank to right bank as: left concrete auxiliary dam,
ship lock dam section, left sluice dam section (13 sluices), riverbed powerhouse dam section (12 units),
right sluice dam section (5 sluices), and right concrete auxiliary dam. The dam has the maximum height
of 56.2m, and an overall length of 909.90m at the dam crest elevation of 229.50m.
The powerhouse dam section has an overall length of 350.20m, in 8 sub-sections, composed of the
auxiliary erection bay dam section, the 1#~12# units powerhouse dam section, and the main erection bay
dam section in order from left to right.
18 sluice outlets altogether (13 outlets in the opening size of 15m×22m (W×H) arranged at the left
terrace and flood plain and 5 outlets in the opening size of 12.5m×16m (W×H) set at the right side),are
divided as 11 dam sections, and have an overall length of 341.50m (left sluice 250m+ right sluice
91.50m). The left side of the right flood outlets neighbors the powerhouse dam section, the right side
abuts on the fish pass outlet dam section, and the 5 outlets will adopt the hydraulic jump energy
dissipation method. Among the 13 outlets at the left side, 5 of them against the powerhouse dam
section will have the hydraulic jump energy dissipation method, and the remaining flood outlets will
apply the surface flow energy dissipation way.
The navigation lock is designed as per the single-line capacity of 500 t of Grade IV. The effective
dimension of lock chamber is 120×12×4m (length × width × sill depth). The whole navigation lock
consists of the upstream approach channel, upper lock head, lock chamber, lower lock head and
downstream approach channel. Considering the navigable clearance demand, the dam crest elevation is
defined at EL.229.50m.
The fishway arranged on the right bank will have two inlets, respectively at EL. 199m and 201.3m, and
the inlet gate chambers will have a width of 5m. To prevent migrated-upstream fish from being drifted
to the dam downstream along the flood discharge, the outlet of the fishway is set at the upstream side
170m away from the dam axis, and considering the minimum reservoir level of EL.219m, the bottom
elevation of the fishway outlet is set at EL.217m.
As a run-of-the-river scheme, Sanakham plant will generate electricity with the inflow water,
and its reservoir has no regulating capability. Considering the project layout, the reservoir
desilting operation mode is preliminarily proposed below:
With the hydrological station at Luang Prabang as the inflow flood water control station
(usually the flood water from Luang Prabang will take 1~2 days to reach Sanakham damsite),
the desilting operation mode is blow:
In the flood season, when the reservoir inflow water is bigger than the design discharge, surplus flood
will be discharged firstly through the 5 flood gates on the left bank with a stilling basin, and then other
flood gates, to maintain the reservoir level at the normal storage water level of EL. 220.0m.
In case of a 3-year-or-bigger flood event occurring at Luang Prabang, flood release shall be started at
Sanakham. Firstly, the 5 flood gates on the left bank with a stilling basin, and then other flood outlets
shall be opened, with the outflow less than the 3-year flood peak discharge, the pool level will be drawn
down to the gate full opening for flood and sand discharge, and after the flood process, the reservoir will
be refilled up to the normal pool level for power generation. When the upstream reservoirs are
Sanakham Hydropower Project Overall Design Report of Sediment Monitoring System
3
discharging sand, all gates of Sanakham reservoir shall be fully opened for sand discharge accordingly.
Based on the sediment monitoring results, backwater at the reservoir shall be analyzed. When the
backwater due to sedimentation in the reservoir area may affect Pak Lay or the reservoir inundated area,
or when the sediment buildup approaches the sand barrier level in front of the intake, all flood gates
shall be fully opened to draw down the pool level for sand flushing. In other periods, the plant will
operate normally.
During the plant operation period, the sediment monitoring plan shall be well performed to accumulate
more sediment data, so that the sand flushing mode can be optimized further.
1.3 Automatic System of Hydrological Data Acquisition and Transmission
Because some hydrological stations of sediment monitoring are combined with the automatic system of
hydrological data acquisition and transmission, the following briefly describes the planned site layout
of Sanakham automatic system of hydrological data acquisition and transmission.
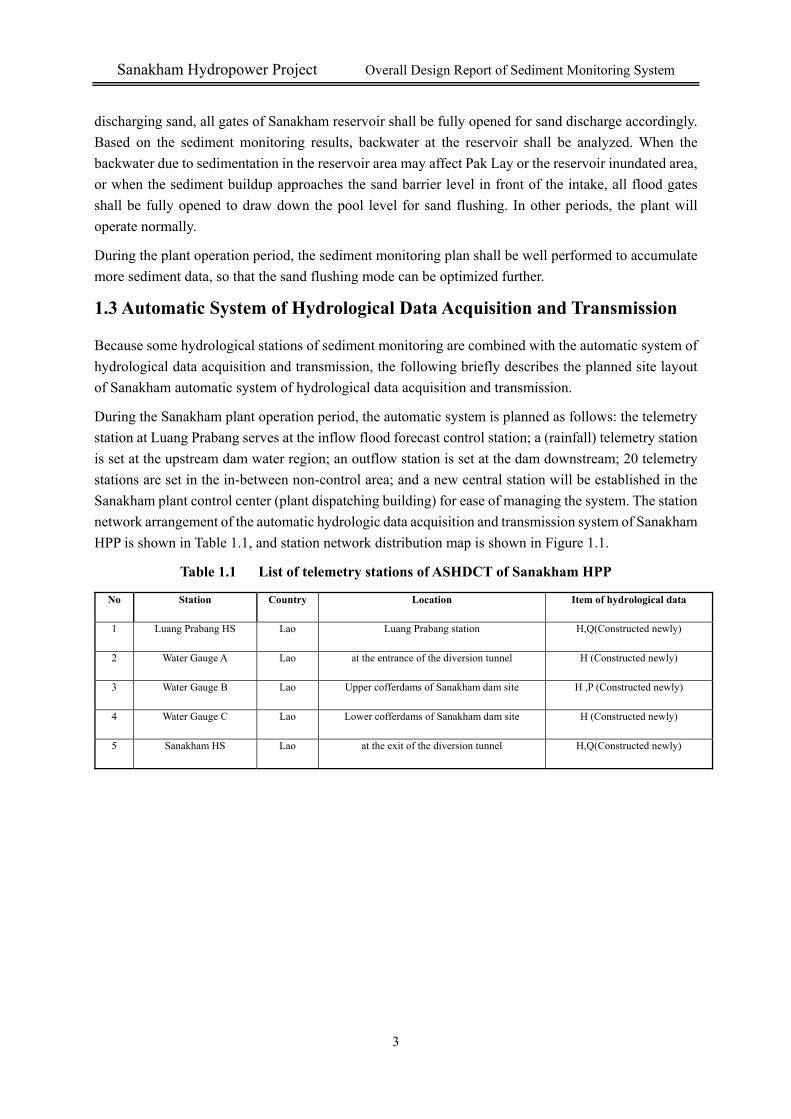
During the Sanakham plant operation period, the automatic system is planned as follows: the telemetry
station at Luang Prabang serves at the inflow flood forecast control station; a (rainfall) telemetry station
is set at the upstream dam water region; an outflow station is set at the dam downstream; 20 telemetry
stations are set in the in-between non-control area; and a new central station will be established in the
Sanakham plant control center (plant dispatching building) for ease of managing the system. The station
network arrangement of the automatic hydrologic data acquisition and transmission system of Sanakham
HPP is shown in Table 1.1, and station network distribution map is shown in Figure 1.1.
Table 1.1 List of telemetry stations of ASHDCT of Sanakham HPP
No Station Country Location Item of hydrological data
1 Luang Prabang HS Lao Luang Prabang station H,Q(Constructed newly)
2 Water Gauge A Lao at the entrance of the diversion tunnel H (Constructed newly)
3 Water Gauge B Lao Upper cofferdams of Sanakham dam site H ,P (Constructed newly)
4 Water Gauge C Lao Lower cofferdams of Sanakham dam site H (Constructed newly)
5 Sanakham HS Lao at the exit of the diversion tunnel H,Q(Constructed newly)

Sanakham Hydropower Project Overall Design Report of Sediment Monitoring System
4
Figure 1.1Hydrological (gauging) station network distribution map
2 Purposes and Contents of Sediment Monitoring Plan
2.1 System Purposes
Major sediment issues involve: the impact of the backwater (because of sedimentation in Sanakham
reservoir) on the upstream Pak Lay tailwater, the impact of the backwater (due to sedimentation in the
reservoir) and bank cave-in on the inundated area of the reservoir, the impact of the sedimentation on
navigation, the scouring and sedimentation variation in upstream and downstream approach channels
and their impacts, and the impact of the sedimentation in the reservoir on the downstream river channel
scouring and sedimentation variation and stability. Therefore, it is necessary to conduct a sediment
monitoring plan for the reservoir, in order to acquire the Sanakham reservoir inflow water and sediment
volumes, scouring and sedimentation evolution, reservoir bank change, main navigation course variation
and reservoir storage capacity change, provide accurate and reliable data for the plant operation and
navigation dispatching management, and improve the plant managing level and economic efficiency.
2.2 Design Principles and Bases
Sediment monitoring design of Sanakham HPP complies with the following principles:
(1)The sediment monitoring network of Sanakham HPP is designed according to the principles of

Sanakham Hydropower Project Overall Design Report of Sediment Monitoring System
5
advanced & reliable, economical & practical, and convenient for construction & maintenance
management.
(2)The data of original hydrological stations should be fully used, and during layout of station network,
the sites should be appropriately added and adjusted according to the requirements of sediment
monitoring based on the existing station network.
(3) The social forces should be fully used to reduce personnel allocation as far as possible. Design basis
of the sediment monitoring station network of Sanakham HPP:
Preliminary DG of LMB Mainstream dams (2009.8.31)
Code for reservoir hydrologic and sediment survey (SL339-2006)
River suspended sediment test specification (GB50159-92)
Specifications for the Waterway Survey (SL257-2000)
Survey Specification for Hydraulic and Hydro-Power Projects (Planning and design phase) (SL197-97)
2.3 Main Monitoring Contents
According to the major sediment problems associated to the reservoir, to monitor and analyze the
sedimentation impacts, main sediment monitoring contents include:
(1) Reservoir inflow and outflow water and sediment volumes;
(2) Reservoir sedimentation variation;
(3) Reservoir water surface profile;
(4) Reservoir bank scouring/ sedimentation change and cave-in;
(5) Dam downstream scouring monitoring during initial reservoir operation period;
(6) Sedimentation in upstream and downstream approach channels.
3 Sediment Monitoring Programming
3.1 Sediment monitoring at inflow stations and outflow stations
The principle for establishing the sediment monitoring stations is to cover those hydrological and
sediment elements change, and try best to utilize the existing hydrological stations and water regime
forecasting system stations.
3.1.1Arrangement of monitoring stations
(1) Inflow station (Luang Prabang station)
Proposal: An LISST-100X granulometer is put at the inflow station to monitor the real-time inflow
sediment condition.
Site selection: The hydrological gauging station at Luang Prabang measures hydrological and sediment
elements, with a catchment area of 268000km2, which accounts for 91.8% of the catchment area till
Sanakham Hydropower Project Overall Design Report of Sediment Monitoring System
6
Sanakham damsite, so the hydrological station can serve as the inflow sediment monitoring station for
Sanakham reservoir. Sediment monitoring at the station is carried out in patrol inspection manner. To
have better knowledge of Sanakham reservoir's inflow water and sediment, intense monitoring of level,
flowrate, sediment concentration and grain gradation should be conducted at the hydrological station
Operation mode: A qualified professional agency should be employed to maneuver a survey boat to
conduct patrol inspection. During carrying out normal testing, the instruments will be mounted in the
inflow station, the LISST-100X field laser granulometer and data transmission equipment will undertake
real-time water flow and sediment monitoring, and measured data will be transmitted to the central
station through a transmitter or a satellite receiving terminal.
(2) Outflow station
The outflow station will rely on the water regime outflow station which is situated in the Sanakham dam
downstream. The instruments and operation mode will be identical to those for the inflow station.
3.1.2 Equipment configuration and civil works
(1) Inflow station
For monitoring sediment, the inflow station must have the function of a hydrological station. The patrol
survey mode of the inflow station may use ADCP to acquire and transmit hydrological data, define the
stage-discharge relation, and an automatic device for water level gauging and real-time monitoring data
reporting should be equipped for automatic hydrological data acquisition and transmission.
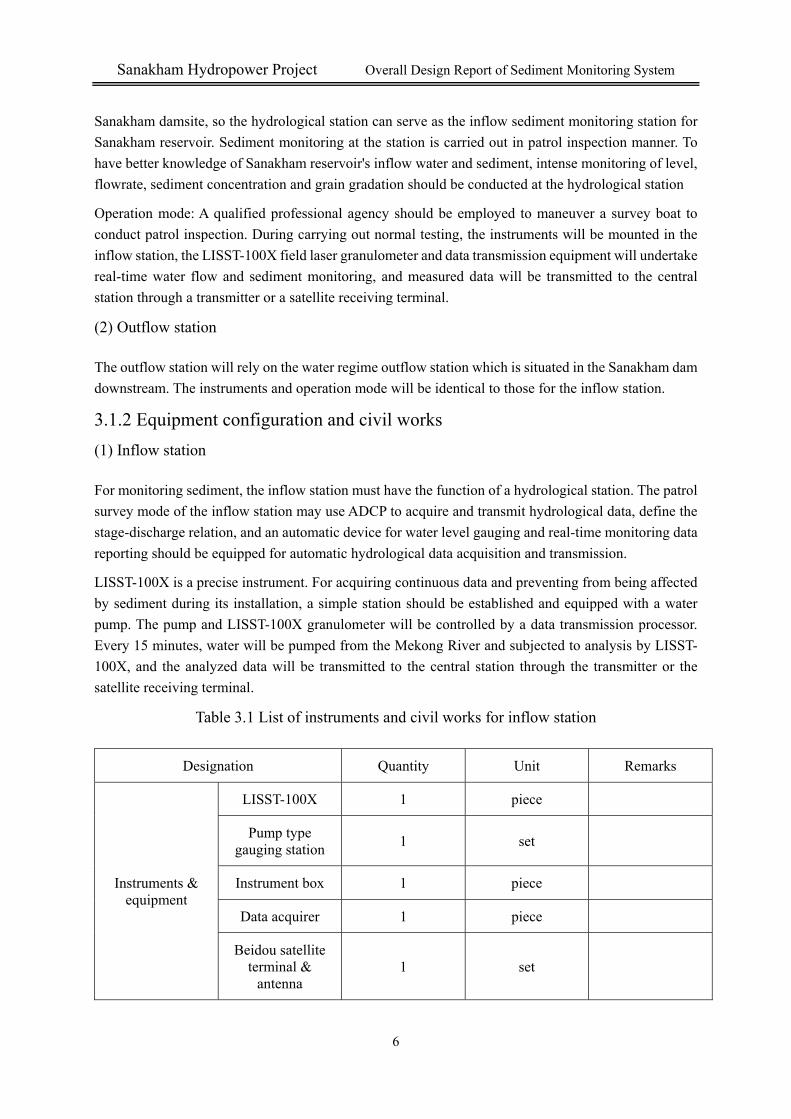
LISST-100X is a precise instrument. For acquiring continuous data and preventing from being affected
by sediment during its installation, a simple station should be established and equipped with a water
pump. The pump and LISST-100X granulometer will be controlled by a data transmission processor.
Every 15 minutes, water will be pumped from the Mekong River and subjected to analysis by LISST-
100X, and the analyzed data will be transmitted to the central station through the transmitter or the
satellite receiving terminal.
Table 3.1 List of instruments and civil works for inflow station
Designation Quantity Unit Remarks
Instruments & equipment
LISST-100X 1 piece
Pump type gauging station
1 set
Instrument box 1 piece
Data acquirer 1 piece
Beidou satellite terminal &
antenna 1 set

Sanakham Hydropower Project Overall Design Report of Sediment Monitoring System
7
Tranceiver 1 piece
Solar panel 1 piece 40W
Battery cell 2 piece 100AH
Keyboard 1 piece
Civil works
Lightning grounding system
1 set Soil resistance
<10 ohm
Instrument room 1 piece 2 rooms, in area
of 8m2
Power supply 1 piece
Artificial water gauge
1 piece Elevation system
conversion for water gauge
Pump station system
1 set Installation of
pump and pump station piping
LISST-100X can conduct field measurement of the particle distribution, optical transmission and
scattered light quantity function. A red 670nm-long diode laser transmitter and siliceous detector will be
used to scatter at a small angle suspended particles within the 32 angle range.
Post-processing by the instrument may produce the sediment size distribution, volume density, optical
transmission and VSF. At the same time, it may also measure temperature and depth. The optional
SeaBird MicroCat 37-SI CTD may be connected with the instrument, which enables the instrument to
have more accurate electric conductivity, temperature and depth data.
LISST-100 technical indicators are as follows:
Technology: Small angle forward scattering;
Laser: Solid state diode (670 nm);
Optical path: 5.0cm (Standard), 2.5cm (Optional), 20.0cm (Optional)
Parameter: Particle size distribution
Light scattering function (VSF)
Light penetration
Water depth (0 to 300 m)
Water temperature (-5℃ to 50 ℃)
Implementation method: Underwater, laboratory, field, towing, anchorage, platform,

Sanakham Hydropower Project Overall Design Report of Sediment Monitoring System
8
profile
Operating range: Concentration (Approximate range of the particles with an average size
of 30m):
5.0 cm light pool - 10 to 750 mg/l
2.5 cm light pool - 20 to 1500 mg/l
20 cm light pool - 2.5 to 175mg/l
(The range shows linear variation with the particle size)
Particle size range: 1.25 - 250 (Type B)
2.5 - 500 (Type C)
Light penetration: 0- 100%
Accuracy: Concentration: ±20% (Full range)
Light penetration: 0.1%
Resolution: Concentration: 0.5/l
Particle size distribution: 32 size grades, interval sampling
Measurement rate: Programmable, up to 4Hz (Measured 4 times per second)
Data programming acquisition unit: Internal memory and / or external data output,
RS-232C
Data capacity: 16MB
Interface: RS-232 C, WINDOWS 95/98/NT software
Energy: Internal power-Common alkaline battery
External power- REG +15 & -15 V @ 250 Ma max
Actual dimension: 32inch long 5 inch diameter (81 cm long 13 cm diameter)
Weight: 25 pounds (11.25KG) in the air; 8 pounds (3.6 KG) in the water
Rated working depth: 300m (For special requirements, depth can be upgraded)
In consideration of the characteristics of sediments in the Mekong River water, the application range of
LISST-100 can serve as the instrument to measure sediments in the river.
(2) Outflow station
The instruments and civil works for the outflow station will be identical to those for the inflow station.
3.2 Dam-front and Reservoir Area Water Surface Profiles Monitoring
3.2.1 Layout of stations
The dam-front water level measurement will utilize the existing dam-front level gauging station

Sanakham Hydropower Project Overall Design Report of Sediment Monitoring System
9
established for the water regime forecasting system. The reservoir tail level can use the tailwater level
monitoring system for Pak Lay Plant, to spare new setting-up. It is preliminarily proposed to establish
2 automatic water level gauging stations at Don Men Village and Pak Lay Town.
3.2.2 Equipment installation and civil works
The list of level gauging instruments/equipment and civil works refers to Table 3.2.
Table 3.2 List of level gauging instruments/equipment and civil works
Designation Quantity Unit Remarks
Instruments & equipment
Pump type gauging station
2 set
Instrument box 2 piece
Data acquirer 2 piece
Beidou satellite terminal &
antenna 2 set
Maritime satellite terminal &
antenna 2 set
Solar panel 2 piece
Battery cell 2 piece 100AH
Keyboard 2 piece
Civil works
Lightning grounding system
2 set Soil resistance <10 ohm
Instrument room 2 Floor area of 4m2
Artificial water gauge
2 set Elevation system
conversion for water gauge
3.3 Reservoir baseline survey
The reservoir baseline survey includes establishing a reservoir control network, erecting
sectional stakes for reservoir area, and surveying works.
(1) Reservoir area control survey
Reservoir area control survey is the basis for hydrological and sediment monitoring in the reservoir area.
Its task is to establish a plane and elevation system control networks for the whole reservoir area.
The reservoir area is about 99km long. Grade Ⅰ lines in a total length of 120km are used as the first
level control for the plane.
The reservoir area elevation control network is formulated in Grade Ⅲ leveling lines, 200km in total
length, and branch lines for different sections are in Grade Ⅳ, 150km in total length.
(2) Setting out of longitudinal and cross sections in reservoir area and survey works
Altogether 90 cross sections are arranged in the reservoir area, the sections along with the baseline have

Sanakham Hydropower Project Overall Design Report of Sediment Monitoring System
10
a total length of 90km. One longitudinal profile for the reservoir area is laid out, about 100km in length.
90 pairs of sectional monitoring monuments are constructed in the reservoir area. The endpoints of
different sections will be jointly surveyed, and cross and longitudinal sections will be surveyed
accordingly.
(3) Topographic survey instruments
The underwater topography will be surveyed with a digital echo-sounding instrument, land topography
by total survey station, positioned with GPS, and professional data acquisition software, computation
software, image integration software will be used as well. The detailed list refers to Table 3.3. Since the
reservoir area survey works would be vast in quantities, it is recommended that qualified agencies should
be entrusted to carry out the survey with above-mentioned instruments.
Table 3.3 List of survey instruments and software
No. Equipment name Model Manufacturer Remarks
1 Trimble GPS Trimble R7 Trimble Navigation,US GPS RTK
2 Total survey
station TCR802 Leica
To acquire land topographic data
3 Multi-beam
depth sounding system
R2SONIC2024 US R2SONIC To acquire underwater data
4 Single-beam
depth sounding system
Hi Target Hi Target To acquire underwater data
5 Vehicle, boat Traffic means, to acquire
underwater data
6 Computer Data processing
7 Image software Cass9.0 South Digital Data processing
8 Data acquisition
software PDS2000
To acquire multi-beam data
9 Computation
software TBC2.8 Trimble Navigation,US
Calculation of GPS control net
(4) Reservoir shoreline monitoring
High precision satellite image of the Sanakham reservoir area will be acquired once a year. 3S
technology can be used to generate the reservoir area topographic map, and then to analyze the
interannual variations of the river course, shorelines and terraces. Each year before and after flood period,
patrol survey should be conducted for the reservoir area, to the bank slopes in the reservoir area,
especially those slopes possibly to deform.
3.4 Damsite Area Topography Monitoring (Power Intake & Approach
Channel)
To follow up the sedimentation evolution in the damsite area and the approach channels, after the
reservoir impoundment, the damsite area topography should be monitored every year, mainly to keep a

Sanakham Hydropower Project Overall Design Report of Sediment Monitoring System
11
watchful eye on the locations such as the sand barrier, power intake, flood sluices, upstream and
downstream approach channels. The topography survey method and instruments refer to Table 3.4. The
underwater topography will be surveyed with a digital echo-sounding instrument, land topography by
total survey station, positioned with GPS, and professional data acquisition software, computation
software, image integration software will be used as well. The number of instruments will be determined
according to the workload and the time schedule.
Topography survey requirements are narrated below:
(1) Scope: 1km upstream of damsite~2km downstream of damsite;
(2) The scale should not less than 1:500. The determined survey scope and scale should remain
unchanged as far as possible;
(3) Each year before and after flood period, overall survey should be conducted for these areas, and
survey times at the approach channels should be more frequent than normal survey times.
3.5 Downstream River Course Topography Monitoring
High precision satellite image of the 30km-range downstream of Sanakham damsite will be acquired
once a year. 3S technology can be used to generate the reservoir area topographic map, and then to
analyze the interannual variations of the river course, shorelines and terraces. Each year before and after
flood period, patrol survey should be conducted for the bank slopes in the downstream river course,
especially those slopes possibly to deform.
3.6 Reservoir Area Landslide Deformation Body Monitoring
The two bank slopes near the dam area and in the reservoir area are relatively gentle, exposed
groundwater elevation is higher than the normal pool level, and dense forest and vegetation are
developed in large gullies. It is preliminarily judged that in the reservoir area there should not evoke
large-scale slope stability problems, but for the reservoir shore slopes are composed of silt and silty clay
soil, once the reservoir is impounded, the underground water level is raised, the soil will be soaked or
wetted, which will cause soil softening and abrupt strength drop, plus wind wave actions, small-scale
reservoir bank collapses could be triggered.
Before the reservoir impoundment, the topography of the two sides of the reservoir area should be
observed, to identify the location, size and other parameters of possible landslide deformations, and
monitoring instruments can be monitored according to the specific arrangement of the deformation
bodies.
3.7 Monitoring Requirements
(1) Inflow and outflow water and sediment monitoring
Inflow and outflow water and sediment monitoring will be conducted as per pertinent water and
sediment measurement specifications.
(2) Sectional survey
Before the reservoir is made ready for impounding, the reservoir baseline survey works shall be

Sanakham Hydropower Project Overall Design Report of Sediment Monitoring System
12
finished, which will serve as the primary data for the reservoir's longitudinal and cross profiles.
After every 3~5 years of operation, the reservoir area shall be surveyed once again at the respective
sections. If necessary, the flood water surface profile in the reservoir shall be surveyed as well.
(3) Bank slopes in the reservoir area shall be monitored regularly every year, as well as surveying the
main fairway depth in the reservoir area.
(4) Regular or irregular monitoring of the upstream and downstream approach channels. Any
accumulation maybe hindering smooth navigation shall be timely dredged.
(5) Regularly (2 times every month in the non-flood season, 4 times every month in the flood season,
and another 3 times for a flood process, respectively before, on and after the flood peak) test sediments
at the outflow section, and take typical sediment samples subject to grain size gradation analysis.
3.8 Main Monitoring Results
Monitoring data shall be summarized and sorted out as per related specifications and the PDG of MRC.
The main results include:
(1) Water and sediment data and variation trend at inflow gauging station;
(2) Sediment volume, sediment content, sediment gradation, mineral composition at outflow gauging
station;
(3) Water surface profile of reservoir area under different discharges;
(4) Reservoir's sediment accumulation distribution;
(5) Reservoir's storage capacity variation, rectified storage capacity curve;
(6) Damsite area (scope from damsite upstream 1km to downstream 2km) topography monitoring,
mainly including the sedimentation distribution, accumulation thickness and development trend at the
sand barrier, power intake and in the upstream and downstream approach channels;
(7) Downstream river course topography monitoring results;
(8) Bank cave-in positions and volumes in the reservoir area.
4 Staffing
Considering cost-effectiveness, no dedicated survey personnel will be assigned for the power plant.
Qualified professional agencies could be entrusted to conduct the survey jobs at the damsite and in the
reservoir area.
5 Cost Estimate
The cost for the reservoir sediment monitoring program is estimated to be 3,145,000CNY, including
1,000,000 CNY for the equipment and installation cost, 1,602,000CNY for the reservoir baseline survey,
318,000CNY for the civil works, and 225,000CNY for other items, as detailed in Table 5.1.
According to the monitored inflow and outflow water and sediment data, reservoir sedimentation,

Sanakham Hydropower Project Overall Design Report of Sediment Monitoring System
13
sediment accumulation in approach channels, the impact of sedimentation on the plant and navigation
safety and normal operation should be analyzed, as well as the outflow water and sediment variation
and reservoir area sedimentation laws after the reservoir is commissioned, and if necessary, the reservoir
operation mode should be optimized as appropriate.

Sanakham Hydropower Project Overall Design Report of Sediment Monitoring System
14
Table 5.1 Cost estimate for sediment monitoring program at Sanakham reservoir (CNY)
Unit: 104 CNY
No. Works or cost designation Unit Quantity Unit price Sub-total Remarks
Part I: Civil Works 31.8
1 Dam-front reservoir level
gauging station (new) 1 Cost covered by water regime
forecasting budget
2 Reservoir area level gauging
station 2 6 12
3 Central station 1 Cost covered by water regime
forecasting budget
4 Concrete survey monuments
number 180 0.1 18
Including precast, installation, embedding costs, the construction cost
after the impoundment
Management fee % 10 1.8
Part II: Equipment and Installation Works 100
5
Sediment monitoring, analysis instruments\ equipment and their
installations
set 2 40 80
6 Waterborne traffic equipment
cost (boat) 1 20 20
Part III Survey 160.2

Sanakham Hydropower Project Overall Design Report of Sediment Monitoring System
15
6 Benchmark traverse network km 100 0.5 50
7 Reservoir area sectional
survey times 1 40 40 Survey once the entire reservoir area
after its impoundment
8 Damsite area survey times 1 20 20
9 Technical job cost % 22 24.2
10 Cost for procuring and
analyzing images km2 130 0.2 26
Part IV: Other cost 22.5
11 Reserve fee % 6 17.5
12 Charges of Chiang Khan
Station data 5 Estimated only
Sum of Part I, II, III and IV 314.5