outputs and performance measures a case study of two new
TRANSCRIPT

Outputs and Performance Measures
A Case Study of
Two New Zealand Public Sector
Organisations
_________________________________________________
A thesis submitted in partial fulfilment of
the requirements for the degree of
MASTER OF COMMERCE
University of Canterbury
Christchurch, New Zealand
_________________________________________________
By Meaw-Fong Phang
2006

i
Abstract
Measuring performance is a necessary management practice if action is to result in desired
outcomes. An important objective of the New Zealand public sector reforms that started in the
late 1980s, was to focus the attention of public servants on clear specified results rather than
bureaucratic procedures. Based on an implicit assumption that all public sector organisations are
of a production nature, the reforms promised greater efficiency within the public sector by
holding managers accountable for results while providing them with greater freedom to allocate
resources. Consequently, outputs became key performance measures to enhance the
accountability structure and to improve efficiency of the public organizations. The development
of performance measurements to date appears inadequate in that the most important component
of results – outcomes is overlooked from the measurement.
Currently government departments in New Zealand are implementing the early stage of the
Management for Outcomes initiative, with an aim of ensuring all public service departments
adopt a more strategic and outcome-focused approach to management and reporting. This thesis
studied the latest developments in using outputs as performance measures in two public
organisations. The findings demonstrates that outputs do not indicate performance for a
procedural or a coping organisation as output information may not be relevant, meaningful or
useful. However the most significant risk is that just as in the past, reliance on outputs will
continue to lead to the fragmentation of public services and the ineffective delivery of services
that the Management for Outcomes initiative aims to overcome.

ii
Acknowledgements
There are many people I would like to thank in helping me along the journey to complete this
thesis.
My greatest thanks to my supervisors, Karen Lewis, Sue Newberry and Alan Robb for their
invaluable guidance, encouragement, comments and suggestions. Without their support, this
thesis would not be possible.
All the interviewees and other staff at Collections Unit and CYF, who provided many assistance
and valuable time for interview.
To my husband Mike, for his unwavering support in last two years. Also to my daughters
Jasmine and Laurel, for their patience in allowing me time to study, and to monopolise the home
computer.
A special acknowledgement to Professor June Pallot and Mr George Thompson, who stimulated
my research interest in public management. Sadly, both June and George passed away in 2004
and could not witness the completion of this thesis.

iii
Table of Contents
Abstract……………………….……………………..…………………………………………….………i
Acknowledgements……………….……………………….………………………………………………ii
Chapter 1: Introduction........................................................................................................................ 1
Chapter 2: Development in New Zealand Public Sector...................................................................... 4
New Public Management (NPM) and New Public Financial Management (NPFM) ...................... 4
Key Legislation ................................................................................................................................. 6
State-Owned Enterprise Act 1986 ................................................................................................ 6
State Sector Act 1988 and Public Finance Act 1989 .................................................................... 6
Financial Reporting Act (FRA) 1993 ........................................................................................... 8
Fiscal Responsibility Act 1994...................................................................................................... 9
Output-Oriented Appropriation Process ......................................................................................... 9
Measuring ‘Result’ in Government Departments.......................................................................... 10
Output versus Outcome .............................................................................................................. 11
Difficulties in Aligning Outputs and Outcomes ......................................................................... 11
Review of the Centre and Managing for Outcomes ................................................................... 13
Summary ......................................................................................................................................... 15
Chapter 3: Performance Management and Measurement in Public Sector...................................... 17
Performance Management and Measurement ............................................................................... 17
Origin and Concept .................................................................................................................... 17
Effectiveness versus Efficiency .................................................................................... 18
Financial and Non-Financial Measures ........................................................................ 19
Applying Performance Management and Measurement to Public Sector .................................... 20
Uniqueness of Public Sector Organisations ............................................................................... 20
Different Types of Public Organizations.................................................................................... 22
Requirements under the New Zealand Accounting Standards...................................................... 24
Financial and Service (Non-Financial) Performance Reporting ............................................... 24
Summary ......................................................................................................................................... 27
Chapter 4: Research Method.............................................................................................................. 28
Research Objective and Questions ................................................................................................. 28
Interviews.................................................................................................................................... 29
Documentary Source Materials.................................................................................................. 30

iv
Gaining Approval to Undertake the Research............................................................................... 30
Motivation for Research ................................................................................................................. 31
Research Design.............................................................................................................................. 31
Limitations of Research Method .................................................................................................... 32
Ethical and Regulatory Approvals ................................................................................................. 32
Chapter 5: Collections Unit ................................................................................................................ 33
Background..................................................................................................................................... 33
Fines Compliance Process .......................................................................................................... 33
History - Pre-Establishment Reviews 1982 and 1994..................................................................... 34
1996 - 2000....................................................................................................................................... 36
Establishment in Jan 1996 – New Emphasis on Enforcing Monetary Penalties ....................... 36
Nature of Fines ........................................................................................................... 36
Change to ‘More Money Sooner’ Culture .................................................................... 36
1996 Business Case ..................................................................................................... 37
1996 – 2000 Strategic Plan and Implementation........................................................... 37
Emerging Issues ......................................................................................................... 38
2000 - 2005 .................................................................................................................................. 39
2000-2005 Strategic Plans ........................................................................................... 39
2002 and 2003 Business Cases ..................................................................................... 40
Summary ......................................................................................................................................... 41
Chapter 6: Department of Child, Youth and Family Services........................................................... 42
Establishment of CYF..................................................................................................................... 42
Care and Protection Process........................................................................................................... 42
Family/Whanau Agreements (FWA) ......................................................................................... 46
Family Group Conference (FGC) .............................................................................................. 47
History............................................................................................................................................. 47
2000 Mick Brown’s review ............................................................................................................. 48
Predicament of CYF revealed in Brown's report ...................................................................... 49
2003 First Principles Baseline Review ............................................................................................ 51
Summary ......................................................................................................................................... 52
Chapter 7: Findings Collections Unit Output – Collection and Enforcement of Court-imposed
Monetary Penalties and Infringement Fines ............................................................. 53
The Nature of Outputs.................................................................................................................... 53
Quantity Measures...................................................................................................................... 53
Amount Collected ....................................................................................................... 54
Number of Legal Challenges that Resulting in Costs Being Awarded Against MOJ....... 56

v
Quality Measures ........................................................................................................................ 56
Percentage of Fines Actioned ...................................................................................... 56
Timeliness Measures ................................................................................................................... 57
Timeframe - 28 days, 4 months or 6 months................................................................. 59
Outputs as Internal Performance Measures .................................................................................. 59
Applying Criteria of Well-Defined Outputs and Performance Measures ..................................... 60
Criteria 1: External Focus .......................................................................................................... 60
Criteria 2: Controllable .............................................................................................................. 61
Criteria 3: Comprehensive ......................................................................................................... 63
Criteria 4: Measurable ............................................................................................................... 64
Criteria 5: Informative ............................................................................................................... 64
Summary..................................................................................................................................... 65
Chapter 8: Findings CYF output - Care and Protection Service....................................................... 66
Care and Protection Outputs.......................................................................................................... 66
Intake Notification...................................................................................................................... 67
Response to Notification ............................................................................................................. 69
Investigation................................................................................................................................ 70
Family Group Conference (FGC) and FGC plans..................................................................... 71
Care Services............................................................................................................................... 72
Outputs as Internal Performance Measures .................................................................................. 73
Applying Criteria of Well-Defined Outputs................................................................................... 75
External Focus ............................................................................................................................ 75
Controllable ................................................................................................................................ 75
Comprehensive ........................................................................................................................... 76
Measurable.................................................................................................................................. 77
Informative ................................................................................................................................. 78
Summary ......................................................................................................................................... 80
Chapter 9: Discussion ......................................................................................................................... 81
Fitness into Wilson's Matrix........................................................................................................... 81
Collections Unit........................................................................................................................... 81
Collections Unit’s Outcomes ....................................................................................... 82
Collections Unit – a Procedural Type Organisation...................................................... 83
CYF ................................................................................................................................................. 83
CYF’s Outcomes ......................................................................................................................... 83
Narrowness of the new outcome statements ................................................................. 84
CYF – a Coping Type Organisation............................................................................. 86
Fitness of Outputs under the Criteria of Well-Defined Outputs and Measures ........................... 86

vi
Similarities .................................................................................................................................. 87
Controllable, Comprehensive and Informative ............................................................ 87
Differences .................................................................................................................................. 88
External Focus ........................................................................................................... 88
Measurability ............................................................................................................. 88
Impact on Using Outputs as Performance Measures..................................................................... 89
Summary ......................................................................................................................................... 91
Chapter 10: Conclusion ...................................................................................................................... 92
References……………… .................................................................................................................... 95
Appendix 1: Key Government Goals ................................................................................................ 101
Appendix 2: Summary Output Plan – Care and Protection Services.............................................. 102
Appendix 3: Linkages Between Key Government Goals and Justice Sector and Ministry Outcomes
.................................................................................................................................. 105
Appendix 4: Letter of Approval – Collections Unit ......................................................................... 105
Appendix 5: Letter of Approval – CYF............................................................................................ 108

1
Chapter 1: Introduction
New Zealand public sector reforms received international attention for their consistency, scope,
speed and theoretical coherence, and in particular the implementation of a world-leading New
Public Financial Management (NPFM) system (Hood, 1991). This NPFM system has provided
an important framework for the reforms, although the decision to use that system as a model has
been questioned (Schick, 1996; 1998; 2001; Pallot, 1998a; Scott, 2001). For example:
In the five years since The Spirit of Reform was published, I have become more critical and less ambivalent, more admiring of the remarkable managerial edifice erected in this country, but less convinced that it is the right way to go (Schick 2001, p.1).
While there has been no systematic review of the New Zealand reforms, many observers have
agreed that the new systems succeeded in improving output productivity and production
efficiency (Martin, 1995; Shick, 1996; Boston el al., 1996; James 1998). Simultaneously
concerns have been raised about the tension between output-based operational management and
the ministers’ imperatives for strategic policy development (Schick 1996; 2001). Schick (1998)
further points out:
The New Zealand model emphasizes matters that can be specified in contracts, such as the purchase of outputs, but gives inadequate attentions to outcomes and the government’s ownership interest because they do not fit easily into the contracting framework (p.126).
A major 2002 review, Review of the Centre, concluded that the New Zealand public
management system did not require any fundamental change, but more emphasis should be
placed on the achievement of outcomes.
Subsequently Managing for Outcomes initiative was developed with the aim of putting more
emphasis on the alignment of outputs with outcomes. Currently government departments are in
the process of implementing that initiative.
However whether the Managing for Outcomes initiative can focus the attention of public sector
management on outcomes without a change to the existing output-orientated system is not
certain. This latest move to focus on outcomes does not propose changes to the contractual
arrangement of public sector organisations in their delivery of outputs, nor to shift the emphasis
from outputs to outcomes in the appropriation process. Gregory (1994, 1995a, 1995b) believes

2
New Zealand public sector management has assumed all tasks carried out by public sector
organisations are of ‘production’ and homogenous nature. Therefore the Managing for Outcomes
initiative is insufficient to shift the paradigm from a focus on outputs to outcomes. So how well
can a ‘production’ type management fit into other type environment still remains an outstanding
question.
With this question in mind, this thesis examines the roles of outputs of two public sector
organisations with four specific research questions:
1. How were outputs applied as performance measures?
2. What were these outputs and how did they link with the intended outcomes?
3. What was the effect of using outputs as key performance measures and why?
4. How useful have outputs been as performance measures?
This thesis will apply Wilson’s (1989) typology of public organisations and the principles of
well-defined output and measures under Technical Practice Aids 9 Service Performance
Reporting issued by the Institute of Chartered Accountants of New Zealand in answering these
questions.
Chapter 2 reviews the historical and current development of using outputs as key performance
measures in public sector. It includes an introduction of the concepts, principles and key
legislation behind the New Public Management and New Public Financial Management reforms.
After illustrating the importance of outputs in the public sector management system the chapter
reviews the literature on the evaluation of the results achieved by the reform so far. Findings and
recommendations of a key review - Review of the Centre and the current Managing for
Outcomes initiative are outlined, and the chapter concludes by questioning whether Managing
for Outcomes can help to solve the problem of insufficient attention to outcomes experienced in
the last two decades of public sector reform.
Chapter 3 reviews performance management and measurement, and their application in the
public sector. All organisations, including private, public and not-for-profit organisations, desire
to improve their performance. Though the concept of performance management and
measurement appears reasonably straight forward, it is an intricate task to design a good
performance measurement system. The two important considerations of setting up a performance
measurement system - efficiency versus effectiveness, and financial and non-financial measures
are introduced. The uniqueness and differences of public sector organisations and the challenges

3
in adapting private sector practice in performance measurement is also illustrated. The last
section of the chapter details the requirements under the New Zealand accounting standards for
the reporting of non-financial performance of public organisations.
Chapter 4 details the research method used. The research objectives, which are descriptive and
explanatory, are identified. Describing and explaining contemporary issues where the
investigator has no control over the actual behavioural events justifies the appropriateness of the
case study method (Ryan el al, 1992). Interviews were carried out with management and
personnel in two case organisations. In addition a wide range of documentary sources have been
used in this research. Limitations of this research method are also identified.
Chapter 5 provides the background information on the first case organisation – the Collections
Unit within Ministry of Justice. The emphasis is on the collection and enforcement of monetary
penalties which represents about 75% of Collections Unit work. Fines collection and the
enforcement process, different types of monetary penalties and their implication are explained.
In addition historical and current developments are also examined.
Chapter 6 provides the background information of the second case organisation – Department of
Child, Youth and Family Services (CYF). The emphasis is on care and protection services and
the related social work process. Since its inception CYF has been extensively reviewed twice by
external parties twice - Judge Brown’s review in 2000 and The First Principles Baseline Review
(Baseline Review) in 2003.
Chapters 7 and 8 describe and explain the outputs and output measures of the two organisations
and how well they fit into the framework provided by Technical Practice Aids - 9 Service
Performance Reporting (TPA-9).
The main points are discussed in chapter 9. A comparison is made of which type of public
organisations each case organisation belong to according to Wilson’s typology. Similarities and
differences on the ratings under the criteria of TPA-9 are discussed. The limitations of outputs
and the impact on using outputs as performance measures are elaborated.
Conclusions are explained in chapter 10 which highlights the findings that outputs may not
accurately indicate performance for some public organisations and the problems expected due to
the continuing use of outputs in the public management system.

4
Chapter 2: Development in New Zealand Public Sector
New Public Management (NPM) and New Public Financial
Management (NPFM)
Beginning in 1984 New Zealand has undertaken a number of significant reforms that have
attracted international interest due to their radicalism, boldness, coherence and innovative
methods (Boston et al., 1996). They started with widespread economic reforms such as the
removal of foreign exchange, wage, price and interest controls; the introduction of Goods and
Services Tax; and public sector reforms that impact sectors from health, education, local
government to Maori authorities (Pallot, 1998b).
These reforms are referred to as the New Public Management (NPM) reforms and have been
implemented in varying degree by many industrialised countries around the world. Olson et al.
(1998) points out that that the NPM reform movement was based on the belief that the public
sector was “too large and cumbersome, organised on the wrong principles and in need of re-
invention and institutional renewal” (Olson et al., 1998, p.17). Consequently the results pursued
have been “policies of restraint on public spending, the selling of public assets, the adoption of
market models and the promotion of performance measurement, auditing of and business
accounting systems for a wide range of public sector organisations” (Olson et al., 1998, p.17).
Boston et al. (1996, p. 26) provides a list of key characteristics of NPM that impact the public
sector management in New Zealand:
• The reform was shaped by public choice theory, institutional economics - especially
agency theory and transaction-cost economics - and managerialism;
• A belief that public sector organisations can be managed the same way as private sector
organisations;
• A shift from focusing on process accountability to accountability for results;
• An emphasis on management rather than policy;
• The devolution of management control with improved reporting, monitoring and
accountability mechanisms;

5
• A shift from long-term and generally poorly specified contracts to shorter-term and
more tight specified contracts;
• The mirroring of private sector management practices including the use of short-term
labour contracts, the development of strategic plans, performance agreements and new
management information system;
• A focus on cost-cutting, efficiency and cut back management.
The five key mutually reinforcing principles introduced to the New Zealand public sector
management system are documented in Government Management (Treasury 1987, pp7-8):
clarity of objectives, freedom to manage, accountability, effective assessment of performance
and adequate information flows (see Figure 2.1).
The application of these principles has resulted in significant changes in the public sector
management system. The most important has been a change in the focus of parliamentary
scrutiny from inputs to outputs. This involved fundamental changes in the financial management
and human resources systems and the development of the performance management system to
hold chief executives and departments responsible for specified results.
Figure 2.1: Principles underpinning New Zealand public sector system
Source: The Treasury, 1987, p.62

6
Key Legislation
The use of outputs as key performance measures in New Zealand public sector reform was
enabled by the Public Finance Act 1989 and the State Sector Act 1988. Though the earlier State-
Owned Enterprise Act 1986 did not directly impact on the core government departments, its
principles did influence the enactment of the Public Finance Act. In addition the Financial
Reporting Act 1993 and Fiscal Responsibility Act 1994 also played an important part in the
defining and reporting of outputs. The remainder of this section explains the importance of these
legislations, including the State-Owned Enterprise Act 1986 which influenced the later enacted
key legislation, in relation to performance management of pubic sector organisations.
State-Owned Enterprise Act 1986
New Zealand public sector reforms started with the passage of the State-Owned Enterprise
(SOE) Act 1986 that provided the means to corporatise and eventually to privatise the market
activities of the government. These market activities included banking, air and rail transport,
forestry, telecommunication, postal services, electricity generation and supply. In the past public
enterprises had taken a number of organisational forms with no consistent framework, but the
SOE Act now imposed a uniform structure. All SOEs are incorporated into companies and need
to comply with the Companies Act and other associate legislation (SOE Act, s. 30). The
principal objective of each SOE is "to operate as a successful business" (SOE Act, s.14).The
government as an owner seeks the highest possible return on investment, but can make specific
payments to a SOE if it wishes the SOE to undertake some social activities. Key components of
this new model include a clear identification and separation of the roles of ministers, boards and
managers, a reporting of actual performance against planned objectives.
State Sector Act 1988 and Public Finance Act 19891
After dealing with the market activities of public sector, the focus of the public sector reform
then turned to central government departments with the introduction of two key pieces of
mutually reinforcing legislation - the State Sector Act 1988 and Public Finance Act 1989.
1 PFA 1989 was amended substantially in January 2005. This chapter refers to the previous provisions before the January 2005 amendments when historical events were discussed.

7
The State Sector Act significantly changed the process of appointing departmental chief
executives and enables devolved human resources management. Chief executives were placed on
renewable performance-based fixed term contracts instead of permanent employment. The Act
also devolved responsibility to chief executives for running their departments and provided them
with unprecedented flexibility in their powers to manage human resources such as to hire and
fire staff, and set remuneration.
The Public Finance Act (PFA) 1989, embedded with the key principles of the SOE Act,
redefined the appropriation process from a focus on inputs to outputs, and established
departmental and whole of government reporting requirements (Pallot, 1996). The Act gives
departments more control of day-to-day administration, allows departments to manage their own
bank accounts and makes chief executives responsible for departmental financial management
(Pallot, 1998b). It requires appropriation on full accrual basis and subjects public sector
organisations to the Financial Reporting Act 1993 and generally accepted accounting principles.
Both the PFA and the State Sector Act were intended to install a system of performance
management in public sector organisations. There were two underpinning key ideas under PFA-
a distinction between inputs, outputs and outcomes and the notion of contractual relationships
between the departments and the government (Treasury, 1996).
Putting It Together (Treasury, 1996) provides an explanation of inputs, outputs and outcomes.
Inputs are the resources (such as capital, personnel and equipment) used to produce goods and
services. Outputs are the goods and services produced by the departments. They may include
provision of prison management, policy advice or enforcement of speed limit. Outcomes are
described as the impacts on the community of an output or class of outputs. Examples of
outcomes (see Appendix 1) include “maintain trust in government and provide strong social
services”, “improve New Zealanders’ skills” and “reduce inequalities in health, education,
employment and housing”.
In making chief executives of departments accountable for performance, the reformers of New
Zealand NPM believe that accountability can only operate effectively if the chief executives
have sufficient control over their results (Scott et al., 1997). However evaluating chief
executive's performance based on outcomes could dilute the accountability framework as many
contributory causes are often outside the control of the departments (Scott et al., 1997). Hence
outputs form the basis of performance measurement.

8
The second set of ideas is the notion of contractual relationships between the departments and
the government which was influenced by agency and transaction cost theories (Pallot, 1998a).
The government has two different interests in the activities of public sector organisations. The
first is as a purchaser of outputs from public sector organisations and requires a specific purchase
contract detailing quantity, quality, time, place of delivery and price of outputs (Treasury, 1996).
The second is as the owner of the resources held by government departments, seeking to ensure
capital assets are utilised efficiently and capacity is maintained to enable future provision of
services (Treasury, 1996).
In addition accounting and reporting requirements form a key part of the PFA. The PFA requires
all public organisations to comply with generally accepted accounting practice (PFA 1989 s.
3AA2) which means:
• Compliance with approved financial reporting standards according to Financial Reporting
Act 1993; and
• In relation to matters outside the approved financial reporting standards and not subject to
any applicable of law, accounting policies that are appropriate in relation to the relevant
entity and have authoritative support within the accounting profession in New Zealand.
Financial Reporting Act (FRA) 1993
This legislation installs mechanisms for a statutory accounting standard setting process to apply
in New Zealand. FRA deems financial reports to consist of both financial and non-financial
statements and requires Statement of Service Performance (SSP) as part of the financial reports
for public sector organisations. In alignment with the requirement of PFA, Financial Reporting
Standard Number 2 Presentation of Financial Reports requires SSP to disclose and describe the
outputs of an entity, and each output should include information on quantity, quality, time,
location and cost where they are relevant and appropriate to the users of the entity’s financial
reports. Chapter 3 provides further explanation on the reporting requirement on outputs.
2 Current provision PFA 1989 s. 2

9
Fiscal Responsibility Act 19943
This Act establishes the principles for formulating fiscal policy in New Zealand (Treasury, 1996,
p.11). It committed the government to the observation of specified principles of fiscal
responsibility, limiting government expenditure and bringing some predictability to the level and
stability of future tax rates (Fiscal Responsibility Act 1994, s. a4). The Act required regular
reports on the government's fiscal policy, including both short and long term policy, and the
consistency of that policy with the principles. A budget policy statement must be published
stating the government's long term fiscal policy in relation to the Crown's operating revenues,
operating expenses, operating balance, Crown total debt and net worth by 31 March each year
(s.5A5). The targets for these variables must be compared with the principles of fiscal
responsibility. A half yearly economic and fiscal update and a pre-election update must also be
published (s.12, s.136).
Output-Oriented Appropriation Process
The major type of appropriation to departments is for purchases of classes of outputs. The PFA
requires the Estimates of Appropriations to contain information on the link between the classes
of outputs to be purchased by the Crown and the government’s desired outcomes and assumes
outputs should achieve desired community effect (outcome). Outputs should be developed or
refined during the strategic planning phase, when a department assesses how the goods and
services (outputs) they provide best achieve the government stated objectives. Each output
should include information on cost, quantity and quality, and the actual performance of output
should be measured against target. A range of homogenous outputs is grouped into an output
class, and the output classes of a department then form the output plan that is also the
performance contract between a department's chief executive and its responsible minister. The
chief executive and his/her department are accountable for the delivery of these outputs. Output
classes, together with their full costing on accrual basis, appear as inputs to the overall
government budget process. After approval by the Cabinet each class of outputs becomes a
3 Fiscal Responsibility Act 1994 was replaced by Part 2 of PFA 1989 since January 2005. 4 Equivalent provision PFA 1989 s. 26G. 5 Equivalent provision PFA 1989 s. 26M 6 Equivalent provision PFA 1989 s. 26S

10
legally binding appropriation. Once appropriated, output classes and their respective costs
become the basis for internal and external monitoring of departmental performance.
The financial performance of government departments is assessed at two different levels: per
department and per appropriation. Appropriation may be per output class (s.7(3)(a)(i))7 or for
multi-class (s.7(3)(b)). Multi-class output expense appropriations is a single appropriation that
covers more than one output class (s.7(3)(b)). Such appropriations must be approved by the
Minister of Finance and when presented to Parliament for approval must be accompanied by an
explanation as to why the output classes have been grouped. At either level, the PFA requires
departments to spend within appropriation (s.128 ). Surplus or deficit is calculated as the
difference between departmental revenue and expenses at year end. Surplus is repayable to the
Crown, unless there is an agreement between the Finance Minister and the responsible Minister
(s.22). However the Act is silent on responsibility for a department's deficit, and generally it
requires departments to absorb the deficit and cut back its cash spending. While attempting to
spend within total departmental appropriation may require significant effort, trying to allocate
costs so each output class is not overspent at year-end is a particularly arduous task.
Measuring ‘Results’ in Government Departments
The shift in emphasis of parliamentary scrutiny and control of government from the traditional
focus on inputs towards a focus on outputs and assessment of results has received both praise
and criticism within New Zealand and internationally. Scott et al. (1997) acknowledged the
focus of holding chief executives of government departments responsible for outputs rather than
outcomes had “received much comment within New Zealand and around the world” (p.363). The
focus on output was justified on the basis that virtually all significant outcomes of government
will be influenced by a variety of government agencies; to enforce accountability of chief
executives in outcome terms would be impractical due to problems of measurability, causality,
control, and time frames.
7 s.7(3)(a)(i), s.7(3)(b) and s. 22 referred to in this page are new provisions introduced in January 2005. 8 Current provision s. 8

11
Output versus Outcome
An understanding of the distinction between outcome and output is crucial in studying the role of
performance measures in New Zealand public sector reforms. The PFA defined outcomes as the
impacts on, or a consequence for, the community of the outputs or activities of the government9.
Outcomes, or government objectives or strategic result areas are decided by the government.
Departments, via their chief executives, are responsible for the delivery of outputs while the
government ministers choose which outputs should be produced and should therefore have to
answer directly themselves for the outcomes. The production of outputs of a department is
assumed to help to achieve the government outcomes that the department should contribute to.
However to prove a direct relationship between output and outcome has proven to be a difficult
task.
An important aspect of public sector reforms is its claim of focusing on results rather than
bureaucratic procedures. This raises the question of what is meant by ‘result’. A common sense
approach suggests achieving a good result in public sector context means the effective and
efficient achievement of the desired governmental outcome. However using outputs as
performance measures dilutes the importance of outcomes. Is producing sufficient level of goods
and services by government departments in itself sufficient to discharge government
responsibility to their citizens?
Difficulties in Aligning Outputs and Outcomes
The PFA requires Ministers to identify in the Estimates the link between the classes of outputs to
be purchased by the Crown and the government’s desired outcomes must be reported as part of
the appropriation process (s. 9(2)(i)10). However, the Act does not require that outcomes be
measured nor the strategic priority identified. In addition there are a relatively high number of
Ministerial portfolios and departments and few key goals are the responsibility of a single
Minister or department. Thus it tends not to be possible to hold individual Ministers or agencies
responsible for achieving outcome goals. This has caused difficulties due to the lack of
9 The January 2005 amendment defines outcome as a state or condition of society, the economy, or the environment; and includes a change in that state or condition. 10 Current provision s.15

12
information required to demonstrate the alignment of output and outcome, and the strategic
coherence of that relationship (Office of the Controller and Auditor-General, 1999).
In addition the PFA 1989 requires the government, in the Budget Policy Statement, to specify the
broad strategic priorities by which the government will be guided in preparing the Budget for
that financial year.
To address this requirement and to overcome some of these difficulties in the alignment of
output and outcome, successive governments have developed formal strategic management
processes such as the development of the Strategic Result Areas, Strategic Priorities and
Overarching Goals, and currently, Key Government Goals to Guide Public Sector Policy and
Performance (Appendix 1). Generally speaking these are statements of broad direction that
attempt to define outcomes. They are not tightly specified, and no targets or quantifiable
measures have been developed to measure progress against them (Ussher & Kibblewhite, 2005).
Despite some progress, production efficiency is still favoured at the expense of strategic
direction-setting, and the resulting ancillary statements are not regulated and are also generally
not measurable (Office of the Controller and Auditor-General, 1999).
A number of reviews and books were published on different aspects of the Public Sector
Management System between 1991 and 2001. They include the Logan Report (1991)11, three
reviews by the State Service Commission (one in 1993 and two in 1998), the Schick Review
(1996), Third Report for 1999 by Office of the Controller and Auditor-General and the Review of
the Centre (2001), Boston et al. (1996), Scott (2001) and Norman (2003). These reviewers and
commentators generally agreed that the efficient delivery of services was a positive change since
the early 1990’s, despite the absence of evaluation data to substantiate such claim. Other positive
aspects include devolution of resource management, clearer accountability for roles and
responsibilities, greater transparency and improved information on government activities and
outputs. On the negative side, the reviewers and commentators tend to agree that there is a need
for a greater focus on the effective delivery of services and maintaining and developing the
capability of the public sector. The next section explains the most recent review - the Review of
11 Review of State Sector Reforms, Logan B (Convenor), State Services Commission, 1991 – known as the “Logan Report”.

13
the Centre and the resultant Managing for Outcome initiative together with some of the
common weaknesses identified in previous reviews and commentaries.
Review of the Centre and Managing for Outcomes
In 2001, a review of the public management system responsiveness to the needs and expectations
of Ministers and of citizens was conducted. The review acknowledged the public management
reform of the late 1980s had hard-wired an output-based management system in place (State
Services Commission, 2001). However the major finding concludes that the public management
system “provides a reasonable platform to work from, but some significant shifts in emphasis are
needed to better respond to the needs of the future” (State Services Commission, 2001, p.6).
The review sees three main areas that need attention (State Services Commission, 2001, p.3):
• The achievement of better integrated, citizen focused, service delivery, particularly where
complex social problems are dealt with by multiple agencies, making sure the system is
focused on the results that citizens and governments want in terms of outcomes and
services;
• To address fragmentation / Improving Alignment particularly through: improving
emphasis on outcomes; developing more effective, higher trust means of working
together; harnessing technology; re-examining the large number of agencies and votes,
and the tendency to emphasise vertical accountabilities rather than whole of government
interests; and
• To enhance the people and culture of the State sector, particularly building a strong and
unifying sense of values, staff and management development, and meaningful
opportunities for collective engagement in organisational decisions.
This review places emphasis on the effective delivery of services. In particular an intention to
make changes to the accountability and reporting system to put more emphasis on the
achievement of outcomes, and the capability of government agencies, as well as outputs, by
(State Services Commission, 2001, p.4):
• Providing Ministers with a stronger mechanism for shaping departmental priorities
through better engagement with departments around a statement of intent;
• Replacing purchase agreements with output plans;
• Enhanced monitoring of organisational performance.

14
The review does not propose to move away from specification of, or accountability for, the
delivery of goods and services (outputs). The review committee believes that by clearly linking
the right mix of services to intended results, they will have a significant impact on outcomes for
New Zealanders.
Following the review in December 2001, Cabinet introduced the Managing for Outcomes (MfO)
initiative that requires “all public service departments to adopt a more strategic and outcomes-
focused approach to management and reporting (State Services Commission, 2003a, p.2). MfO
“encompasses the management cycle of setting direction, planning, implementing and delivering,
and reviewing the results, which then feeds back into the cycle to inform future planning,
enabling a cycle of ongoing improvement (State Services Commission, 2003a, p.2)”.
As a result of MfO, from 2003/2004 onwards every public service department is required to
prepare and present a Statement of Intent (SOI) to parliament annually as part of the
appropriation process. The SOI is a “high level document that provides transparent information
to parliament and the New Zealand public about how the department intends to manage for
outcomes over the medium term, including information about outcomes and capability, as well
as outputs”( State Services Commission, 2003b, p.3).
Additionally output plans which outline expected outputs and their associated performance
measures will replace purchase agreements for all departments from the 2003 Budget. In
responding to departments’ proposals, output plans enable ministers to make trade-off between
quantity, quality, timeliness, location and cost of outputs and suppliers within a given budget.
MfO encourages government departments to utilise intervention logic to provide explicit
connection between outputs and outcomes. Pathfinder: Guidance on Outcome Focused
Management (Pathfinder) provides guidance to the government department on the identification
of outcomes, outcome indicators, intervention logic, assessment of impact and maximisation of
outcomes from interventions.
Pathfinder encourages the development of the vital few outcomes that covering whole of
government, inter-agency, agency and business unit outcomes. These outcomes should align
with the agency's mission or purpose; demonstrate linkage to inputs and outputs; collectively
measure major outcomes from or across all dominant output classes; measure the benefits

15
experienced by clients or entities the agency manages; support critical business decisions and
be measured reliably and economically.
Managing for Outcomes Steering Group (State Services Commission, 2002) explains the
implication of the new reporting requirements as follows:
Previous departmental planning and reporting has largely focused on financial performance and outputs within a one-year timeframe. Managing for 'outcomes' requires departments to adopt a longer term, outcome-focused approach to management, planning and reporting and can be particularly challenging for departments that have an indirect influence on the outcomes. As chief executive, you will still be held accountable for delivering outputs and for altering your mix of outputs as circumstances dictate. While you will not be held accountable for achieving outcomes, you will be held accountable for 'managing for outcomes'. This includes providing a clear account in your SOI of what you're doing (and what you plan to do) to pursue your outcomes (p. 1).
This new reporting requirement adds a layer of accountability for chief executives on top of the
accountability for the delivery of outputs. However chief executives are not responsible of the
achievement of outcomes, but to ensure the departments are taking effective interventions to
achieve them. Hence Managing “for”, not “of” Outcomes.
Can MfO initiatives focus the attention of public sector management on outcomes without a
change of the existing output-orientated system? This latest move to focus on outcomes does not
propose to change the contractual arrangement of public sector organisations for their delivery of
outputs, or to shift the emphasis from outputs to outcomes in the appropriation process. Gregory
(1994, 1995a, 1995b) believes current public sector management has assumed all tasks carried
out by public sector organisations are of ‘production’ and homogenous nature, and that new MfO
initiatives are insufficient to shift the paradigm from a focus on outputs to outcomes. So how
well can a ‘production’ type management fit into another type of environment still remains
unanswered.
Summary
A number of problems remain unresolved after more than two decades of public sector reforms.
Two of these are the lack of alignment of outputs and outcomes and the fragmentation of public
agencies. Both have contributed to ineffective delivery of public services to the citizens.

16
Consequently the Managing for Outcomes initiative has been implemented to ensure public
services are effectively delivered by putting more emphasis on outcomes.

17
Chapter 3: Performance Management and Measurement
in Public Sector
Performance Management and Measurement
It can be safely assumed that most organisations, including private, public and non-profit, want
to find ways to improve their performance. Finding the appropriate performance management
practice to improve performance has become a topic of huge interest internationally among
academics and practitioners in the last few decades. Many theories, methods and computer
programs have been developed and many consultants become available to assist organisations in
improving performance.
Origin and Concept
The concept of performance management originated in the management of private sector
organisations. It can be traced to Taylor’s scientific management that focused on controlling
production tasks and outputs in a manufacturing environment. Taylor’s time and motion study of
tasks evolved into the setting of standards and performance measures to monitor progress on
production and ensure desired objectives are achieved. Performance management is the process
of assessing management performance. Management is commonly referred to as the process of
ensuring activities is completed efficiently and effectively, with and through other people. In
general management performance is about completing an activity successfully by utilising
knowledge; as distinguished from merely processing information.
The importance of managing the whole performance process is illustrated by Baird (1986) using
a conventional model. Baird believes performance can be managed by defining the desired
results, communicating performance expectations, specifying and managing the activities to be
performed, controlling the rewards a person receives and controlling information about results
(see Figure 3.1). Performance measures are defined under the communications process. The
feedback loop ensures the process is an evolving one with possible constant fine-tuning in both
communications and activity areas.

18
Figure 3.1: Managing the performance process. Source: Baird, 1986, p.7
However setting up an effective performance management and measurement system is not an
easy task. What should be measured and how to measure require careful consideration.
Inappropriate or an inappropriate mix of measures may encourage dysfunctional behaviours that
lead to negative results. To ensure a positive performance outcome some people may modify
their behaviour in pursuing inappropriate courses of action (Hopwood, 1984; Neely et al., 1997;
Neely et al., 2003). Therefore performance measurement systems must not be static and should
constantly evolve based on feedback provided by the performance result (Courty & Marschke,
2003; Nanni et al., 1990). The next two sections discuss the two important factors when deciding
on a performance measurement system - effectiveness and efficiency, and financial and non-
financial measures.
Effectiveness versus Efficiency
The first and perhaps the most important step in developing a performance measurement process
is to establish well-defined performance measures and targets. They are essential elements of any
performance management process as they are the indicators of the effectiveness and efficiency of
policies and operational programs and processes. Efficiency is an ability to perform well or
achieve a result without wasted resources, effort, time or money. Greater efficiency is achieved
where a similar amount and standard of services are produced for a lower cost; if a more useful
activity is substituted for a less useful one at the same cost or if needless activities are
eliminated.
Goals Managed by defining desired results
Communications Managed by communicating performance expectations
Activity Managed by specifying the activities to be performed
Results Managed by controlling rewards the person receives
Feedback Managed by controlling information about results

19
Effectiveness is a measure of the ability of a program, project or work task to produce a specific
desired effect or result that can be qualitatively measured; performing the right tasks correctly,
consistent with organizational mission, vision, values and in support of the organization's goals
and objectives.
Efficiency and effectiveness are two distinct measures. Being efficient means you spend less
time, money or effort on something and can be easily quantifiable by analysing the ratio of
output over input. Being effective means doing one's job right to achieve the desired result. Thus
measures on effectiveness are often qualitative in nature.
Financial and Non-Financial Measures
Performance measures can be expressed in financial and non-financial terms. Common financial
measures include profit margins, returns on investment, turnover of stock and debt to equity
ratio. Non-financial measures can include information on turnover of employees, number of
customers' complaints and number of products launched.
There has been a general acceptance in practice that a mixture of financial and non-financial
measures in performance measurement system is beneficial for both profit and not-for-profit
organisations (Sinclair and Zairi, 2001; Ballou et al 2003). The inclusion of non-financial
measures is typically to overcome the limitations of traditional financial measures such as short-
term focus, emphasis on small groups of stakeholders and limited guidance on future actions
(Langfield-Smith et al., 2003). However the design of non-financial performance measures has
yet to be perfected (McNamara and Mong, 2005).
McNamara and Mong (2005) believe that no one single performance management system fits all
organisations and each organisation should customise its own appropriate system and measures.
McNamara and Mong (2005) point out that a successful performance measurement system
should contain information on organisational culture and risk assessment. Organisations can
adopt or adapt a range of systems such as Balanced Scorecard change and activity based
management. McNamara and Mong (2005) warn that performance measurement systems can
only be perfected with time and experience, particularly in terms of the right number of
measures, what to measure, how to measure and how to weight measures.

20
The next section examines the uniqueness of public sector organisations in relation to
performance management and measurement.
Applying Performance Management and Measurement to Public
Sector
According to Perry and Kraemer (1983), public management is “a merger of normative
orientation of traditional public administration and the instrumental orientation of general
management" (p. x). Management is commonly described as getting things done as efficiently
and effectively as possible, and generally through other people. It implies flexibility,
performance measurement and accountability on managers to achieve result. Public
administration is also concerned with accountability and effectiveness but must also focus on
core public sector values such as democracy, equity and probity. Therefore public management
can be seen as a merger between generic management which is drawn on private sector practice
and the traditional focus of public administration.
Uniqueness of Public Sector Organisations
One underlying assumption in applying private sector management practices to public
organisations is that there is sufficient similarity between the management of public and private
sectors. It can be argued that in general all organisations are made up of people who are unified
by a shared or common mission and place a high value in delivering goods and services that
satisfies their customers or consumers. In addition all organisations want efficient allocation of
resources to achieve their objectives.
In providing a differing view, Boston et al. (1996, pp. 38-39) cites a number of unique attributes
of public organisations:
• The State has a monopoly over the legitimate use of coercive power within society and
undertakes various functions that are neither duplicated in the private sector nor subject
to competition.
• There is an absence of a market assessment of the quality of management. Instead
governments are held accountable via the election, legislature and constitutional
conventions, and agents often serve multiple principals.
• There is a significant difference in the context within which public officials and their
private sector equivalent work. The conduct of Public officials’ is governed by important
constitutional principles; they are bound to different loyalties and obligations, they

21
constantly work amid high levels of political controversy and often face an uncertain
and rapidly changing political environment.
• Public organisations are often faced with multiple and sometimes conflicting objectives,
some of which cannot be measured when implementing programs. For example most
governmental outcomes are of a social or economic nature and many factors influencing
their successful achievement are outside the control of government.
• To install an incentive scheme based on profit sharing is not feasible as the non-
commercial public sector organisations do not generate a profit and the use of rewards
and sanctions for public officials is difficult, particularly given a higher degree of public
scrutiny.
• Most government agencies have a complex and functionally interdependent relationship
with each other to enable them to deliver their services effectively.
Similarly Hughes (2003) sums up four fundamental differences that affect the way public sector
can be managed. Firstly, public sector decisions may be coercive. Secondly, the public sector is
accountable to political leadership, parliament, the public, and the judicial system. The third
difference is that public sector management must respond to an ‘outside’ agenda set by the
current political leadership. Fourthly, the public sector has inherent difficulties in measuring
output or efficiency in production. Finally the public sector’s sheer size and diversity make any
control or coordination difficult.
There are therefore a number of obstacles which must be recognized before applying private-
sector type performance measurement in public organisations. Firstly, the government outcomes
that public organisations should contribute to are often social or economic in nature and involve
many variables that are outside the control of individual public organisations. Thus in many
instances these government outcomes cannot be easily linked with a set of goods and services the
organisations have produced. Secondly, many of these public organisations are professional
organisations providing public services and must adhere to different values. For example, a court
must process as many cases as possible but its judgment must be well-considered, how ever long
a case may take. Thirdly, many public organisations cooperate with third parties to provide their
services. For example, a child welfare agency works closely with education, health and justice
sectors and the community to ensure a child’s well-being is restored. Fourthly, public
organisations are answerable to numerous stakeholders including politicians and taxpayers; and
they may not have a consistent agenda. For example most government ministers prefer bad news
of their departments not being disclosed in the public arena particularly during election time.

22
However taxpayers, in general, wish to know both the good and bad news about public
organisations so they can choose to take action. The fifth obstacle is that there is no equivalent to
profitability to measure results and to provide an effective incentive scheme. The requirement for
government departments in New Zealand to return surplus to the Crown causes these public
organisations to tend to spend as close to budget as possible. Lastly there is often a lack of
market that allows clients to choose between competitors and therefore setting prices, and
comparison of performance is not always possible.
Despite the fundamental differences between the two sectors, private sector practices have been
applied to performance measurement in the public sector. To simulate a controlled environment
to enable a performance measurement system to work, and to hold departments accountable for
results, New Zealand has introduced a process where controllable and measurable elements such
as goods and services produced by government departments have become key performance
measures. To reinforce sanctions and rewards available to the ministers, chief executives are
given renewable fixed term employment contracts that are subject to satisfactory performance,
including the delivery of a set of goods and services specified in the output plans.
Different Types of Public Organizations
Despite common characteristics public organisations are not uniform and can be grouped into
different types. Wilson (1989) provides a useful illustration of different types of public
organisations in his major work on America public bureaucracy where he differentiates among
public organisations according to the observability of an agency’s outputs and outcomes.
Gregory (1995a) further develops a four-way matrix to depict this differentiation.
Workers of ‘production’ organisations can be assessed on their achievement of observable
outputs and outcome. In 'procedural' organisations workers' compliance with rules and
procedures are assessed given that the outcome cannot be observed. In 'craft' organisations
compliance with outcome will be assessed rather than the processes or outputs. 'Coping'
organisations face the biggest challenge, as neither outputs nor outcome can be observed.

23
Observable Unobservable
Obs
erva
ble
Production Procedural
Uno
bser
vabl
e
Craft Coping
Outcomes
O
utpu
ts
Figure 3.2: Wilson’s four-way matrix of public organisations
Source: Gregory, 1995a, p.58
In Wilson's opinion, different mixes of incentives are required to encourage operators to comply
with agency rules. Therefore each type of organisation is characterized by a different type of
management culture. Production organisations are agencies in which both outputs and outcomes
can be observed. Given clearly defined outcomes and outputs, it is possible to design and report
on systems that measure progress towards these outcomes. Procedural organisations are agencies
in which outputs but not outcomes can be observed. Therefore how the job is done (process) is
more important than if doing the job produces the required outcomes. Craft organisations are
agencies in which outcomes but not outputs can be observed. Managers can evaluate and reward
operators on the basis of the result (outcomes) they achieve. Capability (employee skills) and
shared commitment towards outcomes are likely to be important in a craft organisation. Coping
organisations are agencies in which neither outputs nor outcomes can be observed – there may be
few or no objective, readily observable measures appropriate for the agency. Effective
management of coping organisations can be difficult if not almost impossible.
Many public entities will have characteristics of more than one of these classes, as each such
public organisation has multiple job functions. For example, the payroll and account payable
sections of all public organisations are of production nature but the front line operation of these
organisations may be of a different type.
New Zealand public sector management system assumes all public organisations, including
government departments, belong to the production type (Gregory 1994, 1995a, 1995b). The use
of outputs as key performance measures and the reliance of contractual arrangements to achieve
accountability for results have caused a number of difficulties for some public organisations.

24
Requirements under the New Zealand Accounting Standards
This section explains the requirement under the New Zealand accounting standards in relation to
the reporting of outputs.
Financial and Service (Non-Financial) Performance Reporting
All departments are required to provide a forecast of financial statements and produce half-
yearly and annual financial statements. The annual financial statements are subject to audit and
included in the department’s annual report. Financial Reporting Standard 2 Presentation of
Financial Reports (FRS 2) requires financial reports to include:
• A statement of financial performance;
• A statement of movements in equity;
• A statement of financial position;
• A statement of cash flows (where not exempted);
• A statement of service performance (where not exempted); and
• Such accounting policies and explanatory notes as a reader may need to understand the
entity’s financial and non-financial performance, financial position and cash flows.
The reporting of non-financial aspects of performance is mandatory as part of the financial
reports for government departments. In forecast financial statements a department is required to
include a statement of forecast service performance (PFA s. 42(1)(e)(ii)) which specifies the
department’s forecast non-financial performance for each class of outputs. These outputs are
required to link to the government’s desired outcomes in the Estimates (PFA s. 15(1)(a)). In the
annual financial statements a department is required to include a Statement of Service
Performance (SSP) which shows for each class of outputs performance achieved compared to
performance forecast in the statement of objectives (PFA s. 15(1)(b)). SSPs are included in the
annual report of the department and are subject to audit.
In 2002 the Institute of Chartered Accountants of New Zealand (ICANZ) issued Technical
Practice Aids 9 Service Performance Reporting (TPA-9) to provide guidance to the
specification, measurement and reporting of service performance. Consistent with the intent of
the PFA, it sees outputs as the basis for accountability. It acknowledges that not-for-profit
organisations face different degrees of difficulty in defining outputs and has suggested the use of

25
OECD Output Manual to classify outputs into four quadrants of a matrix. This matrix (Figure
3.3) is based on the relationship between knowledge of the production process and the number of
exception12 of the specification and measurement of outputs.
Production process are well-articulated Production process are not articulated
F
ew E
xcep
tion
s
Quadrant 1: Certain Quadrant 2: Rely on Predictability
Administration of transfer payments Case managementAdministration of regulation InvestigationsArchival services Promotional servicesBorder Control ProsecutionsCollection services Teaching servicesFinancial auditsMinisterial support serviceTransport services
Quadrant 3: Rely on Known Process Quadrant 4 : Uncertain
Contingent military capabilities CounsellingEmployment placement services Diplomatic representative
Emergency response services Policy advice
Patrol and surveillance Research
Prison management/custodial services Resolution and mediation servicesQuarantine services Species recovery management
Residential care
Reviews/audits (non-financial)
Knowledge of Production Process
Few
Exc
eptio
ns
Man
y E
xcep
tion
s
Nu
mb
er o
f Exc
eptio
ns
Figure 3.3: Examples of different types of outputs
Source: ICANZ, 2005, p.27
Quadrant 1 is similar to Wilson’s production type of public organisations. Outputs are relatively
certain/observable and tend to be standardized, high-volume and repetitive in their nature. Thus
outputs should be relatively easy to specify and measure.
Quadrants 2 and 3 resemble a mixture of craft and procedural type in Wilson’s typology. In
quadrant 2 the production process may be difficult to articulate in advance and the delivery of
outputs relies on the technical skills and/or the professional judgment of staff. Measurement of
actual performance relies on assessment by internal peer reviewers and external reviews.
12 According to TPA-9, few exceptions mean outputs tend to be standardised in nature; and many exceptions mean outputs tend to be relatively non-standard.

26
Quadrant 3 outputs tend to be non-standard with high levels of routine activities. A mixed of
measurement similar to quadrant 1 and 2 is required.
Similar to the coping organisation in Wilson’s typology, quadrant 4 outputs are the most difficult
to be specified and measured as they are non-standard, highly tailored with a significant degree
of variation in the production processes. It recommends a self-assessment and peer review for
measurement of performance, reinforced by external reviews.
In addition TPA-9 identified five principles and tests (see Table 3.1) in assessing whether an
output specification and its related measures are regarded as well-defined. These principles are
external focus, controllable, comprehensive, measurable and informative.
Principle Test External focus The output describes a distinct product or service.
The output is a final product or service that is delivered externally. It does not relate to inputs, processes, management systems, outcome and/or internal outputs. The outputs reflect the purchaser's interests and priorities.
Controllable Output specifications appropriately reflect the extent of control over the delivery of each output.
Comprehensive The outputs reported in the Statement of Service Performance (SPP) incorporate all of the outputs that were delivered by the entity. This includes outputs where delivery has been subcontracted to another party. It also includes all outputs funded by parties other than ratepayers or taxpayers - for example, outputs funded through user charges. While comprehensive coverage is important, the aggregation of similar outputs is expected in most cases. This is a similar concept to the aggregation of financial elements. Aggregation should be at a level that conveys a meaningful understanding of outputs purchased without obscuring what is being purchased and/or burying the reader in detail. Outputs should be aggregated according to the nature of the activity, not the recipient, the delivery location or the funding mechanism.
Measurable Output specifications provide clear descriptions and standards against which actual performance can be judged.
Informative Output descriptions are sufficient to meet the information needs of a relatively new or unfamiliar user of the information.
Table 3.1: Principles and tests for well-defined output and output measures Source: ICANZ, 2005, pp.28-29

27
These principles and tests of well-defined outputs will be checked against specific current
outputs of the Collections Unit and CYF.
Summary
Improved performance is a common pursuit among organisations. The concept of performance
management and measurement has been introduced to public sector organisations from the
private sector. However public sector organisations operate in a unique and different
environment from their private sector counterparts. Despite their uniqueness, public sector
organisations can be classified into four different types according to the observability of their
outputs and outcomes. Each type requires its own style of management and measurement.

28
Chapter 4: Research Method
Research Objective and Questions
The objective of this thesis is to describe, explain and explore the development of outputs as
performance measures in New Zealand public organisations under the current MfO initiative.
Four specific research questions were identified.
1) How were outputs applied as performance measures?
2) What were these outputs and how did they link with the intended outcomes?
3) What was the effect of using outputs as key performance measures and why?
4) How useful have outputs been as performance measures?
Research Method As this thesis seeks to describe and explain the development of the use of outputs as performance
measures in public sector organisations, a qualitative research approach was used. A case study
method is adopted in this thesis. Yin (2003) defines case study as an empirical inquiry that
“investigates a contemporary phenomenon within its real-life context, especially when the
boundaries between phenomenon and context are not clearly evident" (p.13). The requirement to
develop effective performance measures particularly under the current Managing for Outcomes
environment, has become a common phenomenon in New Zealand public organisations. This
phenomenon cannot be isolated from the context of the evolving public management system and
the resulting responses of individual public organisations.
This thesis satisfies Yin's (2003) three conditions on whether case study method as appropriate
strategy. Firstly, it seeks to understand the process (how) and the reasons (why) for the
development of performance measures. Secondly, the investigator has no control over the actual
behavioural events. Thirdly, while the focus of this thesis is on contemporary events, its
historical context was also examined.
Multiple information sources are important for triangulation and enriched analysis (Yin, 2003).
The sources used in this research include a comprehensive literature review, interviews and
document analysis.

29
Chapter 3 reviews the literature describing the New Zealand public sector performance
management system. Chapter 3 discusses current literature review on performance measures.
Interviews
Eleven interviews involving 15 participants were conducted on a semi-structured nature. Notes
were taken during all interviews and these interviews were recorded on voice recorder.
Transcriptions and summaries of the interviews were prepared.
Two sets of questions were used as a guide for the interviews. The first set of questions, which
required more detailed information, was used to interview participants who worked at the third
and fourth tier level of the organisation. The second set of questions which required an
organizational perspective, was used to interview participants who worked at the first and second
tier of the organisations. In all interviews the conversation flowed relatively unrestricted and
areas of interest were explored as they emerged.
Participants were chosen principally according to their association with the performance
measures, such as being the developers of performance measures or different levels of managers
and staff who need to manage and report performance measures.
To encourage an open and frank discussion from interviewees, they were assured of anonymity.
In addition, all interviewees were asked to elect the time and place for the meetings. This was to
ensure the interviewees were comfortable in their environment, to facilitate the discussion of
potentially sensitive issues and preparedness to express a personal view.
The interviews took place in Wellington and Christchurch between July and November 2005. All
interviews proceeded smoothly and all the participants were very cooperative. Follow up
information was collected through e-mails and post.
The interviewers provided important insight into the development of performance measures at
different organisational levels within the two case organisations. The interviewees shared their
understanding and opinion of the use of outputs and performance measures in relation to their
work. Whilst some voiced opposing opinions from that of the central agencies, they provided
valuable suggestions on how the performance measures can be improved.

30
Documentary Source Materials
A number of documentary sources have been used in this research. They include publications by
the case study organisations, publications about the case study organisations, and other
publications on public sector management.
Publications by the case study organisations including public reports such as Annual Reports,
Statement of Intents, Briefings to Ministers, and various internal documents supplied by the staff
of these organisations.
Publications about the case study organisations including two case studies on Collections Unit by
Victoria Link Limited, Judge Brown’s review on the Department of Child, Youth and Family
Services (CYF) and The First Principles Baseline Review on CYF.
Other publications on public sector management and public sector reform from a number of
sources on topics related to Managing for Outcomes, general public management, performance
management in public sector, performance measures and service performance were reviewed.
This includes public reports published by State Service Commission, The Treasury, Office of the
Auditor General and Institute of Chartered Accountants of New Zealand. Other sources include
articles and books by New Zealand and overseas commentators.
Gaining Approval to Undertake the Research
The two case organisations are high profile government agencies. To conduct research in any
government agency requires specific permission from them. Approvals for this research were
received from Ms. Jenny Norton, the General Manager of the Collections Unit, and Mr. Chris
Ross, Chairperson, Research Access Committee of CYF. Their approval was subject to receipt of
a draft copy prior to finalisation of the thesis. This is to provide an opportunity for them to
correct any factual information. Both letters are attached in the appendixes 4 and 5.
While the Collections Unit approval process went smoothly, it was more difficult to obtain
access to CYF initially. CYF was undertaking major restructuring and experienced a high
turnover in their National Office in early 2005. My research access request was misplaced due to
the resignation of an administrator, which caused significant delays in the approval of this
31
research. Fortunately with the help of CYF staff approval was granted in July. In addition with
the perseverance of individuals within and outside of the organisation an important contact
person was found within CYF. Without this support access to CYF staff would have been
extremely difficult.
Motivation for Research
I worked as a public servant between 1992 and 2001 - as Finance Manager for Collections Unit
between 1998 and 2001; and in a number of finance positions for Income Support, a business
unit of Department of Social Welfare, between 1992 and 1998. As a result I have experience of
the operational and strategic challenges faced by public organisations and have become
interested in public management issues.
Research Design
With the objective of this thesis in mind - to investigate the performance measure developments
in public organisations, the study propositions were:
1. Outputs are used as key performance measures externally and internally.
2. Outputs should have characteristics of causality, controllability and measurability as they
are key performance measurement tools to hold public managers to account for results.
3. Public organisations are not homogenous and cover all four parts of Wilson's (1989)
typology. However the public management system treats all public organisations as if
they belong to a simple production sector in terms of performance management.
4. Applying outputs as performance measures may work well for a production type public
organisation but there may be complications due to the peculiar tasks of these
organisations.
The main unit of analysis is the development of outputs as performance measures in New
Zealand public organisations. The sub units of analysis are the two case organisations. These
organisations were chosen because on the surface they represent two different types (production
and coping) of public organisations according to Wilson's typology. In investigating the
development of performance measures in these two organisations will provide evidence to
confirm or deny the above stated study propositions.

32
Limitations of Research Method
Using Mckinnon's (1988) identification, the threats to validity and reliability of this research are
data access limitations and the complexities and limitations of human minds.
Data access limitations may occur as the researcher was not present to observe the historical
background of the phenomenon that may be important to the current setting. In addition it is
possible to miss crucial documents. Data access may be restricted by the research hosts to certain
documents, people or events.
The complexities and limitations of the human mind mean that the statements made by the
people interviewed cannot be taken at face value. The subjects may intentionally seek to mislead
the researcher; or the statements made by the subjects may be affected by natural human
tendencies and fallibilities, such as forgetfulness, selective memory and bias.
Strategies and tactics to cope with these potential problems were employing multiple sources of
evidence that allowed the researcher to address a broader range of historical, attitudinal, and
behaviour issues (Yin, 2003). Multiple data sources (data triangulation); assess different
perspective on the same data set (theory triangulation); and different methods (methodological
triangulation) were utilized to minimize the above mentioned possible threats.
Ethical and Regulatory Approvals
As this case study research is of two organisations and does not involve gathering personal
information of a sensitive nature about or from, section 3f of the Human Ethics Committee’s
(HEC) guidelines state that this type of research does not require the approval from HEC.
However much effort was taken to adhere to the HEC principles and guidelines when conducting
this research, with appropriate regard for ethical principles and cultural values which include
justice, safety, truthfulness, confidentiality and respect. Principles of the Treaty of Waitangi were
observed in this research. The responsibility for this research and conformation to the HEC
Principles and Guidelines rested with the researcher and the Head of Department/School.

33
Chapter 5: Collections Unit
Background
Collections Unit was formally established as a distinct business unit of the Department for
Courts (DFC) in January 1996. Its key responsibility was to boost the effectiveness of fines
administration and enforcement, and therefore enhance the credibility of the criminal justice and
civil debt repayments system (DFC, 1996a).
Currently Collections Unit is a business unit within the Ministry of Justice (MOJ) following the
merger of DFC and the previous Ministry of Justice in October 2003. Other than the Collections
Unit, other operational units of MOJ include District Courts, Higher Courts and Special
Jurisdictions.
Other than fines operation, Collections Unit is also responsible for the enforcement of civil court
orders and collection of civil debt. Civil activities, which represent approximately 25% of
Collections Unit workload, are excluded from this research due to the limited timeframe and
resources available to the researcher.
Fines Compliance Process13
The Collections Unit's primary business relates to the collection and enforcement of fines. These
include fines imposed by the Court for major criminal offences, minor criminal offences often
referred to as Court-imposed fines (CIF); fines that are a result of unpaid infringements (e.g.
traffic and parking tickets) and which have been lodged with the Court for enforcement; Court-
ordered payments to victims (reparation, restitution, part-payment of fine) which are grouped
with CIF for the purpose of this thesis. Similarly associated infringement filing fees, court costs
and enforcement fees will be included in either CIF or infringements and not be disclosed
separately.
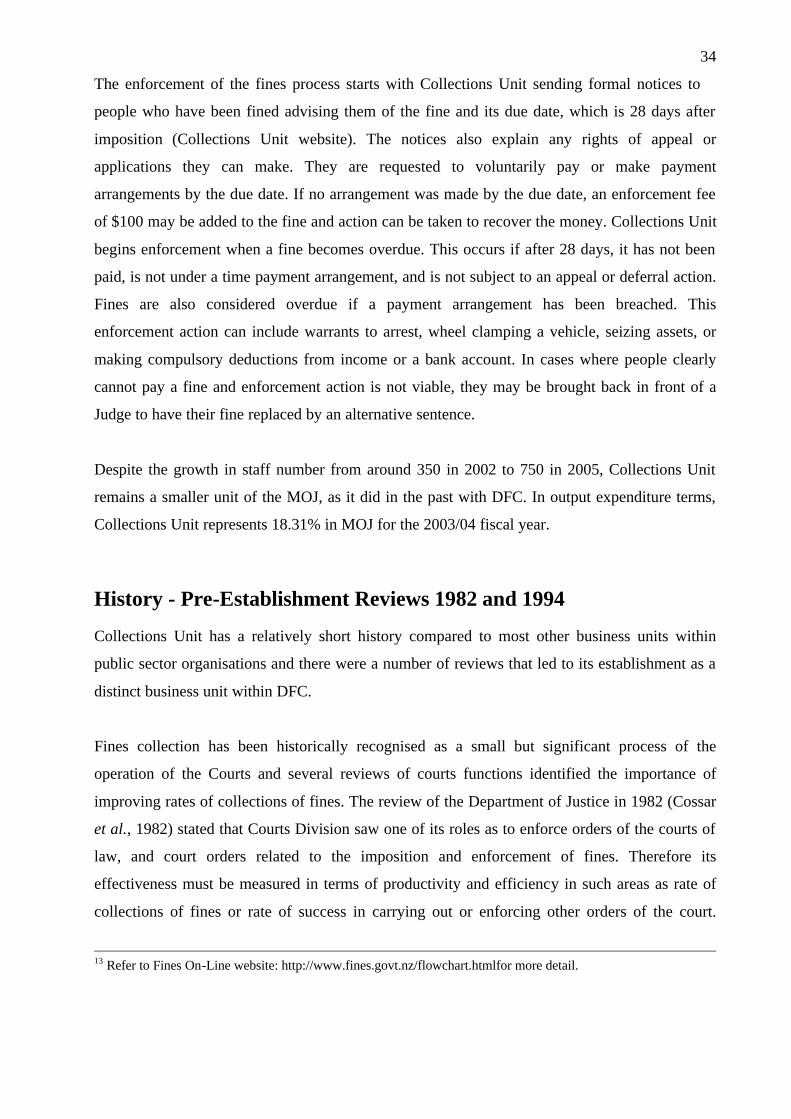
34
The enforcement of the fines process starts with Collections Unit sending formal notices to
people who have been fined advising them of the fine and its due date, which is 28 days after
imposition (Collections Unit website). The notices also explain any rights of appeal or
applications they can make. They are requested to voluntarily pay or make payment
arrangements by the due date. If no arrangement was made by the due date, an enforcement fee
of $100 may be added to the fine and action can be taken to recover the money. Collections Unit
begins enforcement when a fine becomes overdue. This occurs if after 28 days, it has not been
paid, is not under a time payment arrangement, and is not subject to an appeal or deferral action.
Fines are also considered overdue if a payment arrangement has been breached. This
enforcement action can include warrants to arrest, wheel clamping a vehicle, seizing assets, or
making compulsory deductions from income or a bank account. In cases where people clearly
cannot pay a fine and enforcement action is not viable, they may be brought back in front of a
Judge to have their fine replaced by an alternative sentence.
Despite the growth in staff number from around 350 in 2002 to 750 in 2005, Collections Unit
remains a smaller unit of the MOJ, as it did in the past with DFC. In output expenditure terms,
Collections Unit represents 18.31% in MOJ for the 2003/04 fiscal year.
History - Pre-Establishment Reviews 1982 and 1994
Collections Unit has a relatively short history compared to most other business units within
public sector organisations and there were a number of reviews that led to its establishment as a
distinct business unit within DFC.
Fines collection has been historically recognised as a small but significant process of the
operation of the Courts and several reviews of courts functions identified the importance of
improving rates of collections of fines. The review of the Department of Justice in 1982 (Cossar
et al., 1982) stated that Courts Division saw one of its roles as to enforce orders of the courts of
law, and court orders related to the imposition and enforcement of fines. Therefore its
effectiveness must be measured in terms of productivity and efficiency in such areas as rate of
collections of fines or rate of success in carrying out or enforcing other orders of the court.
13 Refer to Fines On-Line website: http://www.fines.govt.nz/flowchart.htmlfor more detail.

35
Similarly the 1991 November Scoping Study: Police and Justice prepared by State Service
Commission to the Expenditure Reduction Committee stated: “...for fines to retain its credibility
it is essential that there be an effective system in place to ensure that a high proportion of those
imposed are paid. Any alternative, should fines fail to be credible, is likely to be considerably
more expensive"(p.32).
However there were also opinions expressed that fines and fines related work should be
contracted out from courts operation. The 1991 review questioned the appropriateness of Courts
enforcing fines for local authorities and considered the contracting out of fines (p. 33). A similar
view was also expressed in the 1994 Report of the Courts Services Review Committee that the
collection of infringements initiated by either local authorities or the Police was considered a non
core business and should be discontinued or attributed to a more suitable agency. The 1994
review considered fines administration as essentially debt collection and the collection of court-
imposed fines was also regarded a non core business. In addition the executive/service of Writs,
Warrants and Orders undertaken by bailiffs should be privatised.
The 1994 review acknowledged several reasons to continue fines collection activities within the
courts system. The first is that fines collection needs to maintain a close operational connection
with local courts, particularly at the “front end” when sentencing occurs, to ensure either that
payment was made on the spot or that satisfactory arrangements for subsequent payments were
made. The second reason involved a concern for public interest, particularly for balancing the
potentially serious consequences for dependants of the individuals fined with how forcefully
debt collection and asset seizure were to be exercised. In addition bailiffs who exercised coercive
powers to enforce orders of the courts also needed to be carefully managed and monitored. The
review therefore concluded that an effective fines collection and enforcement needed to occur to
make fines a credible sanction, to improve fines revenue, and to limit the substitution of more
costly alternative sentences.
Consequently the 1994 review decided that an internal structure that recognised fines
administration as a distinct operation was needed. The committee recommended that a separate
Department for Courts be set up on 1 July 1995 with a new emphasis on enforcing monetary
penalties. In January 1996 Collections Unit was formally established as a distinct business unit
of DFC

36
1996 - 2000
This period was a time of transformation. The establishment of Collections Unit as a distinct
business unit involved major restructuring of its culture, strategies, processes, people and system.
Establishment in Jan 1996 – New Emphasis on Enforcing Monetary Penalties
Collections Unit recognised at its inception that poor performance of the collections process
could largely be measured by an increasing level of imposition that if left uncollected, led to an
ever-growing ‘lake’ of overdue fines. The increasing level of overdue fines reduces the
effectiveness of the use of monetary penalties as a credible sentence (Norman & Smith, 1998).
Nature of Fines
Collections Unit also recognised that inadequate or out of date information was a key challenge
to effective collection, particularly evident in the collection of infringements (Smith, 2000).
Infringements are more difficult to collect than CIF for several reasons. Firstly, in setting a CIF,
the Court is required to consider the finances and responsibilities of the offender. This can mean
that CIFs are set according to an individual’s ability to pay. On the other hand infringement
fines, which are usually a fixed amount, are imposed without the assessment on ability to pay.
Secondly, Collections Unit has more control over the quality of information it gathers on people
who are fined in court. Thirdly, Collections staff can arrange payment with people who have
incurred CIF before the offenders leave the courthouse. However Collections Unit does not have
the same control over infringement information and relies on information provided by
prosecuting authorities. This information is often insufficient or out of date and as a result
infringement offenders are more difficult to trace and consequently the fine is more costly to
collect. Fourthly, Collections Unit is pursuing infringements that are already harder to collect as
presumably people who wished to comply with the infringement notice would have paid within
the stipulated time. Most infringement offenders have 56 days to pay before the infringement is
lodged in court.
Change to ‘More Money Sooner’ Culture
A benchmarking project in 1996 showed that the single most important factor in collecting fines
was speed – the sooner a fine was followed up, the more likely it was to be collected (Norman &
Smith, 1998). The longer it was left, the less likely it was that the correct contact details would

37
be available. For court-imposed fines, "court walkers" would escort people from the court to a
deal room to arrange a payment immediately after they have had a fine imposed in court. For
infringements, proactive phone contact would be made by Collections Unit staff once the
infringement is lodged in court and before it is overdue. The key driver, therefore, was to shift
the unit’s focus from enforcement – the more difficult and expensive part of the process – to
collecting fines up front. ‘Collecting more money sooner’ became the catch cry.
To accompany the new attention to collect more money sooner, Collections Unit planned for a
new delivery structure, new collection processes, new information technology system, more
empowering legislation and more importantly a new culture (Norman & Smith, 1998). The focus
to shift the unit’s culture from enforcement to one of delivering a customer service was a critical
transformation for the Collections Unit in 1996 (Norman & Smith, 1998). Treating fine debtors
as ‘customers’ was an unusual concept in public sector. In practice, improvements in the delivery
of customer service transpired to widening payment methods, such as the introduction of credit
card, EFTPOS and internet payment facilities, together with more user friendly opening hours
for collections offices (DFC, 1996a). However if 'customers' chose not to pay, Collections Unit
will track them down to deal firmly with them.
1996 Business Case
In 1996, the government approved the business case put up by Collections Unit to fund its new
structure, process and information system. Cost and benefit analysis showed that the DFC and
the Crown would benefit by a net $90 million, with a net present value of $37 million, from the
project within 10 years, (Norman & Smith, 1998). With a total investment of $98 million, the
project was expected to break even within three years (Norman & Smith, 1998). Collections
Unit’s challenging cash collection targets were set by this business case, with some adjustments
later due to the delay in implementing the new information technology project.
1996 – 2000 Strategic Plan and Implementation
In the same year, Collections Unit embarked on a four-year strategic planning period to achieve
a vision of "greatly improved performance and continuous business improvement" (DFC, 1996b,
p.12). Between November 1996 and April 1997 Collections Unit implemented a major
restructuring which involved establishing 23 district offices, redefining roles for staff,
implementing new processes and practices, introducing new technology and setting up a
technology-driven call centre (Norman & Smith, 1998). A successful television advertisement

38
campaign was delivered in 1996. Legislation was enhanced in 1996 including equipping
bailiffs with 100 wheel clamps to immobilise the vehicles of people with overdue fines and the
publication of names of fines defaulters in newspapers (Norman & Smith, 1998). Later in 1998,
legislation allowed collection officers' to extract money from fines defaulters’ wages and bank
accounts, and extension on information matching with the Department of Work and Income and
the Inland Revenue Department (refer to Summary Proceedings Amendment Act (No. 2) 1998).
However the planned technology was delayed from the planned date of mid 1998 to 2002; and
the information matching with Department of Work and Income began in 1999 and with IRD in
2002.
The successful cultural, structural, legislative, process and technology change from an
enforcement orientated culture to a collection one between 1996 and 2000 had enabled
Collections Unit to improve its performance as illustrated by the foreword in Collections Unit
Strategic Plan 2000-2005 and Business Plan 2000-2001:
In the year to 30 June 2000 we collected $133 million, which represents an increase of 87% compared to 5 years ago when we collected $71 million. We have $115 million of fines under payment arrangements compared with 5 years ago …we have achieved these results with very little extra resource so that productivity has increased dramatically from $384,000 collected per person to $614,000 in 2000 (DFC, 2000 p.2).
Emerging Issues
Despite these achievements, Collections Unit remained concerned about several issues. Firstly,
the 'lake' of unpaid fines had continued to grow, mainly driven by the substantial increase in
infringement fines. Of these new impositions approximately 75% of them came from Police. The
level of infringement lodged in courts has increased from $71m in 1996 to $139m in 2000 and
resulted in overdue fines increasing from $123m to $186m. Secondly, Collections Unit had
started to notice a number of people were repeat offenders and as a result some were on
permanently reduced income. The repeat offending has compounded the hardship for families of
this group of offenders. Thirdly, there were constant reoccurrence of unintended consequences as
a result of the pressure to achieve cash collected and other output measures. The unintended
consequences were most commonly demonstrated in ‘deal poaching’ and month-end transfer of
‘unwanted customers’ list. 'Deal poaching' occurred typically where court Y imposed a huge fine
on client A whom should be dealt by the domiciled collection district unit Y. District unit X
transferred customer A’s file to X site through the computer system and proceeded to collect
direct from customer A. As a result district unit X improved its collection result at the expense of

39
office Y's. This 'poaching' was not restricted to the district level and on numerous occasions
call centre staff were caught 'stealing deals' from district units too. Month-end transfer problems
occurred in a number of districts where ‘unwanted customers’ were transferred out of their lists
in the computer system to other districts to improve rating in their timeliness targets and
'transferred back' a day later. This practice occurred so frequently that most district managers
wasted valuable hours scrutinising their computer records on the last day of the month to ensure
corrective action could take place if such transfer occurred.
Some of these concerns led to the broader focus in the next phrase of the strategic plan. While
cash collection was still retained as a key component; the correction of the dysfunctional
behaviour was mainly rectified by the system design of the new information technology.
2000 - 2005
This period was characterised by a number of significant changes. It began with the departure of
its long serving General Manager, Murray Short, who was replaced by the current General
Manager, Jenni Norton. The long awaited information technology was implemented
progressively from October 2001 and has provided much improved management information to
enabled process improvement. Two successful business cases in 2002 and 2003 allowed much
needed additional capacity to keep pace with the increase in new fines.
2000-2005 Strategic Plans
In 2000 a new five-year strategic plan for the DFC was developed with a vision to "help make
New Zealand a more just and safer place through the promotion of law-abiding behaviour by
ensuring compliance with monetary orders" (DFC, 2000, p. 4). The goal for 2005 was "to be a
model of best practice, actioning 100% of fines and civil documents in a fair manner and in
accordance with the law" (DFC, 2000, p.8).
The continuous growth in the 'lake' of unpaid fines that mainly caused by the high imposition of
infringement had resulted in Collections Unit seeking additional resources to combat the
problem.

40
2002 and 2003 Business Cases
A business case to increase Collections Unit capacity to keep pace with the growing rate of
infringement imposition was approved by the government in 2002. The additional funding of
$36 million over the next four years was to expand and upgrade its Collections Unit call centre
capacity in a phased programme from 1 September 2002 to 30 June 2006 (DFC, 2002). This
phased programme included new call centre premises and enhanced technology to support the
flow of call centre work more efficiently. This would allow the collection units to focus on
physical enforcement activities while call centre focus on making contacts with people who
incurred fines. The expanded call centre capacity was expected to enable Collections Unit to
collect an additional $90 million over four years including $22 million reparation payments for
victims of crime (DFC, 2002).
Again in 2003 the steady increase in infringement fines imposition faced by Collections Unit led
to a review of its structure and capacity. In addition there was a requirement to comply with
health and safety legislation. These led to an increase in funding of approximately $31 million
and an increased of cash collection target of approximately $67 million over the next four years
(MOJ, 2004a). This funding enabled 63 new staff to be appointed to the call centres and the
establishment of a centralised processing unit. 30 additional field staff was also employed to
ensure compliance with the new health and safety legislation when dealing with cases where
there was risk of violence, and to support staff in the National Office.
The new information technology system COLLECT was fully operational from 2002 onwards
and has provided Collections Unit with much needed management information. Collections Unit
is able to access the fines database directly and has utilised the information to produce timely,
regular and ad hoc management information. The database has also enabled profiling of fines
debtors so different collection strategies can be used to target different types of fines debtors
such as the confiscated car club campaign in 2004.
However the transition from the previous Law Enforcement System to COLLECT has caused
some disruption to collection activities and has impacted on fines collection during 2002 fiscal
year (DFC, 2002). As a result, the target for cash collected was altered for 2002.
Other initiatives were implemented during this period that were aimed at improving information
on fine defaulters. Data matching with IRD which commenced in May 2002 provided
Collections Unit with a new source of information on fine defaulters (DFC, 2002).

41
Developmental work was expected to commence in 2005 on initiatives to catch fine defaulters
at the airports when they leave or enter the country, approved by the government in 2003 (MOJ,
2004b). Publication of fines defaulters’ names in newspapers was approved by the government
in Oct 2004 and has been utilised by Collections Unit in a national campaign in late 2004 and
early 2005 with much success (MOJ, 2004b).
Other work programmes to improve the quality of fines debtors information took place include
working with prosecuting authorities to assist with developing processes to improve their own
collections rates and to only file infringements that contained accurate information in courts
(MOJ, 2004b). In addition changes were sought in legislation to introduce mandatory electronic
filing of infringement notices by prosecuting authorities (MOJ, 2004b).
Summary
Since its inception in 1996, Collections Unit has been subjected to a number of significant
changes. It has adjusted its organisational structure and work processes constantly, updated its
information technology and continued to influence legislation to achieve its goals.

42
Chapter 6: Department of Child, Youth and Family
Services
Establishment of CYF
The Department of Child, Youth and Family Services was established on 1 October 1999
following the integration of two Department of Social Welfare business units: the Children,
Young Persons and Their Families Service and the New Zealand Community Funding Agency.
CYF has a variety of roles in dealing with children and young persons. It has a statutory
responsibility to intervene, protect and help children who are being abused or neglected or who
have problem behaviour. Under the youth justice system CYF works with the police and the
courts in dealing with young offenders. CYF provides residential and care services for children
in need of care and protection and for young offenders. CYF also approves and contracts with
community organisations for social services for children, young people and their families. CYF
also assesses people who wish to adopt children and provides report to the Family Court on
adoption application. In addition CYF provides information to adopted people, birth parents and
people who wish to adopt children when required.
Due to time and resource restriction, this thesis evaluates only the performance measures utilised
in care and protection area only. Care and protection work is made up of about 75% of CYF total
work.
Care and Protection Process14
The Children, Young Persons and their Families Act 1989 (CYPF Act) is the key legislation
governing New Zealand child care and protection system. Under this Act statutory power is
vested in the Chief Executive of CYF and in social workers and Care and Protection coordinators
14 Refer to CYF website: http://www.cyf.govt.nz/1258.htm for more detail.

43
appointed by the Chief Executive. There are two important duties required of the Chief
Executive under the Act. The first duty is to:
Promote, by education and publicity, among members of the public (including children and
young persons) and members of professional and occupational groups, awareness of child abuse,
the unacceptability of child abuse, the ways in which child abuse may be prevented, the need to
report cases of child abuse, and the ways in which child abuse may be reported (s. 7(ba)(i),
CYPF Act 1989).
The second duty is to:
Develop and implement protocols for agencies (both governmental and non-governmental) and
professional and occupational groups in relation to the reporting of child abuse and monitor the
effectiveness of such protocols (s. 7(ba)(ii), CYPF Act 1989).

44
Figure 6.1: The care and protection process Source: CYF website

45
A large part of the work of CYF is to ensure children have the care and protection they need to
keep them safe from experiencing harm, ill-treatment, abuse, neglect and deprivation (CYF
Website). A child is believed to be ‘at risk’ if they are suffering from, or likely to suffer from
physical or sexual abuse, violence or conflict between their caregivers, emotional or physical
neglect, behaviour which is beyond their or their caregivers’ control, or lack of stable or
adequate care (CYPF Act Amendment 1994, s2,1). CYF’s official website provides a detailed
description of the care and protection process (see Figure 6.1). This process is summarised in the
rest of this section.
When a report of a child or a young person may be ‘at risk’ is made, it is assessed by a social
worker to determine whether or not a family or whanau will need CYF services. This intake
process makes a preliminary assessment of the level of risk to the child or young person and to
plan an appropriate investigation or intervention. This process aims at ensuring the child or
young person's immediate safety. A risk estimation assessment must be completed for every case
where a social worker reasonably believes that child abuse or neglect has occurred.
In determining an appropriate response, the social worker taking the initial information will
consult with their supervisor on whether to initiate:
• Immediate service. The social worker provides a service there and then and takes no
further action. This is appropriate if immediate advice or information was wanted.
• Onward referral. The caller is referred on to a more appropriate agency that specialises in
the type of service needed.
• Further Child, Youth and Family involvement. If this is the case, the degree of urgency is
determined.
In more serious cases when a child or young person is believed to be in need of care and/or
protection, the care and protection resource panel is consulted and a family group conference is
called.
When problems are found to be serious, a social worker must, as soon as is practical, undertake
or arrange an investigation into the report of abuse and, once that has begun, must consult with a
care and protection resource panel about the investigation.
The welfare and interests of the child or young person should be the first and paramount
consideration. Intervention under the CYPF Act must ensure that the child or young person is

46
protected from harm, but every effort should be made to limit the damage and disruption to the
child's relationship with their family or whanau.
In less serious situations there are a range of options including setting up family/whanau
agreements that can help with a range of family problems and issues. CYF should always work
with families and whanau to strengthen their ability to care for their children and young people.
As a last resort a child or young person may be taken away from home, away from their parents
or their usual caregivers, during the care and protection process. This will occur if the social
workers or the Police have good reason to believe that the child has been harmed, and there is no
other way of keeping the child safe. CYF provides care services to children in the custody or
guardianship of the Chief Executive, including residential services when these are required.
Family/Whanau Agreements (FWA)
These agreements, drawn up between a family, whanau, social worker and a service provider
(where appropriate), enable family/whanau to get services to help them resolve problems and
continue looking after their children. This is an informal process that applies to cases that are
assessed as non-urgent. Services can include therapy, counselling, home help, parenting skills
and budget advice.
A family/whanau agreement spells out what services will be provided to the family. It describes
what the social worker will do and what the family or whanau will do. It sets out the goals the
family or whanau want to achieve and describes how progress on them will be measured.
After three months, every agreement should be reviewed by the family or whanau, social worker
and any other organisation involved to see if the goals have been achieved or partially met.
A decision has to be made as to whether the agreement is ended, extended for a month,
renegotiated for a further three months, or the family/whanau be referred for a family group
conference.

47
Family Group Conference (FGC)
Section 18(1) of CYPF Act requires a family group conference (FGC) to be held in any
circumstances where a social worker or member of Police forms a belief that any child or young
person is in need of care and protection. A family group conference is a formal meeting for
members of the family group/whanau/hapu/iwi to discuss, often with social workers, how to
keep a child safely and well cared for within the family group.
CYPF Act recognises that families have the main responsibility for caring for their children and
young persons, and protecting them from harm. The FGC is a means of balancing children’s
need and right to be safe, with their need and right to be in a family The FGC ensures that
families and whanau are supported to develop their own solutions to their problems and work
with social workers to reach agreement.
Typically FGC starts with a care and protection coordinator from CYF making arrangements
after consulting the family on who should attend the FGC. As many family members as possible
will be invited to attend. Other attendees may include a social worker from CYF or another
agency, a care and protection coordinator, counsel-for-the-child or member of Police. Other
people with special information may attend to such as a public health nurse; teacher; support
group; psychiatrist; doctor; or lawyer who are there to provide information and give advice, not
to make decisions.
If the conference agreed on a plan, it has to specify who is going to be responsible for the care of
the child or young person and where they will live, what services or organisations are needed as
support for the child and family, what payments are needed to support the child, and when the
plan is to be reviewed.
If agreement cannot be reached, the case may go to the Family Court for a solution to be worked
out.
History
The history of CYF can be traced to 1972 when the Department of Social Welfare (DSW) was
established through the amalgamation of the Social Security Department and the Child Welfare
Division of the Department of Education (Ministry of Social Development website).

48
From its inception DSW focused its attention and resources on the social security or benefits
which situation was aggravated by the growth in the domestic purpose benefit and
unemployment benefit in the 1970's and1980's (Brown, 2000). Consequently minimal effort and
attention was applied to develop the social services practice or to the associated professional
training (Brown, 2000).
In 1991, as a result of fiscal pressures, DSW flattened its structure across the benefits and
pensions and social work divisions, closed student units and consequently lost many experienced
staff. The biggest loss to social work support at this time were positions known as Executive
Senior Social Workers, who led the Social Work Supervisor group on site and were responsible
for the maintenance of professional standards (Brown, 2000).
In 1992, DSW was restructured into separate internal business groups, including the New
Zealand Children and Young Persons Service (NZCYPS), the New Zealand Community Funding
Agency, Income Support and Social Policy Unit. This review also separated benefits and
pensions, social work, and community services at the local level and the break up of an
administration services network which had serviced these service streams (DSW, 1993).
A review of the agency in 1994 occurred as a result of NZCYPS failing to meet its budget
requirement by about $1.2 million for the year ended 30 June 1993. The Director General of
DSW established an external review team led by Andrew Weeks. The Weeks Report noted that
there were poor information system, budgeting and information gaps and problems in the
interface with health and education (Weeks, 1994). The report of this review was accepted and
resulted in a major restructuring in 1994 to decentralise the structure of NZCYPS (DSW, 1995).
NZCYPS was renamed Children, Young Persons and their Families Services (CYPFS) in 1995.
In 1998 it amalgamated with Community Funding Agency and formed Children, Young Persons
and their Families Agency. Then in 1999 CYF became a stand-alone government department.
2000 Mick Brown’s review
Partly as a result of several high profile child abuse cases such as James Whakaruru and Sade
Trembath and the fact that the new incoming Labour government had sufficient concerns about
the capabilities and operation of CYF, a Ministerial Review was undertaken. In March 2000,
former Principal Youth Court Judge Mick Brown was appointed by the government to undertake

49
two independent reviews into the procedures of Child, Youth and Family for care and
protection referral and notification, and for the placement of children and young persons outside
their immediate family or care-giving arrangement.
Predicament of CYF revealed in Brown's report
In the submissions that Brown received in his review of CYF’s operation, there were a number
of shared complaints that commonly concerned:
• A perception of a service seriously under resourced. • A demoralised workforce • Varied skill levels • Disproportionately inexperienced • Inadequately supervised and supported • Serious difficulties with both recruitment and retention of Social Workers • Incapable in many regions of handling the workloads in a truly professional manner
and resorting to reactive crisis driven social work. • Confronting significant growth of new notifications or renotifications but of greater
concern children and young person presenting with multiple and complex problems, some intergenerational.
• A diminishing number of placement alternatives, both inter family and so called ‘stranger-care’ (a curiously inappropriate and value-laden term given that may equally apply to wide family placements, linked only by obscure ties of consanguinity!)
• With a frontline staff which may at times be exposed to the elements of ‘professional dangerousness’. The question then arises, given the current perceived staff profile and lack of supervisory support, do those frontline staff have the maturity or worldliness to identify and cope with those elements?
• By the nature of their calling Social Workers are required at all times to exercise sensitivity in its various forms. At times this may appear to be in conflict with the unwavering injunction as to the paramountcy of the child. Over sensitivity can lead to paralysis of decision making. Once again, maturity and supported decision making is essential.
• An issue raised and elaborated upon in the submission received from the Department of Child, Youth and Family was that ‘many staff leaving Child, Youth and Family attribute their decision, in part, to the cumulative caustic effects of negative media portrayal and poor public perception (Brown, 2000, pp7-8).
Brown (2000) believes all these above factors provide a fertile environment for a ‘blame’ culture
characterized by an unwillingness to take risks or accept responsibility for mistakes because of a
fear of criticism or prosecution.
CYF was a government department to which had been abdicated to a large extent the ills and
casualties of our contemporary society. CYF’s submission to Brown's review provided an insight
of the difficulties CYF experienced:

50
We are the state agency with responsibility for statutory social services. Our work is challenging and stressful:
• working with the most disadvantaged • exercising coercive powers in a ‘helping’ relationship • managing complex inter-agency relationships • facing public and media scrutiny
Together with work volumes and resourcing issues these factors damage staff morale. Our changing community will make the work more difficult (Brown, 2000, p.17).
Each of those points was developed in the body of the submission exemplified by the following:
Working at the ‘hard end’ Statutory social workers deal with the most extreme situations affecting the wellbeing of children, young people and their families. They make judgements that no other agency or professional is called upon to make, within a system that requires them to constantly reassess priorities and risks. They are in the business of predicting human behaviour, when it is beyond the ability of any social work system to accurately and consistently anticipate how people will act. The issues confronting our staff are among the most difficult that any social workers deal with. The work is complex and there are few absolutes. Staff members deal with ambiguous information, operate in grey areas and find solutions among options that are often less than ideal. The work is high risk. Mistakes are dangerous and costly, in both human and financial terms. Results are difficult to observe; it is difficult to measure the effectiveness of interventions or to link outcomes for clients to the services provided. There are few valid and reliable measures of either the negative impact or the positive outcomes of social work interventions. Despite these difficulties, we manage in excess of 26,000 notifications and 20,000 plans orders every year. Collectively, social workers make more than 15,000 placement decisions in any single year (Brown, 2000, p.17).
Brown made 57 recommendations to improve the service, and emphasised that most of the
problems were due to factors beyond the agency's control. Overall the recommendations suggest
two interconnected approaches for bringing about needed change - increased resources from the
government and changes to the culture and operation of the Department.
CYF introduced a New Directions programme in response, with key strategies and a host of
projects including service improvement, capability assessment and designing medium and long
term operational strategies. The core of the plan is that CYF needs to focus more on improving
the long-term outcomes for at-risk children and their families, rather than simply providing
immediate solutions to immediate problems. CYF’s baseline funding was increased by 50% from
the end of 1999 onwards.
But in late 2002, little more than a year after the Brown’s review, CYF again requested
additional funding as it had a cash crisis and was struggling to meet many of its objectives.

51
2003 First Principles Baseline Review
This request led to an in-depth review carried out by the Treasury, the Ministry of Social
Development, and Child, Youth and Family in 2002 and 2003. It covered the Department’s role
and services, and how these services are delivered. It also considered the appropriate level of
resources the Department needs to operate effectively.
In September 2003, The First Principles Baseline Review on CYF was released. The review
identified ‘deep and systemic’ problems within CYF that were about ‘much more than just levels
of resourcing’. It recommended clarifying its role and expectations, addressing demand for
services, improving the Department’s interface with other agencies, a new approach to service
delivery, and building corporate and business systems, information and workforce capability. As
a result of the review the government agreed to inject more than $120 million into the
department.
The review acknowledged some good gains were made as a result of ‘New Direction’
programmes. There were improvement in the timeliness in attending the most urgent social work
cases, staff turnover was reduced, induction training was made mandatory, relationships with
community stakeholders had improved, access to services for children, young people and their
families was improved via the roll out of national call centre.
However the review found that at the end of 2002 many of the problems identified in the
previous eight years still existed. In particular CYF’s performance and capability did not
improved in a sustainable way despite the increases in funding. The various initiatives CYF were
working on lacked overall integration. The inadequacy of the systems and processes
compromised CYF’s ability to prioritise its resources for investigation and intervention.
Consequently emphasis was primarily placed on managing an increased throughput at the
expense of the quality of service.
The review therefore concluded that a sustainable lift in performance was required and it would
not be achieved by some adjustments around existing business operation, better information
system, or additional resources on their own effect. Instead the review team proposed a staged
approach: a number of immediate steps, a package of initiatives over the next 2-3 years, followed
by a reassessment of the baseline by December 2005 for the 2006/07 Budget. These proposals
were focus on:

52
• Stabilising the department’s position so it is better able to provide services to children and young people who need them;
• Supporting CYF to become a learning organisation; • Improving service quality and reducing the recurrence of harm, neglect, insecurity of
care and re-offending (Hughes et al., 2003, p.2).
In November 2003 CYF Chief Executive Jackie Pivac who had served CYF since 1999 resigned.
Pivac found it personally painful to cope with the damning Baseline Review that opened the lid
on a department in crisis facing "deep and systemic" problems (Haines, 2003). More importantly
she felt the department faced an intensive three to five years of change which should be managed
by one person the whole way through (Berry, 2003)
Pivac’s successor also did not last long in the position. In August 2004, Paula Tyler, previously
the head of Alberta's Children's Services Department in Canada, took up the position of the new
Chief Executive of CYF. Little more than a year later in October 2005, Tyler resigned citing
personal reason.
Summary
CYF provides care and protection service for children. CYF aims to change behaviour to be
successful in its work.
This work is complicated, and CYF has been subject to two major reviews in its short history
since becoming an independent government department. Both reviews were critical of CYF’s
operations, and the later review has also resulted in the departure of its first chief executive.

53
Chapter 7: Findings Collections Unit Output – Collection
and Enforcement of Court-imposed Monetary Penalties and
Infringement Fines
The Nature of Outputs
This section explains each of the output measures under output 5.1 the collection and
enforcement of fines. They can be grouped into three types of measure: quantity, quality and
timeliness (refer to Table 7.1).
Output measures of output 5.1: Collection and enforcement of court-imposed monetary penalties and infringement fines
2006 Projection
Quantity Amount collected: $210-$227.5m Number of legal challenges to fines or collection procedures resulting in costs being awarded against the Department
0
Quality Percentage of fines actioned 57-62% Timeliness Percentage of court imposed fines collected or placed under arrangement within 28 days.
60-65%
Percentage of court imposed fines collected or placed under arrangement within 4 months
80-85%%
Percentage of infringement fines collected or placed under arrangement within 28 days.
28-331%
Percentage of infringement fines collected or placed under arrangement within 4 months
65-70%
Table 7.1 Collections Unit’s fines collection and enforcement output and related measures Source: MOJ (2005)
Quantity Measures
Quantity-type output measures include the amount collected and number of legal challenges that
result in costs being awarded against MOJ.

54
Amount Collected
…amount collected very much pushes down the route of obtaining money from the fines irrespective of whether this is the right outcome. It arises out of the behaviour of chasing those people who can pay, rather than holding people to account for the fact that they have not paid the penalty for their crime. (Interviewee A)
While there have been a number of changes in output measures, amount collected has remained
the most consistent output measure for Collections Unit since its inception. Its importance
originates as a result of a number of factors. The change of culture to 'more cash sooner' in its
early history required Collection Unit to have a strong focus on money collected. In addition the
threat of privatised fines collection activity in the late 1980s and early 1990s highlighted the
importance for the Collections Unit to demonstrate its effectiveness in dollars collected. Another
early output 'average cost per dollar collected', used from 1996 to 1998 was also targeted at
demonstrating that Collections Unit was competitive in comparison to private collection
agencies.
Amount collected ($m)
1996 1997 1998 1999 2000 2001 2002 2003 2004 2005
Actual 70.8 79.6 98.2 112.0 132.8 135.7 115.0 149.7 191.6 203.4
Table 7.2: Actual fines collected: 1996 - 2005 in $ million Source: DFC Annual Reports 1996-2003 and MOJ Annual Reports 2004-2005
With an unchanged staff level, Collections Unit has achieved a tremendous improvement in the
amount collected, with the fines collected increasing from $79.6m in 1997 to $135.7m in 2001
(see Table 7.2). With an injection of funds as a result of the approval of business cases in 2002
and 2004, the amount collected continued to increase to a new record of $203.4m in 2005. This
success can be credited to its management of processes, staff and technology (Office of the
Controller and Auditor-General, 2005). However cash collection targets have been achieved only
since 2001 with the exception of 2003, when work was disrupted by the transition to a new
information technology system.
Collections Unit was successful in securing additional funding primarily on the basis of expected
increase in amount collected. The business case promised good returns on investment, in
exchange for much required funding to expand its capacity and capability to cope with
astronomical increases in infringement fines imposed by the courts.

55
Amount collected is expressed in dollars and includes voluntary and enforcement collection of
all types of fines such as courts imposed fines, reparation and infringement; court imposed costs
such as court costs and enforcement fees. The bulk of the funds collected are disbursed to other
parties. Collection of court imposed fines and infringements issued by other government
agencies is disbursed to the Crown. Reparation collected is disbursed to relevant victims.
Infringement and related filing costs such as court costs recovered on behalf of local authorities,
are disbursed to the relevant filing local authorities. Court costs, apart from those related to local
authorities which are paid in advance when the infringement notice is filed, and enforcement fees
recovered, are credited to MOJ's other revenue account.
The collection of court costs and enforcement fees have a significant impact on MOJ's operating
budget. In general, the Crown funds MOJ on the difference between the budgeted operating cost
and budgeted other revenue. Other revenue is primarily made up of infringement filing fees and
enforcement fees and represents approximate 10% of total departmental budgeted revenue.
The speed of collection is inversely related to the amount available for collection. In one
situation where a Treasury official suggested leaving all fines untouched until after the
enforcement period, so a $100 enforcement fee per fine could be imposed15. This incident
occurred after the last budgeting round for the 2000 fiscal year when the forecasted enforcement
fees failed to materialise. This suggestion was resisted on the proven practice of 'more money
sooner' and the Treasury official was persuaded to accept the natural consequence of events.
A number of other dysfunctional incidents were observed as a result of the focus on amount
collected described in chapter five, such as poaching deals between the units and the call centre.
Although most of these historical problems that have caused fraction within Collections Units
are rectified by the domiciled rules in COLLECT, a number of issues remain. For example a
number of staff tended to pay greater attention to a small number of high-value fines rather than
higher volumes of low-value fines. Also the tendency of some staff was to put offenders on long
term time payment arrangement without adequate consideration of their ability to pay.
15 This request from the Treasury officer was made verbally to a number of senior staff of Collections Unit, including the researcher who was the Finance Manager for Collections Unit at that time.

56
Number of Legal Challenges that Resulting in Costs Being Awarded Against MOJ
This second quantitative type output measure is not regarded as a challenging one to achieve but
one than can help in improving internal management of public relation as commented by
interviewee A:
This will always be zero as the reality is that if the Ministry thinks that they will lose the case they will negotiate out of court. A case will only go through if the Ministry believes it has a sound legal argument and the Judge decided that it didn't.
Having the number of legal challenges as a measure strengthens the complaint management of the whole organisation. It encourages appropriate responses to complaints.
The expected standard of this measure has been set at zero. Apart from 1999 when there was one
legal challenge that resulted in costs being awarded against DFC, the standard has been
achieved.
Quality Measures
The only quality type output measure is the percentage of fines actioned.
Percentage of Fines Actioned
According to MOJ Annual Report 2005, actioned fines means "paid and disbursed, remitted,
placed in a pending pool if the defendant has been unable to be traced, under appeal or subject to
a time payment arrangement that is being honoured or within the period allowed for voluntary
compliance."
This is probably our best measure but also the most complicated for people to understand. It tries to take into account a lot of factors to make it fair [to Collections Unit]. Simplistically it says how much have we done over the year with what is available... It captures things that you have done and things that could have been worked on. (Interviewee A)
This output measure attempts to quantify Collections Unit’s efficiency in dealing with fines but
there are a number of deficiencies in this measure. Firstly, gaming behaviour had occurred in
putting fines into the pending pool prematurely to improve the actioned rate (Interviewees A, B
and C). The pending pool should only capture fines that had completed the whole tracing process
but the defendants could not be found. But there have been inappropriate actions such as gone-
no-address status been put on fines that are still going through the tracing process. The second
deficiency relates to the calculation of actioned rate that assumes the capability of Collections

57
Unit is always aligned with the level of fines imposition. Thus increased fines imposition
without the equivalent increased in capability would reduce the actioned rate, particularly
between 2002 and 2005 when fines imposition was increased by 44% and funding by only 23%.
This measure emerged in the second strategic planning phase of Collections Unit and was
designed to “include broader concerns with promoting law-abiding behaviour and better
compliance with monetary penalties” (Collections Unit, 2000, p.2). The original target, to action
100% of fines by June 2005, was set before the necessary management information was
available from the new information system and proved to be too challenging. In addition the
continuous high increase in infringement fines had affected the achievement of the original
target. Later the actioned rate target for 2005 was revised to 57-62% and the actual result
achieved was 61.4% (see Table 7.3).
Percentage of fines actioned 2002 2003 2004 2005
Actual 49.2% 55.2% 57.0% 61.4%
Table 7.3: Actioned rate achieved 2002 – 2005
Source: DFC Annual Reports 2002-2003 and MOJ Annual Reports 2004-2005
It was unclear how much this measure has helped to move towards a resolution focus as this
measure does not assess the result of the fines collection and enforcement process. Moreover
apart from the deficiencies mentioned above, the calculation of actioned rate is primarily based
on value, not volume of fines. Most interviewees see a stronger emphasis on resolving volume of
fines, rather than value, is needed in future output measures.
Timeliness Measures
There are four outputs measures that are of timeliness type. They are percentage of court
imposed fines collected or placed under arrangement within 28 days, and 4 months; and
percentage of infringement fines collected or placed under arrangement within 28 days, and 4
months.

58
2002 2003 2004 2005 Percentage of court imposed fines collected or placed under arrangement within 28 days.
23.7%
61.1%
58%
60.2%
Percentage of court imposed fines collected or placed under arrangement within 4 months
61.1%
78.8%
79.5%
79.9%
Percentage of infringement fines collected or placed under arrangement within 28 days.
8%
26%
29.9%
32.1%
Percentage of infringement fines collected or placed under arrangement within 4 months
33.1%
60.2%
66.7%
69.3%
Table 7.4: Actual timeliness result 2002 – 2005
Source: DFC Annual Reports 2002-2003 and MOJ Annual Reports 2004-2005
All timeliness measures improved between 2002 and 2005 (see Table 7.4). In particular the
percentage of infringement fines collected or placed under arrangement within 28 days has
increased from 8% in 2002 to 31.2% in 2005. The low achievement in 2002 was due to an
extensive disruption to operations resulting from the implementation of a new computer system.
These timeliness outputs first appeared in 1996 and the calculation at that time included only the
amount collected. These earlier outputs encouraged 'more cash sooner' and were designed to
encourage early full recovery action to be taken. The inclusion of time payment arrangements in
these outputs in 2002 coincided with the extension of maximum time payment arrangement from
the previous 18 months to five years. As a result fines under arrangement grew from $117.8m in
June 2002 to $277.0m in June 2005.
Concerns were expressed by the majority of interviewees about the inappropriate use of time
payment arrangement. Statements included:
There are things that push the arrangement culture that are not necessarily contributing to public confidence in the fairer justice system; people put fines under arrangement without checking whether this is the right solution for this profile. If you've are an 18 year old who owes $50k; we can set up an arrangement for him to pay over 5 years. This person may not have any ability or capacity to comply with this arrangement. (Interviewee A)
There were situations where staff were doing deals where there is warrant to seize…staff are dealing with fines without a good consideration as to whether putting debtors under arrangement is the right way to go. (Interviewee D)
…may have to do with instead of grinding that person to pay up front with cash, its easier for an arrangement to be set up. (Interviewee C)
Interviewee D in particular described the inappropriate use of time payment arrangement as
trapping the fines in "a great washing machine that goes round and round". This situation occurs

59
when a new payment arrangement for an offender is installed despite the offender breaching
previous arrangements. While COLLECT automatically puts defaulted fines into enforcement
phase, the system still allows staff to make another time payment arrangement for a new
infringement incurred by the same offender. This 'churning' allowed some offenders to
temporarily get away from complying with the penalties imposed and contribute to duplication
of work among staff (Interviewees A & D).
To combat this problem interviewees A, B, C, D and E suggested that a strong focus on
resolution of fines, supported by implementation of new procedures, is needed in future outputs.
For 06/07 we will have revamped outputs that are more reflective on where we are now. By the time we put the Infringement Review outcome in place there will be a need to have work done on a whole lot of different performance measures. (Interviewee A)
These new outputs are expected to reflect the fines resolution focus and place more emphasis on
volume of fines resolved.
Timeframe - 28 days, 4 months or 6 months
Information on voluntary compliance is important to Collections Unit and readers of SSP as it
measures the speed of collection before the fines incur enforcement fees. Voluntary compliance
means either payment in full or agreement on time payment arrangement within 28 days of the
issuance of first fines notice from Collections Unit. After that time an enforcement fee of $100 is
added to the fines.
However the usefulness of using the timing of 4 months is less certain. Interviewee A suggested
that the 4 month term was continued from previous outputs and suggested that:
A 6 month term measure will be more appropriate as this is the time when fines have gone through the entire tracing process and is a good time to assess whether effective action has happened.
Outputs as Internal Performance Measures
From Interviewee F:
Lots of things are outside our control as we are at the end of a value chain. We use all outputs as performance indicators … we collect data on them, evaluate, discuss and monitor

60
their performance. Other indicators for whether we have done a good job include balance of debts under control versus not under control… outstanding balance, amount under arrangement, amount of fines that were breached, breached rate which is an indicator that we may touch the same work too many times. We monitor top 50 fines defaulters to ensure they are properly case managed.
Output measures serve as an important set of internal management performance indicators. They
are reported and monitored monthly on a local, regional and national basis. These measures are
also translated into individual staff performance expectations in their performance agreements,
particularly at the area managers' and contact centre managers' level. For example the amount
collected target is divided among the three areas and each area further divides the target to a
local unit level. The assessment of individual staff performance includes other factors such as the
competency achieved rather than simply a focus on hard targets.
However, output measures are only a subset of wider indicators used internally within
Collections Unit for performance management purpose. Key information that is not part of the
outputs but is critical to understanding Collections' performance include amount and trends of
new fines imposed, balance of unpaid fines (total and overdue) and balance of fines under
payment arrangement. This information is disclosed in annual reports at the MOJ's discretion.
Applying Criteria of Well-Defined Outputs and Performance
Measures
This section examines whether the current output measures of the Collections Unit satisfy the
five criteria of well-defined outputs and performance measures (see Table 3.1). These criteria
according to TPA-9 are external focus, controllable, comprehensive, measurable and
informative.
Criteria 1: External Focus
All current measures of the output 5.1 - collection and enforcement of monetary penalties, are
externally focused to some degree. They meet the test of being distinct and are considered final
product or services that are delivered externally. For example cash collected represents one type
of fine resolution and action rate and timeliness measures indicate how soon an arrangement or
other resolution has been made since the imposition of a fine. The assessment of the purchaser's
interest and priorities is not within the scope of this research and therefore will not be included in
this discussion.

61
Criteria 2: Controllable
Whilst the number of legal challenges that resulted in costs being awarded against MOJ is to
some extent within the control of Collections Unit, it has a lower level, and sometimes very
limited control, over other output measures. This is due to a number of factors.
Firstly, Collections Unit cannot control the level of fines imposition and the new infringement
fines filed in courts have increased dramatically in the last few years. Among the 100 different
prosecuting authorities that include 14 central agencies and 86 local authorities that lodge
infringement fines with Courts (MOJ & The Law Commission 2004), Police infringements made
up 80% of all new infringement imposed. A change in Police’s policy in road safety such as a
lowering of tolerance of breaching the speed limit, an increase in number of roadside speed
cameras and additional high way patrols, can have a significant impact on Collections Unit’s
work. Collections Unit does not have an influence on Police’s policy but must deal with the
increased number of infringements lodged in courts when Police are unable to collect them
within 45 days.
In an effort to rectify the problems associated with the high level of infringement fines,
Collections Unit has initiated a review of the infringement system through MOJ and with other
sector agencies and local authorities. This review assesses the infringement system's policy,
legislative and administrative framework to ensure it is ‘fit for purpose' (MOJ, 2005b). The
review aims to maintain public confidence in the integrity of the infringement system with a
purpose to reduce the number of infringements needing enforcement, and to make the system
more efficient, fairer and more consistent.
Secondly, the fines information, particularly for infringement fines, may be of poor quality and
cannot be used to identify the offender. The Collections Unit has made significant efforts to
encourage prosecuting authorities to file only good-quality infringement fines. A number of local
authorities have responded positively and the pre-filing information has improved greatly.
However the success of attempts by Collections Unit to improve the information quality of
Police infringement notices, particularly the hand-written infringements, has proved to be
variable from region to region. Police may see the issuance as opposed to collection of an
infringement notice, as the end result of its road safety outputs. In addition there is no financial
incentive for the Police to ensure infringements filed with Courts are collectable. Police are not

62
required to pay the court cost of $30 per infringement notice; and will not be reimbursed upon
collection as Police infringements are Crown revenue that is paid directly to the Crown upon
collection. In comparison local authorities need to pay $30 court costs in advance and these costs
are only recoverable to them if the collection effort is successful. Local authorities are also
reimbursed the amount of infringement fines. Consequently local authorities have been very
receptive to Collections Unit’s initiatives to improve quality of infringement data. Interviewee C
quoted Manukau City Council as an example of how the council has corrected its processes to
improve from a 92% lodgement with no date of birth information, which is essential in tracking
offenders, to a 92% lodgement now with date of birth information.
The third factor is related to the offender's ability to pay coupled with a high recidivist rate.
Research undertaken for the DFC found that a significant number of people, especially those on
lower incomes, have difficulty paying infringement penalties. Those who received tickets for not
having a car registration or warrant of fitness found that by paying the infringement fee, they
could no longer afford to have their car registered or warranted and fell into a cycle of re-
offending (ACNielsen (NZ) Limited, 2000). It is also easy for recidivist offenders to accumulate
a large number of infringement fees that they are unable to pay. According to Interviewees A and
F, 60 to 80% of new infringements imposed are incurred by recidivist offenders. This high rate
of recidivist offending would have affected the amount collected and is likely to also affect the
actioned rate and timeliness measures if offenders can no longer afford to pay, even on
maximum time payment arrangement.
Fourthly, there are a number of legal processes, such as appeals and concurrent sentences,
including imprisonments, which take fines out of the collection and enforcement process.
Interviewee D pointed out that there were a number of large fines under appeal that had affected
the amount collected and the timeliness measures. For example if the appeal process take more
than four months then all the timeliness measures against the fine will be negatively affected.
Similarly if a judge imposed both a fine and imprisonment the fine may not be collectable until
the offender was released from prison.
Fifthly, there are a number of fines that cannot be enforced as the offender no longer lives in
New Zealand and Collections Unit has no legal power to enforce fines in other countries.
Interviewee B believes:

63
We are facing an increasingly mobile population moving around the world. We are increasingly getting overseas addresses where we don't have reciprocal arrangements. There has been a large growth in the number of students coming into New Zealand and fines left unpaid after they return to their countries. Potentially this leaves a large amount of unpaid fines in our database and we spent a lot of time trying to track them down.
In addition the introduction of instant fines at the airports and ports for minor bio-security
offences have worsen this situation due to the high percentage of offenders residing overseas.
Criteria 3: Comprehensive
The current measures under Output 5.1 of Collections Unit do not meet the test of
comprehensiveness. This is mainly due to an inappropriate emphasis on amount collected and
placing debt under arrangement for most measures. Apart from the number of legal challenges
that resulted in costs awarded against MOJ, all other measures required the achievement of
amount collected and/or placing debt under arrangement. There is no focus on resolution of
fines.
Collections Unit wants the new outputs and measures to reflect what it believes to be its main
priority: resolution of fines. Interviewee D sees most measures including amount collected as a
by-product of resolution of fines and this focus should be clearly reflected in the output
measures.
However difficulties are expected in changing the focus of these measures. Resolution of fines
would not be easy to quantify and the formula would need to place a higher priority on resolving
high volume rather than high value of fines. In addition the formula needs to give significant
priority to compliance with the agreed collection and enforcement procedure, if timely actions
such as escalation of enforcement action are to be encouraged. It is likely that the new measures,
if they are approved, will consist of a number of quantitative, qualitative and timeliness type
measures to reflect the resolution focus.
The greatest difficulty however may be changing Collections Unit culture, so all staff embrace
the resolution focus. While there may be teething issues in implementing a resolution focus
procedure in the local offices the implementation of such procedures will be significantly more
challenging in call centres. In comparison to staff working at the local offices, call centre agents
are generally sales/collection orientated and their performance is managed more effectively if
their main performance objectives are quantified into cash collection or number of deals made.

64
The increase in the number of call centre agents from 40 to 160 between 2002 and 2005
intensified the challenge.
Criteria 4: Measurable
Most measures are described clearly in formal reports. These reports provide further explanation
of fines actioned and the timeliness measures. For example the MOJ 2005 Annual Report
inserted a footnote to explain 'actioned' in relation to fines (see above). It also stated all
"timeliness measures are rolling 12-month calculations"(p.82).
All standards of output measures are set out clearly and can be judged against the actual
performance. The standards of all output measures are disclosed in the Statement of Intent before
the beginning of each fiscal year. These standards are then compared against actual performance
in the Annual Report that is usually available after September.
With the exception of the number of legal challenges which is obtained from the legal section of
MOJ, all quantitative information on other output measures is generated from the computer
system COLLECT. No interviewee has indicated any issue with the information from
COLLECT. Therefore the test of measurability is met satisfactorily.
Criteria 5: Informative
Most of Collections Unit's output measures do not provide sufficient information to the users on
their own. For example it would be difficult to assess Collections Unit's performance in
collecting fines without knowing information such as amount of imposition, opening and closing
fines balances, Collections Unit's available capacity and information quality of new fines.
Although some of this information has been disclosed in other part of the annual reports, the
disclosure is discretionary and not part of SSP.
In particular the information on the unpaid fines has attracted interest from the media and
opposition party.
Fines debt grows - The level of outstanding and overdue court fines is spiralling out of control … in the 2004-2005 year there was $637 million in outstanding and overdue fines, compared with $310 million six years ago (The Press, 2005 Nov 22, p.A3.).

65
The growth in overdue fines has a direct relationship with the level of infringements filed in
courts, which grew from $72.8m in 1996 to $246.3 in 2005, or 238%. Despite the increase in
capacity as a result of the 2002 and 2004 business cases, total unpaid overdue fines has
increased from $123.3m in 1996 to $341.2m in 2004, or 177%.
Some wordings and concepts used in the output measures are difficult for readers and even
Collections Unit staff to comprehend easily. Apart from fines actioned that was discussed earlier
in this chapter, all timeliness measures can cause conceptual problems for staff. Interviewee A
explains:
The formula on the percentage of fines collected or under arrangement within 28 days is probably the most complex. The problem is it doesn't form part of the measure until it got past 28 days. So for the purpose of 1 July 2004 through to 30 June 2005 the fines it relate to effectively go from the 2 June 2004 through to 2 June 2005. When you look at number of impositions they are not the ones that staff are dealing for the year, but a mixture between two years. It's hard for them to reconcile this to other views of the business.
Summary
Collections Unit has good reasons in wanting to change its current output measures to place
more emphasis on resolving fines fairly and justly. Despite its achievement of the expected
performance standards of its current output measures, dysfunctional behaviour of some staff
caused largely by a focus on collecting cash and making deals need correcting. In addition
resolution focus has always been important to Collections Unit but it has always been omitted in
output measures so far.
The evaluation of the output measures against the criteria of well-defined outputs and measures
under TPA-9 shows interesting result. While most of its output measures met the criteria of
external focus and measurability, they do not meet the criteria of controllable, comprehensive
and informative.

66
Chapter 8: Findings CYF output - Care and Protection
Service
Care and Protection Outputs
According to CYF Output Plan 2005/2006 the current outputs under Care and Protection Service
are intake, investigation and assessment, case management, resolution services and care services.
Intake, investigation and assessment is about receiving notifications of abuse, neglect and
insecurity of care at the call centre and seeking to establish the risk of harm to the child or young
person concerned. It also involves undertaking assessments and investigations to establish the
appropriate measures required to keep the child safe and support the family.
Case management relates to convening and holding family group conferences or making
family/whänau agreements to maximize appropriate decision making, once the need for care
and/or protection has been established. It involves bringing together family members with a
range of agencies to help identify and explore ways to meet critical needs to protect the child as
well as other family members.
Resolution services provide or purchase services to implement Family Group Conference plans
and Court Orders. It also involves establishing effective relationships with children, young
people and their families to identify their needs and possible support services to help resolve
immediate and ongoing issues.
Care services create case plans that identify issues to be resolved and which highlight
opportunities for achieving permanency for the child or young person concerned. It involves
identifying the needs to be addressed and services that should be provided to support the
resolution of ongoing issues. Undertaking emergency action to ensure the safety of children and
young people is also included within this output.
Each output contains up to four types of measurement: activity indicator reflects demand;
quantity indicates the number of actions which occurred, timeliness captures expected timeframe
of certain actions, and quality measures desired result of certain processes.

67
Due to the difficulties of examining all 33 performance measures in the output class of care and
protection services (see Appendix 2) within the limited time and resources to complete, this
research examines in detail only a selected number of process and activities. The measures
examined relate to intake notification, response rate to notification, investigation, FGCs and the
care services. They were chosen as they appear to be a significant part of the current focus of
many CYF work programmes and were measures that the interviewees tended to emphasis in
their interviews.
Intake Notification
There are three activity monitors under the intake process - number of intake assessments,
number of intake notifications that require further action and number of distinct clients at intake
requiring further action. The first two indicators have been reported in CYF annual reports since
1999 and their trends revealed a significant and unprecedented increase in demand for CYF
services.
Activity indicators 1999 2000 2001 2002 2003 2004 2005 Number of intake notifications received by CYF
27,017
26,588
26,707
27,507
31,781
43,314
53,097
Number of intake notifications that require further action (FARs)
21,707
21,983
22,868
23,805
27,394
36,066
43,460
Table 8.1: Intake activity indicators 1999 – 2005 Source: CYF Annual Reports 1999 - 2005
The significant increase in intake notification first occurred in 2003, with an increase of 4,274
notifications. For each of 2004 and 2005 an approximately additional 10,000 notifications were
made. While the level of 2006 intake notification is forecast to be between 51,400 and 59,700
according to CYF Statement of Intent 2005/2006, a number of interviewees reported that they
expected the rate of increase to have continued and intake notifications will actually be closer to
63,000 in 2006.
This increase in demand mirrors trends in a number of other countries. For example in the USA,
child abuse reports have increased from approximately 9,500 to 3 million between 1967 and

68
2002. Between 1995 and 2003 Australia saw an increase of reported suspected child abuse and
neglect cases from 91,734 to 198,355 (CYF, 2005a, p15).
In its Statement of Intent 2005/06 CYF identifies the drivers of the increased in demand:
• An increased public awareness of child abuse;
• The problems faced by children and their families with care and protection issues are
becoming more complex;
• The mass media and public have increased their focus on child safety rather than broader
child welfare.
Interviewee R put the raise in demand of CYF service in a wider political perspective:
One driver of increased demand is that other government agencies moved their risks to CYF. The Police deal with domestic violence, youth offending, and some of their regions move risks to CYF. Government agencies have changed in last 7 to 8 years where public service has become a political product. The culture of the public service is about minimising the risk for the agencies. We've seen nearly 35% of notifications attributable to Police. We try to manage by building relationship with Police and get memorandum of understanding from them…The liaison with Police is marginal, good at national level but variable at regional level.
CYF Statement of Intent 2005/06 identified Police as the largest notifier of potential cases to
CYF, contributing approximately 34% of total notifications.
To a large extent CYF is an ambulance at the bottom of the cliff, the only government agency that can't turn people away. Health may say there is mental health issue but we haven't got funding and CYF has to pick that up. (Interviewee S)
As demand for CYF's services is largely not controllable but CYF is expected to manage the
workload, activity indicators of current and expected demand are critical information in
assessing CYF's performance.
The terms used in these indicators of demand required further and often extensive explanation. In
CYF output plan 05/06 intake notification is explained as
Intake notifications are also known as ‘client notifications’. A client notification is created for every client identified as being at risk of child abuse, neglect or insecurity of care in families where a concern is expressed to Child, Youth and Family. This total will be greater than either the number of children and young people notified to Child, Youth and Family or the number of concerns expressed to Child, Youth and Family (p.24).

69
To further assist in reaching a common understanding on the terms and outputs used in the
reporting a booklet Proposed Sub Output Definition was written to assist staff of CYF.
Interviewee Y explained the possible confusion and complication in some of the terms used:
There are different ways notification is interpreted throughout CYF. For reporting purpose this is the definition but is not necessary a unique one for the whole organisation. Notification is trying to capture the concerns (expressed on the safety of a child or children). Request for service (RFS) is a distinct call, so if a teacher and a doctor report on one child on different concerns, there are two notifications. A RFS which relates to more than one child, if the first child is at risk will make two notifications. If two people ring for the same child with the same concern they are likely to be grouped into one notification…Two notifications that related to two siblings will create one case for the social worker who is dealing with it.
Therefore the intake assessment for the year ended 30 June 2005 includes 53,087 notifications of
which 43,460 required further action. These notifications involved 5,071 children and young
people.
Response to Notification
The most consistent timeliness measure for care and protection services since the inception of
CYF has been the response rates to notification. There are four categories of notification based
on the assessment of the safety of the child: critical, very urgent, urgent and low urgent. The
critical and very urgent cases require immediate actions and the expected response time is within
24 hours and 48 hours respectively. The expected performance standards are 95% to 100% for
critical cases and 90 to 95% for very urgent cases. For the urgent and low urgent cases, the
response time is within 7 days and 28 days respectively. Their associated expected performance
standards are both 50 - 85%.
2000 2001 2002 2003 2004 2005 Critical 98.0% 85.0% 93.0% 93.4% 96.0% 97.8% Very urgent 92.0% 77.0% 89.8% 93.4% 93.7% 95.9% Urgent 73.0% 40.0% 39.5% 37.9% 38.1% 51.0% Low urgent 78.0% 47.0% 48.2% 48.4% 45.7% 62.4%
Table 8.2: Actual performance of response rates to notification Source: CYF Annual Reports 2000 - 2005
When comparing these results with the increase in intake notification since 2002, the results
achieved by CYF appear very positive (see Table 8.2), especially during the year ended 30 June
2005 when for the first time all the expected measures in the response rates were achieved.

70
Timeliness measures come under pressure when you can't recruit social workers and demand increases. We were able to meet timeliness measures because of the productivity improvements through different ways of working …establishing some processes, guidelines and systems that operated across the country… Consistent social work practice around intake and assessment - one set process to follow. Before that there were 59 different ways. The same methodology will be used in reviewing other part of the care and protection process. (Interviewee S)
The productivity gain resulted from the re-engineering of the front line intake assessment process
that enabled CYF to improve its response rate. This occurred even though CYF's funding not
been correspondingly increased to reflect the level of demand.
Investigation
The measure of the investigation process first appeared in the CYF Statement of Intent
2004/2005 as 'investigations will be completed in a timely manner' with a performance standard
of 70% in 90 days. In the 2005/06 Output Plan there are two variable standards: 70% in 90 days
if FAR received is less than 48,050, and 70% in 120 days if FAR is 48,050 or more.
Interviewee X sees this measure as an improvement on the previous one:
...better measure of what the real intake is ...The two standards reflect the finite resource with variable demand to show we have enough resources to do this if that is the volume. There are lots of comments from central agencies. They are not keen on it.
There are two new measures related to investigation - 'number of investigations completed' and
'clients waiting for investigation services will be monitored and reprioritised regularly in order to
minimise client risk'.
The addition of investigation related measures reflect the concerns within CYF on how
investigations have been managed and recorded in the field and this measure is intended to
clarify this part of the process.
Investigation has been in the radar for a while. We are concerned about the length of time it takes to complete investigation … most social workers would have completed, done the intervention but not ticked the box. We need to educate and make the connection between social work and reporting. (Interviewee R) Ninety days deem to be the reasonable timeframe. Reason for not closed - the way we do things and our practice sees this as a low priority …For example Brown case can have an open investigation by the computer system and an intervention at the same time. We have

71
already worked with the clients for 6 months but someone has forgotten to close it down…Most of ours are like this… only need to complete the three page report in the system to close them. (Interviewee U)
Family Group Conference (FGC) and FGC plans
Output 4.2 case management includes family/whanau agreements (FWAs), and holding care and
protection FGCs for children and their families. The existing measures include the number of
(FWAs), number of Care and Protection FGCs and percentages of FWAs and care and protection
FGC plans reviewed on time respectively. In addition there are two new measures in relation to
FGCs: percentage of FGCs where a plan is created and percentage of children and young people
whose FGC plans were completed and the objectives were assessed as being met.
These FGC related measures are aimed at providing better information on the result achieved.
FGC occur if the child is considered to be in need of care and/or protection at the end of an
investigation. Compared to FWAs that are agreements of informal processes to resolve less
urgent needs of children and their families, FGCs are statutory processes for those children who
are deemed to be at risk. FGC plans are the expected products of these FGCs.
FGCs are critical processes in the CYPF Act 1989 that reinforce the need for family, rather than
professional solutions to family problems. Based on traditional Maori decision-making practices,
FGC provide the primary opportunity and forum for family, and the extended family to hear
concerns and participate in the decision-making process with respect to the child (Connelly,
2001). Family members are given the first opportunity to resolve the problems by planning for
safe outcomes for their children, with professionals supporting them with information. The
participation of non-family members is invited during the agreement phase to discuss decisions
and plans with an emphasis on strengthening the family so that it can continue to care for the
child when possible. If no agreement can be reached, the social worker can choose to exercise
statutory power to bring the case to family court for resolution.
These plans can be wide-ranging; from a change of placement of the child, to providing
assistance to the family to enable the child to live at home. They are not, and cannot be
standardised, vary depending on the children and their family circumstances and the available
support network. Therefore without knowing the specific contents in these plans and agreements,
measures such as percentage of plans/agreements reviewed on time, communicate little
information to people who are not directly involved in the process.

72
Care Services
Output 4.3 includes measures relate to the provision and management of care services provided
by CYF. It includes family/whanau care, CYF caregivers, placement in CYF family homes, CYF
residences and other CYF approved providers.
There are four measures listed under care services:
1. number of children and young people in care and protection care and protection care
placements at any time during the year,
2. re-entry into care placements,
3. percentage of children and young people who are care and protection clients in family,
whanau, hapu and iwi care and
4. the average length of time until care permanency is established.
In addition there are three specific activity monitors:
1. number of children and young people in the custody of the chief executive at any time during
the year,
2. number of care nights used
3. number of distinct clients in receipt of the Youth Service Strategy programmes that involve
specialist family home placements or one-to-one placements.
A number of interviewees raised concerns about the attitude of Treasury on cost control in care
area:
Treasury came across quite heavy saying that they want us to focus on these areas: only to do investigations when we have to, this is when we start incurring costs… and prevent the children drifting into care. (Interviewee V) Treasury is concerned about the number of kids in care. What is the right number? If the kids need care they'll get care. They are only concerned because of the money attached to it. (Interviewee S)
It is however not difficult to understand Treasury’s concern in the area of care services. The
number of children in care has risen constantly from 1999 and the cost of care is high.
1999 2000 2001 2002 2003 2004 2005 Number of children in care
3,265
3,670
4,196
4,480
4,682
4,909
5,071
Table 8.3: Number of children in care 1999 - 2005 Source: CYF Annual Reports 1999 - 2005

73
…we have limited capacity in the secured care…a 28-person capacity residential unit in the Bay of Plenty will cost $29 million as all the furniture, walls etc cannot look like prison. It will take 3 years to build a unit like that… Demand would be hard to forecast and there is a time lag factor. (Interviewee V)
Despite the constant increase between 2002 and 2005 in the number of children in care, the rate
of increase was just 13% compared to the 93% increase in the number of intake notifications
over the same period. According to the CYF 2005 Annual Report "this is the result of an increase
in emphasis on achieving permanency in care placements and more consideration of alternatives
to care when considering how to address needs in families" (p.14).
There are conflicting views on the measure of percentage of children and young people who are
care and protection clients in family, whanau, hapu and iwi care. While Interviewee R sees the
number of placement in kin care as an indicator of success, Interviewee X disagreed:
…the re-entry into care is a reasonable one, but the percentage placed into family, whanau, hapu and iwi care is a response to a certain cultural value. We shouldn’t measure a culture thing, as you won’t place a child with the family if the child is put at risk again. Placement choice should be looking at the best choice for the child, not the family…The real quality here is the timing and permanency of the care etcetera that we are not reporting on. The measure is wrong but we don’t have a better one yet.
Despite the large number of current measures under care and protection services, it is expected
the number will increase and some measures will be amended particularly after the
implementation of Differential Response System that will significantly alter the intake
assessment process.
Outputs as Internal Performance Measures
Like Collections Unit, CYF utilises output measures as important management indicators.
Reporting is captured in Output Plan Monthly Monitoring Reports commonly referred to within
CYF as the Traffic Light report. The term traffic light originated from the use of three colours to
indicate good or achieved (green), average (blue) and poor or not achieve (red) on its summary
page.
These Traffic Light reports, which are key internal management reports for performance
monitoring and management, include information other than output measures. For example it
includes a section on capability, showing the number of social workers and how many of them
are qualified.

74
Capability is a serious issue for CYF:
…a workforce capability strategy is underway to provide CYF with skilled professionals who can meet ever-changing demand… we are currently one hundred staff down. We have been successful in attracting graduates but it takes at least eighteen months before they are productive. They are a drain on the resources when you are mentoring them. (Interviewee S). Only two out of fourteen social workers (at one site) have more than five years experience…This increasingly high turnover is common around the country…the experience base has eroded and we see a cautious approach such as keeping cases open longer. (Interviewee U)
Another key measure disclosed in the Traffic Light report is the unallocated cases. The measures
include the number of unallocated, age of oldest unallocated cases and the number of unallocated
cases over 4 months old.
Unallocated cases have attracted more attention from the media and the politicians than any
other output measure. Though the disclosure of this information has not been compulsory it has
been reported in CYF annual reports since CYF's inception.
Internally CYF produced Unallocated Cases Strategy - monthly report.
The report was put together by a project manager and some of the information came from CYRAS (computer system). It provides more detailed information for management purpose. Unallocated case is a wrong driver for external parties such as the media. It means clients are waiting for services and what do we do to address this issue. What’s important is what drives the number and what sits underneath it (Interview S).
This emphasis in reducing the number of unallocated cases may have caused dysfunctional
behaviour in some sites. "One site told me that it was found that cases were allocated to
managers and support staff." (Interviewee W)
Interviewee V reported a similar observation:
There is evidence of gaming in allocating cases at month end. The number looks good at the end of the month but not at other times. The system allows allocation to occur without checks and balances.
In addition to the output plan, CYF is in the process of developing interim service management
indicators that will support CYF to manage effectively and efficiently, and will help inform the
Minister of its performance. CYF believes these service indicators measure client milestone

75
based activities that contribute to the attainment of outcome and will be included in the formal
monthly reporting.
Applying Criteria of Well-Defined Outputs
This section examines whether the current outputs of care and protection services satisfy the
criteria of well-defined outputs and performance measures according to TPA-9.
External Focus
It is difficult to conclude that any of the outputs and their measures under care and protection
services has an external focus. These outputs describe discrete social work processes and
activities and are unlikely to be considered a 'final product or service that is delivered externally'.
The measures under these outputs indicate the demand and result of social work process.
Ultimately we know the success or failure of an outcome is whether the child has reached a permanency, how long does it take, and whether the child comes back to CYF for problems that should be known by CYF. (Interviewee W)
It would be useful to have an output that measures the success of CYF intervention, such as the
number of children 'rescued', how many achieved 'well-being' or at a minimum the number or
percentage of permanency achieved for their clients. CYF has developed a permanency policy
and an implementation plan that promises to improve permanency for children in care (CYF,
2005c, p.14). In addition there is one current measure which assesses the average length of time
until care permanency is established. Therefore it is likely that a measure such as the number of
permanency achieved will eventuate.
However there will be difficulties in finding an output that represents the final product or service
that is delivered externally from the care and protection service. A key problem is to do with the
low level of controllability of CYF in the care and protection process. This will be discussed in
the following section.
Controllable
CYF has a low level of control over the delivery of their outputs. Care and protection work is
demand driven and CYF must cope with whatever volume of work presenting to them.

76
Historically the quality, including timeliness, of work will decrease, when the volume increases
unless there is a corresponding increase in capacity and capability. This reduction in quality had
often resulted in more demands for CYF services in the future. As an example, the social
workers may only have resources to respond to critical and very urgent cases. The delay in
responding to urgent and low-urgent cases, such as lack of food in the house, may escalate to
critical or very urgent category in a short period of time and may require more CYF resources for
resolution. The recent focus on the intake process has produced productivity gains that enabled
CYF to cope with the recent increase in demand without sacrificing its quality and timeliness
measures. However whether further increases in notifications can be offset by this type of
productivity gain remains unknown.
Likewise, the result CYF desired for their clients is not completely within CYF control. The
expectation of the Children, Young Persons, and Their Families Act 1989 is that identifying
family, rather than professional solutions to family problems will be the first priority. Therefore
families need to be strengthened and maintained so they are able to look after their children, but
many activities that are aimed at achieving this are delivered by other agencies. To achieve a
desired outcome for a child required efforts from CYF, other agencies, and most importantly the
family. As stated in Output Plan 1 July 2005 - 30 June 2006:
…achieving positive youth justice and care and protection outcomes for children, young people and their families is not a role that CYF can perform alone. Families, communities and community service providers play a vital role in helping keep children and young people safe, providing the care that they need and establishing stable situations of security and permanency for children. Often the children and young people who come into contact with the Department have complex needs, requiring the specialist skills and services of other government organisations. These needs include mental health services, specialist education services and disability services, as well as services for refugee and migrants. The inter-connectedness of client needs means that government agencies must work closely together to deliver the best available services available to this vulnerable group of young New Zealanders (p.6).
Comprehensive
The large number (33) of measures under the five outputs of care and protection service appear
to qualify them for comprehensiveness. CYF has a further 44 measures under its four other
outputs. The number of measures is expected to increase over the next few years. As indicated in
Output Plan - 1 July 2005 to 30 June 2005:

77
…a wider improved set of performance measures and performance standards will be progressively developed and implemented by the Department over the next few years, to address findings from the Baseline (p.9).
CYF has made an immense effort to incorporate care and protection processes into the measures
of output class 4. It has reviewed comparable international performance standards in identifying
potential new performance measures. During 2005/06, CYF will continue its programme of
developing and testing enhanced performance measures which are more focused on outcomes
and measuring service quality (CYF, 2000b, p.9).
However the outputs under care and protection services do not comprehensively represent the
effort of CYF primarily as these outputs are not the final result of CYF's interventions.
Measurable
Most care and protection outputs are clearly set out in formal reports. However further
explanation and definition was provided to ensure readers understood the terms used. In
particular, the definition of intake notification has caused some confusion internally and as a
result a booklet Proposed Sub Output Definition was published to ensure CYF has a common
understanding of certain measures and sub-outputs, for reporting purposes.
All standards of outputs are set clearly and can be judged against the actual performance. The
standards of all outputs are disclosed in its Statement of Intent before the beginning of the fiscal
year. These standards are then compared against actual performance in its Annual Report that is
usually available after September.
The reporting of outputs and their measures is primarily generated from the computer system
CYRAS. A number of interviewees reported problems about CYRAS.
CYRAS was a case work management system and little thought was given to the need to account for activities that CYF has undertaken. It is deficient in providing management information. Finding way around CYRAS is difficult. (Interviewee R) CYRAS promised to deliver lots of things such as volume of work, but these were not delivered. As an example it can't find information like the number children over sixteen years old in care. We need to tweak data in CYRAS for it to report properly…Court review area is very complex and most social workers can't work it to get out what needs to be done …CYRAS was supposed to be the tool to aid us but it became the tool to dictate. (Interviewee T)

78
There is a further serious deficiency within CYRAS that may cause significant errors in
reporting. CYRAS does not have a monthly close-off facility and therefore information can be
entered into the system retrospectively at any time. For example data labelled June 2003 may
actually have been entered in May 2005. This lack of close-off has caused high levels of
frustration among staff particularly for those who need accurate information for costing,
planning and reporting purposes.
CYRAS is more challenging to the PC illiterate social workers…Social workers view data as a notebook - part of the process is to write it up and input it when they get the time. Whereas we see that as an inherent data control process and view data they have as of no value if they are not up to date... You can input data months after the event. If we run a report on the number of FGCs to convene for the month of May at the end of May, it will say 50. Then run it again at the end of June it will say 307. (Interviewee W) There are enormous data quality issues. CYF is recognising this and the need to have a cut- off but there are a lot of education (hence challenges) to go with it. I suspect some numbers will go up and some gaming at month end will disappear if there is a hard cut off. (Interviewee V)
The Baseline Review found that as a high priority CYF needed to produce improved
management information that allows linkage across inputs, outputs and outcomes. A programme
of initiatives designed to enable the strengthening of management capability is currently
underway (CYF, 2005a). Whether the lack of close-off problem will be rectified as part of this
initiative is unclear.
Informative
The outputs and measures under care and protection services have not met the test of
informative. The lack of external focus, exclusion of intervention outcome, inadequate
comprehensiveness and inaccurate reporting have all contributed to this failure of the
informative test.
Moreover there are three additional factors that compounded this situation. Firstly, the joint
responsibility across family, government agencies, community providers and CYF is not
reflected in these outputs. This joint responsibility is crucial in ensuring those children whom
have been notified to CYF achieve safe and well permanency. However the silo nature of outputs
does not allow joint responsibility, rather requiring individual responsibility from each
government agency.

79
Interviewee S believes joint responsibility is about resoursing:
Our staff were sitting in meetings with staff from Health and Education and there was an absolute want to do the best and there were agreements and plans. But when it came down to how to resource it, it died. They didn't have delegated authority, or knew that their managers won't give them the budget. Shared outcomes are at such a high level you can say anything really. I want the shared outcome to come down to a level that the Health, Education and CYF professionals can implement decisions on how to make things better for the kids.
Secondly, information on risk and capacity is not reflected in these outputs and measures.
Despite the reporting on the increased and the expected increase in notifications there is
inadequate information on how this will impact CYF's capability and its management of the
increased workload. As interviewee R recalled the past:
The resources we had, to do what was expected was unreasonable. We were unreasonably demanding of our staff so they took measures that managed the costs and provided minimal services to kids, tried to meet the budget that the organisation has set. From a social work perspective that is ethically immoral. From a public servant/ bureaucrat perspective it was trying to keep the government safe. The lack of resources stem from the split into business units in 1992… CYF was trying to do more with less and attempted to do a good job on volume rather than quality. As a result we have the baseline review really.
There is a real risk that the history may repeat itself if the volume keeps on increasing without
the corresponding increase of resources and capability. This risk is not helped by the
unprecedented workload experienced by CYF complicate the current costing of the baseline. The
required increase and change in workforce, infrastructure and systems will take time whereas the
demand of CYF service is immediate and difficult to predict. In particular the recent increase in
demand for social workers by other agencies and the overall short supply of social workers has
aggravated the retention and recruitment problems at CYF. In addition it is expected that rolling
out of Differential Response System will further increase the demand for social workers among
community providers, while at the same time the tighter standards for registering social workers
is expected to further reduce the available pool.
In addition there is another immediate risk associated with increased demand highlighted by
interviewee W:
Nobody expected the notifications to increase from 32 to 43 to 53 thousand…We absorbed some of it. The real worry is the flow on effect. Let’s say 90 days to do an investigation, another 30 days for a FGC etc. What we build up is that a lot of work may not occur in the year that notification occurs. The real cost may occur in the subsequent year. I think this year we are going to face difficult problem…We are still trying to understand the impact.

80
Thirdly, the outputs and measures of care and protection services do not reflect the fact that
social work is a professional service that deals with people and requires judgement and
discretion in attempting the best outcome for the clients. In some situations interventions are not
welcomed by the families and these situations can turn hostile towards the social workers.
Social work is about making individual call on individual case at that particular time… Social workers can only make a belief driven call based on the facts available at that time…If the decision is made later after other facts are available then it may be a different decision. (Interviewee S) The parents may hide after notification and social workers will be looking for them. The interaction with social worker, particularly at the investigation stage has become more and more violent and abusive. (Interviewee R)
Doolan, the ex Chief Social Worker for CYF stated in A Life Too Short:
Statutory child care and protection social work is risky business. It is carried out in the most intimate and sensitive parts of family life. It is fraught with anxiety, uncertainty, misleading, or incomplete information and secrecy. It challenges adult behaviour and adult concepts of child ownership, and evinces strong reactions and negative stances towards workers (Doolan, 2004, p.130).
Summary
CYF is in the process of defining its outputs to ensure they represent comprehensively the related
social work processes. There are currently 74 output measures and the number is expected to
increase in the near future. Care and protection services output and output measures are grouped
according to five distinct processes. Under each process output measures are divided into activity
monitor, quantity, quality and timeliness types.
Despite all this effort the evaluation of the output measures against the criteria of well-defined
outputs and measures under TPA-9 shows a poor result. The best score attained was a medium in
measurability test and low in the tests of external focus, controllable, comprehensive and
informative.

81
Chapter 9: Discussion
Fitness into Wilson's Matrix
As outlined in chapter 3, Wilson (1989) classifies public organisations into four types (see Figure
9.1) according to the observability of outputs and outcomes.
Observable Unobservable
Obs
erva
ble
Production Procedural
Uno
bser
vabl
e
Craft Coping
Outcomes
O
utpu
ts
Figure 9.1: Wilson’s four-way matrix of public organisations Source: Gregory, 1995a, p. 58
Collections Unit
Initially Collections Unit gave an impression that its fines activities are of a production type.
This was partly due to both its outputs and outcomes appearing to be observable. It can quantify
its output measures, and the success of the organisation in achieving these measures appears to
confirm that it is ensuring monetary penalty is a credible sanction.
However a closer examination of fines activities shows that they fit more appropriately in the
procedural type. Its final goods and services are observable and measurable, even if it moves to a
resolution focus. However, an assessment of its effectiveness in achieving outcomes is more
problematic.

82
Collections Unit’s Outcomes
To focus the justice sector’s contribution to the key government goals, early in 2003 MOJ, the
leading ministry in the justice sector, and other core agencies agreed on two outcomes for the
sector. They were ‘safer communities’ and ‘a fairer, more creditable and more effective justice
system’ (see Appendix 3).
Whilst its indicators are yet to be established, the specific intermediate outcome to which
Collections Unit contributes, is ‘improved public confidence in the Police, the Judiciary and
other justice institutions’. Ensuring that monetary penalties are a credible sanction, is an outcome
statement Collections Unit has consistently made since its inception, despite a number of
changes in other outcome statements.
There are a number of groups whose views need to be considered in assessing whether
Collections Unit has been successful in achieving its outcome. Interviewee E asserts that taking
enforcement action and engaging publicity campaigns including advertising fines defaulters
names in newspapers, are effective ways to demonstrate to the general public that this outcome is
achieved. The impact of these enforcement and publicity activities can be verified by a public
opinion survey. From a taxpayer's view, an analysis of available statistic such as the growth of
unpaid fines (overdue and not-overdue), levels of imposition, cash collection and the resources
consumed may also provide meaningful information to the achievement of outcome.
However care must be taken in interpreting performance statistics. While the amount collected
increased from $59.3m in 1995 to $203.4m in 2005, and the percentage of unpaid overdue fines
reduced from 67% to 54%, total unpaid grew from $156.1m to $637.7m between 30 June 1995
and 30 June 2005. Despite good performance in other areas, the Office of the Controller and
Auditor-General (2005) stressed that the increase in the number and amount of unpaid fines
continues to be the key issue for Collections Unit.
Also from the justice perspective, where there is an expectation that re-offending rates should
decrease, the result may not be entirely positive. The recidivist rate is high at 60-80% and the
ever increasing level of unpaid fines of which 43% were under payment agreements as at 30
June 2005, gives an impression that offenders are either allowed to escape or escaping with a
lesser penalty by taking advantage of long term payment arrangements.

83
Collections Unit – a Procedural Type Organisation
The unobservable outcome criteria classified Collections Unit as a procedural-type organisation
because of a lack of consensus on how and what to measure. While it is possible to observe how
much money is collected and how many fines are resolved, exactly how these activities
contribute to outcome is unobservable.
The management of a procedural type organisation becomes means orientated, and “how the
operators go about their jobs is more important than whether doing those jobs produces the
desired outcomes” (Wilson, 1989, p. 164). Collections Unit recognises that its fines collection
and enforcement work requires compliance with procedures that aim to resolve fines in a just and
equitable manner. This is not suggesting that Collections Unit management should ignore the
quantum result of its fines compliance actions or incidents of dysfunctional behaviour, but that
all information should form an input to enhance the procedures used by staff.
CYF
CYF, as a social service government agency fits into a coping type organisation (Wilson, 1989;
Gregory, 1995b), for its care and protection activities. Its final goods and services and outcomes
are not observable or measurable. Despite the large number of outputs and output measures
quantified in the CYF output plan, they do not represent the final results of its care and
protection work.
CYF’s Outcomes
The new narrow outcomes defined by the Baseline Review and the requirement under MfO are
expected to help CYF in demonstrating positive outcome indicators. In complying with the
requirement of MfO, new outcomes are identified in care and protection along with a number of
proposed associated outcome indicators (see Figure 9.2).

84
Figure 9.2: Care and protection proposed outcome indicators
Source: CYF, 2005a, p.27
Narrowness of the new outcome statements
The proposed outcome indicators (see Figure 9.2) that CYF is currently developing reflect the
new outcomes defined by the Baseline Review. The review significantly narrowed the outcomes
to which CYF was to contribute as it found the previous objectives to be too broad. The focus is
now on the safety and security of children and young people, rather than general well-being. As
a priority, the outcome should be on preventing the recurrence of harm and child and youth re-
offending. The review stated that CYF should not be expected to be a broadly focused family
support service or to lead community development.
There are different views within CYF on this narrow-focus:
Baseline Review identified that we were trying to be all things to all people and carry the sole responsibility for the protection of children rather than CYF only being part of it (the solution). This clarification is beneficial to us on our way forward but is still tied to the unpredictability of the work. We have to respond. We don't have a choice. (Interviewee T) Baseline Review stated CYF should only be responsible for the children that come through the door. This view is very narrow - only on immediate safety and no contextual thinking around that the child lives with family/community…it sees the definition of CYF role as to prevent the re-occurrence and first occurrence. It focuses on an individual child in isolation, rather than the child's family. It negates the necessity of family involvement in the child's well-being outcome. This perspective goes against the intent of the legislation...The focus of the review is also very narrow in terms of preventative perspective… we can manage demand if we look at preventative work in that you engage families/communities to be responsible for their children. (Interviewee R)

85
While these new outcome statements may help CYF identify measurable indicators, the
question remains as to whether this is the right way forward. A number of interviewees saw the
benefit of a narrower outcome as it helped them to prioritise CYF activities better. In contrast
some interviewees strongly disagreed with the new focus, seeing it as a risk to CYF’s
effectiveness in their protection and care of children required under the legislation; and reducing
CYF’s ability to cope with increased demand by taking proactive actions.
Some views on assessing the outcome of care and protection services
A number of interviewees offered their opinions as to an objective assessment of the outcome of
care and protection work.
Need to track all the kids. Have they become productive adults or ended in prison? Then we need to interview prison inmates to ask what CYF could have done. (Interviewee V) Some outcomes can't be seen for twenty years. They are in the eyes of receivers whether the interventions are of quality. (Interviewee R) Ultimately you know the success or failure of an outcome is whether the child has reached a permanency. How long does it take and whether the child came back to CYF for problems that should have been known by CYF… In terms of measuring effectiveness in the short term it's almost impossible. (Interviewee W) Clients' outcomes should be evaluated so we know that we are doing the right things. Maybe we should take feedback from 5% of children who had received CYF interventions five years ago, instead of checking 5% of cases on internal process. (Interviewee Z)
As the interviewees suggested, effectiveness should be assessed on the client outcomes. Such
measures include how many children have been protected from harm and how many progressed
to achieving wellbeing. Only those children and young people and their families who have
received CYF interventions can provide credible feedback on whether CYF was successful in
helping them and just as importantly, how the interventions could improve.
Conducting such evaluation work has a number of complications. Firstly, such an exercise will
be costly as it would involve obtaining qualitative information from a large of number of people.
Secondly, the possible time lag may reduce the usefulness of such evaluative information. Social
work practice constantly evolves and feedback about interventions ten years ago may be
irrelevant. Thirdly, confirming a causal relationship between a CYF intervention and the
outcome for the children affected is expected to be difficult.

86
However recognising the importance of evaluative information, CYF plans to implement the
research and evaluation strategy that focuses on the effectiveness of interventions at different
parts of the care and protection process (CYF, 2005a). In addition an encouraging proposal to
evaluate child welfare was advanced recently by the Children's Commissioner. This proposal
requests the government 'to test every New Zealand child four times during childhood as part of
a radical plan to keep tabs on child welfare (Thomas, 2006). If this proposal is accepted, then
CYF may have another opportunity to include its evaluation criteria as part of the test.
CYF – a Coping Type Organisation
As a coping type organisation CYF understands very well that the most appropriate strategy is to
invest in its staff. This strategy is similar to Wilson's description on how coping organisations
can try recruiting the best people and to create an atmosphere that is conducive to good work to
deal with the difficult situations facing them. As the departing Chief Executive Paula Tyler
stated:
At Child, Youth and Family we understand that investing in our people is one of the best things we can do for New Zealand’s children, youth and families. The success of our organisation is directly reliant upon its staff – the people at the heart of our organisation who work so tirelessly everyday on behalf of children, youth and families. We believe that concentrating on building their skills will result in lasting success. (CYF, 2005d, p.1)
Fitness of Outputs under the Criteria of Well-Defined Outputs and
Measures
This section compares the fitness of outputs under the principles and criteria set out under
TPA 9. A rating of high, medium and low is used to indicate the degree of the criteria met based
on the analysis by the researcher in chapters 7 and 8 (see Table 9.1).
Collections Unit CYF
External focus High Low
Controllable Low Low
Comprehensive Low Low
Measurable High Medium
Informative Low Low
Table 9.1: Assessment of output and output measures specification

87
There are a number of similarities and differences between the two case organisations in terms of
the degree of their outputs and measures that satisfied criteria for a well-defined output. While
both scored poorly in controllable, comprehensive and informative tests, Collections Unit rated
high for external focus tests and measurable tests. However the highest score CYF rated is a
medium in measurable test.
Similarities
Controllable, Comprehensive and Informative
Their common low scores in controllable, comprehensive and informative tests suggest the
uniqueness of the environment in which Collections Unit and CYF operate and the complexity of
the tasks they undertake.
Firstly, Collections Unit and CYF have little control over demand of their services. Neither of
them has the luxury of refusing work when the level of demand exceeds its capability to cope.
Often the demand is generated as a result of other agencies’ actions and both organisations
identified Police as the main source of increased demand. Collections Unit must manage the
consequences of Police road safety outputs such as an increase in the number of speed cameras
or lower tolerance of speeding. CYF, on the other hand, faced an increased intake notification as
Police escalated the priority it gives to domestic violence.
Secondly, Collections Unit and CYF have limited control of case resolution. Collections Unit is
unlikely to resolve a fine if the available information is of low quality, the offender resides
overseas or has no financial means to pay. Though CYF is the lead agency, the very nature of
care and protection work requires cooperation across different agencies, communities and
families. The success of care and protection work depends on how well all parties work together.
Thirdly, neither of them has a flexible funding mechanism to increase or decrease resources in
line with demand. Collections Unit has been partially successful in negotiating additional
funding in return for higher amounts collected. CYF however, could only secure additional
funding through external reviews of its operation, which in turn resulted in massive restructuring
of its management, staff, processes and structure.

88
Fourthly, both organisations perform complex tasks. Care and protection work involves
professional and personal judgements based on at times ambiguous evidence and where the
outcome of decisions will affect the lives of many people. Fines collection and enforcement
work also requires judgements such as when to escalate enforcement action despite the offender's
claim of his/her ability to afford a payment arrangement; or what is the best means to resolve a
particular fine given the offender’s personal circumstances.
Compared to CYF, Collections Unit has greater opportunity to improve its scores in
comprehensive and informative tests in the future. Despite efforts to provide more information
on different parts of care and protection process, CYF outputs are expected to continue to
resemble internal assessments designed for internal management purposes. On the other hand
Collections Unit is clear about wanting to change the output measures to reflect a resolution
focus. The challenge is to define what is meant by resolution and how to measure it; and how to
balance these resolution focused output measures against the current measures.
Differences
External Focus
The contrasting scores of external focus between the two outputs illustrate a significant
difference between Collections Unit and CYF. This distinction is on what Alford (1993) refers to
as their “productive capabilities”. As a procedural type organisation Collections Unit is operating
on “self-production” and relies less on other entities to complete its fines collections and
enforcement work. Whereas CYF as a coping type organisation relies on what Alford calls “co-
production” to complete its care and protection work:
Accomplishing the objectives of a government program can often call for some of the work to be done by people or organisations other than the producing unit, such as the target group being regulated, or the program's clients, or other public sector agencies, or citizens generally (Alford, 1993, p.140).
Measurability
Although the current scores on measurability are different between the two organisations, CYF is
expected to improve its measurability rating. The primary reason for the medium score was due
to the lack of cut-off facility in the CYF’s computer system which may lead to data quality
problem. CYF plans to rectify this problem in the coming year.

89
Impact on Using Outputs as Performance Measures
Outputs primarily suit only production type organisations and the claim that New Zealand public
sector reforms treating all public agencies as if they are, or could be, production organisations is
well documented by Gregory (1994, 1995a, 1995b).
TPA-9 also assumes that all public organisations are of a production type. Despite the
acknowledgement that one size does not fit all and the likely difficulties of some public
organisations in specifying outputs and output measures, it requires output and output measure
specification to meet the tests of external focus, controllable, comprehensive, measurable and
informative.
There are a number of limitations in using outputs as performance measures in public
organisations. Output requires a direct causal link and may ignore the actual result of certain
tasks. This lack of recognition of the need to co-produce services prevents CYF from claiming
the true result of its care and protection work. CYF can only be successful in providing an
effective care and protection service, if all agencies and individuals cooperate – the children,
their families, community service providers, schools, health professionals, other government and
non-government agencies. CYF has resorted to identifying internal processes as outputs and as a
result has received criticism such as that CYF’s “current performance measures focus on
throughput and timeliness rather than on other quality measures and the achievement of
outcomes” (Hughes et al., 2003, p.11).
The second limitation is related to assumptions as to the degree of controllability public
organisations have over their work. Unlike the production type organisations, such as New
Zealand Post which can adjust the demand and capability for its service, other public
organisations such as Collections Unit and CYF operate on a fixed funding and need to cope
with whatever level of demand they face. New Zealand Post may decide to employ more staff
and hire more transport to take advantage of the increased Christmas mail and hence anticipated
additional revenue. In contrast CYF risks deterioration in its service quality when the level of
demand exceeds its capability to resolve cases properly. CYF is expected to receive close to
63,000 notifications in the 2006 fiscal year, an increase of 10,000 from the previous year.
Without a corresponding increase in capability the result may be deterioration in quality of care

90
and protection services. Similarly Collections Unit cannot control the level of fines imposition
and can only hope the impending Infringement Review will provide some solutions.
The third limitation relates to the poor informative value. The informative value of outputs is
inherently low as outputs should reflect the purchaser's rather than the owner's interest. Important
information for readers, whether they be clients, stakeholders, community partners or taxpayers,
on such issues as risk profiles is not reflected in the outputs. For example, readers should be
informed through a formal mechanism such as SSP that CYF is facing a significant risk of
becoming dysfunctional due to an ever increasing workload unless there is a corresponding and
timely increase in capacity. Currently this degree of analysis is absent in public reports.
While Collections Unit is not expected to face a similar risk, the inadequate information in its
output measures may also lead readers to reach an incorrect conclusion on performance. The
focus on cash collection and fines under arrangement in output measures may give readers the
impression that Collections Unit's primary function is the same as a debt collection agency.
Whilst fines collection is one of a number activities conducted by Collections Unit, its primary
function is to ensure fine offenders comply with monetary penalties imposed by courts. If non-
compliance occurs, Collection Officers can exercise their statutory power in taking enforcement
actions. Unlike a private debt collection agency, Collections Unit does not write off fines simply
because the debt becomes too costly or too difficult to recover. Fines remain in the Collections
Unit’s system until they are resolved – collected, or remitted. Fines can only be remitted by a
Judge or by a Registrar under limited circumstances, such as offender having no financial means
to pay and the remission is usually only given in exchange for an alternative sentence such as
community work or even imprisonment. In the past extreme enforcement actions have been
taken to recover reparations for victims who suffered horrific crime. For example a Hamilton
family home was seized and sold to recover reparation for victims (McGehan, 2000).
These limitations lead to a question as to how useful outputs are as performance measures. In
acknowledging the weaknesses of outputs, Scott, a key reformer of New Zealand reforms,
asserts: " …if we are not careful to specify performance correctly, then we do get distortion…A
loosely specified performance requirement …may be superior to a badly designed performance
agreement" (Scott, 2001, p.73). The question is if outputs, particularly for the coping type public
organisations, are considered loose or bad performance measures.

91
More importantly, the failure to recognise the co-production nature of certain public sector
activities has contributed to the fragmentation of the public service and ineffective delivery of
services that MfO is trying to solve. Departments are accountable for the delivery of their own
set of outputs and their funding is tied with these outputs. There is little incentive for government
departments to put their limited resources into cross-agency initiatives to achieve some distant
outcomes for which they are not accountable.
Summary
This chapter has found that the limitations of outputs and the impact of using them as
performance measures needs to be carefully considered by promoters of MfO. Despite the claim
of increased emphasis on the effectiveness in outputs, MfO does not propose to change the
characteristics of outputs nor their importance in the appropriations and performance
management process. As long as output continued its dominant role in public management, the
achievement of outcomes will remain questionable particularly for coping type public
organisations.

92
Chapter 10: Conclusion
Outputs serve as key performance measures in the management of the New Zealand public
sector. The nature of output supports the basic principles of the New Zealand public sector
reforms of clarity of objective, accountability and effective management of performance. In
addition the State Service Act 1986 and the PFA 1989 formalised outputs as key performance
measures for public sector organisations, and importantly, tied outputs with funding.
However the continued use of outputs as key performance measures in the current MfO
environment is expected to be problematic. Expectations that MfO would overcome issues such
as fragmentation of the public service and ineffective delivery of service are unlikely to be met
as long as outputs continue to dominate the performance measurement system. The nature of
outputs does not encourage inter-agency cooperation. As government departments are
appropriated primarily according to their individual outputs, when they faced with increased
demand and fixed funding, they are unlikely to spend resources in areas that they are not
formally accountable for.
Outputs measures should possess the characteristics set out by TPA-9. However this thesis
shows that not all the outputs measures examined possessed the required characteristics. Fines
compliance output measures met the tests of external focus and measurability satisfactorily but
not the tests of controllability, comprehensiveness and informative. Their comprehensiveness
and informative ratings may be improved, provided Collections Unit was able to reflect the fines
resolution focus in their new output measures. On the other hand the only rating CYF is expected
to improve is the measurability of its care and protection output measures and is unlikely to meet
the tests for external focus, controllability, comprehensiveness and informative.
A number of limitations of outputs were identified. These assumptions limit their use as effective
performance measures for some public organisations. Firstly, outputs assume all public
organisations are of production type and fail to recognise the co-production nature of craft and
coping organisations. Secondly, outputs assume a high level of controllability in terms of
managing demand, service delivery such as case resolution and acquiring capability. This
assumption does not apply to most non-commercial public organisations. Thirdly, outputs must
accurately represent the final goods and services produced by the organisation. As this thesis has
shown, justice and social services organisations perform complex tasks and output measures may

93
misrepresent critical functions of the organisations. Fourthly, outputs for all public
organisations are assumed to be observable and measurable. This is not true for coping and craft
organisations.
Outputs and outcomes of public organisations may or may not be observable. According to
Wilson’s (1989) typology, Collections Unit is a procedural organisation as while its fines
compliance output is observable, its outcome is not. Specific end results of fines compliance
processes, particularly quantifiable measures such as amount collected and the amount place
under time payment arrangement, are used as output measures, but the linkage of these output
measures and the intended outcomes is not easily established. In contrast, as a coping
organisation CYF cannot observe its care and protection outputs or outcomes. Instead measures
of discrete parts of care and protection processes are used as output measures. The linkage of
these output measures to the intended outcomes is weak.
The observability of fines compliance output, places Collections Unit in an advantageous
position despite the unobservability of its outcome. Collections Unit can point to the
achievement of all output measures and a suite of other statistics to demonstrate that they have
been performing well. Despite criticism about the increasing level of unpaid fines, Collections
Unit can justify its performance by the reduction in the overdue unpaid portion.
Conversely, CYF has very limited opportunity to prove its performance using care and
protection outputs or outcomes information. While CYF is expected to expand its output
measures, they are still unlikely to represent its contribution to its outcomes. CYF is expected to
continue to endeavour to satisfy reporting requirements, and criticism and scepticism from
central agencies on its performance is unlikely to disappear, as demonstrated in the recent (24
Feb 2006) news article:
The Government has released details of a far-reaching review of state spending and performance… Its first targets will be agencies and programmes that have received sharply increased funding, but may not be delivering value for money… Among the top priorities for review are business assistance programmes, Child Youth and Family's foster care policies and the performance of CYF…Funding at CYF has grown 50 per cent since a major review in 2003. The paper notes: "Although CYF has improved capability since the baseline review, it remains unclear to what extent this has led to improved outcomes." (Small, 2006)
This thesis demonstrates that outputs are inadequate performance measures for a procedural and
a coping organisation as output information may not be relevant, meaningful or useful. However

94
the most significant risk is that just as in the past, reliance on the outputs will continue to lead
to the fragmentation of public services and ineffective delivery of service.

95
References
ACNielsen (NZ) Limited (2000). Infringement Fine Customer Research: Focus Groups. Report
Prepared for Department for Courts. Wellington: ACNielsen (NZ) Limited.
Alford, J. (1993). Towards a new public management model: beyond managerialism and its
critics. Australian Journal of Public Administration, 52(2), 135-148.
Baird, L. (1986). Managing Performance. New York: John Wiley & Sons.
Ballou, B., Heitger, D., & Tabor, R. (2003). Nonfinancial Performance Measures in the
Healthcare Industry. Management Accounting Quarterly, 5(1), 11-16.
Berry, R. (2003, Nov 4). CYF head quits after bad review. The New Zealand Herald, A1
Boston, J., Martin, J., Pallot, J., & Walsh, P. (1996). Public Management: the New Zealand
Model. Auckland: Oxford University Press.
Brown, M. (2000). Care and protection is about adult behaviour: the ministerial review of the
Department of Child, Youth and Family Services.
(http://www.cyf.govt.nz/documents/BrownReport.pdf)
Collections Unit website: http://www.justice.govt.nz/ministry/collections.html
Connolly, M. (2001). Child Care and Protection Services in Child Welfare. In M. Connolly
(Ed.), New Zealand Social Work Contexts and Practice (pp. 221-235).
Auckland: Oxford University Press.
Courty, P. & Marschke, G. (2003). Dynamics of performance-measurement systems. Oxford
Review of Economic Policy. 19(2), 268-281.
Cossar, M., Donn, R., Francis, J., & Hornby, G. (1982). Review: Department of Justice: report of
Consultancy Team on Management Systems in the Commercial Affairs, Courts,
Penal and Probation Divisions. Wellington: Department of Justice.
CYF. (2005a). Statement of Intent 2005/2006. Wellington: The Department of Child, Youth and
Family Services.
CYF. (2005b). Output Plan: 1 July 2005 - 30 June 2006. Wellington: The Department of Child,
Youth and Family Services.
CYF. (2005c). Annual Report 2005. Wellington: The Department of Child, Youth and Family
Services.
CYF. (2005d). Briefing for the incoming minister October 2005.
(http://www.cyf.govt.nz/documents/bim_2005.pdf)
CYF website: http://www.cyf.govt.nz

96
Department of Justice. (1994). Review of the Department of Justice. Stage one report, 30.9.94,
&, Report of the Court Services Review Committee, 5.10.94. Wellington:
Department of Justice.
Department of the Prime Minister and Cabinet. (2006). Key Government Goals to Guide the
Public Sector in Achieving Sustainable Development
(http://www.dpmc.govt.nz/dpmc/publications/key_goals.html)
DFC. (1996a). Annual Report for the year ended 30 June 1996. Wellington: Department for
Courts.
DFC. (1996b). Collections Business Plan 1997-1998. Wellington: Department for Courts.
DFC. (2000). Collections Strategic Plan 2000-2005 and Business Plan 2001-2002. Wellington:
Department for Courts.
DFC. (2002). Ministerial Briefings 2002.
(http://www.beehive.govt.nz/briefings/justice/courts/section4.cfm)
Doolan, M. (2004). A life too short: child death by homicide in New Zealand: an examination of
incidence and statutory child protection actions. Unpublished master's thesis,
University of Canterbury, Christchurch, New Zealand.
DSW. (1993). Annual Report for the year ended 30 June 1993. Wellington: Department of
Social Welfare.
DSW. (1995). Annual Report for the year ended 30 June 1995. Wellington: Department of
Social Welfare.
Financial Reporting Act, (1993).
Fiscal Responsibility Act, (1994).
Gregory, R. (1994). Consolidating the reforms: can the production model be counter-productive?
Public Sector, 17(2), 18-21.
Gregory, R. (1995a). Accountability, Responsibility and Corruption: Managing the 'Public
Production Process'. In J. Boston (Ed.), The State Under Contract (pp. 56-77).
Wellington: Bridget Williams Books Ltd.
Gregory, R. (1995b). The peculiar tasks of public management: Toward conceptual
discrimination. Australian Journal of Public Administration, 54(2), 171-184.
Haines, L. (2003, Nov 4). CYFS Boss quits after ‘really painful’ report. Dominion Post, p. A1
Hood, C. (1991). Public management for all seasons'. Public Administration Review, 69, 3-19.
Hopwood, A. (1984). Accounting and the pursuit of efficiency. In A. Hopwood and C. Tompkins
(eds), Issues in public sector accounting (pp. 167-187). Oxford: Philip Allan
Limited.

97
Hughes, P., Inglis, M., Mersi, P., & Pivac, J. (2003). Report of the Department of Child, Youth
and Family Services First Principles Baseline Review.
(http://www.cyf.govt.nz/documents/baselineReview.pdf)
Hughs, O. (2003). Public management and administration: an introduction (3rd ed.). New York:
Palgrave.
ICANZ. (2005). Technical Practice Aids 9 Service Performance Reporting. Wellington: Institute
of Chartered Accountants of New Zealand
James, C. (1992). New territory: the transformation of New Zealand 1984-92. Wellington:
Bridget Williams Books Limited.
Langfield-Smith, K., Thorne, H., & Hilton, R. (2003). Management Accounting: an Australian
perspective (3rd ed.). Sydney: McGraw-Hill.
Martin, K. (1995). Contracting and Accountability’. In J. Boston (Ed.), The State Under
Contract (pp. 56-77). Wellington: Bridget Williams Books Ltd.
McKinnon, J. (1988). Reliability and validity in field research: some strategies and tactics.
Accounting, Auditing and Accountability, 1(1), 34-54.
McNamara, C., & Mong, S. (2005). Performance Measurement and Management: Some Insights
from Practice. Australian Accounting Review, 15(35), 14-28.
Ministry of Social Development website. (http://www.msd.govt.nz/about/historical-
timeline.html)
MOJ. (2004a). Annual Report for the year ended 30 June 2004. Wellington: Ministry of Justice.
MOJ. (2004b). Collections Business Plan 2004-2005 Wellington: Ministry of Justice.
MOJ. (2005a). Statement of Intent 2005/2006. Wellington: Ministry of Justice.
MOJ. (2005b). Briefings for the Incoming Ministers.
(http://www.justice.govt.nz/pubs/reports/2005/briefing-ministers-
2005/index.html)
MOJ & The Law Commission (2004). Review of the Infringement System: Options for Reform: A
Discussion Paper. (http://www.justice.govt.nz/pubs/reports/2004/infringements-
review/index.html)
McGehan, K. (2000, June 03). Court sells convicts' homes. Waikato Times, p.8
Nanni, A. J., Dixon, J., & Vollmann, T. (1990). Strategic control and performance measurement
- balancing financial and non-financial measures of performance. Journal of
Cost Management, 4(2), 33-42.
Neely, A., Bourne, M., & Kennerley, M. (2003). Dysfunctional performance through
dysfunctional measures. Cost Management, 17(5), 41-48.

98
Neely, A., Richards, H., Mills, J., Platts, K., & Bourne, M. (1997). Designing performance
measures: a structured approach. International Journal of Operations &
Production Management, 17(11), 1131-1150.
Norman, R. (2003). Obedient servants? Management freedoms and accountabilities in the New
Zealand public sector. Wellington: Victoria University Press.
Norman, R., & Smith, A. (1998). Criminal or customers? Wellington: Victoria Link Ltd.
Office of the Controller and Auditor-General (1999). Third Report for 1999: The Accountability
of Executive Government to Parliament June 1999.
(http://www.oag.govt.nz/1999/3rd-report/3rd-report.htm)
Office of the Controller and Auditor-General (2005). Ministry of Justice: Performance of the
Collections Unit in collecting and enforcing fines.
(http://www.oag.govt.nz/2005/fines/default.htm)
Olson, O., Guthrie, J., & Humphrey, C. (1998). International Experiences with Financial
Management Reforms in the World of Public Services - New World? Small
World? Better World? In O. Olson, J. Guthrie & C. Humphrey (Eds.), Global
Warning! Debating International Developments in New Public Financial
Management (pp. 17-48). Oslo: Cappelen Akademisk Forlag.
Pallot, J. (1996), Innovations in national government accounting and budgeting in New Zealand.
Research in Governmental and Nonprofit Accounting, 9, 323-4
Pallot, J. (1998a), The New Zealand revolution', in O. Olson, J. Guthrie, and C. Humphrey (eds),
Global warning! Debating international developments in new public financial
management (pp. 156-184), Oslo: Cappelen Akademisk Forlag.
Pallot, J. (1998b). The Role of Accounting in the Privatization of State Trading Enterprises in
New Zealand. Advances in Public Interest Accounting, 7, 161-191
Perry, J. & Kraermer, K. (eds) (1983). Public Management: Public and Private Perspectives.
California: Mayfield.
Public Finance Act 1989
Schick, A. (1996). The spirit of reform: managing the New Zealand state sector in a time of
change.
(http://www.ssc.govt.nz/display/document.asp?NavID=121&DocID=2845)
Schick, A. (1998). Why most developing countries should not try New Zealand reforms. The
World Bank Research Observer, 13(1), 123-131.
Schick, A (2001). Reflections on the New Zealand Model. Based on a lecture at the New Zealand
Treasury. (http://www.treasury.govt.nz/academiclinkages/schick/paper.asp)

99
Scott, G. (2000). Public management reform and lessons from experience in New Zealand.
International Public Management Journal, 3(1), 67-78
Scott, G. (2001). Public management in New Zealand: lessons and challenges. Wellington: New
Zealand Business Roundtable.
Scott, G., Ball, I., & Dale, T. (1997). New Zealand's Public Sector Management Reform. Journal
of Policy Analysis and Management, 16(3), 357-381.
Small, V. (2006, Feb 24). 'Razor gang' denies cost-cutting.
(http://www.stuff.co.nz/stuff/0,2106,3582476a11,00.html)
Smith, A. (2000). Anchoring change. Wellington: Victoria Link Ltd.
State-Owned Enterprise Act 1986
State Sector Act 1988
State Services Commission. (1991). Scoping Study: Police and Justice. Wellington: State
Services Commission
State Services Commission. (2001). Report of the advisory group on the Review of the Centre.
(http://www.ssc.govt.nz/display/document.asp?NavID=121&DocID=2776)
State Services Commission. (2002). Managing for Outcomes: Guidance for Departments.
(http://www.ssc.govt.nz/display/document.asp?navid=114&docid=2535&pagen
o=1#P14_117)
State Services Commission. (2003a). Managing for Outcomes: Guidance for Departments
(2003).
(http://www.ssc.govt.nz/display/document.asp?navid=114&docid=3530&pagen
o=1#P9_0)
State Services Commission. (2003b). 2004/05 Statements of Intent: Guidance and Requirements.
(http://www.ssc.govt.nz/display/document.asp?NavID=114&DocID=3542)
State Services Commission. (2003c) Pathfinder: Guidance on Outcome Focused Management.
(http://io.ssc.govt.nz/pathfinder/)
Summary Proceedings Amendment Act (No. 2) 1998.
The Children, Young Persons and their Families Act, (1989).
The Treasury. (1987). Government management - Brief to the incoming government. Wellington:
The Treasury.
The Treasury (1996). Putting it together. Wellington: The Treasury.
Thomas, K. (2006, Jan 25). Proposal to test every child in NZ. The Press, p. A1
Ussher, C. & Kibblewhite, A. (2005). Outcomes Focussed Management in New Zealand - A
Background Paper. (http://www.treasury.govt.nz/workingpapers/2001/01-5.asp)

100
Weeks, A. (1994). A Study of Financial Management Practices in the Children and Young
Persons Service in Fiscal 1994. Wellington: New Zealand. Children & Young
Persons Service.
Wilson , J. (1989). Bureaucracy. New York: Basic Books.
Yin, R. (2003). Case study research: design and methods. California: Sage Publications.

101
Appendix 1: Key Government Goals
Key Government Goals
The New Zealand government's outcomes are of a social, economic, environmental or cultural
nature. The six key government goals (Department of the Prime Minister and Cabinet, 2002) are
to:
• strengthen national identity and uphold the principles of the Treaty of Waitangi
• grow an inclusive, innovative economy for the benefit of all
• maintain trust in government and provide strong social services
• improve New Zealanders’ skills
• reduce inequalities in health, education, employment and housing
• protect and enhance the environment.

102
Appendix 2: Summary Output Plan – Care and Protection
Services
2005/06 Estimated Demand and
Performance Standards
2004/05 Actual
4.1 Intake, Investigation and Assessment
Activity Monitor
Number of intake notifications received by Child, Youth and Family
51,500 – 59,700 41,500 – 45,500
Number of intake notifications that require further action (FARs)
42,900 – 49,850 35,000 – 39,000
* Number of distinct clients at intake requiring further action
34,900 – 40,550 New for 05/06
Quantity
* Number of investigations completed
36,950 – 42,950
New for 05/06
Quality * The earliest notified cases will be given attention to ensure prompt allocation
All cases will be allocated within six months of notification
All cases will be allocated within six months of notification
* Clients waiting for investigation services will be monitored and reprioritised regularly in order to minimise client risk
80% of monitoring actions due are undertaken
80% of monitoring actions due are undertaken
Timeliness Response to Notifications: Notifications allocated to a social worker for investigation within timeframes:
Critical - within 24 hours 95% – 100% 95% – 100%
Very Urgent - within 48 hours 90% – 95% 90% – 95%
Action taken at sites by a social worker to establish the immediate safety of the child or young person, and to confirm the response time and further action required, within timeframes:
Urgent – within 7 days 50% – 85% 50% – 85%
Low Urgent – within 28 days 50% – 85% 50% – 85%

103
2005/06 Estimated Demand and
Performance Standards
2004/05 Actual
* Investigations and assessments will be completed in a timely manner
70% in 90 days if FAR received is less than 48,050 70% in 120 days if FAR is 48,050 or more
70% in 90 days
Cost Excluding GST
$ 53.056 m
$47.796 m
4.2 Case Management Quantity Number of Family/Whanau Agreements
3,100 – 3,600
2,250 – 2,750
Number of Care and Protection FGCs: Held Reconvened Reviewed
(total 5,150 – 6,000) 3,910 – 4,450 750 – 880 490 – 570
4,800 – 5,300
Quality * Percentage of FGC’s where a plan is created
80 – 90%
–
* Percentage of children and young people whose FGC plans were completed and the objectives were assessed as being met
80% –
Timeliness
Percentage of Family/Whanau Agreements reviewed on time
90%
90%
Percentage of Care and Protection FGC plans reviewed on time
90% 90%
Cost Excluding GST
$90.881 m
$81.872 m
4.3 Care Services
Activity Monitor * Number of children and young people in the custody of the Chief Executive at any time during the year (as measured at the end of each month)
Report Quarterly
–
* Number of care nights used (a care night is defined as an overnight stay by a CYF client in a placement which is provided by CYF such as in a residence, CYF caregivers, family/whanau/iwi caregivers, iwi social service caregivers or any other care provider)
1,770,700 – 2,057,900 –
Number of distinct clients in receipt of the Youth Services Strategy programmes that involve Specialist Family Home placements or one-to-one placements
45 – 65 45 – 65
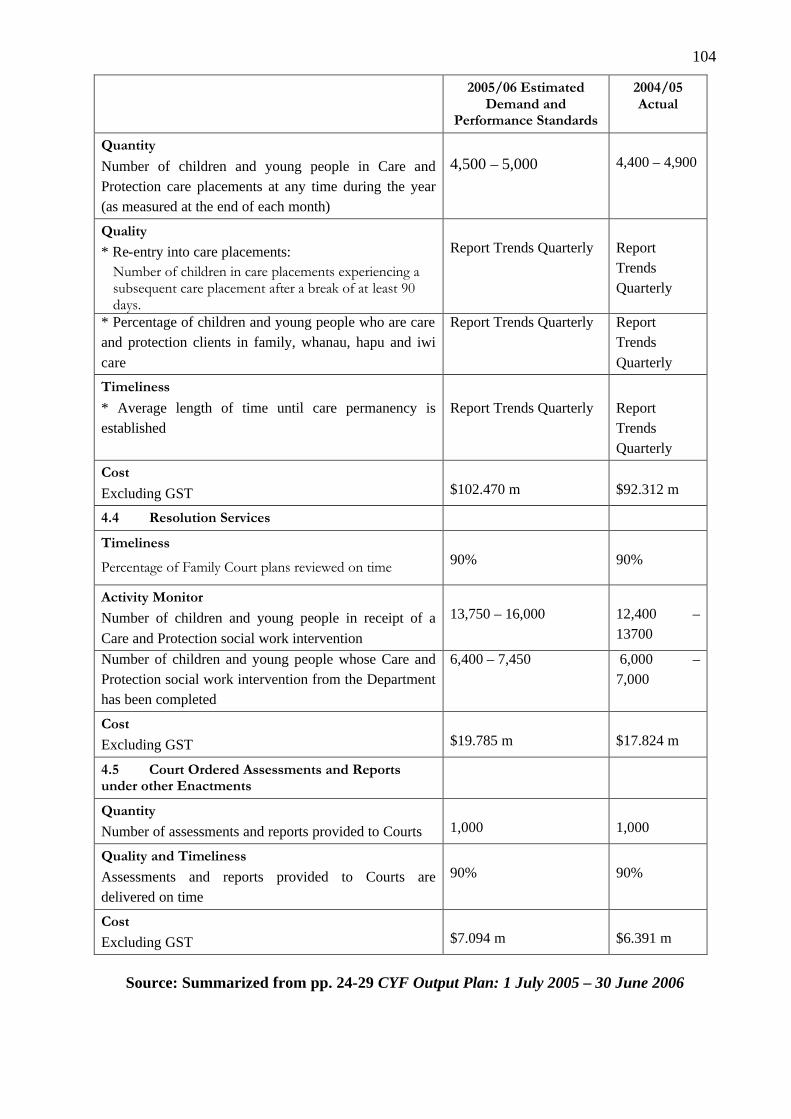
104
2005/06 Estimated Demand and
Performance Standards
2004/05 Actual
Quantity Number of children and young people in Care and Protection care placements at any time during the year (as measured at the end of each month)
4,500 – 5,000 4,400 – 4,900
Quality * Re-entry into care placements:
Number of children in care placements experiencing a subsequent care placement after a break of at least 90 days.
Report Trends Quarterly
Report Trends Quarterly
* Percentage of children and young people who are care and protection clients in family, whanau, hapu and iwi care
Report Trends Quarterly Report Trends Quarterly
Timeliness * Average length of time until care permanency is established
Report Trends Quarterly
Report Trends Quarterly
Cost Excluding GST
$102.470 m
$92.312 m
4.4 Resolution Services
Timeliness
Percentage of Family Court plans reviewed on time
90%
90%
Activity Monitor
Number of children and young people in receipt of a Care and Protection social work intervention
13,750 – 16,000
12,400 – 13700
Number of children and young people whose Care and Protection social work intervention from the Department has been completed
6,400 – 7,450 6,000 – 7,000
Cost Excluding GST
$19.785 m
$17.824 m
4.5 Court Ordered Assessments and Reports under other Enactments
Quantity Number of assessments and reports provided to Courts
1,000
1,000
Quality and Timeliness Assessments and reports provided to Courts are delivered on time
90%
90%
Cost Excluding GST
$7.094 m
$6.391 m
Source: Summarized from pp. 24-29 CYF Output Plan: 1 July 2005 – 30 June 2006

105
Appendix 3: Linkages Between Key Government Goals
and Justice Sector and Ministry Outcomes
Source: MOJ, 2004a, p. 19

106
Appendix 4: Letter of Approval – Collections Unit

107

108
Appendix 5: Letter of Approval – CYF