output and national measuring national 6 income c h a p t...
TRANSCRIPT

1 of 31 © 2014 Pearson Education, Inc.
C H A P T E R O U T L I N E
6 Measuring National Output and National
Income Gross Domestic Product Final Goods and Services Exclusion of Used Goods and Paper Transactions Exclusion of Output Produced Abroad by Domestically Owned Factors of Production
Calculating GDP The Expenditure Approach The Income Approach
Nominal versus Real GDP Calculating Real GDP Calculating the GDP Deflator The Problems of Fixed Weights
Limitations of the GDP Concept GDP and Social Welfare The Informal Economy Gross National Income per Capita
Looking Ahead
2 of 31 © 2014 Pearson Education, Inc.
national income and product accounts Data collected and published by the government describing the various components of national income and output in the economy.
While there are literally thousands of variables in the national income and product accounts, in this chapter we discuss only the most important.

3 of 31 © 2014 Pearson Education, Inc.
gross domestic product (GDP) The total market value of all final goods and services produced within a given period by factors of production located within a country.
GDP is the total market value of a country’s output. It is the market value of all final goods and services produced within a given period of time by factors of production located within a country.
Gross Domestic Product
final goods and services Goods and services produced for final use.
intermediate goods Goods that are produced by one firm for use in further processing by another firm.
value added The difference between the value of goods as they leave a stage of production and the cost of the goods as they entered that stage.
Final Goods and Services
4 of 31 © 2014 Pearson Education, Inc.
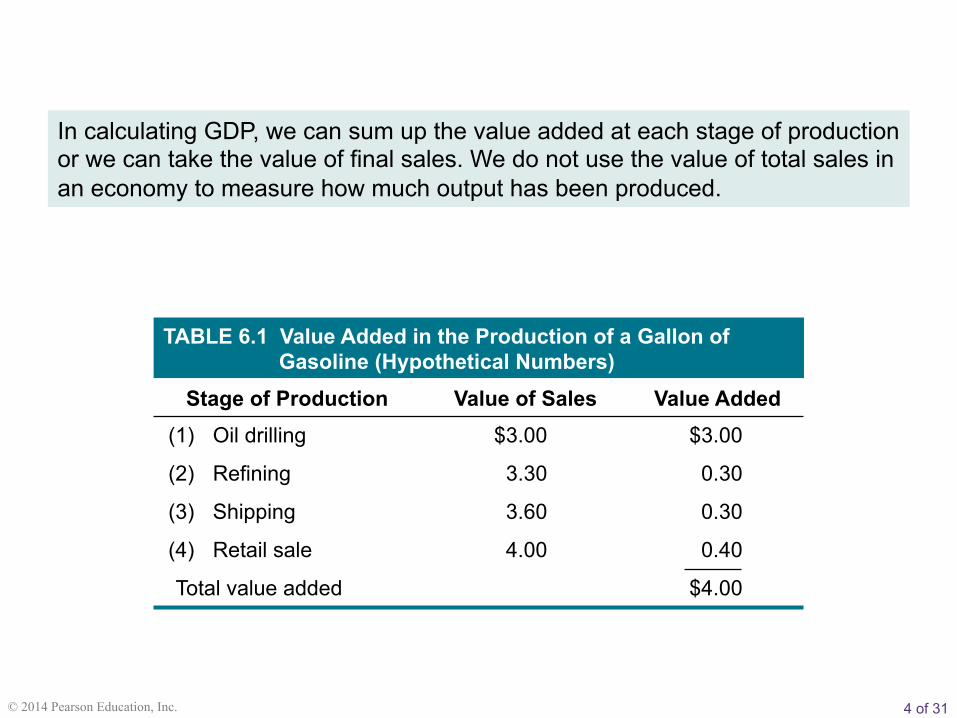
In calculating GDP, we can sum up the value added at each stage of production or we can take the value of final sales. We do not use the value of total sales in an economy to measure how much output has been produced.
TABLE 6.1 Value Added in the Production of a Gallon of Gasoline (Hypothetical Numbers)
Stage of Production Value of Sales Value Added (1) Oil drilling $3.00 $3.00
(2) Refining 3.30 0.30
(3) Shipping 3.60 0.30
(4) Retail sale 4.00 0.40
Total value added $4.00

5 of 31 © 2014 Pearson Education, Inc.
GDP is concerned only with new, or current, production. Old output is not counted in current GDP because it was already counted when it was produced.
GDP does not count transactions in which money or goods changes hands but in which no new goods and services are produced.
Exclusion of Used Goods and Paper Transactions
GDP is the value of output produced by factors of production located within a country.
gross national product (GNP) The total market value of all final goods and services produced within a given period by factors of production owned by a country’s citizens, regardless of where the output is produced.
Exclusion of Output Produced Abroad by Domestically Owned Factors of Production
6 of 31 © 2014 Pearson Education, Inc.
expenditure approach A method of computing GDP that measures the total amount spent on all final goods and services during a given period.
income approach A method of computing GDP that measures the income—wages, rents, interest, and profits—received by all factors of production in producing final goods and services.
Calculating GDP

7 of 31 © 2014 Pearson Education, Inc.
There are four main categories of expenditure: ! Personal consumption expenditures (C): household spending on consumer
goods ! Gross private domestic investment (I): spending by firms and households
on new capital, that is, plant, equipment, inventory, and new residential structures
! Government consumption and gross investment (G) ! Net exports (EX − IM): net spending by the rest of the world, or exports
(EX) minus imports (IM)
GDP = C + I + G + (EX − IM)
The Expenditure Approach
8 of 31 © 2014 Pearson Education, Inc.
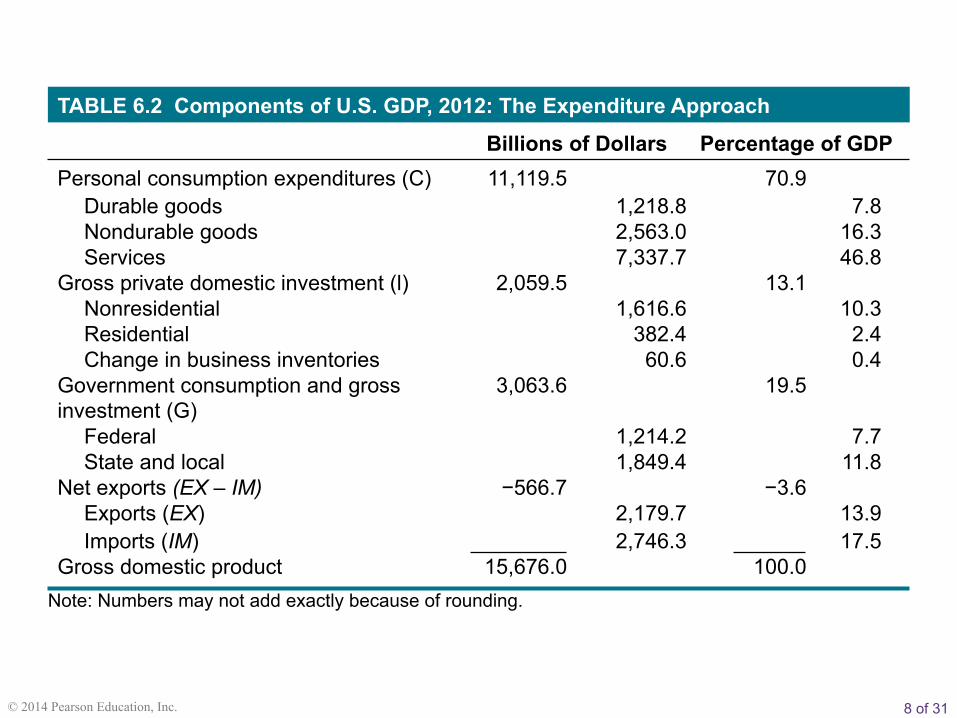
TABLE 6.2 Components of U.S. GDP, 2012: The Expenditure Approach
Billions of Dollars Percentage of GDP Personal consumption expenditures (C) 11,119.5 70.9
Durable goods 1,218.8 7.8 Nondurable goods 2,563.0 16.3 Services 7,337.7 46.8
Gross private domestic investment (l) 2,059.5 13.1 Nonresidential 1,616.6 10.3 Residential 382.4 2.4 Change in business inventories 60.6 0.4
Government consumption and gross investment (G)
3,063.6 19.5
Federal 1,214.2 7.7 State and local 1,849.4 11.8
Net exports (EX – IM) −566.7 −3.6 Exports (EX) 2,179.7 13.9 Imports (IM) 2,746.3 17.5
Gross domestic product 15,676.0 100.0 Note: Numbers may not add exactly because of rounding.

9 of 31 © 2014 Pearson Education, Inc.
Personal Consumption Expenditures (C)
personal consumption expenditures (C) Expenditures by consumers on goods and services.
durable goods Goods that last a relatively long time, such as cars and household appliances.
nondurable goods Goods that are used up fairly quickly, such as food and clothing.
services The things we buy that do not involve the production of physical things, such as legal and medical services and education.
10 of 31 © 2014 Pearson Education, Inc.
eBay’s business is to provide a marketplace for exchange. In doing so, it uses labor and capital and creates value.
In return for creating this value, eBay charges fees to the sellers that use its site. The value of these fees enter into GDP.
Items that people sell on eBay do not contribute to current GDP. The cost of finding an interested buyer for those goods, however, does get counted.
E C O N O M I C S I N P R A C T I C E
Where Does eBay Get Counted?
THINKING PRACTICALLY
1. John has a 2009 Honda Civic. In 2013, he sells it to Mary for $10,000. Is that $10,000 counted in the GDP for 2013?
2. If John is an automobile dealer, does that change your answer to Question 1 at all?
11 of 31 © 2014 Pearson Education, Inc.
gross private domestic investment (I) Total investment in capital—that is, the purchase of new housing, plants, equipment, and inventory by the private (or nongovernment) sector.
nonresidential investment Expenditures by firms for machines, tools, plants, and so on.
residential investment Expenditures by households and firms on new houses and apartment buildings.
Gross Private Domestic Investment (I)
change in business inventories The amount by which firms’ inventories change during a period. Inventories are the goods that firms produce now but intend to sell later.
GDP = Final sales + Change in business inventories
Change in Business Inventories

12 of 31 © 2014 Pearson Education, Inc.
depreciation The amount by which an asset’s value falls in a given period.
gross investment The total value of all newly produced capital goods (plant, equipment, housing, and inventory) produced in a given period.
net investment Gross investment minus depreciation.
capitalend of period = capitalbeginning of period + net investment
Gross Investment versus Net Investment
13 of 31 © 2014 Pearson Education, Inc.
government consumption and gross investment (G) Expenditures by federal, state, and local governments for final goods and services.
net exports (EX − IM) The difference between exports (sales to foreigners of U.S.-produced goods and services) and imports (U.S. purchases of goods and services from abroad). The figure can be positive or negative.
Government Consumption and Gross Investment (G)
Net Exports (EX − IM)
14 of 31 © 2014 Pearson Education, Inc.
The Income Approach
compensation of employees Includes wages, salaries, and various supplements—employer contributions to social insurance and pension funds, for example—paid to households by firms and by the government.
proprietors’ income The income of unincorporated businesses.
rental income The income received by property owners in the form of rent.
corporate profits The income of corporations.
national income The total income earned by the factors of production owned by a country’s citizens.
net interest The interest paid by business.

15 of 31 © 2014 Pearson Education, Inc.
net business transfer payments Net transfer payments by businesses to others.
surplus of government enterprises Income of government enterprises.
TABLE 6.3 National Income, 2012 Billions of
Dollars Percentage of
National Income National income 13,833.2 100.0
Compensation of employees 8,559.8 61.9 Proprietors’ income 1,203.0 8.7 Rental income 463.5 3.4 Corporate profits 1,939.3 14.0 Net interest 504.1 3.6
Indirect taxes minus subsidies 1069.6 7.7 Net business transfer payments 127.9 0.9 Surplus of government enterprises −34.0 −0.2
indirect taxes minus subsidies Taxes such as sales taxes, customs duties, and license fees less subsidies that the government pays for which it receives no goods or services in return.

16 of 31 © 2014 Pearson Education, Inc.
statistical discrepancy Data measurement error.
personal income The total income of households.
net national product (NNP) Gross national product minus depreciation; a nation’s total product minus what is required to maintain the value of its capital stock.
TABLE 6.4 GDP, GNP, NNP, and National Income, 2012 Dollars
(Billions) GDP 15,676.0
Plus: Receipts of factor income from the rest of the world +774.1 Less: Payments of factor income to the rest of the world −537.0
Equals: GNP 15,913.1 Less: Depreciation −2,011.4
Equals: Net national product (NNP) 13,901.7 Less: Statistical discrepancy −68.5
Equals: National income 13,833.2
17 of 31 © 2014 Pearson Education, Inc.
disposable personal income or after-tax income Personal income minus personal income taxes. The amount that households have to spend or save.
personal saving The amount of disposable income that is left after total personal spending in a given period.
personal saving rate The percentage of disposable personal income that is saved. If the personal saving rate is low, households are spending a large amount relative to their incomes; if it is high, households are spending cautiously.

18 of 31 © 2014 Pearson Education, Inc.
TABLE 6.5 National Income, Personal Income, Disposable Personal Income, and Personal Saving, 2012
Dollars (Billions)
National income 13,833.2 Less: Amount of national income not going to households −430.8
Equals: Personal income 13,402.4 Less: Personal income taxes −1,471.9
Equals: Disposable personal income 11,930.6 Less: Personal consumption expenditures −11,119.5 Personal interest payments −172.3 Transfer payments made by households −168.1
Equals: Personal saving 470.8 Personal saving as a percentage of disposable personal income: 3.9%

19 of 31 © 2014 Pearson Education, Inc.
current dollars The current prices that we pay for goods and services.
nominal GDP Gross domestic product measured in current dollars.
weight The importance attached to an item within a group of items.
Nominal versus Real GDP

20 of 31 © 2014 Pearson Education, Inc.
TABLE 6.6 A Three-Good Economy (1) (2) (3) (4) (5) (6) (7) (8)
GDP in GDP in GDP in GDP in Year 1 in Year 2 in Year 1 in Year 2 in
Production Price per Unit Year 1 Year 1 Year 2 Year 2 Year 1 Year 2 Year 1 Year 2 Prices Prices Prices Prices
Q1 Q2 P1 P2 P1 × Q1 P1 × Q2 P2 × Q1 P2 × Q2
Good A 6 11 $0.50 $0.40 $3.00 $5.50 $2.40 $4.40 Good B 7 4 0.30 1.00 2.10 1.20 7.00 4.00 Good C 10 12 0.70 0.90 7.00 8.40 9.00 10.80 Total $12.10 $15.10 $18.40 $19.20
Nominal GDP in year 1
Nominal GDP in year 2
Calculating Real GDP
base year The year chosen for the weights in a fixed-weight procedure.
fixed-weight procedure A procedure that uses weights from a given base year.
21 of 31 © 2014 Pearson Education, Inc.
Policy makers not only need good measures of how real output is changing but also good measures of how the overall price level is changing. The GDP deflator is one measure of the overall price level.
Calculating the GDP Deflator
Many structural changes took place in the U.S. economy between the 1950s and 1987. The use of fixed-price weights does not account for the responses in the economy to supply shifts. The fixed-weight procedure ignores the substitution away from goods whose prices are increasing and toward goods whose prices are decreasing or increasing less rapidly.
The Problems of Fixed Weights
22 of 31 © 2014 Pearson Education, Inc.
If crime levels went down, society would be better off, but a decrease in crime is not an increase in output and is not reflected in GDP. An increase in leisure is also an increase in social welfare, sometimes associated with a decrease in GDP. Most nonmarket and domestic activities, such as housework and child care, are not counted in GDP even though they amount to real production. GDP also has nothing to say about the distribution of output among individuals in a society.
Limitations of the GDP Concept
GDP and Social Welfare
23 of 31 © 2014 Pearson Education, Inc.
informal economy The part of the economy in which transactions take place and in which income is generated that is unreported and therefore not counted in GDP.
The Informal Economy
gross national income (GNI) GNP converted into dollars using an average of currency exchange rates over several years adjusted for rates of inflation.
Gross National Income per Capita
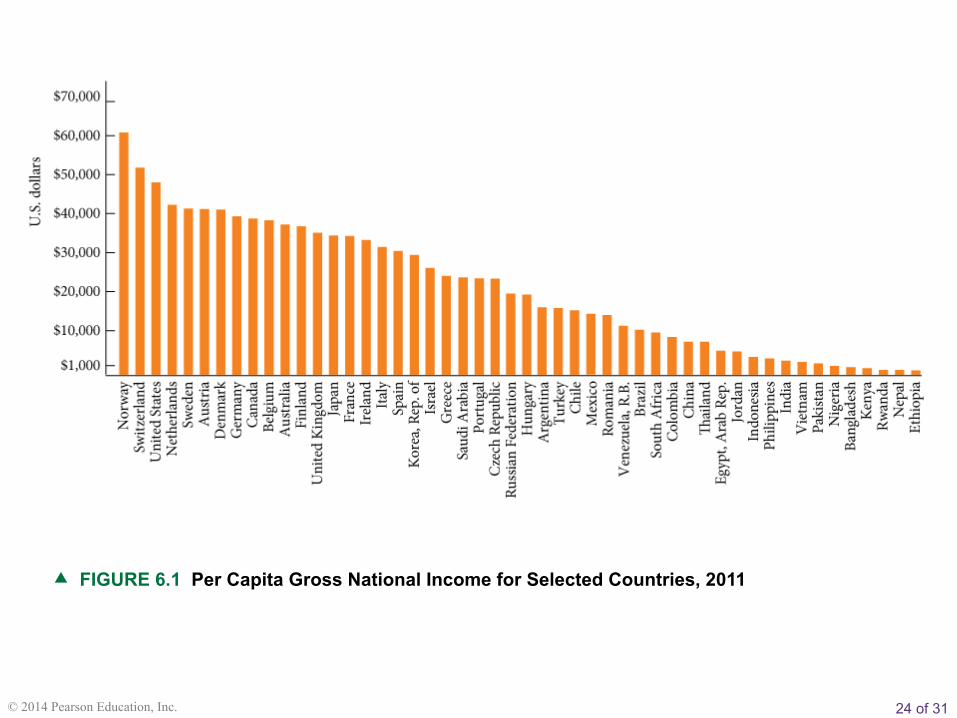
24 of 31 © 2014 Pearson Education, Inc.
� FIGURE 6.1 Per Capita Gross National Income for Selected Countries, 2011
25 of 31 © 2014 Pearson Education, Inc.
base year change in business inventories compensation of employees corporate profits current dollars depreciation disposable personal income, or after-tax
income durable goods expenditure approach final goods and services fixed-weight procedure government consumption and gross
investment (G)
R E V I E W T E R M S A N D C O N C E P T S
gross domestic product (GDP) gross investment gross national income (GNI) gross national product (GNP) gross private domestic investment (I) income approach indirect taxes minus subsidies informal economy intermediate goods national income national income and product accounts net business transfer payments
26 of 31 © 2014 Pearson Education, Inc.
net exports (EX − IM) net interest net investment net national product (NNP) nominal GDP nondurable goods nonresidential investment personal consumption expenditures (C) personal income personal saving personal saving rate proprietors’ income
R E V I E W T E R M S A N D C O N C E P T S
rental income residential investment services statistical discrepancy surplus of government enterprises value added weight Expenditure approach to GDP: GDP =
C + I + G + (EX − IM) GDP = Final sales + Change in
business inventories capitalend of period = capitalbeginning of period +
net investment