outlook on the chinese economy · l. gauvin and c. rebillard (2015) ”towards recoupling?...
TRANSCRIPT

Copyright Mizuho Research Institute Ltd. All Rights Reserved.
Outlook on the Chinese Economy ~Implications for the Global Economy and Markets ~
14 October 2016
Katsuyuki Hasegawa, CFA Chief Market Economist

Slow Down of the Chinese Economy
1
0
5
10
15
20
25
30
Real GDP Nominal GDP
(YOY, %)【 GDP Growth Rate in China 】
Source: National Bureau of Statistics of China, CEIC Data

Growth Rate by Sectors
2
0
2
4
6
8
10
12
14
16
2012 13 14 15 16
Real GDP (Tertiary Industry)Nominal GDP (Tertiary Industry)Rarl GDP (Secondary Industry)Nominal GDP (Seconodary Industry)
(YOY, %)
【 GDP Growth Rate in China】
Source: National Bureau of Statistics of China, CEIC Data

Signs of Stabilization in the Chinese Economy
3
0
5
10
15
20
14/Jan 15/Jan 16/Jan
Industrial productionRetail sales of consumer goodsInvestment in fixed assets
(Y-o-y % change)
(yy/mmm)
Notes: 1. Readings on “industrial production”, retail sales” and “investment in fixed assets” for January and February are changes over the year-ago of the Jan-Feb period. 2. “Investment in fixed assets” is the cumulative total from the beginning of the year converted into a single month basis. 3. "Industrial production" (real terms), "retail sales of consumer goods”,"investment in fixed assets" and "exports" are in nominal terms. Source: Made by MHRI based upon National Bureau of Statistics of China, CEIC Data..
【 Key Economic Indicators 】

Deflation in the Manufacturing Sectors
4
▲ 8
▲ 6
▲ 4
▲ 2
0
2
4
6
8
10
11 12 13 14 15 16
Consumer Price
Producer Price
(YOY,%)【Inflation Trends in China 】
Source: National Bureau of Statistics of China, CEIC Data

Excessive Capacities and Declining Utilization
5
60
65
70
75
80
85
2006 07 08 09 10 11 12 13 14 15
(%)
【Capacity Utilisation Rate in China 】
Source: Made by MHRI base upon Chinese Entrepreneurs Survey System

Excessive Debts and Balance Sheet Adjustment in China
6
【 Rising private-sector debt in China and Emerging Market Countries 】
Note: “EM” refers to the total of China, India, Hong Kong, South Korea, Singapore, Thailand, Malaysia, Indonesia, Brazil, Russia, South Africa, and Turkey. “DM” refers to the total of the US, eurozone, UK and Japan. Source: Made by MHRI based upon BIS.
EMDM
China
EM(ex China)
20
40
60
80
100
120
140
160
180
200
220
99 00 01 02 03 04 05 06 07 08 09 10 11 12 13 14 15
(As a percentage of GDP, %)
(CY)
EM credit expansion
DM debt crisis
EM debt crisis
DM credit expansion

Rising Non Performing Loans in China
7
0
1
2
3
4
5
6
0
1,000
2,000
3,000
4,000
5,000
6,000
09/3 10/3 11/3 12/3 13/3 14/3 15/3 16/3
(%)(Billion Yuan)
Wathc List LoansNPLsNPL Ratio (Right Scale)NPL+Wach List Loans Ratio (Right Scale)
【 Non Performing Loans (NPL) in China 】
Source: Made by MHRI base upon China Banking Regulatory Commission

Thoughts on the Size of the Potential NPL in China
8
IndustryNo.of
Companies
TotalBorrowings
(US$ millions)
No. ofCompanies at
Risk
Debt-at-Risk(US$ millions)
Debt-at-Risk over TotalBorrowings(%)
Information Technology 377 147,229 71 12,576 9
Retail and Wholesale 321 157,113 73 55,145 35
Manufacturing 1,231 501,659 240 88,525 18
Leasing 43 5,342 6 142 3
Utilities 109 369,881 9 3,086 1
Steel 72 115,484 28 45,396 39
Construction Materials 43 59,841 9 11,625 19
Transportation 104 152,096 10 27,548 18
Mining 52 135,163 15 47,598 35
Energy 43 224,845 15 2,357 1
Real Estate 407 850,737 100 96,412 11
Others 69 55,558 14 1,642 3
Total 2,871 2,774,948 590 392,053 14
【 Debt-at-Risk in China (Calculation by IMF) 】
Source: IMF

China Should Have Will and Means to Tackle the Problem
9
【 General Government Debt / GDP Ratio 】
43.9
248.1
105.8
71.0
17.7
73.7 67.2
0
50
100
150
200
250
300
China Japan US Germany Russia Brazil India
(%)
Source: IMF, Fiscal Monitor, April 2016
3 Channels of Spillover Effects of China Slowdown
10 10
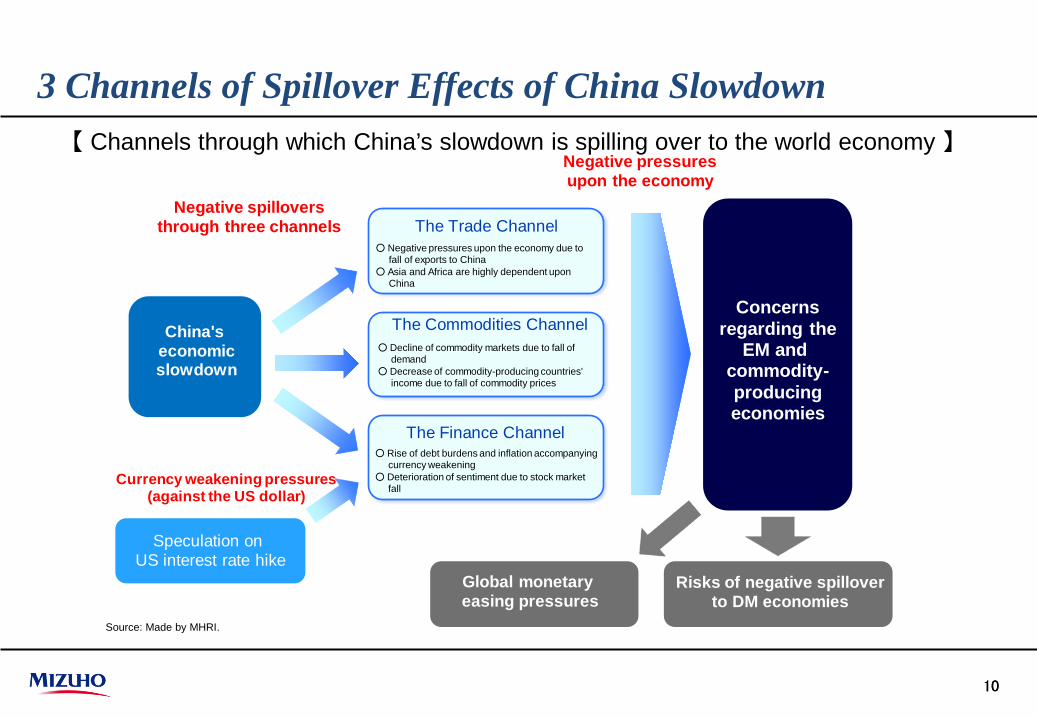
【 Channels through which China’s slowdown is spilling over to the world economy 】
Source: Made by MHRI.
China's economicslowdown
The Trade Channel○ Negative pressures upon the economy due to
fall of exports to China○ Asia and Africa are highly dependent upon
China
The Commodities Channel○ Decline of commodity markets due to fall of
demand○ Decrease of commodity-producing countries'
income due to fall of commodity prices
The Finance Channel○ Rise of debt burdens and inflation accompanying
currency weakening○ Deterioration of sentiment due to stock market
fall
Concernsregarding the
EM and commodity-producingeconomies
Speculation on US interest rate hike
Negative pressures upon the economy
Currency weakening pressures (against the US dollar)
Negative spillovers through three channels
Global monetary easing pressures
Risks of negative spilloverto DM economies

China as the Engine of the Global Growth
11
▲ 2
▲ 1
0
1
2
3
4
5
6
2000 05 10 15
OthersJapanEUUSChinaGlobal
(YOY, %)【 Global GDP Growth Rate 】
Source: IMF

Trade Channel: Global Dependence on the Export to China
12
China
NIEs15.2%
MENA4.9%
Japan3.5%
US0.9%
Europe1.5%
ASEAN8.2%
Central and South America
2.2%
Australia6.2%
Sub-SaharanAfrica6.5%
India0.8%
Central and Eastern Europe, former Soviet
Union1,8%
USD200 bil
USD150 bil
USD100 bil
Note: China-bound exports of each of the regions are based upon the value of China’s imports. The dark blue line indicates that the pace of increase has accelerated from the previous year, the red line indicates that the pace of increase has slowed from the previous year, and the broken red line indicates a decrease from the previous year. The values of each of the regions are the percentage of China-bound exports in nominal GDP. Sources: Made by MHRI based upon IMF.

Impact of Slowdown in China on Global Exports
13
【 The spillover from China’s economic slowdown (Global VAR) 】
Notes: 1. The size of the “China Shock” assumes that China’s GDP is subject to a one-standard-deviation negative impact (China’s GDP falls by approximately 0.7% one year on). 2. The impact upon overseas GDP is the impact upon total GDP of the countries weighted by the value of exports from Japan. Source: Made by MHRI based upon Smith, L.V. and A. Galesi (2014),”GVAR Toolbox 2.0”(https://sites.google.com/site/gvarmodelling/gvar-toolbox), L. Gauvin and C. Rebillard (2015) ”Towards Recoupling? Assessing the Global Impact of a Chinese Hard Landing through Trade and Commodity Price Channels”, and others.
< The spillover to real exports of major countries (one year on) > < Impact upon overseas GDP and Japan’s exports (cumulative) >
-4.0
-3.5
-3.0
-2.5
-2.0
-1.5
-1.0
-0.5
0.0
Japan
China
Indonesia
Philippines
Hong K
ong
US
Singapore
Malaysia
Thailand
Italy
Germ
any
S. K
orea
Austria
Spain
Belgium
Brazil
UK
Canada
France
Russia
(Impact upon real exports, %)
-3.5
-3.0
-2.5
-2.0
-1.5
-1.0
-0.5
0.0
-0.9
-0.8
-0.7
-0.6
-0.5
-0.4
-0.3
-0.2
-0.1
0.0
0 1 2 3 4 5 6 7 8 9 10 11 12
Contribution by China
Contribution by Asia (ex China)
Contribution by the US
Contribution by the eurozone
Other contributions
Impact upon overseas GDPImpact upon
Japan's exports(right scale)
(Lapse from the "Shina Shock", quarters)
(Impact upon overseas GDP, %) (Impact upon Japan's exports, %)

Overall Impact of China Slowdown on the Global Economies
14
Note: Cumulative impact one year following the “China Shock”. The size of the “China Shock” assumes that China’s GDP is subject to a one-standard-deviation negative impact (China’s GDP falls by approximately 0.7% one year on). Source: Made by MHRI based upon Smith, L.V. and A. Galesi (2014),”GVAR Toolbox 2.0”(https://sites.google.com/site/gvarmodelling/gvar-toolbox), L. Gauvin and C. Rebillard (2015) ”Towards Recoupling? Assessing the Global Impact of a Chinese Hard Landing through Trade and Commodity Price Channels”.
【 Impact upon real GDP (one year following the “China Shock”. 】
-1.8
-1.6
-1.4
-1.2
-1.0
-0.8
-0.6
-0.4
-0.2
0.0
RussiaSingaporeHong KongTurkeyMalaysiaArgentinaFinlandThailandMexicoSwedenIndonesiaItalyS. KoreaJapanCanadaPeruGermanyAustraliaSaudi ArabiaBrazilUS PhilippinesNetherlandsSwitzerlandChileBelgiumSouth AfricaSpainUK IndiaFranceNorwayNew ZealandPolandAustralia
EMDM
(Impact upon real GDP, %)
Negative impact surpasses those
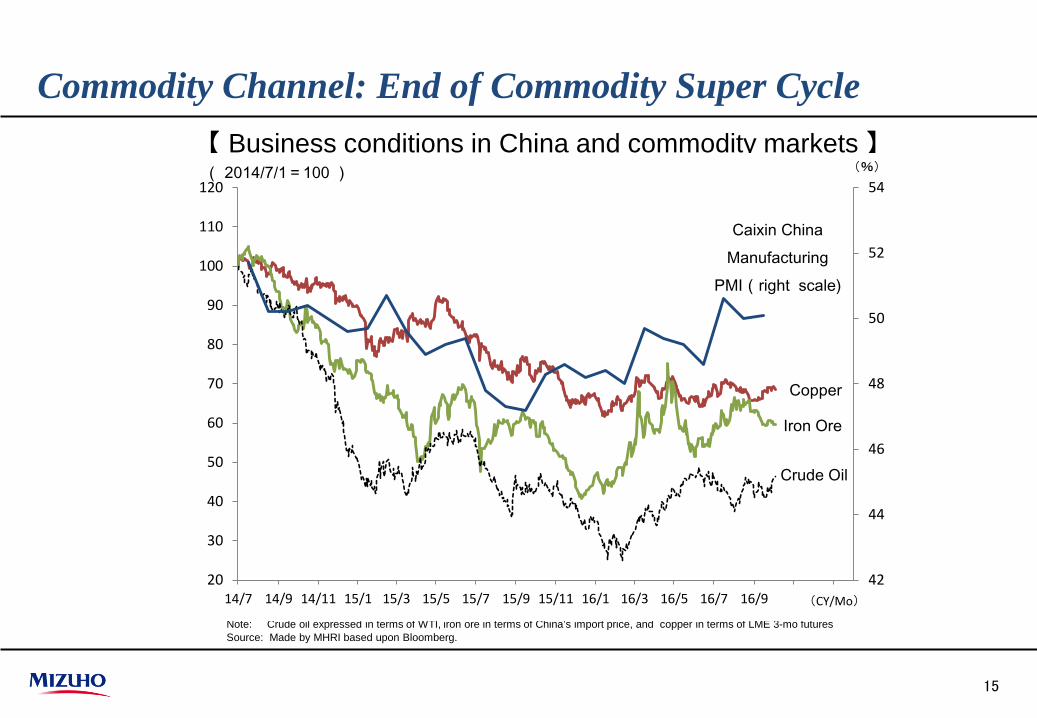
Commodity Channel: End of Commodity Super Cycle
15
Note: Crude oil expressed in terms of WTI, iron ore in terms of China’s import price, and copper in terms of LME 3-mo futures Source: Made by MHRI based upon Bloomberg.
【 Business conditions in China and commodity markets 】
Copper
Iron Ore
Crude Oil
Caixin China Manufacturing
PMI(right scale)
42
44
46
48
50
52
54
20
30
40
50
60
70
80
90
100
110
120
14/7 14/9 14/11 15/1 15/3 15/5 15/7 15/9 15/11 16/1 16/3 16/5 16/7 16/9 16/11 17/1
( 2014/7/1=100 )
(CY/Mo)
(%)

Financial Market Development in China
16
【 RMB Exchange rate and Shanghai Stock Index】
2,500
3,000
3,500
4,000
4,500
5,000
5,5006.10
6.20
6.30
6.40
6.50
6.60
6.70
6.8015/Jan 15/Apr 15/Jul 15/Oct 16/Jan 16/Apr 16/Jul
RMB/USD exchange rate
Shanghai Stock Exchange CompositeIndex (right)
Strong RMB
Weak RMB
(yy/mmm)
(RMB/USD) (Pt)
Source: Made by MHRI based upon Bloomberg.

Concerns for the Capital Outflow from China
17
▲ 200
▲ 150
▲ 100
▲ 50
0
50
100
150
10 11 12 13 14 15 16
Change in Foreign Exchange Reserve
Capital Inflow (+) /Outflow (-)
(US$ Billion)【 Capital Inflow to and Outflow from China 】
Source: Bloomberg

Our Main Scenario for the Chinese and Global Economy
18
Note: The total of the forecast area is calculated upon the 2014 GDP share (PPP) by the IMF. Sources: Made by MHRI based upon International Monetary Fund (IMF) and statistics of relevant countries and regions.
(Y-o-y % change) (% point)2014 2015 2016 2017 2016 2017 2016 2017
(Actual) (Actual) (Forecast) (Forecast)
Total of forecast area 3.5 3.4 3.2 3.6 3.2 3.6 - -
Japan, US, Eurozone 1.6 2.1 1.3 1.6 1.3 1.6 - -
US 2.4 2.6 1.4 2.2 1.4 2.2 - -
Eurozone 1.1 2.0 1.5 1.1 1.5 1.1 - -
Japan -0.0 0.5 0.5 0.7 0.5 0.7 - -
Asia 6.4 6.1 6.0 6.0 6.0 6.0 - -
China 7.3 6.9 6.6 6.5 6.6 6.5 - -
NIEs 3.4 1.9 1.9 2.2 1.8 2.2 0.1 -
ASEAN5 4.6 4.8 4.8 4.6 4.7 4.6 0.1 -
India 7.0 7.2 7.6 7.5 7.7 7.6 -0.1 -0.1
Australia 2.7 2.5 2.8 2.5 2.7 2.5 0.1 -
Brazil 0.1 -3.8 -3.2 1.0 -3.4 0.8 0.2 0.2
Russia 0.7 -3.7 -1.2 1.0 -1.2 1.0 - -
Japan (FY) -0.9 0.8 0.6 0.9 0.6 0.9 - -
Crude oil price (WTI, USD/bbl) 93 49 42 45 42 45 - -
(Breadth of change from August)(Forecast as of August)Calendar year

Long Term Trend & Outlook on the Global Economy
19
1996~2000 2001~2005 2006~2010 2011~2015 2016~2020(Actual) (Actual) (Actual) (Actual) (Forecast)
Global real GDP growth rate 3.8 3.9 4.0 3.5 3.6Total of forecast area 3.7 3.7 3.8 3.5 3.6
Japan, US, Eurozone 3.2 2.0 0.7 1.3 1.7US 4.3 2.5 0.8 2.0 2.1Eurozone 2.8 1.5 0.8 0.6 1.4Japan 0.9 1.2 0.4 0.6 1.0
Asia 5.8 7.2 8.5 6.5 6.0China 8.6 9.8 11.3 7.8 6.5 NIEs 5.1 4.3 4.3 2.9 2.0 ASEAN5 2.3 5.1 5.3 5.1 4.4 Indonesia 0.2 5.1 6.2 5.5 4.7India 6.0 6.8 8.3 6.5 7.6
Australia 4.1 3.4 2.7 2.7 2.5Brazil 2.2 2.9 4.5 1.0 0.4Russia 1.8 6.1 3.7 1.2 0.3
Japan (FY average) 0.8 1.2 0.3 0.6 1.0
Calendar year average
Sources: Made by MHRI based upon International Monetary Fund (IMF) and statistics of relevant countries and regions. Note: The total of the forecast area is calculated upon the 2013 GDP share (PPP) by the IMF.
Takeaway Message
20
The Chinese economy is slowing down and is facing with the structural change of its economic system.
While soft landing is our main scenario, we should, however, be aware of; The slowdown could last for years to come. The market should be very sensitive to the development in China and
the scenario for the hard landing. In the event of rapid deceleration and the rising risk of hard landing in
China, the global economy and financial markets would be greatly damaged due to Trade channel Commodity channel Financial channel

21
© Mizuho Research Institute Ltd. This publication is compiled solely for the purpose of providing readers with information and is in no way meant to solicit transactions. Although this publication is compiled on the basis of sources which we believe to be reliable and correct, Mizuho Research Institute does not warrant its accuracy and certainty. Readers are requested to exercise their own judgment in the use of this publication.