outlook for economic activity and pricesoutlook for economic activity and prices april 2012 (english...
TRANSCRIPT

April 28, 2012 Bank of Japan
Outlook for Economic Activity and Prices
April 2012
(English translation prepared by the Bank's staff based on the Japanese original)
Not to be released until 2:00 p.m. Japan Standard Time on Saturday, April 28, 2012.

Please contact the Bank of Japan at the address below in advance to request permission
when reproducing or copying the content of this document for commercial purposes.
Secretariat of the Policy Board, Bank of Japan
P.O. Box 30, Nihonbashi, Tokyo 103-8660, Japan
Please credit the source when quoting, reproducing, or copying the content of this
document.
1
The Bank's View1
I. Introduction
This April 2012 issue of the Outlook for Economic Activity and Prices (Outlook Report)
presents the outlook for Japan's economy through fiscal 2013. The Outlook Report first
provides a description of developments in global financial markets and overseas economies
that are affecting trends in Japan's economy, followed by the Bank of Japan's assessment of
the nation's financial conditions. Next, taking these into account, the scenario for
economic activity and prices considered to be the most likely by the Bank -- its baseline
scenario -- is described, and upside and downside risks associated with the scenario are
examined. Lastly, a summary of the Bank's basic thinking on the conduct of monetary
policy is provided.
II. Global Financial Markets and Overseas Economies
Strains in global financial markets had intensified since last summer toward the end of 2011,
mainly due to concern about the European debt problem. Governments and central banks
around the globe have implemented various measures in response. The European Central
Bank (ECB) conducted large-scale longer-term refinancing operations (LTROs) with a
maturity of 36 months. With regard to Greece, which faced the most serious debt problem,
restructuring of debts held by private creditors was implemented, and this allowed the
European Union (EU) and the International Monetary Fund (IMF) to decide on the second
financial support program. Progress was also made in efforts to enhance fiscal discipline
as well as the financial capacity to respond to crises through provision of funds.
Specifically, EU member states signed the Fiscal Compact and agreed to boost the lending
capacity of the European Financial Stability Facility (EFSF) and the European Stability
Mechanism (ESM). Meanwhile, at the end of November 2011, six central banks including
the Bank of Japan announced coordinated actions to address pressures in global money
markets, such as a reduction of interest rates on the fixed-rate U.S. dollar funds-supplying
operations. With the implementation of these measures, funding conditions for European
and U.S. financial institutions have been improving and global financial markets have
1 The text of "The Bank's View" was decided by the Policy Board at the Monetary Policy Meeting
held on April 27, 2012.

2
generally regained stability, as evident in developments such as declines in short-term
interest rates in the euro and U.S. dollar interbank markets. Government bond yields in
countries facing serious fiscal situations have declined compared with the period from
autumn 2011 toward the beginning of 2012, although upward pressure persists.
In such a circumstance, a tail risk -- namely, the likelihood of global financial market
turmoil causing a significant global economic downturn -- has been decreasing after causing
serious concern around the end of last year. Somewhat positive developments have been
observed in the global economy, including the continued moderate improvement in the U.S.
economy. Reflecting these developments, risk aversion among global investors has
weakened compared with the second half of 2011, and positive market developments have
been observed, including a pick-up in stock prices around the globe and in international
commodity prices as well as a narrowing of credit spreads on corporate bonds in the U.S.
and European markets. In the foreign exchange market, reflecting a reversal of extreme
"flight to safe assets," the yen has depreciated somewhat against both the U.S. dollar and the
euro compared with around the end of 2011.
Next, the pace of growth in overseas economies has moderated since spring 2011, mainly
due to increased strains in global financial markets reflecting the effects of the European
debt problem and to the effects of the earlier monetary tightening in emerging and
commodity-exporting economies. More recently, although overseas economies have
remained in a deceleration phase, some improvement has been observed. By region, the
U.S. economy has continued to recover at a moderate pace. Specifically, in the corporate
sector, business fixed investment has been increasing moderately against the background of
solid corporate profits. In the household sector, private consumption has recently been
firm, mainly due to a moderate improvement in employment, despite the continued burdens
of balance-sheet repair. The sluggishness in the European economy remains strong mainly
due to the effects of fiscal austerity measures. More recently, however, the economy
generally stopped deteriorating further as financial markets have regained some stability.
Emerging and commodity-exporting economies have maintained relatively high growth on
the whole, and the pace of growth has stopped decelerating of late, as exports to advanced
economies are no longer decreasing and domestic demand has been firm in a situation

3
where inflation rates have generally been on a declining trend.
In the Bank's baseline scenario, the pace of recovery in overseas economies is likely to
gradually pick up led by emerging and commodity-exporting economies, on the assumption
that global financial markets will generally remain stable. Therefore, the average annual
growth rates of overseas economies during the projection period are forecast to be relatively
high compared with past long-term averages.2 When looking at a breakdown by country
and region, the U.S. economy is likely to continue recovering at a moderate pace against the
background of accommodative financial conditions, although the burdens of balance-sheet
repair will remain. The European economy is likely to head toward a moderate recovery
based on the assumption that the tail risk stemming from the debt problem will not
materialize, but such momentum will likely be restrained by the continuation of fiscal
austerity. Meanwhile, emerging and commodity-exporting economies are likely to
maintain relatively high growth as the virtuous circle of production, income, and spending
is expected to gradually strengthen, mainly against the background of a recovery in
advanced economies and a receding of inflationary pressure, which in turn provides room
for monetary easing.
III. Japan's Financial Conditions
Japan's financial conditions have continued to ease as the Bank has pursued powerful
monetary easing. Specifically, market interest rates, including longer-term ones, have
remained at extremely low levels, and firms' funding costs have declined moderately.
Issuing conditions for CP have remained favorable. In the corporate bond market, issuing
conditions continue to be generally favorable except for electric power companies, which
face considerable uncertainty concerning their business environment. Firms continue to
view financial institutions' lending attitudes as being on an improving trend, and have
2 In January 2012, the IMF revised downward its September 2011 projections for global economic
growth (calculated as the aggregate of purchasing power parity-weighted GDP growth projections
for individual countries or regions), particularly those for European economies. Following this
downward revision, the projections were revised upward in April 2012, albeit slightly. The global
economy is projected to grow by 3.5 percent in 2012, and is expected to accelerate once again by 4.1
percent in 2013. For reference, the average growth rate during the 30 years since 1980 is 3.3
percent.

4
retained their recovered financial positions on the whole. Despite some differences
depending on the size of firms, the respective indicators representing financial institutions'
lending attitudes as perceived by firms and the financial positions of firms have been at
levels exceeding the average for the period since 2000. As for credit demand, firms have
shown signs of increasing their demand mainly for working capital and funds related to
mergers and acquisitions. Looking at funding in the corporate sector, the year-on-year rate
of change in the amount outstanding of bank lending, after turning positive at the end of
2011, has recently risen further. The year-on-year rate of change in the amount
outstanding of CP and corporate bonds combined has generally been slightly positive.
As such, Japan's financial conditions have maintained stability and have not been
significantly affected even during phases of heavy strains in global financial markets caused
by the European debt problem. Such stability in financial conditions can be attributed to
the reasonable amount of tolerance that Japan's financial system possesses for negative
shocks, including an economic downturn, a stock price plunge, and a rise in long-term
interest rates, as well as to the Bank's powerful monetary easing. In terms of the outlook,
these accommodative financial conditions are expected to support a transition toward a
self-sustaining recovery in domestic private demand. Taking into account the increasing
global linkages of financial markets, however, it is necessary to maintain vigilance with
regard to the possibility that global financial markets will affect Japan's financial system
and its financial conditions, depending on developments.3
IV. Baseline Scenario of the Outlook for Economic Activity and Prices in Japan
A. Outlook for Economic Activity
On the basis of the aforementioned developments in overseas economies and the financial
environment at home and abroad, the following examines the scenario for Japan's economy
that the Bank considers to be the most likely -- that is, the baseline scenario.
Japan's economic activity, after a further plunge caused by the Great East Japan Earthquake
3 For more details on the assessment of the financial system stability in Japan, see the April 2012
issue of the Bank's Financial System Report.

5
while in the process of recovering from the Lehman shock, picked up steadily until the
beginning of autumn 2011 with the restoration of supply chains. Thereafter, in the second
half of fiscal 2011, economic activity remained more or less flat mainly due to an adverse
effect of the slowdown in overseas economies and the appreciation of the yen on exports
and production. The growth rate for fiscal 2011 is expected to have been slightly negative,
reflecting the post-quake economic downturn, as projected in the interim assessment in
January 2012.
More recently, although Japan's economic activity has remained more or less flat, it has
become increasingly evident that the economy is shifting toward a pick-up phase as positive
developments have become widespread. Taking into account the recent developments, the
outlook for Japan's economy can be described as follows. The economy is expected to
return to a moderate recovery path in the first half of fiscal 2012 as the pace of recovery in
overseas economies picks up, led by emerging and commodity-exporting economies, and as
reconstruction-related demand after the earthquake disaster gradually strengthens.
Specifically, exports are expected to resume an increasing trend, and a rise in
reconstruction-related demand -- in terms of both public and private demand -- is expected
to contribute to economic growth throughout the fiscal year. Under these circumstances,
in fiscal 2012, the economy is likely to register a relatively high rate of growth, supported
by gradually increasing momentum generated from the transmission mechanism in which
the strength in production feeds through into income and spending. In fiscal 2013, the
economy is expected to grow at a pace that is clearly above its potential as overseas
economies continue to see relatively high growth, although the growth rate is expected to be
somewhat lower than that in fiscal 2012 because the positive effects from
reconstruction-related demand will gradually diminish.4 Growth rates for the 2012 and
2013 fiscal years are expected to be somewhat higher than the projection in the January
2012 interim assessment, especially for fiscal 2012, mainly due to slightly improved market
conditions on the reduced risk of the European debt problem causing financial market
4 Japan's potential growth rate during the projection period is estimated to be "around 0.5 percent"
based on a standard production function approach. However, estimates of the potential growth rate
are subject to a considerable margin of error as they greatly depend on the specific methodology
employed and could change as more data for the relevant period become available.

6
turmoil.5 More detailed explanations of the outlook, broken down by the corporate and
household sectors, are as follows.
Regarding the corporate sector, exports have remained more or less flat but positive
developments have gradually come to be observed, as evidenced by the fact that they have
already recovered from the plunge caused by the effects of the flooding in Thailand and
global inventory adjustments in IT-related goods have almost reached completion.
Regarding the outlook, exports are expected to resume an increasing trend as overseas
economies are likely to emerge from the current deceleration phase and as downward
pressure from the yen's appreciation gradually wanes. As for reconstruction-related
demand, a part of this has already materialized, including for the restoration of
disaster-stricken facilities, pent-up consumption demand following a temporary restraint
after the disaster, and for the removal of debris as well as construction of temporary housing.
With public investment recently beginning to increase, reconstruction-related demand is
expected to gain further momentum.6 Against the background of such developments in
demand at home and abroad, production and corporate profits are expected to increase, and
business fixed investment is likely to continue rising at a moderate pace on the assumption
that firms will maintain their medium- to long-term growth expectations.7
As for the employment and income environment surrounding the household sector, there
has been improvement, as seen in the moderate rise in the ratio of job offers to applicants.
5 A potential increase in the consumption tax rate and its effects are not incorporated in the
projections in this edition of the Outlook Report. The past experiences of Japan and other countries
reveal a temporary rush in demand in the period preceding an increase in the consumption tax rate,
which subsequently was reversed. 6 Looking at the reconstruction-related budget, most of what was presented in the Basic Guidelines
for Reconstruction in response to the Great East Japan Earthquake -- namely, a total of at least 19
trillion yen or so over a period of five years -- has already been allocated through expenses related to
the earthquake disaster in the supplementary budget for fiscal 2011 and in the initial budget for fiscal
2012. This large budget amounts to about 4 percent of Japan's overall GDP and over 60 percent of
the total GDP of the four disaster-stricken prefectures (Iwate, Miyagi, Fukushima, and Ibaraki). 7 According to the "Annual Survey of Corporate Behavior" released by the Cabinet Office (survey
conducted in January 2012), firms expect the average economic growth rate over the next three to
five years to be around 1.5 percent, having risen somewhat compared with survey results obtained in
2011 before the earthquake.

7
Regarding the outlook, positive effects of a pick-up in economic activity, especially
production, are likely to gradually spill over to the employment and income environment on
the whole, although differences among regions -- including disaster-stricken areas -- and
industries will likely remain. However, considering the possibility that the weakness in
corporate performance for fiscal 2011 -- mainly due to the earthquake disaster, the
slowdown in overseas economies, and the yen's appreciation -- will have lagged effects,
improvement in the employment and income environment is expected to become evident
only in the second half of fiscal 2012 onward. Private consumption has recently firmed up
amid improvement in economic activity and the labor supply and demand situation from the
plunge caused by the earthquake disaster, as well as in consumer sentiment. In addition to
temporary factors such as the effects of demand-boosting measures for automobiles, this is
attributed to gradual progress in capturing potential demand related to the aging population.
With regard to the outlook, private consumption is expected to gradually increase at a faster
pace against a backdrop of recovery in the employment and income environment. In the
meantime, backed by low interest rates and a rise in reconstruction-related demand, housing
investment will likely continue to increase moderately throughout the projection period.
B. Outlook for Prices
The Bank conducts monetary policy based on the principle that it should achieve price
stability, thereby contributing to the sound development of the national economy. In doing
so, the Bank publishes, in a numerical form, "the price stability goal in the medium to long
term," which is the inflation rate that it judges to be consistent with price stability
sustainable over the medium to long term. The Bank judges "the price stability goal in the
medium to long term" to be in a positive range of 2 percent or lower in terms of the
year-on-year rate of change in the consumer price index (CPI); more specifically, it has set a
goal of 1 percent for the time being. With this "price stability goal in the medium to long
term" in mind, the following examines the outlook for price developments.
Looking back at the developments in the CPI (for all items less fresh food, and hereafter)
from a somewhat long-term perspective, the year-on-year rate of decline -- after reaching a
historical trough of 2.4 percent in August 2009 -- has continued to slow consistently since
around the end of 2009 with a gradual improvement in the degree of utilization of labor and

8
production capacity -- that is, the aggregate supply and demand balance of goods and
services -- and has recently been at around 0 percent.
Regarding the outlook for the environment surrounding prices, as mentioned earlier the
aggregate supply and demand balance is expected to continue improving with the
economy's moderate recovery trend. Medium- to long-term inflation expectations can be
assumed to remain stable throughout the projection period, given that the perceptions of
market participants and economists have been stable, at around 1.0 percent, and that
households have not changed their views notably. There has been a slight rise in
international commodity prices, especially crude oil prices, mainly due to a heightening of
geopolitical risk. Commodity prices are likely to follow a moderate rising trend against
the background of an increase in demand for food and energy arising from growth in
emerging economies.
As for the outlook for prices on the basis of the aforementioned environment, the domestic
corporate goods price index (CGPI) is expected to continue rising moderately on a
year-on-year basis throughout the projection period, reflecting a moderate increase in
international commodity prices and the improvement in the aggregate supply and demand
balance. On the assumption that medium- to long-term inflation expectations remain
stable, the year-on-year rate of change in the CPI is expected to gradually rise to a range of
above 0.5 percent and less than 1 percent toward the latter half of the projection period as
the aggregate supply and demand balance improves. Thereafter, it will likely be not too
long before the rate reaches the Bank's "price stability goal in the medium to long term" of 1
percent for the time being.
Comparing the current projection for the CPI with that in the January 2012 interim
assessment, the year-on-year rate of change in the CPI is likely to be somewhat higher.
This is partly because the economic projection has been revised somewhat upward, and this
is expected to improve the aggregate supply and demand balance. The correction of the
appreciation of the yen and a rise in crude oil prices also contributed to the upward revision
in the CPI projection.

9
As mentioned earlier, price developments have been on an improving trend approaching the
"price stability goal in the medium to long term," but some more time will be needed before
the goal is achieved.8 In this regard, in terms of a mechanism in which strength in
economic activity generates inflationary pressure, both cyclical and structural factors appear
to play a role. In terms of a cyclical factor, there is still room for the aggregate supply and
demand balance to improve given the significant economic downturn resulting from the
recession following the bankruptcy of Lehman Brothers. Consequently, it is projected that,
even with a moderate economic recovery going forward, the balance between the aggregate
supply and demand will be largely restored only around the end of the current projection
period, giving rise to clearer upward pressure on prices. In terms of a structural factor, it
could be pointed out that the economic growth rate has been on a declining trend. While
the aging of the population proceeds at a pace unprecedented in other countries, there has
not been sufficient progress in efforts to strengthen the growth potential of the economy and
the review of the social security system to enhance its sustainability. As a result, firms and
households lowered their growth expectations, turning cautious in terms of their spending
behavior. Such a situation is believed to have exerted downward pressure on prices.
V. Upside and Downside Risks
A. Risks to Economic Activity
The aforementioned outlook is the scenario the Bank considers to be the most likely -- in
other words, its baseline scenario. The following upside and downside risks concerning
the outlook for economic activity warrant attention.
The first risk concerns developments in overseas economies, including those in global
financial markets and the impact of international commodity prices on economic activity.
Although a tail risk of global financial market turmoil causing a significant global economic
downturn has decreased, various challenges remain before the European debt problem, the
fundamental cause of such risk, can be resolved. There is a possibility that credibility will
be strengthened in markets, acting as an upside risk to the global economy, if steady
8 Looking at the annual rate of change in the CPI on a fiscal-year basis since the 1990s, the
improvement of almost 1 percentage point within a year occurred only in periods when the
consumption tax rate was raised or international commodity prices rose significantly.

10
progress is made -- while market stability is secured, mainly through provision of funds by
the ECB -- in reforms such as an increase in competitiveness among peripheral countries
and ensuring of fiscal sustainability. There is also a possibility that strains in global
financial markets will intensify once again in the face of a reemergence of concern about
the implementation of such reforms, acting as a downside risk to the global economy, and
consequently Japan's economy.
In addition to the shocks arising from global financial markets described above, overseas
economies continue to be surrounded by various other uncertainties. While the European
economy may post higher growth, mainly supported by the strong global competitiveness of
core euro area countries, there is also a downside risk due to fiscal austerity and a
deterioration of financial conditions in peripheral countries. With regard to the U.S.
economy, there is considerable uncertainty regarding the progress in balance-sheet repair.
Pressure from such repair appears to have gradually receded given that five to six years
have already passed since housing prices peaked. Momentum for economic recovery may
therefore strengthen if the bottoming out of the housing market becomes evident together
with improvement in employment conditions. On the other hand, there is a possibility that
the pace of economic recovery will remain more moderate than expected due to further
prolonged adjustments. There is also a high degree of uncertainty surrounding the future
course of fiscal policy in the United States. Regarding emerging and
commodity-exporting economies, there remains considerable uncertainty about whether
these can make a soft landing by realizing price stability and economic growth at the same
time. Taking into account the robust potential demand and significant room for supporting
the economy through fiscal and monetary stimulus, these economies may grow at a faster
pace if inflationary pressures recede swiftly. At the same time, the pace of growth may
slow if inflationary pressures are not sufficiently contained, mainly due to a persistent rise
in wages and high crude oil prices.
Meanwhile, with regard to international commodity prices, if prices such as those of crude
oil rise further, mainly due to heightening geopolitical risk, downside risks to the global
economy will increase; for Japan, which is a resource-importing country, deterioration in
the terms of trade will weigh on corporate profits and households' real purchasing power.

11
In contrast, if the rise in international commodity prices reflects an expansion of the global
economy, positive aspects such as an increase in exports might exceed a negative impact of
deterioration in the terms of trade.
Second, there is uncertainty with regard to reconstruction-related demand. Recently, such
demand, including public investment aimed at restoration of capital stock, has gradually
been strengthening, as progress has been made in drawing up reconstruction plans and the
supplementary budget is being executed. As for the outlook, while reconstruction-related
demand is expected to become increasingly evident, these developments could be affected
by various bottlenecks on the supply side, such as a shortage in construction workers. The
extent to which the reconstruction-related demand will push the growth rate upward is
subject to uncertainty at this point. The crucial question is whether it will simply end up
as a temporary increase or lead to a continuous rise in private demand by lessening
uncertainty about the future via a clearer path toward resuscitation of regional economies.
Third, there is uncertainty with regard to firms' and households' medium- to long-term
growth expectations. Although no significant changes are assumed in the baseline
scenario, changes in either direction are possible depending on future developments. For
example, expansion in production and business operations overseas is expected to continue,
considering that the capturing of global demand and relocation of global business
operations to enhance efficiency are critical challenges facing firms. If such an expansion
is not compensated for by new domestic production activities, however, firms' and
households' medium- to long-term growth expectations regarding domestic demand and
employment might decline. Similarly, with regard to problems concerning the supply and
demand of electric power, there is a possibility that production will be restrained during
periods of high electric power demand, such as in the summer, depending on various factors
including the weather. Attention should be paid not only to such short-term effects but
also to the chances of an eventual decline in medium- to long-term growth expectations.
On the other hand, medium- to long-term growth expectations might improve if efforts in
various areas aimed at strengthening the growth potential of Japan's economy -- such as
exploring global demand, capturing the needs of the elderly population as well as
diversified domestic demand, reviewing the operational risk management structure, and

12
making innovations in energy-related technologies and business models -- proceed in a
steady manner and positive effects start to appear.
Fourth, there are various problems regarding Japan's fiscal sustainability. For example,
taking into account that the household saving rate has stopped declining in recent years,
regardless of the advance in the aging of the population, there is a possibility that the
accumulation of government debt will generate public anxiety about the sustainability of the
social security system as well as a future increase in the tax burden, thereby causing
people's spending behavior to become cautious. In the event that the general public's
confidence in fiscal sustainability declines, people's increasing anxiety about the future
could lead the economy to deviate downward from the baseline scenario. On the other
hand, if the medium- to long-term path toward fiscal consolidation becomes evident and the
sustainability of the social security system improves, such anxiety will be alleviated and this
would have a positive effect on the economy. Given the progress in the globalization of
financial markets, market participants seem to be taking a more critical view of Japan's
conduct of fiscal policy amid rising concern about public debt in many advanced countries.
In this situation, should market participants come to believe that efforts to achieve fiscal
consolidation are insufficient, this will lead to a rise in long-term interest rates, which will
have adverse effects on financial institutions and consequently on Japan's economy as a
whole.
B. Risks to Prices
There is also uncertainty regarding the outlook for prices, which could deviate either
upward or downward from the projection. To begin with, if any of the aforementioned
upside and downside risks to economic activity materialize, prices might be affected
accordingly. There are also the following risks specific to prices. The first concerns
developments in firms' and households' medium- to long-term inflation expectations.
While the Bank judges that some more time will be needed before the year-on-year rate of
increase in the CPI reaches 1 percent, in such an environment downward pressure may be
exerted on actual prices and wages if firms and households increasingly expect that the pace
of a rise in prices will remain slow. On the other hand, if efforts to strengthen growth
potential succeed in bringing about differentiated new goods and services, potential demand

13
will materialize, leading to a rise in prices and possibly resulting in higher medium- to
long-term inflation expectations. In such a scenario, the growth rate will increase and
prices might deviate upward by even more than would be expected from the higher growth
rate.
The second risk concerns developments in import prices. There is a possibility that crude
oil prices will show large fluctuations, mainly reflecting geopolitical risk. Uncertainty also
surrounds developments in other primary commodities, with potential for movement in
either direction. Fluctuations in foreign exchange rates could also affect consumer prices,
both directly through changes in import prices and indirectly through changes in economic
activity.
VI. Conduct of Monetary Policy
The Bank assesses the aforementioned economic and price situation from two perspectives
and then outlines its thinking on the future conduct of monetary policy with the "price
stability goal in the medium to long term" in mind.
The first perspective from which the Bank assesses the situation is an examination of the
baseline scenario for the outlook for economic activity and prices -- that is, the scenario
considered to be the most likely -- through fiscal 2013. As noted earlier, Japan's economy
is expected to return to a moderate recovery path in the first half of fiscal 2012 as the pace
of recovery in overseas economies picks up, led by emerging and commodity-exporting
economies, and as reconstruction-related demand after the earthquake disaster gradually
strengthens. On the assumption that medium- to long-term inflation expectations remain
stable, the year-on-year rate of change in the CPI is expected to gradually rise to a range of
above 0.5 percent and less than 1 percent toward the latter half of the projection period as
the aggregate supply and demand balance improves. Thereafter, it will likely be not too
long before the rate reaches the Bank's "price stability goal in the medium to long term" of 1
percent for the time being. In comprehensively assessing the outlook for economic
activity and prices described above, the Bank expects that Japan's economy will return to a
sustainable growth path with price stability in the longer run.

14
The assessment from the second perspective involves an examination of the risks
considered most relevant to the conduct of monetary policy, including risks that have a
longer time horizon than in the first perspective.9 In the area of economic activity,
although tail risks arising from the European debt problem have waned, a high degree of
uncertainty remains concerning global financial markets and overseas economies. There is
also a possibility that a further hike in international commodity prices will exert an adverse
impact on domestic private demand, mainly through a decline in real purchasing power
associated with deterioration in terms of trade. Furthermore, uncertainty is inherent in the
reconstruction-related demand in terms of its pace of strengthening and the economic
effects. Meanwhile, medium- to long-term growth expectations could either rise or fall
depending on efforts to strengthen growth potential. Efforts to ensure fiscal sustainability
could also significantly affect economic developments. On the price front, careful
attention should be paid to future developments in international commodity prices and in
medium- to long-term inflation expectations.
As for the future conduct of monetary policy, based on the examinations from the two
perspectives described above, the Bank is committed to conducting appropriate policy
aimed at overcoming deflation by pursuing powerful monetary easing and supporting
efforts to strengthen the economy's growth potential.
First, the Bank aims to achieve its "price stability goal in the medium to long term" of 1
percent for the time being in terms of the year-on-year rate of increase in the CPI through
the pursuit of powerful monetary easing, conducting its virtually zero interest rate policy
and implementing the Asset Purchase Program mainly through the purchase of financial
assets. The Bank will continue with this powerful easing until it judges the 1 percent goal
to be in sight, on condition that it identifies no significant risk to the sustainability of
economic growth, including from the accumulation of financial imbalances. In this regard,
it is unlikely that a financial imbalance has been emerging as a result of excessive optimism
at this point.10 At the same time, financial institutions hold a large amount of government
9 For example, the Bank examines risk factors that will significantly impact economic activity and
prices when they materialize, although the probability of such risks arising is low. 10 For more details, see the April 2012 issue of the Bank's Financial System Report

15
bonds in a situation where the outstanding amount of government debt has accumulated to a
substantially high level. Due attention needs to be paid to a possibility that some events
will trigger a rise in long-term interest rates, which would cause significant damage to the
economy and the financial system. From this viewpoint, it is important to maintain
credibility in the conduct of monetary policy.
Second, while pursuing powerful monetary easing, the Bank will also engage in efforts to
strengthen the foundations for Japan's economic growth as a central bank. Japan's
economy currently confronts the long-term structural challenge of declining trend growth
rates amid the situation of a rapidly aging population. In order to overcome this challenge
and establish a new basis for economic growth, business firms need to become more
innovative in an effort to add value to their activities and explore new sources of demand
both at home and abroad. With the aim of supporting such positive movements by firms,
the government should seek to create a more conducive environment and private financial
institutions should make efforts to strengthen the foundation for economic growth. In
addition, given that Japan's ratio of government debt to GDP is the largest among advanced
economies, it is crucial to ensure fiscal sustainability over the medium to long term. As
described above, it is important for business firms, financial institutions, the government,
and the Bank each to continue exerting efforts within their respective roles.

16
(Appendix 1)
Forecasts of the Majority of Policy Board Members
y/y % chg.
Real GDP Domestic CGPI CPI (all items less fresh food)
Fiscal 2011 -0.2 to -0.2 [-0.2]
+1.7 0.0
Forecasts made in January 2012
-0.4 to -0.3 [-0.4]
+1.8 to +1.9 [+1.8]
-0.1 to 0.0 [-0.1]
Fiscal 2012 +2.1 to +2.4 [+2.3]
+0.4 to +0.7 [+0.6]
+0.1 to +0.4 [+0.3]
Forecasts made in January 2012
+1.8 to +2.1 [+2.0]
-0.1 to +0.2 [+0.1]
0.0 to +0.2 [+0.1]
Fiscal 2013 +1.6 to +1.8 [+1.7]
+0.7 to +0.9 [+0.8]
+0.5 to +0.7 [+0.7]
Forecasts made in January 2012
+1.4 to +1.7 [+1.6]
+0.6 to +1.0 [+0.8]
+0.4 to +0.5 [+0.5]
Notes: 1. Figures in brackets indicate the median of the Policy Board members' forecasts (point estimates).
2. The forecasts of the majority of the Policy Board members are constructed as follows: each Policy Board member's forecast takes the form of a point estimate, namely, the figure to which he or she attaches the highest probability of realization. These forecasts are then shown as a range, with the highest figure and the lowest figure excluded. The range does not indicate the forecast errors.
3. Individual Policy Board members make their forecasts with reference to the view of market participants regarding the future course of the policy interest rate -- a view that is incorporated in market interest rates.
4. The real GDP figures for fiscal 2011 are Policy Board members' estimates. The figures for the domestic CGPI and the CPI (all items less fresh food) are actual values.
5. The CPI using the Chain-Weighted Index Formula has also been released as a reference. Based on this chain-weighted index, the year-on-year rate of change in the CPI around fiscal 2013 may be slightly lower than the above forecasts based on the Fix-Weighted Index Formula.
6. The ranges shown below include the forecasts of all Policy Board members.
y/y % chg.
Real GDP Domestic CGPI CPI (all items less fresh food)
Fiscal 2011 -0.2 to -0.1 +1.7 0.0
Forecasts made in January 2012 -0.5 to -0.3 +1.7 to +1.9 -0.1 to 0.0
Fiscal 2012 +2.1 to +2.4 +0.3 to +0.8 +0.1 to +0.4
Forecasts made in January 2012 +1.8 to +2.2 -0.2 to +0.2 -0.2 to +0.3
Fiscal 2013 +1.5 to +1.8 +0.6 to +1.0 +0.4 to +0.8
Forecasts made in January 2012 +1.4 to +1.8 +0.5 to +1.0 +0.2 to +0.6

17
(1) Real GDP (2) CPI (All Items Less Fresh Food)FY2012 FY2012
FY2013 FY2013
Notes: 1. Vertical axes in the charts represent probability (%), while horizontal axes represent the year-on-year percentage
changes in the respective indicators. Bar charts represent the probability distributions in April 2012, and
solid lines represent those in January 2012.
2. Heavy vertical dashed lines indicate the median of the Policy Board members' forecasts (point estimates).
indicates the range of the forecasts of the majority of Policy Board members. indicates
the range of the forecasts of all Policy Board members.
3. Thin vertical dashed lines indicate the median of the Policy Board members' forecasts (point estimates) in January 2012.
4. For the process of compilation of the Risk Balance Charts, see the box on page 9 of the April 2008 Outlook for
Economic Activity and Prices.
0
5
10
15
20
25
30
35
40
45
50
0
5
10
15
20
25
30
35
40
45
50
-6.1
and
bel
ow-6
.0 to
-5.
6-5
.5 to
-5.
1-5
.0 to
-4.
6-4
.5 to
-4.
1-4
.0 to
-3.
6-3
.5 to
-3.
1-3
.0 to
-2.
6-2
.5 to
-2.
1-2
.0 to
-1.
6-1
.5 to
-1.
1-1
.0 to
-0.
6-0
.5 to
-0.
10.
0 to
0.4
0.5
to 0
.91.
0 to
1.4
1.5
to 1
.92.
0 to
2.4
2.5
to 2
.93.
0 to
3.4
3.5
to 3
.94.
0 to
4.4
4.5
to 4
.95.
0 to
5.4
5.5
to 5
.96.
0 to
6.4
6.5
to 6
.97.
0 to
7.4
7.5
to 7
.98.
0 an
d ab
ove
0
5
10
15
20
25
30
0
5
10
15
20
25
30
-2.0
and
bel
ow -1.8
-1.6
-1.4
-1.2
-1.0
-0.8
-0.6
-0.4
-0.2 0.0
0.2
0.4
0.6
0.8
1.0
1.2
1.4
1.6
1.8
2.0
2.2
2.4
2.6
2.8
3.0
and
abov
e
(Appendix 2)
Risk Balance Charts

18
The Background
I. Economic, Price, and Financial Developments in Fiscal 2011
Economic Activity
In fiscal 2011, after a plunge caused by the Great East Japan Earthquake, Japan's economy
picked up rapidly toward the summer, assisted by a restoration of disrupted supply chains
and an improvement in corporate and consumer sentiment (Chart 1 [1]). Although
economic conditions remained more or less flat from autumn onward, with these
movements entering a lull mainly due to the effects of the slowdown in overseas economies
and the yen's appreciation, signs that conditions would pick up became evident again as the
fiscal year-end approached.
Looking in detail at developments in the second half of the fiscal year, overseas economies
grew at a slower pace, affected mainly by the European debt problem and the effects of the
earlier monetary tightening in emerging and commodity-exporting economies (Chart 2).
The yen appreciated toward the year-end in reflection of increasing risk aversion by
investors (Chart 3 [2]). In addition, after a rapid pick-up from the plunge following the
earthquake disaster, exports and production stopped increasing and became more or less flat,
partly due to supply constraints caused by the flooding in Thailand (Charts 4 and 5).
Toward the fiscal year-end, however, they showed signs of a possible pick-up, with
diminished downward pressure from the flooding in Thailand and progress in inventory
adjustments of IT-related goods on a global scale. As for domestic private demand, on the
other hand, business fixed investment, private consumption, and housing investment were
on an improving trend, mainly reflecting pent-up demand that had been restrained
temporarily after the earthquake disaster (Charts 6, 7, and 8). Public investment, which
had stopped declining after the disaster mainly due to the construction of temporary housing
and restoration projects for social infrastructure, started to increase in January-March as the
successive execution of the supplementary budgets progressed. Given that the strength in
domestic demand continued beyond autumn, as described, corporate activity and business
sentiment in the domestic demand-oriented sectors, particularly nonmanufacturing sectors,
remained relatively firm (Charts 1 [2] and 9 [3]).

19
Reflecting these economic developments, utilization of labor and production capacity was
restored during the summer to the level seen prior to the plunge caused by the disaster, and
thereafter remained flat or on a very mild uptrend (Chart 10). Looking at the weighted
average of the Tankan (Short-Term Economic Survey of Enterprises in Japan) diffusion
indices (DIs) of production capacity and employment conditions, where indices are
weighted by capital and labor shares, net "excessive production capacity" and net
"excessive employment" shrank in September following an increase in June and remained
on a very gradual declining trend, mainly in domestic demand-oriented sectors. The
estimated negative balance of the aggregate supply and demand also started to shrink after a
temporal widening following the earthquake.
Prices
On the price front, the year-on-year rate of increase in the domestic corporate goods price
index (CGPI) expanded toward mid-2011, reflecting the rise in international commodity
prices through spring (Chart 11 [1]). From autumn onward, however, the rate narrowed as
international commodity prices fell back toward the end of the year. The year-on-year rate
of change in the corporate services price index (CSPI, excluding international
transportation) continued to be negative mainly in response to firms' cutbacks in expenses.
However, the pace of decline slowed, albeit with fluctuations, mainly reflecting the
relatively long-term recovery trend in corporate activity (Chart 11 [2]). The year-on-year
rate of decline in the consumer price index (CPI) (all items less fresh food, hereafter the
same) continued shrinking from around the end of 2009, and has recently been more or less
at 0 percent (Chart 12 [1]). Similar trends can be confirmed more evidently in the trimmed
mean11 or the Laspeyres chain-weighted index,12 both of which are less likely to be
affected by the base-year change and therefore are more suitable for capturing fundamental
price developments (Chart 12 [2]). A look at the year-on-year changes in items that
11 Figures for the 10 percent trimmed mean are weighted averages of items; these items are obtained
by rearranging year-on-year rates of price change in ascending order and then excluding items in
both the upper and lower 10 percent tails by weight. The 10 percent trimmed mean exhibits good
performance, comparable to that of the price index for all items less fresh food, in measuring
fundamental price developments after adjusting for temporary sources of disturbance and projecting
the future direction of the overall price index. 12 See Box 1 for details on the Laspeyres chain-weighted index.

20
comprise the CPI -- an indicator that subtracts the ratio of the number of items with
declining prices from the number of items of rising prices -- confirms that, although the
former is still larger than the latter, the indicator itself is on a gradual improving trend
(Chart 13 [1]). Unit prices in the Family Income and Expenditure Survey also have been
on an improving trend on average, albeit with large fluctuations (Chart 13 [2]).13 These
developments in consumer prices can be interpreted as effects of the trend rise in
international commodity prices and of the gradual improvement in the aggregate supply and
demand balance feeding through to prices with a time lag, amid stable medium- to
long-term inflation expectations among firms and households. Looking at a breakdown of
the CPI with regard to goods, the year-on-year rate of decline slowed at a very mild pace on
the whole toward the end of the fiscal year, since the positive contribution from petroleum
products diminished somewhat, while prices of food products turned positive, albeit slightly,
and the negative contribution from durable goods narrowed (Chart 14 [2]). As for services,
the rate of change in housing rents continued to be slightly negative and prices for the
eating out category remained more or less unchanged (Chart 14 [3]). The overall
developments in services prices were shaped by the rate of change in prices for "other
services," which started to become negative toward the end of fiscal 2011 after having
increased at a somewhat faster pace toward the middle of the fiscal year, mainly due to price
changes in overseas package tours. On the other hand, the year-on-year rate of increase in
prices of public services gradually rose, mainly reflecting price changes in electricity and
gas charges (Chart 14 [1]).
Financial Markets
In global financial markets, funding conditions for financial institutions have improved, as
concern about liquidity funding by European financial institutions has receded thanks to
ample liquidity provision by the European Central Bank (ECB) through the longer-term
13 In order to measure price changes for goods and services of the same quality, the CPI is compiled
by either fixing items or adjusting prices to reflect quality changes when changing items. In
contrast, such adjustments for quality changes are not made for unit prices in the Family Income and
Expenditure Survey. The recent year-on-year rate of increase in unit prices of the Family Income
and Expenditure Survey may be attributable not only to the fact that price declines have become less
common, but also to moves by households to purchase high-end products of higher quality within
the same category of item.

21
refinancing operations (LTROs) with a maturity of 36 months, as well as to certain progress
in efforts to support Greece. At the same time, as for the European debt problem, it
appears that some time is still needed to tackle such fundamental issues as building a
stronger firewall, strengthening fiscal governance, and regaining competitiveness. Credit
default swap premiums and spreads in long-term government bond yields against German
government bonds for those countries with fiscal concerns have become generally lower
than the levels in the period from last autumn to the start of this year, despite slight
increases of late (Chart 15).
Global investors have become less risk averse since the start of the year, since a tail risk of
the European debt problem causing significant global financial market turmoil has
diminished and U.S. economic conditions have continued to improve moderately. U.S.
and European stock prices have started to recover and implied volatility has also decreased
significantly (Chart 16). In foreign exchange markets, the yen -- which had been bought
through the end of last year as a safe asset -- has been sold while the euro and currencies of
emerging and commodity-exporting economies have been bought back (Chart 17).
In the U.S. and European money markets, credit spreads on interbank transactions have
shown a marked decline, partly due to the aforementioned 36-month refinancing operations
by the ECB and coordinated actions taken by the Bank of Canada, Bank of England, Bank
of Japan, ECB, U.S. Federal Reserve, and Swiss National Bank in November last year to
lower interest rates applied to U.S. dollar funds-supplying operations (Chart 18 [1]). With
regard to corporate finance, credit spreads have narrowed in the U.S. and European
corporate bond markets since the start of the year in light of waning risk aversion by
investors (Chart 18 [2]).
In the meantime, policy rates in the United States have remained at low levels. In Europe,
in view of a negative feedback loop among the fiscal balance, the financial system, and the
real economy taking place toward the end of last year, the ECB lowered its policy rate by 25
basis points in November and then again in December by the same amount. In December,
with the aim of enhancing bank lending and liquidity in the euro funding market, the ECB
decided to implement its 36-month refinancing operation, to reduce the reserve requirement

22
ratio, and to introduce measures to expand eligible collateral (Chart 19 [1]).
While the conduct of monetary policy varies among emerging and commodity-exporting
economies, some central banks changed the policy direction from tightening to easing partly
in response to a modest decline in inflation rates (Chart 19 [2]). Looking at emerging and
commodity-exporting economies as a whole, inflationary pressures persist and there
remained a high degree of uncertainty about the prospect of a soft landing, in which price
stability and economic growth are realized at the same time.
The Bank of Japan has pursued significant monetary easing: at the Monetary Policy
Meeting held in February 2012, the Bank clarified its policy stance by introducing "the
price stability goal in the medium to long term" and announced that it would increase the
total size of the Asset Purchase Program from about 55 trillion, to 65 trillion yen, with an
increase of about 10 trillion yen in the Program earmarked for the purchase of Japanese
government bonds. In these circumstances, looking at financial and capital markets in
Japan, the overnight call rate has remained at an extremely low level in the money market,
and the T-Bill rates -- including those with a 1-year maturity -- have stayed at around 0.1
percent (Chart 20 [1]).
Credit spreads on interbank transactions have remained stable as the balance sheets of
Japanese financial institutions have maintained their soundness (Chart 18 [1]).
Premiums for U.S. dollar funding through the yen/dollar foreign exchange swap market
rose toward the end of last year when market tensions regarding the European debt problem
heightened, but they have declined markedly since the start of the year (Chart 20 [2]).
As for future short-term interest rates, these reflect market participants' view that short-term
money market rates will remain at low levels for the next two to three years (Chart 20 [3]).
The Bank encouraged a decline in longer-term interest rates through its comprehensive
monetary easing framework, and yields on 2-year government bonds have remained stable

23
at low levels of around 0.1 percent.14 Yields on 5-year government bonds have fallen to
around 0.3 percent and those on 10-year government bonds have remained unchanged at
low levels, at around 1 percent (Chart 21).
Stock prices have risen relative to the end of last year, as a recovery in U.S. stock prices has
made foreign investors more aggressive and the exchange rate of the yen against the U.S.
dollar has started to depreciate (Chart 22 [1] and [2]). In the Japanese real estate
investment trust (J-REIT) market, prices rose slightly on investors' waning risk aversion
(Chart 22 [3]).
In foreign exchange markets, the yen has somewhat depreciated against the U.S. dollar and
the euro since the start of the year against the background of global investors' waning risk
aversion (Chart 17).
Financial Conditions
Financial conditions in Japan have continued to ease on the whole.
Firms' funding costs have continued to decline moderately. In the CP market, issuing
conditions have remained favorable with credit spreads having stayed stable at low levels
(Chart 23 [1]). In the corporate bond market, the issuance spread has basically been at a
low level, on a par with that prior to the disaster, although there were monthly fluctuations
caused partly by issuances of investment corporation bonds (REIT bonds) that have a wide
yield spread (Chart 23 [2]). Meanwhile, market conditions for bonds with low credit
ratings have remained stable, although the issuance spread expanded slightly relative to
around the middle of last year, when the market was somewhat overheated. As such,
issuing conditions for corporate bonds have remained favorable on the whole. The
average interest rates on new loans and discounts have continued their moderate downtrend,
mainly reflecting declines in relatively long-term market interest rates (Chart 23 [3]).
14 Under the Asset Purchase Program, the Bank has purchased government bonds with a maturity of
one to two years. This is because, looking at channels of fund-raising in the non-financial sector,
bank lending with a maturity of three years and less has a large share in Japan while corporate bonds
with a relatively long maturity as well as mortgage loans have a large share in the United States.

24
Although stimulative effects from low interest rates are still partly constrained given the
current growth rates and prices, interest payments by firms have remained at sufficiently
low levels in relation to their profitability (Chart 24).
With regard to the availability of funds for firms, financial institutions' lending attitudes as
perceived by large as well as small firms have continued to improve, and the levels of
various indicators have been above the average for the period since 2000 (Chart 25 [1]).
The financial positions of firms, including small ones, have recovered moderately on the
whole, and the levels of various indicators have also been above the average for the period
since 2000 (Chart 25 [2]).
In this situation, Japan's financial conditions have remained accommodative, unlike those in
the United States and Europe, even at times when tensions grew in the global financial and
capital markets due to the European debt problem. Credit spreads on corporate bonds have
remained stable at low levels in Japan even during periods -- primarily during the second
half of last year -- when the U.S. and European markets saw their spreads increase
considerably (Chart 26). Also, the lending attitudes of financial institutions in the United
States and Europe -- chiefly those of European ones -- notably became cautious from
around the end of last year, although those of financial institutions in Japan were hardly
affected by such overseas factors (Chart 27).
Within the aforementioned financial conditions, the demand for working capital by firms
has lacked vigor overall, as they continued to restrain their business fixed investment within
the range of their cash flow. Even in this situation, demand for working capital has risen,
backed by the recovery in production activity since the quake, and that for funds related to
mergers and acquisitions has also shown an increase reflecting firms' strategic efforts to
strengthen their global businesses. Against this backdrop, the year-on-year rate of increase
in the outstanding amount of bank lending has expanded (Chart 28 [1]). The amount
outstanding of CP had registered a positive year-on-year growth rate, but then returned to
the year-ago level due in part to an increase in redemptions toward the end of March (Chart
28 [2]). The year-on-year rate of change in the outstanding amount of corporate bonds has

25
recently been slightly negative, partly because some issuers have shifted to the CP market
(Chart 28 [3]). Meanwhile, the amount of corporate bonds issued has been on a par with
that of the previous year on the whole, with an increased variety of corporate bond issuers
amid the extremely low level of issuance spreads (Chart 29).
The year-on-year change in the monetary base -- which had continued to realize
double-digit growth -- fell back and registered a negative figure in March, albeit only
marginally, from the year-ago level, which was high due to large liquidity provision since
the disaster. In this regard, the level of the monetary base as a ratio to nominal GDP has
remained within a historically high range. The year-on-year change in money stock (M2)
has been in the range of 2.5-3.0 percent (Chart 30).
Land prices have continued to decline both in metropolitan and nonmetropolitan areas, but
the rate of decline has begun to narrow gradually. Looking in detail at the Public Notice of
Land Prices for 2012 (as of January 1), the year-on-year rate of decline has slowed
somewhat for commercial and residential land prices in the three major metropolitan areas
(Tokyo, Osaka, and Nagoya), as well as in nonmetropolitan areas (Chart 31). As for the
23 wards of Tokyo on a semiannual basis, the pace of decline in land prices has slowed
compared with six months ago.
II. The Outlook for Economic Activity and Prices from Fiscal 2012 through Fiscal
2013
The Outlook for Economic Activity and Prices
As for the outlook, Japan's economy is expected to return to a moderate recovery path in the
first half of fiscal 2012, supported by gradually increasing momentum from the
transmission mechanism in which the strength in production feeds through into income and
spending as the pace of recovery in overseas economies picks up, led by emerging and
commodity-exporting economies, and as reconstruction-related demand after the earthquake
disaster gradually strengthens. For fiscal 2012 as a whole, the economy is projected to
register relatively high growth, since exports and private domestic demand will post fairly
strong growth and public investment will make positive contributions due to

26
reconstruction-related demand. The relatively high growth in exports and private domestic
demand is mainly supported by a rebound from fiscal 2011, which was affected by supply
constraints caused by the earthquake disaster and the flooding in Thailand.15 As for fiscal
2013, the economy is expected to continue to clearly outpace the potential growth rate led
by strong demand overseas, especially in emerging and commodity-exporting economies,
although the growth rate is expected to be lower than that in fiscal 2012 since upward
momentum from reconstruction-related demand will diminish gradually.
Expressing the outlook in terms of the annual real GDP growth rate, this is projected to be
in the ranges of 2.0-2.5 percent and 1.5-2.0 percent for fiscal 2012 and fiscal 2013,
respectively. The projected growth rates, particularly the rate for fiscal 2012, are expected
to be somewhat higher than those in the January 2012 interim assessment.
As for the outlook in terms of price indices, the year-on-year rate of increase in the CGPI is
expected to continue increasing moderately. On the assumption that medium- to long-term
inflation expectations remain stable, the year-on-year rate of change in the CPI is expected
to gradually rise to a range of above 0.5 percent and less than 1 percent toward the latter
half of the projection period as the aggregate supply and demand balance improves.
Thereafter, it will likely be not too long before the rate reaches the Bank's "price stability
goal in the medium to long term" of 1 percent for the time being. Compared with the
January 2012 interim assessment, the projection for the CGPI is somewhat higher for fiscal
2012, due to effects of the subsequent increase in international commodity prices and some
reversal of the yen's appreciation, but almost unchanged for fiscal 2013. The projections
for the CPI are somewhat higher as well for fiscal 2012 and 2013, owing to some upward
revisions to the growth outlook and associated improvement in the aggregate supply and
demand balance, as well as effects of some reversal of the yen's appreciation and the
increase in international commodity prices.
15 This economic outlook is based on the assumption that economic activity will not be constrained
by a deterioration in the supply and demand balance of electricity. The productivity per unit of
electricity consumption has risen sharply thanks to efforts to conserve electricity after the disaster
(Chart 32).

27
Given these economic and price developments, the pace of growth in nominal income is
expected to recover at a moderate pace.
The following provides supplementary details on the underlying mechanism of
developments in economic activity and prices.
Government Spending
As for reconstruction expenditures, most of the budget for related projects -- amounting to
at least 19 trillion yen for the first five years designated in the Basic Guidelines for
Reconstruction in response to the Great East Japan Earthquake -- was allocated for each of
the following budgets: the first supplementary budget for fiscal 2011 of approximately 4
trillion yen; the second supplementary budget of approximately 2 trillion yen; the third
supplementary budget of approximately 9.2 trillion yen; and the budget for fiscal 2012 of
approximately 3.8 trillion yen. The value of public works contracted -- a measure that
reflects public orders -- has been on the rise since the middle of fiscal 2011, albeit with
fluctuations, and the amount of public construction completed -- which reflects the progress
of public works -- has also started to increase since the turn of the year (Chart 33 [1]).
With the execution of disaster-related expenditures in full scale, public investment overall is
projected to maintain its high level throughout fiscal 2012.16
Overseas Economies
From spring 2011 onward, the pace of growth in overseas economies has decelerated, due
mainly to increased tensions in the global financial markets caused by the European debt
problem and to the effects of earlier monetary tightening in emerging and
commodity-exporting economies. Recently, however, overseas economies have shown
some improvement, although they still have not emerged from a deceleration phase.
The baseline scenario regarding the outlook for overseas economies is that their growth
rates are expected to rise gradually led by emerging and commodity-exporting economies
16 As a result, the amount outstanding of government debt -- which is already high -- is projected to
rise even further (Chart 33 [3] and [4]).

28
and the average growth rate for the projection period is projected to be somewhat higher
than the past long-term average (Chart 3 [1]). By country and region, the U.S. economy is
expected to continue recovering at a modest pace supported mainly by its accommodative
financial conditions, although pressures from balance-sheet repair will persist. The
recovery in the European economy is likely to be constrained even with the assumption that
any tail risk related to the debt problem will not materialize, since the debt problem will
weigh on the real economy through continued fiscal austerity. Meanwhile, emerging and
commodity-exporting economies are likely to achieve relatively high growth as a
self-sustaining virtuous cycle of production, income, and spending will gradually gain
further momentum, assisted mainly by the improvement in advanced economies and by
decreased inflationary pressures, which in turn provide room for monetary easing.
Exports and Imports
Real exports have remained more or less flat so far, but some positive signs have started to
emerge gradually; for example, the negative impact from the flooding in Thailand has been
overcome and global inventory adjustments for IT-related goods are about to end (Chart 34).
As mentioned above, overseas economies have shown some improvement, and furthermore,
the appreciation of the yen has been reversed somewhat from a while ago. Taking these
factors into account, exports are expected to edge up as the pace of recovery in overseas
economies picks up, led by emerging and commodity-exporting economies and as the
adverse effects of the yen's appreciation gradually diminish.
In recent years, however, the competitiveness of Japanese products has been trending
downward, mainly due to emerging economies catching up. Looking at Japan's
competitiveness in terms of the global share of Japanese manufacturers and the coefficient
of international competitiveness based on the balance between exports and imports, capital
goods have maintained high competitiveness on the whole (Charts 35 and 36). As for
IT-related goods and household electrical appliances, however, the global share of Japanese
manufacturers has trended downward, including the period when the yen depreciated in the
mid-2000s. The coefficient of competitiveness shows that the competitiveness of IT
appliances including TVs has fallen markedly of late, following that of conventional
household appliances. As for iron and steel, the global share of Japanese products has

29
declined while the coefficient of China's international competitiveness has risen.
Regarding automobile-related goods, the coefficient of competitiveness remains high due to
limited imports, but the global share of Japanese automobiles appears to have fallen slightly
since the Lehman shock, partly due to a reversal of the yen's depreciation and to the effects
of supply constraints caused mainly by the earthquake disaster and the flooding in Thailand.
This downtrend in Japan's foreign competitiveness is projected to somewhat reduce the pace
of increase in exports in relation to the pace of recovery in overseas economies.
On the other hand, real imports have been on a rising trend (Chart 4). This is mainly
attributable to (1) increased imports of fuels due to the cessation of operations at nuclear
power plants, (2) a rise in imports of Asian products with improved quality and supply
capacity, chiefly in intermediate goods, triggered by import substitution following the
disaster and the yen's appreciation, and (3) elevated demand for new products (such as
smartphones and tablet PCs) by foreign manufacturers. These factors contributing to the
increase in imports are projected to remain for a while, although import substitution and the
effects of the yen's appreciation will gradually diminish. In these circumstances, real
imports are expected to continue their uptrend throughout the projection period, aided by
the ongoing rise in domestic demand as well as a gradual recovery in exports and
production.
External and Saving-Investment Balances
In terms of the trade balance, a deficit is projected for fiscal 2011-- the first such deficit
since fiscal 1979 (Chart 37). This is largely attributable to (1) a rise in prices of imports in
reflection of high international commodity prices, (2) a decline in real exports due to supply
constraints caused by the earthquake disaster and the flooding in Thailand, and (3) an
increase in real imports due to growing fuel imports as a result of the cessation of
operations at nuclear power plants. As for the outlook, although the downward pressure of
real exports from supply constraints will be resolved, domestic demand is expected to be
relatively strong, supported mainly by restoration demand, and imports of fuels due to the
cessation of operations at nuclear power plants will continue to affect the trade balance.
Consequently, the pace of decline in the trade deficit is projected to remain modest even
though the possibility of further expansion is small.

30
In this situation, Japan's current account surplus is expected to stay more or less unchanged
for the time being and then increase somewhat toward fiscal 2013. The current account
surplus will remain in place since the income balance will continue to register a relatively
large surplus thanks to the accumulation of external assets. As for the outlook, the income
surplus is expected to somewhat shrink for the time being as the yield on external assets
will decline with a time lag following a slowdown in overseas economies (Chart 38).
After that, however, the income surplus is expected to expand at a mild pace, primarily in
direct investment profits, reflecting a pick-up in the pace of recovery in overseas
economies.
Looking at a saving-investment balance that conceptually corresponds to a current account
balance, excess saving will continue on the whole throughout the projection period since the
private sector will display excess saving on a large scale even though the general
government will continue to register a significant deficit (Chart 39).17 Looking at the
saving rate and the investment rate individually, the overall saving rate in Japan is projected
to hover at around 0 percent, since the saving rate of the household sector is to decline
moderately, mainly because of an increase in consumption and the aging of the population,
while the negative saving rate of the government sector is expected to shrink reflecting an
increase in tax revenue associated with economic recovery (Chart 40).18 In contrast, the
investment rate -- which on a net basis excludes depreciation of fixed capital -- is expected
to remain in negative territory as a whole despite the fact that its rate of decline will narrow,
assisted by the recovery in housing investment in the household sector and business fixed
investment in the corporate sector. This implies that the amount of new domestic fixed
investment will become smaller than the depreciation of fixed capital -- in other words,
causing a decline in capital stock. This decline partly reflects a drop in households'
housing stock in line with the population decrease. It also reflects the fact that firms
prioritize the accumulation of capital stock overseas rather than that at home as a means of
strengthening their global businesses, in view of a gap between investment returns at home
and abroad. Looking at the economy as a whole, the saving rate is projected to outpace the
17 See Box 2 for the relationship between the current account and saving-investment balances. 18 Details of past movements in a saving-investment balance by sector are described in Box 3.

31
investment rate for the coming period -- a movement consistent with the projection that the
current account balance will continue to register a surplus.
The Environment Surrounding Corporate Profits and Business Fixed Investment
Corporate profits have been more or less flat as a whole, although they have varied by
industry and size. Profits at manufacturers -- mainly large ones -- have been somewhat
weak while those at nonmanufacturers -- excluding electric power companies -- have
remained relatively strong (Chart 41). On a fiscal-year basis, profits are projected to
resume their gradual uptrend from fiscal 2012 onward, assisted by increases in demand and
production, after having plunged in fiscal 2011, chiefly in large manufacturing firms and
electric power companies, mainly due to the earthquake disaster, the flooding in Thailand,
the slowdown in overseas economies, and the yen's appreciation.
Business fixed investment has been on a moderate increasing trend, aided by the restoration
of disaster-stricken facilities. From a somewhat long-term perspective, business fixed
investment is seemingly in a recovery phase following the period of a plunge after the
Lehman shock and projected to continue on a moderate increase in the coming period,
supported by a recovery in economic activity and corporate profits (Chart 42). Business
fixed investment plans for fiscal 2012 (including software investment and excluding land
purchasing expenses) in the March Tankan also reveal that firms' initial plans were set
higher than those in past years and were on a par with the average of fiscal 2004-2007,
when the economy was in a recovery phase.
Despite constraints from a shift of production overseas, manufacturers' business fixed
investment is expected to remain on an uptrend on the condition that uncertainty regarding
overseas economies decreases and that production and profits pick up, since the level of
investment has been squeezed considerably. As for nonmanufacturers, business fixed
investment is projected to move gradually upward, aided by relatively strong domestic
demand. For the sectors related to communications in particular, an increase in their
investment is expected due to the upsurge in demand for smartphones. Business fixed
investment associated with businesses targeting the elderly is also expected to emerge
eventually. Meanwhile, as for disaster-related investment, restoration of damaged

32
equipment in disaster-stricken areas has shown certain progress. The repair and
reconstruction of private equipment is projected to progress even further, primarily because
of infrastructure construction in significantly damaged areas being in full swing. Areas
other than disaster-stricken ones, mainly in the Tokyo metropolitan areas, are also expected
to see an increase in investment for strengthening earthquake resistance and business
continuity systems, as well as investment for strengthening privately owned electrical
power facilities and that related to electricity conservation.
Judging from various representative indicators, the projected moderate increase in future
business fixed investment is basically consistent with similar movements in the past as well
as medium- to long-term growth potential (Charts 43 and 44). First of all, the ratio of
business fixed investment to GDP is projected to gradually move above the average since
2000, which is also roughly consistent with the ratios seen in past economic recovery
phases. The ratio of business fixed investment to cash flow generally matches the current
level of firms' expected growth rates. Comparing the projected increase in business fixed
investment with the long-term equilibrium level estimated from the potential growth rate,
such investment is expected to rise toward the second half of the projection period to a level
close to that of the long-term equilibrium, after having declined to a considerably low level
following the Lehman shock. Long-term equilibrium may change depending on the
potential growth rate and growth expectations. Business fixed investment might possibly
become higher than projected should medium- to long-term growth potential and,
consequently, growth expectations increase, assisted by progress in regulatory reform and
business reconstruction, whereas a downshift in growth expectations could reduce business
fixed investment.
Foreign Investment Activities of Firms
The foreign investment of firms grew sharply in 2011 despite lackluster profits due to the
disaster. The amount of foreign direct investment reveals that 2011 recorded the second
largest amount following that in 2008 (Chart 45 [1]). Firms also significantly increased
their mergers and acquisitions abroad (Chart 45 [2]). This aggressive foreign investment
stance taken by firms is partly attributable to the yen's appreciation but, more fundamentally,
is driven by efforts to expand their global business networks in order to capture local

33
demand overseas (Chart 45 [3]). So far, the profitability of foreign direct investment has
been higher than that of domestic investment (Chart 45 [4]). If firms will be more actively
engaged in highly profitable foreign investment to capture local demand overseas, their
profitability will increase on a consolidated basis and, in terms of the external balance, the
income surplus will also expand to a profound degree. It should be noted, however, that
high profit-earning opportunities entail risks and foreign investment activity requires
appropriate risk management.
The Employment and Income Situation and Households' Spending Behavior
As for the employment and income situation, supply and demand conditions in the labor
market have shown signs of improvement, mainly due to relatively strong domestic demand,
while compensation of employees has been more or less flat (Charts 46 and 47). In terms
of the outlook, the labor market conditions are expected to continue improving in
accordance with economic recovery, which, together with a pick-up in corporate profits,
will gradually exert positive effects on compensation of employees. For the time being,
however, compensation of employees is likely to remain more or less flat mainly due to (1)
the lagged effects of lackluster business performance in fiscal 2011, mainly in bonuses, and
(2) reductions in public employees' salaries. Taking into account that the labor share has
recently remained high, an improvement in compensation of employees is expected to
become evident only from the second half of fiscal 2012, even though economic activity
will start to recover from the first half of the fiscal year.
The current high labor share is affected by developments in both wages and employment.
Regarding wages, winter bonuses for fiscal 2011 were relatively higher in relation to the
performance of corporate profits. This was because (1) the favorable corporate
performance of fiscal 2010 largely determined winter bonuses, whereas the lackluster
performance of fiscal 2011 was not reflected so much, especially among large
manufacturing firms, and (2) the construction sector, which has enjoyed favorable
reconstruction-related demand, showed relatively strong business performance (Chart 47
[3]). The first factor might be due to the fact that many firms decide their summer and
winter payments combined, which means that the annual amount of bonuses paid was
mostly decided prior to the earthquake. These firms are likely to restrain their bonus

34
payments for fiscal 2012, taking account of their business performance in fiscal 2011 (Chart
47 [4]). On the employment side, labor productivity per worker has diverged considerably
downward from the long-term trend, since employment was basically retained during fiscal
2011 despite sluggish economic activity caused mainly by the earthquake disaster and the
flooding in Thailand (Chart 48 [1] and [2]). From a macroeconomic perspective, this
indicates a continuing situation of excess labor in the economy. As a result, the paces of
recovery in employment and decline in the unemployment rate are expected to remain
modest for the time being despite a recovery in economic activity in the coming period
(Chart 48 [3]). In addition, an increased mismatch in employment, notably in disaster
areas, could slow the paces of recovery in employment and decline in the unemployment
rate even further.19
Private consumption has firmed up recently despite sluggish growth in household income
(Charts 7 and 49). Against this background basically lies a recovery in economic activity
and the labor market conditions following the plunge in the period after the disaster, as well
as an improvement in consumer confidence. In addition, this is affected by multiple
factors such as (1) pent-up demand and increased consumption related to restoring one's
quality of life in disaster areas, (2) changes in consumer attitudes after the disaster (the
so-called kizuna consumption, which promotes ties among people), (3) rising consumption
among the elderly, (4) policy effects including subsidies for purchasing energy efficient cars,
and (5) the merits of the yen's appreciation.20
A closer picture of the rise in consumption by the elderly reveals that their significance on
consumption has grown steadily, as the ratio of the elderly to the total population has edged
up every year and as the elderly in the 65 years and older cohort comprise about 30 percent
of private consumption; by including the 60 years and older cohort, this figure adds up to
somewhat over 40 percent (based on the Family Income and Expenditure Survey) (Chart 50
[1] and [2]). According to the life-cycle hypothesis, consumption by the elderly depends
more on assets than income flows, which makes their consumption more resilient against
19 See Box 4 for the employment situation in disaster areas. 20 For information collected from firms regarding this firmness in consumption, see "Recent
developments in private consumption and its background (available in Japanese only)" (Regional
Economic Report, April 2012).

35
changes in business conditions. In fact, the 60 years and older cohort's propensity to
consume is significantly higher than for younger cohorts (Chart 50 [3]). The rise in the
number of the elderly with a high propensity to consume exerts consistent upward pressure
on the propensity to consume within the macroeconomy (Chart 50 [4]). Furthermore, a
recent feature in this regard is that the elderly's propensity to consume has trended upward
(Chart 50 [3]). As for the increase in the first half of the 2000s, this might have been
affected by receding anxiety among the elderly as a result of the introduction of the Public
Nursing Care Insurance. In contrast, the rise in recent years is mainly due to the fact that
the "baby boom generation" (the so-called "active senior citizens") -- already with a high
propensity to consume -- has reached the elderly cohort, and that firms have made gradual
but successful progress in the areas of businesses targeted at the elderly.21
Regarding the outlook from a macroeconomic aspect, private consumption is expected to
edge up as the employment and income situation heads toward gradual improvement,
assisted by the economic recovery, despite downward pressure from reduced salaries for
public employees. In terms of the factors mentioned above supporting recent firmness in
consumption, it is difficult to evaluate changes in consumer attitudes, and although the
policy effects and the benefits of the yen's appreciation will stay in place for the time being,
they are expected to diminish gradually.22 On the other hand, pent-up demand and
consumption related to restoring one's quality of life in the disaster areas are of a temporal
nature, but they are likely to stay at a certain level given that restoration in disaster areas
will become full-fledged. The gradual progress on the business side to capture demand of
the elderly is expected to have sustaining effects, to a certain degree, on consumption by the
elderly. Assisted by these factors, private consumption is projected to grow somewhat
higher than household income throughout the projection period.
21 See Box 5 for private consumption of the elderly. 22 Following the Lehman shock, the yen has appreciated considerably in a cumulative manner and
this has exerted downward pressure on prices of import goods on a yen basis. At the same time,
however, since international commodity prices and goods prices denominated in local currencies
have risen, yen-denominated prices of import goods have not necessarily declined in line with the
pace of the yen's appreciation. Therefore, although many consumers and retailers observe some
benefits of the yen's appreciation, they have pointed out that these are less evident compared to past
phases of rapid appreciation of the yen.

36
Housing investment has recently been picking up (Chart 8). As for the outlook, housing
investment is expected to move gradually upward since housing demand -- which was held
down temporarily after the disaster -- will be restored and reconstruction of damaged houses
will gradually become evident. The increase will also be supported by the effects of
incentives to purchase homes.
The Environment Surrounding Prices
International commodity prices have risen, particularly in crude oil prices, from their
bottom around the end of last year due to lessened uncertainty regarding the global
economy and to increased geopolitical risks surrounding the situation in Iran (Chart 51).
From a relatively long-term perspective, international commodity prices are projected to
move gradually upward in line with growth in overseas economies. Given these
movements in international commodity prices, domestic energy and food prices are also
expected to continue a moderate uptrend.
As for the expected inflation rate in the medium to long term, a survey conducted among
market participants and economists shows that this has been stable over the past few years,
at around 1 percent (Chart 52).23 Another survey conducted among households indicates
that the rate has been more or less unchanged recently (Chart 52 [1]).
From a somewhat long-term perspective, the aggregate supply and demand balance has
maintained its gradual improving trend after the plunge resulting from the Lehman shock
despite fluctuations caused by various factors such as the earthquake disaster (Chart 53 [1]).
As for the outlook, the balance is projected to see consistent improvement as Japan's
economic growth continues to outpace the potential growth rate.24 23 See Box 6 for various indicators to measure inflation expectations. 24 Japan's potential growth rate had temporarily dropped to around 0 percent, partly due to a decline
in the growth rate of capital stock reflecting the economic plunge after the Lehman shock (Chart 53
[2]). Since then, the rate has been gradually increasing as a result of recoveries in the growth of
capital stock and potential labor input against the background of gradual economic recovery.
Japan's potential growth rate during the projection period is estimated to be "around 0.5 percent"
based on a standard production function approach. However, estimates of the potential growth rate
are subject to a considerable margin of error as they greatly depend on the specific methodology
employed and could change as more data for the relevant period become available.

37
As for the CPI outlook, on the assumption that medium- to long-term inflation expectations
remain stable at around 1 percent, the year-on-year rate of change is expected to gradually
rise to a range of above 0.5 percent and less than 1 percent toward the latter half of the
projection period as the aggregate supply and demand balance improves. Thereafter, it
will likely be not too long before the rate reaches the Bank's "price stability goal in the
medium to long term" of 1 percent for the time being.
In the relatively long run, there is a broad positive correlation between the CPI and the
aggregate supply and demand balance. In fact, the year-on-year rate of decline in the CPI
has been slowing gradually so far against a backdrop of moderate improvement in the
aggregate supply and demand balance (Chart 54 [1]). A similar relationship can be found
for the chain-weighted CPI, which is less affected by the base-year change (Chart 54 [2]).
However, in terms of the duration required for the CPI to rise by 1 percentage point after
turning toward improvement, this was about one year in the second half of the 1980s, when
the level of the aggregate supply and demand balance was high and the pace of increase was
rapid, whereas it took roughly two years in the mid-1990s, when the level was low and the
pace was slow (Chart 55). Based on these past episodes, the expectation is that it will take
some time before the year-on-year rate of change in the CPI -- currently at around 0 percent
-- reaches 1 percent.
In the past, the year-on-year rate of change in the chain-weighted CPI tended to become
lower than that in the fixed-weighted CPI, and the gap became larger as more time passed
from the base year, which is currently 2010. Based on this observation, the year-on-year
rate of change in the chain-weighted CPI in around 2013 may be slightly lower than the
forecast in this Outlook Report, which is based on the fixed-weighted CPI. As illustrated
in Box 1, however, the gap between the chain-weighted CPI and the fixed-weighted CPI is
expected to remain relatively small with the current base year of 2010, since the weights of
some items such as TVs -- which show large price falls -- have been declining since 2011.
38
(Box 1) The Laspeyres Chain-Weighted Index of Consumer Prices
In contrast to the fixed-weighted index, the Laspeyres chain-weighted index (hereafter,
chain-weighted index) of consumer prices is compiled after completing the annual exercises
of (1) updating weights of individual items25 and (2) rebasing index levels of individual
items by setting those in December last year at 100.26 These exercises have the following
merits in judging the trend in price developments.
(Merit of Updating Weights)
One merit of the chain-weighted index is that it reflects the recent structure of consumers'
expenditures because weights are updated every year. Looking at changes in the
expenditure structure, expenditures for durable consumption goods such as TVs increased
significantly in 2010 due to the eco-point system -- that is, subsidies for purchasing energy
efficient products -- but declined sharply in 2011 in the absence of such incentives (Chart 56
[2] and [3]). The fixed-weighted index continues to use the weights in an unusual year
such as 2010 for five years, which results in overvaluation of the impact of prices of
consumer durable goods. In this regard, the effect of a temporary factor such as the
eco-point system will not last in the chain-weighted index because of the annual update of
weights of items in expenditures.
(Merit of Rebasing Index Levels)
When the prices of some products such as TVs and personal computers continue to decline
persistently and significantly, the impact of the declines on the year-on-year change in the
overall price index gradually diminishes because the index levels of the concerned products
decline with the lapse of time. Therefore, the year-on-year rate of change tends to be
larger in the fixed-weight index compared to the chain-weighted index, and such a
25 New weights are calculated based on various statistics including the Family Income and
Expenditure Survey for the previous year. 26 This treatment was introduced for the first time for the Laspeyres chain-weighted index with the
base year of 2010. In the chain-weighted index with the base year of 2005, index levels were
rebased such that the average for the previous calendar year became 100.

39
divergence becomes larger as it grows more distant from the base year (Chart 56 [1]).27 At
the time of a base-year change for the fixed-weight index, the index levels for those
products are instantaneously reset, at 100, from the low levels that reflect cumulative
declines over five years, and this results in a discontinuous increase in the impact of price
declines for those products causing a break in year-on-year changes in the overall index.
On the other hand, in the case of the chain-weighted index, a base-year change does not
cause such a large break in data because index levels are rebased every year.
27 In the next year of the base-year change, developments in the fixed-weight index and the
chain-weighted index are almost identical. To be more precise, however, there are some differences
because the fixed-weight index rebases the average index for a previous calendar year at 100 while
the chain-weighted index rebases the index for December of the previous year at 100.

40
(Box 2) Current Account and Saving-Investment Balances
(Concept of Current Account and Saving-Investment Balances)
Developments in a current account balance of a national economy correspond to those in a
saving-investment balance. National economic activities can be simply described as
follows.
National income = Consumption + Investment + A current account balance ---- (a)
That is, where saving can be obtained by subtracting consumption from national income
and a gap between the saving and investment is a saving-investment balance, which is
identical to a current account balance.
National income – Consumption = Saving ---- (b)
Combining (a) and (b) yields the following equation.
Saving – Investment = A saving-investment balance = A current account balance ---- (c)
Therefore, excess saving in a national economy, where saving exceeds investment,
corresponds to a current account surplus. Looking at developments in current account and
saving-investment balances in Japan, there has been a continuing situation of a current
account surplus and corresponding excess saving (Chart 39). The relationship between the
two variables is not a causal one in which, for example, a current account balance comes
first and a saving-investment balance is determined later. Instead, the two variables are
determined simultaneously as a result of activities of individual economic entities such as
households, firms, and the government.
(Points to Note When Assessing Current Account and Saving-Investment Balances)
Japan's current account and saving-investment balances have been under the spotlight
recently, reflecting a decline in the current account surplus, a shift to overseas production,

41
and rising concern about a possible decline in household saving rates amid an aging
population and low fertility. Based on the conceptual understanding described above, the
following are points to note when assessing current account and saving-investment
balances.
1) A shift of production overseas does not necessarily lead to a decline in a current account
surplus. While it reduces a current account surplus through a decline in the trade
balance associated with declining exports, a shift of production overseas also increases
the surplus through an increase in the income balance, including an increase in
dividends from foreign affiliates. If an expansion of production overseas leads to
success in capturing more global demand, an increase in the income balance could more
than offset a decline in the trade balance. Looking at this from a saving-investment
balance, a shift of production overseas supports national income through an increase in
the income balance while restraining domestic investment, which could result in an
increase in excess saving.
2) A decline in the household saving rate associated with an aging population and low
fertility does not necessarily lead to a decline in the current account surplus. An aging
population and low fertility cause a decline in the household saving rate through a rising
share of the elderly for which consumption depends more on accumulated assets than
income, while causing a decline in the household investment rate because of less
housing investment. The overall impact of these effects on the saving-investment
balance for households is not known a priori. Furthermore, as the population decline
associated with an aging population and low fertility reduces Japan's potential growth
rate, firms may accelerate their shift of production overseas to capture global demand.
In this case, since domestic investment will be reduced, as described above, excess
saving by the national economy could increase.
3) Given that gross external assets and net external assets have accumulated to almost 580
trillion yen and 260 trillion yen, respectively, the income balance from these assets has
surpassed 10 trillion yen in recent years (Chart 38). For the time being, it is possible
to maintain a large surplus in the income balance thanks to the income from the external

42
assets, and consequently the current account surplus will likely continue unless there is
a further significant increase in the trade deficit. If direct investment with high
profitability, especially that in emerging economies, rises as a result of Japanese firms'
expansion of global businesses, a surplus in the income balance could increase further.

43
(Box 3) Developments in Saving-Investment Balances by Sector
Looking at long-term developments in the saving-investment balance, Japan has continued
to record excess saving (= a current account surplus) at a time when saving and investment
rates have been on a declining trend (Chart 40 [1]). Developments in saving and
investment rates in the household, corporate, and government sectors are as follows.
(Household Sector)
Excess saving had decreased toward the 2000s, with the saving rate having declined due to
the aging population while the investment rate remained unchanged (Chart 40 [2]). From
the latter half of the 2000s onward, however, the investment rate has declined, reflecting
decreasing housing investment, while the saving rate has increased against a background of
restrained consumption despite various income transfers, including the supplementary
income payments. As a result, excess saving expanded. This is seemingly attributable to
households' rising concern about their future, reflecting a business slump after the Lehman
shock as well as a rising fiscal deficit, which restrained both housing investment and
consumption. Looking at the propensity to consume by age of householders, while the
group of those aged 60 years and older increased their propensity to consume, as described
later, the group of those younger than 60 reduced their propensity to consume (i.e., there
was a rise in the saving rate) (Chart 50 [3]).
(Corporate Sector)
From the latter half of the 1980s to the first half of the 1990s, excess investment continued,
reflecting a tremendous increase in fixed investment during the bubble period (Chart 40 [3]).
After the bursting of the bubble, excess saving continued throughout the 2000s as (1) firms
restrained their fixed investment in the process of balance-sheet repair, and (2) an
improvement in corporate profits as the result of business restructuring and a cutback in
labor costs led to an increase in saving. After the Lehman shock, excess saving in the
corporate sector has expanded, as the investment rate dropped while the saving rate has
remained more or less unchanged.

44
(Government Sector)
The saving-investment balance for the government sector recorded excess saving around
1990, reflecting a sharp increase in saving associated with a rise in tax revenue (Chart 40
[4]). Thereafter, excess investment (= a fiscal deficit) has increased significantly, as tax
revenue fell sharply due to the bursting of the bubble while successive fiscal stimuli have
kept the investment rate high. Excess investment (= a fiscal deficit) shrank at one point in
the mid-2000s, reflecting an increase in tax revenue due to economic recovery and cuts in
fiscal expenditures, but expanded again after the Lehman shock due to a sharp fall in tax
revenue and an increase in various social benefits.

45
(Box 4) Employment Situation in Disaster Areas
Employment conditions in disaster areas deteriorated soon after the earthquake disaster but
have recently shown signs of improvement (Chart 57 [1]). In the three disaster-stricken
prefectures in the Tohoku region (Iwate, Miyagi, and Fukushima), job offers have increased
significantly in a wide range of sectors, especially the construction sector, and the pace of
improvement in the ratio of job offers to applicants has been faster than the national average
(Chart 57 [2]). At the same time, however, the rise in labor demand has not yet fully led to
an increase in employment.
This is partly attributable to the fact that the skills required in those construction-related
sectors that are increasing job offers to meet the reconstruction-related demand are
markedly different from those required in the industries job seekers were engaged in before
the disaster, such as marine product processing, agriculture, and fishing. There is also a
possibility that the increase in employment is relatively slow because the maximum term of
unemployment benefits was extended by 210 days, and this has kept growth in labor supply
at low levels (Chart 57 [3]).
Labor supply is expected to recover because the term of unemployment benefits is
approaching expiration for an increasing number of the unemployed. At the same time,
however, it appears that some time will be required to correct the skill mismatch. The
tightening of demand and supply of labor in specific sectors such as the construction sector
may exert persistent upward pressure on wages in those sectors (Chart 57 [4]).

46
(Box 5) Aging of Population and Private Consumption
Distinguishing features of private consumption in the recent period are the rising
importance of consumption by the elderly and a trend rise in their propensity to consume
(Chart 50 [3]). Evidence of the elderly's increasing willingness to consume is supported
by the following analysis using panel data for different age cohorts.
A cohort-based analysis that uses panel data for different age cohorts allows us to separately
analyze (1) common characteristics in each age bracket regardless of birth year (the age
effect) and (2) characteristics unique to a generation born in specific years (the generation
effect).
As for the age effect, it has been observed that a propensity to consume tends to be low in
working-age cohorts and high in older ones (Chart 58 [1][a]). This observation is
consistent with a life-cycle hypothesis. The working-age cohort saves in preparation for
retirement by restraining their expenses such that these are less than their income. On the
other hand, as for the older-age cohort, the propensity to consume (= consumption divided
by income) is higher, as this cohort's consumption depends on accumulated assets because
the levels of their income -- mainly comprised of pension benefits -- are low compared to
those of the working-age population.
As for the generation effect, our analysis shows that the baby boom generation, which is
comprised of people who were born soon after the end of World War II, has a high
propensity to consume compared to other generations (Chart 58 [1][b]). The recent rise in
the elderly's propensity to consume seemingly reflects the fact that the generation showing a
high propensity to do so, the so-called "active senior citizens," is part of the elderly
category.
Comparing the composition of consumption by the elderly with that of other age groups, it
is notable that the shares are high for "social expenses," "medical care," "food," and
"accommodation services & package tours" (Chart 58 [2]). With the aim of taking
advantage of the elderly's strong willingness to consume, especially in service industries,

47
firms have been strengthening their capacity to develop and supply goods and services
targeted at the active senior citizens in recent years.

48
(Box 6) Various Indicators to Measure Inflation Expectations
Inflation expectations, which indicate how households and firms see future inflation
prospects, provide important information with regard to the conduct of monetary policy.28
First, inflation expectations affect such decision making as consumption by households and
investment by firms, and consequently business fluctuations through changes in real interest
rates, which reflect future price developments. Even when nominal interest rates are
unchanged, financial conditions can tighten or ease if real interest rates change in reflection
of changes in inflation expectations. Second, inflation expectations affect actual inflation
rates through wage- and price-setting behavior. When firms and households expect to see
price changes in the future, they consider such changes when making decisions on prices
and wages.
From the above two perspectives, medium- to long-term inflation expectations are more
important than their short-term counterpart. In terms of their impact on business
conditions, this is because real interest rates have a significant effect on the purchases of
consumer durable goods as well as machinery and construction equipment, which involve
intertemporal decision making with a significantly long time horizon. In terms of their
impact on actual prices, medium- to long-term inflation expectations are important because
the price-setting behavior of firms and consumption by households are considered to be
largely determined by such expectations -- in other words, the general public's perception of
prices as established within the society.
There are basically two approaches to measuring inflation expectations: conducting surveys
of households, firms, or economists and/or deriving them from price information in
financial markets (Chart 59 [1]). It is important to measure inflation expectations in a
comprehensive manner by checking a variety of indicators without focusing too much on a
specific one, bearing in mind their strengths and weaknesses.
28 For a more detailed explanation of indicators for inflation expectations in Japan and abroad,
please see "On Inflation Expectations" Bank of Japan Review Series (2008-J-15) and "Usefulness of
Surveys regarding Medium- to Long-term Inflation Expectations" Bank of Japan Review Series
(2011-J-8), both of which are available only in Japanese.
49
For example, when asked about the prospects for output prices and input prices, firms have
a bias toward providing more unfavorable prices for themselves. Such survey data are
known to have a certain usefulness in projecting short-term prospects of the CGPI. On the
other hand, it has been pointed out that short-term inflation expectations by households tend
to be influenced by short-term price developments of frequently purchased items such as
gasoline and foods.29
Inflation expectations by economists are useful and widely utilized by central banks,
including the Bank, because not only short-term projections but also medium- to long-term
projections covering five or ten years are available. However, there is also a weakness in
terms of how such inflation expectations by economists are related to actual consumption
by households and the price- and wage-setting behavior of firms. Furthermore, if
economists respond to surveys based on the economic theory that "inflation rates will, in a
medium to long run, converge to the rate pursued by a central bank," then a central bank's
examination of such expectations represents nothing more than looking at itself in the
mirror (the "looking into the mirror problem").
Inflation expectations derived from price information in financial markets, such as prices
for inflation-indexed government bonds and inflation-linked swap transactions, are an
indicator of summarized views held by a variety of market participants. At the same time,
however, due attention is needed because they are significantly affected by market liquidity.
In particular, market liquidity for inflation-indexed government bonds in Japan significantly
declined after the Lehman shock because overseas financial institutions, which used to be
major holders of the bonds, reduced their positions sharply. Thereafter, against a backdrop
of increasing deflationary pressures associated with the global financial crisis, domestic
investors have generally stayed away from investing in inflation-indexed government bonds
for which principals are not guaranteed at the time of redemption. Against this
background, new issuance of inflation-indexed government bonds has been suspended since
29 It should also be noted that it is not clear whether households and firms respond to surveys after
taking into account changes in the quality of goods and services. When compiling price indices,
improvement in quality is adjusted by lowering prices accordingly in order to measure price changes
with constant quality.

50
August 2008 and the buy-back operations of inflation-indexed government bonds by the
national debt consolidation fund have been conducted on a significant scale. As a result,
the market size of inflation-indexed government bonds in Japan has declined from more
than 8 trillion yen at the peak, to less than 4 trillion yen in the recent period, and its share in
the total outstanding amount of Japanese government bonds has become less than 1 percent,
which is very different from the situation in the United States (Chart 59 [2]).30 In such a
market environment with extremely low market liquidity, a larger liquidity premium is
added to the yield of inflation-indexed government bonds compared to the fixed
coupon-bearing government bonds. Therefore, the break-even inflation rate (BEI), which
is calculated as a yield difference between the fixed coupon-bearing government bonds and
inflation-indexed government bonds and often used as a proxy for inflation expectations,
has a nonnegligible downward bias. Furthermore, changes in the BEI could be affected by
changes not only in inflation expectations but also in differences in market liquidity of the
fixed coupon-bearing government bonds and inflation-indexed government bonds.
Regarding inflation-linked swap transactions, while relatively active transactions are taking
place in the United States, the transaction volume in Japan is small due to limited demand
for the purpose of hedging inflation risk, and market prices are not available from
information vendors.
30 The Ministry of Finance of Japan has changed the product design of inflation-indexed
government bonds, for example, by setting a floor for the amount of principal at the time of
redemption. In order to resume the issuance of inflation-indexed government bonds, the Ministry
has been conducting a practical examination involving market participants.

Charts
Chart 1 Real GDP and Business Conditions
Chart 2 Overseas Economies
Chart 3 Overseas Economies and Exchange Rates
Chart 4 Exports and Imports
Chart 5 Production
Chart 6 Corporate Profits and Fixed Investment
Chart 7 Private Consumption
Chart 8 Housing Investment
Chart 9 All Industry Activity
Chart 10 Resource Utilization
Chart 11 Corporate Prices
Chart 12 Consumer Price Index (1)
Chart 13 Consumer Price Index (2)
Chart 14 Consumer Price Index (3)
Chart 15 Sovereign Risk Premiums
Chart 16 Stock Prices in the United States and Europe, and Volatility
Chart 17 Exchange Rates
Chart 18 Credit Spreads in Financial Markets of Major Economies
Chart 19 Policy Interest Rates
Chart 20 Short-Term Interest Rates
Chart 21 Long-Term Interest Rates
Chart 22 Stock Prices and the J-REIT Market
Chart 23 Spreads for CP and Corporate Bonds, and Bank Lending
Chart 24 Interest Rates and Economic Activity
Chart 25 Corporate Finance-Related Indicators
Chart 26 Interest Rates on Corporate Bonds
Chart 27 Bank Lending Practices
Chart 28 Amount Outstanding of Bank Lending, CP, and Corporate Bonds
Chart 29 Issuance Spreads for and Amount of Corporate Bonds
Chart 30 Monetary Base and Money Stock
Chart 31 Land Prices
Chart 32 Power Demand
Chart 33 Public Investment and Government Liabilities
Chart 34 Cycle of Global Demand for IT-Related Goods
Chart 35 Worldwide Market Share of Japanese-Affiliated Companies
Chart 36 International Competitiveness Coefficient
Chart 37 Trade Balance
Chart 38 Income Balance and International Investment Position
Chart 39 Current Account and Investment-Saving Balance
Chart 40 Investment-Saving Balance of Each Sector
Chart 41 Corporate Profits
Chart 42 Business Fixed Investment Plans as Surveyed
Chart 43 Capital Stock Cycle
Chart 44 Business Fixed Investment
Chart 45 Corporate Overseas Investment Activities
Chart 46 Employee Income
Chart 47 Employment and Wages
Chart 48 Supply and Demand Conditions in the Labor Market
Chart 49 Disposable Income of Households, Propensity to Consume, and Saving Rates
Chart 50 Population Aging and Private Consumption
Chart 51 International Commodity Prices and Overseas Economies
Chart 52 Inflation Expectations
Chart 53 Output Gap and Potential Growth Rate
Chart 54 Output Gap and Inflation Rate (1)
Chart 55 Output Gap and Inflation Rate (2)
Chart 56 CPI Laspeyres Chain Index
Chart 57 Employment Conditions in the Disaster Areas
Chart 58 Features of Elderly Household Consumption
Chart 59 Information Available in Deriving Inflation Expectations
Reference Economic Assessment by Region (Regional Economic Report)
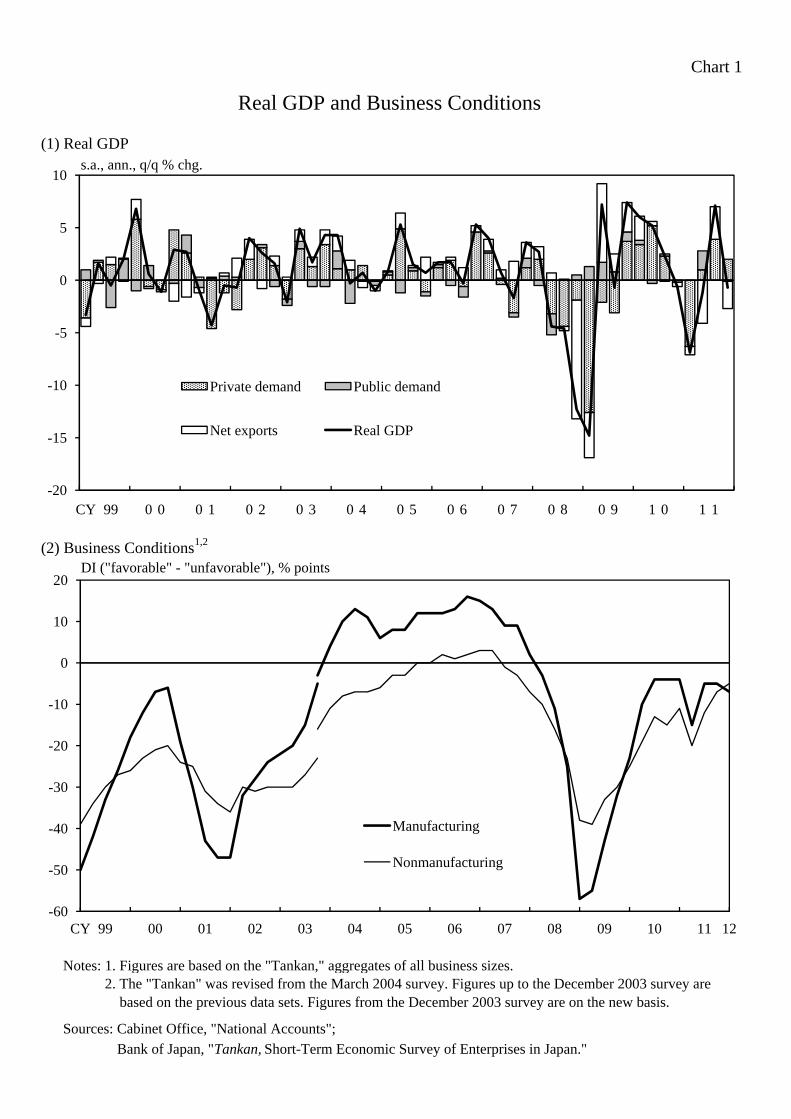
Chart 1
(1) Real GDP
Real GDP and Business Conditions
10s.a., ann., q/q % chg.
0
5
10s.a., ann., q/q % chg.
-15
-10
-5
0
5
10
Private demand Public demand
Net exports Real GDP
s.a., ann., q/q % chg.
(2) Business Conditions1,2
-20
-15
-10
-5
0
5
10
CY 99 0 0 0 1 0 2 0 3 0 4 0 5 0 6 0 7 0 8 0 9 1 0 1 1
Private demand Public demand
Net exports Real GDP
s.a., ann., q/q % chg.
DI ("favorable" - "unfavorable"), % points
-20
-15
-10
-5
0
5
10
CY 99 0 0 0 1 0 2 0 3 0 4 0 5 0 6 0 7 0 8 0 9 1 0 1 1
Private demand Public demand
Net exports Real GDP
s.a., ann., q/q % chg.
0
10
20DI ("favorable" - "unfavorable"), % points
-20
-15
-10
-5
0
5
10
CY 99 0 0 0 1 0 2 0 3 0 4 0 5 0 6 0 7 0 8 0 9 1 0 1 1
Private demand Public demand
Net exports Real GDP
s.a., ann., q/q % chg.
-30
-20
-10
0
10
20
M f t i
DI ("favorable" - "unfavorable"), % points
-20
-15
-10
-5
0
5
10
CY 99 0 0 0 1 0 2 0 3 0 4 0 5 0 6 0 7 0 8 0 9 1 0 1 1
Private demand Public demand
Net exports Real GDP
s.a., ann., q/q % chg.
-60
-50
-40
-30
-20
-10
0
10
20
CY 99 00 01 02 03 04 05 06 07 08 09 10 11 12
Manufacturing
Nonmanufacturing
DI ("favorable" - "unfavorable"), % points
Notes: 1. Figures are based on the "Tankan," aggregates of all business sizes. Notes: 2. The "Tankan" was revised from the March 2004 survey. Figures up to the December 2003 survey areNotes: 2. based on the previous data sets. Figures from the December 2003 survey are on the new basis.
Sources: Cabinet Office, "National Accounts";
Sources: Bank of Japan, "Tankan, Short-Term Economic Survey of Enterprises in Japan."
-20
-15
-10
-5
0
5
10
CY 99 0 0 0 1 0 2 0 3 0 4 0 5 0 6 0 7 0 8 0 9 1 0 1 1
Private demand Public demand
Net exports Real GDP
s.a., ann., q/q % chg.
-60
-50
-40
-30
-20
-10
0
10
20
CY 99 00 01 02 03 04 05 06 07 08 09 10 11 12
Manufacturing
Nonmanufacturing
DI ("favorable" - "unfavorable"), % points

Chart 2
(1) Real GDP Growth Rates of the World Economy1
Overseas Economies
10
12s.a., ann., q/q % chg.
0
2
4
6
8
10
12s.a., ann., q/q % chg.
-10
-8
-6
-4
-2
0
2
4
6
8
10
12
World economy
Advanced economies
Emerging and developing economies, etc.
s.a., ann., q/q % chg.
2
2
3
Notes: 1. Figures are calculated using GDP based on purchasing power parity (PPP) shares of the world total fromNotes: 1. the IMF.Notes: 2. World economy covers 184 countries. Advanced economies are the United States, euro area (17 countries),Notes: 2. United Kingdom, and Japan.Notes: 3. Including estimated quarterly growth rates based on historical annual data of real GDP growth rates.
-10
-8
-6
-4
-2
0
2
4
6
8
10
12
CY 0 5 0 6 0 7 0 8 0 9 1 0 1 1
World economy
Advanced economies
Emerging and developing economies, etc.
s.a., ann., q/q % chg.
2
2
3
(2) Business Confidence (3) Consumer Confidence
20
30
40
60
70United States (left scale)
Euro area (right scale)
s.a., % s.a., % points1
2
20
30
40
120
140
160United States (left scale)Euro area (right scale)
s.a., % points1966/Q1=1001
2
-10
-8
-6
-4
-2
0
2
4
6
8
10
12
CY 0 5 0 6 0 7 0 8 0 9 1 0 1 1
World economy
Advanced economies
Emerging and developing economies, etc.
s.a., ann., q/q % chg.
2
2
3
-20
-10
0
10
20
30
40
40
50
60
70United States (left scale)
Euro area (right scale)
s.a., % s.a., % points1
2
-20
-10
0
10
20
30
40
40
60
80
100
120
140
160United States (left scale)Euro area (right scale)
s.a., % points1966/Q1=1001
2
-10
-8
-6
-4
-2
0
2
4
6
8
10
12
CY 0 5 0 6 0 7 0 8 0 9 1 0 1 1
World economy
Advanced economies
Emerging and developing economies, etc.
s.a., ann., q/q % chg.
2
2
3
Notes: 1. Figures for business confidence are the Manufacturing ISM Report on Business, and those for consumerNotes: 1. confidence are the Thomson Reuters/University of Michigan Consumer Sentiment Index. A reading ofNotes: 1 50 percent on the ISM index generally indicates a turning point between economic expansion and decline
-40
-30
-20
-10
0
10
20
30
40
30
40
50
60
70
05 06 07 08 09 10 11 12
United States (left scale)
Euro area (right scale)
s.a., % s.a., % points1
2
CY-40
-30
-20
-10
0
10
20
30
40
0
20
40
60
80
100
120
140
160
05 06 07 08 09 10 11 12
United States (left scale)Euro area (right scale)
s.a., % points1966/Q1=1001
2
CY
-10
-8
-6
-4
-2
0
2
4
6
8
10
12
CY 0 5 0 6 0 7 0 8 0 9 1 0 1 1
World economy
Advanced economies
Emerging and developing economies, etc.
s.a., ann., q/q % chg.
2
2
3
Notes: 1. 50 percent on the ISM index generally indicates a turning point between economic expansion and declineNotes: 1. in the manufacturing sector.Notes: 2. Taken from the Economic Sentiment Indicator of the European Commission. Figures for business confidenceNotes: 2. are the Industrial Confidence Indicator, and those for consumer confidence are the Consumer ConfidenceNotes: 2. Indicator. A reading of 0 percentage points generally indicates a turning point between economic expansionNotes: 2. and decline.Sources: IMF, "World Economic Outlook"; European Commission; Thomson Reuters; HAVER, etc.
-40
-30
-20
-10
0
10
20
30
40
30
40
50
60
70
05 06 07 08 09 10 11 12
United States (left scale)
Euro area (right scale)
s.a., % s.a., % points1
2
CY-40
-30
-20
-10
0
10
20
30
40
0
20
40
60
80
100
120
140
160
05 06 07 08 09 10 11 12
United States (left scale)Euro area (right scale)
s.a., % points1966/Q1=1001
2
CY
-10
-8
-6
-4
-2
0
2
4
6
8
10
12
CY 0 5 0 6 0 7 0 8 0 9 1 0 1 1
World economy
Advanced economies
Emerging and developing economies, etc.
s.a., ann., q/q % chg.
2
2
3

Chart 3
(1) Real GDP Growth Rates of Overseas Economies
Overseas Economies and Exchange Rates
7y/y % chg.
101234567
United States EU China
y/y % chg.
Note: Real GDP growth rate of the overseas total is the weighted average of real GDP growth rates by value of Note: exports from Japan to each economy.(2) Effective Exchange Rates of the Yen
-3-2-101234567
84 85 86 87 88 89 90 91 92 93 94 95 96 97 98 99 00 01 02 03 04 05 06 07 08 09 10 11 12 13 14
United States EU ChinaNIEs ASEAN4 Other economiesOverseas total
y/y % chg.
IMF projection
CY
monthly avg., CY 2010=100( ) g
-3-2-101234567
84 85 86 87 88 89 90 91 92 93 94 95 96 97 98 99 00 01 02 03 04 05 06 07 08 09 10 11 12 13 14
United States EU ChinaNIEs ASEAN4 Other economiesOverseas total
y/y % chg.
IMF projection
CY
80
100
120
140
160monthly avg., CY 2010=100
Appreciationof the yen
Depreciationof the yen
Note: The effective exchange rates are based on the broad indices of the BIS effective exchange rates, and thoseNote: prior to 1994 are calculated using the narrow indices Figures for April 2012 are calculated using the Bank
-3-2-101234567
84 85 86 87 88 89 90 91 92 93 94 95 96 97 98 99 00 01 02 03 04 05 06 07 08 09 10 11 12 13 14
United States EU ChinaNIEs ASEAN4 Other economiesOverseas total
y/y % chg.
IMF projection
CY
20
40
60
80
100
120
140
160
80 81 82 83 84 85 86 87 88 89 90 91 92 93 94 95 96 97 98 99 00 01 02 03 04 05 06 07 08 09 10 11
Real effective exchange rate
Nominal effective exchange rate
monthly avg., CY 2010=100
Appreciationof the yen
Depreciationof the yen
CY 12
Note: prior to 1994 are calculated using the narrow indices. Figures for April 2012 are calculated using the BankNote: of Japan's nominal effective exchange rate of the yen.(3) Real Exchange Rates of the Yen
-3-2-101234567
84 85 86 87 88 89 90 91 92 93 94 95 96 97 98 99 00 01 02 03 04 05 06 07 08 09 10 11 12 13 14
United States EU ChinaNIEs ASEAN4 Other economiesOverseas total
y/y % chg.
IMF projection
CY
20
40
60
80
100
120
140
160
80 81 82 83 84 85 86 87 88 89 90 91 92 93 94 95 96 97 98 99 00 01 02 03 04 05 06 07 08 09 10 11
Real effective exchange rate
Nominal effective exchange rate
monthly avg., CY 2010=100
Appreciationof the yen
Depreciationof the yen
CY 12
120
140
160Real exchange rate of the yen against the U.S. dollarReal exchange rate of the yen against the wonReal exchange rate of the yen against the euro
monthly avg., CY 2010=100
Appreciationof the yen
Depreciationf th
-3-2-101234567
84 85 86 87 88 89 90 91 92 93 94 95 96 97 98 99 00 01 02 03 04 05 06 07 08 09 10 11 12 13 14
United States EU ChinaNIEs ASEAN4 Other economiesOverseas total
y/y % chg.
IMF projection
CY
20
40
60
80
100
120
140
160
80 81 82 83 84 85 86 87 88 89 90 91 92 93 94 95 96 97 98 99 00 01 02 03 04 05 06 07 08 09 10 11
Real effective exchange rate
Nominal effective exchange rate
monthly avg., CY 2010=100
Appreciationof the yen
Depreciationof the yen
CY 12
60
80
100
120
140
160
CY 0 0 0 1 0 2 0 3 0 4 0 5 0 6 0 7 0 8 0 9 1 0 1 1 12
Real exchange rate of the yen against the U.S. dollarReal exchange rate of the yen against the wonReal exchange rate of the yen against the euro
monthly avg., CY 2010=100
Appreciationof the yen
Depreciationof the yen
Note: Figures are calculated as the yen's nominal exchange rate against a currency multiplied by (Japan's CPI / theNote: corresponding countries' or regions' CPI). The CPI of each country and region is based on the index of all items.
Sources: IMF, "World Economic Outlook"; Ministry of Finance, "Trade Statistics"; Bank for International Settlements;Sources: Bank of Japan; CEIC; Ministry of Internal Affairs and Communications, "Consumer Price Index";Sources: Bloomberg; etc.
-3-2-101234567
84 85 86 87 88 89 90 91 92 93 94 95 96 97 98 99 00 01 02 03 04 05 06 07 08 09 10 11 12 13 14
United States EU ChinaNIEs ASEAN4 Other economiesOverseas total
y/y % chg.
IMF projection
CY
20
40
60
80
100
120
140
160
80 81 82 83 84 85 86 87 88 89 90 91 92 93 94 95 96 97 98 99 00 01 02 03 04 05 06 07 08 09 10 11
Real effective exchange rate
Nominal effective exchange rate
monthly avg., CY 2010=100
Appreciationof the yen
Depreciationof the yen
CY 12
60
80
100
120
140
160
CY 0 0 0 1 0 2 0 3 0 4 0 5 0 6 0 7 0 8 0 9 1 0 1 1 12
Real exchange rate of the yen against the U.S. dollarReal exchange rate of the yen against the wonReal exchange rate of the yen against the euro
monthly avg., CY 2010=100
Appreciationof the yen
Depreciationof the yen

Chart 4
(1) Real Exports and Real Imports
Exports and Imports
50
60
70
80
90
100
110
120
130
140
150
CY 99 0 0 0 1 0 2 0 3 0 4 0 5 0 6 0 7 0 8 0 9 1 0 1 1 12
Real exports
Real imports
s.a., CY 2005=100
(2) Real Exports by Region (3) Real Imports by Goods
Note: The seasonally adjusted figures for real exports and real imports have been retroactively revised due to theNote: regular annual revision of the previous year's data in the "Trade Statistics." Figures by region or goods,Note: however, have not been revised.Sources: Ministry of Finance "Trade Statistics"; Bank of Japan "Corporate Goods Price Index "
50
60
70
80
90
100
110
120
130
140
150
CY 99 0 0 0 1 0 2 0 3 0 4 0 5 0 6 0 7 0 8 0 9 1 0 1 1 12
Real exports
Real imports
s.a., CY 2005=100
-10
-5
0
5
10
15
CY 1 0 1 1 12
United States
EU
China
NIEs
ASEAN4
Others
Total
s.a., q/q % chg.
-5
0
5
10
CY 1 0 1 1 12
Intermediate goods
IT-related goods
Capital goods and parts
Raw materials
Others
Total
s.a., q/q % chg.
Sources: Ministry of Finance, Trade Statistics ; Bank of Japan, Corporate Goods Price Index.
50
60
70
80
90
100
110
120
130
140
150
CY 99 0 0 0 1 0 2 0 3 0 4 0 5 0 6 0 7 0 8 0 9 1 0 1 1 12
Real exports
Real imports
s.a., CY 2005=100
-10
-5
0
5
10
15
CY 1 0 1 1 12
United States
EU
China
NIEs
ASEAN4
Others
Total
s.a., q/q % chg.
-5
0
5
10
CY 1 0 1 1 12
Intermediate goods
IT-related goods
Capital goods and parts
Raw materials
Others
Total
s.a., q/q % chg.

Chart 5
(1) Industrial Production
Note: Industrial production (adjusted to the effects of the Lehman shock) is calculated by detecting large
Production
70
75
80
85
90
95
100
105
110
115
C Y 9 9 0 0 0 1 0 2 0 3 0 4 0 5 0 6 0 7 0 8 0 9 1 0 1 1 12
Industrial production
Industrial production (adjusted to the effects of the Lehman shock)
s.a., CY 2005=100
Note: Industrial production (adjusted to the effects of the Lehman shock) is calculated by detecting large fluctuations after the Lehman shock as outliers (estimation by the Research and Statistics Department, Bank of Japan).
(2) Shipment-Inventory Balance (Mining and Manufacturing)
Source: Ministry of Economy Trade and Industry "Indices of Industrial Production "
-40
-30
-20
-10
0
10
20
30
40
-40
-30
-20
-10
0
10
20
30
40
C Y 9 9 0 0 0 1 0 2 0 3 0 4 0 5 0 6 0 7 0 8 0 9 1 0 1 1 12
Shipments minus inventories (right scale)
Shipments (left scale)
Inventories (left scale)
% points y/y % chg.
70
75
80
85
90
95
100
105
110
115
C Y 9 9 0 0 0 1 0 2 0 3 0 4 0 5 0 6 0 7 0 8 0 9 1 0 1 1 12
Industrial production
Industrial production (adjusted to the effects of the Lehman shock)
s.a., CY 2005=100
Source: Ministry of Economy, Trade and Industry, "Indices of Industrial Production."

Chart 6
(1) Corporate Profits
Corporate Profits and Fixed Investment
10y/y chg., tril. yen
0
5
10y/y chg., tril. yen
-10
-5
0
5
10
Current profits
Operating profits
y/y chg., tril. yen
Notes: 1. Based on all-size enterprises and all industries.Notes: 2. Taken from the "Financial Statements Statistics of Corporations by Industry, Quarterly." Figures exclude
-15
-10
-5
0
5
10
CY 99 00 01 02 03 04 05 06 07 08 09 10 11
Current profits
Operating profits
y/y chg., tril. yen
p y y Q y gNotes: 2. finance and insurance.
(2) Fixed Investment
-15
-10
-5
0
5
10
CY 99 00 01 02 03 04 05 06 07 08 09 10 11
Current profits
Operating profits
y/y chg., tril. yen
75
80s.a., ann., tril. yen
-15
-10
-5
0
5
10
CY 99 00 01 02 03 04 05 06 07 08 09 10 11
Current profits
Operating profits
y/y chg., tril. yen
65
70
75
80s.a., ann., tril. yen
-15
-10
-5
0
5
10
CY 99 00 01 02 03 04 05 06 07 08 09 10 11
Current profits
Operating profits
y/y chg., tril. yen
55
60
65
70
75
80s.a., ann., tril. yen
Note: Taken from "National Accounts." The figure is real private non-residential investment.
Sources: Ministry of Finance, "Financial Statements Statistics of Corporations by Industry, Quarterly"; Sources: Cabinet Office, "National Accounts."
-15
-10
-5
0
5
10
CY 99 00 01 02 03 04 05 06 07 08 09 10 11
Current profits
Operating profits
y/y chg., tril. yen
55
60
65
70
75
80
CY 99 00 01 02 03 04 05 06 07 08 09 10 11
s.a., ann., tril. yen

Chart 7
(1) Private Final Consumption Expenditure and Synthetic Consumption Index
Private Consumption
90
92
94
96
98
100
102
104
9 9 0 0 0 1 0 2 0 3 0 4 0 5 0 6 0 7 0 8 0 9 1 0 1 1 12
Private final consumption expenditure (SNA, real)
Synthetic consumption index
s.a., CY 2010=100
CY
Note: The figure for the synthetic consumption index for 2012/Q1 is the January-February averagein quarterly amount.
(2) Consumer Confidence Index
Sources: Cabinet Office, "National Accounts," "Consumer Confidence Survey,""Synthetic Consumption Index "
60
70
80
90
100
110
120
130
9 9 0 0 0 1 0 2 0 3 0 4 0 5 0 6 0 7 0 8 0 9 1 0 1 1 12CY
s.a., CY 2010=100
Improved
Worsened
90
92
94
96
98
100
102
104
9 9 0 0 0 1 0 2 0 3 0 4 0 5 0 6 0 7 0 8 0 9 1 0 1 1 12
Private final consumption expenditure (SNA, real)
Synthetic consumption index
s.a., CY 2010=100
CY
"Synthetic Consumption Index."
60
70
80
90
100
110
120
130
9 9 0 0 0 1 0 2 0 3 0 4 0 5 0 6 0 7 0 8 0 9 1 0 1 1 12CY
s.a., CY 2010=100
Improved
Worsened
90
92
94
96
98
100
102
104
9 9 0 0 0 1 0 2 0 3 0 4 0 5 0 6 0 7 0 8 0 9 1 0 1 1 12
Private final consumption expenditure (SNA, real)
Synthetic consumption index
s.a., CY 2010=100
CY

Chart 8
(1) Housing Starts and Private Residential Investment
Housing Investment
14025s.a., ann., tril. yen s.a., ann., 10 thous. units
110
120
130
140
20
25s.a., ann., tril. yen s.a., ann., 10 thous. units
70
80
90
100
110
120
130
140
10
15
20
25
Private residential investment (SNA, real, left scale)
Housing starts (right scale)
s.a., ann., tril. yen s.a., ann., 10 thous. units
Note: The figure for housing starts for 2012/Q1 is the January-February average.
(2) Amount of Flat 35 Housing Loan Financed (3) Housing Eco-Points
60
70
80
90
100
110
120
130
140
5
10
15
20
25
9 9 0 0 0 1 0 2 0 3 0 4 0 5 0 6 0 7 0 8 0 9 1 0 1 1 12
Private residential investment (SNA, real, left scale)
Housing starts (right scale)
s.a., ann., tril. yen s.a., ann., 10 thous. units
CY
(2) Amount of Flat 35 Housing Loan Financed (3) Housing Eco Points
0 6
0.7
0.8
0.9
1.0 tril. yen
12
14
16
18
20
Construction
Renovation
points issued, bil. points
60
70
80
90
100
110
120
130
140
5
10
15
20
25
9 9 0 0 0 1 0 2 0 3 0 4 0 5 0 6 0 7 0 8 0 9 1 0 1 1 12
Private residential investment (SNA, real, left scale)
Housing starts (right scale)
s.a., ann., tril. yen s.a., ann., 10 thous. units
CY
0.2
0.3
0.4
0.5
0.6
0.7
0.8
0.9
1.0 tril. yen
4
6
8
10
12
14
16
18
20
Construction
Renovation
points issued, bil. points
60
70
80
90
100
110
120
130
140
5
10
15
20
25
9 9 0 0 0 1 0 2 0 3 0 4 0 5 0 6 0 7 0 8 0 9 1 0 1 1 12
Private residential investment (SNA, real, left scale)
Housing starts (right scale)
s.a., ann., tril. yen s.a., ann., 10 thous. units
CY
Notes: 1. Flat 35 is the long-term fixed-rate mortgage financed by the Japan Housing Finance Agency in Notes: 1. cooperation with private financial institutions. It is available for new construction or purchase
0.0
0.1
0.2
0.3
0.4
0.5
0.6
0.7
0.8
0.9
1.0
0 7 0 8 0 9 1 0 1 1FY
tril. yen
0
2
4
6
8
10
12
14
16
18
20
10/4 7 10 11/1 4 7 10 12/1
Construction
Renovation
points issued, bil. points
60
70
80
90
100
110
120
130
140
5
10
15
20
25
9 9 0 0 0 1 0 2 0 3 0 4 0 5 0 6 0 7 0 8 0 9 1 0 1 1 12
Private residential investment (SNA, real, left scale)
Housing starts (right scale)
s.a., ann., tril. yen s.a., ann., 10 thous. units
CY
Notes: 1. cooperation with private financial institutions. It is available for new construction or purchase Notes: 1. of houses that meet certain criteria. The borrowing period is 15-35 years.
2. Housing eco-points are provided for new construction or renovation of houses that meet certain Notes: 1. energy-saving criteria. These points can be exchanged with energy-saving products, or goods Notes: 1. produced in areas damaged by the Great East Japan Earthquake. Sources: Ministry of Land, Infrastructure, Transport and Tourism, "Statistics on Building Construction Starts"; Sources: Cabinet Office, "National Accounts"; Japan Housing Finance Agency, etc.

Chart 9
(1) All Industry Activity and Real GDP1
(2) All Industry Activity1
All Industry Activity
-2
0
2
4
6
Construction industry activity
y/y % chg.
-12
-10
-8
-6
-4
-2
0
2
4
6
9 5 9 6 9 7 9 8 9 9 0 0 0 1 0 2 0 3 0 4 0 5 0 6 0 7 0 8 0 9 1 0 1 1 12
All industry activity
Real GDP
y/y % chg.
CY
(3) Tertiary Industry Activity1
Notes: 1. Figures for 2012/Q1 are January-February averages. 2. Consisting of scientific research, professional and technical services; living-related and personal
services and amusement services; and miscellaneous services (except government services, etc.).
Sources: Ministry of Economy, Trade and Industry, "Indices of All Industry Activity," "Indices of Tertiary Industry Activity"; Cabinet Office "National Accounts "
-12
-10
-8
-6
-4
-2
0
2
4
6
CY 0 4 0 5 0 6 0 7 0 8 0 9 1 0 1 1 12
Construction industry activityIndustrial productionTertiary industry activityGovernment services, etc.All industry activity
y/y % chg.
-8
-6
-4
-2
0
2
4
CY 0 4 0 5 0 6 0 7 0 8 0 9 1 0 1 1 12
Wholesale tradeTransport and postal activitiesServicesFinance and insuranceElectricity, gas, heat supply and waterRetail tradeOthersTertiary industry
y/y % chg.
2
-12
-10
-8
-6
-4
-2
0
2
4
6
9 5 9 6 9 7 9 8 9 9 0 0 0 1 0 2 0 3 0 4 0 5 0 6 0 7 0 8 0 9 1 0 1 1 12
All industry activity
Real GDP
y/y % chg.
CY
"Indices of Tertiary Industry Activity"; Cabinet Office, "National Accounts."

Chart 10
(1) Production Capacity DI
(2) Employment Conditions DI
Resource Utilization
-50
-40
-30
-20
-10
0
10
20
30
reversed, DI ("excessive" - "insufficient"), % points
"Excessive"
"Insufficient"
-20
-10
0
10
20
3075 77 79 81 83 85 87 89 91 93 95 97 99 01 03 05 07 09 11 12
"Excessive"
"Insufficient"
reversed, DI ("excessive" - "insufficient"), % points
CY
(3) Tankan Composite Indicator and Output Gap
Notes: 1. Figures for the DI are based on all-size enterprises and all industries. 2. Figures for the Tankan composite indicator are weighted averages of the production capacity DI and
employment conditions DI. The fiscal 1990-2010 averages of capital and labor shares in the National Accounts are used as the weight. The output gap is estimated by the Research and Statistics Department,Bank of Japan. For the estimation procedures, see "The New Estimates of Output Gap and Potential Growth Rate," Bank of Japan Review Series, 2006-E-3.
3. The "Tankan" was revised from the March 2004 survey. Figures up to the December 2003 survey are based on the previous data sets. Figures from the December 2003 survey are on the new basis.
Sources: Cabinet Office, "National Accounts"; Bank of Japan, "Tankan, Short-Term Economic Survey ofEnterprises in Japan"; Ministry of Internal Affairs and Communications, "Labour Force Survey";Ministry of Health, Labour and Welfare, "Monthly Labour Survey," "Report on Employment Service";Ministry of Economy, Trade and Industry, "Indices of Industrial Production," etc.
-50
-40
-30
-20
-10
0
10
20
3075 77 79 81 83 85 87 89 91 93 95 97 99 01 03 05 07 09 11 12
reversed, DI ("excessive" - "insufficient"), % points
"Excessive"
"Insufficient"
CY
-20
-10
0
10
20
3075 77 79 81 83 85 87 89 91 93 95 97 99 01 03 05 07 09 11 12
"Excessive"
"Insufficient"
reversed, DI ("excessive" - "insufficient"), % points
CY
-40-30-20-1001020304050-10
-8-6-4-202468
75 77 79 81 83 85 87 89 91 93 95 97 99 01 03 05 07 09 11 12
Output gap (left scale)
Tankan composite indicator (right scale)
% reversed, DI ("excessive" - "insufficient"), % points
CY
Ministry of Economy, Trade and Industry, Indices of Industrial Production, etc.
-50
-40
-30
-20
-10
0
10
20
3075 77 79 81 83 85 87 89 91 93 95 97 99 01 03 05 07 09 11 12
reversed, DI ("excessive" - "insufficient"), % points
"Excessive"
"Insufficient"
CY
-20
-10
0
10
20
3075 77 79 81 83 85 87 89 91 93 95 97 99 01 03 05 07 09 11 12
"Excessive"
"Insufficient"
reversed, DI ("excessive" - "insufficient"), % points
CY
-40-30-20-1001020304050-10
-8-6-4-202468
75 77 79 81 83 85 87 89 91 93 95 97 99 01 03 05 07 09 11 12
Output gap (left scale)
Tankan composite indicator (right scale)
% reversed, DI ("excessive" - "insufficient"), % points
CY

Chart 11
(1) Domestic Corporate Goods Price Index
Corporate Prices
-10
-8
-6
-4
-2
0
2
4
6
8
99 00 01 02 03 04 05 06 07 08 09 10 11 12
1995 base (Domestic Wholesale Price Index)
2000 base
2005 base
CY
y/y % chg.
(2) Corporate Services Price Index (Excluding International Transportation)
Source: Bank of Japan, "Corporate Goods Price Index," "Wholesale Price Index,""Corporate Services Price Index."
-4
-3
-2
-1
0
1
99 00 01 02 03 04 05 06 07 08 09 10 11 12
1995 base
2000 base
2005 base
y/y % chg.
CY
-10
-8
-6
-4
-2
0
2
4
6
8
99 00 01 02 03 04 05 06 07 08 09 10 11 12
1995 base (Domestic Wholesale Price Index)
2000 base
2005 base
CY
y/y % chg.
p
-4
-3
-2
-1
0
1
99 00 01 02 03 04 05 06 07 08 09 10 11 12
1995 base
2000 base
2005 base
y/y % chg.
CY
-10
-8
-6
-4
-2
0
2
4
6
8
99 00 01 02 03 04 05 06 07 08 09 10 11 12
1995 base (Domestic Wholesale Price Index)
2000 base
2005 base
CY
y/y % chg.

Chart 12
(1) Consumer Price Index
( ) i d d h i d
Consumer Price Index (1)
-3
-2
-1
0
1
2
3
99 00 01 02 03 04 05 06 07 08 09 10 11 12
1995 base
2000 base
2005 base
2010 base
CY
y/y % chg.
Note: Less fresh food.
(2) Trimmed Mean and Laspeyres Chain Index
Notes: 1. Figures for the 10 percent trimmed mean are weighted averages of items; these items are obtained byrearranging year-on-year rates of price change in ascending order and then excluding items in both the upper and lower 10 percent tails by weight.
2. Figures for the Laspeyres chain index for 2006 are the year-on-year rates for the fixed-base method. The year-on-year figures for the Laspeyres chain index up to 2010 are on the 2005 base, and thosefrom 2011 onward are on the 2010 base.
Source: Ministry of Internal Affairs and Communications "Consumer Price Index "
-3.0
-2.5
-2.0
-1.5
-1.0
-0.5
0.0
0.5
1.0
1.5
2.0
2.5
0 6 0 7 0 8 0 9 1 0 1 1 1 2
CPI (10 percent trimmed mean)
CPI (Laspeyres chain index, less fresh food)
y/y % chg.
CY
-3
-2
-1
0
1
2
3
99 00 01 02 03 04 05 06 07 08 09 10 11 12
1995 base
2000 base
2005 base
2010 base
CY
y/y % chg.
Note: Less fresh food.
Source: Ministry of Internal Affairs and Communications, "Consumer Price Index."
-3.0
-2.5
-2.0
-1.5
-1.0
-0.5
0.0
0.5
1.0
1.5
2.0
2.5
0 6 0 7 0 8 0 9 1 0 1 1 1 2
CPI (10 percent trimmed mean)
CPI (Laspeyres chain index, less fresh food)
y/y % chg.
CY
-3
-2
-1
0
1
2
3
99 00 01 02 03 04 05 06 07 08 09 10 11 12
1995 base
2000 base
2005 base
2010 base
CY
y/y % chg.
Note: Less fresh food.

Chart 13
(1) Ratio of Increasing and Decreasing Items
(2) Goods Prices Facing Consumers
Consumer Price Index (2)
y/y % chg
20
30
40
50
60
70
80
-50
-40
-30
-20
-10
0
10
20
30
40
50
0 6 0 7 0 8 0 9 1 0 1 1 1 2
Ratio of increasing items - ratio of decreasing items (left scale)Ratio of increasing items (right scale)Ratio of decreasing items (right scale)
CY
% points %
2010 base CPI
Note: Proportion of items whose year-on-year rates of price change increased/decreased. CPI less fresh food.
-8
-6
-4
-2
0
2
4
6
8
91 92 93 94 95 96 97 98 99 00 01 02 03 04 05 06 07 08 09 10 11 12
Purchase-unit-base prices
CPI-base prices
y/y % chg.
CY
20
30
40
50
60
70
80
-50
-40
-30
-20
-10
0
10
20
30
40
50
0 6 0 7 0 8 0 9 1 0 1 1 1 2
Ratio of increasing items - ratio of decreasing items (left scale)Ratio of increasing items (right scale)Ratio of decreasing items (right scale)
CY
% points %
2010 base CPI
Notes: 1. Figures are the weighted average of the items of food products, agricultural, aquatic & livestock products (less freshfood), clothes, durable goods, and other goods that are continuously available in both the CPI and the "Family Income and Expenditure Survey."
Notes: 2. Definitions of the items are basically the same as those published by the Ministry of Internal Affairs and Communications.
Notes: 3. Other goods exclude clothes (including shirts, sweaters & underwear); food products; agricultural & aquatic products; durable goods; petroleum products; and electricity, gas & water charges.
Notes: 4. Figures for 2012/Q1 are January-February averages.Source: Ministry of Internal Affairs and Communications, "Consumer Price Index,"Source: "Family Income and Expenditure Survey."
Note: Proportion of items whose year-on-year rates of price change increased/decreased. CPI less fresh food.

Chart 14
(1) Consumer Price Index (Less Fresh Food)
(2) Goods (Less Agricultural, Aquatic & Livestock Products)1
Consumer Price Index (3)
-3
-2
-1
0
1
2
3
9 9 0 0 0 1 0 2 0 3 0 4 0 5 0 6 0 7 0 8 0 9 1 0 1 1 12
Goods (less agricultural, aquatic & livestock products)General servicesAgricultural, aquatic & livestock products (less fresh food)Public services and electricity, manufactured & piped gas & water chargesCPI (less food and energy)CPI (less fresh food)
2000 base CPI
y/y % chg.
2
2005 base CPI
1
2010 base CPI
0
2
4
6y/y % chg.
2005 base CPI2000 base CPI 2010 base CPI
CY
(3) General Services
-3
-2
-1
0
1
2
3
9 9 0 0 0 1 0 2 0 3 0 4 0 5 0 6 0 7 0 8 0 9 1 0 1 1 12
Goods (less agricultural, aquatic & livestock products)General servicesAgricultural, aquatic & livestock products (less fresh food)Public services and electricity, manufactured & piped gas & water chargesCPI (less food and energy)CPI (less fresh food)
2000 base CPI
y/y % chg.
2
2005 base CPI
1
2010 base CPI
-6
-4
-2
0
2
4
6
9 9 0 0 0 1 0 2 0 3 0 4 0 5 0 6 0 7 0 8 0 9 1 0 1 1 12
Petroleum products Durable goodsClothes Food productsOthers Goods
y/y % chg.
2005 base CPI2000 base CPI
1,4
3
2010 base CPI
-0.8
-0.6
-0.4
-0.2
0.0
0.2
0.4
0.6
0.8
1.0
9 9 0 0 0 1 0 2 0 3 0 4 0 5 0 6 0 7 0 8 0 9 1 0 1 1 12
House rent, private & imputed rent Other services
Meals outside the home General services
2005 base CPI2000 base CPI
y/y % chg.
2010 base CPI
Notes: 1. The items are basically the same as those defined by the Ministry of Internal Affairs and Communications.However, electricity, manufactured & piped gas & water charges are excluded from goods.
2. Alcoholic beverages are excluded from food. 3. Including shirts, sweaters & underwear.4. Less agricultural, aquatic & livestock products.5. The year-on-year rates of change other than those of the CPI (less fresh food), CPI (less food and energy), and
General services are calculated using published indices.
Source: Ministry of Internal Affairs and Communications, "Consumer Price Index."
CY
CY
CY-3
-2
-1
0
1
2
3
9 9 0 0 0 1 0 2 0 3 0 4 0 5 0 6 0 7 0 8 0 9 1 0 1 1 12
Goods (less agricultural, aquatic & livestock products)General servicesAgricultural, aquatic & livestock products (less fresh food)Public services and electricity, manufactured & piped gas & water chargesCPI (less food and energy)CPI (less fresh food)
2000 base CPI
y/y % chg.
2
2005 base CPI
1
2010 base CPI
-6
-4
-2
0
2
4
6
9 9 0 0 0 1 0 2 0 3 0 4 0 5 0 6 0 7 0 8 0 9 1 0 1 1 12
Petroleum products Durable goodsClothes Food productsOthers Goods
y/y % chg.
2005 base CPI2000 base CPI
1,4
3
2010 base CPI
-0.8
-0.6
-0.4
-0.2
0.0
0.2
0.4
0.6
0.8
1.0
9 9 0 0 0 1 0 2 0 3 0 4 0 5 0 6 0 7 0 8 0 9 1 0 1 1 12
House rent, private & imputed rent Other services
Meals outside the home General services
2005 base CPI2000 base CPI
y/y % chg.
2010 base CPI
Notes: 1. The items are basically the same as those defined by the Ministry of Internal Affairs and Communications.However, electricity, manufactured & piped gas & water charges are excluded from goods.
2. Alcoholic beverages are excluded from food. 3. Including shirts, sweaters & underwear.4. Less agricultural, aquatic & livestock products.5. The year-on-year rates of change other than those of the CPI (less fresh food), CPI (less food and energy), and
General services are calculated using published indices.
Source: Ministry of Internal Affairs and Communications, "Consumer Price Index."
CY
CY
CY

Chart 15
(1) 5-Year Sovereign CDS Premiums
Note: The CDS premium for Greece has been discontinued due to the decrease in market trades.
(2) Spreads for European Government Bonds
Notes: 1. The spreads for government bonds are the yield spreads for 10-year government bonds issued by
European countries minus those issued by Germany.
2. The spreads for Irish bonds after October 12, 2011 were calculated using 9-year government bonds
due to the suspension of market issuance since October 2010.
3. The spreads for Greek bonds narrowed significantly after the restructuring of government debt on
March 12, 2012.
Source: Bloomberg.
Sovereign Risk Premiums
0
5
10
15
20
25
30
35
40
45
50
55
9 1 5 9 1 5 9 1 5 9 1
Greece
Portugal
Ireland
Spain
Italy
%
08/ 09/ 10/ 11/ 12/
0
6
12
18
24
30
36
9 1 5 9 1 5 9 1 5 9 1
Greece
Portugal
Ireland
Spain
Italy
08/ 09/ 10/ 11/
%
12/
Introduction of the 36-month
LTRO by the ECB

Chart 16
(1) Stock Prices in the United States (S&P500)
(2) Stock Prices in Europe (EURO STOXX)
(3) Implied Volatility of Stock Prices in the United States (VIX Index)
Source: Bloomberg.
Stock Prices in the United States and Europe, and Volatility
40
50
60
70
80
90
100
110
00 01 02 03 04 05 06 07 08 09 10 11 12
end of month, end of CY1999=100
CY
Introduction of the 36-month
LTRO by the ECB
40
50
60
70
80
90
100
110
00 01 02 03 04 05 06 07 08 09 10 11 12
end of month, end of CY1999=100
CY
Introduction of the 36-month
LTRO by the ECB
0
10
20
30
40
50
60
70
00 01 02 03 04 05 06 07 08 09 10 11 12CY
end of month, points
Introduction of the
36-month LTRO
by the ECB

Chart 17
(1) Yen/U.S. Dollar and Yen/Euro
(2) Rates of Change in Individual Currencies against the U.S. Dollar (Since the Beginning of 2011)
(3) Real Effective Exchange Rate
Note: The real effective exchange rates are based on the broad indices of the BIS effective exchange rate.
Sources: Bank for International Settlements; Bank of Japan; Bloomberg.
Exchange Rates
70
80
90
100
110
120
130
03 04 05 06 07 08 09 10 11 12
Yen
U.S. dollar
Euro
CY
Introduction of the 36-month
LTRO by the ECB
reversed, monthly avg., CY 2010=100
Depreciation
70
80
90
100
110
120
130
140
150
160
170
03 04 05 06 07 08 09 10 11 12
Yen/U.S. dollar
Yen/euro
Depreciation
of the yen
Appreciation
of the yen
CY
Introduction of the 36-month
LTRO by the ECB
yen/U.S. dollar, yen/euro, monthly avg.
Appreciation
Euro
Indian
rupeeBrazilian
real
Korean
won
Canadian
dollar Australian
dollarBritish
pound sterling
Swiss
franc
Chinese
yuan
New Zealand
dollar
Yen
-10
-5
0
5
10
15
20
25
Beginning of 2011 → End of 2011
Beginning of 2012 → Recent
Beginning of 2011 → Recent
%
Appreciation
(Depreciation of the U.S. dollar)
Depreciation
(Appreciation of the U.S. dollar)

Chart 18
(1) Credit Spreads for Yen-, Dollar-, and Euro-Denominated Term Instruments
Note:
(3-month).
(2) Credit Spreads for Corporate Bonds in Major Economies
Notes: 1. The credit spreads for corporate bonds (rated A) are the corporate bond yields minus the government
bond yields. The indicated ratings of corporate bonds in Japan are of R&I, and those in the United States
and the euro area are of Moody's, S&P, and Fitch.
2. For the issuance spread, see Chart 23.
3. The credit spread in Japan fluctuated significantly because of a change in the credit rating of some firms
with wide spreads.
Sources: Japan Securities Dealers Association; Capital Eye Ltd.; I-N Information Systems; Bloomberg.
Credit Spreads in Financial Markets of Major Economies
The credit spreads for term instruments are Libor (3-month) minus yields on overnight index swaps
0
1
2
3
4
5
6
7
07 08 09 10 11 12
Japan (issuance spread)
Japan (5-year)
United States (3- to 5-year)
Euro area (3- to 5-year)
CY
%
Introduction of the 36-month
LTRO by the ECB
0.0
0.5
1.0
1.5
2.0
2.5
3.0
3.5
4.0
07 08 09 10 11 12
Yen
U.S. dollar
Euro
%
CY
Introduction of the 36-month
LTRO by the ECB

Chart 19
(1) Advanced Economies
Policy Interest Rates
7 %
4
5
6
7
Japan
United States
Euro area
United Kingdom
%
2
3
4
5
6
7
Japan
United States
Euro area
United Kingdom
%
0
1
2
3
4
5
6
7
07 08 09 10 11 12
Japan
United States
Euro area
United Kingdom
%
CY
Note: In the United States, from December 16, 2008, the target range for the federal funds rate is 0 to 0.25 percentand the interest rate applied to reserve balances is 0.25 percent. In Japan, from October 5, 2010, the Bankof Japan has encouraged the uncollateralized overnight call rate to remain at around 0 to 0.1 percent and the interest rate applied to the complementary deposit facility is 0.1 percent.
(2) Emerging and Commodity-Exporting Economies
18 %
0
1
2
3
4
5
6
7
07 08 09 10 11 12
Japan
United States
Euro area
United Kingdom
%
CY
10
12
14
16
18
China India Brazil
Australia Korea
%
0
1
2
3
4
5
6
7
07 08 09 10 11 12
Japan
United States
Euro area
United Kingdom
%
CY
4
6
8
10
12
14
16
18
China India Brazil
Australia Korea
%
0
1
2
3
4
5
6
7
07 08 09 10 11 12
Japan
United States
Euro area
United Kingdom
%
CY
Sources: Bank of Japan; Bloomberg.
0
2
4
6
8
10
12
14
16
18
07 08 09 10 11 12
China India Brazil
Australia Korea
%
CY
0
1
2
3
4
5
6
7
07 08 09 10 11 12
Japan
United States
Euro area
United Kingdom
%
CY
p ; g
0
2
4
6
8
10
12
14
16
18
07 08 09 10 11 12
China India Brazil
Australia Korea
%
CY
0
1
2
3
4
5
6
7
07 08 09 10 11 12
Japan
United States
Euro area
United Kingdom
%
CY

Chart 20
(1) Short-Term Interest Rates
(2) Dollar Funding Premiums through Foreign Exchange Swaps
Note: Rates for funding the U.S. dollar from the yen or the euro minus 3-month dollar LIBOR.
(3) Japanese Yen OIS Rates
Note: 2- and 3-year Japanese yen OIS rates lack some data partly due to low trading volumes.
Sources: Bank of Japan; Bloomberg.
Short-Term Interest Rates
-0.8
-0.4
0.0
0.4
0.8
1.2
1.6
2.0
2.4
2.8
3.2
03 04 05 06 07 08 09 10 11 12
U.S. dollar/yen
Euro/yen
Reduction of interest
rates on the fixed-rate
U.S. dollar funds-
supplying operations
%
CY
-0.1
0.0
0.1
0.2
0.3
0.4
0.5
0.6
0.7
0.8
0.9
1.0
03 04 05 06 07 08 09 10 11 12
Call rate (overnight, uncollateralized)
Tibor (3-month)
T-bill rate (3-month)
T-bill rate (1-year)
CY
%
0.0
0.2
0.4
0.6
0.8
1.0
1.2
03 04 05 06 07 08 09 10 11 12
1-year
2-year
3-year
%
CY

Chart 21
(1) Government Bond Yields
(2) Long-Term Interest Rates in Major Countries (10-Year Government Bond Yields)
Long-Term Interest Rates
Source: Bloomberg.
0
1
2
3
4
5
6
7
98 99 00 01 02 03 04 05 06 07 08 09 10 11 12
Japan
United States
Germany
%
CY
0.0
0.5
1.0
1.5
2.0
2.5
3.0
98 99 00 01 02 03 04 05 06 07 08 09 10 11 12
10-year JGBs
5-year JGBs
2-year JGBs
%
CY
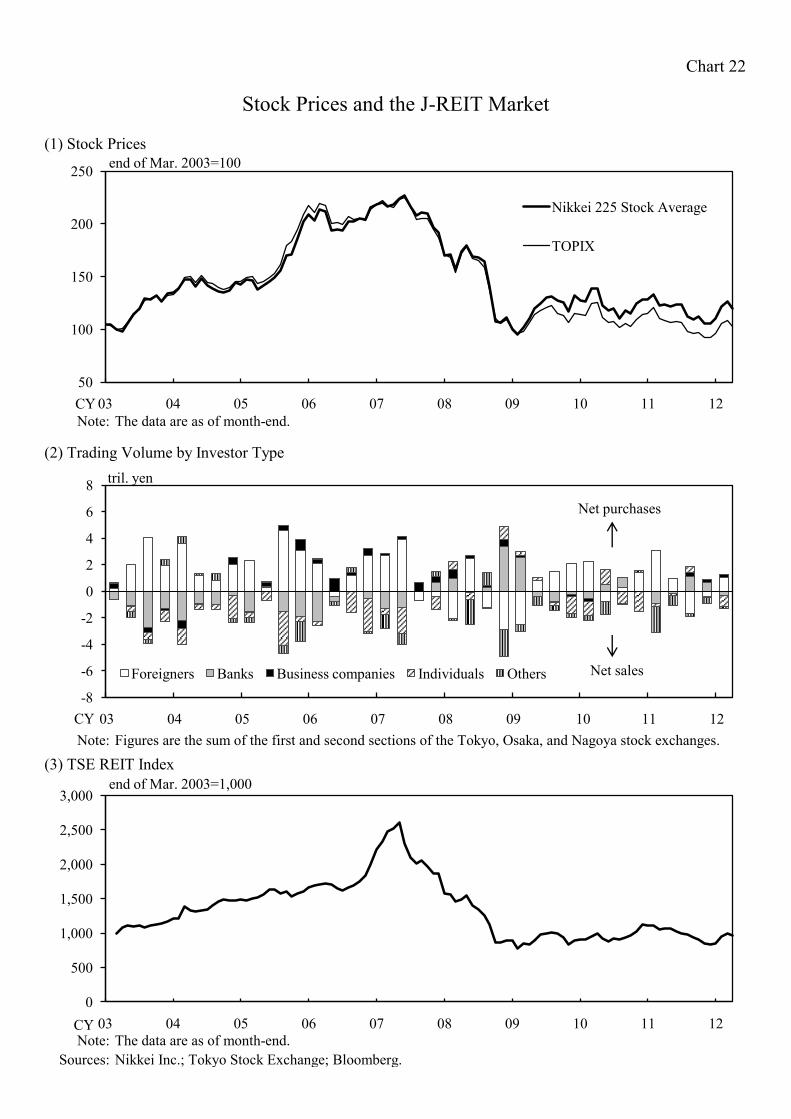
Chart 22
(1) Stock Prices
Note: The data are as of month-end.
(2) Trading Volume by Investor Type
Note: Figures are the sum of the first and second sections of the Tokyo, Osaka, and Nagoya stock exchanges.
(3) TSE REIT Index
Note: The data are as of month-end.
Sources: Nikkei Inc.; Tokyo Stock Exchange; Bloomberg.
Stock Prices and the J-REIT Market
50
100
150
200
250
03 04 05 06 07 08 09 10 11 12
Nikkei 225 Stock Average
TOPIX
end of Mar. 2003=100
CY
-8
-6
-4
-2
0
2
4
6
8
03 04 05 06 07 08 09 10 11 12
Foreigners Banks Business companies Individuals Others
tril. yen
Net purchases
Net sales
CY
0
500
1,000
1,500
2,000
2,500
3,000
03 04 05 06 07 08 09 10 11 12
end of Mar. 2003=1,000
CY

Chart 23
(1) Credit Spreads for CP
Spreads for CP and Corporate Bonds, and Bank Lending
1.2%
0.3
0.6
0.9
1.2%
Note: Figures up to September 2009 are the average issuance rate of CP (3-month, rated a-1 or higher) minusthe yield on treasury discount bills (3-month). Figures from October 2009 are the average issuance rate of CP (3-month, rated a-1) minus the yield on treasury discount bills (3-month).
0.0
0.3
0.6
0.9
1.2
CY 0 3 0 4 0 5 0 6 0 7 0 8 0 9 1 0 1 1 1 2
%
(2) Issuance Spreads for Corporate Bonds
0.0
0.3
0.6
0.9
1.2
CY 0 3 0 4 0 5 0 6 0 7 0 8 0 9 1 0 1 1 1 2
%
0.6
0.8
1.0
A
AA
AAA
six-month backward moving avg., %
Notes: 1. The issuance spreads for corporate bonds are the issuance rate of these bonds minus the government bond yield.
0.0
0.3
0.6
0.9
1.2
CY 0 3 0 4 0 5 0 6 0 7 0 8 0 9 1 0 1 1 1 2
%
0.0
0.2
0.4
0.6
0.8
1.0
CY 0 3 0 4 0 5 0 6 0 7 0 8 0 9 1 0 1 1 1 2
A
AA
AAA
six-month backward moving avg., %
Notes: 1. The issuance spreads for corporate bonds are the issuance rate of these bonds minus the government bond yield.2. Figures are the average of all maturities issued in domestic markets, based on the launch date. 3. Bonds issued by banks and securities companies, etc., are excluded.4. Bonds are classified by the highest ratings among Moody's, S&P, R&I, and JCR.
(3) Average Contracted Interest Rates on New Loans and Discounts
0.0
0.3
0.6
0.9
1.2
CY 0 3 0 4 0 5 0 6 0 7 0 8 0 9 1 0 1 1 1 2
%
0.0
0.2
0.4
0.6
0.8
1.0
CY 0 3 0 4 0 5 0 6 0 7 0 8 0 9 1 0 1 1 1 2
A
AA
AAA
six-month backward moving avg., %
1.9six-month backward moving avg., %
0.0
0.3
0.6
0.9
1.2
CY 0 3 0 4 0 5 0 6 0 7 0 8 0 9 1 0 1 1 1 2
%
0.0
0.2
0.4
0.6
0.8
1.0
CY 0 3 0 4 0 5 0 6 0 7 0 8 0 9 1 0 1 1 1 2
A
AA
AAA
six-month backward moving avg., %
1.1
1.3
1.5
1.7
1.9
Short-term
Long-term
six-month backward moving avg., %
Sources: Bank of Japan, "Average Yields on Newly Issued Domestic Commercial Paper," "Average Contracted Interest Rates on New Loans and Discounts"; Japan Securities Depository Center; Capital Eye, Ltd.; I-N Information Systems; Bloomberg.
0.0
0.3
0.6
0.9
1.2
CY 0 3 0 4 0 5 0 6 0 7 0 8 0 9 1 0 1 1 1 2
%
0.0
0.2
0.4
0.6
0.8
1.0
CY 0 3 0 4 0 5 0 6 0 7 0 8 0 9 1 0 1 1 1 2
A
AA
AAA
six-month backward moving avg., %
0.9
1.1
1.3
1.5
1.7
1.9
CY 0 3 0 4 0 5 0 6 0 7 0 8 0 9 1 0 1 1 1 2
Short-term
Long-term
six-month backward moving avg., %

Chart 24
(1) Short-Term Real Interest Rate and Potential Growth Rate
Interest Rates and Economic Activity
6
7%
2
3
4
5
6
7
Short-term real interest rate (a)
Short-term real interest rate (b)
Potential growth rate (y/y % chg.)
%
-2
-1
0
1
2
3
4
5
6
7
Short-term real interest rate (a)
Short-term real interest rate (b)
Potential growth rate (y/y % chg.)
%
Notes: 1. Short-term real interest rate (a) = call rate (overnight, uncollateralized) - year-on-year percentage change in the CPI (all items less fresh food)
2. Short-term real interest rate (b) = call rate (overnight, uncollateralized) - year-on-year percentage change in the CPI (all items less food [alcoholic beverages are excluded from food] and energy)
3. Figures for the CPI are adjusted to exclude the effects of changes in the consumption tax rate. From 2001/Q1,
-2
-1
0
1
2
3
4
5
6
7
85 86 87 88 89 90 91 92 93 94 95 96 97 98 99 00 01 02 03 04 05 06 07 08 09 10 1112
Short-term real interest rate (a)
Short-term real interest rate (b)
Potential growth rate (y/y % chg.)
%
CY
high school fees are excluded.4. The potential growth rate is estimated by the Research and Statistics Department, Bank of Japan.
(2) ROA and Paid Interest Rate
6
7
8
ROA (operating profits/total assets)
Paid interest rate (interest expense/interest bearing debt)
-2
-1
0
1
2
3
4
5
6
7
85 86 87 88 89 90 91 92 93 94 95 96 97 98 99 00 01 02 03 04 05 06 07 08 09 10 1112
Short-term real interest rate (a)
Short-term real interest rate (b)
Potential growth rate (y/y % chg.)
%
CY
s.a., %
3
4
5
6
7
8
ROA (operating profits/total assets)
Paid interest rate (interest expense/interest-bearing debt)
-2
-1
0
1
2
3
4
5
6
7
85 86 87 88 89 90 91 92 93 94 95 96 97 98 99 00 01 02 03 04 05 06 07 08 09 10 1112
Short-term real interest rate (a)
Short-term real interest rate (b)
Potential growth rate (y/y % chg.)
%
CY
s.a., %
0
1
2
3
4
5
6
7
8
85 86 87 88 89 90 91 92 93 94 95 96 97 98 99 00 01 02 03 04 05 06 07 08 09 10 11
ROA (operating profits/total assets)
Paid interest rate (interest expense/interest-bearing debt)
-2
-1
0
1
2
3
4
5
6
7
85 86 87 88 89 90 91 92 93 94 95 96 97 98 99 00 01 02 03 04 05 06 07 08 09 10 1112
Short-term real interest rate (a)
Short-term real interest rate (b)
Potential growth rate (y/y % chg.)
%
CY
s.a., %
CY
Notes: 1. Figures are taken from the "Financial Statements Statistics of Corporations by Industry, Quarterly," and are based on all-size enterprises and all industries. Finance and insurance are excluded.
2. Interest-bearing debt is the sum of long- and short-term borrowings, corporate bonds, and bills receivable discounted outstanding.
Sources: Ministry of Internal Affairs and Communications, "Consumer Price Index";Ministry of Finance, "Financial Statements Statistics of Corporations by Industry, Quarterly"; Bank of Japan.
0
1
2
3
4
5
6
7
8
85 86 87 88 89 90 91 92 93 94 95 96 97 98 99 00 01 02 03 04 05 06 07 08 09 10 11
ROA (operating profits/total assets)
Paid interest rate (interest expense/interest-bearing debt)
-2
-1
0
1
2
3
4
5
6
7
85 86 87 88 89 90 91 92 93 94 95 96 97 98 99 00 01 02 03 04 05 06 07 08 09 10 1112
Short-term real interest rate (a)
Short-term real interest rate (b)
Potential growth rate (y/y % chg.)
%
CY
s.a., %
CY
0
1
2
3
4
5
6
7
8
85 86 87 88 89 90 91 92 93 94 95 96 97 98 99 00 01 02 03 04 05 06 07 08 09 10 11
ROA (operating profits/total assets)
Paid interest rate (interest expense/interest-bearing debt)
-2
-1
0
1
2
3
4
5
6
7
85 86 87 88 89 90 91 92 93 94 95 96 97 98 99 00 01 02 03 04 05 06 07 08 09 10 1112
Short-term real interest rate (a)
Short-term real interest rate (b)
Potential growth rate (y/y % chg.)
%
CY
s.a., %
CY

Chart 25
(1) Lending Attitude of Financial Institutions as Perceived by Firms (a) Tankan (b) Other Surveys
Corporate Finance-Related Indicators
6040DI, % pointsDI ("accommodative" - "severe"), % points
20
30
40
50
60 Small enterprises (JFC survey, "accommodative" - "severe")
Micro businesses (JFC survey, "more accommodative" - "more severe")
10
20
30
40DI, % pointsDI ("accommodative" - "severe"), % points
-20
-10
0
10
20
30
40
50
60 Small enterprises (JFC survey, "accommodative" - "severe")
Micro businesses (JFC survey, "more accommodative" - "more severe")
-30
-20
-10
0
10
20
30
40
Large enterprises
DI, % pointsDI ("accommodative" - "severe"), % points
(2) Financial Position (a) Tankan (b) Other Surveys
-40
-30
-20
-10
0
10
20
30
40
50
60
90 92 94 96 98 00 02 04 06 08 10 12
Small enterprises (JFC survey, "accommodative" - "severe")
Micro businesses (JFC survey, "more accommodative" - "more severe")
2030
-40
-30
-20
-10
0
10
20
30
40
90 92 94 96 98 00 02 04 06 08 10 12
Large enterprises
Small enterprises
DI ("easy" - "tight"), % points DI, % points
DI, % points
CY
DI ("accommodative" - "severe"), % points
CY-40
-30
-20
-10
0
10
20
30
40
50
60
90 92 94 96 98 00 02 04 06 08 10 12
Small enterprises (JFC survey, "accommodative" - "severe")
Micro businesses (JFC survey, "more accommodative" - "more severe")
0
10
20Small enterprises (JFC survey, "easy" - "tight")
Small enterprises (Shoko Chukin Bank survey, "easier" - "tighter")Micro businesses (JFC survey, "easier" - "tighter")
10
20
30
Large enterprises
Small enterprises
-40
-30
-20
-10
0
10
20
30
40
90 92 94 96 98 00 02 04 06 08 10 12
Large enterprises
Small enterprises
DI ("easy" - "tight"), % points DI, % points
DI, % points
CY
DI ("accommodative" - "severe"), % points
CY-40
-30
-20
-10
0
10
20
30
40
50
60
90 92 94 96 98 00 02 04 06 08 10 12
Small enterprises (JFC survey, "accommodative" - "severe")
Micro businesses (JFC survey, "more accommodative" - "more severe")
-30
-20
-10
0
10
20Small enterprises (JFC survey, "easy" - "tight")
Small enterprises (Shoko Chukin Bank survey, "easier" - "tighter")Micro businesses (JFC survey, "easier" - "tighter")
-10
0
10
20
30
Large enterprises
Small enterprises
-40
-30
-20
-10
0
10
20
30
40
90 92 94 96 98 00 02 04 06 08 10 12
Large enterprises
Small enterprises
DI ("easy" - "tight"), % points DI, % points
DI, % points
CY
DI ("accommodative" - "severe"), % points
CY
N t D t f th "T k " b d ll i d t i Th "T k " i d f th M h 2004
-40
-30
-20
-10
0
10
20
30
40
50
60
90 92 94 96 98 00 02 04 06 08 10 12
Small enterprises (JFC survey, "accommodative" - "severe")
Micro businesses (JFC survey, "more accommodative" - "more severe")
-50
-40
-30
-20
-10
0
10
20
90 92 94 96 98 00 02 04 06 08 10 12
Small enterprises (JFC survey, "easy" - "tight")
Small enterprises (Shoko Chukin Bank survey, "easier" - "tighter")Micro businesses (JFC survey, "easier" - "tighter")
-30
-20
-10
0
10
20
30
90 92 94 96 98 00 02 04 06 08 10 12
Large enterprises
Small enterprises
-40
-30
-20
-10
0
10
20
30
40
90 92 94 96 98 00 02 04 06 08 10 12
Large enterprises
Small enterprises
DI ("easy" - "tight"), % points
CY
DI, % points
CY
DI, % points
CY
DI ("accommodative" - "severe"), % points
CY
Note: Data of the "Tankan" are based on all industries. The "Tankan" was revised from the March 2004survey. Figures up to the December 2003 survey are based on the previous data sets. Figures from theDecember 2003 survey are on the new basis. Broken lines are the averages since 2000.
Sources: Bank of Japan, "Tankan, Short-Term Economic Survey of Enterprises in Japan";Shoko Chukin Bank, Ltd., "Business Survey Index for Small and Medium-Sized Businesses";Japan Finance Corporation (JFC), "Monthly Survey of Small Businesses in Japan," "Quarterly Surveyof Small Businesses in Japan (For Micro Businesses)."
-40
-30
-20
-10
0
10
20
30
40
50
60
90 92 94 96 98 00 02 04 06 08 10 12
Small enterprises (JFC survey, "accommodative" - "severe")
Micro businesses (JFC survey, "more accommodative" - "more severe")
-50
-40
-30
-20
-10
0
10
20
90 92 94 96 98 00 02 04 06 08 10 12
Small enterprises (JFC survey, "easy" - "tight")
Small enterprises (Shoko Chukin Bank survey, "easier" - "tighter")Micro businesses (JFC survey, "easier" - "tighter")
-30
-20
-10
0
10
20
30
90 92 94 96 98 00 02 04 06 08 10 12
Large enterprises
Small enterprises
-40
-30
-20
-10
0
10
20
30
40
90 92 94 96 98 00 02 04 06 08 10 12
Large enterprises
Small enterprises
DI ("easy" - "tight"), % points
CY
DI, % points
CY
DI, % points
CY
DI ("accommodative" - "severe"), % points
CY

Chart 26
(1) 2-year
(2) 5-year
Notes: 1. Credit ratings are those rated A. The indicated ratings in Japan are of R&I, and those in the United States
and the euro area are of Moody's, S&P, and Fitch.
2. Japan's yields declined after rising significantly following the Great East Japan Earthquake in March
2011, mainly reflecting the widening of spreads in some electric power companies and the abatement of
such effect due to the downgrading of their credit ratings.
Source: Bloomberg.
Interest Rates on Corporate Bonds
0
1
2
3
4
5
6
7
8
9
10
03 04 05 06 07 08 09 10 11 12
Japan
United States
Euro area
%
CY
0
1
2
3
4
5
6
7
8
9
10
03 04 05 06 07 08 09 10 11 12
Japan
United States
Euro area
%
CY

Chart 27
Bank Lending Practices
(1) Bank Lending to Large Firms
(2) Bank Lending to Small and Medium-Sized Firms
-100
-80
-60
-40
-20
0
20
40
-50
-40
-30
-20
-10
0
10
20
03 04 05 06 07 08 09 10 11 12
Japan (left scale)
United States (right scale)
Euro area (right scale)
% points % points
Easing
Tightening
CY
( ) g
Notes: 1. For the United States, (1) is based on large and medium-sized firms and (2) is based on small firms.2. Japan: "eased considerably" + 0.5 × "eased somewhat" - 0.5 × "tightened somewhat" -
"tightened considerably"3. United States and euro area: "eased considerably" + "eased somewhat" - "tightened somewhat" -
"tightened considerably"
Sources: Bank of Japan, "Senior Loan Officer Opinion Survey on Bank Lending Practices at Large Japanese Banks"; Federal Reserve Board; European Central Bank.
-100
-80
-60
-40
-20
0
20
40
-50
-40
-30
-20
-10
0
10
20
03 04 05 06 07 08 09 10 11 12
Japan (left scale)
United States (right scale)
Euro area (right scale)
% points % points
Easing
Tightening
-100
-80
-60
-40
-20
0
20
40
60
-100
-80
-60
-40
-20
0
20
40
60
03 04 05 06 07 08 09 10 11 12
Japan
United States
Euro area
% points % points
Easing
Tightening
CY
CY
; p

Chart 28
(1) Lending by Domestic Commercial Banks
Amount Outstanding of Bank Lending, CP, and Corporate Bonds
4
6avg. amount outstanding, y/y % chg.
4
-2
0
2
4
6
Total of banks
City banks
avg. amount outstanding, y/y % chg.
Note: Fluctuations from liquidations of loans, loan write-offs, etc., are excluded.
(2) Amount Outstanding of CP
-6
-4
-2
0
2
4
6
CY 0 3 0 4 0 5 0 6 0 7 0 8 0 9 1 0 1 1 12
Total of banks
City banks
Total of regional banks and regional banks II
avg. amount outstanding, y/y % chg.
y/y % chg.
-6
-4
-2
0
2
4
6
CY 0 3 0 4 0 5 0 6 0 7 0 8 0 9 1 0 1 1 12
Total of banks
City banks
Total of regional banks and regional banks II
avg. amount outstanding, y/y % chg.
-20
-10
0
10
20y/y % chg.
Note: Figures are those of short-term corporate bonds registered under the book-entry transfer system. Those issuedby banks, securities companies and others such as foreign corporations are excluded; ABCP is included. Figures up to March 2008 are those compiled by the Bank of Japan
-6
-4
-2
0
2
4
6
CY 0 3 0 4 0 5 0 6 0 7 0 8 0 9 1 0 1 1 12
Total of banks
City banks
Total of regional banks and regional banks II
avg. amount outstanding, y/y % chg.
-40
-30
-20
-10
0
10
20
CY 0 3 0 4 0 5 0 6 0 7 0 8 0 9 1 0 1 1 12
y/y % chg.
Figures up to March 2008 are those compiled by the Bank of Japan.
(3) Amount Outstanding of Corporate Bonds
-6
-4
-2
0
2
4
6
CY 0 3 0 4 0 5 0 6 0 7 0 8 0 9 1 0 1 1 12
Total of banks
City banks
Total of regional banks and regional banks II
avg. amount outstanding, y/y % chg.
-40
-30
-20
-10
0
10
20
CY 0 3 0 4 0 5 0 6 0 7 0 8 0 9 1 0 1 1 12
y/y % chg.
4
6
8y/y % chg.
-6
-4
-2
0
2
4
6
CY 0 3 0 4 0 5 0 6 0 7 0 8 0 9 1 0 1 1 12
Total of banks
City banks
Total of regional banks and regional banks II
avg. amount outstanding, y/y % chg.
-40
-30
-20
-10
0
10
20
CY 0 3 0 4 0 5 0 6 0 7 0 8 0 9 1 0 1 1 12
y/y % chg.
-4
-2
0
2
4
6
8
CY 0 3 0 4 0 5 0 6 0 7 0 8 0 9 1 0 1 1 12
y/y % chg.
Note: Figures are calculated based on the sum of straight bonds issued in both domestic and overseas markets. Bonds issued by banks are included. Domestic bonds are those registered under the book-entry transfer system. The series is spliced at April 2008 with the one published by the Japan Securities Dealers Association.
Sources: Bank of Japan, "Principal Figures of Financial Institutions"; Japan Securities Depository Center;Japan Securities Dealers Association; I-N Information Systems.
-6
-4
-2
0
2
4
6
CY 0 3 0 4 0 5 0 6 0 7 0 8 0 9 1 0 1 1 12
Total of banks
City banks
Total of regional banks and regional banks II
avg. amount outstanding, y/y % chg.
-40
-30
-20
-10
0
10
20
CY 0 3 0 4 0 5 0 6 0 7 0 8 0 9 1 0 1 1 12
y/y % chg.
-4
-2
0
2
4
6
8
CY 0 3 0 4 0 5 0 6 0 7 0 8 0 9 1 0 1 1 12
y/y % chg.
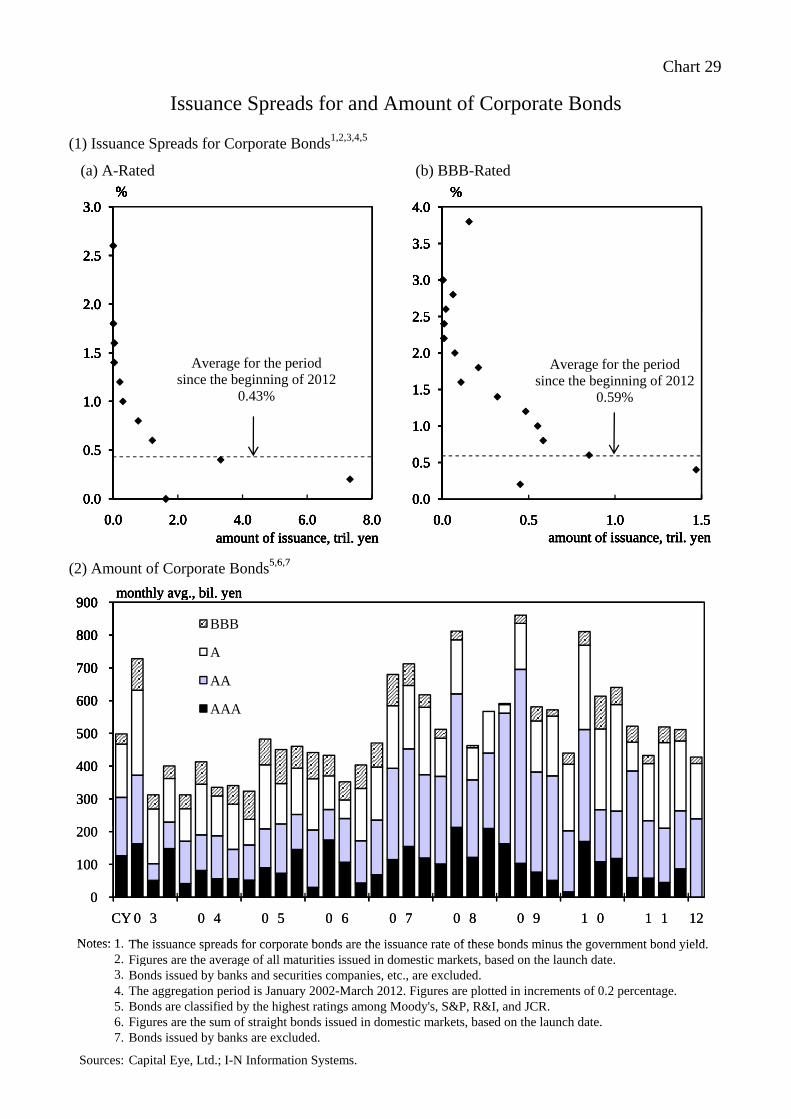
Chart 29
(1) Issuance Spreads for Corporate Bonds1,2,3,4,5
(a) A-Rated (b) BBB-Rated
Issuance Spreads for and Amount of Corporate Bonds
% %
2.0
2.5
3.0%
2 5
3.0
3.5
4.0%
1.0
1.5
2.0
2.5
3.0%
Average for the periodsince the beginning of 2012
0.43%
1.0
1.5
2.0
2.5
3.0
3.5
4.0
Average for the periodsince the beginning of 2012
0.59%
%
(2) A f C B d 5 6 7
0.0
0.5
1.0
1.5
2.0
2.5
3.0
0.0 2.0 4.0 6.0 8.0amount of issuance, tril. yen
%
Average for the periodsince the beginning of 2012
0.43%
0.0
0.5
1.0
1.5
2.0
2.5
3.0
3.5
4.0
0.0 0.5 1.0 1.5
Average for the periodsince the beginning of 2012
0.59%
amount of issuance, tril. yen
%
(2) Amount of Corporate Bonds5,6,7
600
700
800
900
BBB
A
AA
AAA
monthly avg., bil. yen
0.0
0.5
1.0
1.5
2.0
2.5
3.0
0.0 2.0 4.0 6.0 8.0amount of issuance, tril. yen
%
Average for the periodsince the beginning of 2012
0.43%
0.0
0.5
1.0
1.5
2.0
2.5
3.0
3.5
4.0
0.0 0.5 1.0 1.5
Average for the periodsince the beginning of 2012
0.59%
amount of issuance, tril. yen
%
300
400
500
600
700
800
900
BBB
A
AA
AAA
monthly avg., bil. yen
0.0
0.5
1.0
1.5
2.0
2.5
3.0
0.0 2.0 4.0 6.0 8.0amount of issuance, tril. yen
%
Average for the periodsince the beginning of 2012
0.43%
0.0
0.5
1.0
1.5
2.0
2.5
3.0
3.5
4.0
0.0 0.5 1.0 1.5
Average for the periodsince the beginning of 2012
0.59%
amount of issuance, tril. yen
%
Notes: 1 The issuance spreads for corporate bonds are the issuance rate of these bonds minus the government bond yield
0
100
200
300
400
500
600
700
800
900
CY 0 3 0 4 0 5 0 6 0 7 0 8 0 9 1 0 1 1 12
BBB
A
AA
AAA
monthly avg., bil. yen
0.0
0.5
1.0
1.5
2.0
2.5
3.0
0.0 2.0 4.0 6.0 8.0amount of issuance, tril. yen
%
Average for the periodsince the beginning of 2012
0.43%
0.0
0.5
1.0
1.5
2.0
2.5
3.0
3.5
4.0
0.0 0.5 1.0 1.5
Average for the periodsince the beginning of 2012
0.59%
amount of issuance, tril. yen
%
Notes: 1. The issuance spreads for corporate bonds are the issuance rate of these bonds minus the government bond yield.2. Figures are the average of all maturities issued in domestic markets, based on the launch date. 3. Bonds issued by banks and securities companies, etc., are excluded.4. The aggregation period is January 2002-March 2012. Figures are plotted in increments of 0.2 percentage. 5. Bonds are classified by the highest ratings among Moody's, S&P, R&I, and JCR.6. Figures are the sum of straight bonds issued in domestic markets, based on the launch date.7. Bonds issued by banks are excluded.
Sources: Capital Eye, Ltd.; I-N Information Systems.
0
100
200
300
400
500
600
700
800
900
CY 0 3 0 4 0 5 0 6 0 7 0 8 0 9 1 0 1 1 12
BBB
A
AA
AAA
monthly avg., bil. yen
0.0
0.5
1.0
1.5
2.0
2.5
3.0
0.0 2.0 4.0 6.0 8.0amount of issuance, tril. yen
%
Average for the periodsince the beginning of 2012
0.43%
0.0
0.5
1.0
1.5
2.0
2.5
3.0
3.5
4.0
0.0 0.5 1.0 1.5
Average for the periodsince the beginning of 2012
0.59%
amount of issuance, tril. yen
%

Chart 30
(1) Monetary Base
Monetary Base and Money Stock
2840
Ratio to nominal GDP (right scale)
% %
20
22
24
26
28
10
20
30
40
Ratio to nominal GDP (right scale)
Year-on-year percentage change (left scale)
% %
14
16
18
20
22
24
26
28
-10
0
10
20
30
40
Ratio to nominal GDP (right scale)
Year-on-year percentage change (left scale)
% %
Note: Figures for nominal GDP for 2012/Q1 are those for 2011/Q4.
10
12
14
16
18
20
22
24
26
28
-30
-20
-10
0
10
20
30
40
98 99 00 01 02 03 04 05 06 07 08 09 10 11 12
Ratio to nominal GDP (right scale)
Year-on-year percentage change (left scale)
%
CY
%
(2) Money Stock
5
6
M2
y/y % chg.
1
10
12
14
16
18
20
22
24
26
28
-30
-20
-10
0
10
20
30
40
98 99 00 01 02 03 04 05 06 07 08 09 10 11 12
Ratio to nominal GDP (right scale)
Year-on-year percentage change (left scale)
%
CY
%
2
3
4
5
6
M2
M3
y/y % chg.
2
1
10
12
14
16
18
20
22
24
26
28
-30
-20
-10
0
10
20
30
40
98 99 00 01 02 03 04 05 06 07 08 09 10 11 12
Ratio to nominal GDP (right scale)
Year-on-year percentage change (left scale)
%
CY
%
0
1
2
3
4
5
6
M2
M3
y/y % chg.
2
1
10
12
14
16
18
20
22
24
26
28
-30
-20
-10
0
10
20
30
40
98 99 00 01 02 03 04 05 06 07 08 09 10 11 12
Ratio to nominal GDP (right scale)
Year-on-year percentage change (left scale)
%
CY
%
Notes: 1. Figures for M2 up to March 2004 are the former series of the figures for M2+CDs.2. Figures for M3 up to March 2004 are the former series of the figures for M3+CDs minus
the figures for pecuniary trusts.Sources: Cabinet Office, "National Accounts"; Bank of Japan, "Monetary Base," "Money Stock."
-1
0
1
2
3
4
5
6
98 99 00 01 02 03 04 05 06 07 08 09 10 11 12
M2
M3
y/y % chg.
2
1
CY
10
12
14
16
18
20
22
24
26
28
-30
-20
-10
0
10
20
30
40
98 99 00 01 02 03 04 05 06 07 08 09 10 11 12
Ratio to nominal GDP (right scale)
Year-on-year percentage change (left scale)
%
CY
%
, ; p , y , y

Chart 31
(1) Public Notice of Land Prices
( ) R id ti l L d (b) C i l L d
Land Prices
(a) Residential Land (b) Commercial Land
5
10
15
20
25NationwideThree metropolitan areasOther areasTokyo
5
10
15
20
25NationwideThree metropolitan areasOther areasTokyo
y/y % chg. y/y % chg.
-20
-15
-10
-5
0
5
10
15
20
25NationwideThree metropolitan areasOther areasTokyo
-20
-15
-10
-5
0
5
10
15
20
25NationwideThree metropolitan areasOther areasTokyo
y/y % chg. y/y % chg.
Notes: 1. Figures are as of January 1.2 Three metropolitan areas: the Tokyo area (Tokyo Kanagawa Saitama Chiba and Ibaraki prefectures)
-30
-25
-20
-15
-10
-5
0
5
10
15
20
25
CY90 92 94 96 98 00 02 04 06 08 10 12
NationwideThree metropolitan areasOther areasTokyo
-30
-25
-20
-15
-10
-5
0
5
10
15
20
25
CY9092 94 96 98 00 02 04 06 08 10 12
NationwideThree metropolitan areasOther areasTokyo
y/y % chg. y/y % chg.
2. Three metropolitan areas: the Tokyo area (Tokyo, Kanagawa, Saitama, Chiba, and Ibaraki prefectures), the Osaka area (Osaka, Hyogo, Kyoto, and Nara prefectures), and the Nagoya area (Aichi and Mieprefectures). Other areas: other than the three metropolitan areas.
(2) Land Prices in the 23 Wards of Tokyo
-30
-25
-20
-15
-10
-5
0
5
10
15
20
25
CY90 92 94 96 98 00 02 04 06 08 10 12
NationwideThree metropolitan areasOther areasTokyo
-30
-25
-20
-15
-10
-5
0
5
10
15
20
25
CY9092 94 96 98 00 02 04 06 08 10 12
NationwideThree metropolitan areasOther areasTokyo
10
12
C i l l d
y/y % chg. y/y % chg.
six-month % chg.
-30
-25
-20
-15
-10
-5
0
5
10
15
20
25
CY90 92 94 96 98 00 02 04 06 08 10 12
NationwideThree metropolitan areasOther areasTokyo
-30
-25
-20
-15
-10
-5
0
5
10
15
20
25
CY9092 94 96 98 00 02 04 06 08 10 12
NationwideThree metropolitan areasOther areasTokyo
0
2
4
6
8
10
12
Commercial land
Residential land
y/y % chg. y/y % chg.
six-month % chg.
-30
-25
-20
-15
-10
-5
0
5
10
15
20
25
CY90 92 94 96 98 00 02 04 06 08 10 12
NationwideThree metropolitan areasOther areasTokyo
-30
-25
-20
-15
-10
-5
0
5
10
15
20
25
CY9092 94 96 98 00 02 04 06 08 10 12
NationwideThree metropolitan areasOther areasTokyo
-8
-6
-4
-2
0
2
4
6
8
10
12
CY01 02 03 04 05 06 07 08 09 10 11 12
Commercial land
Residential land
y/y % chg. y/y % chg.
six-month % chg.
Note: Figures are six-month percentage changes in land prices available in both "Public Notice of Land Prices"and "Land Price Survey by Prefectural Governments" (residential: 45 points; commercial: 34 points).
Source: Ministry of Land, Infrastructure, Transport and Tourism, "Public Notice of Land Prices,""Land Price Survey by Prefectural Governments."
-30
-25
-20
-15
-10
-5
0
5
10
15
20
25
CY90 92 94 96 98 00 02 04 06 08 10 12
NationwideThree metropolitan areasOther areasTokyo
-30
-25
-20
-15
-10
-5
0
5
10
15
20
25
CY9092 94 96 98 00 02 04 06 08 10 12
NationwideThree metropolitan areasOther areasTokyo
-8
-6
-4
-2
0
2
4
6
8
10
12
CY01 02 03 04 05 06 07 08 09 10 11 12
Commercial land
Residential land
y/y % chg. y/y % chg.
six-month % chg.

Chart 32
Power Demand
(1) Electric Power Consumption (10 Companies Total)
-15
-10
-5
0
5
10
15
20
25
CY 0 9 1 0 1 1 1 2
Tohoku and Tokyo Other than Tohoku and Tokyo 10 companies total
y/y % chg.
(2) Electric Productivity (Real GDP / Electric Power Consumption1 [10 Companies Total])
Note: 1. Seasonally adjusted by X-12-ARIMA.
Sources: The Federation of Electric Power Companies of Japan, "Electricity Demand";Sources: Cabinet Office "National Accounts "
-15
-10
-5
0
5
10
15
20
25
CY 0 9 1 0 1 1 1 2
Tohoku and Tokyo Other than Tohoku and Tokyo 10 companies total
y/y % chg.
94
96
98
100
102
104
106
108
CY 0 5 0 6 0 7 0 8 0 9 1 0 1 1
s.a., CY 2005=100
Sources: Cabinet Office, "National Accounts."

Chart 33
(1) Public Investment (2) Fiscal Balance2
Public Investment and Government Liabilities
0
5
10
15
20
25
30
35
40
01 02 03 04 05 06 07 08 09 10 11 12
Public investment (real)
Value of public works contracted
Amount of public construction completed
CY
s.a., ann., tril. yen
Notes: 1. The figure for amount of public construction completed for 2012/Q1 is the January-February average.Notes: 2. The following factors are excluded from the fiscal balance: (1) redemption of JGBs held by the Deposit
Insurance Corporation of Japan (fiscal 2001 and 2002); (2) transfer of reserves in the special account for the Fiscal Investment and Loan Program (public financial institutions) to the special account for thegovernment debt consolidation fund of the general government (fiscal 2006 and 2008); and (3) transferof reserves in the special account for the Fiscal Investment and Loan Program to the general account of the general government (fiscal 2009 and 2010)
-12
-10
-8
-6
-4
-2
0
2
01 02 03 04 05 06 07 08 09 10FY
% of nominal GDP
1
(3) Government Liabilities (4) Comparisons of Net Government Liabilities4
Notes: 1. Consisting of the central government, local governments, and social security funds. Notes: 2. Outstanding debt in "Economic and Fiscal Projections for Medium to Long Term Analysis (January 2012)." Notes: 3. Gross liabilities minus financial assets. Notes: 4. Government liabilities (of the general government) are the IMF projections in calendar 2013. Sources: Cabinet Office, "National Accounts," "Economic and Fiscal Projections for Medium to Long Term Sources: Analysis"; East Japan Construction Surety, etc., "Public Works Prepayment Surety Statistics"; Sources: Ministry of Land, Infrastructure, Transport and Tourism, "Integrated Statistics on Construction Works";
Sources: IMF "World Economic Outlook "
0
5
10
15
20
25
30
35
40
01 02 03 04 05 06 07 08 09 10 11 12
Public investment (real)
Value of public works contracted
Amount of public construction completed
CY
s.a., ann., tril. yen
Notes: 1. The figure for amount of public construction completed for 2012/Q1 is the January-February average.Notes: 2. The following factors are excluded from the fiscal balance: (1) redemption of JGBs held by the Deposit
Insurance Corporation of Japan (fiscal 2001 and 2002); (2) transfer of reserves in the special account for the Fiscal Investment and Loan Program (public financial institutions) to the special account for thegovernment debt consolidation fund of the general government (fiscal 2006 and 2008); and (3) transferof reserves in the special account for the Fiscal Investment and Loan Program to the general account of the general government (fiscal 2009 and 2010).
0 50 100 150
Germany
United States
United Kingdom
Italy
Japan
% of nominal GDP
-12
-10
-8
-6
-4
-2
0
2
01 02 03 04 05 06 07 08 09 10FY
% of nominal GDP
0
50
100
150
200
250
300
90 92 94 96 98 00 02 04 06 08 10
Gross liabilities of general government
Gross liabilities of central and local governmentsNet liabilities of general government
FY-end
% of nominal GDP
2005 base
1
2
3 1
1
Sources: IMF, "World Economic Outlook."
0
5
10
15
20
25
30
35
40
01 02 03 04 05 06 07 08 09 10 11 12
Public investment (real)
Value of public works contracted
Amount of public construction completed
CY
s.a., ann., tril. yen
Notes: 1. The figure for amount of public construction completed for 2012/Q1 is the January-February average.Notes: 2. The following factors are excluded from the fiscal balance: (1) redemption of JGBs held by the Deposit
Insurance Corporation of Japan (fiscal 2001 and 2002); (2) transfer of reserves in the special account for the Fiscal Investment and Loan Program (public financial institutions) to the special account for thegovernment debt consolidation fund of the general government (fiscal 2006 and 2008); and (3) transferof reserves in the special account for the Fiscal Investment and Loan Program to the general account of the general government (fiscal 2009 and 2010).
0 50 100 150
Germany
United States
United Kingdom
Italy
Japan
% of nominal GDP
-12
-10
-8
-6
-4
-2
0
2
01 02 03 04 05 06 07 08 09 10FY
% of nominal GDP
0
50
100
150
200
250
300
90 92 94 96 98 00 02 04 06 08 10
Gross liabilities of general government
Gross liabilities of central and local governmentsNet liabilities of general government
FY-end
% of nominal GDP
2005 base
1
2
3 1
1

Chart 34
(1) DRAM Spot Prices (2) NAND Flash Prices
(3) World Semiconductor Shipments (4) Shipment-Inventory Balance (Electronic Parts
and Devices)
Note: The figure for world semiconductor shipments forNote: 2012/Q1 is the January-February average convertedNote: into a quarterly amount.
Sources: Nikkei Financial QUEST; WSTS;
Sources: Ministry of Economy, Trade and Industry, "Indices of Industrial Production."
Cycle of Global Demand for IT-Related Goods
-25
-20
-15
-10
-5
0
5
10
15
20
CY0 5 0 6 0 7 0 8 0 9 1 0 1 1 12
s.a., q/q % chg.
2
4
6
8
10
12
0 8 0 9 1 0 1 1 1 2
32 Gb
16 Gb
US$/piece
CY
0
1
2
3
4
08 09 1 0 1 1 12
1 Gb (DDR3-based)
1 Gb (DDR2-based)
US$/piece
CY
-80
-60
-40
-20
0
20
40
60
80
100
-80
-60
-40
-20
0
20
40
60
80
100
CY0 5 0 6 0 7 0 8 0 9 1 0 1 1 12
Shipments minus inventories (right scale)
Shipments (left scale)
Inventories (left scale)
% points y/y % chg.

Chart 35
(1) Semiconductor1,2 (2) IT-Related Goods Other than Semiconductors1,3
Worldwide Market Share of Japanese-Affiliated Companies
30market share in value, %
35market share in value, %
25
30market share in value, %
25
30
35market share in value, %
Forecast
15
20
25
30market share in value, %
10
15
20
25
30
35
Display device
Communications equipment
market share in value, %
Forecast
(3) Intermediate Goods4 (4) Motor Vehicles1
10
15
20
25
30
99 00 01 02 03 04 05 06 07 08 09 10 11 12
market share in value, %
CY
40market share in cars, %
20market share in weight, %
5
10
15
20
25
30
35
99 00 01 02 03 04 05 06 07 08 09 10 11 12
Display device
Communications equipment
market share in value, %
CY
Forecast
10
15
20
25
30
99 00 01 02 03 04 05 06 07 08 09 10 11 12
market share in value, %
CY
35
40market share in cars, %
15
20
Crude steel
Ethylene
market share in weight, %
5
10
15
20
25
30
35
99 00 01 02 03 04 05 06 07 08 09 10 11 12
Display device
Communications equipment
market share in value, %
CY
Forecast
10
15
20
25
30
99 00 01 02 03 04 05 06 07 08 09 10 11 12
market share in value, %
CY
25
30
35
40market share in cars, %
5
10
15
20
Crude steel
Ethylene
market share in weight, %
Forecast
5
10
15
20
25
30
35
99 00 01 02 03 04 05 06 07 08 09 10 11 12
Display device
Communications equipment
market share in value, %
CY
Forecast
Notes: 1. Figures are worldwide market share of Japanese-affiliated companies.Notes: 2. Figures are calculated by the Research and Statistics Department, Bank of Japan based on data by Gartner
10
15
20
25
30
99 00 01 02 03 04 05 06 07 08 09 10 11 12
market share in value, %
CY
20
25
30
35
40
99 00 01 02 03 04 05 06 07 08 09 10 11 12
market share in cars, %
CY0
5
10
15
20
99 00 01 02 03 04 05 06 07 08 09 10 11 12
Crude steel
Ethylene
market share in weight, %
CY
Forecast
5
10
15
20
25
30
35
99 00 01 02 03 04 05 06 07 08 09 10 11 12
Display device
Communications equipment
market share in value, %
CY
Forecast
Notes: 2. as of March 2012.Notes: 3. Figures from 2011 onward are the forecasts by JEITA as of December 2011.Notes: 4. Figures are worldwide market shares of domestic products in Japan. Figures of ethylene from 2009 onwardNotes: 4. are the forecasts by the Ministry of Economy, Trade and Industry as of May 2010.Sources: Gartner; JEITA, "Production Forecasts for the Global Electronics and Information Technology Industries";Sources: JISF; World Steel Association; OICA; Ministry of Economy, Trade and Industry,Sources: "Future Trends in Global Demand for and Supply of Petrochemical Products."
10
15
20
25
30
99 00 01 02 03 04 05 06 07 08 09 10 11 12
market share in value, %
CY
20
25
30
35
40
99 00 01 02 03 04 05 06 07 08 09 10 11 12
market share in cars, %
CY0
5
10
15
20
99 00 01 02 03 04 05 06 07 08 09 10 11 12
Crude steel
Ethylene
market share in weight, %
CY
Forecast
5
10
15
20
25
30
35
99 00 01 02 03 04 05 06 07 08 09 10 11 12
Display device
Communications equipment
market share in value, %
CY
Forecast

Chart 36
(1) Household-Type Electrical Equipment and IT-Related Goods1
(a) China (b) Korea (c) Japan
International Competitiveness Coefficient
1.0 1.0 1.0
0 8-0.6-0.4-0.20.00.20.40.60.81.0
TelevisionreceiversSemiconductordevices, etc.Household-typeelectrical equipment
0 8-0.6-0.4-0.20.00.20.40.60.81.0
0 8-0.6-0.4-0.20.00.20.40.60.81.0
(2) Intermediate Goods1
(a) China (b) Korea (c) Japan
0.81.0
0.81.0
0.81.0
Chemicals and related products
-1.0-0.8-0.6-0.4-0.20.00.20.40.60.81.0
92 94 96 98 00 02 04 06 08 10
TelevisionreceiversSemiconductordevices, etc.Household-typeelectrical equipment
CY-1.0-0.8-0.6-0.4-0.20.00.20.40.60.81.0
92 94 96 98 00 02 04 06 08 10CY-1.0-0.8-0.6-0.4-0.20.00.20.40.60.81.0
92 94 96 98 00 02 04 06 08 1011CY
1 0-0.8-0.6-0.4-0.20.00.20.40.60.81.0
1 0-0.8-0.6-0.4-0.20.00.20.40.60.81.0
1 0-0.8-0.6-0.4-0.20.00.20.40.60.81.0
Chemicals and related products
Iron and steel
-1.0-0.8-0.6-0.4-0.20.00.20.40.60.81.0
92 94 96 98 00 02 04 06 08 10
TelevisionreceiversSemiconductordevices, etc.Household-typeelectrical equipment
CY-1.0-0.8-0.6-0.4-0.20.00.20.40.60.81.0
92 94 96 98 00 02 04 06 08 10CY-1.0-0.8-0.6-0.4-0.20.00.20.40.60.81.0
92 94 96 98 00 02 04 06 08 1011CY
(3) Capital Goods and Motor Vehicles and Their Related Goods1
(a) China (b) Korea (c) Japan
-1.0-0.8-0.6-0.4-0.20.00.20.40.60.81.0
92 94 96 98 00 02 04 06 08 10CY 11-1.0-0.8-0.6-0.4-0.20.00.20.40.60.81.0
92 94 96 98 00 02 04 06 08 10CY-1.0-0.8-0.6-0.4-0.20.00.20.40.60.81.0
92 94 96 98 00 02 04 06 08 10
Chemicals and related products
Iron and steel
CY
-1.0-0.8-0.6-0.4-0.20.00.20.40.60.81.0
92 94 96 98 00 02 04 06 08 10
TelevisionreceiversSemiconductordevices, etc.Household-typeelectrical equipment
CY-1.0-0.8-0.6-0.4-0.20.00.20.40.60.81.0
92 94 96 98 00 02 04 06 08 10CY-1.0-0.8-0.6-0.4-0.20.00.20.40.60.81.0
92 94 96 98 00 02 04 06 08 1011CY
0.40.60.81.0
Transport equipment
Specialized machinery
General industrial machinery
2
30.40.60.81.0
0 20.40.60.81.0
-1.0-0.8-0.6-0.4-0.20.00.20.40.60.81.0
92 94 96 98 00 02 04 06 08 10CY 11-1.0-0.8-0.6-0.4-0.20.00.20.40.60.81.0
92 94 96 98 00 02 04 06 08 10CY-1.0-0.8-0.6-0.4-0.20.00.20.40.60.81.0
92 94 96 98 00 02 04 06 08 10
Chemicals and related products
Iron and steel
CY
-1.0-0.8-0.6-0.4-0.20.00.20.40.60.81.0
92 94 96 98 00 02 04 06 08 10
TelevisionreceiversSemiconductordevices, etc.Household-typeelectrical equipment
CY-1.0-0.8-0.6-0.4-0.20.00.20.40.60.81.0
92 94 96 98 00 02 04 06 08 10CY-1.0-0.8-0.6-0.4-0.20.00.20.40.60.81.0
92 94 96 98 00 02 04 06 08 1011CY
-1.0-0.8-0.6-0.4-0.20.00.20.40.60.81.0
92 94 96 98 00 02 04 06 08 10
Transport equipment
Specialized machinery
General industrial machinery
CY
2
3
-1.0-0.8-0.6-0.4-0.20.00.20.40.60.81.0
92 94 96 98 00 02 04 06 08 10CY-1.0-0.8-0.6-0.4-0.20.00.20.40.60.81.0
92 94 96 98 00 02 04 06 08 10CY 11
International Competitiveness Coefficient (ICC)
ICC iA = (AX i - AM i ) / (AX i + AM i )
ICC iA : Country A's ICC of goods i , AX i : Country A's exports of goods i , AM i : Country A's imports of goods i
N t 1 Fi b d th SITC R 3 l ifi ti
ICC: Net export value divided by the sum of export value and import value. The closer the value of ICC is to one, the greater the competitiveness.
-1.0-0.8-0.6-0.4-0.20.00.20.40.60.81.0
92 94 96 98 00 02 04 06 08 10CY 11-1.0-0.8-0.6-0.4-0.20.00.20.40.60.81.0
92 94 96 98 00 02 04 06 08 10CY-1.0-0.8-0.6-0.4-0.20.00.20.40.60.81.0
92 94 96 98 00 02 04 06 08 10
Chemicals and related products
Iron and steel
CY
-1.0-0.8-0.6-0.4-0.20.00.20.40.60.81.0
92 94 96 98 00 02 04 06 08 10
TelevisionreceiversSemiconductordevices, etc.Household-typeelectrical equipment
CY-1.0-0.8-0.6-0.4-0.20.00.20.40.60.81.0
92 94 96 98 00 02 04 06 08 10CY-1.0-0.8-0.6-0.4-0.20.00.20.40.60.81.0
92 94 96 98 00 02 04 06 08 1011CY
-1.0-0.8-0.6-0.4-0.20.00.20.40.60.81.0
92 94 96 98 00 02 04 06 08 10
Transport equipment
Specialized machinery
General industrial machinery
CY
2
3
-1.0-0.8-0.6-0.4-0.20.00.20.40.60.81.0
92 94 96 98 00 02 04 06 08 10CY-1.0-0.8-0.6-0.4-0.20.00.20.40.60.81.0
92 94 96 98 00 02 04 06 08 10CY 11
Notes: 1. Figures are based on the SITC Rev.3 classification.Notes: 2. Machinery specialized for particular industries and metalworking machinery. Examples of the former includeNotes: 2. construction and mining machinery, semiconductor manufacturing equipment, agricultural machinery, andNotes: 2. printing and bookbinding machinery.Notes: 3. General industrial machinery and equipment. Examples include heating and cooling equipment,Notes: 3. mechanical handling equipment, pumps, and bearings.Source: United Nations, "Comtrade."
-1.0-0.8-0.6-0.4-0.20.00.20.40.60.81.0
92 94 96 98 00 02 04 06 08 10CY 11-1.0-0.8-0.6-0.4-0.20.00.20.40.60.81.0
92 94 96 98 00 02 04 06 08 10CY-1.0-0.8-0.6-0.4-0.20.00.20.40.60.81.0
92 94 96 98 00 02 04 06 08 10
Chemicals and related products
Iron and steel
CY
-1.0-0.8-0.6-0.4-0.20.00.20.40.60.81.0
92 94 96 98 00 02 04 06 08 10
TelevisionreceiversSemiconductordevices, etc.Household-typeelectrical equipment
CY-1.0-0.8-0.6-0.4-0.20.00.20.40.60.81.0
92 94 96 98 00 02 04 06 08 10CY-1.0-0.8-0.6-0.4-0.20.00.20.40.60.81.0
92 94 96 98 00 02 04 06 08 1011CY
-1.0-0.8-0.6-0.4-0.20.00.20.40.60.81.0
92 94 96 98 00 02 04 06 08 10
Transport equipment
Specialized machinery
General industrial machinery
CY
2
3
-1.0-0.8-0.6-0.4-0.20.00.20.40.60.81.0
92 94 96 98 00 02 04 06 08 10CY-1.0-0.8-0.6-0.4-0.20.00.20.40.60.81.0
92 94 96 98 00 02 04 06 08 10CY 11

Chart 37
(1) Breakdown of Changes in Trade Balance1,2
Trade Balance
3850tril. yen, cumulative changes from the value in FY 2000
8.
18
28
38
20
30
40
50tril. yen, cumulative changes from the value in FY 2000
-3
-2
-1
-1
8.
18
28
38
-20
-10
0
10
20
30
40
50
Import price factor
Export price factor
Real exports factor
R l i t f t
tril. yen, cumulative changes from the value in FY 2000
(2) Trend of Trade Balance1
-5
-4
-3
-2
-1
-1
8.
18
28
38
-40
-30
-20
-10
0
10
20
30
40
50
00 01 02 03 04 05 06 07 08 09 10 11
Import price factor
Export price factor
Real exports factor
Real imports factor
Trade balance
FY
tril. yen, cumulative changes from the value in FY 2000
( )
-5
-4
-3
-2
-1
-1
8.
18
28
38
-40
-30
-20
-10
0
10
20
30
40
50
00 01 02 03 04 05 06 07 08 09 10 11
Import price factor
Export price factor
Real exports factor
Real imports factor
Trade balance
FY
tril. yen, cumulative changes from the value in FY 2000
10
12
14
16tril. yen
-5
-4
-3
-2
-1
-1
8.
18
28
38
-40
-30
-20
-10
0
10
20
30
40
50
00 01 02 03 04 05 06 07 08 09 10 11
Import price factor
Export price factor
Real exports factor
Real imports factor
Trade balance
FY
tril. yen, cumulative changes from the value in FY 2000
0
2
4
6
8
10
12
14
16tril. yen
Notes: 1 Figures for the trade balance are based on the "Balance of Payments " Figures for fiscal 2011 are April 2011-
-5
-4
-3
-2
-1
-1
8.
18
28
38
-40
-30
-20
-10
0
10
20
30
40
50
00 01 02 03 04 05 06 07 08 09 10 11
Import price factor
Export price factor
Real exports factor
Real imports factor
Trade balance
FY
tril. yen, cumulative changes from the value in FY 2000
-6
-4
-2
0
2
4
6
8
10
12
14
16
00 01 02 03 04 05 06 07 08 09 10 11
Trade balance
Trend (FY 2000-11)
Trend (FY 2000-10)
FY
tril. yen
Notes: 1. Figures for the trade balance are based on the "Balance of Payments." Figures for fiscal 2011 are April 2011-Notes: 1. February 2012 averages in annual amount.Notes: 2. Cross terms between the export (import) price factor and the real exports (imports) factor are included in theNotes: 2. export (import) price factor. Figures for the trade balance are the actual value and those for each factor areNotes: 2. cumulative changes from the value in fiscal 2000. The dashed line indicates the level of trade balance forNotes: 2. fiscal 2000.Sources: Ministry of Finance and Bank of Japan, "Balance of Payments"; Ministry of Finance, "Trade Statistics"; Sources: Bank of Japan, "Corporate Goods Price Index."
-5
-4
-3
-2
-1
-1
8.
18
28
38
-40
-30
-20
-10
0
10
20
30
40
50
00 01 02 03 04 05 06 07 08 09 10 11
Import price factor
Export price factor
Real exports factor
Real imports factor
Trade balance
FY
tril. yen, cumulative changes from the value in FY 2000
-6
-4
-2
0
2
4
6
8
10
12
14
16
00 01 02 03 04 05 06 07 08 09 10 11
Trade balance
Trend (FY 2000-11)
Trend (FY 2000-10)
FY
tril. yen

Chart 38
(1) Income Balance1
Income Balance and International Investment Position
20s.a., ann., tril. yen
10
15
20
Direct investment income
Other than direct investment income
Total
s.a., ann., tril. yen
(2) External Assets Total2 (3) Rate of Return on External Assets2,3
0
5
10
15
20
0 0 0 1 0 2 0 3 0 4 0 5 0 6 0 7 0 8 0 9 1 0 1 1
Direct investment income
Other than direct investment income
Total
s.a., ann., tril. yen
FY
800tril. yen %
0
5
10
15
20
0 0 0 1 0 2 0 3 0 4 0 5 0 6 0 7 0 8 0 9 1 0 1 1
Direct investment income
Other than direct investment income
Total
s.a., ann., tril. yen
FY
400
600
800Direct investmentEquity securitiesDebt securitiesLoansReserve assetsDeposits and othersNet assets
tril. yen
8
10
12
14
16
18 Rate of return on external assets total
Rate of return on assets other than direct investmentRate of return on direct investment
10-year U.S. government bond yield
%
0
5
10
15
20
0 0 0 1 0 2 0 3 0 4 0 5 0 6 0 7 0 8 0 9 1 0 1 1
Direct investment income
Other than direct investment income
Total
s.a., ann., tril. yen
FY
0
200
400
600
800
96 97 98 99 00 01 02 03 04 05 06 07 08 09 10 11
Direct investmentEquity securitiesDebt securitiesLoansReserve assetsDeposits and othersNet assets
tril. yen
CY0
2
4
6
8
10
12
14
16
18
97 98 99 00 01 02 03 04 05 06 07 08 09 10 11
Rate of return on external assets total
Rate of return on assets other than direct investmentRate of return on direct investment
10-year U.S. government bond yield
%
CY
(4) External Liabilities Total2 (5) Rate of Return on External Liabilities2,3
0
5
10
15
20
0 0 0 1 0 2 0 3 0 4 0 5 0 6 0 7 0 8 0 9 1 0 1 1
Direct investment income
Other than direct investment income
Total
s.a., ann., tril. yen
FY
0
200
400
600
800
96 97 98 99 00 01 02 03 04 05 06 07 08 09 10 11
Direct investmentEquity securitiesDebt securitiesLoansReserve assetsDeposits and othersNet assets
tril. yen
CY0
2
4
6
8
10
12
14
16
18
97 98 99 00 01 02 03 04 05 06 07 08 09 10 11
Rate of return on external assets total
Rate of return on assets other than direct investmentRate of return on direct investment
10-year U.S. government bond yield
%
CY
300
400Direct investmentEquity securitiesDebt securitiesLoansDeposits and others
tril. yen
10
12
14
16
18Rate of return on external liabilities totalRate of return on liabilities other than direct investmentRate of return on direct investment
%
0
5
10
15
20
0 0 0 1 0 2 0 3 0 4 0 5 0 6 0 7 0 8 0 9 1 0 1 1
Direct investment income
Other than direct investment income
Total
s.a., ann., tril. yen
FY
0
200
400
600
800
96 97 98 99 00 01 02 03 04 05 06 07 08 09 10 11
Direct investmentEquity securitiesDebt securitiesLoansReserve assetsDeposits and othersNet assets
tril. yen
CY0
2
4
6
8
10
12
14
16
18
97 98 99 00 01 02 03 04 05 06 07 08 09 10 11
Rate of return on external assets total
Rate of return on assets other than direct investmentRate of return on direct investment
10-year U.S. government bond yield
%
CY
0
100
200
300
400
96 97 98 99 00 01 02 03 04 05 06 07 08 09 10 11
Direct investmentEquity securitiesDebt securitiesLoansDeposits and others
tril. yen
CY0
2
4
6
8
10
12
14
16
18
97 98 99 00 01 02 03 04 05 06 07 08 09 10 11
Rate of return on external liabilities totalRate of return on liabilities other than direct investmentRate of return on direct investment
%
CY
Notes: 1. Figures for the second half of fiscal 2011 are October 2011-February 2012 averages in annual amount.Notes: 2. Figures for 2011 are based on the quarterly estimate of the international investment position at the end ofNotes: 2. December (preliminary estimate). Financial derivatives are excluded from the quarterly estimate.Notes: 3. Figures are calculated as income divided by average assets (liabilities) at the beginning and end of the year.
Sources: Ministry of Finance and Bank of Japan, "Balance of Payments"; Bloomberg.
0
5
10
15
20
0 0 0 1 0 2 0 3 0 4 0 5 0 6 0 7 0 8 0 9 1 0 1 1
Direct investment income
Other than direct investment income
Total
s.a., ann., tril. yen
FY
0
200
400
600
800
96 97 98 99 00 01 02 03 04 05 06 07 08 09 10 11
Direct investmentEquity securitiesDebt securitiesLoansReserve assetsDeposits and othersNet assets
tril. yen
CY0
2
4
6
8
10
12
14
16
18
97 98 99 00 01 02 03 04 05 06 07 08 09 10 11
Rate of return on external assets total
Rate of return on assets other than direct investmentRate of return on direct investment
10-year U.S. government bond yield
%
CY
0
100
200
300
400
96 97 98 99 00 01 02 03 04 05 06 07 08 09 10 11
Direct investmentEquity securitiesDebt securitiesLoansDeposits and others
tril. yen
CY0
2
4
6
8
10
12
14
16
18
97 98 99 00 01 02 03 04 05 06 07 08 09 10 11
Rate of return on external liabilities totalRate of return on liabilities other than direct investmentRate of return on direct investment
%
CY

Chart 39
(1) Current Account
(2) Investment-Saving Balance
Current Account and Investment-Saving Balance
-10
-5
0
5
10
15
20
25
30
35
96 97 98 99 00 01 02 03 04 05 06 07 08 09 10 11
Current transfers Income balance Services balanceTrade balance Current account
tril. yen
FY
Note: Figures for fiscal 2011 are April 2011 to February 2012 averages in annual amount.
5
10
15 % of nominal GDP
(Saving surplus)
Forecast
Sources: Cabinet Office, "National Accounts," "Economic and Fiscal Projections for Medium to Long TermSources: Analysis"; Ministry of Finance and Bank of Japan "Balance of Payments "
-10
-5
0
5
10
15
20
25
30
35
96 97 98 99 00 01 02 03 04 05 06 07 08 09 10 11
Current transfers Income balance Services balanceTrade balance Current account
tril. yen
FY
Note: Figures for fiscal 2011 are April 2011 to February 2012 averages in annual amount.
Notes: 1. The following factors are excluded from the domestic investment-saving balance: (1) redemption of JGBsheld by the Deposit Insurance Corporation of Japan (fiscal 2001 and 2002); (2) transfer of assets and liabilities of the Japan Expressway Holding and Debt Repayment Agency to the general account (fiscal 2005); (3) transfer of reserves in the special account for the Fiscal Investment and Loan Program (public financial institutions) to the special account for the government debt consolidation fund of the general government(fiscal 2006 and 2008); and (4) transfer of reserves in the special account for the Fiscal Investment and Loan Program to the general account of the general government (fiscal 2009 and 2010).
Notes: 2. Figures for private final consumption expenditure and private housing investment in fiscal 2011 arecalculated using the average year-on-year rate of change in the period from 2011/Q2 to Q4. The domestic investment-saving balance in fiscal 2011 is estimated by subtracting -0.3 percentage point (the difference between the domestic investment-saving balance and current account in fiscal 2010) from the current account.
Notes: 3. The figures for nominal GDP and the investment-saving balance of the general government in fiscal 2011 are based on the "Economic and Fiscal Projections for Medium to Long Term Analysis (January 2012)." The figure for the balance of the household sector is estimated by subtracting private final consumption expenditure and private housing investment from personal disposable income, which is calculated by the nominal disposable income in Chart 49. The figure for the balance of the corporate sector is the residue.
-15
-10
-5
0
5
10
15
01 02 03 04 05 06 07 08 09 10 11
Household sectorCorporate sectorGeneral governmentDomestic investment-saving balanceCurrent account
FY
% of nominal GDP
(Saving surplus)
(Saving deficit)
Forecast
Sources: Analysis"; Ministry of Finance and Bank of Japan, "Balance of Payments."

Chart 40
(1) Total (2) Household Sector
(3) Corporate Sector (4) General Government
Investment-Saving Balance of Each Sector
-5
0
5
10
15
20
85 87 89 91 93 95 97 99 01 03 05 07 09 11
Investment-saving balanceSaving rateInvestment rate
FY
% of nominal GDP
-4
-2
0
2
4
6
8
10
12
85 87 89 91 93 95 97 99 01 03 05 07 09 11FY
% of nominal GDP
15
20% of nominal GDP
4
6
8% of nominal GDP
Sources: Cabinet Office, "National Accounts," "Economic and Fiscal Projections for Medium to Long TermSources: Analysis"; Ministry of Finance and Bank of Japan, "Balance of Payments."
-5
0
5
10
15
20
85 87 89 91 93 95 97 99 01 03 05 07 09 11
Investment-saving balanceSaving rateInvestment rate
FY
% of nominal GDP
-4
-2
0
2
4
6
8
10
12
85 87 89 91 93 95 97 99 01 03 05 07 09 11FY
% of nominal GDP
-15
-10
-5
0
5
10
15
20
85 87 89 91 93 95 97 99 01 03 05 07 09 11
% of nominal GDP
FY
-12
-10
-8
-6
-4
-2
0
2
4
6
8
85 87 89 91 93 95 97 99 01 03 05 07 09 11FY
% of nominal GDP
Notes: 1. Investment rate = (gross domestic fixed capital formation - consumption of fixed capital + land investment + inventory investment) / nominal GDP
Notes 2. The following factors are excluded from the domestic investment-saving balance: (1) redemption of JGBsheld by the Deposit Insurance Corporation of Japan (from fiscal 1998 to 2002); (2) transfer of Japan National Railway's long-term debt (fiscal 1998) and cumulative debt of the National Forestry Project (state-owned forests and fields) (fiscal 1998) to the general account of the general government; (3) transfer of assets and liabilities of the Japan Expressway Holding and Debt Repayment Agency to the general account (fiscal 2005); (4) transfer of reserves in the special account for the Fiscal Investment and Loan Program (public financial institutions) to the special account for the government debt consolidation fund ofthe general government (fiscal 2006 and 2008); and (5) transfer of reserves in the special account for the Fiscal Investment and Loan Program to the general account of the general government (fiscal 2009 and 2010).
3. Figures up to fiscal 2000 are on the 2000 base, and those from fiscal 2001 are on the 2005 base.4. Figures in fiscal 2011 are forecasts. For the estimation procedure, see Chart 39.
Sources: Analysis ; Ministry of Finance and Bank of Japan, Balance of Payments.

Chart 41
(1) Large Manufacturing Enterprises (2) Small Manufacturing Enterprises
(3) L N f t i E t i (4) S ll N f t i E t i
Corporate Profits
2
4
6
8
10
12
14
16
18
20
90 92 94 96 98 00 02 04 06 08 10 12
tril. yen
FY0
1
2
3
4
5
90 92 94 96 98 00 02 04 06 08 10 12
tril. yen
FY
(3) Large Nonmanufacturing Enterprises (4) Small Nonmanufacturing Enterprises
Notes: 1. Based on current profits.Notes: 2. Figures for fiscal 2011 and fiscal 2012 are the forecasts in the March 2012 survey.Notes: 3. In the March 2004 survey, the "Tankan" underwent major revisions, including the addition of new sampleNotes: 3. enterprises to the survey. In the March 2007 and March 2010 surveys, regular revisions were made toNotes: 3. the sample enterprises. The data show some discontinuities that coincided with these timings.
Source: Bank of Japan, "Tankan, Short-Term Economic Survey of Enterprises in Japan."
2
4
6
8
10
12
14
16
18
20
90 92 94 96 98 00 02 04 06 08 10 12
tril. yen
FY0
1
2
3
4
5
90 92 94 96 98 00 02 04 06 08 10 12
tril. yen
FY
6
8
10
12
14
16
18
90 92 94 96 98 00 02 04 06 08 10 12
Nonmanufacturing
Nonmanufacturing (excluding electric & gas utilities)
tril. yen
FY2
3
4
5
6
7
90 92 94 96 98 00 02 04 06 08 10 12
tril. yen
FY
p , , y p p
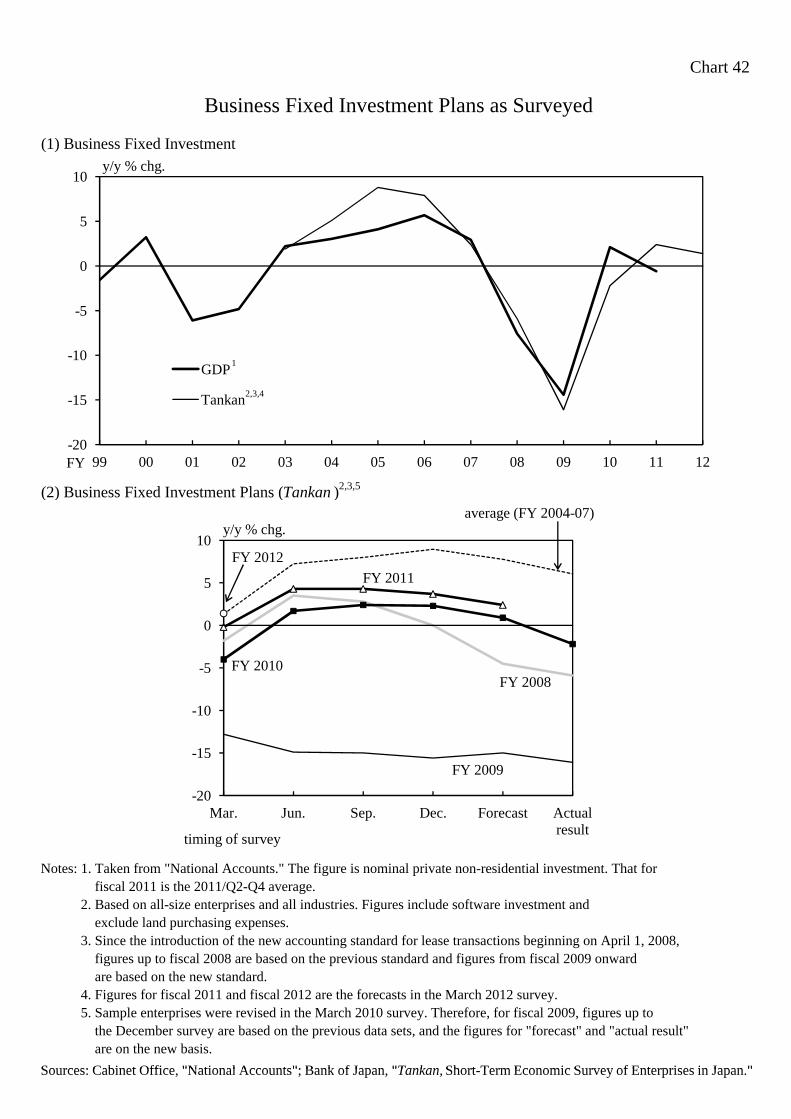
Chart 42
(1) Business Fixed Investment
(2) Business Fixed Investment Plans (Tankan )2,3,5
Business Fixed Investment Plans as Surveyed
-20
-15
-10
-5
0
5
10
99 00 01 02 03 04 05 06 07 08 09 10 11 12
GDP
Tankan
y/y % chg.
FY
1
2,3,4
10y/y % chg.
average (FY 2004-07)
FY 2012
Notes: 1. Taken from "National Accounts." The figure is nominal private non-residential investment. That for Notes: 1. fiscal 2011 is the 2011/Q2-Q4 average.Notes: 2. Based on all-size enterprises and all industries. Figures include software investment andNotes: 2. exclude land purchasing expenses.Notes: 3. Since the introduction of the new accounting standard for lease transactions beginning on April 1, 2008,Notes: 3. figures up to fiscal 2008 are based on the previous standard and figures from fiscal 2009 onwardNotes: 3. are based on the new standard.Notes: 4. Figures for fiscal 2011 and fiscal 2012 are the forecasts in the March 2012 survey.Notes: 5. Sample enterprises were revised in the March 2010 survey. Therefore, for fiscal 2009, figures up toNotes: 5. the December survey are based on the previous data sets, and the figures for "forecast" and "actual result"Notes: 5. are on the new basis.
Sources: Cabinet Office "National Accounts"; Bank of Japan "Tankan Short Term Economic Survey of Enterprises in Japan "
-20
-15
-10
-5
0
5
10
99 00 01 02 03 04 05 06 07 08 09 10 11 12
GDP
Tankan
y/y % chg.
FY
1
2,3,4
-20
-15
-10
-5
0
5
10
Mar. Jun. Sep. Dec. Forecast Actualresult
y/y % chg.average (FY 2004-07)
FY 2008
FY 2009
FY 2010
FY 2011
FY 2012
timing of survey
Sources: Cabinet Office, "National Accounts"; Bank of Japan, "Tankan, Short-Term Economic Survey of Enterprises in Japan."

Chart 43
1. Capital stock cycle in the chart shows the relationship between the investment-capital ratio and the year-on-
year rate of change in fixed investment.
2. As these variables have the following relation, a hyperbolic curve can be drawn for a given expected growth rate.
Year-on-year rate of change in fixed investment (y-axis) × investment-capital ratio at the end of the previous
fiscal year (x-axis) = expected growth rate + trend growth rate of capital coefficient + depreciation rate
3. The phase of fixed investment at a certain time can be evaluated in relation to the hyperbolic curve
corresponding to the expected growth rate at that time.
Sources: Cabinet Office, "National Accounts";
Research Institute of Economy, Trade and Industry, "Japan Industrial Productivity Database."
Capital Stock Cycle
-20
-15
-10
-5
0
5
10
15
20
25
7 8 9 10 11 12 13 14
90
88
91
86
93
81
98
01
07
00030605
Investment-capital ratio
at the end of FY 2010
fixed investment, y/y % chg.
Expected
growth rate: -1% 1%2%
3%
4%
5%
investment-capital ratio at the end of the previous fiscal year, %
FY 2010
08
0%
09

Chart 44
(1) Investment-GDP Ratio (Nominal)
Business Fixed Investment
22s.a., %
10
12
14
16
18
20
22
Investment-GDP ratio (nominal)CY 1985-2011 averageCY 2000-2011 average
s.a., %
(2) Cash Flow and Business Fixed Investment
10
12
14
16
18
20
22
85 87 89 91 93 95 97 99 01 03 05 07 09 11
Investment-GDP ratio (nominal)CY 1985-2011 averageCY 2000-2011 average
s.a., %
CY
1 21.31.41.5
3.54.04.5
Implied forward rate of industry-specific real demand growth ratesfive years from now (left scale)I t t h fl ti ( i ht l )
% times
1
2 3
10
12
14
16
18
20
22
85 87 89 91 93 95 97 99 01 03 05 07 09 11
Investment-GDP ratio (nominal)CY 1985-2011 averageCY 2000-2011 average
s.a., %
CY
0.40.50.60.70.80.91.01.11.21.31.41.5
0.00.51.01.52.02.53.03.54.04.5
Implied forward rate of industry-specific real demand growth ratesfive years from now (left scale)Investment-cash flow ratio (right scale)
% times
1
2,3
(3) Investment-Capital Ratio ( I t / K t-1 )5
10
12
14
16
18
20
22
85 87 89 91 93 95 97 99 01 03 05 07 09 11
Investment-GDP ratio (nominal)CY 1985-2011 averageCY 2000-2011 average
s.a., %
CY
0.40.50.60.70.80.91.01.11.21.31.41.5
0.00.51.01.52.02.53.03.54.04.5
85 87 89 91 93 95 97 99 01 03 05 07 09 11
Implied forward rate of industry-specific real demand growth ratesfive years from now (left scale)Investment-cash flow ratio (right scale)
%
FY
times
1
2,3
12131415
Investment-capital ratio
Long-run equilibrium (calculated by using potential growth rates)
%
4
10
12
14
16
18
20
22
85 87 89 91 93 95 97 99 01 03 05 07 09 11
Investment-GDP ratio (nominal)CY 1985-2011 averageCY 2000-2011 average
s.a., %
CY
0.40.50.60.70.80.91.01.11.21.31.41.5
0.00.51.01.52.02.53.03.54.04.5
85 87 89 91 93 95 97 99 01 03 05 07 09 11
Implied forward rate of industry-specific real demand growth ratesfive years from now (left scale)Investment-cash flow ratio (right scale)
%
FY
times
1
2,3
789
101112131415
85 87 89 91 93 95 97 99 01 03 05 07 09 11
Investment-capital ratio
Long-run equilibrium (calculated by using potential growth rates)
%
FY
4
Notes: 1. Calculated using the "Annual Survey of Corporate Behavior." Figures surveyed in January or FebruaryNotes: 1. in the fiscal year.Notes: 2. Taken from "National Accounts."Notes: 3. Cash flow = consumption of fixed capital + (operating surplus + net property income) /2Notes: 3. Figures up to fiscal 2000 are on the 2000 base.Notes: 4. ( I t / I t-1 )·( I / K )t-1 = depreciation rate + trend growth rate of capital coefficient + potential growth rate
10
12
14
16
18
20
22
85 87 89 91 93 95 97 99 01 03 05 07 09 11
Investment-GDP ratio (nominal)CY 1985-2011 averageCY 2000-2011 average
s.a., %
CY
0.40.50.60.70.80.91.01.11.21.31.41.5
0.00.51.01.52.02.53.03.54.04.5
85 87 89 91 93 95 97 99 01 03 05 07 09 11
Implied forward rate of industry-specific real demand growth ratesfive years from now (left scale)Investment-cash flow ratio (right scale)
%
FY
times
1
2,3
789
101112131415
85 87 89 91 93 95 97 99 01 03 05 07 09 11
Investment-capital ratio
Long-run equilibrium (calculated by using potential growth rates)
%
FY
4
( t t 1 ) ( )t 1 p g p p gNotes: 4. (see the explanation in Chart 43). Since the left-hand term equals I t / K t-1, the equation can be expressedNotes: 4. as I t / K t-1 = depreciation rate + trend growth rate of capital coefficient + potential growth rate.Notes: 4. The long-run equilibrium of I t / K t-1 is calculated by using this equation and potential growth rates.Notes: 5. Figures for fiscal 2011 are those for 2011/Q2-Q4 in an annual amount.
Sources: Cabinet Office, "National Accounts," "Annual Survey of Corporate Behavior";Sources: Research Institute of Economy, Trade and Industry, "Japan Industrial Productivity Database," etc.

Chart 45
(1) Foreign Direct Investment (2) Overseas M&A1
Corporate Overseas Investment Activities
30tril. yen
10500Number of cases (left scale)
cases tril. yen
20
25
30
Foreign direct investment
Current account
tril. yen
6
7
8
9
10
300
350
400
450
500Number of cases (left scale)
Value (right scale)
cases tril. yen
5
10
15
20
25
30
Foreign direct investment
Current account
tril. yen
2
3
4
5
6
7
8
9
10
100
150
200
250
300
350
400
450
500Number of cases (left scale)
Value (right scale)
cases tril. yen
(3) Reasons for Overseas Business Fixed Investment2 (4) Rates of Return in Japan and Overseas (Up to Two Answers Allowed)
10Rate of return on foreign
%
0
5
10
15
20
25
30
96 97 98 99 00 01 02 03 04 05 06 07 08 09 10 11
Foreign direct investment
Current account
tril. yen
CY
G i l l k t
0
1
2
3
4
5
6
7
8
9
10
0
50
100
150
200
250
300
350
400
450
500
03 04 05 06 07 08 09 10 11
Number of cases (left scale)
Value (right scale)
CY
cases tril. yen
6
8
10Rate of return on foreign direct investment
ROA of domestic corporations
%
3
4
0
5
10
15
20
25
30
96 97 98 99 00 01 02 03 04 05 06 07 08 09 10 11
Foreign direct investment
Current account
tril. yen
CY
8.1
19.1
33.671.0
Preferential policiesor low tax rate
Diversification ofproduction base
Inexpensive labor cost
Growing local market
0
1
2
3
4
5
6
7
8
9
10
0
50
100
150
200
250
300
350
400
450
500
03 04 05 06 07 08 09 10 11
Number of cases (left scale)
Value (right scale)
CY
cases tril. yen
2
4
6
8
10Rate of return on foreign direct investment
ROA of domestic corporations
%
3
4
0
5
10
15
20
25
30
96 97 98 99 00 01 02 03 04 05 06 07 08 09 10 11
Foreign direct investment
Current account
tril. yen
CY
7 6
3.6
4.3
6.1
8.1
19.1
33.671.0
Others
Reduction of tariffs
Qualified humanresources
Reduction of exchangerate changes
Preferential policiesor low tax rate
Diversification ofproduction base
Inexpensive labor cost
Growing local market
0
1
2
3
4
5
6
7
8
9
10
0
50
100
150
200
250
300
350
400
450
500
03 04 05 06 07 08 09 10 11
Number of cases (left scale)
Value (right scale)
CY
cases tril. yen
Notes: 1. M&A of foreign companies by Japanese companies.Notes: 2. Taken from the "Opinion Poll on Corporate Behavior" in the July 2011 survey.Notes: 3. Figures are calculated as direct investment income (credit) divided by direct investment assets. Figures forNotes: 3. 2011 are based on the quarterly estimate of the international investment position at the end of December
0
2
4
6
8
10
97 98 99 00 01 02 03 04 05 06 07 08 09 10 11
Rate of return on foreign direct investment
ROA of domestic corporations
%
CY
3
4
0
5
10
15
20
25
30
96 97 98 99 00 01 02 03 04 05 06 07 08 09 10 11
Foreign direct investment
Current account
tril. yen
CY
7.6
3.6
4.3
6.1
8.1
19.1
33.671.0
0 10 20 30 40 50 60 70 80
Others
Reduction of tariffs
Qualified humanresources
Reduction of exchangerate changes
Preferential policiesor low tax rate
Diversification ofproduction base
Inexpensive labor cost
Growing local market
%
0
1
2
3
4
5
6
7
8
9
10
0
50
100
150
200
250
300
350
400
450
500
03 04 05 06 07 08 09 10 11
Number of cases (left scale)
Value (right scale)
CY
cases tril. yen
Notes: 3. 2011 are based on the quarterly estimate of the international investment position at the end of DecemberNotes: 2. (preliminary estimate). Financial derivatives are excluded from the quarterly estimate.Notes: 4. Figures are calculated as operating profits divided by total assets and four quarterly averages.Notes: 4. Based on all-size enterprises and all industries. Figures exclude finance and insurance.Sources: Ministry of Finance and Bank of Japan, "Balance of Payments"; RECOF DATA, "MARR";Sources: Development Bank of Japan, "Opinion Poll on Corporate Behavior";Sources: Ministry of Finance, "Financial Statements Statistics of Corporations by Industry, Quarterly."
0
2
4
6
8
10
97 98 99 00 01 02 03 04 05 06 07 08 09 10 11
Rate of return on foreign direct investment
ROA of domestic corporations
%
CY
3
4
0
5
10
15
20
25
30
96 97 98 99 00 01 02 03 04 05 06 07 08 09 10 11
Foreign direct investment
Current account
tril. yen
CY
7.6
3.6
4.3
6.1
8.1
19.1
33.671.0
0 10 20 30 40 50 60 70 80
Others
Reduction of tariffs
Qualified humanresources
Reduction of exchangerate changes
Preferential policiesor low tax rate
Diversification ofproduction base
Inexpensive labor cost
Growing local market
%
0
1
2
3
4
5
6
7
8
9
10
0
50
100
150
200
250
300
350
400
450
500
03 04 05 06 07 08 09 10 11
Number of cases (left scale)
Value (right scale)
CY
cases tril. yen

Chart 46
(1) Number of Employees1,5
Employee Income
3y/y % chg.
-3
-2
-1
0
1
2
3
Part-time employees (Monthly Labour Survey)Full-time employees (Monthly Labour Survey)
y/y % chg.
(2) Breakdown of Total Cash Earnings1,2
-5
-4
-3
-2
-1
0
1
2
3
CY 99 0 0 0 1 0 2 0 3 0 4 0 5 0 6 0 7 0 8 0 9 1 0 1 1 12
Part-time employees (Monthly Labour Survey)Full-time employees (Monthly Labour Survey)Number of regular employees (Monthly Labour Survey)Number of employees (Labour Force Survey)
y/y % chg.
y/y % chg.
-5
-4
-3
-2
-1
0
1
2
3
CY 99 0 0 0 1 0 2 0 3 0 4 0 5 0 6 0 7 0 8 0 9 1 0 1 1 12
Part-time employees (Monthly Labour Survey)Full-time employees (Monthly Labour Survey)Number of regular employees (Monthly Labour Survey)Number of employees (Labour Force Survey)
y/y % chg.
-3
-2
-1
0
1
2
Scheduled cash earnings
y/y % chg.
(3) Breakdown of Employee Income1,2
-5
-4
-3
-2
-1
0
1
2
3
CY 99 0 0 0 1 0 2 0 3 0 4 0 5 0 6 0 7 0 8 0 9 1 0 1 1 12
Part-time employees (Monthly Labour Survey)Full-time employees (Monthly Labour Survey)Number of regular employees (Monthly Labour Survey)Number of employees (Labour Force Survey)
y/y % chg.
-6
-5
-4
-3
-2
-1
0
1
2
9 9 0 0 0 1 0 2 0 3 0 4 0 5 0 6 0 7 0 8 0 9 1 0 1 1
Scheduled cash earnings
Non-scheduled cash earnings
Special cash earnings (bonuses, etc.)
Total cash earnings
y/y % chg.
y/y % chg.
( ) p y
-5
-4
-3
-2
-1
0
1
2
3
CY 99 0 0 0 1 0 2 0 3 0 4 0 5 0 6 0 7 0 8 0 9 1 0 1 1 12
Part-time employees (Monthly Labour Survey)Full-time employees (Monthly Labour Survey)Number of regular employees (Monthly Labour Survey)Number of employees (Labour Force Survey)
y/y % chg.
-6
-5
-4
-3
-2
-1
0
1
2
9 9 0 0 0 1 0 2 0 3 0 4 0 5 0 6 0 7 0 8 0 9 1 0 1 1
Scheduled cash earnings
Non-scheduled cash earnings
Special cash earnings (bonuses, etc.)
Total cash earnings
y/y % chg.
-2
0
2
4
Total cash earnings
y/y % chg.
Notes: 1. Data of the "Monthly Labour Survey" are for establishments with at least five employees.
-5
-4
-3
-2
-1
0
1
2
3
CY 99 0 0 0 1 0 2 0 3 0 4 0 5 0 6 0 7 0 8 0 9 1 0 1 1 12
Part-time employees (Monthly Labour Survey)Full-time employees (Monthly Labour Survey)Number of regular employees (Monthly Labour Survey)Number of employees (Labour Force Survey)
y/y % chg.
-6
-5
-4
-3
-2
-1
0
1
2
9 9 0 0 0 1 0 2 0 3 0 4 0 5 0 6 0 7 0 8 0 9 1 0 1 1
Scheduled cash earnings
Non-scheduled cash earnings
Special cash earnings (bonuses, etc.)
Total cash earnings
y/y % chg.
-8
-6
-4
-2
0
2
4
9 9 0 0 0 1 0 2 0 3 0 4 0 5 0 6 0 7 0 8 0 9 1 0 1 1
Total cash earnings
Number of regular employees
Employee income (Monthly Labour Survey)
Employee income (Labour Force Survey)
y/y % chg.
3
4
2. Q1 = March-May, Q2 = June-August, Q3 = September-November, Q4 = December-February. 3. Calculated as the "number of regular employees" (Monthly Labour Survey) times "total cash earnings"
(Monthly Labour Survey). 4. Calculated as the "number of employees" (Labour Force Survey) times "total cash earnings" (Monthly Labour Survey).5. Figures for 2012/Q1 are January-February averages.
Sources: Ministry of Health, Labour and Welfare, "Monthly Labour Survey"; Ministry of Internal Affairs and Communications, "Labour Force Survey ."

Chart 47
(1) Compensation of Employees (SNA)
Employment and Wages
2
4y/y % chg.
-6
-4
-2
0
2
4
CY 95 96 97 98 99 00 01 02 03 04 05 06 07 08 09 10 11
y/y % chg.
(2) Labor Share1
-6
-4
-2
0
2
4
CY 95 96 97 98 99 00 01 02 03 04 05 06 07 08 09 10 11
y/y % chg.
52535455
s.a., %
(3) B P 2 3 (4) F f S B P 5
-6
-4
-2
0
2
4
CY 95 96 97 98 99 00 01 02 03 04 05 06 07 08 09 10 11
y/y % chg.
4849505152535455
CY 95 96 97 98 99 00 01 02 03 04 05 06 07 08 09 10 11
Labor share (SNA)CY 1995-2011 averageCY 2004-07 average
s.a., %
(3) Bonus Payments2,3 (4) Forecast of Summer Bonus Payments5
-6
-4
-2
0
2
4
CY 95 96 97 98 99 00 01 02 03 04 05 06 07 08 09 10 11
y/y % chg.
39.9
56.1
14.7 26.4
40%
60%
80%
100%
4849505152535455
CY 95 96 97 98 99 00 01 02 03 04 05 06 07 08 09 10 11
Labor share (SNA)CY 1995-2011 averageCY 2004-07 average
s.a., %
0.0
0.5
1.0
1.5
2.0
0123456
y/y % chg. y/y chg., % points
-6
-4
-2
0
2
4
CY 95 96 97 98 99 00 01 02 03 04 05 06 07 08 09 10 11
y/y % chg.
38.5
12.2
39.9
56.1
14.7 26.4
0%
20%
40%
60%
80%
100%
FY 2011 2012Increase from the previous yearRemain unchanged from the previous yearDecrease from the previous year
4849505152535455
CY 95 96 97 98 99 00 01 02 03 04 05 06 07 08 09 10 11
Labor share (SNA)CY 1995-2011 averageCY 2004-07 average
s.a., %
-1.0
-0.5
0.0
0.5
1.0
1.5
2.0
-3-2-10123456
10/Summer Winter 11/Summer WinterConstruction ManufacturingInformation and communications Transport and postal activitiesWholesale and retail trade Education, learning supportMedical, health care and welfare Other
y/y % chg. y/y chg., % points
FY
Notes: 1. Labor share = compensation of employees / nominal GDP × 1002. Summer and winter bonus payments correspond to the sum of special cash earnings in "Monthly Labour Survey"
from June to August and from November to next January, respectively.3. Data from "Monthly Labour Survey" are for establishments with at least five employees.4. Taken from the "Tankan." All-size enterprises and all industries.
-6
-4
-2
0
2
4
CY 95 96 97 98 99 00 01 02 03 04 05 06 07 08 09 10 11
y/y % chg.
38.5
12.2
39.9
56.1
14.7 26.4
0%
20%
40%
60%
80%
100%
FY 2011 2012Increase from the previous yearRemain unchanged from the previous yearDecrease from the previous yearNo response
4849505152535455
CY 95 96 97 98 99 00 01 02 03 04 05 06 07 08 09 10 11
Labor share (SNA)CY 1995-2011 averageCY 2004-07 average
s.a., %
-1.0
-0.5
0.0
0.5
1.0
1.5
2.0
-3-2-10123456
10/Summer Winter 11/Summer WinterConstruction ManufacturingInformation and communications Transport and postal activitiesWholesale and retail trade Education, learning supportMedical, health care and welfare OtherIndustries covered Ratio of current profit to sales
y/y % chg.
(right scale)
y/y chg., % points
4
FY
pThe figures for fiscal 2011 are the forecasts in the March 2012 survey.
5. The result of survey by the Institute of Labour Administration.Sample enterprises are selected from listed enterprises on the Tokyo Stock Exchange First Section and Second Section. The number of reporting enterprises for the results for fiscal 2012 is 148.
Sources: Cabinet Office, "National Accounts"; Ministry of Health, Labour and Welfare, "Monthly Labour Survey";Bank of Japan, "Tankan, Short-Term Economic Survey of Enterprises in Japan";The Institute of Labour Administration.
-6
-4
-2
0
2
4
CY 95 96 97 98 99 00 01 02 03 04 05 06 07 08 09 10 11
y/y % chg.
38.5
12.2
39.9
56.1
14.7 26.4
0%
20%
40%
60%
80%
100%
FY 2011 2012Increase from the previous yearRemain unchanged from the previous yearDecrease from the previous yearNo response
4849505152535455
CY 95 96 97 98 99 00 01 02 03 04 05 06 07 08 09 10 11
Labor share (SNA)CY 1995-2011 averageCY 2004-07 average
s.a., %
-1.0
-0.5
0.0
0.5
1.0
1.5
2.0
-3-2-10123456
10/Summer Winter 11/Summer WinterConstruction ManufacturingInformation and communications Transport and postal activitiesWholesale and retail trade Education, learning supportMedical, health care and welfare OtherIndustries covered Ratio of current profit to sales
y/y % chg.
(right scale)
y/y chg., % points
4
FY
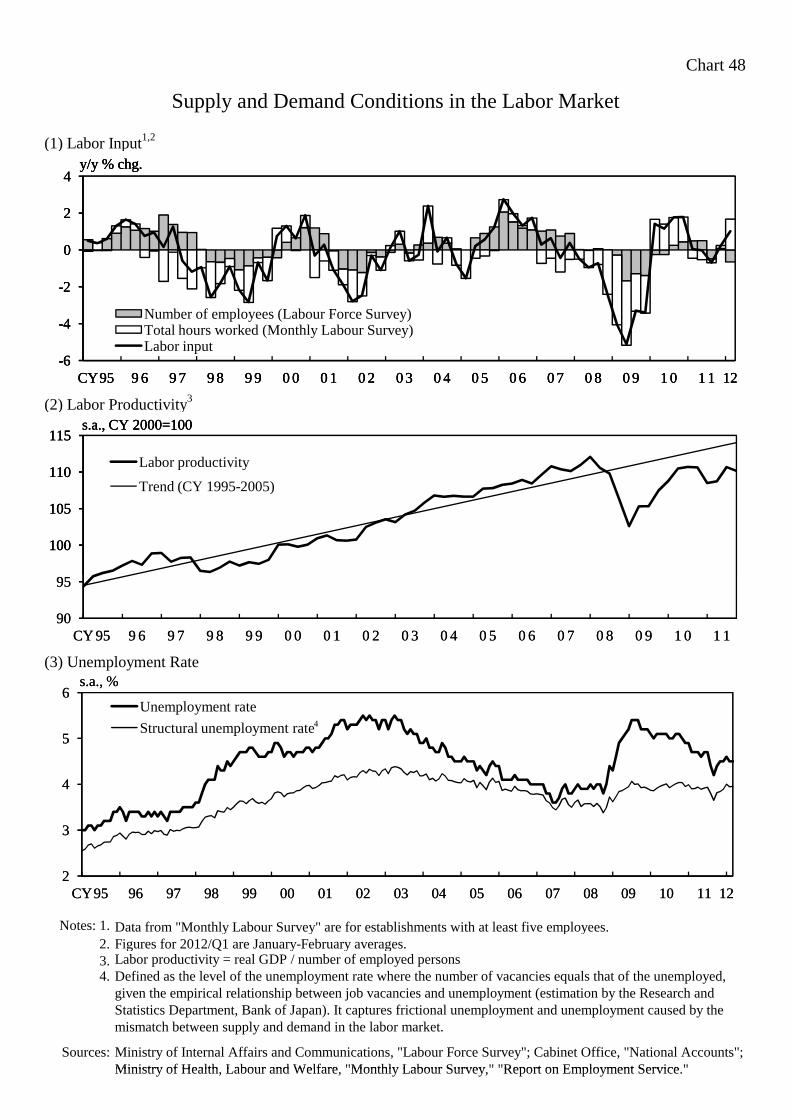
Chart 48
(1) Labor Input1,2
(2) Labor Productivity3
Supply and Demand Conditions in the Labor Market
100
105
110
115
Labor productivity
Trend (CY 1995-2005)
s.a., CY 2000=100
-6
-4
-2
0
2
4
CY95 9 6 9 7 9 8 9 9 0 0 0 1 0 2 0 3 0 4 0 5 0 6 0 7 0 8 0 9 1 0 1 1 12
Number of employees (Labour Force Survey)Total hours worked (Monthly Labour Survey)Labor input
y/y % chg.
(3) Unemployment Rate
Notes: 1. Data from "Monthly Labour Survey" are for establishments with at least five employees.2. Figures for 2012/Q1 are January-February averages. 3. Labor productivity = real GDP / number of employed persons4. Defined as the level of the unemployment rate where the number of vacancies equals that of the unemployed,
given the empirical relationship between job vacancies and unemployment (estimation by the Research and Statistics Department, Bank of Japan). It captures frictional unemployment and unemployment caused by the mismatch between supply and demand in the labor market.
Sources: Ministry of Internal Affairs and Communications, "Labour Force Survey"; Cabinet Office, "National Accounts"; Ministry of Health Labour and Welfare "Monthly Labour Survey " "Report on Employment Service "
90
95
100
105
110
115
CY 95 9 6 9 7 9 8 9 9 0 0 0 1 0 2 0 3 0 4 0 5 0 6 0 7 0 8 0 9 1 0 1 1
Labor productivity
Trend (CY 1995-2005)
s.a., CY 2000=100
2
3
4
5
6
CY95 96 97 98 99 00 01 02 03 04 05 06 07 08 09 10 11 12
Unemployment rate
Structural unemployment rate
s.a., %
4
-6
-4
-2
0
2
4
CY95 9 6 9 7 9 8 9 9 0 0 0 1 0 2 0 3 0 4 0 5 0 6 0 7 0 8 0 9 1 0 1 1 12
Number of employees (Labour Force Survey)Total hours worked (Monthly Labour Survey)Labor input
y/y % chg.
Ministry of Health, Labour and Welfare, "Monthly Labour Survey," "Report on Employment Service."
90
95
100
105
110
115
CY 95 9 6 9 7 9 8 9 9 0 0 0 1 0 2 0 3 0 4 0 5 0 6 0 7 0 8 0 9 1 0 1 1
Labor productivity
Trend (CY 1995-2005)
s.a., CY 2000=100
2
3
4
5
6
CY95 96 97 98 99 00 01 02 03 04 05 06 07 08 09 10 11 12
Unemployment rate
Structural unemployment rate
s.a., %
4
-6
-4
-2
0
2
4
CY95 9 6 9 7 9 8 9 9 0 0 0 1 0 2 0 3 0 4 0 5 0 6 0 7 0 8 0 9 1 0 1 1 12
Number of employees (Labour Force Survey)Total hours worked (Monthly Labour Survey)Labor input
y/y % chg.

Chart 49
(1) Compensation of Employees and Disposable Income of Households1,2
(2) Propensity to Consume2
Disposable Income of Households, Propensity to Consume, and Saving Rates
-8-6-4-202468
1012
85 86 87 88 89 90 91 92 93 94 95 96 97 98 99 00 01 02 03 04 05 06 07 08 09 10 11
Compensation of employeesNominal disposable income of householdsReal disposable income of households
FY
y/y % chg.
90
95
100%
(3) Household Saving Rates2
Notes: 1. The figure for compensation of employees for the second half of fiscal 2011 is calculated using of the average year-on-year rate of change in the period from 2011/Q2-Q4.2. Figures for propensity to consume and household saving rates are on a National Accounts basis. The figure for disposable income of households for the second half of fiscal 2011, and those for propensity to consume and household saving rates for fiscal 2011 are estimated by the Research and Statistics Department, Bank of Japan. They include estimated transfers of income from the government to households through the economic policy packages. Figures up to fiscal 2000 are on the 2000 base. From fiscal 2001, they are on the 2005 base.
Sources: Cabinet Office, "National Accounts"; Ministry of Internal Affairs and Communications, "Consumer Price Index";Sources: Budgets for fiscal 2009-11, etc.
-8-6-4-202468
1012
85 86 87 88 89 90 91 92 93 94 95 96 97 98 99 00 01 02 03 04 05 06 07 08 09 10 11
Compensation of employeesNominal disposable income of householdsReal disposable income of households
FY
y/y % chg.
0
5
10
15
20
85 86 87 88 89 90 91 92 93 94 95 96 97 98 99 00 01 02 03 04 05 06 07 08 09 10 11
%
FY
80
85
90
95
100
85 86 87 88 89 90 91 92 93 94 95 96 97 98 99 00 01 02 03 04 05 06 07 08 09 10 11
%
FY
Sources: Budgets for fiscal 2009 11, etc.

Chart 50
(1) Number of Households by Age1,2 (2) Shares of Private Consumption by Age1
Population Aging and Private Consumption
100% Estimates
70%
40
50
60
70
80
90
100
70+ 65-6960 64 55 59
% Estimates
30
40
50
60
70
-3940-5960-6465+
%
0
10
20
30
40
50
60
70
80
90
100
90 94 98 02 06 10 14 18 22 26 30
70+ 65-6960-64 55-5950-54 45-4940-44 35-3930-34 25-29-24
% Estimates
CY0
10
20
30
40
50
60
70
85 90 95 00 05 10
-3940-5960-6465+
%
CY
(3) Propensity to Consume by Age3 (4) Change in Propensity to Consume3
0
10
20
30
40
50
60
70
80
90
100
90 94 98 02 06 10 14 18 22 26 30
70+ 65-6960-64 55-5950-54 45-4940-44 35-3930-34 25-29-24
% Estimates
CY0
10
20
30
40
50
60
70
85 90 95 00 05 10
-3940-5960-6465+
%
CY
130
140
CY 2000CY 2005CY 2011
%
7
8
9
10 Changes in household compositionAges 60+50-5940-4930-39
cumulative changes from 2000, % points
0
10
20
30
40
50
60
70
80
90
100
90 94 98 02 06 10 14 18 22 26 30
70+ 65-6960-64 55-5950-54 45-4940-44 35-3930-34 25-29-24
% Estimates
CY0
10
20
30
40
50
60
70
85 90 95 00 05 10
-3940-5960-6465+
%
CY
90
100
110
120
130
140
CY 2000CY 2005CY 2011
%
1
2
3
4
5
6
7
8
9
10 Changes in household compositionAges 60+50-5940-4930-39-29Cumulative change
cumulative changes from 2000, % points
Note: The breakdown is based on the following equation.
0
10
20
30
40
50
60
70
80
90
100
90 94 98 02 06 10 14 18 22 26 30
70+ 65-6960-64 55-5950-54 45-4940-44 35-3930-34 25-29-24
% Estimates
CY0
10
20
30
40
50
60
70
85 90 95 00 05 10
-3940-5960-6465+
%
CY
60
70
80
90
100
110
120
130
140
CY 2000CY 2005CY 2011
%
-1
0
1
2
3
4
5
6
7
8
9
10
01 03 05 07 09 11
Changes in household compositionAges 60+50-5940-4930-39-29Cumulative change
cumulative changes from 2000, % points
CY
∑⎤⎡⎟⎞
⎜⎛ ′
⎟⎞
⎜⎛ ′
⎟⎞
⎜⎛ ′
⎟⎞
⎜⎛ ′′ CCYYYYCCCC 11
C : Consumption, Y : Disposable income, i : Age brackets, C' : C t+1
Notes: 1. Based on the "Family Income and Expenditure Survey" (two-or-more-person households). Figures up to 1999 exclude agricultural, forestry, and fisheries households.
0
10
20
30
40
50
60
70
80
90
100
90 94 98 02 06 10 14 18 22 26 30
70+ 65-6960-64 55-5950-54 45-4940-44 35-3930-34 25-29-24
% Estimates
CY0
10
20
30
40
50
60
70
85 90 95 00 05 10
-3940-5960-6465+
%
CY
Changes within age brackets
Propensity to consume (y/y chg.)
Changes in household composition
60
70
80
90
100
110
120
130
140
-24 25-29
30-34
35-39
40-44
45-49
50-54
55-59
60-64
65-69
70+
CY 2000CY 2005CY 2011
%
age
-1
0
1
2
3
4
5
6
7
8
9
10
01 03 05 07 09 11
Changes in household compositionAges 60+50-5940-4930-39-29Cumulative change
cumulative changes from 2000, % points
CY
∑ ⎥⎦
⎤⎢⎣
⎡⎟⎟⎠
⎞⎜⎜⎝
⎛+′′
⎟⎠⎞
⎜⎝⎛ −
′′
+⎟⎠⎞
⎜⎝⎛ +
′′
⎟⎟⎠
⎞⎜⎜⎝
⎛−′′
=−′′
i i
i
i
iiiii
i
i
i
i
Y
C
Y
C
Y
Y
Y
Y
Y
Y
Y
Y
Y
C
Y
C
Y
C
Y
C
2
1
2
1
g y2. Up to 1999, figures for ages 70+ are calculated using the ratio of the figures for ages 70+ to those of 65+
as of 2000. Estimates from 2012 are based on household projections (March 2008) by the National Instituteof Population and Social Security Research.
3. Figures for propensity to consume are calculated by using consumption expenditure and disposable income, which are averages weighted by the number of workers' households and no-occupation households.
Sources: Ministry of Internal Affairs and Communications, "Family Income and Expenditure Survey"; National Institute of Population and Social Security Research, "Household Projections for Japan."
∑ ⎥⎦
⎤⎢⎣
⎡⎟⎟⎠
⎞⎜⎜⎝
⎛+′′
⎟⎠⎞
⎜⎝⎛ −
′′
+⎟⎠⎞
⎜⎝⎛ +
′′
⎟⎟⎠
⎞⎜⎜⎝
⎛−′′
=−′′
i i
i
i
iiiii
i
i
i
i
Y
C
Y
C
Y
Y
Y
Y
Y
Y
Y
Y
Y
C
Y
C
Y
C
Y
C
2
1
2
1

Chart 51
(1) Oil Prices
(2) International Commodity Prices
International Commodity Prices and Overseas Economies
0
20
40
60
80
100
120
140
99 00 01 02 03 04 05 06 07 08 09 10 11 12
WTI
Dubai
monthly avg., US$/barrel
CY
100
150
200
250
150
210
270
330Grain Index (left scale)Copper (left scale)Aluminum (left scale)Bank of Japan Overseas Commodity Index (right scale)
end of month, CY 2005=100monthly avg., CY 2005=100
Note: The Grain Index is the weighted average of prices of three selected items (wheat, soybeans, and corn) in overseas commodity markets. The weights are based on the value of imports in the Trade Statistics of Japan.
(3) International Commodity Prices and Overseas Economies
Sources: Bank of Japan, "Bank of Japan Overseas Commodity Index"; IMF, "World Economic Outlook," etc.
0
20
40
60
80
100
120
140
99 00 01 02 03 04 05 06 07 08 09 10 11 12
WTI
Dubai
monthly avg., US$/barrel
CY
0
50
100
150
200
250
30
90
150
210
270
330
99 00 01 02 03 04 05 06 07 08 09 10 11 12
Grain Index (left scale)Copper (left scale)Aluminum (left scale)Bank of Japan Overseas Commodity Index (right scale)
end of month, CY 2005=100monthly avg., CY 2005=100
CY
-50-40
-30
-20
-100
10
2030
40
50
-4
-2
0
2
4
6
8
10
12
80 82 84 86 88 90 92 94 96 98 00 02 04 06 08 10 12
Real GDP growth rate of the overseas total (left scale)
RJ/CRB Index (right scale)
y/y % chg.
CY
y/y % chg.
Sources: Bank of Japan, Bank of Japan Overseas Commodity Index ; IMF, World Economic Outlook, etc.
0
20
40
60
80
100
120
140
99 00 01 02 03 04 05 06 07 08 09 10 11 12
WTI
Dubai
monthly avg., US$/barrel
CY
0
50
100
150
200
250
30
90
150
210
270
330
99 00 01 02 03 04 05 06 07 08 09 10 11 12
Grain Index (left scale)Copper (left scale)Aluminum (left scale)Bank of Japan Overseas Commodity Index (right scale)
end of month, CY 2005=100monthly avg., CY 2005=100
CY
-50-40
-30
-20
-100
10
2030
40
50
-4
-2
0
2
4
6
8
10
12
80 82 84 86 88 90 92 94 96 98 00 02 04 06 08 10 12
Real GDP growth rate of the overseas total (left scale)
RJ/CRB Index (right scale)
y/y % chg.
CY
y/y % chg.

Chart 52
(1) Expected Rates of Inflation over the Medium to Long Term (Economists, Households)
Inflation Expectations
2y/y % chg.
1
2y/y % chg.
0
1
2
Economists (six to ten years ahead [Consensus Forecasts])
y/y % chg.
Note: Figures for households are estimated using the modified Carlson-Parkin method. For details, see "On
-1
0
1
2
CY 0 5 0 6 0 7 0 8 0 9 1 0 1 1 1 2
Economists (six to ten years ahead [Consensus Forecasts])
Households (over the next five years [Opinion Survey on the General Public's Views and Behavior])
y/y % chg.
g g ,Inflation Expectations," Bank of Japan Review Series, 2008-J-15 (available in Japanese only).
(2) Expected Rates of Inflation (Market Participants)
2 y/y % chg.
-1
0
1
2
CY 0 5 0 6 0 7 0 8 0 9 1 0 1 1 1 2
Economists (six to ten years ahead [Consensus Forecasts])
Households (over the next five years [Opinion Survey on the General Public's Views and Behavior])
y/y % chg.
0
1
2 y/y % chg.
-1
0
1
2
CY 0 5 0 6 0 7 0 8 0 9 1 0 1 1 1 2
Economists (six to ten years ahead [Consensus Forecasts])
Households (over the next five years [Opinion Survey on the General Public's Views and Behavior])
y/y % chg.
-1
0
1
2
Yearly average (one year ahead)
Yearly average (one to two years ahead)
Yearly average of an eight-year period (two to ten years ahead)
y/y % chg.
-1
0
1
2
CY 0 5 0 6 0 7 0 8 0 9 1 0 1 1 1 2
Economists (six to ten years ahead [Consensus Forecasts])
Households (over the next five years [Opinion Survey on the General Public's Views and Behavior])
y/y % chg.
Sources: Bank of Japan, "Opinion Survey on the General Public's Views and Behavior"; Consensus Economics Inc.,"Consensus Forecasts"; QUICK, "Quick Bond Monthly Survey."
-2
-1
0
1
2
0 5 0 6 0 7 0 8 0 9 1 0 1 1 1 2
Yearly average (one year ahead)
Yearly average (one to two years ahead)
Yearly average of an eight-year period (two to ten years ahead)
y/y % chg.
CY
-1
0
1
2
CY 0 5 0 6 0 7 0 8 0 9 1 0 1 1 1 2
Economists (six to ten years ahead [Consensus Forecasts])
Households (over the next five years [Opinion Survey on the General Public's Views and Behavior])
y/y % chg.
; Q , Q y y
-2
-1
0
1
2
0 5 0 6 0 7 0 8 0 9 1 0 1 1 1 2
Yearly average (one year ahead)
Yearly average (one to two years ahead)
Yearly average of an eight-year period (two to ten years ahead)
y/y % chg.
CY
-1
0
1
2
CY 0 5 0 6 0 7 0 8 0 9 1 0 1 1 1 2
Economists (six to ten years ahead [Consensus Forecasts])
Households (over the next five years [Opinion Survey on the General Public's Views and Behavior])
y/y % chg.

Chart 53
(1) Output Gap
Output Gap and Potential Growth Rate
7%
1
2
3
4
5
6
7
Capital input gap
Labor input gap
Output gap
%
-4
-3
-2
-1
0
1
2
3
4
5
6
7
Capital input gap
Labor input gap
Output gap
%
(2) Potential Growth Rate
-7
-6
-5
-4
-3
-2
-1
0
1
2
3
4
5
6
7
75 76 77 78 79 80 81 82 83 84 85 86 87 88 89 90 91 92 93 94 95 96 97 98 99 00 01 02 03 04 05 06 07 08 09 10 11
Capital input gap
Labor input gap
Output gap
%
FY
6y/y % chg.
-7
-6
-5
-4
-3
-2
-1
0
1
2
3
4
5
6
7
75 76 77 78 79 80 81 82 83 84 85 86 87 88 89 90 91 92 93 94 95 96 97 98 99 00 01 02 03 04 05 06 07 08 09 10 11
Capital input gap
Labor input gap
Output gap
%
FY
3
4
5
6
Labor hoursNumber of employedCapital stockTotal factor productivityPotential growth rate
y/y % chg.
-7
-6
-5
-4
-3
-2
-1
0
1
2
3
4
5
6
7
75 76 77 78 79 80 81 82 83 84 85 86 87 88 89 90 91 92 93 94 95 96 97 98 99 00 01 02 03 04 05 06 07 08 09 10 11
Capital input gap
Labor input gap
Output gap
%
FY
0
1
2
3
4
5
6
Labor hoursNumber of employedCapital stockTotal factor productivityPotential growth rate
y/y % chg.
-7
-6
-5
-4
-3
-2
-1
0
1
2
3
4
5
6
7
75 76 77 78 79 80 81 82 83 84 85 86 87 88 89 90 91 92 93 94 95 96 97 98 99 00 01 02 03 04 05 06 07 08 09 10 11
Capital input gap
Labor input gap
Output gap
%
FY
-2
-1
0
1
2
3
4
5
6
77 78 79 80 81 82 83 84 85 86 87 88 89 90 91 92 93 94 95 96 97 98 99 00 01 02 03 04 05 06 07 08 09 10 11
Labor hoursNumber of employedCapital stockTotal factor productivityPotential growth rate
y/y % chg.
FY
Notes: 1. The output gap and the potential growth rate are estimated by the Research and Statistics Department, Bank f J F th ti ti d "Th N E ti t f O t t G d P t ti l G th R t "
-7
-6
-5
-4
-3
-2
-1
0
1
2
3
4
5
6
7
75 76 77 78 79 80 81 82 83 84 85 86 87 88 89 90 91 92 93 94 95 96 97 98 99 00 01 02 03 04 05 06 07 08 09 10 11
Capital input gap
Labor input gap
Output gap
%
FY
-2
-1
0
1
2
3
4
5
6
77 78 79 80 81 82 83 84 85 86 87 88 89 90 91 92 93 94 95 96 97 98 99 00 01 02 03 04 05 06 07 08 09 10 11
Labor hoursNumber of employedCapital stockTotal factor productivityPotential growth rate
y/y % chg.
FY
Sources: Cabinet Office, "National Accounts"; Ministry of Internal Affairs and Communications, "Labour Force Survey"; Ministry of Health, Labour and Welfare, "Monthly Labour Survey," "Report on Employment Service"; Ministry of Economy, Trade and Industry, "Indices of Industrial Production"; Bank of Japan, "Tankan,Short-Term Economic Survey of Enterprises in Japan," etc.
Notes: 1. The output gap and the potential growth rate are estimated by the Research and Statistics Department, Bank of Japan. For the estimation procedures, see "The New Estimates of Output Gap and Potential Growth Rate," Bank of Japan Review Series, 2006-E-3.
2. Figures for the second half of fiscal 2011 are those of 2011/Q4.

Chart 54
(1) Phillips Curve (CPI Less Fresh Food)1,2,3
Output Gap and Inflation Rate (1)
3 5CPI less fresh food, y/y % chg.
1.0
1.5
2.0
2.5
3.0
3.5
1983/Q1-2012/Q1
CPI less fresh food, y/y % chg.
1983/Q1-2012/Q12012/Q1
-2.0
-1.5
-1.0
-0.5
0.0
0.5
1.0
1.5
2.0
2.5
3.0
3.5
1983/Q1-2012/Q1
CPI less fresh food, y/y % chg.
1983/Q1-2012/Q1y = 0.33x + 0.6
2012/Q1
(2) Phillips Curve (CPI Less Fresh Food, Laspeyres Chain Index)1,2,3,4
-2.5
-2.0
-1.5
-1.0
-0.5
0.0
0.5
1.0
1.5
2.0
2.5
3.0
3.5
-9 -8 -7 -6 -5 -4 -3 -2 -1 0 1 2 3 4 5 6 7 8
1983/Q1-2012/Q1
output gap (four-quarter lead, %)
CPI less fresh food, y/y % chg.
1983/Q1-2012/Q1y = 0.33x + 0.6
2012/Q1
3 5CPI less fresh food, Laspeyres chain index, y/y % chg.
-2.5
-2.0
-1.5
-1.0
-0.5
0.0
0.5
1.0
1.5
2.0
2.5
3.0
3.5
-9 -8 -7 -6 -5 -4 -3 -2 -1 0 1 2 3 4 5 6 7 8
1983/Q1-2012/Q1
output gap (four-quarter lead, %)
CPI less fresh food, y/y % chg.
1983/Q1-2012/Q1y = 0.33x + 0.6
2012/Q1
0.5
1.0
1.5
2.0
2.5
3.0
3.5
1983/Q1-2012/Q1
1983/Q1-2012/Q10 35 + 0 6
2012/Q1
CPI less fresh food, Laspeyres chain index, y/y % chg.
-2.5
-2.0
-1.5
-1.0
-0.5
0.0
0.5
1.0
1.5
2.0
2.5
3.0
3.5
-9 -8 -7 -6 -5 -4 -3 -2 -1 0 1 2 3 4 5 6 7 8
1983/Q1-2012/Q1
output gap (four-quarter lead, %)
CPI less fresh food, y/y % chg.
1983/Q1-2012/Q1y = 0.33x + 0.6
2012/Q1
-2.0
-1.5
-1.0
-0.5
0.0
0.5
1.0
1.5
2.0
2.5
3.0
3.5
1983/Q1-2012/Q1
1983/Q1-2012/Q1y = 0.35x + 0.6
2012/Q1
CPI less fresh food, Laspeyres chain index, y/y % chg.
Notes: 1. The circled marks are the latest four positions. Notes: 2. Figures for the CPI are adjusted to exclude the effect of changes in the consumption tax rate.Notes: 3. The output gap is estimated by the Research and Statistics Department, Bank of Japan. For the
-2.5
-2.0
-1.5
-1.0
-0.5
0.0
0.5
1.0
1.5
2.0
2.5
3.0
3.5
-9 -8 -7 -6 -5 -4 -3 -2 -1 0 1 2 3 4 5 6 7 8
1983/Q1-2012/Q1
output gap (four-quarter lead, %)
CPI less fresh food, y/y % chg.
1983/Q1-2012/Q1y = 0.33x + 0.6
2012/Q1
-2.5
-2.0
-1.5
-1.0
-0.5
0.0
0.5
1.0
1.5
2.0
2.5
3.0
3.5
-9 -8 -7 -6 -5 -4 -3 -2 -1 0 1 2 3 4 5 6 7 8
1983/Q1-2012/Q1
output gap (four-quarter lead, %)
1983/Q1-2012/Q1y = 0.35x + 0.6
2012/Q1
CPI less fresh food, Laspeyres chain index, y/y % chg.
p g p y p , pNotes: 4. estimation procedures, see "The New Estimates of Output Gap and Potential Growth Rate," BankNotes: 4. of Japan Review Series, 2006-E-3.Notes: 4. Figures for the CPI (Laspeyres chain index) up to 2000/Q4 are based on the fixed-base index, and figures from 2001/Q1 are based on the Laspeyres chain index. However, figures for the Laspeyres chain index of the 2000 base are estimated by the Research and Statistics Department, Bank of Japan.Sources: Ministry of Internal Affairs and Communications, "Consumer Price Index";Sources: Cabinet Office, "National Accounts," etc.
-2.5
-2.0
-1.5
-1.0
-0.5
0.0
0.5
1.0
1.5
2.0
2.5
3.0
3.5
-9 -8 -7 -6 -5 -4 -3 -2 -1 0 1 2 3 4 5 6 7 8
1983/Q1-2012/Q1
output gap (four-quarter lead, %)
CPI less fresh food, y/y % chg.
1983/Q1-2012/Q1y = 0.33x + 0.6
2012/Q1
-2.5
-2.0
-1.5
-1.0
-0.5
0.0
0.5
1.0
1.5
2.0
2.5
3.0
3.5
-9 -8 -7 -6 -5 -4 -3 -2 -1 0 1 2 3 4 5 6 7 8
1983/Q1-2012/Q1
output gap (four-quarter lead, %)
1983/Q1-2012/Q1y = 0.35x + 0.6
2012/Q1
CPI less fresh food, Laspeyres chain index, y/y % chg.

Chart 55
(1) Output Gap and CPI
(2) Comparison in Business Cycles
(a) 1987/Q2 Onward (b) 1994/Q1 Onward
Notes: 1. Alcoholic beverages are excluded from food.
2. Figures for the CPI are adjusted to exclude the effect of changes in the consumption tax rate.
3. The output gap is estimated by the Research and Statistics Department, Bank of Japan.
For the estimation procedures, see "The New Estimates of Output Gap and Potential
Growth Rate," Bank of Japan Review Series, 2006-E-3.
4. Less fresh food.
Sources: Ministry of Internal Affairs and Communications, "Consumer Price Index";
Cabinet Office, "National Accounts," etc.
Output Gap and Inflation Rate (2)
-10
-8
-6
-4
-2
0
2
4
6
8
10
-4
-3
-2
-1
0
1
2
3
4
83 84 85 86 87 88 89 90 91 92 93 94 95 96 97 98 99 00 01 02 03 04 05 06 07 08 09 10 11
CPI (less fresh food, left scale)
CPI (less food and energy, left scale)
Output gap (right scale)
%y/y % chg.
CY 12
2
1,2
3
-4
-2
0
2
4
6
-2
-1
0
1
2
3
0 5 8
y/y % chg. %
quarters
-4
-2
0
2
4
6
-2
-1
0
1
2
3
0 5 14
y/y % chg. %
quarters
Period of
improvement
in the output
gap
Turning point
of the rate of
increase in the
CPI4
1% increase
since the
turning point
Period 1987/Q2 1988/Q3 1989/Q2
CPI4 (y/y % chg.) -- 0.2% 1.5%
Period of
improvement
in the output
gap
Turning point
of the rate of
increase in the
CPI4
1% increase
since the
turning point
Period 1994/Q1 1995/Q2 1997/Q3
CPI4 (y/y % chg.) -- -0.2% 0.8%

Chart 56
(1) Fixed-Base Index and Laspeyres Chain Index (All Items Less Fresh Food)
(2) CPI Weight (CY 2011)1 (3) CPI Weight of TV Sets5
CPI Laspeyres Chain Index
Note: Figures for the Laspeyres chain index for 2006 are the year-on-year rates for the fixed-base method. The year-on-year figures for the Laspeyres chain index up to 2010 are on the 2005 base, and those from 2011 onward are on the 2010 base.
-3.0
-2.5
-2.0
-1.5
-1.0
-0.5
0.0
0.5
1.0
1.5
2.0
2.5
0 6 0 7 0 8 0 9 1 0 1 1 1 2
Difference (Laspeyres chain index - fixed-base index)
Laspeyres chain index
Fixed-base index
y/y % chg., % points
2010 base CPI
CY
(2) CPI Weight (CY 2011)1 (3) CPI Weight of TV Sets5
0
20
40
60
80
100
120
2005 base 2010 base CY 2011
per 10,000
Note: Figures for the Laspeyres chain index for 2006 are the year-on-year rates for the fixed-base method. The year-on-year figures for the Laspeyres chain index up to 2010 are on the 2005 base, and those from 2011 onward are on the 2010 base.
-3.0
-2.5
-2.0
-1.5
-1.0
-0.5
0.0
0.5
1.0
1.5
2.0
2.5
0 6 0 7 0 8 0 9 1 0 1 1 1 2
Difference (Laspeyres chain index - fixed-base index)
Laspeyres chain index
Fixed-base index
y/y % chg., % points
2010 base CPI
CY
Notes: 1. The items are basically the same as those defined by the Ministry of Internal Affairs and Communications.However, electricity, manufactured & piped gas & water charges are excluded from goods.
Notes: 2. Less fresh food. Notes: 3. Less agricultural, aquatic & livestock products.Notes: 4. Including electricity, manufactured & piped gas & water charges.Notes: 5. The figure for the 2005 base is based on the midpoint-year revision.
Source: Ministry of Internal Affairs and Communications, "Consumer Price Index."
per 10,000
2010 base(A)
2011(B)
Difference(B) - (A)
10,000 10,000 -
9,604 9,611 7
293 294 1
3,729 3,690 -40
Durable goods 660 583 -77
Petroleum products 359 377 18
Food products 1,337 1,350 13
1,712 1,753 41
3,869 3,873 4
Goods1,3
Public services4
General services
All items
All items,less fresh food
Agricultural, aquatic &
livestock products2

Chart 57
(1) Ratio of Job Offers to Applicants
Employment Conditions in the Disaster Areas
(Total for Japan) (Iwate, Miyagi, and Fukushima)
0 9
1.0
3
4 s.a., timesy/y % chg.
0 9
1.0
3
4 s.a., timesy/y % chg.
0.5
0.6
0.7
0.8
0.9
1.0
-1
0
1
2
3
4 s.a., timesy/y % chg.
0.5
0.6
0.7
0.8
0.9
1.0
-1
0
1
2
3
4 s.a., timesy/y % chg.
(2) Status of New Job Openings by Industry(Iwate, Miyagi, and Fukushima)(Total for Japan)
100y/y % chg.
100y/y % chg.
0.2
0.3
0.4
0.5
0.6
0.7
0.8
0.9
1.0
-4
-3
-2
-1
0
1
2
3
4
CY 0 8 0 9 1 0 1 1 12
Number of persons insured by employment insurance (left scale)Ratio of job offers to applicants (right scale)
s.a., timesy/y % chg.
0.2
0.3
0.4
0.5
0.6
0.7
0.8
0.9
1.0
-4
-3
-2
-1
0
1
2
3
4
CY 0 8 0 9 1 0 1 1 12
s.a., timesy/y % chg.
20
40
60
80
100y/y % chg.
20
40
60
80
100ConstructionManufacturingTransport and postal activitiesWholesale and retail tradeAccommodations, eating and drinking servicesMedical, health care and welfareServices (not elsewhere classified)OthersNew job offers
y/y % chg.
0.2
0.3
0.4
0.5
0.6
0.7
0.8
0.9
1.0
-4
-3
-2
-1
0
1
2
3
4
CY 0 8 0 9 1 0 1 1 12
Number of persons insured by employment insurance (left scale)Ratio of job offers to applicants (right scale)
s.a., timesy/y % chg.
0.2
0.3
0.4
0.5
0.6
0.7
0.8
0.9
1.0
-4
-3
-2
-1
0
1
2
3
4
CY 0 8 0 9 1 0 1 1 12
s.a., timesy/y % chg.
(4) Unit Price for Labor Service in Public Works(3) Extended Payments of Employment Insurance
-20
0
20
40
60
80
100
10/4 7 11/1 7 12/1
y/y % chg.
-20
0
20
40
60
80
100
10/4 7 11/1 7 12/1
ConstructionManufacturingTransport and postal activitiesWholesale and retail tradeAccommodations, eating and drinking servicesMedical, health care and welfareServices (not elsewhere classified)OthersNew job offers
y/y % chg.
0.2
0.3
0.4
0.5
0.6
0.7
0.8
0.9
1.0
-4
-3
-2
-1
0
1
2
3
4
CY 0 8 0 9 1 0 1 1 12
Number of persons insured by employment insurance (left scale)Ratio of job offers to applicants (right scale)
s.a., timesy/y % chg.
0.2
0.3
0.4
0.5
0.6
0.7
0.8
0.9
1.0
-4
-3
-2
-1
0
1
2
3
4
CY 0 8 0 9 1 0 1 1 12
s.a., timesy/y % chg.
10 thous yen(3) Benefits in the Disaster Areas
-20
0
20
40
60
80
100
10/4 7 11/1 7 12/1
y/y % chg.
-20
0
20
40
60
80
100
10/4 7 11/1 7 12/1
ConstructionManufacturingTransport and postal activitiesWholesale and retail tradeAccommodations, eating and drinking servicesMedical, health care and welfareServices (not elsewhere classified)OthersNew job offers
y/y % chg.
0.2
0.3
0.4
0.5
0.6
0.7
0.8
0.9
1.0
-4
-3
-2
-1
0
1
2
3
4
CY 0 8 0 9 1 0 1 1 12
Number of persons insured by employment insurance (left scale)Ratio of job offers to applicants (right scale)
s.a., timesy/y % chg.
0.2
0.3
0.4
0.5
0.6
0.7
0.8
0.9
1.0
-4
-3
-2
-1
0
1
2
3
4
CY 0 8 0 9 1 0 1 1 12
s.a., timesy/y % chg.
1 6
1.7
1.8
Japan's total
10 thous. yen
March 2009 -Case-by-case extended
payments1 + 60 days
May 2011 -
Additional extension on thecase-by-case extended
payments2
+ 60 days
Payment of the wide area
Notes: 1. Introduced after the Lehman shock. For workers who (1) are under the age of 45, (2) reside in the designated areas, or (3) are approved by the Chief of the Public Employment Security Office.
-20
0
20
40
60
80
100
10/4 7 11/1 7 12/1
y/y % chg.
-20
0
20
40
60
80
100
10/4 7 11/1 7 12/1
ConstructionManufacturingTransport and postal activitiesWholesale and retail tradeAccommodations, eating and drinking servicesMedical, health care and welfareServices (not elsewhere classified)OthersNew job offers
y/y % chg.
0.2
0.3
0.4
0.5
0.6
0.7
0.8
0.9
1.0
-4
-3
-2
-1
0
1
2
3
4
CY 0 8 0 9 1 0 1 1 12
Number of persons insured by employment insurance (left scale)Ratio of job offers to applicants (right scale)
s.a., timesy/y % chg.
0.2
0.3
0.4
0.5
0.6
0.7
0.8
0.9
1.0
-4
-3
-2
-1
0
1
2
3
4
CY 0 8 0 9 1 0 1 1 12
s.a., timesy/y % chg.
1.5
1.6
1.7
1.8
FY 05 06 07 08 09 10 11 12
Japan's totalIwateMiyagiFukushima
10 thous. yen
March 2009 -Case-by-case extended
payments1 + 60 days
May 2011 -
Additional extension on thecase-by-case extended
payments2
+ 60 days
+) October 2011 -Payment of the wide area
extended benefits3 + 90 days
+ 210 daysMaximum days of extended payments
, ( ) pp y p y y2. For workers who were separated from employment or suspended from work due to the Great East Japan
Earthquake.3. For workers who reside in the coastal areas in Iwate, Miyagi, and Fukushima prefectures.
Sources: Ministry of Health, Labour and Welfare, "Report on Employment Service," "Monthly Report on Employment Insurance Services";Prefectural Labour Offices, "Employment Referrals for General Workers";Ministry of Land, Infrastructure, Transport and Tourism, etc.
-20
0
20
40
60
80
100
10/4 7 11/1 7 12/1
y/y % chg.
-20
0
20
40
60
80
100
10/4 7 11/1 7 12/1
ConstructionManufacturingTransport and postal activitiesWholesale and retail tradeAccommodations, eating and drinking servicesMedical, health care and welfareServices (not elsewhere classified)OthersNew job offers
y/y % chg.
0.2
0.3
0.4
0.5
0.6
0.7
0.8
0.9
1.0
-4
-3
-2
-1
0
1
2
3
4
CY 0 8 0 9 1 0 1 1 12
Number of persons insured by employment insurance (left scale)Ratio of job offers to applicants (right scale)
s.a., timesy/y % chg.
0.2
0.3
0.4
0.5
0.6
0.7
0.8
0.9
1.0
-4
-3
-2
-1
0
1
2
3
4
CY 0 8 0 9 1 0 1 1 12
s.a., timesy/y % chg.
1.5
1.6
1.7
1.8
FY 05 06 07 08 09 10 11 12
Japan's totalIwateMiyagiFukushima
10 thous. yen
March 2009 -Case-by-case extended
payments1 + 60 days
May 2011 -
Additional extension on thecase-by-case extended
payments2
+ 60 days
+) October 2011 -Payment of the wide area
extended benefits3 + 90 days
+ 210 daysMaximum days of extended payments
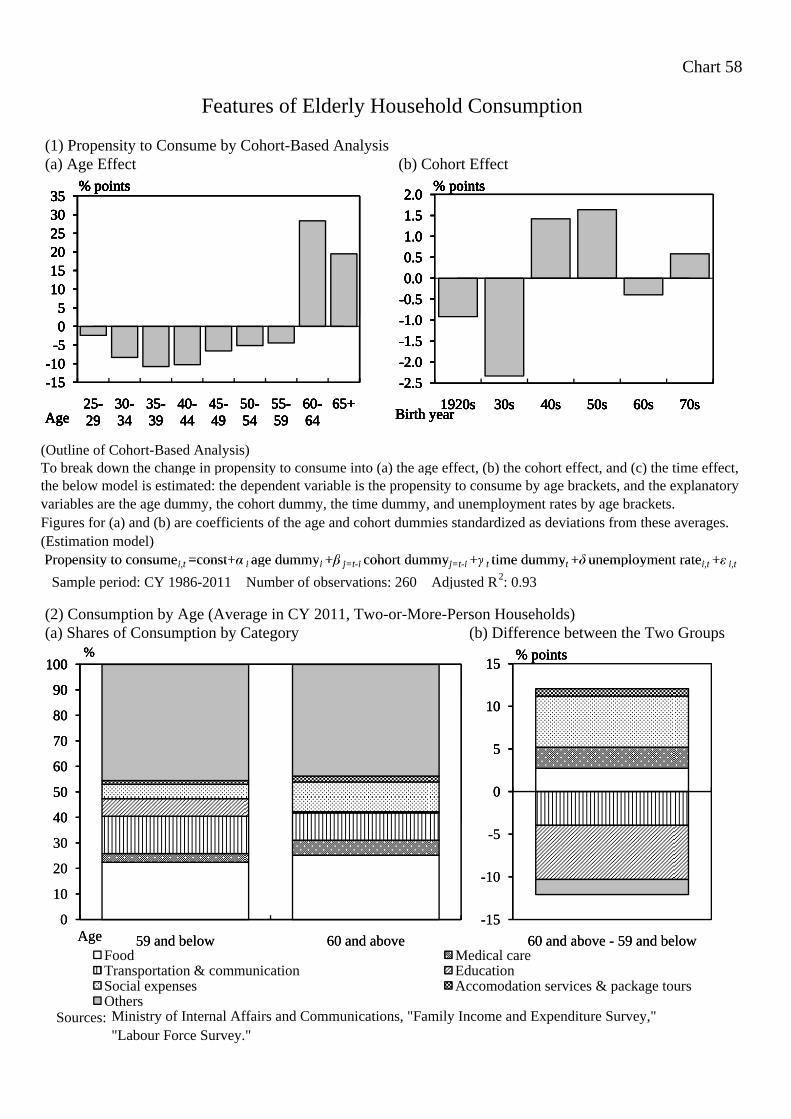
Chart 58
(1) Propensity to Consume by Cohort-Based Analysis (a) Age Effect (b) Cohort Effect
Features of Elderly Household Consumption
2 0% points% points
1 0
-0.5
0.0
0.5
1.0
1.5
2.0% points
5101520253035
% points
-2.5
-2.0
-1.5
-1.0
-0.5
0.0
0.5
1.0
1.5
2.0
1920s 30s 40s 50s 60s 70s
% points
Birth year
-15-10
-505
101520253035
25-29
30-34
35-39
40-44
45-49
50-54
55-59
60-64
65+
% points
Age
(Outline of Cohort-Based Analysis)To break down the change in propensity to consume into (a) the age effect, (b) the cohort effect, and (c) the time effect, the below model is estimated: the dependent variable is the propensity to consume by age brackets, and the explanatoryvariables are the age dummy, the cohort dummy, the time dummy, and unemployment rates by age brackets. Figures for (a) and (b) are coefficients of the age and cohort dummies standardized as deviations from these averages.(Estimation model)Propensity to consumei t =const+α i age dummyi +β j=t i cohort dummyj=t i +γ t time dummyt +δ unemployment ratei t +ε i t
-2.5
-2.0
-1.5
-1.0
-0.5
0.0
0.5
1.0
1.5
2.0
1920s 30s 40s 50s 60s 70s
% points
Birth year
-15-10
-505
101520253035
25-29
30-34
35-39
40-44
45-49
50-54
55-59
60-64
65+
% points
Age
Propensity to consumei,t =const+α i age dummyi +β j=t-i cohort dummyj=t-i +γ t time dummyt +δ unemployment ratei,t +ε i,t
Sample period: CY 1986-2011 Number of observations: 260 Adjusted R2: 0.93
(2) Consumption by Age (Average in CY 2011, Two-or-More-Person Households) (a) Shares of Consumption by Category (b) Difference between the Two Groups
90
100%
-2.5
-2.0
-1.5
-1.0
-0.5
0.0
0.5
1.0
1.5
2.0
1920s 30s 40s 50s 60s 70s
% points
Birth year
-15-10
-505
101520253035
25-29
30-34
35-39
40-44
45-49
50-54
55-59
60-64
65+
% points
Age
15% points
40
50
60
70
80
90
100%
-2.5
-2.0
-1.5
-1.0
-0.5
0.0
0.5
1.0
1.5
2.0
1920s 30s 40s 50s 60s 70s
% points
Birth year
-15-10
-505
101520253035
25-29
30-34
35-39
40-44
45-49
50-54
55-59
60-64
65+
% points
Age
0
5
10
15% points
0
10
20
30
40
50
60
70
80
90
100
59 and below 60 and above
%
Age
-2.5
-2.0
-1.5
-1.0
-0.5
0.0
0.5
1.0
1.5
2.0
1920s 30s 40s 50s 60s 70s
% points
Birth year
-15-10
-505
101520253035
25-29
30-34
35-39
40-44
45-49
50-54
55-59
60-64
65+
% points
Age
-15
-10
-5
0
5
10
15
60 and above - 59 and below
% points
Sources: Ministry of Internal Affairs and Communications, "Family Income and Expenditure Survey,""Labour Force Survey."
0
10
20
30
40
50
60
70
80
90
100
59 and below 60 and aboveFood Medical careTransportation & communication EducationSocial expenses Accomodation services & package toursOthers
%
Age
-2.5
-2.0
-1.5
-1.0
-0.5
0.0
0.5
1.0
1.5
2.0
1920s 30s 40s 50s 60s 70s
% points
Birth year
-15-10
-505
101520253035
25-29
30-34
35-39
40-44
45-49
50-54
55-59
60-64
65+
% points
Age
-15
-10
-5
0
5
10
15
60 and above - 59 and below
% points

Chart 59
Information Available in Deriving Inflation Expectations
(1) Surveys and Indicators Related to Inflation Expectations
Sectors Examples
Consumer price index (CPI)
Opinion Survey on the General Public's Views and Behavior
Corporate goods price index (CGPI)
Tankan
Opinion Survey on the General Public's Views and Behavior
Consumer Confidence Survey
Tankan (forecasts of "Change in Output Prices" and
"Change in Input Prices")
ESP Forecast Survey
Consensus Forecasts
Market participants Quick Bond Monthly Survey
Break-even inflation rate(fixed-rate JGB yield - inflation-indexed JGB yield)
Inflation swap rate
Implied forward rate
Methods
Market participants
Households
Enterprises
Households
Economists
EnterprisesSurveys(qualitative/
quantitative)
Market priceinformation
Actual results
Forecasts
(2) Amount Outstanding of Inflation-Indexed Government Bonds
(a) Japan1,2 (b) United States3
5
10
12Amount outstanding (left scale)
Ratio to amount outstanding of JGBs
tril. yen %
12
14
700
800Amount outstanding (left scale)
Ratio to amount outstanding of U S
%bil. U.S. dollars
Sectors Examples
Consumer price index (CPI)
Opinion Survey on the General Public's Views and Behavior
Corporate goods price index (CGPI)
Tankan
Opinion Survey on the General Public's Views and Behavior
Consumer Confidence Survey
Tankan (forecasts of "Change in Output Prices" and
"Change in Input Prices")
ESP Forecast Survey
Consensus Forecasts
Market participants Quick Bond Monthly Survey
Break-even inflation rate(fixed-rate JGB yield - inflation-indexed JGB yield)
Inflation swap rate
Implied forward rate
Methods
Market participants
Households
Enterprises
Households
Economists
EnterprisesSurveys(qualitative/
quantitative)
Market priceinformation
Actual results
Forecasts
2
3
4
5
6
8
10
12Amount outstanding (left scale)
Ratio to amount outstanding of JGBs (right scale)
tril. yen %
6
8
10
12
14
400
500
600
700
800Amount outstanding (left scale)
Ratio to amount outstanding of U.S. Treasury securities (right scale)
%bil. U.S. dollars
Sectors Examples
Consumer price index (CPI)
Opinion Survey on the General Public's Views and Behavior
Corporate goods price index (CGPI)
Tankan
Opinion Survey on the General Public's Views and Behavior
Consumer Confidence Survey
Tankan (forecasts of "Change in Output Prices" and
"Change in Input Prices")
ESP Forecast Survey
Consensus Forecasts
Market participants Quick Bond Monthly Survey
Break-even inflation rate(fixed-rate JGB yield - inflation-indexed JGB yield)
Inflation swap rate
Implied forward rate
Methods
Market participants
Households
Enterprises
Households
Economists
EnterprisesSurveys(qualitative/
quantitative)
Market priceinformation
Actual results
Forecasts
0
1
2
3
4
5
0
2
4
6
8
10
12Amount outstanding (left scale)
Ratio to amount outstanding of JGBs (right scale)
tril. yen %
0
2
4
6
8
10
12
14
0
100
200
300
400
500
600
700
800Amount outstanding (left scale)
Ratio to amount outstanding of U.S. Treasury securities (right scale)
%bil. U.S. dollars
Sectors Examples
Consumer price index (CPI)
Opinion Survey on the General Public's Views and Behavior
Corporate goods price index (CGPI)
Tankan
Opinion Survey on the General Public's Views and Behavior
Consumer Confidence Survey
Tankan (forecasts of "Change in Output Prices" and
"Change in Input Prices")
ESP Forecast Survey
Consensus Forecasts
Market participants Quick Bond Monthly Survey
Break-even inflation rate(fixed-rate JGB yield - inflation-indexed JGB yield)
Inflation swap rate
Implied forward rate
Methods
Market participants
Households
Enterprises
Households
Economists
EnterprisesSurveys(qualitative/
quantitative)
Market priceinformation
Actual results
Forecasts
Notes: 1. Figures for Japan for fiscal 2011 are those of December 2011.2. JGBs = general bonds + fiscal investment and loan program bonds3. U.S. Treasury securities exclude nonmarketable bonds.
Sources: Ministry of Finance; CEA, "Economic Report of the President."
0
1
2
3
4
5
0
2
4
6
8
10
12
03 04 05 06 07 08 09 10 11
Amount outstanding (left scale)
Ratio to amount outstanding of JGBs (right scale)
tril. yen %
0
2
4
6
8
10
12
14
0
100
200
300
400
500
600
700
800
03 04 05 06 07 08 09 10 11
Amount outstanding (left scale)
Ratio to amount outstanding of U.S. Treasury securities (right scale)
%bil. U.S. dollars
FY FY
Sectors Examples
Consumer price index (CPI)
Opinion Survey on the General Public's Views and Behavior
Corporate goods price index (CGPI)
Tankan
Opinion Survey on the General Public's Views and Behavior
Consumer Confidence Survey
Tankan (forecasts of "Change in Output Prices" and
"Change in Input Prices")
ESP Forecast Survey
Consensus Forecasts
Market participants Quick Bond Monthly Survey
Break-even inflation rate(fixed-rate JGB yield - inflation-indexed JGB yield)
Inflation swap rate
Implied forward rate
Methods
Market participants
Households
Enterprises
Households
Economists
EnterprisesSurveys(qualitative/
quantitative)
Market priceinformation
Actual results
Forecasts

Reference
Economic Assessment by Region (Regional Economic Report)
Region Assessment in January 2012
Changes from the previous assessment
Assessment in April 2012
Hokkaido The economy is more or less unchanged, as the pick-up in economic activity is pausing.
The economy has been more or less unchanged.
Tohoku
The economy has been recovering as a whole, as evident from the following factors: (1) economic activity in non-stricken areas has exceeded pre-earthquake levels due to the demand stemming from the disaster; and (2) there are signs of resumption in economic activity even in some of the stricken areas.
The economy has been recovering as a whole, as evident from the following factors: (1) economic activity in non-stricken areas has been above pre-earthquake levels due to the demand stemming from the disaster; and (2) there are signs of resumption in economic activity even in the stricken areas.
Hokuriku The economy continues to pick up as a whole, although the pace of the pick-up is moderating in some aspects.
The economy continues to pick up as a whole, although the pace of the pick-up is moderating in some aspects.
Kanto- Koshinetsu
The pick-up in economic activity appears to be pausing, mainly due to the effects of the slowdown in overseas economies and the appreciation of the yen.
The economy is more or less unchanged, mainly due to the effects of the slowdown in overseas economies and the appreciation of the yen.
Tokai The economy continues to pick up, but the pace of the pick-up is moderating.
The economy has continued to pick up.
Kinki The economy has paused.
The economy has paused.
Chugoku The pick-up in economic activity is pausing.
The economy is more or less unchanged.
Shikoku The economy has been on a pick-up trend as a whole, although there appear to be signs of weakness on the production side.
The economy has been picking up as a whole, as some weakness observed on the production side has begun to ease.
Kyushu- Okinawa
The pace of the pick-up in economic activity has slowed, as the effects of the slowdown in overseas economies are beginning to weigh on production.
The economy continues to pick up as a whole, although the pace of the pick-up remains moderate.
Note: The Regional Economic Report (summary) is available on the Bank of Japan's web site (http://www.boj.or.jp/en/research/brp/rer/rer120412.htm/).
Source: Bank of Japan, "Regional Economic Report (Summary) April 2012."