outlook: 2014 2023 - renapri
TRANSCRIPT

1st Annual Regional Agricultural Outlook: 2014 – 2023
Anticipating and responding to policy challenges in the decade ahead
Presentation at 1st Annual ReNAPRI Outlook Symposium Lusaka, Zambia
November 4th, 2014

Outline
1. ReNAPRI: localizing agricultural policy research
– The Network
– The Modelling Framework
2. Sector Level Analysis: 2014 – 2023 regional maize outlook
– Global outlook
– Regional outlook
3. Farm Level Analysis: benchmarking maize cost of production
4. Strategic Foresighting: border closing scenario

ReNAPRI: Localizing Agricultural Policy Research
• The Goal:
– Provide policy-makers with relevant and accurate information
• The Challenge:
– Regional agricultural policy research and outreach is largely driven by
non-African institutions
– In terms of implementation, this external analysis has yielded very little
fruit to date.

ReNAPRI: Localizing Agricultural Policy Research
• Regional Network of Agricultural Policy Research Institutes (ReNAPRI)
– Offers a unique solution:
• African-led, African-driven initiative with a ground-up approach to policy research
– Membership includes existing policy research institutes with a proven track-record of policy advisement within their respective countries.

• Institute for Social and Economic Research, University of Kinshasa - Democratic Republic of Congo
• Tegemeo Institute of Agricultural Policy and Development, Egerton University – Kenya
• Centre for Agricultural Research and Development, Lilongwe University of Agriculture & Natural Resources – Malawi
• CEPPAG, University of Eduardo Mondlane – Mozambique
• Bureau for Food and Agricultural Policy (BFAP). University of Pretoria & Stellenbosch - South Africa
• Department of Agriculture Economics and Agribusiness, Sokoine University of Agriculture - United Republic of Tanzania
• Indaba Agriculture Policy Research Institute (IAPRI) - Zambia
ReNAPRI: Localizing Agricultural Policy Research

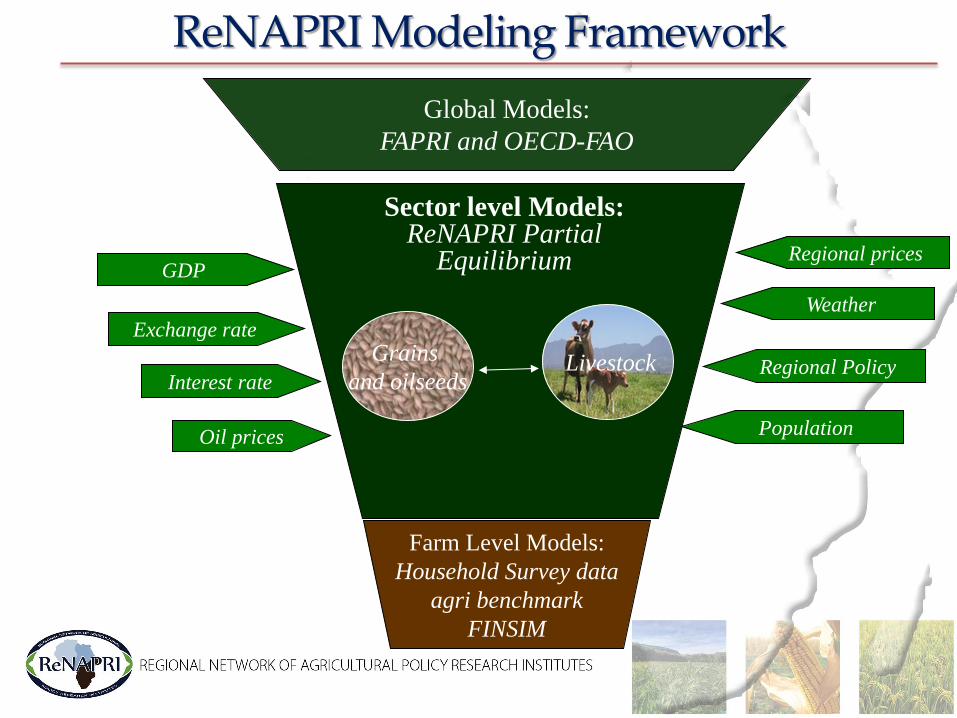
Global Models:
FAPRI and OECD-FAO
GDP
Exchange rate
Interest rate
Regional prices
Weather
Population
Regional Policy
Farm Level Models:
Household Survey data
agri benchmark
FINSIM
Sector level Models: ReNAPRI Partial
Equilibrium
Livestock Grains
and oilseeds
Oil prices
ReNAPRI Modeling Framework
Maize Markets: global drivers
Patrick Westhoff ([email protected]) FAPRI-MU director
University of Missouri www.fapri.missouri.edu

Agenda
• Why have world maize prices declined from recent record levels?
• What are the main drivers of future market prices?
• What can we expect?
• How uncertain are projections? Why?

U.S. maize export prices What went up has come back down
0
50
100
150
200
250
300
350
Jan 2010 Jan 2011 Jan 2012 Jan 2013 Jan 2014
Do
llars
per
to
nn
e
FOB Gulf
Source: USDA Economic Research Service. Last data point is September 2014.
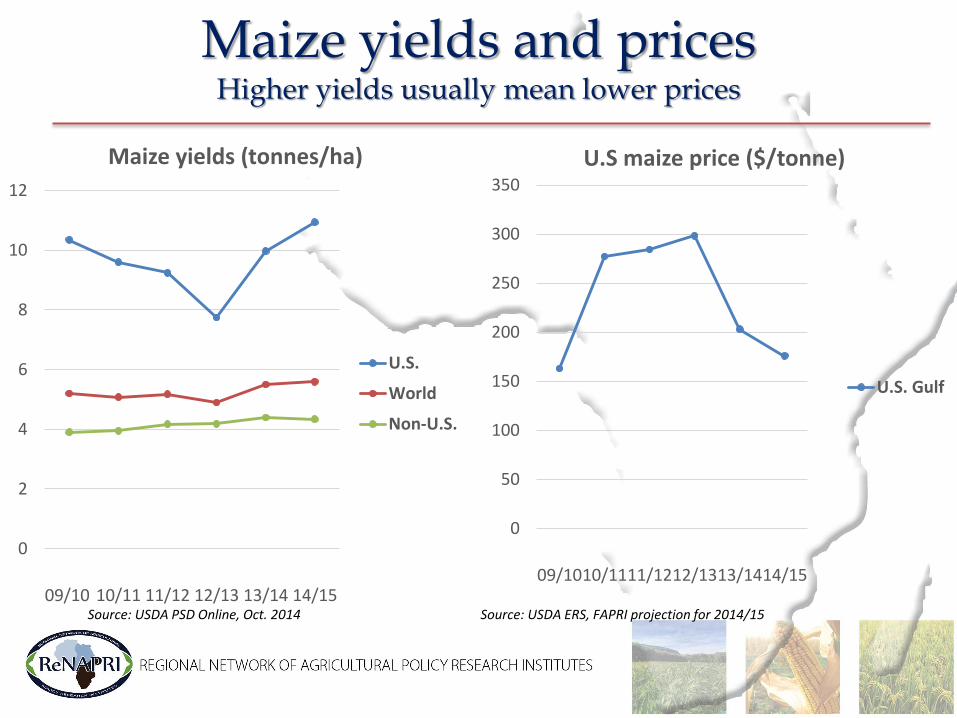
Maize yields and prices Higher yields usually mean lower prices
0
2
4
6
8
10
12
09/10 10/11 11/12 12/13 13/14 14/15
Maize yields (tonnes/ha)
U.S.
World
Non-U.S.
0
50
100
150
200
250
300
350
09/1010/1111/1212/1313/1414/15
U.S maize price ($/tonne)
U.S. Gulf
Source: USDA PSD Online, Oct. 2014 Source: USDA ERS, FAPRI projection for 2014/15

Maize Utilization
0
50
100
150
200
250
300
350
Mill
ion
to
nn
es
U.S. domestic maize use
Feed All other (inc. ethanol)
0
50
100
150
200
250
300
350
Mill
ion
to
nn
es
China domestic maize use
Feed All other (inc. ethanol)
Source: USDA PSD Online, Oct. 2014

World Maize Production, Use and Carryover Stocks
0
200
400
600
800
1000
1200
05/06 07/08 09/10 11/12 13/14 15/16 17/18 19/20 21/22 23/24
Mill
ion
to
nn
es
Production
Use
Stocks
Source: Unpublished FAPRI-MU baseline update, October 2014
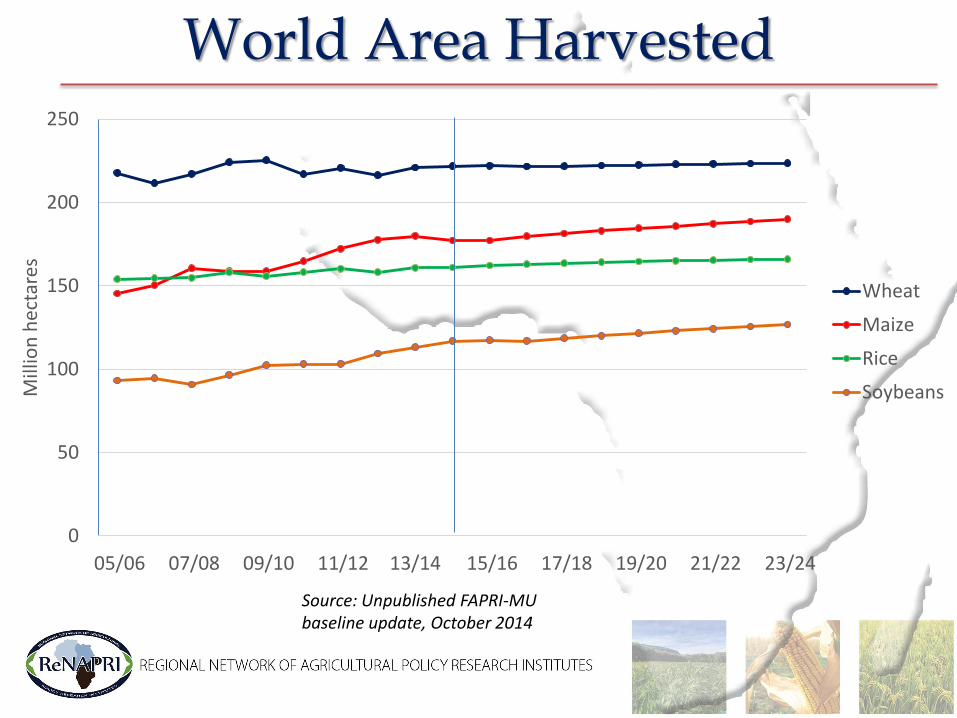
World Area Harvested
0
50
100
150
200
250
05/06 07/08 09/10 11/12 13/14 15/16 17/18 19/20 21/22 23/24
Mill
ion
hec
tare
s
Wheat
Maize
Rice
Soybeans
Source: Unpublished FAPRI-MU baseline update, October 2014

World Area Harvested
0
100
200
300
400
500
600
700
800
05/06 07/08 09/10 11/12 13/14 15/16 17/18 19/20 21/22 23/24
Mill
ion
hec
tare
s
Soybeans
Rice
Maize
Wheat
Source: Unpublished FAPRI-MU baseline update, October 2014

World crop yields
0
1
2
3
4
5
6
7
05/06 07/08 09/10 11/12 13/14 15/16 17/18 19/20 21/22 23/24
Ton
nes
per
hec
tare
Maize
Wheat
Milled rice
Soybeans
Source: Unpublished FAPRI-MU baseline update, October 2014

World Crop Use (total)
0
200
400
600
800
1000
1200
05/06 07/08 09/10 11/12 13/14 15/16 17/18 19/20 21/22 23/24
Mill
ion
to
nn
es
Maize
Wheat
Milled rice
Soybeans
Source: Unpublished FAPRI-MU baseline update, October 2014
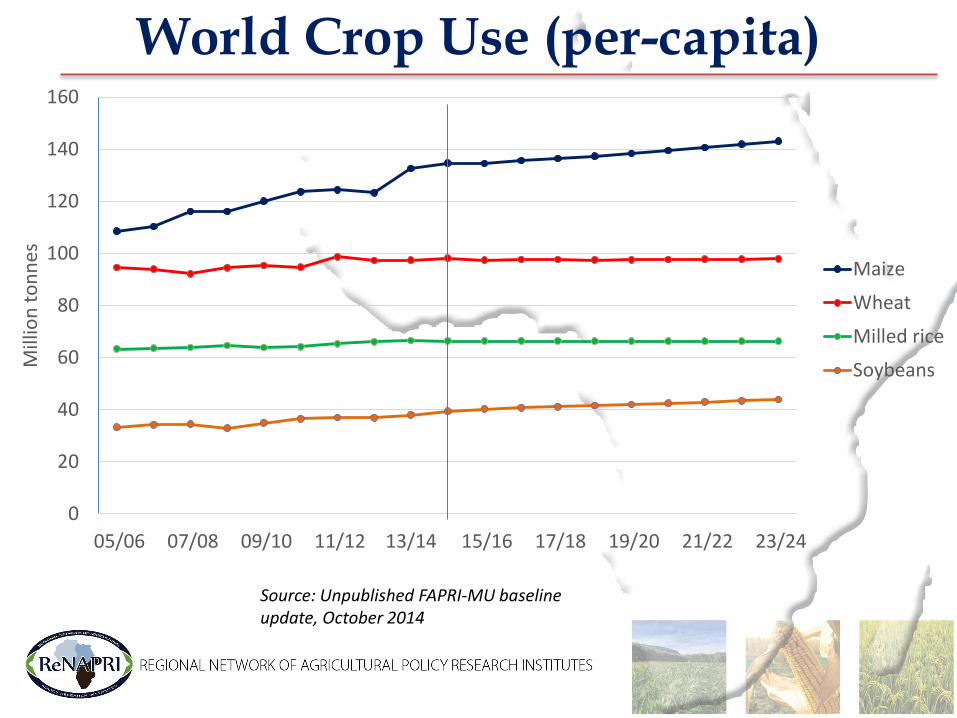
World Crop Use (per-capita)
0
20
40
60
80
100
120
140
160
05/06 07/08 09/10 11/12 13/14 15/16 17/18 19/20 21/22 23/24
Mill
ion
to
nn
es
Maize
Wheat
Milled rice
Soybeans
Source: Unpublished FAPRI-MU baseline update, October 2014
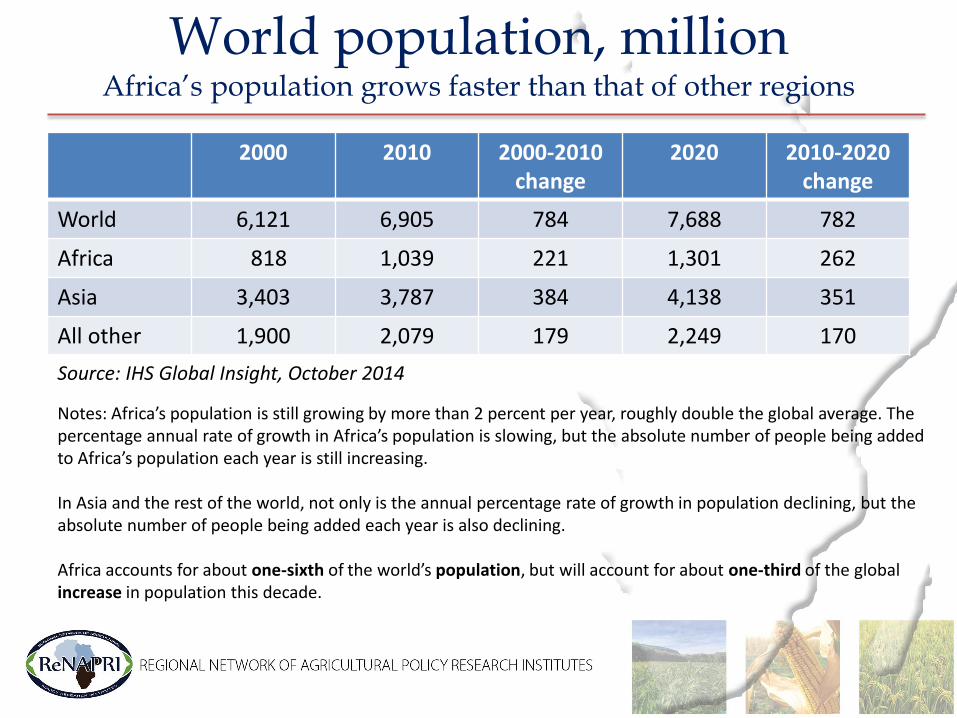
World population, million Africa’s population grows faster than that of other regions
2000 2010 2000-2010 change
2020 2010-2020 change
World 6,121 6,905 784 7,688 782
Africa 818 1,039 221 1,301 262
Asia 3,403 3,787 384 4,138 351
All other 1,900 2,079 179 2,249 170
Source: IHS Global Insight, October 2014
Notes: Africa’s population is still growing by more than 2 percent per year, roughly double the global average. The percentage annual rate of growth in Africa’s population is slowing, but the absolute number of people being added to Africa’s population each year is still increasing. In Asia and the rest of the world, not only is the annual percentage rate of growth in population declining, but the absolute number of people being added each year is also declining. Africa accounts for about one-sixth of the world’s population, but will account for about one-third of the global increase in population this decade.

U.S. Export Prices for Wheat and Maize
0
50
100
150
200
250
300
350
05/06 07/08 09/10 11/12 13/14 15/16 17/18 19/20 21/22 23/24
Do
llars
per
to
nn
e
Wheat
Maize
Source: Unpublished FAPRI-MU baseline update, October 2014
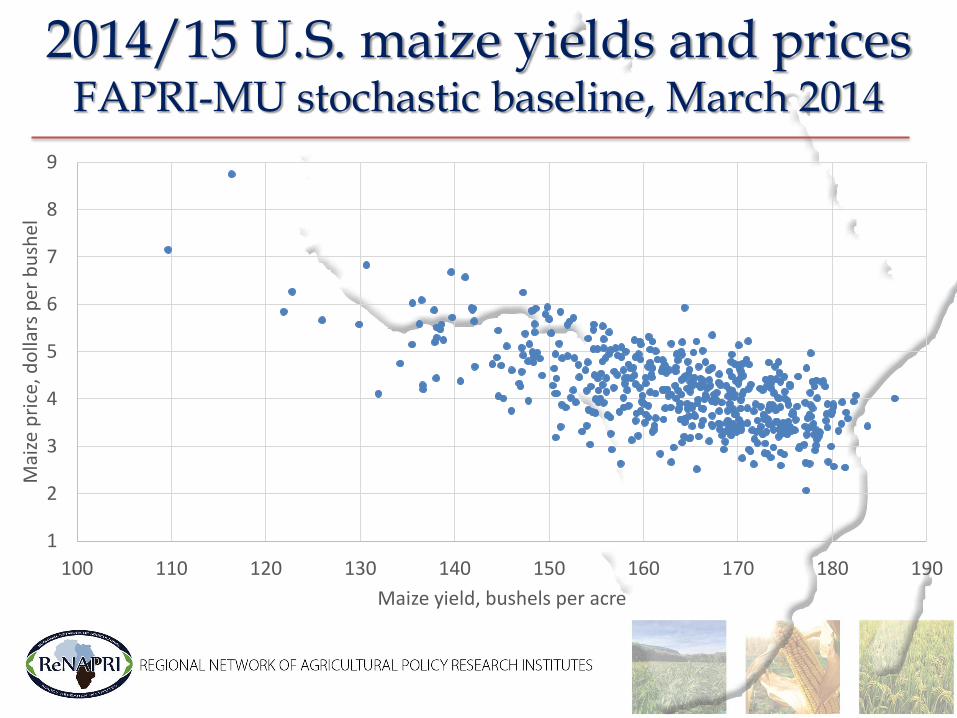
2014/15 U.S. maize yields and prices FAPRI-MU stochastic baseline, March 2014
1
2
3
4
5
6
7
8
9
100 110 120 130 140 150 160 170 180 190
Mai
ze p
rice
, do
llars
per
bu
shel
Maize yield, bushels per acre
2014/15 U.S. maize yields and prices FAPRI-MU stochastic baseline, March 2014
0
50
100
150
200
250
300
350
400
6 7 8 9 10 11 12
Mai
ze p
rice
, do
llars
per
to
nn
e
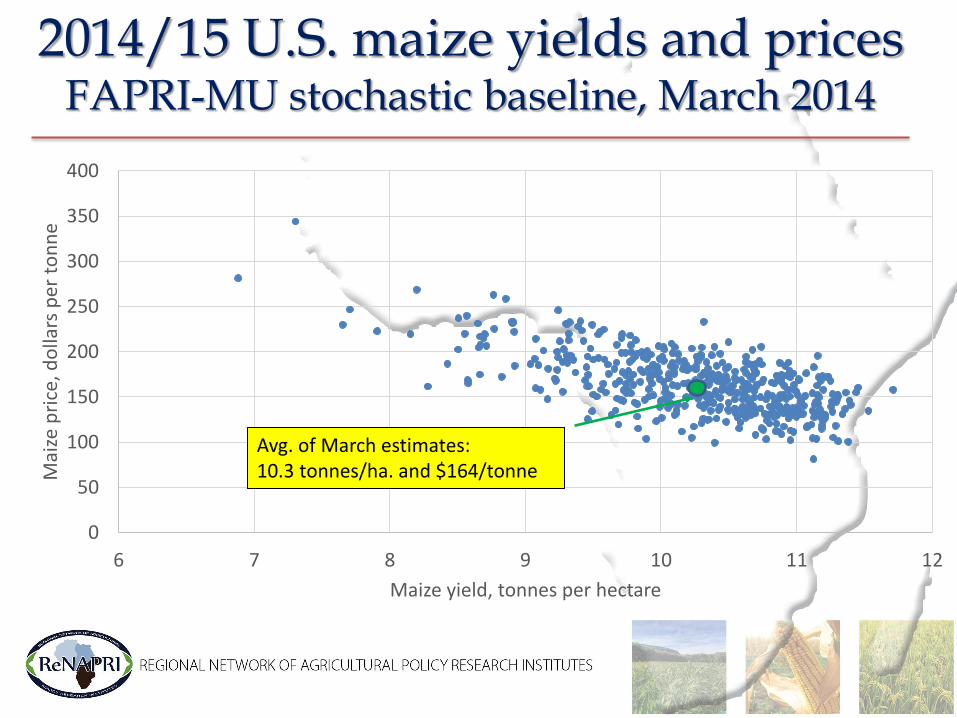
Maize yield, tonnes per hectare
Avg. of March estimates: 10.3 tonnes/ha. and $164/tonne

2014/15 U.S. maize yields and prices FAPRI-MU stochastic baseline, March 2014
0
50
100
150
200
250
300
350
400
6 7 8 9 10 11 12
Mai
ze p
rice
, do
llars
per
to
nn
e
Maize yield, tonnes per hectare
October USDA estimates: 10.9 tonnes/ha. and $134/tonne
Avg. of March estimates: 10.3 tonnes/ha. and $164/tonne
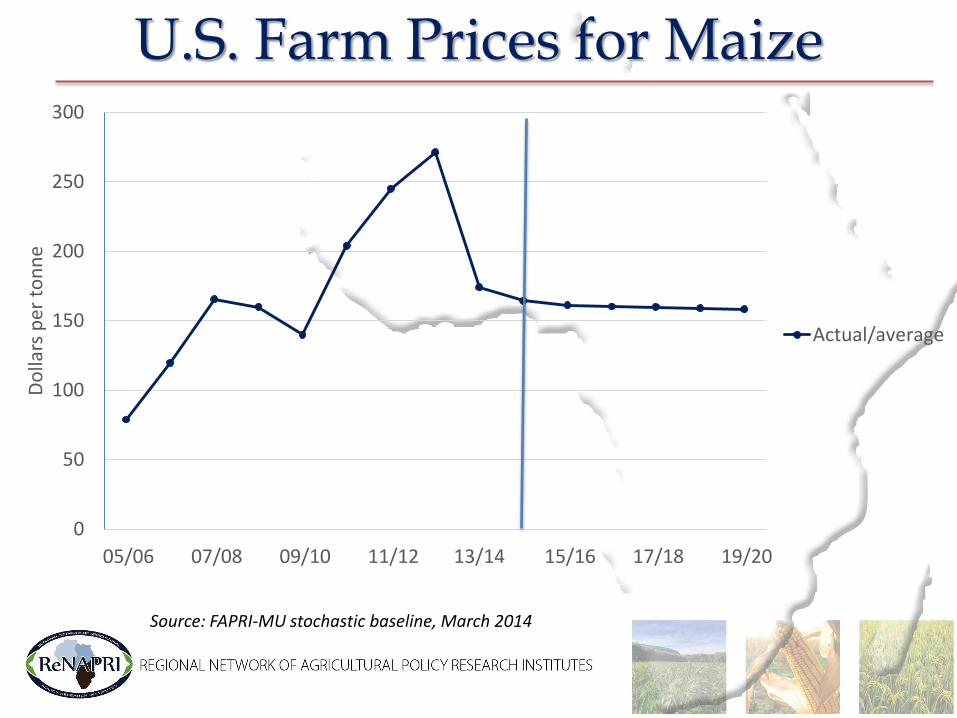
U.S. Farm Prices for Maize
Source: FAPRI-MU stochastic baseline, March 2014
0
50
100
150
200
250
300
05/06 07/08 09/10 11/12 13/14 15/16 17/18 19/20
Do
llars
per
to
nn
e
Actual/average
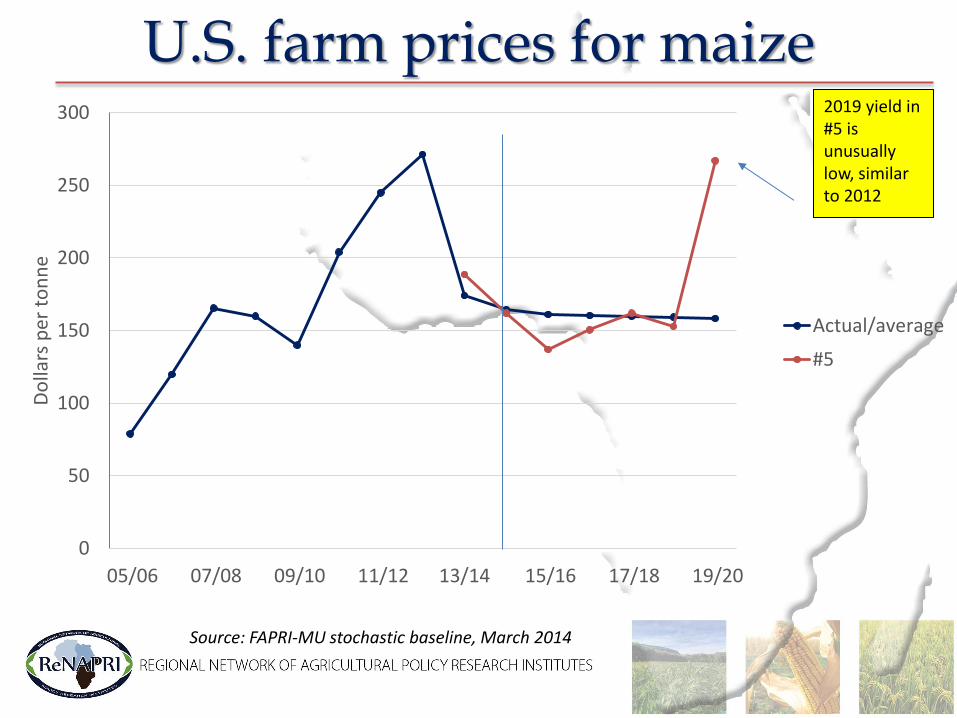
U.S. farm prices for maize
0
50
100
150
200
250
300
05/06 07/08 09/10 11/12 13/14 15/16 17/18 19/20
Do
llars
per
to
nn
e
Actual/average
#5
Source: FAPRI-MU stochastic baseline, March 2014
2019 yield in #5 is unusually low, similar to 2012

U.S. Farm Prices for Maize
Source: FAPRI-MU stochastic baseline, March 2014
0
50
100
150
200
250
300
05/06 07/08 09/10 11/12 13/14 15/16 17/18 19/20
Do
llars
per
to
nn
e
Actual/average
#5
#250
#495
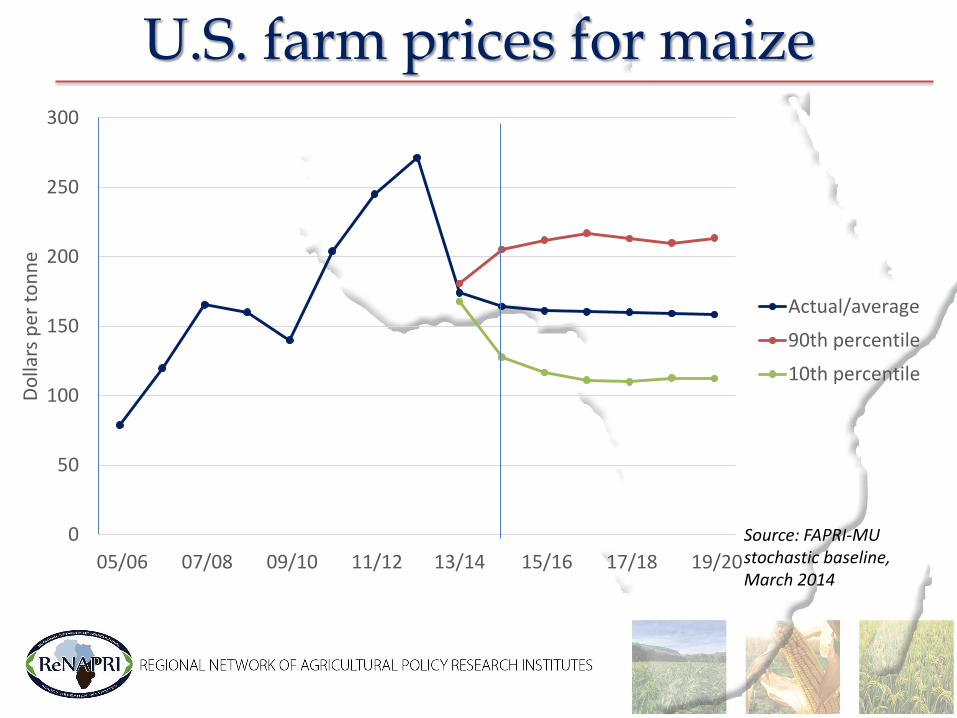
U.S. farm prices for maize
0
50
100
150
200
250
300
05/06 07/08 09/10 11/12 13/14 15/16 17/18 19/20
Do
llars
per
to
nn
e
Actual/average
90th percentile
10th percentile
Source: FAPRI-MU stochastic baseline, March 2014

Final comments • Recent swings in global maize prices are largely due to U.S. weather,
which lowered yields in 2012 and raised them in 2014
• U.S. ethanol and China have been major sources of demand growth—China may continue to grow, but U.S. ethanol may not
• Longer-term price trends depend on relative rates of growth in technology (yields), population, and per-capita demand
• We expect maize prices to average above recent lows, but below 2012-13 peaks
• But in any given year, weather and other unpredictable factors will cause price volatility

Thanks!
• FAPRI-MU website: www.fapri.missouri.edu
• To contact Pat Westhoff:
– 1-573-882-4647
• FAPRI-MU team:
– Julian Binfield
– Sera Chiuchiarelli
– Deepayan Debnath
– Scott Gerlt
– Lauren Jackson
– Willi Meyers
– Wyatt Thompson
– Jarrett Whistance
– Peter Zimmel

Eastern and Southern Africa Maize Outlook: 2014 – 2023

Regional Outlook: Prices transmission
Source: ReNAPRI Outlook, November 2014
0
50
100
150
200
250
300
350
400
450
2000 2002 2004 2006 2008 2010 2012
US
$ /
to
n
World Price South Africa - Randfontein Kenya - Nairobi
Zambia - Lusaka Tanzania - Arusha Malawi - Lilongwe
Mozambique - Maputo DRC - Kinshasa

Regional Outlook: Prices transmission
Source: ReNAPRI Outlook, November 2014
0
50
100
150
200
250
300
350
2000 2002 2004 2006 2008 2010 2012
US
$ /
to
n
World Price South Africa - Randfontein

Regional Outlook: Maize Price Transmission
• Country specific price-setting mechanisms: South Africa
Consumption
Retailing
Processing
Trading
Storage
Production
May 2012 to April 2013
SubsistenceFarmers
Volume = 564,335
Commercial FarmersVolume = 10,360,000 tons
ImportsVolume =
341,000 tons
Informal (Gristing) Millers
Volume = 62,000 t
Animal FeedVolume = ?
Domesticstorage and tradingDelivery volume = 9,913,000 t
Formal millers: Human consumptionVolume = 4,147,000 t
Animal Feed
Independent Trader
Household Consumption
Formal & Informal Retailing
Livestock Industry
Exports:Maize product
128,000 t
Exports:Maize grain1,812,000 t
SAFEX
Source: SAGIS, 2013
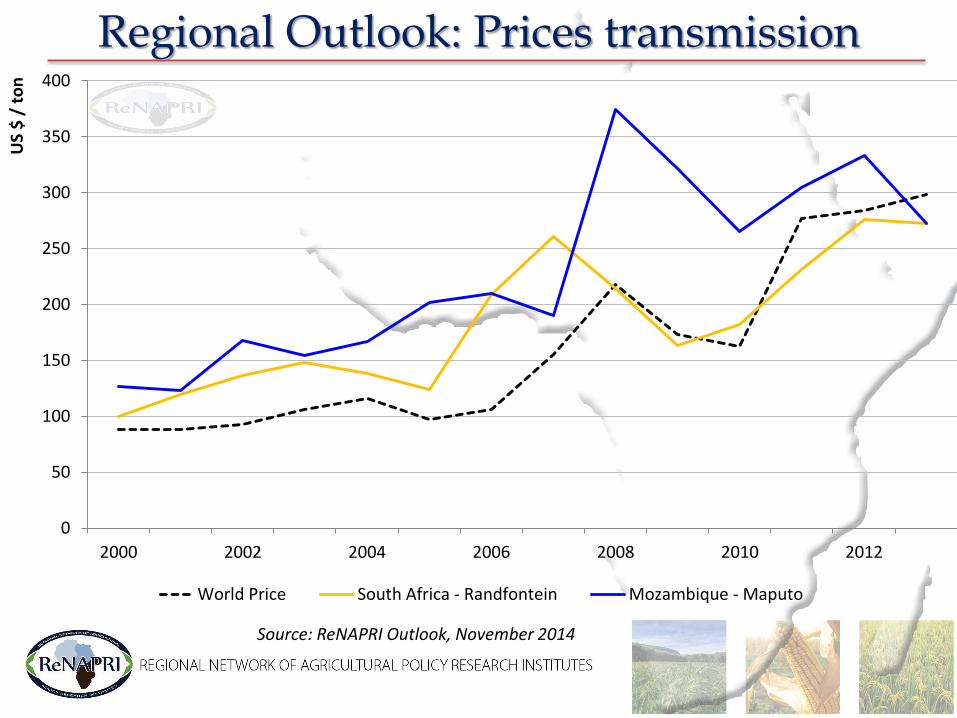
Regional Outlook: Prices transmission
Source: ReNAPRI Outlook, November 2014
0
50
100
150
200
250
300
350
400
2000 2002 2004 2006 2008 2010 2012
US
$ /
to
n
World Price South Africa - Randfontein Mozambique - Maputo

Regional Outlook: Prices transmission
Source: ReNAPRI Outlook, November 2014
0
50
100
150
200
250
300
350
2000 2002 2004 2006 2008 2010 2012
US
$ /
to
n
World Price Zambia - Lusaka

Regional Outlook: Maize Price Transmission
KEY
flow of maize gain
flow ofmealie meal or beer for human consumption
flow of maize product for animal feed
Maize figures from 2012/13 season
TRADE FLOW MAP OF GRAIN AND GRAN PRODUCTS IN ZAMBIA
small scale millers
Volume=200,000 tons
Vertically integrated
(production, storage,
processing, retailing and exporting)
Small holder Farmers
Volume = 2,532,800 tons
CommercialFarmers=Volume
=66,576
ImportsVolume=0
Farm retention for home
consumption=50,000tons
Animal FeedVolume
Private Grain Traders
Household Consumption
Formal & Informal Retaiers
Livestock IndustryMaize Grain Exports Mealie meal exports
FRA(national
reserved food)
Volume=500,000 tons
Large scale millersVolume
BreweriesVolume
Production
Storage
Trading
Processing
Retailing
Consumption
Small scale grain traders and assemblers
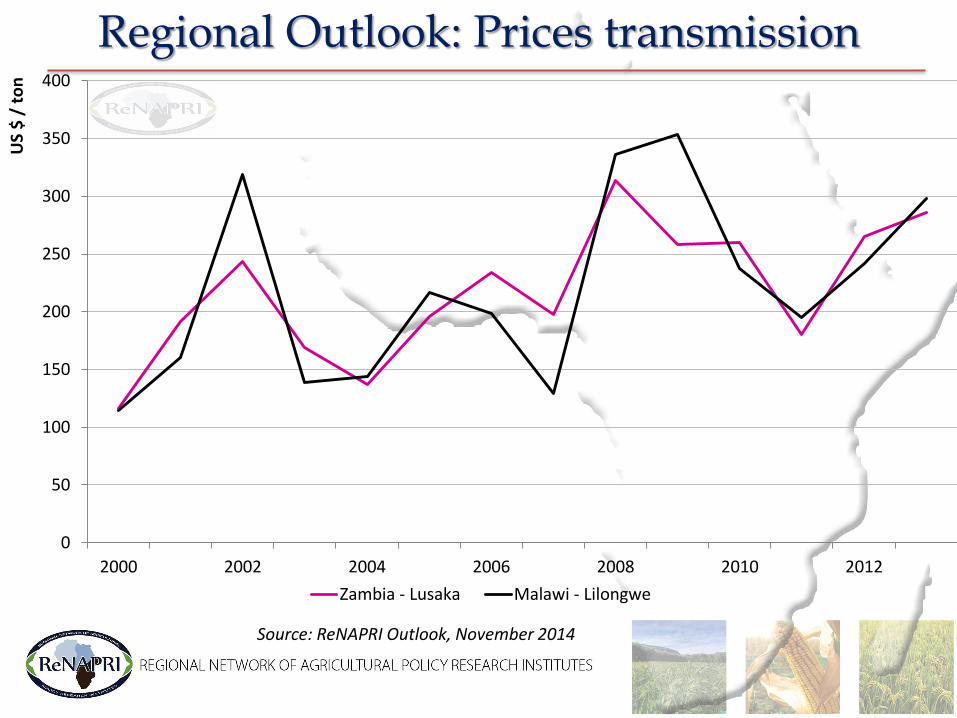
Regional Outlook: Prices transmission
Source: ReNAPRI Outlook, November 2014
0
50
100
150
200
250
300
350
400
2000 2002 2004 2006 2008 2010 2012
US
$ /
to
n
Zambia - Lusaka Malawi - Lilongwe
Regional Outlook: Prices transmission
Source: ReNAPRI Outlook, November 2014
0
50
100
150
200
250
300
350
400
450
2000 2002 2004 2006 2008 2010 2012
US
$ /
to
n
World Price Kenya - Nairobi
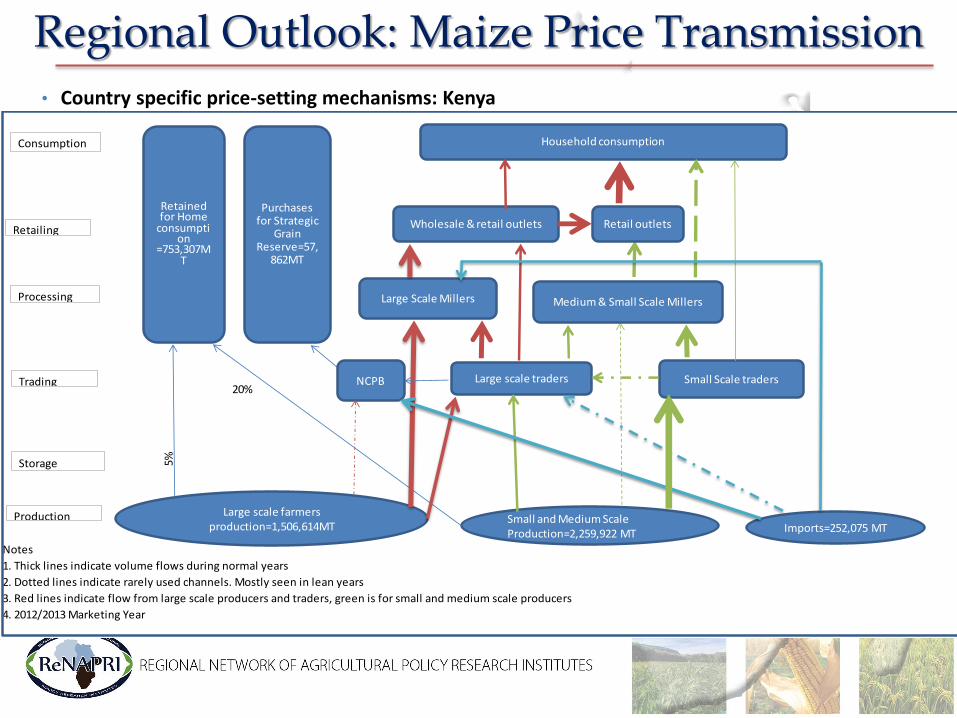
Regional Outlook: Maize Price Transmission
• Country specific price-setting mechanisms: Kenya
Notes
1. Thick lines indicate volume flows during normal years
2. Dotted lines indicate rarely used channels. Mostly seen in lean years
3. Red lines indicate flow from large scale producers and traders, green is for small and medium scale producers
4. 2012/2013 Marketing Year
Small and Medium Scale Production=2,259,922 MT
Large scale farmers production=1,506,614MT Imports=252,075 MT
Retained for Home
consumption
=753,307MT
Purchases for Strategic
Grain Reserve=57,
862MT
Large scale traders Small Scale tradersNCPB
Large Scale Millers
5%
20%
Household consumption
Medium & Small Scale Millers
Wholesale & retail outlets Retail outlets
Consumption
Retailing
Processing
Trading
Storage
Production
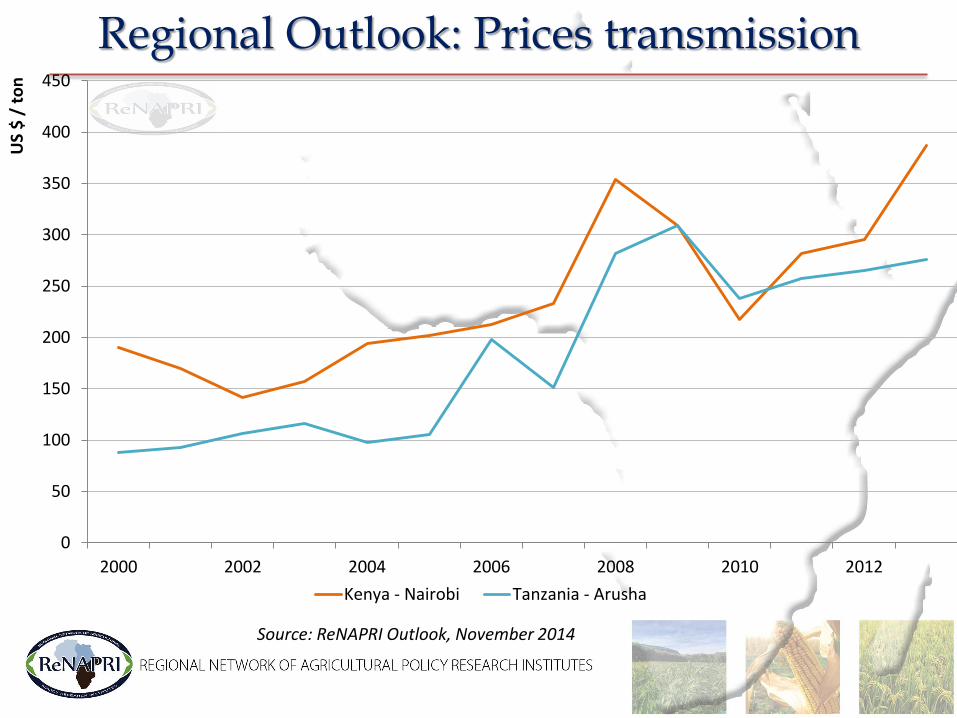
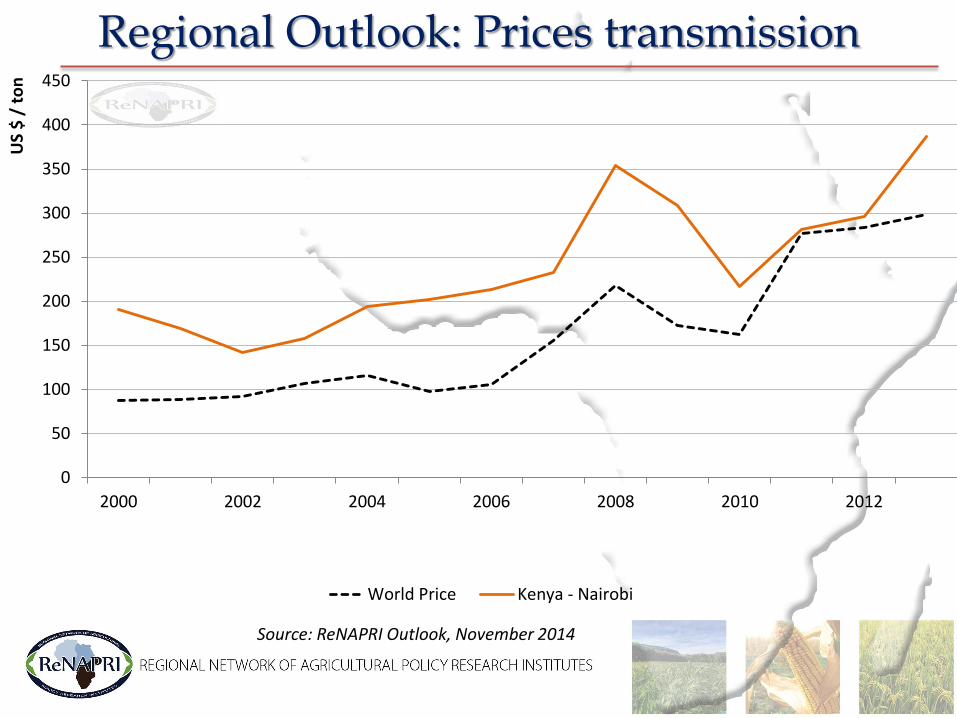
Regional Outlook: Prices transmission
Source: ReNAPRI Outlook, November 2014
0
50
100
150
200
250
300
350
400
450
2000 2002 2004 2006 2008 2010 2012
US
$ /
to
n
Kenya - Nairobi Tanzania - Arusha

Regional Outlook: Maize Price Transmission
• Country specific price-setting mechanisms: Tanzania Maize Value Chain
Consumption
Retailing
Processing
Trading
Storage
Production
KEY
flow of maize gain
flow of maize product for human consumption
flow of maize product for animal feed
Maize figures from 2011/12 season
Subsistence FarmersVolume = 5,104,248 tons
CommercialFarmers
Volume =
ImportsVolume =
Farm retention for home
consumption
Volume = 231,000 t
Small scale millers and tradingDelivery volume = 2,121,017 t
Animal FeedVolume =
Private Tradervolume: 860,639 t
Household Consumption
Formal & Informal Retailing
Livestock Industry
Exports:Maize produt
Volume =
Exports:Maize grainVolume =
NFRA(national reserved
food)
Volume = 200,000 t
Vertically integrated
(production, storage,
processing, retailing and exporting)
volume= t
Large scale millersVolume =

Regional Outlook: Prices transmission
Source: ReNAPRI Outlook, November 2014
0
50
100
150
200
250
300
350
400
450
2000 2002 2004 2006 2008 2010 2012 2014 2016 2018 2020 2022
US
$ /
to
n
World Price South Africa - Randfontein Kenya - Nairobi
Zambia - Lusaka Tanzania - Arusha Malawi - Lilongwe
Mozambique - Maputo DRC - Kinshasa

Regional Outlook: Production, Consumption & Trade
-5,000
0
5,000
10,000
15,000
20,000
25,000
30,000
35,000
40,000
45,000
2000 2002 2004 2006 2008 2010 2012 2014 2016 2018 2020 2022
Tho
usa
nd
to
ns
Consumption - Feed Consumption - Food Production Net trade
Source: ReNAPRI Outlook, November 2014
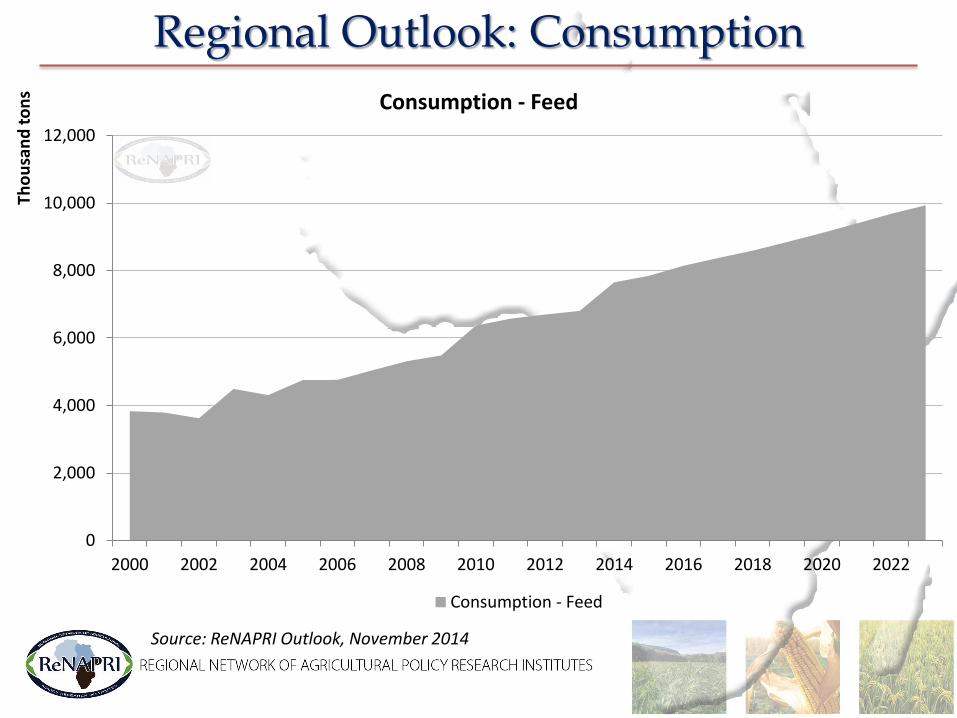
Regional Outlook: Consumption
0
2,000
4,000
6,000
8,000
10,000
12,000
2000 2002 2004 2006 2008 2010 2012 2014 2016 2018 2020 2022
Tho
usa
nd
to
ns Consumption - Feed
Consumption - Feed
Source: ReNAPRI Outlook, November 2014

• Rising per capita GDP and changing consumer diets underpinning increase demand by feed sector
Regional Outlook: Consumption
Source: ReNAPRI Outlook, November 2014
0
5000
10000
15000
20000
25000
30000
35000
0
500
1000
1500
2000
25002
00
0
20
01
20
02
20
03
20
04
20
05
20
06
20
07
20
08
20
09
20
10
20
11
20
12
20
13
20
14
20
15
20
16
20
17
20
18
20
19
20
20
20
21
20
22
20
23
Zambia (ZMW) Mozambique (MZN) Tanzania (TZS) Kenya (KES)
Rea
l GD
P p
er C
apit
a (c
on
stan
t lo
cal c
urr
ency
)
SA R
eal G
DP
per
cap
ita
(co
nst
ant
ZAR
)
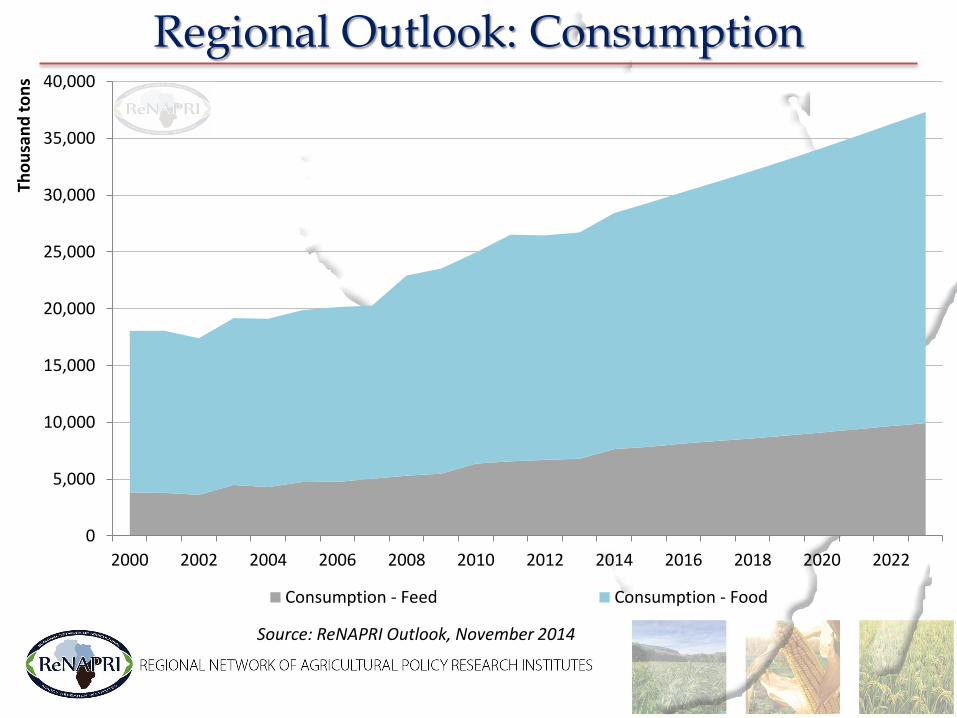
Regional Outlook: Consumption
0
5,000
10,000
15,000
20,000
25,000
30,000
35,000
40,000
2000 2002 2004 2006 2008 2010 2012 2014 2016 2018 2020 2022
Tho
usa
nd
to
ns
Consumption - Feed Consumption - Food
Source: ReNAPRI Outlook, November 2014

• Population growth driving demand for human consumption
Regional Outlook: Consumption
0
10
20
30
40
50
60
70
80
90
100
South Africa Zambia Mozambique Tanzania Kenya Malawi DRC
Mill
ion
s
Source: ReNAPRI Outlook, November 2014
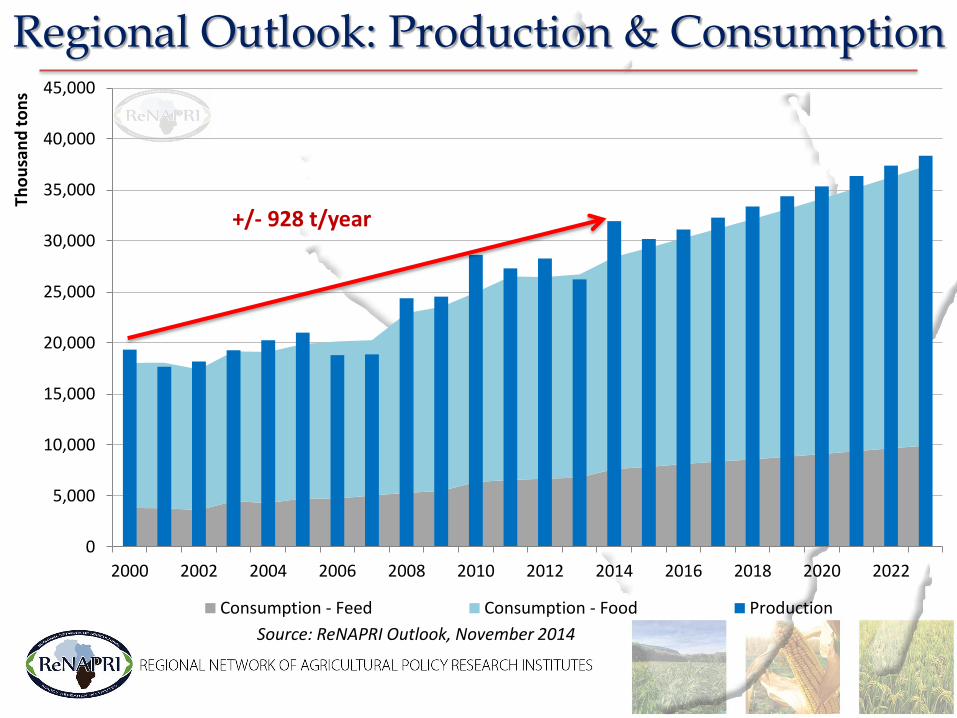
Regional Outlook: Production & Consumption
0
5,000
10,000
15,000
20,000
25,000
30,000
35,000
40,000
45,000
2000 2002 2004 2006 2008 2010 2012 2014 2016 2018 2020 2022
Tho
usa
nd
to
ns
Consumption - Feed Consumption - Food Production
+/- 928 t/year
Source: ReNAPRI Outlook, November 2014

• Key Factors underlying production: Maize area harvested
Regional Outlook: Production
Source: ReNAPRI Outlook, November 2014
0
500
1000
1500
2000
2500
3000
3500
2003 2005 2007 2009 2011 2013
Tho
usa
nd
ha
South Africa Zambia Kenya Tanzania Malawi Mozambique DRC

• Key Factors underlying production: Maize yields (t/ha)
Regional Outlook: Production
0.00
1.00
2.00
3.00
4.00
5.00
6.00
2000 2001 2002 2003 2004 2005 2006 2007 2008 2009 2010 2011 2012 2013 2014South Africa Zambia Kenya Tanzania Malawi Mozambique DRC
t/h
a
Source: ReNAPRI Outlook, November 2014

Regional Outlook: Production & Consumption
0
5,000
10,000
15,000
20,000
25,000
30,000
35,000
40,000
45,000
2000 2002 2004 2006 2008 2010 2012 2014 2016 2018 2020 2022
Tho
usa
nd
to
ns
Consumption - Feed Consumption - Food Production
+/- 928 t/year
+/- 876 t/year
Source: ReNAPRI Outlook, November 2014

• Key Factors underlying production: Maize area harvested - baseline
Regional Outlook: Production
Source: ReNAPRI Outlook, November 2014
0
500
1000
1500
2000
2500
3000
3500
4000
2003 2005 2007 2009 2011 2013 2015 2017 2019 2021 2023
Tho
usa
nd
ha
South Africa Zambia Kenya Tanzania Malawi Mozambique DRC
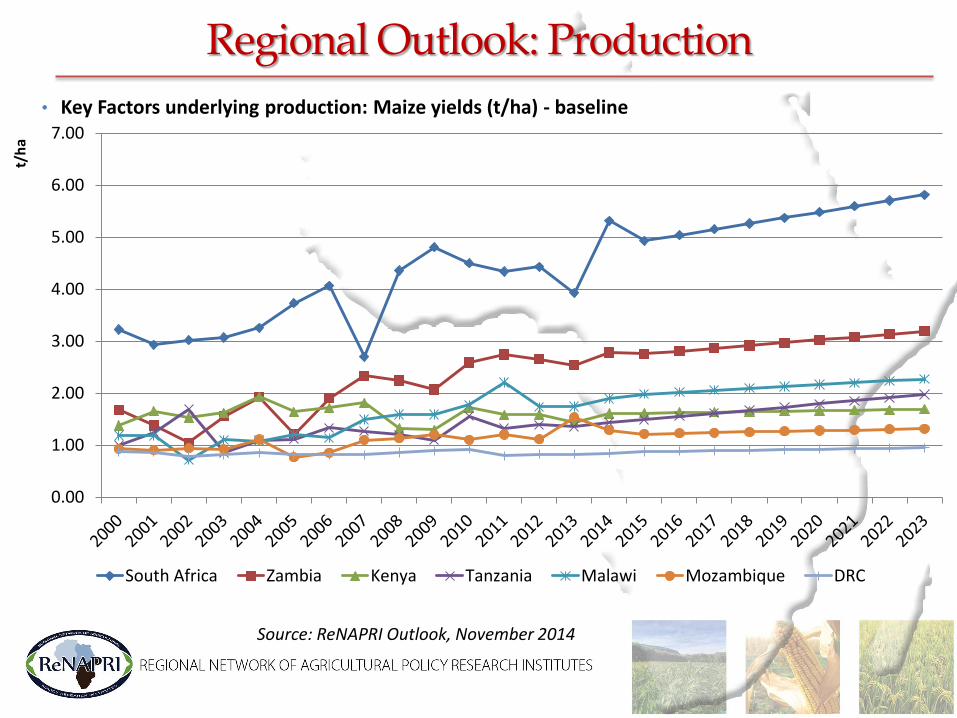
• Key Factors underlying production: Maize yields (t/ha) - baseline
Regional Outlook: Production
Source: ReNAPRI Outlook, November 2014
0.00
1.00
2.00
3.00
4.00
5.00
6.00
7.00
South Africa Zambia Kenya Tanzania Malawi Mozambique DRC
t/h
a
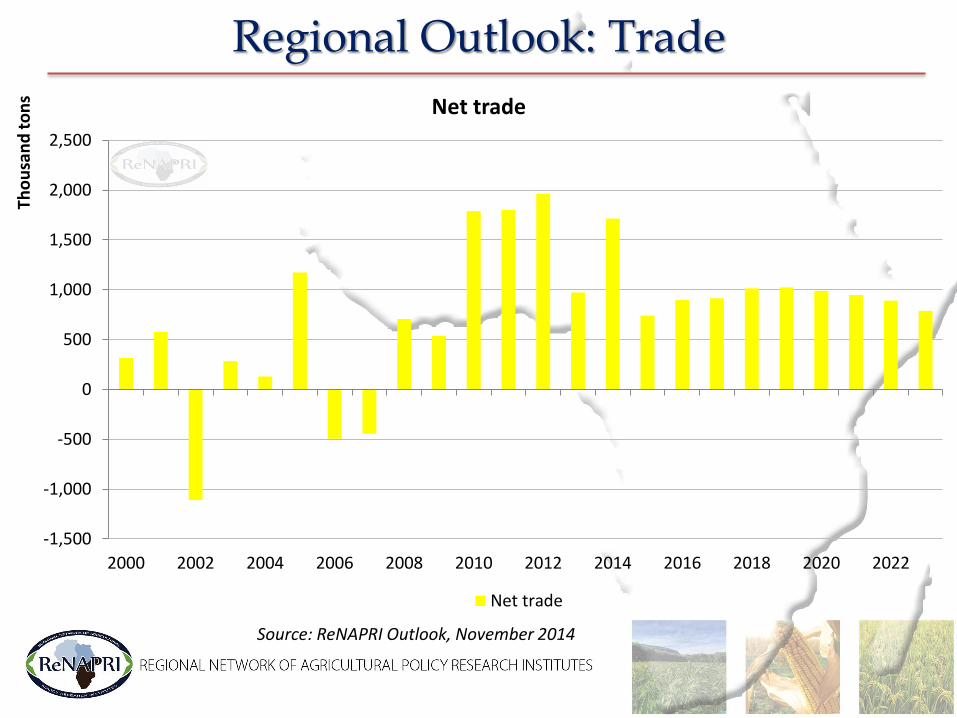
Regional Outlook: Trade
-1,500
-1,000
-500
0
500
1,000
1,500
2,000
2,500
2000 2002 2004 2006 2008 2010 2012 2014 2016 2018 2020 2022
Tho
usa
nd
to
ns Net trade
Net trade
Source: ReNAPRI Outlook, November 2014

• Deficit Producer: DRC
Regional Outlook: Trade
-1,000
-500
0
500
1,000
1,500
2,000
2,500
3,000
2008 2010 2012 2014 2016 2018 2020 2022
Tho
usa
nd
to
ns
Consumption: Feed Consumption: Food Production Net Trade
Source: ReNAPRI Outlook, November 2014
• Deficit Producer: Kenya
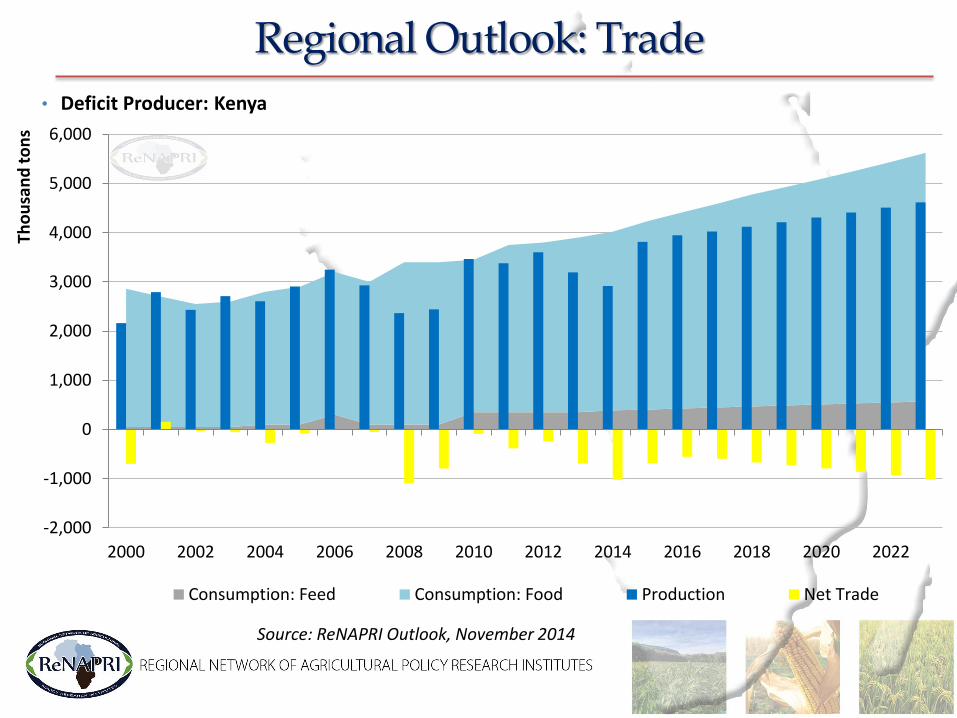
Regional Outlook: Trade
-2,000
-1,000
0
1,000
2,000
3,000
4,000
5,000
6,000
2000 2002 2004 2006 2008 2010 2012 2014 2016 2018 2020 2022
Tho
usa
nd
to
ns
Consumption: Feed Consumption: Food Production Net Trade
Source: ReNAPRI Outlook, November 2014
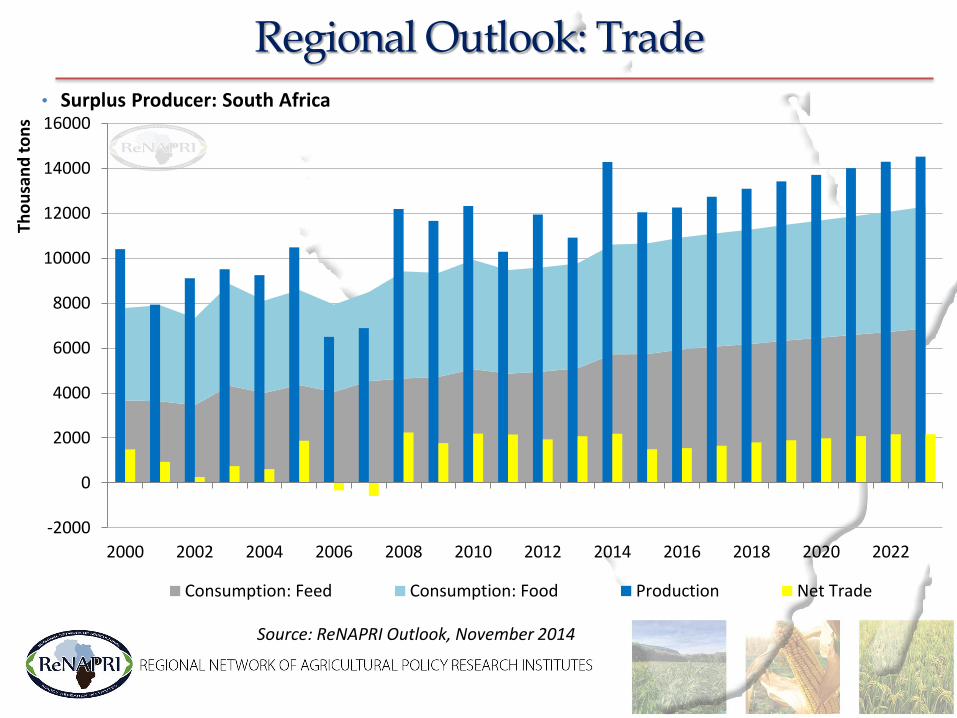
• Surplus Producer: South Africa
Regional Outlook: Trade
-2000
0
2000
4000
6000
8000
10000
12000
14000
16000
2000 2002 2004 2006 2008 2010 2012 2014 2016 2018 2020 2022
Tho
usa
nd
to
ns
Consumption: Feed Consumption: Food Production Net Trade
Source: ReNAPRI Outlook, November 2014

• Surplus Producer: Zambia
Regional Outlook: Trade
-1,000
0
1,000
2,000
3,000
4,000
5,000
2000 2002 2004 2006 2008 2010 2012 2014 2016 2018 2020 2022
Tho
usa
nd
to
ns
Consumption: Feed Consumption: Food Production Net Trade
Source: ReNAPRI Outlook, November 2014
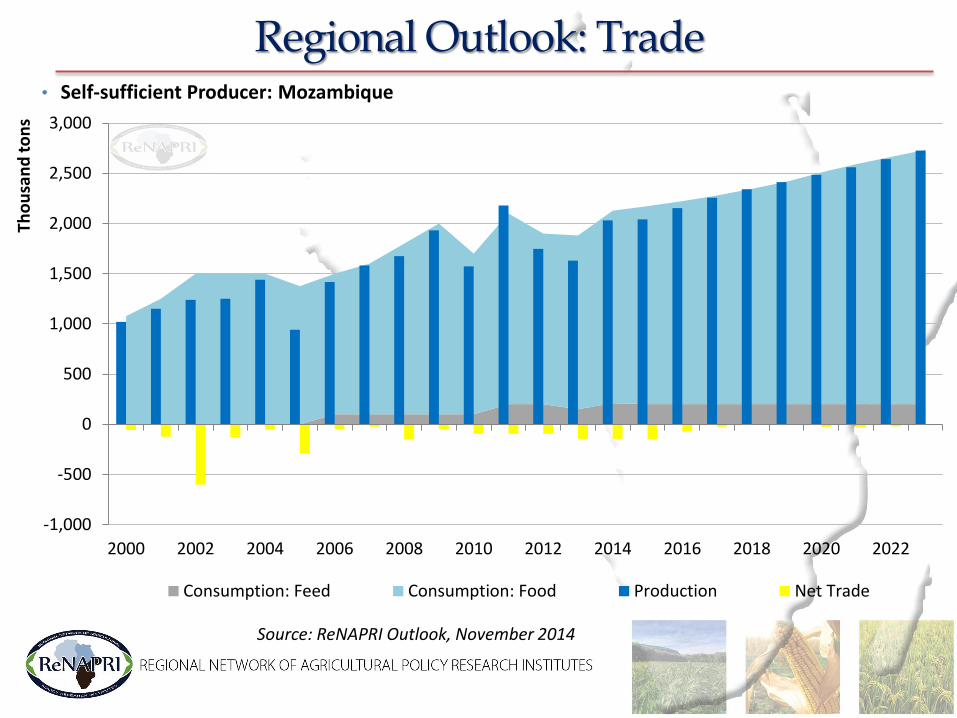
• Self-sufficient Producer: Mozambique
Regional Outlook: Trade
-1,000
-500
0
500
1,000
1,500
2,000
2,500
3,000
2000 2002 2004 2006 2008 2010 2012 2014 2016 2018 2020 2022
Tho
usa
nd
to
ns
Consumption: Feed Consumption: Food Production Net Trade
Source: ReNAPRI Outlook, November 2014
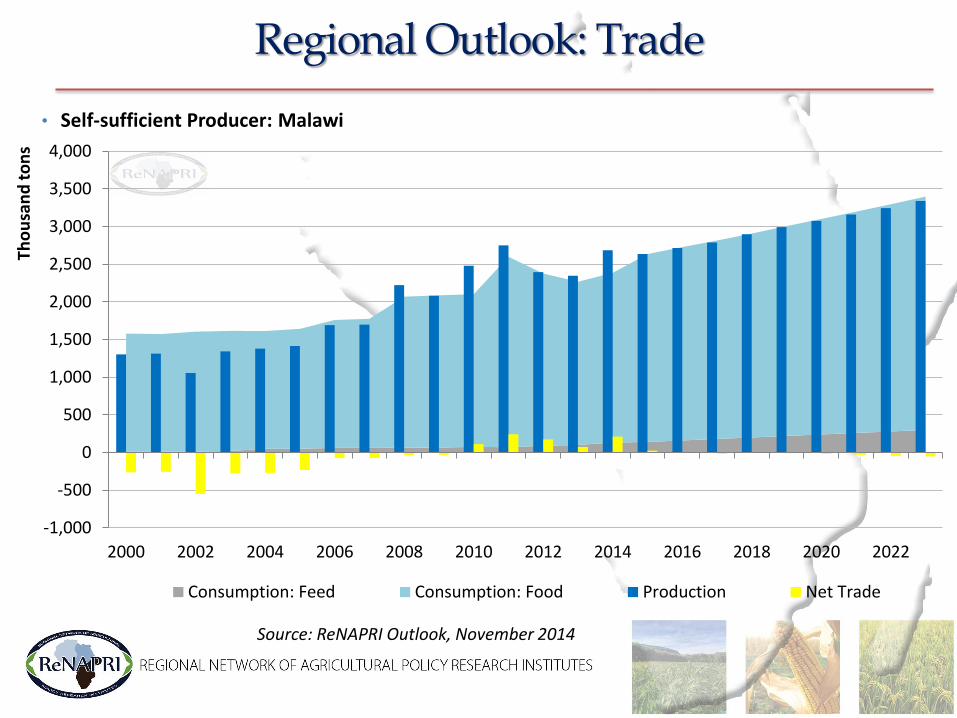
• Self-sufficient Producer: Malawi
Regional Outlook: Trade
-1,000
-500
0
500
1,000
1,500
2,000
2,500
3,000
3,500
4,000
2000 2002 2004 2006 2008 2010 2012 2014 2016 2018 2020 2022
Tho
usa
nd
to
ns
Consumption: Feed Consumption: Food Production Net Trade
Source: ReNAPRI Outlook, November 2014

• Self-sufficient Producer: Tanzania
Regional Outlook: Trade
-1,000
0
1,000
2,000
3,000
4,000
5,000
6,000
7,000
2000 2002 2004 2006 2008 2010 2012 2014 2016 2018 2020 2022
Tho
usa
nd
to
ns
Consumption: Feed Consumption: Food Production Net Trade
Source: ReNAPRI Outlook, November 2014

Regional Outlook: Production, Consumption & Trade
-5,000
0
5,000
10,000
15,000
20,000
25,000
30,000
35,000
40,000
45,000
2000 2002 2004 2006 2008 2010 2012 2014 2016 2018 2020 2022
Tho
usa
nd
to
ns
Consumption - Feed Consumption - Food Production Net trade
Source: ReNAPRI Outlook, November 2014
Farm level analysis
Global Models:
FAPRI and OECD-FAO
GDP
Exchange rate
Interest rate
Regional prices
Weather
Population
Regional Policy
Farm Level Models:
Household Survey data
agri benchmark
FINSIM
Sector level Models: ReNAPRI Partial
Equilibrium
Livestock Grains
and oilseeds
Oil prices
ReNAPRI Modeling Framework
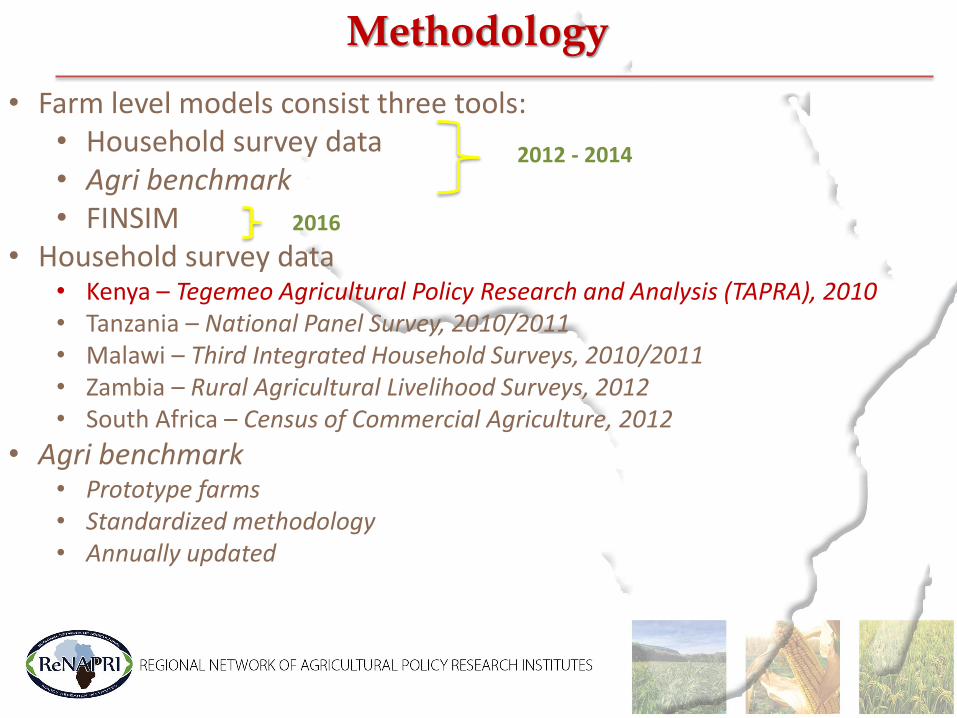
Methodology
• Farm level models consist three tools: • Household survey data • Agri benchmark • FINSIM
• Household survey data • Kenya – Tegemeo Agricultural Policy Research and Analysis (TAPRA), 2010 • Tanzania – National Panel Survey, 2010/2011 • Malawi – Third Integrated Household Surveys, 2010/2011 • Zambia – Rural Agricultural Livelihood Surveys, 2012 • South Africa – Census of Commercial Agriculture, 2012
• Agri benchmark • Prototype farms • Standardized methodology • Annually updated
2012 - 2014
2016

Methodology
• Survey Data and Agri benchmark locations

Case Study: Kenya
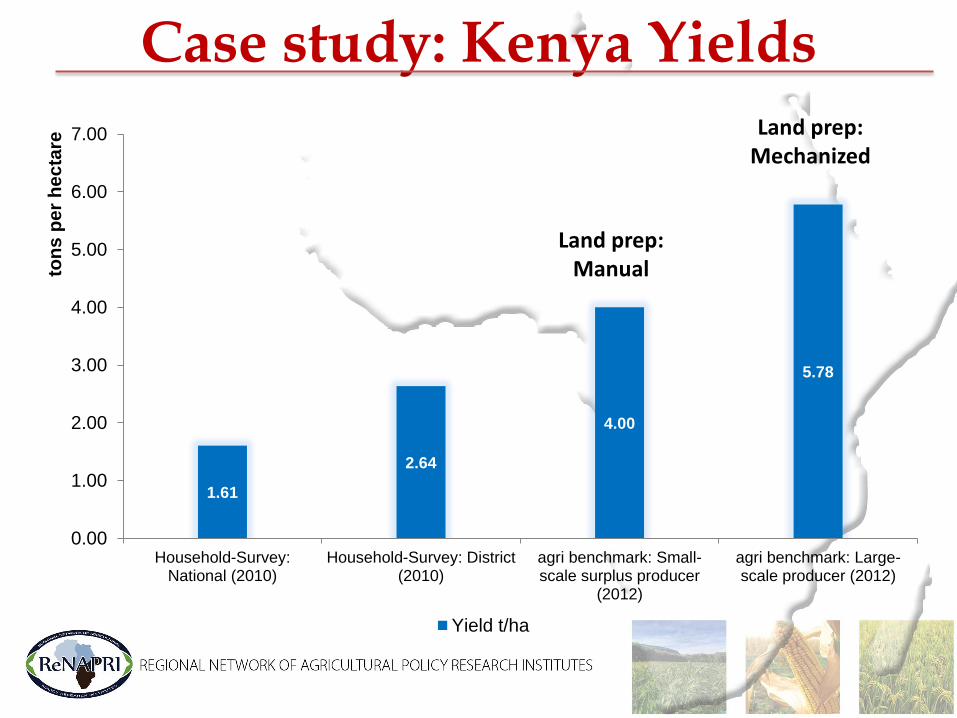
Case study: Kenya Yields
1.61
2.64
4.00
5.78
0.00
1.00
2.00
3.00
4.00
5.00
6.00
7.00
Household-Survey:National (2010)
Household-Survey: District(2010)
agri benchmark: Small-scale surplus producer
(2012)
agri benchmark: Large-scale producer (2012)
ton
s p
er
he
cta
re
Yield t/ha
Land prep: Mechanized
Land prep: Manual

Case study: Kenya Fertilizer & Seed
87
151
309
371 22.2
24.7 24.7 24.7
20.5
21.0
21.5
22.0
22.5
23.0
23.5
24.0
24.5
25.0
0
50
100
150
200
250
300
350
400
Household-Survey:National (2010)
Household-Survey:District (2010)
agri benchmark: Small-scale surplus producer
(2012)
agri benchmark: Large-scale producer (2012)
Se
ed
: k
g p
er
he
cta
re
Fe
rtil
ize
r: k
g p
er
he
cta
re
Fertilizer application rates kg/ha Seed application rates kg/ha
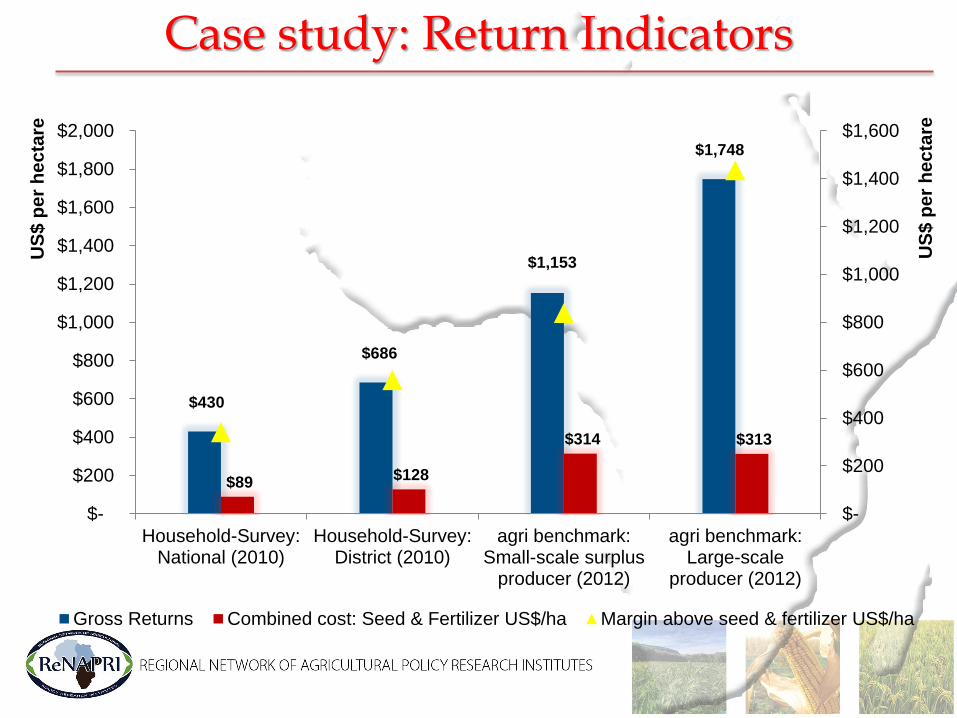
Case study: Return Indicators
$430
$686
$1,153
$1,748
$89 $128
$314 $313
$-
$200
$400
$600
$800
$1,000
$1,200
$1,400
$1,600
$-
$200
$400
$600
$800
$1,000
$1,200
$1,400
$1,600
$1,800
$2,000
Household-Survey:National (2010)
Household-Survey:District (2010)
agri benchmark:Small-scale surplus
producer (2012)
agri benchmark:Large-scale
producer (2012)
US
$ p
er
he
cta
re
US
$ p
er
he
cta
re
Gross Returns Combined cost: Seed & Fertilizer US$/ha Margin above seed & fertilizer US$/ha

Case Study: South Africa
Case Study: South Africa
• Specific case study in KwaZulu-Natal, South Africa - Same type of small-scale producer in the same area - Same size / same area - Difference: Mentorship (GSA vs. traditional)

Difference: Production Systems
Difference: Production Systems
• Lime application: 1 ton per hectare on farm with access to the support program - no lime application on farm that followed traditional methods
• Plant protection on the supported farms was done using chemical
treatments while traditional methods included only the use of hand hoes with manual labour
• A basal and top dressing fertilizer application on the farm that had
access to support while the traditional approach only had a basal application. The total NPK was less on the traditional approach as on the farm who obtained support.
• The type and amount of land preparations differed between the
two groups of farms

Case study: Return Indicators
Regional agri benchmark prototype farms network
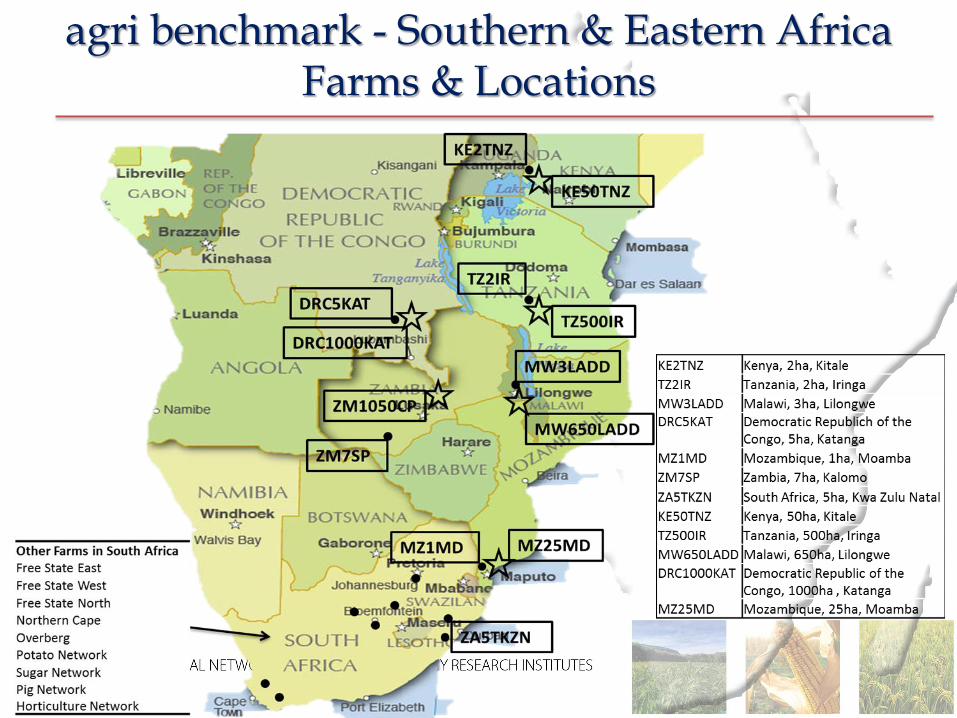
agri benchmark - Southern & Eastern Africa Farms & Locations
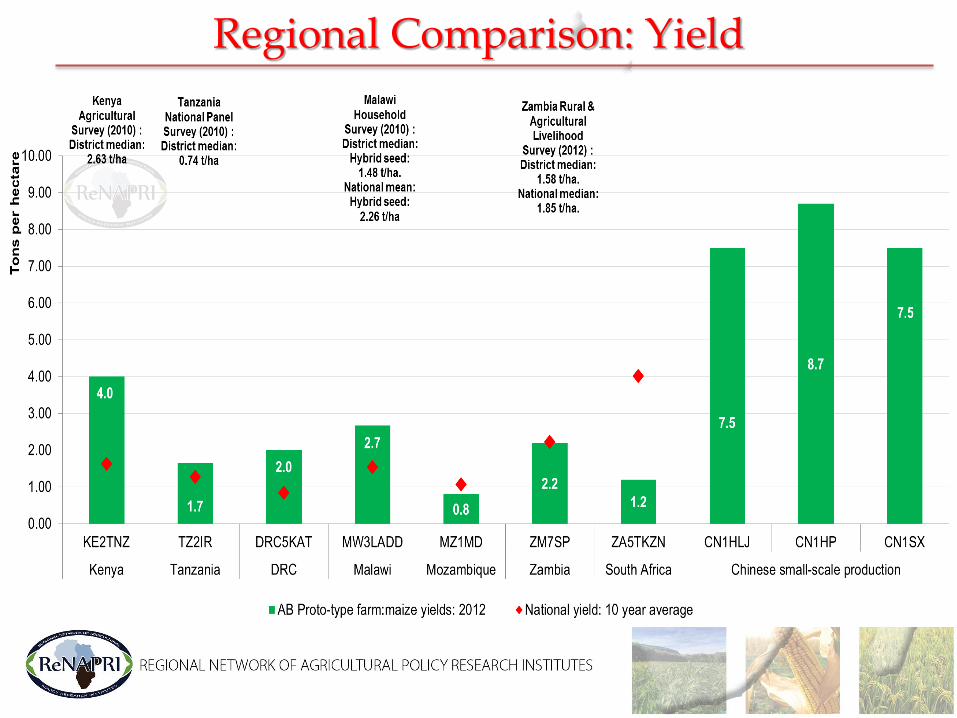
Regional Comparison: Yield

Nitrogen application & costs
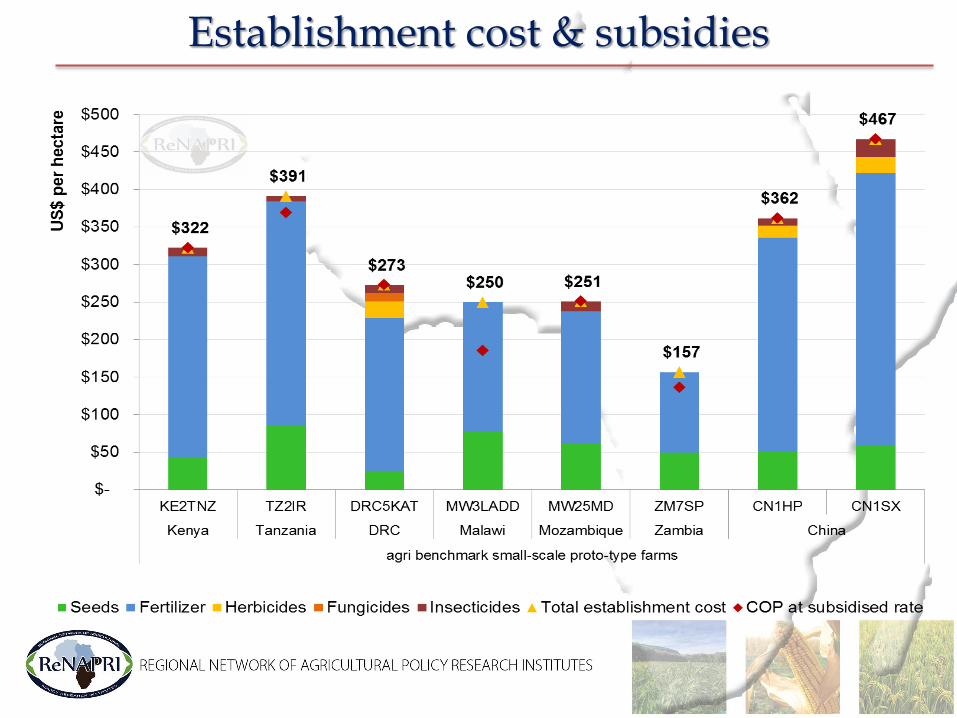
Establishment cost & subsidies
Scenario Planning & Strategic Foresighting:
Impacts of a Zambian maize export restriction
The scenario
• Zambia puts in place restrictions that reduce its 2015 maize exports by 200,000 tonnes
• All other policies in Zambia and in other countries remain as in the baseline

Impacts on Zambian maize markets in 2015
-200
76
13
111
-250
-200
-150
-100
-50
0
50
100
150
Exports Food use Feed use Endingstocks
Change from baseline, 1000 tonnes
-37
4 2
26
-27
-40
-30
-20
-10
0
10
20
30
Exports Fooduse
Feeduse
Endingstocks
Price
Change from baseline, percent

Impacts on regional maize markets in 2015
-200
51
18 15 11 11
94
-250
-200
-150
-100
-50
0
50
100
150
Change from baseline net exports, 1000 tonnes
-27
7
4 5
8 7
-30
-25
-20
-15
-10
-5
0
5
10
Zambia S.Africa
Kenya Malawi Moz. DRC
Change from baseline prices, percent

Impacts on Zambian maize in 2015 and 2016
-27
0 4 2
26
-37
-1 -2
0 3
8
1
-50
-40
-30
-20
-10
0
10
20
30
Price Production Food use Feed use Ending stocks Exports
Percentage change from baseline
2015 2016
Some lessons
• Lower prices in Zambia hurt producers, help consumers
• Reduced Zambian exports raise prices in other countries
– Exporters export more; importers import less
– Higher prices benefit producers, hurt consumers
• Changes in relative prices provide incentives for unsanctioned trade
• Effects can last beyond the year of the export restrictions

Political Context: Critical Questions
• Critical Questions:
– How do we achieve these targets?
– What is the Road-map to Implementation?
• Regional Network of Agricultural Policy Research Institutes (ReNAPRI)
– Offers a multifaceted approach to policy analysis:
Shukran
Nkosi
Obrigado
Merci
Thank you