outline of paper
DESCRIPTION
Voting in the 2011 Welsh Referendum: Nationalism, Valence or What? Richard Wyn Jones (Cardiff University) Roger Scully (Aberystwyth University) Annual Conference of the Elections, Public Opinion and Parties specialist group Exeter, September 2011. Outline of Paper. Introduction - PowerPoint PPT PresentationTRANSCRIPT
Voting in the 2011 Welsh Referendum: Nationalism, Valence or What?
Richard Wyn Jones (Cardiff University)Roger Scully (Aberystwyth University)
Annual Conference of the Elections, Public Opinion and Parties specialist groupExeter, September 2011

Outline of Paper
1. Introduction2. Background to the Referendum3. The Campaign & the Result4. Modelling the Vote: Hypotheses5. Modelling the Vote: Main Findings6. Conclusions & Implications
But first, a word from our sponsors…
• The 2011 Welsh Referendum Study (ESRC Grant RES-000-22-4496)– Survey-based study of voting in the referendum– Conducted via Internet with YouGov– Two-Wave panel study, with first wave conducted as
‘rolling’ study through period of the campaign– N of panel study = 2569
• Further support from McDougall Trust for interview-based study of local and national campaigning

The Background, 1• Previous devolution referendums: 1979, 1997• 1998 GOWA: Flawed Devolution Model
– ‘Secondary’ legislative powers: responsibility without power?
– ‘Body Corporate’ and other problematic aspects
• 2004: Richard Commission Report• 2006 GOWA:
– LCOs– Provision for Referendum on full transfer of primary
legislative powers
Wales 2011: the Background, 2• 2007: ‘One Wales’ Labour-Plaid coalition
• 2008-09: All Wales Convention
• BUT continuing caution…– ‘Shadow of 1979’: unwillingness to believe the survey
evidence!– Labour parliamentary opposition
• Final agreement on referendum: March 3rd 2011
The Campaign: General Context
• Problems created by nature of the issue at stake:– No fundamental issue of principle– Difficult for campaigns to craft messages– Difficult to frame intelligible and legally accurate
referendum question
• Problems with PPERA:– No official campaigns– Constraints on spending (2011 < 1997!)

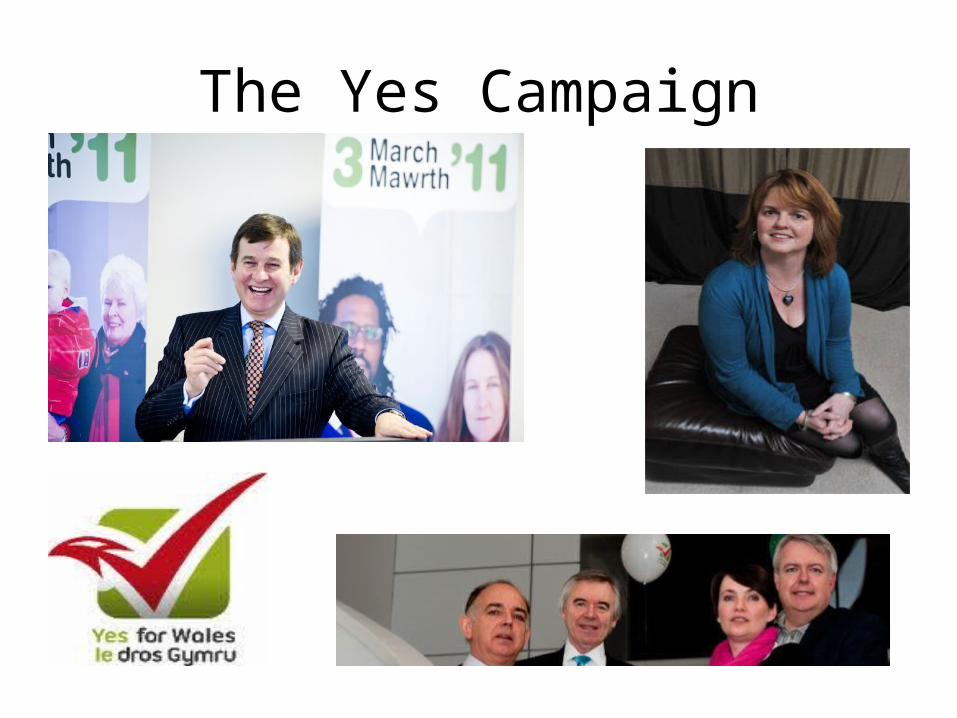
The Yes Campaign• Support from all four party leaderships in NAW• Also widespread support from civil society• The ‘Establishment’ campaign• Paradox of Yes position: Main strength also main
weakness – constrained precisely because it was so all-inclusive– Had to ‘wait for Labour’– Limited in what it could campaign against (not LCOs,
not UK govt)– Main stake-holders had other priorities (particularly
2011 election)
The Yes Campaign
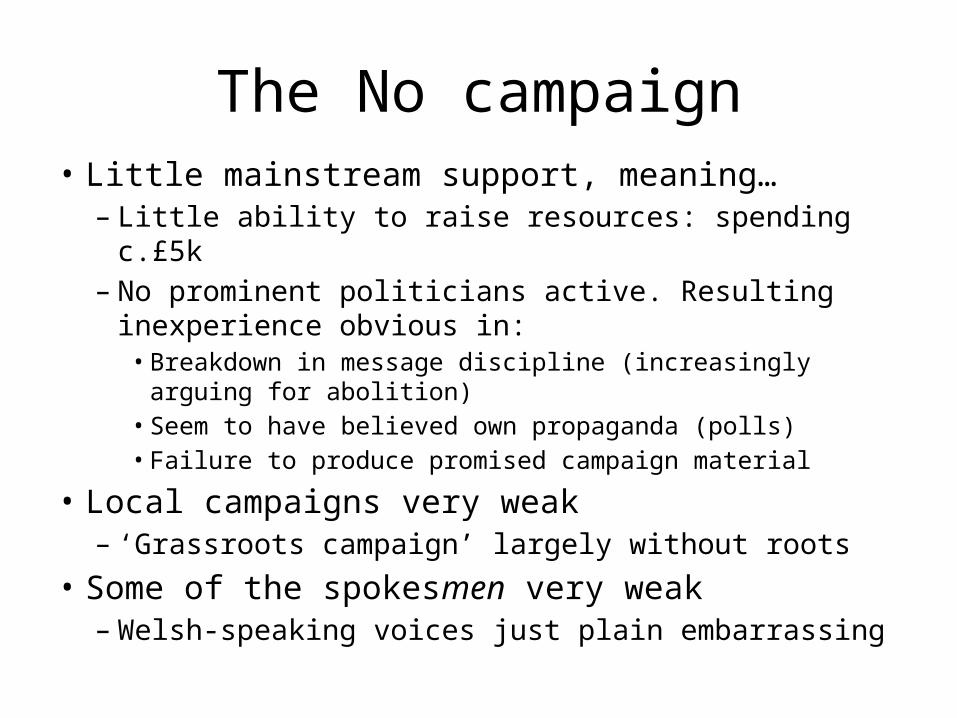
The No campaign• Little mainstream support, meaning…
– Little ability to raise resources: spending c.£5k– No prominent politicians active. Resulting
inexperience obvious in:• Breakdown in message discipline (increasingly arguing for
abolition)• Seem to have believed own propaganda (polls)• Failure to produce promised campaign material
• Local campaigns very weak– ‘Grassroots campaign’ largely without roots
• Some of the spokesmen very weak – Welsh-speaking voices just plain embarrassing

The No Campaign

Referendum Voting Intention 2007-11
Series1
0
10
20
30
40
50
60
70
Yes No DK/Not Voting

Voting intentions across last 4 weeks of campaign (3-day rolling averages)
Series1
0
10
20
30
40
50
60
Yes2NoNot Voting/DK

The Result
Yes: 517,132 (63.5%)
No: 297,380 (36.5%)
Turnout = 35.6%
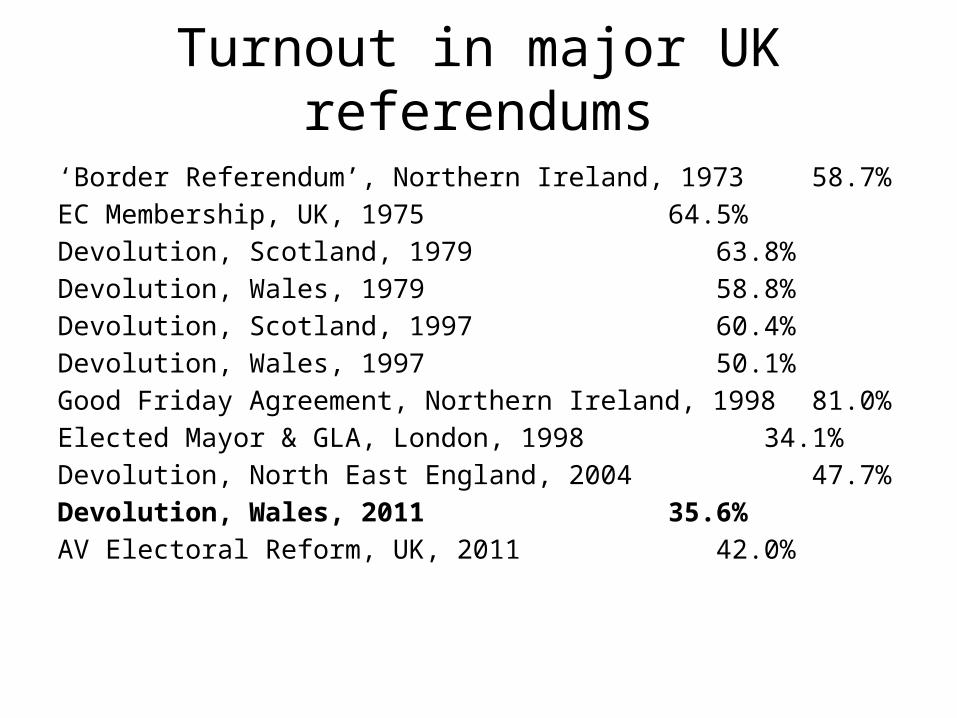
Turnout in major UK referendums
‘Border Referendum’, Northern Ireland, 1973 58.7%EC Membership, UK, 1975
64.5%Devolution, Scotland, 1979
63.8%Devolution, Wales, 1979
58.8%Devolution, Scotland, 1997
60.4%Devolution, Wales, 1997
50.1%Good Friday Agreement, Northern Ireland, 1998 81.0%Elected Mayor & GLA, London, 1998 34.1%Devolution, North East England, 2004
47.7%Devolution, Wales, 2011
35.6%AV Electoral Reform, UK, 2011
42.0%
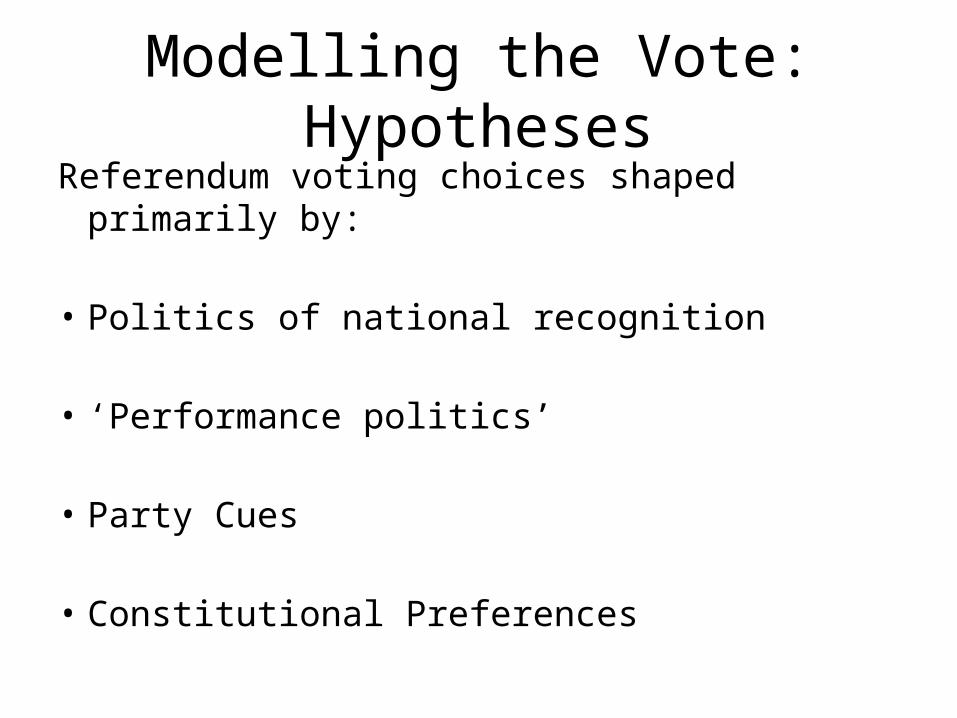
Modelling the Vote: HypothesesReferendum voting choices shaped primarily by:
• Politics of national recognition
• ‘Performance politics’
• Party Cues
• Constitutional Preferences
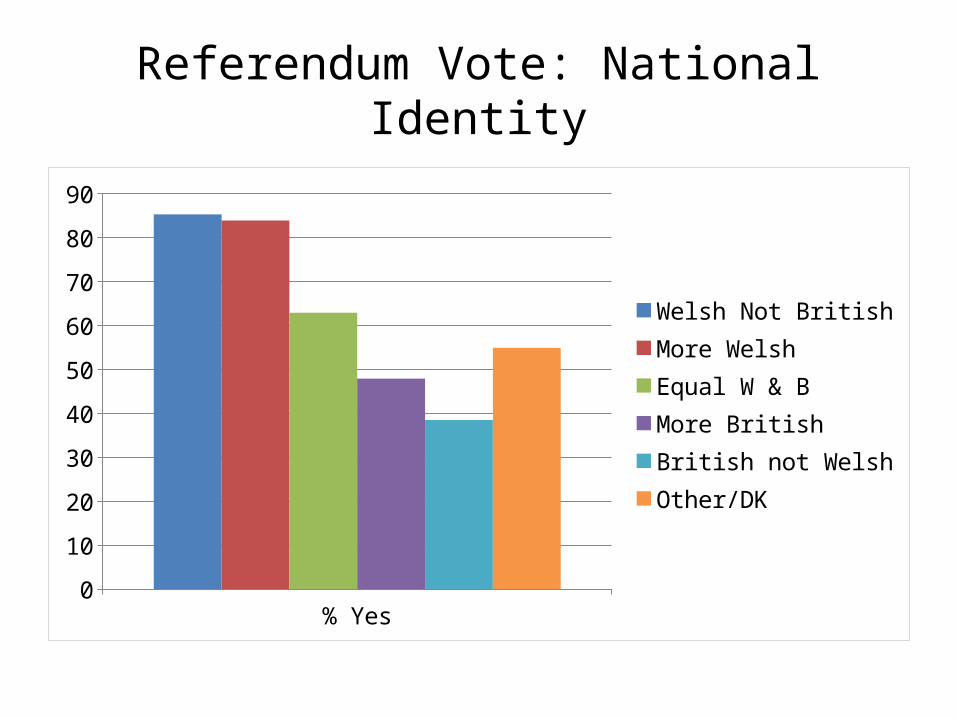
Referendum Vote: National Identity
% Yes0
10
20
30
40
50
60
70
80
90
Welsh Not BritishMore WelshEqual W & BMore BritishBritish not WelshOther/DK

Referendum Vote: WAG performance evaluations
% Yes0
10
20
30
40
50
60
70
80
90
100
NegativeNeutralPositive

Referendum Vote: Party Support
% Yes0
20
40
60
80
100
120
LabourConservativeLDsPlaidOthersNone

Referendum Vote: Constitutional Preference
% Yes0
20
40
60
80
100
120
No DevoFewer PowersLeave as NowMore PowersIndependenceDK
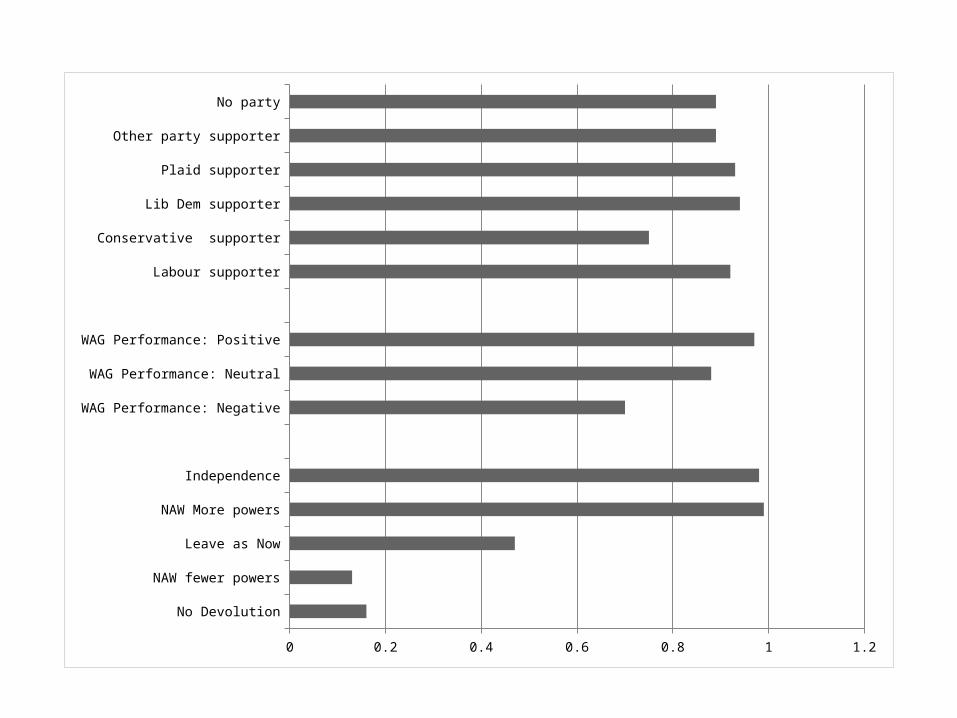
No Devolution
NAW fewer powers
Leave as Now
NAW More powers
Independence
WAG Performance: Negative
WAG Performance: Neutral
WAG Performance: Positive
Labour supporter
Conservative supporter
Lib Dem supporter
Plaid supporter
Other party supporter
No party
0 0.2 0.4 0.6 0.8 1 1.2

Why Did Wales Vote Yes?
• No great impact of campaign• Not mainly about attitudes to major parties
in government (London or Cardiff) or party leaders or performance of government
• Not much about social differences (e.g. national identity or language)
• Mainly about now-settled views concerning how Wales should be governed

And to find out more…
Richard Wyn Jones and Roger Scully, Wales Says Yes: Welsh Devolution and the 2011 Welsh Referendum (University of Wales Press, 2012)