outlier identification in outdoor measurement data: … university institutional repository outlier...
TRANSCRIPT
Loughborough UniversityInstitutional Repository
Outlier identification inoutdoor measurement data:effects of different strategies
on the performancedescriptors of photovoltaic
modules
This item was submitted to Loughborough University's Institutional Repositoryby the/an author.
Citation: ZHU, J. ... et al, 2009. Outlier identification in outdoor mea-surement data: effects of different strategies on the performance descriptors ofphotovoltaic modules. Proceedings of the 34th IEEE Photovoltaic SpecialistsConference, 7-12 June 2009, pp.000828-000833.
Additional Information:
• This conference paper is also available at: http://ieeexplore.ieee.org/ c©2009 IEEE. Personal use of this material is permitted. However, per-mission to reprint/republish this material for advertising or promotionalpurposes or for creating new collective works for resale or redistributionto servers or lists, or to reuse any copyrighted component of this work inother works must be obtained from the IEEE.
Metadata Record: https://dspace.lboro.ac.uk/2134/6332
Version: Published
Publisher: c© IEEE
Please cite the published version.

This item was submitted to Loughborough’s Institutional Repository (https://dspace.lboro.ac.uk/) by the author and is made available under the
following Creative Commons Licence conditions.
For the full text of this licence, please go to: http://creativecommons.org/licenses/by-nc-nd/2.5/
OUTLIER IDENTIFICATION IN OUTDOOR MEASUREMENT DATA - EFFECTS OFDIFFERENT STRATEGIES ON THE PERFORMANCE DESCRIPTORS OF
PHOTOVOLTAlC MODULES
Jiang Zhu, Yingning Qiu, Thomas R. Betts, Ralph Gottschalg
Centre for Renewable Energy Systems Technology (CREST), Department of Electronic and Electrical Engineering,Loughborough University, Loughborough, Leicestershire, LE11 3TU, United Kingdom
Tel.: +441509635313, Fax: +441509635301 , Email: [email protected]
: - @ 1000W/m2 +/-5%
I - @ 100W/m2 +f-5%I I
. - - -t - - - -1- - - -1- - - - t- - - -I I I II I I II I I I
I I I I I I1.5 - - - T - - - "T - - - -, - - - -1- - - -1- - - - I - - -
I I I I I
I I I I II I I I II I I I
1 - - - T - - - -1- - - -1- - - - 1- - - -
I I I II I I II I I
0.5 I 1 1 _I II I
II
2. 51-~----:-----;--------;;====~===il
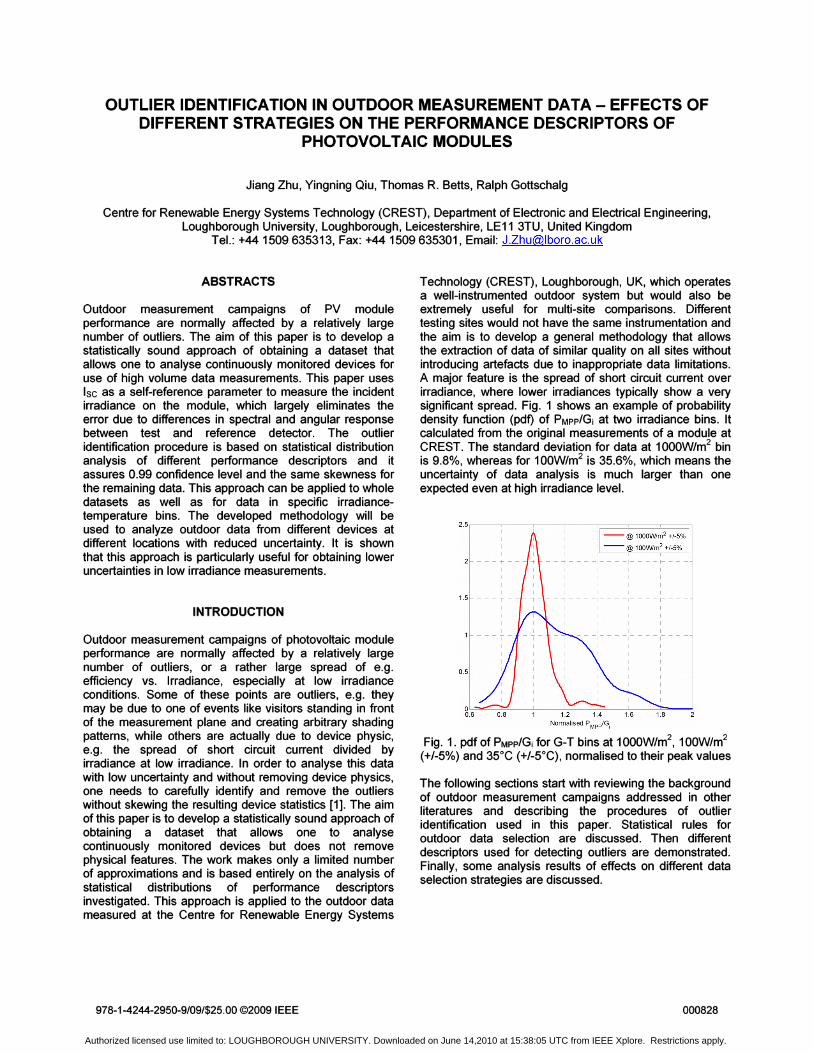
Technology (CREST), Loughborough, UK, which operatesa well-instrumented outdoor system but would also beextremely useful for multi-site comparisons. Differenttesting sites would not have the same instrumentation andthe aim is to develop a general methodology that allowsthe extraction of data of similar quality on all sites withoutintroducing artefacts due to inappropriate data limitations.A major feature is the spread of short circuit current overirradiance, where lower irradiances typically show a verysignificant spread. Fig. 1 shows an example of probabilitydensity function (pdf) of PMPp/Gj at two irradiance bins. Itcalculated from the original measurements of a module atCREST. The standard deviation for data at 1000W/m 2 binis 9.8%, whereas for 100W/m2 is 35.6%, which means theuncertainty of data analysis is much larger than oneexpected even at high irradiance level.
Fig. 1. pdf of PMPp/Gj for G-T bins at 1000W/m2, 100W/m2
(+1-5%) and 35°C (+1-5°C), normalised to their peak values
The following sections start with reviewing the backgroundof outdoor measurement campaigns addressed in otherliteratures and describing the procedures of outlieridentification used in this paper. Statistical rules foroutdoor data selection are discussed. Then differentdescriptors used for detecting outliers are demonstrated.Finally, some analysis results of effects on different dataselection strategies are discussed.
ABSTRACTS
INTRODUCTION
Outdoor measurement campaigns of photovoltaic moduleperformance are normally affected by a relatively largenumber of outliers, or a rather large spread of e.g.efficiency vs. Irradiance, especially at low irradianceconditions. Some of these points are outliers, e.g. theymay be due to one of events like visitors standing in frontof the measurement plane and creating arbitrary shadingpatterns, while others are actually due to device physic,e.g. the spread of short circuit current divided byirradiance at low irradiance. In order to analyse this datawith low uncertainty and without removing device physics,one needs to carefully identify and remove the outlierswithout skewing the resulting device statistics [1]. The aimof this paper is to develop a statistically sound approach ofobtaining a dataset that allows one to analysecontinuously monitored devices but does not removephysical features. The work makes only a limited numberof approximations and is based entirely on the analysis ofstatistical distributions of performance descriptorsinvestigated. This approach is applied to the outdoor datameasured at the Centre for Renewable Energy Systems
Outdoor measurement campaigns of PV moduleperformance are normally affected by a relatively largenumber of outliers. The aim of this paper is to develop astatistically sound approach of obtaining a dataset thatallows one to analyse continuously monitored devices foruse of high volume data measurements. This paper useslsc as a self-reference parameter to measure the incidentirradiance on the module, which largely eliminates theerror due to differences in spectral and angular responsebetween test and reference detector. The outlieridentification procedure is based on statistical distributionanalysis of different performance descriptors and itassures 0.99 confidence level and the same skewness forthe remaining data. This approach can be applied to wholedatasets as well as for data in specific irradiancetemperature bins. The developed methodology will beused to analyze outdoor data from different devices atdifferent locations with reduced uncertainty. It is shownthat this approach is particularly useful for obtaining loweruncertainties in low irradiance measurements.
978-1-4244-2950-9/09/$25.00 ©2009 IEEE 000828
Authorized licensed use limited to: LOUGHBOROUGH UNIVERSITY. Downloaded on June 14,2010 at 15:38:05 UTC from IEEE Xplore. Restrictions apply.

OutdoorAnalyzing
Calibration ofEvaluating
CleanedMeasurements
-to Distribution of -.Isc at STC f----. parameter with • Dataset
Isc/Gi Isc-T matrices
1 1Defining
Analyzing distribution
statistic rulesof parameter in asingle Isc-T bin
1 1Outlier Outlier
Identification-
IdentificationI---
Fig. 2. The flowchart of outlier identification procedures
BACKGROUND OF OUTDOOR MEASUREMENTS
The data recorded for PV devices operating outdoor aresignificantly affected by the meteorological conditionwhere the devices installed, as well as the instrumentsused for measuring. The meteorological condition l.e. theambient temperature, cloudiness, wind, snow etc. maycause inaccuracies in the measurements, which aretypically not controllable. The instruments used formeasuring outdoor climate data and modulecharacteristics have been developing over the years andthe new instrumentation nowadays can achieve relativelyhigh accuracies in measurements [2). However, there isno guaranteed data with high accuracies as devicesinstalled long time ago and is degrading over time. Toinvestigate the outdoor performance of PV devicesaccurately, how to select meaningful outdoormeasurements for further correction and analysis from thedataset is the key procedure. Several data selectioncriterion are found in literatures and summarize below.
A typical data filtering method is to limit both the measuredand calculated module temperatures and the in-planeirradiance into reasonable ranges for the specific site.Module temperatures from 20°C to 65°C and in-planeirradiances from 150W/m2 to 1200W/m2 are the typicalvalues for a high latitude moderate climate location. Somealso consider the angle-of-incidence of direct-beamirradiance to the PV panel of less than certain degrees.
An outdoor data selection method based on analysis ofthe relationship between module operating voltage andmodule temperature is used in [3). Only the data within the'acceptable area' indicated were used. Data out of thisarea were judged unacceptable because they weremeasured under malfunctioning or system-off conditions.
There is another data filtering method described in [4). Thefiltering was performed by linear regression of all shortcircuit current against irradiance levels for allmeasurements. Then the final data was chosen at the95% confidence level about this regression. This is to
978-1-4244-2950-9/09/$25.00 ©2009 IEEE
minimize errors due to the variations in irradiance betweenthe time of measurement of the IV characteristics and thatof the measurement of the irradiance.
In this paper, in order to detect outliers due to effects thatmay occur during the life-time of a module, a different dataselection strategy is proposed.
METHODOLOGY
The aim of this work is to obtain repeatabilities in powerratings which are then usable for monitoring degradationin photovoltaic modules, which is expected in the range of0.5-2% per annual. To achieve this, the modulecharacteristics are sorted into different G; bins. Data withineach irradiance bin is corrected by temperature andirradiance using standard procedures described in IEC60891 [5) to the centre value of the bin. Degradationeffects can be seen at different irradiance points and weaim to see how interpolation/extrapolation affects theprediction. The spread of performance parameters in eachbin is significantly affected by the meteorological condition(temperature, cloudiness, etc.) as well as the equipmentused for measuring. This inevitably causes systematic aswell as random errors. For all devices investigated in thiswork, the variation is much larger for low irradiance levels[6). To minimize these errors, this paper uses a differentstrategy, i.e. using lsc as reference parameter instead ofGj, which is also known as self-reference. It requires,however, a calibration of lsc to the effective irradiance.Calibration can be carried out at high irradiances, wheretypically the angle of incidence as well as incidentspectrum is fairly constant. Having established anappropriate effective irradiance on the module then allowsre-evaluation of the G-T bins into lsc-T bins. Translatinglsc into equivalent G; then allows evaluation of outdoorcharacteristics at given irradiance and temperatureconditions. This gives further possibilities to identifyoutliers by investigating other descriptors such as theIsc/Gj, module efficiency 11, VMPpNoc within the obtainedlsc-T bins. The flowchart of the outlier identificationprocedures is shown in Fig . 2.
000829
Authorized licensed use limited to: LOUGHBOROUGH UNIVERSITY. Downloaded on June 14,2010 at 15:38:05 UTC from IEEE Xplore. Restrictions apply.
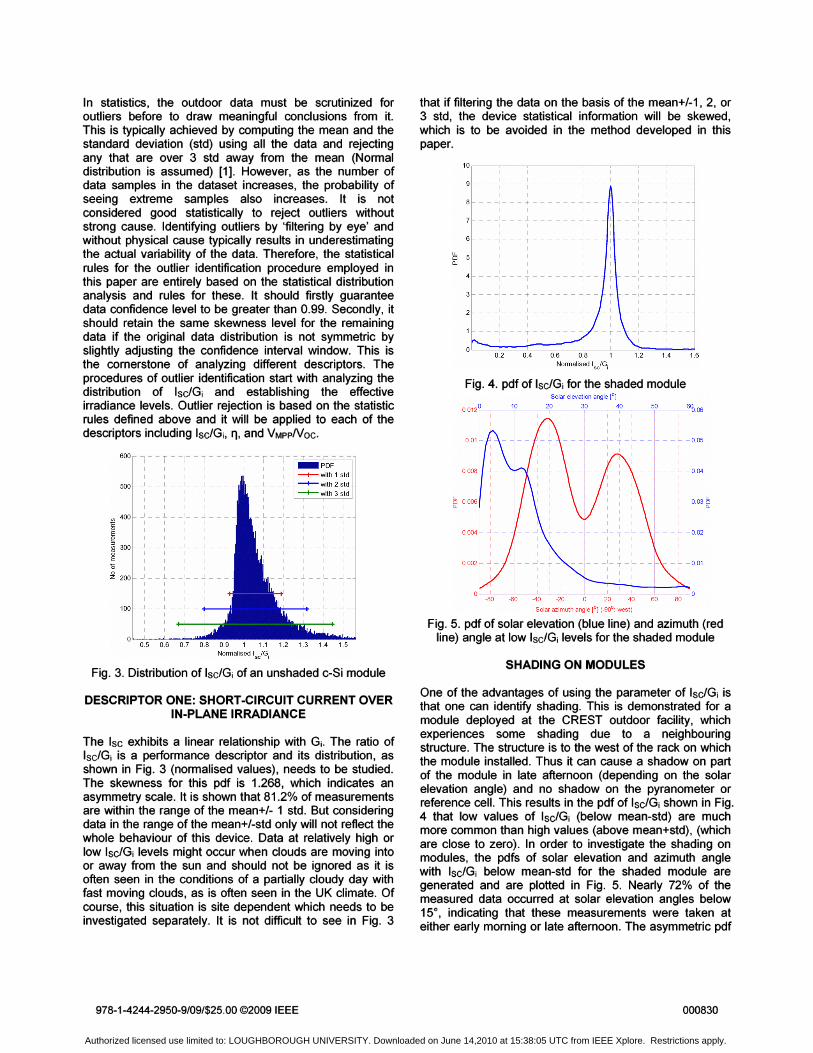
Fig. 3. Distribution of Isc/Gi of an unshaded c-Si module
0.01
004
0.02
0.05
u,0.030
<L
50
1.2 1.4 1.6
I I :
10
0.2 0.4 0.6 0.8 1Normalised IselG i
Fig. 4. pdf of Isc/Gj for the shaded moduleSolar elevation angle [0]
20 30 40
0.004
0.002
0.008
~ 0.006<L
that if filtering the data on the basis of the mean+I-1 , 2, or3 std, the device statistical information will be skewed,which is to be avoided in the method developed in thispaper.
~ ~ 40 ~ a W 40 00 00
Solar azimuth angle [0] (-900: 'NeSt )
Fig. 5. pdf of solar elevation (blue line) and azimuth (redline) angle at low Isc/Gilevels for the shaded module
SHADING ON MODULES
II
I I__ L __I_
I II II I I I I
_ L __1__ .1 __ 1__ ..J _
I I I I II I I I II I I I IL __1__ .1 __ 1__ ..J_I I I I I
I I I II I I I
__1__ .1 __ 1__ ...J_I I I I
I I II I II __ 1__ ..J_
I I III
I
II I I I I
500 _1 __ L __ I__ l __ I__I I I I II I I I II I I I I
~ 400 ~--~--:--~--~-~ I I I I I~ I I I I I
E~ 300 ~--~--:--~--:--I I I I I
'0 I I I I I~ 200 .J __ L __ I__ J. __ L
I I I I II I I I II I I I I
100 ..J __ L __ 1__
I I II I +-,-_,--I I I
0 · ··o'5-·-·~60.7 0.8 0.9 1 1.1 1.2 1.3 1.4 1.5
Normalised Isc/Gj
In statistics, the outdoor data must be scrutinized foroutliers before to draw meaningful conclusions from it.This is typically achieved by computing the mean a~d !hestandard deviation (std) using all the data and rejectingany that are over 3 std away from the mean (Normaldistribution is assumed) [1]. However, as the number ofdata samples in the dataset increases, the probability ofseeing extreme samples also increases. It is notconsidered good statistically to reject outliers withoutstrong cause. Identifying outliers by 'filtering by eye' andwithout physical cause typically results in underestimatingthe actual variability of the data. Therefore, the statisticalrules for the outlier identification procedure employed inthis paper are entirely based on the statistical distributionanalysis and rules for these. It should firstly guaranteedata confidence level to be greater than 0.99. Secondly, itshould retain the same skewness level for the remainingdata if the original data distribution is not symmetric byslightly adjusting the confidence interval window. This isthe cornerstone of analyzing different descriptors. Theprocedures of outlier identification start with analyzing thedistribution of IsdGj and establishing the effectiveirradiance levels. Outlier rejection is based on the statisticrules defined above and it will be applied to each of thedescriptors including Isc/Gj, '1, and VMPpNoc.
DESCRIPTOR ONE: SHORT-CIRCUIT CURRENT OVERIN-PLANE IRRADIANCE
The Isc exhibits a linear relationship with Gj. The ratio ofIsc/Gj is a performance descriptor and its distribution, asshown in Fig. 3 (normalised values), needs to be studied.The skewness for this pdf is 1.268, which indicates anasymmetry scale. It is shown that 81.2% of measur~me~tsare within the range of the mean+l- 1 std. But considerinqdata in the range of the mean+l-std only will not reflect thewhole behaviour of this device. Data at relatively high orlow IsclGj levels might occur when clouds are moving intoor away from the sun and should not be ignored as it. isoften seen in the conditions of a partially cloudy day Withfast moving clouds, as is often seen in the UK climate. Ofcourse, this situation is site dependent which needs to beinvestigated separately. It is not difficult to see in Fig. 3
One of the advantages of using the parameter of Isc/Gi isthat one can identify shading. This is demonstrated for amodule deployed at the CREST outdoor facility, whichexperiences some shading due to a neiqhbourinqstructure. The structure is to the west of the rack on whichthe module installed. Thus it can cause a shadow on partof the module in late afternoon (depending on the solarelevation angle) and no shadow on the pyranometer orreference cell. This results in the pdf of Isc/Gi shown in Fig.4 that low values of Isc/Gi (below mean-std) are muchmore common than high values (above mean+std), (whichare close to zero). In order to investigate the shading onmodules, the pdfs of solar elevation and azimuth anglewith Isc/Gj below mean-std for the shaded module aregenerated and are plotted in Fig. 5. Nearly 72% of themeasured data occurred at solar elevation angles below15°, indicating that these measurements were tak~n ateither early morning or late afternoon. The asymmetric pdf
978-1-4244-2950-9/09/$25.00 ©2009 IEEE 000830
Authorized licensed use limited to: LOUGHBOROUGH UNIVERSITY. Downloaded on June 14,2010 at 15:38:05 UTC from IEEE Xplore. Restrictions apply.

Fig. 7 and Fig. 8 shows the results of normalised IsclG;values sorted into G-T matrix and lsc-T matrix respectively.Generally, lsc-T matrix has a flatter surface than G-Tmatrix does, which indicates that the rearrangement ofoutdoor data based on lsc effective irradiance achievesreduced uncertainty compared to using measuredirradiance on the panel. It is, however, found in Fig. 8 thatat low irradiance levels, e.g. 200 W/m2 (the dark red areaat bottom of the figure), the normalised values of ISC/Gi isabout 1.08, which means 8% larger than the valueobtained at STC. This might be caused by the localclimate condition with large variation at low irradiances,e.g. a worse match of the average incident spectrum inthis particular bin to the quantum efficiency measurements.Analysis is carried out for the measurements in a singlelsc-T bin employing the similar statistical distributionmethods. This then allows further outlier identificationwithin each Isc-T bin. The definition of Isc-T bin width mayneed careful attention as at low irradiances with largeamount of measurements, relatively small bin width isneeded to quantify the module characteristics.
0.94
1.04
0.92
1.08
0.96
0.98
1.02
1.06
0.94
1.08
0.96
0.98
1.02
0.92
1.06
1.04
55
55
45
45
-5
-5
,I I I I I
- - -I - - - ., - - - .- - - - 1- - - --, - - - ,
I I I I I
I I I I I I___I J . I ~ ~ L __
I I I I II I I I I
I I I I I I-1- - - I - - - - - - -1- - - -I - - - "I - - - I" --
I I I I I I
---:--~~ - - - :- - - ~ - ~~~ - -I I I I ~~
___,_ _ _ _ _ _ L ' , _~' _I I I I I
I I r I I
I I I I---r--
, ,, ,
Fig. 7. G-T matrix for normalised Isc/G;
, , ,
,: " -------:---1----'--- - - - - -- i - - - T
I I I I I
I I I I I___I J ~ I ~ ~ _
I I I I I
I I I I I II I I I I
---1-- ~I - - - I- - - -I - - - I - - -
I I I I I
- - -: - - - ~ - - - ;- - - -:- - - ~ - - - ~(- ~. --
I I I I I I___1_ _ _ _ _ _ L 1 I .! . _
I I I I I I
I I I II I ~ I I
------ 1 - - - ---r--,,
15 25 35
T""d (0C)
Fig. 8. lsc-T matrix for normalised Isc/G;
1400
1200
1000
N~800
~c;- 600
400
200
1400
1200
1000
N~
~ 800c;-c<1>
600~'S0-W
400
200
of azimuth angle reveals that in addition to spectralmismatch effect, shading also occurs on the module and isindicated to occur in the afternoon. The shadedmeasurements need to be removed before carry outfurther analysis and thus the data uncertainty can beimproved significantly.
SELF-REFERENCED BY SHORT-CIRCUIT CURRENT
8.22 0.23 0.24 0.25 0.26 0.27 0.28
IsJ Gj@STC [mAj/[W/m2) (outliers removed)
Fig. 6. pdf of IsclG; at G;= 950-1050 W/m2
Typically, lsc behaves linearly with incident i~radian~ .forall single junction devices, although the relative deviationis much larger at low irradiances than at high irradiances.Thus the lsc is a good measure of the effective irradianceprovided it is calibrated accurately. Calibration of lsc toeffective irradiance can be carried out at high irradiances,where typically the angle of incidence as well as incidentspectrum is fairly constant and by definition very close tostandard test conditions (STC). Outlier identification canbe applied to a single irradiance bin using the samestatistical rules. Fig. 6 shows the pdf of Isc/G; at Gi in therange 950-1050 W/m2
, which will be used to determinethe effective irradiance level at STC. Outliers have beenremoved based on the statistical rules described in theprevious section and all measurements are corrected tothe condition of 1000 W/m2 and 25°C using the irradianceand temperature coefficients derived from themeasurements. The pdf has a mean of 0.247 and medianof 0.247 [mA]/[W/m2
] with +/-2.89% uncertainty (99%confidence level). Thus, the lsc calibration can beestablished.
In order to minimise the effects due to differences betweenthe irradiance sensor and the module undermeasurements, such as slow response of pyranometersand difference in the spectral response and angle ofincidence behaviour, it is proposed to use the selfreference method, l.e. using lsc as reference parameterfor irradiance instead of G;. A calibration of lsc to theeffective irradiance is needed to establish the interrelationship. In this study, outdoor data of an a-Si moduleat CREST is taken as an example.
,,
I I I I I
50 - - - -1- - - - -1- - - - - - - - - -1- - - - -1- - --I I I II I I II I I I
40 1 1 ---1-----1----
, "
, "I I I I
~ 30 - - - -1- - - - 1- - - - -1- _ _ _1 1 _Q. I I I I I
I I I I II I I I I
20 ----1--- -1-----1--- _1 1 _I I I I II I I I II I I I I
10 ----1-- --1-----1----- 1 _I I I I I
I I I I, , ,
978-1-4244-2950-9/09/$25.00 ©2009 IEEE 000831
Authorized licensed use limited to: LOUGHBOROUGH UNIVERSITY. Downloaded on June 14,2010 at 15:38:05 UTC from IEEE Xplore. Restrictions apply.

°l : , : : , , , : , ~0.8 ~ - -:- ~ ~ :- - ~ :- .• -:- - -:- - -: •• .- - ~.-. - -~- - -:- - .
, ,18 - - - - - - - - - - - - - - - - - - - -:- - - - - -:--
I I I I I I I I I16 --1---1---1---1---1---1---1- -1---1--
I I I I I I I I I14 - _1- __ 1 1 1 1 1 I. _1 I__
1 1 I 1 I 1 I 1 11 1 I 1 1 1 I 1 1
12 - -1- - -1- - -1- - -1- - -1- - -1- - -I -1- - -I--
1 I I 1 1 1 1 I 1~ 10 __ 1 1__ -1---1--_1 1__ - 1 -1---1--
Q. 1 1 I 1 1 1 1 I 11 1 1 1 I 1 1 I 1
- -1- - -1- - -1- - -1- - -1- - -1- - - I -1- - -I--
1 I I 1 I 1 1 I 16 --1---1---1---1---1---1--- - -1---1--
1 I I 1 I 1 1 1- _1- __ 1 1 1 1 1 1 I__
1 I I 1 I 1 1 11 I 1 1 I 1 1 1
2 -- ~ --:-- -:-- -:--~:- - -:-- -:--
~ ~ ~ U M U U V M UVrrppN oc
Typically, the curvature of the IV curve is related to thediode quality factor of the semiconductor, which is moredifficult. The ratio of voltage at maximum power point toopen circuit voltage 0!MPpNOc) provides some informationabout the shape of I-V curves and can be used as a
DESCRIPTOR THREE: VOLTAGE AT MAXIMUMPOWER POINT OVER OPEN-CIRCUIT VOLTAGE
,.I 1 I I I . I I
L __ 1_. __ 1 1 1_. __ 1,,- __ 1_. __ 1_ . __ I __
1 • I • I 1 1 I I I I· . 1 • I 1 1 I I 1 1 Is 0.5 --1---1---1---1---1---1---1---1---1--
<8: ", I I 1 1 I · I I I
>1:. 0.4 -; :- :_. ~ _ : : : : : : :__
• I · ' I 1 I I 1 I I 1
0.3r. - -:- - -:- - -:- - -:- - -:- - -:- - -:- - -:- - -:--0.21: - -:- - -:- - -:- - -:- - -:- - -:- - -:- - -:- - -:--:1 1 1 1 1 1 I 1 I I
I : I 1 1 1 I I I 1 IO.l t--:- --:- --:- --:- --:- .- -:- --:- --:- --:--o·o 10 20 30 40 50 60 70 80 90 100
Equivalent Gi IW/m2j
Fig. 12. VMPpNoc at Gj<100 W/m2
width. The solid lines represent pdfs obtained using lsc, i.e.effective irradiances, while the dashed lines represent pdfscalculated by measured irradiance Gj. On one hand, asirradiance increases from 200 W/m2 to 1000 W/m2
, themodule efficiencies decrease slightly due to seriesresistance losses. On the other hand, the pdfs calculatedby Gj have much larger deviations than the pdfs calculatedby lsc, and the skewness and thus shape of thedistribution is different. Applying similar statistical rules asdefined above, outliers can be identified at the specificirradiance bins one is interested in. These outliers aremainly due to measurement instrument failures, dirt orsnow/ice/dew on pyranometers or modules. Taking the pdfat 200 W/m2 for example, the mean and median withstandard deviation are 1.09, 1.09 +/-3.16% for 'l-Isc and1.13, 1.15 +/- 9.78% for 'l-Gj, respectively.
Fig. 11. pdf of VMPpNoc for an a-Si module
1.41.3
1400 1600
,,
, ,--../.---1---, ,
, ,, ,
__ J.. L __
, ,, ,, ,
__ .l. L __, ,
/-\ 1 I\ ,
_ -\ 1- __
1\ II \ I
\ , I \ I_\ L- v _L __
\ " I: ~'",,,,,,,\,~
........::::: :=-0.9 1 1.1
Normalised module efficiency0.80.7
--at Isc = 1000W /m2
10 -- at Isc = SOOW/m2
--at Isc = 200W fm2
- - - -- at Gi = 1000W/m2
- - - -- at Gi = 500Wfm2
----- at Gj = 200W/m2
12r;== = = = = :::!]- ---;-- - fY- -----;-- -----:- 1
l!; 6c,
DESCRIPTOR TWO: EFFICIENCY VS IRRADIANCE
Fig. 9. Normalised module '1 against Gj
0. I I
1.8 - - .- ~ . - - - ~ - - ~ f- - - -:- - - -: - - - +- - - ~ --I " I - I I I I I
• - -°1- - - 0°1 - - - t: - - -1- - .- ""1 - - - T - - - t- - -
~~,~~,~! ~,ik;~~::: ,b .• ••.•, .
Fig. 10. pdfs of module efficiencies at different irradiances
The a-Si module efficiency exhibits a distinct relationshipwith irradiance, which can be used as a descriptor. Fig. 9plots the normalised module efficiencies calculated fromthe a-Si module measurements against measured in-planeirradiance (from pyranometer) and calculated effectiveirradiance (from lsc self-reference), respectively. The reddots represent module efficiencies against effectiveirradiance, which show a clear trend of the moduleefficiency decreasing dramatically at low irradiances(below 100 W/m2
) , reaching a maximum at medium levels(between 200-400 W/m\ and then slightly decreasing athigh irradiances. The blue dots, representing theefficiencies against measured irradiance, have a muchlarger spread. This is especially evident for low irradiancelevels as the measured incident irradiance measured bypyranometers varies significantly from that seen by thesemiconductor junction of the test sample. Outlieridentification can be carried out using logarithmicregression for data below 400W/m2 and linear regressionabove 400W/m2
.
Fig. 10 plots pdfs of normalised module efficiencies atirradiance bins of 200, 500, 1000W/m2 with +/-5% bin
978-1-4244-2950-9/09f$25.00 ©2009 IEEE 000832
Authorized licensed use limited to: LOUGHBOROUGH UNIVERSITY. Downloaded on June 14,2010 at 15:38:05 UTC from IEEE Xplore. Restrictions apply.

further descriptor to identify outliers in measurements as itis a rather stable property as shown in Fig. 11. This showsthe pdf of VMPpNoc for an a-Si module. Around 20% ofmeasurements lie within the range of VMPpNoc belowmean-std. Looking closely at irradiances below 100 W/m2
,
as shown in Fig. 12, nearly all the measurements ofVMPpNoc below 0.7 occur at irradiance less than 10 W/m2
.
This is due to the shunt resistance limitation at lowirradiances [7] and very high random errors at these kindsof signal strength.
measure of Gj largely minimizes the error due to spectraland angular effects at different lsc-T bins. The Isc/G;againcan be used for detecting shading on modules and furtherreduce the data uncertainty. Following up the exampleshown in Fig. 1, the normalised result for the samecondition after the proposed outlier identification is plottedin Fig. 13. The standard deviations for 1000W/m2 and100W/m2 are reduced to 1.9% and 1.4%, respectively .
ACKNOWLEDGEMENTS
[1] D.S. Moore, G.P. McCabe, Introduction to the Practiceof Statistics ffh Edition, 2006, W.H. Freeman andCompany , USA.[2] M. Krawczynski , M.B. Strobel, R. Gottschalg,Intercomparison of Pyranometers for DistributedMeasurement System, ffh Photovoltaic ScienceApplications and Technology, Wrexham, 2009, pp. 219222.[3] B. Marion, J. Adelstein , Long-Term Performance of theSERF PV Systems, National Center for Photovoltaics andSolar Program Review Meeting, Denver, CO, 2003.[4] JA del Cueto, T.J. McMahon, Performance of SingleJunction a-Si Modules under Varying Conditions in theField, 26th IEEE Photovoltaic Specialists Conference,Anaheim, CA, 1997, pp. 1205-1208.[5] International Standard CEI IEC 60891, Procedures forTemperature and Irradiance Corrections to Measured I-VCharacteristics Of Photovoltaic Devices.[6] M.B. Strobel, T.R.Betts, G.Friesen, H.G.Beyer,R.Gottschalg, Uncertainty in Photovoltaic PerformanceParameters-Dependence on Location and Material , SolarEnergy Materials and Solar Cells 93,2009, pp. 1124-1128.[7] T.J. McMahon, T.S. Basso, and SR. Rummel, CellShunt Resistance and Photovoltaic Module Performance,25th IEEE Photovoltaic Specialists Conference,Washington, DC, 1996, p.1291.[8] A.J. Carr, T.L. Pryor, A Comparison of the Performanceof Different PV Module Types in Temperate Climate, SolarEnergy 76, 2004, pp. 285-294 .[9] ED. Dunlop, D. Halton, The Performance of CrystallineSilicon Photovoltaic Solar Modules after 22 Years ofContinuous Outdoor Exposure, Progress in Photovoltaics:Research and Applications 14, 2006, pp. 53-64.[10] M. Vazquez, I. Rey-Stolle, Photovoltaic ModuleReliability Model Based on Field Degradation Studies,Progress in Photovoltaics: Research and Application 16,2008, pp. 419-433 .[11] J. Zhu, T.R. Betts, R. Gottschalg , Effects of DifferentData Collection Strategies on Outdoor PerformanceMeasurements and Degradation, 24h EuropeanPhotovoltaic Solar Energy Conference and Exhibition,Hamburg, Germany, 2009.
The work is supported through the EU FP6 project'Performance' (contract no. SES-019718) . It reflects onlythe author's views; the Community is not liable for any usethat may be made of the information contained therein.
REFERENCES
1.06
--@ 1000W/m2 +/-5%
- --@ 100W/m2 +/-5%
0.96 0.98 1 1.02 1.04Nonnalised PMPpiEquivalent Gj
O'----- _ ---'---__.1.-_-----"-__---'---_-----.J_---==0.94
14
1 81----;---~-_____;_r=======il
EFFECTS ON ANALYSIS OF MODULE DEGRADATION
Fig. 13. pdf of PMPP/G; for lsc-T bins at 1000W/m2,
100W/m2 (+/-5%) and 35°C (+/-5°C), normalised to theirpeak values, after outliers been removed
CONCLUSIONS
Long-term outdoor module degradation analysis is basedon the results extracted from outdoor IV measurements .For those modules deployed at the sites with moderateclimate, they experience a relatively low degradation rateof 0.3-1% [8][9]. Thus , the analyzing result uncertaintiesmight be even greater than the degradation rate of theparameter investigated , which leads to the obtainedresults seem to be unchanged. The proposed outlieridentification process enables analyzing module outdoorperformance with reduced uncertainties. It employs pdfanalysis for each parameter and the variation in the shapeof pdf can be investigated to figure out device degradationmodes. As modules degrade over time in outdoorenvironment, it is pointed out in [10] that analyzing thestandard deviation has been considered as important asthe average value for any parameter . The results for theeffects on analysis of long-term module degradation usingproposed data selection strategy will be presented anddiscussed in the authors' paper of [11].
This paper investigates outdoor measurements accuraciesand uncertainties associated with data outliers. An outlieridentification strategy has been developed in this paperusing Isc/G;, VMPpNoc, II against Gj as descriptors in orderto increase the data accuracies without introducingartefacts and skewing device statistics. The use of lsc as a
978-1-4244-2950-9/09/$25.00 ©2009 IEEE 000833
Authorized licensed use limited to: LOUGHBOROUGH UNIVERSITY. Downloaded on June 14,2010 at 15:38:05 UTC from IEEE Xplore. Restrictions apply.