outcomes in special education - wa
TRANSCRIPT

1
OUTCOMES IN SPECIAL EDUCATION:WHAT WE KNOW AND
HOW WE COULD KNOW MORE
Contributors:Pat Brown, Eugene Edgar, Carmen Hadreas,Bridget Kelly, Ron Levine, Constance Pious
The Center for Change in Transition ServicesExperimental Education Unit/College of Education
University of Washington
December 1994
Prepared for the Washington State Institute of Public PolicyThe Evergreen State CollegeSeminar 3162, Mailstop TA-00Olympia, Washington 98505

2
Table of Contents
Page
Executive Summary ......................................................................................................................................... 4
I. Introduction: Purpose of the Paper ...................................................................................................... 6
II. National Data on Special Education Outcomes ................................................................................... 6
A. Who is currently being served in special education? ...................................................................... 7
B. Where and in what type of programs are students served?............................................................ 9
C. What are their in-school outcomes? ............................................................................................... 9
D. Who completes or drops out of school? ........................................................................................ 10
E. What are post-school outcomes .................................................................................................... 11
1. Employment .......................................................................................................................... 12
2. Postsecondary school attendance ........................................................................................ 14
3. Independent living ................................................................................................................. 16
4. Summary of post-school status findings ............................................................................... 17
III. Washington State Data on Special Education Outcomes ................................................................. 18
A. Who is currently being served in special education? .................................................................... 18
B. What type of services are these students receiving? ................................................................... 19
C. What are the in-school student outcomes? ................................................................................... 19
D. Who completes school .................................................................................................................. 20
E. What are post-school outcomes? .................................................................................................. 20
1. Employment .......................................................................................................................... 21
2. Postsecondary education ...................................................................................................... 22

3
3. Independent living ................................................................................................................. 25
4. Summary of post-school status findings ............................................................................... 26
IV. Overview of Data Systems in Other States ....................................................................................... 27
V. Options for Assessing Outcomes in Special Education ..................................................................... 31
References Cited in This Report ..................................................................................................................... 33
Developing a Model of Educational Outcomes ............................................................................... Appendix A

4
OUTCOMES IN SPECIAL EDUCATION:WHAT WE KNOW AND HOW WE COULD KNOW MORE
EXECUTIVE SUMMARY
At legislative direction in the 1994 Supplemental Appropriations Act, the Washington StateInstitute for Public Policy is assessing the feasibility of doing a longitudinal study ofeducational outcomes for students in special education. A longitudinal study allows thetracking of a population over some period of time in order to document changes in thatpopulation. Conducting such a study in the field of K-12 education will be complicated andcostly. In Washington State, we have had only limited experience with this approach.
This report provides a summary of what is known from the research literature on outcomesfor special education students who graduate from high school in the U.S. and inWashington State. Professor Eugene Edgar and his associates at the College ofEducation/Experimental Education Unit of the University of Washington have carried outpath-breaking research in this area over the past decade. For the Institute project, theyhave summarized their research on high school graduates from three school districts inWashington and national research on educational outcomes for such graduates.
What Are Outcomes for the Nation?
• School Completion: Special education students graduate from high school at a ratelower than their non-disabled peers. While the graduation rate for all students is 83%, the rate is 66 % for students with learning disabilities and48 % for students with behavior disabilities.
• Employment: Five years after graduation from high school, employment rates arecomparable for graduates with learning disabilities (71 %) and non-disabled students(69 %), but lower for students with behavior disabilities (47 %).
• Independent Living: Five years after high school graduation, fewer learningdisabled (44 %) and behaviorally disabled (40 %) graduates are living independentlyfrom their parents than are their non-disabled peers (60 %).
• Postsecondary Education: Attendance. Five years after high school graduation,fewer learning disabled and behaviorally disabled (30 % each) graduates haveattended postsecondary education or training programs than have their non-disabledpeers (68 %).
• Other Patterns: Apart from these outcomes, very little is known about the progressof special education students during their school years. Some information isavailable on where students receive their education; more students every yearreceive their education in regular classrooms.

5
What Are Outcomes for W ashington State? From research on student outcomes fromthree school districts in Washington State, the following is known:
• Students with learning and behavior disabilities graduate from high school at rateslower than those for non-disabled students: 60 % and 50 % respectively, comparedto 81 % for non-disabled students.
• Employment rates, 5 years after high-school graduation, are comparable forlearning disabled and non-disabled graduates (79 % and 78 %), but lower for thosewith behavior disabilities (43 %).
• Independent Living rates, 5 years after high school graduation, are 66 % for non-disabled, 64 % for those with learning disabilities and 71 % for those with behaviordisabilities. These patterns for special education graduates are higher than those forthe nation.
• Postsecondary education attendance rates, 5 years after high school graduation,are 92 % for non-disabled, 71 % for those with behavior disabilities, and 63 % forthose with learning disabilities. These patterns for special education graduates arehigher than those for the nation, possibly reflecting the metropolitan nature of theseschool districts.
• Other Patterns: Postsecondary attendance rates are relatively high, althoughpostsecondary graduation rates are substantially lower. Special education graduatesare more likely to be enrolled in vocational and community college programs; theirnon-disabled peers are more likely to be enrolled in four-year institutions.
Options for further study: If work were to begin on a longitudinal system for collectinginformation on special education outcomes, the University of Washington team suggeststhese directions:
• Any system for assessing outcomes in special education should be part of aneducational data system for the entire K-12 system.
• Any such system should:
- collect data at the school district level.- summarize data at regional and state levels.- follow cohorts of students over time (longitudinal).- collect basic demographic student data.- collect data on types of educational services provided.- measure and assess student achievement regularly.- monitor school completion rates.- track post-school outcomes for 5 years.

6
I. INTRODUCTION: PURPOSE OF THE PAPER
This paper offers a review of existing national data on special education services, similar datafrom Washington State, and recommendations for a data collection model that states couldimplement to collect longitudinal data on the effectiveness of special education in the publicschools. No national or state level data adequately address this issue. Despite the enormousresources supporting special education, policymakers and program developers lack informationabout the effectiveness of the specific services provided, comparisons of service delivery models,and the costs of various programs now in place. Hence they are vulnerable to making decisionsbased on conventional practices, pressure from advocacy groups, or untested ideas for change.If a system were in place that longitudinally monitored students in special education regardingservices received and the outcomes of these services, policymakers and program developerswould be able to make decisions based on consistent data regarding program models and thecost of services.
II. NATIONAL DATA ON SPECIAL EDUCATION OUTCOMES
This section draws on several large national surveys of special education (i.e., the 15th AnnualReport to Congress, the SRI National Longitudinal Transition Study [Wagner, et al., 1993], papersof the National Center on Educational Outcomes [NCEO]), and several key studies from differentgeographic regions reported in the professional literature. The information in some parts of thereport is more detailed than in others. This reflects the unevenness of information available fromall sources about the questions we address.

7
A. Who is currently being served in special education?
All data reported in this section concern the 1991-1992 school year as reported in the 15thAnnual Report to Congress. During that year nearly 5 million students, birth to age 21, receivedspecial education services, including 66,495 infants and toddlers (0-2 years) and 422,226 childrenfrom 3 to 5 years old. Students from 6 to 21 years old totalled 4,505,448.
During the 1991-1992 school year, 10.02% of the student population, ages 6 to 21, receivedspecial education services. Most (50.2%) were labeled learning disabled and 9% were labeledseriously emotionally disturbed (i.e., behavior disorders).
Disability Categories for StudentsAged 6-21 for the United States 1991-1992
LearningDisabilities
BehaviorDisorders
OtherDisabilities
SpeechImpairments
MentalRetardation
9%
7%
50%
12%
22%

8
Several demographic categories show significant differences between the special educationpopulation and the general education population: gender, ethnicity, family income, andeducational level of the family. Gender. In special education, 68.5% of students are male ascompared to 49.8% in general education. Ethnicity. African Americans make up 14% of thegeneral education population and 24.2% of the special education population. Family income.More students with disabilities (68.3%) live in families whose income is less than $25,000 than dotheir non-disabled peers (38.8%). Educational level of the family. Students with disabilities aremore likely to live in a home where the head of the household is not a high school graduate thanis the general population of youth (41% and 25.6%, respectively).
68.5%
31.5%Female
Male
Gender
Demographic Characteristicsof Special Education Students
67%
25%
6%2%
African-American
HispanicOther
Caucasian
Ethnicity
68.3%
31.7%
Lessthan$25,000
Greater than$25,000
Annual Income
Source: Wagner, et.al., 1993

9
B. Where and in what type of programs are students served?
Few data are available on the types of services special education students receive, such as typeof instruction, type of curriculum, levels of support offered in the regular classroom. The onlyinformation reported is the location of these services. Most (94.4%) of the students receivingspecial education services received them in the regular school, and 69.3% received services inthe general education classroom more than 40% of the time. Approximately 4% of studentsreceived services in separate schools, 0.8% in residential facilities, and 0.6% at home.
Special Education Settings Provided forStudents Aged 6-21 in the United States in
1991-1992
25%
6%
35%
34%
SeparateClassroom
Other
RegularClassroom
ResourceRoom
C. What are their in-school outcomes?
There are no consistent national data available to answer this question. The National Center onEducational Outcomes (NCEO, 1993) found that between 40% and 50% of students withdisabilities are excluded from national testing.

10
D. Who completes or drops out of school?
Data on school completion (graduation with a high school diploma) and dropouts are difficult toascertain. Data collection problems abound, such as the lack of common definitions of dropoutsand high school diplomas, the movement of students between school districts, and the difficultyschools have keeping data on exit reasons for students who change schools (Rumberger, 1987).
The number of youth in the general population who graduate from school is estimated to be 83%(Wagner, 1993). In contrast, only 66% of students with learning disabilities and 48% of studentswith behavior disorders complete school through graduation (Wagner, 1993).
Rate of Completion*
LearningDisabled
BehaviorDisordered
AllStudents
Disability CategorySource: Wagner, 1993
66%
48%
83%
*United States High School Graduates
100
80
60
40
20
0
Percent of Completion

11
Wehman (1992), based on a review of seven studies reporting dropout rates in different regionsof the country, reports the average dropout rate among students with learning disabilities to be38% (or a completion rate of 62%). Johnson and Rusch (1993) report that students in specialeducation were twice as likely as general education students to drop out of school. The safestassumption is that youth labeled as learning disabled and emotionally disturbed (seriouslybehaviorally disordered) fail to graduate from high school at a higher rate than that of the non-disabled population.
E. What are post-school outcomes?
Many national studies have addressed the question of post-school outcomes for specialeducation students.1 In the following sections we first establish a benchmark at the beginning ofeach section based on the most recent report from the National Longitudinal Transition Study2
(NLTS) (Wagner et al., 1993). This benchmark will then be compared with information from otherstudies across the nation that report information on employment and earnings, postsecondaryschooling, and independent living by disability and by gender. Data are not available on theimpact of ethnicity, social class, and setting (urban vs. rural) on post-school outcomes.

12
(1) Employment
Employment by disability category
At two years after graduation, both learning disabled (LD) graduates and non-disabled graduatesare employed at the same rate of 59%, compared to the 41% rate of graduates with behaviordisorders (BD). By 5 years after graduation the LD employment rate is 71%, the non-disabledrate is 69%, and the BD rate is 47%.
Rates of Employment
Percent of Graduates Employed
0
20
40
60
80
100
59%
41%
71%
69%
47%
2 3 4 5
Years After High School Graduation
Behavior Disordered
Learning Disabled
Non-Disabled
Source: Wagner, 1993
By Disability*
*United States High School Graduates
Employment rates, combining all youth with learning and behavior disabilities, showed over halfcompetitively employed after being out of school 3 to 5 years.

13
Earnings by disability category
Wagner et al., (1993), report hourly wage rates and state that the average yearly income for youthwith disabilities is less than $12,000 per year. Data are not available on earnings by disabilitycategory or gender.
Employment and gender
One of the most consistent findings throughout national studies is the reported difference in theemployment rates following graduation of males and females with disabilities. Women haveconsistently lower rates than men. Wagner et al., (1993), report the employment rate for men withlearning disabilities as 64% and for women with LD as 44% at 3 to 5 years out. Other studiesshow similar trends.
Rates of EmploymentFor Learning Disabled Youth By Gender*
64%
44%
Men Women
Source: Wagner, 1993*United States High School Graduates
Percent Employed100
80
60
40
20
0

14
(2) Postsecondary school attendance
At 5 years after graduation, 30% of youth with learning and behavior disabilities have attendedsome form of postsecondary training as compared to 68% of non-disabled youth (Wagner et al.,1993).
Rates of Ever Attending PostsecondaryEducation and Training*
Percent of Graduates Attending100
80
60
40
02 3 4 5
Years After High School GraduationSource: Wagner, 1993
20
*United States High School Graduates

15
High school graduates in special education who attend postsecondary education are more likelyto have attended vocational schools or community colleges than four-year institutions.
Rates of Attending Postsecondary School*
*United States High School Graduates
Percent Attending100
80
60
40
20
0Vocational School 2-year School 4-year School
19% 15% 14%10%
4% 4%
Type of Postsecondary School Attended
Source: Wagner, 1993
Learning Disabled
Behavior Disordered
Gender differences in postsecondary program attendance
There appear to be few major differences in the attendance rates in postsecondary educationprograms between men and women with disabilities.

16
(3) Independent living
Independent living means living in a household independent of one’s parents. At 5 years fromgraduation, 44% of the youth with learning disabilities and 40% of the youth with behaviordisabilities are living independently, as compared to 60% of the non-disabled youth.
Rates of Independent Living*
Percent Living Independently100
80
60
40
20
02 3 4 5
36%
15%
12%
44%
40%
60%
Years After High School GraduationSource: Wagner, 1993
Behavior DisorderedLearning DisabledNon-Disabled
*United States High School Graduates

17
Gender and independent living
Nationally, female high school graduates with disabilities have higher rates of independentresidence than do males with disabilities. A possible explanation for this difference is thatfemales tend to get married at an earlier age than males.
(4)Summary of post-school status findings . On the whole, youth with learning disabilities andserious behavior disorders appear to be making a relatively satisfactory adjustment to adult lifewhen compared to their non-disabled peers when they graduate from high school. However,special education students have a higher dropout rate.
The major discrepancy is attendance at and graduation from postsecondary education programs.This indicates that the gap between these groups will probably grow as the effects ofpostsecondary education begin to show in the quality of life at a later age. There are someindications that young women with learning disabilities are faring less well than their malecounterparts. We have presented data only on youth with learning and behavior disabilities. Ingeneral, youth with various levels of mental retardation are doing significantly less well than otherdisabled youth discussed in this paper. However, the data about youth with hearing, vision, orphysical disabilities are somewhat similar to the data found within this report.
Rates of Living IndependentlyBy Gender*
Percent Living Independently100
80
60
40
20
0Men Women
30%
49%
32%
45%
Wagner, 1993
Sitlington & Frank, 1993
*United States High School Graduates

18
III. WASHINGTON STATE DATA ON SPECIAL EDUCATION OUTCOMES
Data from this section come from the OSPI Annual Report for the 1992-93 School Year (Billings etal., 1994) and The First Decade Project at the University of Washington (Edgar, 1994b). As withthe data from the national level, information on outcomes in special education is quite limited.
A. Who is currently being served in special education in Washington State?
In Washington State, students between the ages of 3 and 21 are eligible and guaranteed a freeeducation designed to meet their needs. The latest report shows that during the 1992-93 schoolyear, 95,605 students were enrolled in Special Education. This represented 10.75% of the totalWashington State public school enrollment (889,692). The total school age special educationpopulation in Washington is 9.5%. Preschool children numbered 11,260 and students aged 6 to21 years old totalled 84,345. The majority of these students in Washington are learning disabled(48%) and speech/language impaired (20%).
Disability Categories for StudentsAged 6-21 in Washington State 1992-93
17%
6%
48%
9%
20%
OtherDisabilities
BehaviorDisorders
LearningDisabilities
MentalRetardation
SpeechImpairments
Source: Billings et.al., 1994

19
B. What type of services are these students receiving?
Data are not available on specific types of interventions or programs that are provided to thespecial education students other than the location of these services. Students in specialeducation are receiving services in four types of classroom situations. These include the regularclassroom, a resource room, a separate class, or some other type of setting which may be aresidential facility, nonpublic agency, or homebound/hospital care.
Services for Disabled Students inWashington State
3%
49%
19%
29%
RegularClassroom
Other
SeparateClassroom
ResourceRoom
Source: Billings et.al., 1994
C. What are the in-school student outcomes?
No data are available on the overall academic achievement of Washington students in specialeducation.

20
D. Who completes school?
Data are not available on the percentage of school completers in special education on astatewide basis. Two recent studies in Washington State shed some light on this issue.Blackorby, Edgar, and Kortering (1991) report the school completion rate for students withlearning disabilities was 60% in an urban setting.
In a second study (Edgar, 1994a) from two suburban school districts, the completion rate forstudents with learning disabilities was 65% and for students with behavior disabilities 50%.
Rate of Completion*
*Washington High School Graduates
60%
50%
81%
LearningDisabled
BehaviorDisordered
AllStudents
Disability Category
Percent of Completion100
80
60
40
20
0
Source: Edgar, 1994a
E. What are post school outcomes?
The data presented in this section are from the First Decade Project which is a study of 3 schooldistricts in Washington that followed all special education graduates and a random sample of non-disabled graduates in the 1985 and 1990 graduating classes (Edgar, 1994b).

21
(1) Employment
At 2 years after graduation, youth with learning disabilities were employed at a rate of 69%, youthwith behavior disabilities at 50%, and non-disabled youth at 82%. By 9 years after graduationthese rates increased to 73% for LD youth, 57% for BD youth, and 84% for non-disabledgraduates.
Rates of EmploymentBy Disability*
*Washington High School Graduates
100
80
60
40
20
0
Percent of Graduates Employed
2 5 9
Years After High School GraduationSource: First Decade, Edgar, 1994
82%
69%
50%
79%
78%
43%
84%
73%
57%
Behavior DisorderedLearning DisabledNon-Disabled
Employment and gender
An analysis of employment rates by gender for these same graduates revealed few significantdifferences.

22
(2) Postsecondary education
Nine years after graduation, 64% of the youth with learning disabilities, 86% of the youth withbehavior disabilities, and 92% of the non-disabled youth had attended some form ofpostsecondary education program.
Rates of Ever Attending PostsecondaryEducation and Training*
Years After High School GraduationSource: First Decade, Edgar, 1994
Percent of Graduates Attending
Behavior DisorderedLearning DisabledNon-Disabled
67%
92% 92%
46%
38%
63%
71% 86%
64%
*Washington High School Graduates
Gender differences in postsecondary education
Data on postsecondary education by gender indicate little difference in attending postsecondaryprograms for men and women.

23
Postsecondary education: graduation
Data from 9 years after graduation indicate that 42% of the LD youth, 29% of the SBD youth, and66% of the non-disabled youth had graduated from some form of postsecondary educationprogram.
A COMPARISON OF RATES OF GRADUATING FROM POST-S ECONDARY EDUCATION AND TRAINING FOR WASHINGTON HIGH SCHOOL GRADUATES
Disability CategoryPercent Who Graduated Five
Years After High SchoolPercent Who Graduated Nine
Years After High SchoolLearning Disabled 29% 42%Behavior Disordered 29% 29%Non-Disabled 49% 66%

24
Type of program
There was a difference in the types of programs these graduates had completed. High schoolgraduates with learning and behavior disabilities who went on to complete postsecondaryeducation were more likely to have completed vocational programs or community college thanfour-year institutions. The reverse pattern prevailed for non-disabled graduates.
Rates of Graduating from Postsecondary School Five Years After High School*
1%0% 0%7%
21%
7%
29%
9%
33%
0%
20%
40%
60%
80%
100%
VocationalSchool
2-YearSchool
4-YearSchool
Type of Postsecondary School Attended
P er cent Gr aduat ed
Learning Disabled
Behav ior Disordered
Nondisabled
*W ashing to n H ig h S cho o l G rad uates
Rates of Graduating from Postsecondary School Nine Years After High School*
2%0%
14%8%
29%
11%14% 13%
44%
0%
20%
40%
60%
80%
100%
VocationalSchool
2-YearSchool
4-YearSchool
Type of Postsecondary School Attended
P er cent Gr aduat ed
Learning Disabled
Behav ior Disordered
Nondisabled
*W ashing to n H ig h S cho o l G rad uates
25
(3) Independent living
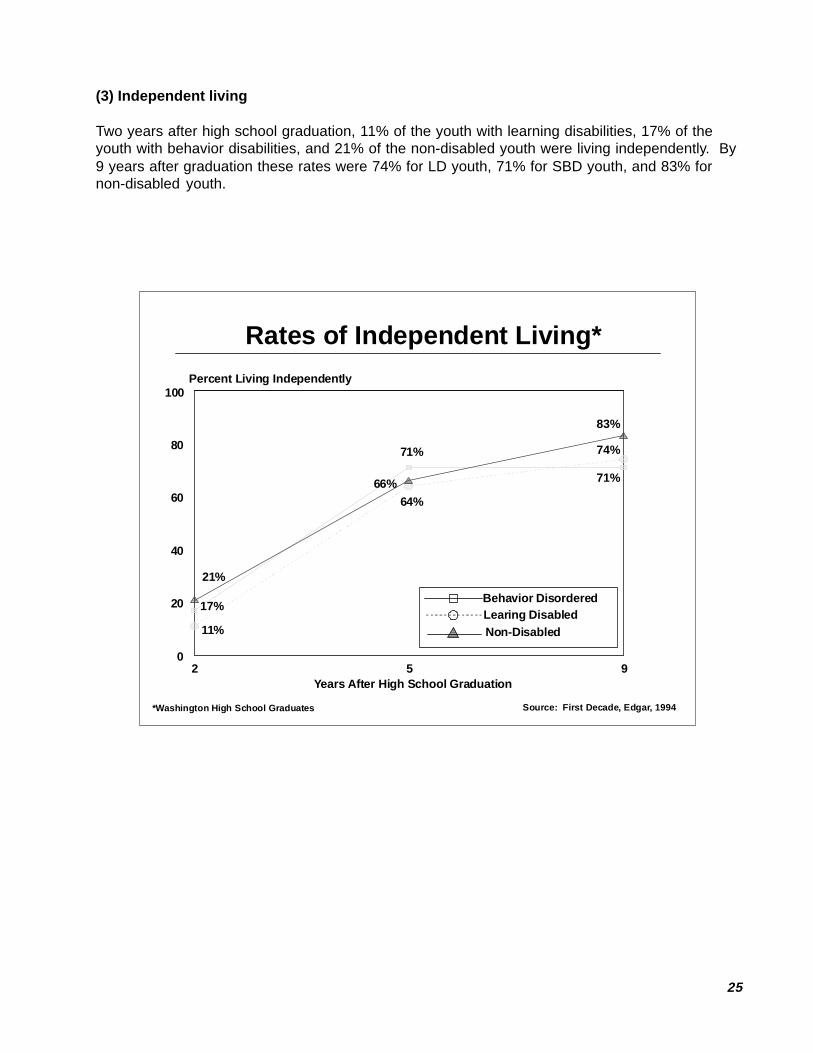
Two years after high school graduation, 11% of the youth with learning disabilities, 17% of theyouth with behavior disabilities, and 21% of the non-disabled youth were living independently. By9 years after graduation these rates were 74% for LD youth, 71% for SBD youth, and 83% fornon-disabled youth.
Percent Living Independently
0
20
40
60
80
100
2 5 9Years After High School Graduation
11%
17%
21%
71%
64%
66% 71%
74%
83%
Behavior DisorderedLearing DisabledNon-Disabled
Rates of Independent Living*
Source: First Decade, Edgar, 1994*Washington High School Graduates

26
(4) Summary of post-school status findings.
High school graduates from three school districts with learning and behavior disabilities inWashington are making a reasonable adjustment to adult life when compared to theirnon-disabled peers. However, special education students have a higher dropout rate. This is truefor both men and women. Because the non-disabled graduates have also achieved a muchhigher graduation rate from postsecondary education programs we believe the differences in lifeoutcomes will increase in the coming years. Further, the data in this report do not reflect thepost-school status of youth in the various categories of mental retardation. Their outcomes areless positive.

27
IV. OVERVIEW OF DATA SYSTEMS IN OTHER STATES
Most of the current research on state systems to measure special education outcomes is done bythe National Center for Educational Outcomes (NCEO) at the University of Minnesota. Theirprimary mission is to promote a “national discussion of educational goals and indicators thatinclude students with disabilities” (NCEO, 1994, p. 1). During the past 3 years, NCEO workedwith state and federal education agencies to develop a comprehensive conceptual model ofeducational outcomes and has produced documents that identify these outcomes and theirindicators.
This model contains 6 domains of educational outcomes with 77 projected indicators for obtainingoutcome data. Appendix A shows their conceptual model and indicators. Based on theconceptual model, NCEO is now working on a model with a set of outcomes and indicators for sixdevelopmental levels: ages 3 and 6, grades 4, 8, and 12, and post-school level. Outcomes andindicators have been established for ages 3 and 6 and post-school level. NCEO is currentlydeveloping outcomes and indicators for grades 4, 8 and 12.
For the past 3 years, NCEO has conducted a national survey of state activities assessingeducational outcomes. State directors of special education were surveyed in 1990 and asked toprovide information on data collection systems within their state. The 1993 report containsinformation on all 50 states and 9 territories receiving special education funds. The surveycontains questions addressing 7 major areas: (1) federally reported data; (2) outcomesassessments; (3) inclusion of students with disabilities in state assessments; (4) state needs;(5) practices, programs, and plans related to outcomes; (6) nontraditional assessments; and (7)state activities in selected outcomes areas.
The following chart includes NCEO data from 13 states whose data collection systems mightserve as examples for Washington. The data fall into category 5 above (practices, programs, andplans related to outcomes). We report on the five assessment areas that are most useful foraddressing the outcome areas we raise in this report: academic, post-school, vocational skills,functional living, and attitudes.
The overview provided in the chart shows very serious gaps in the data systems of all states. Ofthe 13 states, only Maryland collects data in the targeted areas. Washington State collects datain only one area.

28
SUMMARY OF PROGRESS IN ASSESSING SPECIAL EDUCATION OUTCOMES:13 STATES
State Academic Post School Voc. Skills Funct. Living AttitudesIA Students with LD, BD, &
mild MR are followed 1, 3, & 5 years.
ID 11th grade Test of Achievement of Proficiency.6th grade ITBS
Students with disabilities are followed 3 years post high school.
IL 3, 6, 8, & 10 grades Illinois Goal Assessment Program for math, reading, & writing.4, 7, & 11 grade Illinois Goal Assessment Program for science & Social Studies.
KY 4, 8, & 12 Assessment data collected using variety of measures.
Kentucky Instructional Results and Information System is given to all students.
Successful transition to adult life outcome indicator for all students.
(continued)

29
State Academic Post School Voc. Skills Funct. Living AttitudesMD Grades 3, 5, & 8
Comprehensive test of Basic Skills and Maryland School Performance Assessment Program. Grades 9 - 12 Functional tests in math reading, writing, & citizenship
Statewide High School Graduate Follow up System administered to all students.
Grades 8 12 collects data on vocational programs.
Outcomes are measured through Life Skills Curricular Framework.
Parent, teacher and student data in Maryland School Performance Report.
MN
NC In process of developing tests for grades 3 12 which will replace CAT.
Data are collected from students enrolled in Vocational Education.
OR Grades 3, 5, 8, & 11 are given statewide tests in reading, math, writing, & language arts.
Grade 12 and 2 years post school data are obtained.
Data are collected from all students with disabilities
PA Grades 5, 8, & 11 school based assessment for reading and math.Grades 6 & 9 school based assessment for writing.
Data are collected from all students with disabilities
(continued)

30
State A cademic Post School Voc. Skills Fu nct. Living AttitudesSD Grades 4, 8, & 11
SAT
VT Grades 4 & 8 Portfolio Assessment
Students with disabilities Post secondary questionnaire
WA Grades 4, 8, & 11 Metropo li tan Achi evem ent Test.
WS Grade 3 State developed reading test. Grade 8 ACT 8th grade EXPLORE Grade 10 10th grade PLAN
31
V. OPTIONS FOR ASSESSING OUTCOMES IN SPECIAL EDUCATION
A. What should happen next?
The current data collection systems used by states (including Washington) do not enable them tocollect data that can answer the most basic questions concerning the outcomes of specialeducation. As shown in this report, data are missing on the most fundamental issues regardingthe kind of education students receive and the progress they make during their school years.
Any system developed for evaluating special education programs should be a component of anoverall educational data system. Evaluating special education programs alone, without acomparable database on non-disabled students from the same school district, cannot provideusable information for either policymakers or program developers.
Given the extensive work of the National Center on Educational Outcomes at Minnesota andespecially the work on systems developed by other states and a study guide for developing newsystems, we suggest that the next phase of this project include on-site consultation from MarthaThurlow, the Assistant Project Director of NCEO.
B. Questions that should be asked in a longitudinal study
A number of questions need to be addressed in order to monitor the effectiveness of currentspecial education services and to make decisions about programs in special education. Data toanswer these questions should be collected at the local school district level and summed at thestate level. They should be collected in ways that permit analysts to follow cohorts of studentsover time, and to measure changes within the same group of students as well as outcomes (bothin school and post-school) related to different types of students and different types of programsthey receive.
Any model for collecting longitudinal data on special education students in Washington Stateshould include the following elements:
1. Demographic data: gender, disability category, birth date, date of entry into special education,date of exit from special education, some form of socioeconomic measure of the family (e.g., freelunch status). These data need to be stored under a system that will allow analysts to followstudents who move from district to district. Perhaps the student’s social security number and aschool district number would suffice.

32
2. Types of program services the student has received: This component is very importantbecause it will allow for data analysis based on program type by student disability by outcomes.For example, is an inclusive program better than a segregated program for the same levelstudent? Without program type information the data system will have limited use. Developingcodes that can accommodate many program variables is a major stumbling block to the process.However, it will need to be addressed.
3. Student in-school outcomes: Yearly data need to be maintained on student outcomes inschool. Whenever possible, these outcomes should be the same as those for students not inspecial education. Some of these variables include: attendance, achievement test data,alternative assessment data (portfolio data), and, when possible, engagement in the schoolenvironment. The data need to be stored by student and by year so that longitudinal analysesare possible.
4. Completion of school: Data need to be maintained to determine school completion andschool dropout. The dropout data will be difficult to maintain because many students drop out ofschool only to return, often to a different school, and graduate. Alternatively, they drop out againand then enter a different program. While completion data are fairly easy to collect, data onstudents who do not complete school are much more difficult to compile.
5. Post-school outcomes: The prevailing view is that special education graduates are faringpoorly as young adults. This view is not wholly accurate: some special education graduates aredoing quite well and others are not. Schools need to track their graduates to determine theirpost-school status. These data can serve as important markers of special educationeffectiveness. Methodological flaws in follow-up studies (noted earlier) suggest the need for morerigorous data collection. Data on the classic variables of employment and attendance at andgraduation from postsecondary schools are the easiest to collect, but leave unanswered manyother questions about quality of life, life satisfaction, citizenship skills, and the relationship of theschool program to eventual life outcomes. These latter questions are difficult to answer without acomprehensive data collection program.

33
References Cited in This Report
Blackorby, J., Edgar, E.B., & Kortering, L. (1991). A third of our youth? A look at the problem ofhigh school dropout among students with mild handicaps. The Journal of Special Education,25, 102-113.
Billings, J.A., Pearson, J., Gill, D. Dailey, J.L., & Grummick, S. (1994). Special Education: AService, Not a Place. Annual Report for the 1992-93 school year. Olympia, WA: Office of theSuperintendent of Public Instruction.
Edgar, E.B. (1994a). Dropout prevention in suburban settings. Unpublished report. Seattle,WA: Experimental Education Unit, University of Washington.
Edgar, E.B. (1994b). First Decade report. Unpublished report. Seattle, WA: ExperimentalEducation Unit, University of Washington.
Johnson, J.R., & Rusch, F.R. (1993). Secondary special educationand transition services:Identification and recommendations for further research. Career Development forExceptional Individuals, 16(1), 1-18.
National Center on Educational Outcomes (1994). State special education outcomes.Minneapolis, MN: College of Education, University of Minnesota.
National Center on Educational Outcomes (1993). Educational outcomes and indicators forstudents completing school. Minneapolis, MN: College of Education, University ofMinnesota.
Office of Special Education Programs, U.S. Office of Special Education and RehabilitativeServices (1993). To assure the free appropriate public education of all children withdisabilities. Fifteenth Annual Report to Congress on the Implementation of the IndividualsWith Disabilities Education Act. Washington, D.C.: U.S. Department of Education.
Rumberger, R. (1987). High school dropout: A review of the issues and evidence. Review ofEducational Research, 57, 101-121.
Sitlington, P.L., & Frank, A.R. (1993). Success as an adult -- Does gender make a difference forgraduates with mental disabilities? Career Development for Exceptional Individuals, 16(2),171-182.
Wagner, M., Blackorby, J., Cameto, R., Hebbeler, K., & Newman, L. (1993). The transitionexperiences of young people with disabilities: A summary of the findings from the NationalLongitudinal Transition Study of Special Education Students. Menlo Park, CA: SRIInternational.
Wehman, P. (June, 1992). Transition for young people with disabilities: Challenges for the1990’s. Education and Training in Mental Retardation, 112-118.
* For Appendix A “Developing a Model of Educational Outcomes”, please contact WSIPP.

34
ENDNOTES
1
There are a number of concerns about these studies. First , almost all have used telephone interviews with keyinformants (parents) to obtain the data. This method, while cost effective, does not allow for data collection on qualitativeissues such as quality of life, competence of the youth with the disability, or the views and attitudes of the former student.Thus, available data focus on questions of “status” such as employment, attendance at and graduation from postsecondaryeducation programs, and living arrangement (independent or dependent). Second , all the reported studies have had aserious problem with missing data -- that is, subjects who were not located or refused to participate in the study. Moststudies reach less than 70% of the original number of subjects, and for some questions (earnings) the reported datausually represent less than half of the subjects. Regardless of these cautions, we believe that the existing data arevaluable in providing a beginning view of the post-school status of special education students.
2 The NLTS database includes more than 8,000 youth with disabilities, all of whom were 13 to 21, in special educationin the 1985-86 school year. Data were collected for the NLTS study in 1987, 1989, and 1990. LD represented 55% ofthe sample, and SBD 10%.