outcome-based design for circadian lighting: an integrated ... library/conferences/specialty...
TRANSCRIPT

2018 Building Performance Analysis Conference and
SimBuild co-organized by ASHRAE and IBPSA-USA
Chicago, IL
September 26-28, 2018
Outcome-Based Design for Circadian Lighting: An Integrated
Approach to Simulation & Metrics
ABSTRACT
Lighting practitioners are increasingly asked to quantify
melanopic illuminance for phase shift and melatonin
suppression at an hourly time scale for compliance with
the WELL building Standard. This paper illustrates a
workflow to achieve Equivalent Melanopic Lux (EML)
goals based on the spectral qualities of daylight and
electric light sources in the highly variable context of
office design. The impacts of climate, view, color
temperature, wall color, and orientation are considered.
INTRODUCTION
A daily rhythm of blue-rich irradiance in the morning
hours followed by blue-deficient irradiance in the
evening hours is correlated with natural circadian
rhythms, improved sleep and overall health (Figueiro,
Brainard, Lockley, 2008). The WELL Building
Standard, known as the WELL, is one of the first human
health design standards to codify a daily minimum
threshold of 200 melanopic lux between 0900–1300 to
entrain occupant circadian rhythms (International WELL
Building Institute, 2017). Successful outcomes in design
practice requires simulation of vertical illuminance from
all sources of light, including electric, daylight and
reflected light incident at the eye of the viewer, and
consideration of the spectrum of each source, energy
code, glare and cost. In WELL projects, circadian light
systems are spot checked after occupancy in the field
with spectrometer measurements taken at any desk at an
unknown time of year. Therefore, designers must
account for spectral power distributions (SPD) for
glazing, materials, daylight, and electric sources, as well
as accounting of the variable illuminance from daylight,
daylight dimming, and shade deployment.
Simulation of vertical illuminance is accomplished with
physically based rendering via Radiance (Ward, 1994)
and Daysim (Reinhart, 2001), while post-processing for
EML is conducted with Excel using melanopic ratios
calculated with the WELL calculator (WELL, 2018).
Additional luminance validation is provided via LARK
Spectral Lighting (Inanici, Brennan, Clark, 2015).
This paper uses such parameters and metrics to build a
composite understanding of predicted, hourly circadian
light in an office space. Three climate zones based upon
daylight availability are simulated. Two sets of SPDs are
used for indoor and outdoor lighting that can be grouped
into 4000K and 6500K (Fig. 1). To balance lighting
power density goals with circadian lighting targets, this
paper investigates task lighting solutions to fill in the
circadian light deficit for hours that fall short of the goal.
This process enables design validation for visual and
non-visual light coupled with energy performance for
energy code and WELL compliance.
Fig. 1 Melanopic action spectrum & SPDs
Metrics
The WELL standard uses EML which is derived from
the spectral action curve of the photopigment
melanopsin, as the metric for circadian lighting.
Calculating melanopic lux is a matter of multiplying the
spectral power distribution of a light source by the
Martin Timothy Brennan, AIA, Alex Robert Collins ZGF Architects LLP
© 2018 ASHRAE (www.ashrae.org) and IBPSA-USA (www.ibpsa.us). For personal use only. Additional reproduction, distribution, or transmission in either print or digital form is not permitted without ASHRAE or IBPSA-USA's prior written permission.
141
melanopsin action curve which is normalized whereby 1
melanopic lux is equivalent to 1 photopic lux at 555nm
(Enezi and others, 2011). The “Irradiance toolbox”
allows a user to enter a source SPD along with the
photopic illuminance normal to the eye to derive
melanopic lux (Lucas and others, 2014). The WELL
Melanopopic Ratio excel calculator allows the user to
input an SPD to derive a melanopic ratio which can be
multiplied by photopic illuminance for EML. The
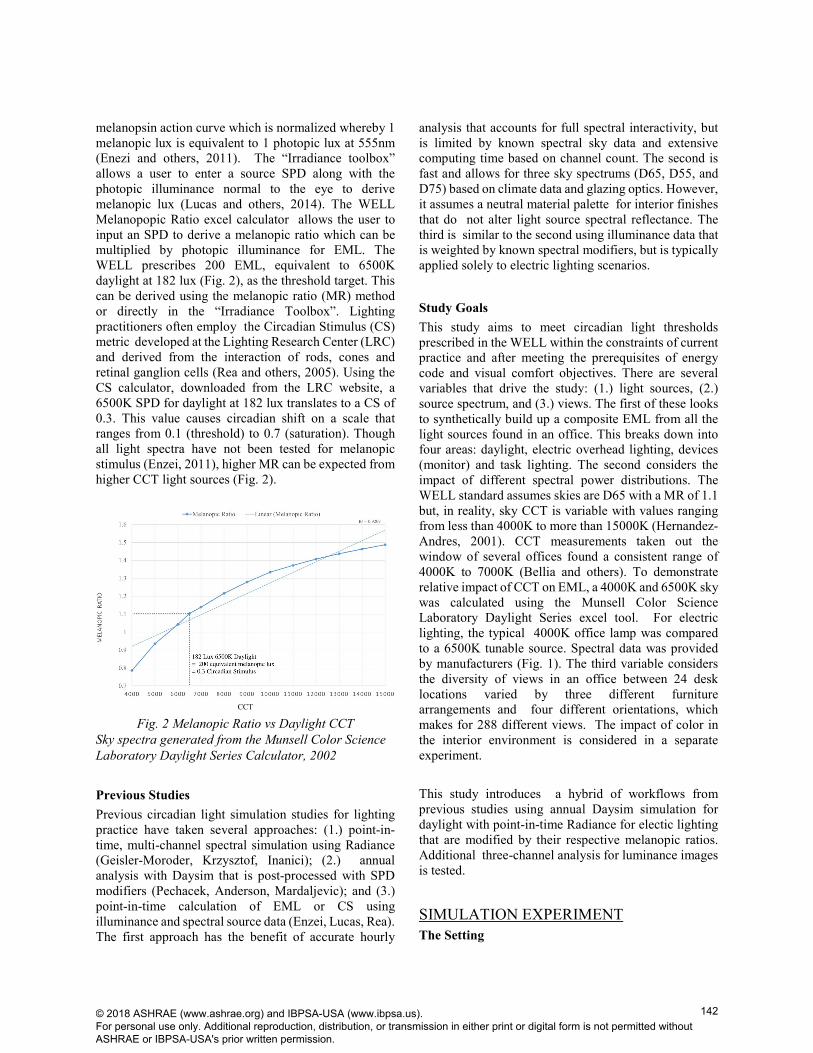
WELL prescribes 200 EML, equivalent to 6500K
daylight at 182 lux (Fig. 2), as the threshold target. This
can be derived using the melanopic ratio (MR) method
or directly in the “Irradiance Toolbox”. Lighting
practitioners often employ the Circadian Stimulus (CS)
metric developed at the Lighting Research Center (LRC)
and derived from the interaction of rods, cones and
retinal ganglion cells (Rea and others, 2005). Using the
CS calculator, downloaded from the LRC website, a
6500K SPD for daylight at 182 lux translates to a CS of
0.3. This value causes circadian shift on a scale that
ranges from 0.1 (threshold) to 0.7 (saturation). Though
all light spectra have not been tested for melanopic
stimulus (Enzei, 2011), higher MR can be expected from
higher CCT light sources (Fig. 2).
CCT
Fig. 2 Melanopic Ratio vs Daylight CCT
Sky spectra generated from the Munsell Color Science
Laboratory Daylight Series Calculator, 2002
Previous Studies
Previous circadian light simulation studies for lighting
practice have taken several approaches: (1.) point-in-
time, multi-channel spectral simulation using Radiance
(Geisler-Moroder, Krzysztof, Inanici); (2.) annual
analysis with Daysim that is post-processed with SPD
modifiers (Pechacek, Anderson, Mardaljevic); and (3.)
point-in-time calculation of EML or CS using
illuminance and spectral source data (Enzei, Lucas, Rea).
The first approach has the benefit of accurate hourly
analysis that accounts for full spectral interactivity, but
is limited by known spectral sky data and extensive
computing time based on channel count. The second is
fast and allows for three sky spectrums (D65, D55, and
D75) based on climate data and glazing optics. However,
it assumes a neutral material palette for interior finishes
that do not alter light source spectral reflectance. The
third is similar to the second using illuminance data that
is weighted by known spectral modifiers, but is typically
applied solely to electric lighting scenarios.
Study Goals
This study aims to meet circadian light thresholds
prescribed in the WELL within the constraints of current
practice and after meeting the prerequisites of energy
code and visual comfort objectives. There are several
variables that drive the study: (1.) light sources, (2.)
source spectrum, and (3.) views. The first of these looks
to synthetically build up a composite EML from all the
light sources found in an office. This breaks down into
four areas: daylight, electric overhead lighting, devices
(monitor) and task lighting. The second considers the
impact of different spectral power distributions. The
WELL standard assumes skies are D65 with a MR of 1.1
but, in reality, sky CCT is variable with values ranging
from less than 4000K to more than 15000K (Hernandez-
Andres, 2001). CCT measurements taken out the
window of several offices found a consistent range of
4000K to 7000K (Bellia and others). To demonstrate
relative impact of CCT on EML, a 4000K and 6500K sky
was calculated using the Munsell Color Science
Laboratory Daylight Series excel tool. For electric
lighting, the typical 4000K office lamp was compared
to a 6500K tunable source. Spectral data was provided
by manufacturers (Fig. 1). The third variable considers
the diversity of views in an office between 24 desk
locations varied by three different furniture
arrangements and four different orientations, which
makes for 288 different views. The impact of color in
the interior environment is considered in a separate
experiment.
This study introduces a hybrid of workflows from
previous studies using annual Daysim simulation for
daylight with point-in-time Radiance for electic lighting
that are modified by their respective melanopic ratios.
Additional three-channel analysis for luminance images
is tested.
SIMULATION EXPERIMENT
The Setting
© 2018 ASHRAE (www.ashrae.org) and IBPSA-USA (www.ibpsa.us). For personal use only. Additional reproduction, distribution, or transmission in either print or digital form is not permitted without ASHRAE or IBPSA-USA's prior written permission.
142
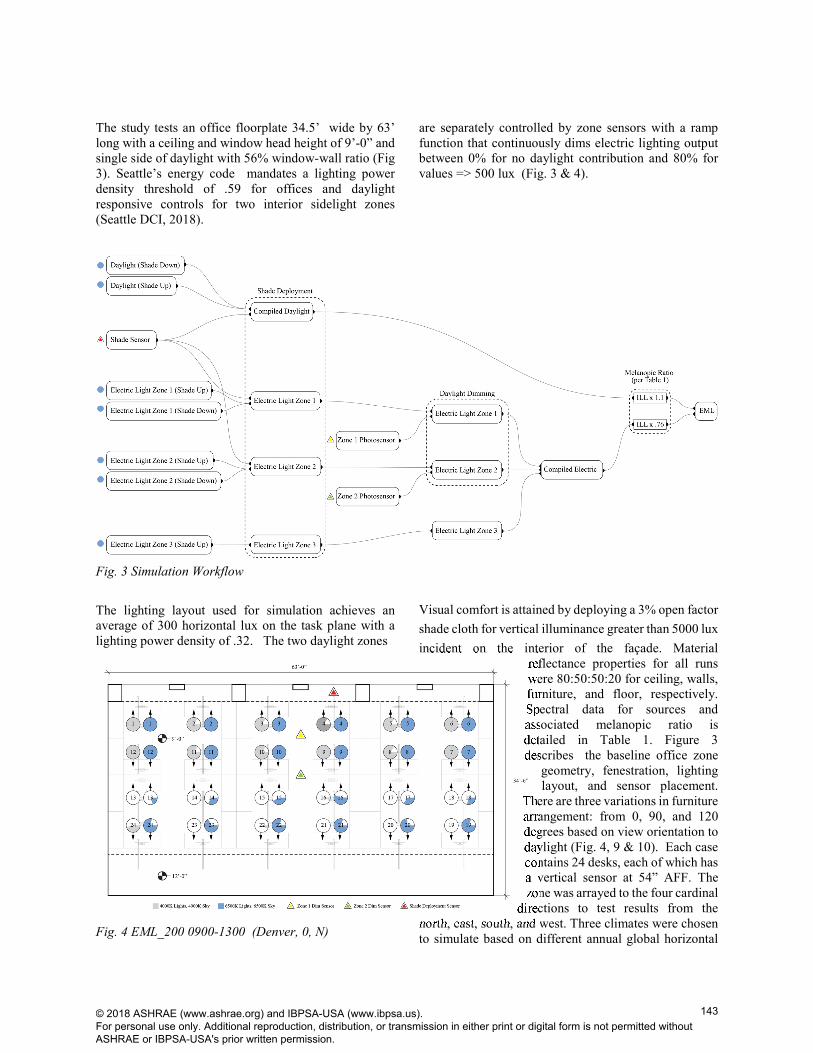
The study tests an office floorplate 34.5’ wide by 63’
long with a ceiling and window head height of 9’-0” and
single side of daylight with 56% window-wall ratio (Fig
3). Seattle’s energy code mandates a lighting power
density threshold of .59 for offices and daylight
responsive controls for two interior sidelight zones
(Seattle DCI, 2018).
Fig. 3 Simulation Workflow
The lighting layout used for simulation achieves an
average of 300 horizontal lux on the task plane with a
lighting power density of .32. The two daylight zones
Fig. 4 EML_200 0900-1300 (Denver, 0, N)
are separately controlled by zone sensors with a ramp
function that continuously dims electric lighting output
between 0% for no daylight contribution and 80% for
values => 500 lux (Fig. 3 & 4).
Visual comfort is attained by deploying a 3% open factor
shade cloth for vertical illuminance greater than 5000 lux
incident on the interior of the façade. Material
reflectance properties for all runs
were 80:50:50:20 for ceiling, walls,
furniture, and floor, respectively.
Spectral data for sources and
associated melanopic ratio is
detailed in Table 1. Figure 3
describes the baseline office zone
geometry, fenestration, lighting
layout, and sensor placement.
There are three variations in furniture
arrangement: from 0, 90, and 120
degrees based on view orientation to
daylight (Fig. 4, 9 & 10). Each case
contains 24 desks, each of which has
a vertical sensor at 54” AFF. The
zone was arrayed to the four cardinal
directions to test results from the
north, east, south, and west. Three climates were chosen
to simulate based on different annual global horizontal
© 2018 ASHRAE (www.ashrae.org) and IBPSA-USA (www.ibpsa.us). For personal use only. Additional reproduction, distribution, or transmission in either print or digital form is not permitted without ASHRAE or IBPSA-USA's prior written permission.
143

radiation (kWh/m2): Seattle (41,800), Chicago (51,900),
and Denver (61,600). The Profile linear downlight from
Fluxwerx was choosen for overhead lighting (Fluxwerx,
2018) . The Curve by Finelite was used for task lighting
(Finelite, 2018). Both IES photometric files and SPDs
for these sources were either provided by the
manufacturer or dowloaded online. The monitor was
modeled as a spectrally neutral 250cd/m2 glow source.
Table 1 Radiance Channel (Nanometers) and
Melanopic Ratio (MR)
SOURCE 586-780 498-
586
380-498 MR
Glazing 0.386 0.454 0.493 NA
Fluxwerx 4000k 0.833 1.153 0.384 0.718
Fluxwerx 6500k 0.405 1.278 0.788 0.976
Daylight 4000k 0.838 0.714 0.375 0.786
Daylight 6500k 0.641 0.872 0.823 1.104
Finelite NA NA NA 0.564
Blue Wall 0.481 0.5162 0.515 NA
Green Wall 0.471 0.582 0.149 NA
Yellow Wall 0.630 0.518 0.083 NA
Simulation Results
An initial simulation established a baseline electric
lighting layout that was used for all post-processing in
all scenarios. The next step was to measure the
percentage of annual hours for which each of the points
reached the EML threshold of 200 lux. This annual
method was proposed by Anderson and Mardalijevic in
2014 and visualized with a “Sombrero plot” for multiple
view directions and hourly durations. In this case, one
view (towards the monitor) and time slot (0900-1300) is
considered for each occupant. A pair of pie charts located
at each desk illustrates annual EML 200 based on both
daylight and electric lighting for 4000K and 6500K CCT
(Fig. 4). Slices of the pie express the percentage of the
1044 hours meeting EML_200. The front two rows of
the room mostly meet the goal, while the back two fall
short. However, this metric does not give a sense of the
margin of failure which in some cases is 20 to 30 EML
out of 200. Various strategies to address this challenge
are discussed later.
Anderson and Mardalijevic also suggested averaging
“circadian potential” of an entire zone to see
performance trends (2014). Figure 5 presents one such
example, in which the annual data for all 24 points per
zone are averaged for all test cases. This was averaged
for an all-4000K light source option and a 6500K option.
The north and west orientations outperform east and
west, as shades are not deployed as often in the morning.
The 90-degree furniture layout performs best, followed
by 120-degree and then 0-degree. There is a modest
advantage to the sunnier climates in the 120- degree and
90-degree layouts. Overall, most spaces are failing
during more than half the hours tested with 4000K light.
Fig. 5 Average Zone EML_200_0900-1300
4000K Sky + 4000K Light vs 6500K
Increasing the sky and electric lighting CCT to 6500K
increases the “passing” hours dramatically (dotted lines
in Fig. 5). However, increasing CCT alone does not
reach annual EML_200. This metric is useful for annual
trends, but gives no indication of the sensitivity of a zone
to meeting EML_200.
Taking a closer look at an interior Denver point #17 at
an hourly resolution across the first week of the year, we
can examine each light source contribution (Fig. 6). In
this case, all sources are set at 4000K except the monitor,
which was assumed to be 6500K. Nearly three-quarters
of the EML_200 target comes from overhead light, with
minimal contribution from daylight. The final quarter of
EML_200 is nearly satisfied by the monitor light,
assuming 100% brightness. Seven of the 20 hours
require some task light to fully comply with this target.
Fig. 6 Hourly EML_200 (Denver, 0, South, Point 17)
4000K: Sky/ Light/ Task + 6500K Monitor
© 2018 ASHRAE (www.ashrae.org) and IBPSA-USA (www.ibpsa.us). For personal use only. Additional reproduction, distribution, or transmission in either print or digital form is not permitted without ASHRAE or IBPSA-USA's prior written permission.
144
Meanwhile, analysis at a perimeter Chicago point #4,
looking straight out a north-facing window tells a
different story in which daylight meets the goal for half
of the hours in the week with overhead lighting filling
the gap to EML_200 (fig. 7).
Fig. 7 Hourly EML_200 (Chicago, 0, North, Point 4)
4000K: Sky/ Light / Task + 6500K Monitor
For the interior locations such as point #17 in Denver,
task lighting may be required for up to half of the hours
to fill a 20-EML deficit. Assuming 8 watts per task light,
Figure 8 shows predicted annual kWh consumption for
each test case. 4000K (worst case) and 6500K (best case)
options are compared such that 6500K is a baseline
energy usage. 6500K monitor light is assumed to
contribute to EML, but not added to the power load.
Figure 9 is calculated by adding each point in a zone that
fails to meet the threshold annually and multiplying by
the source wattage. Switching to 6500K light sources
cuts energy use nearly in half. Interestingly, the 0-degree
option furniture layout does not require task lights with
6500K lighting and monitor light. This shows that many
scenarios can be very close to meeting EML_200, but
the sensitivity is difficult to discern from annual metrics
alone. Furthermore, trends can be deceiving as the
annual metric in Figure 6 shows the 0-degree layout as
less performative compared to 90-degree and 120-
degree layouts with the exception of some 120-degree
east and south orientations that have shades deployed.
Even though half of the seats look away from the
window, the lighting layout happens to be optimized for
electric lighting view. This was not intentional but rather
the product of an efficent lighting scheme and furniture
layout. The lighting layout is a difficult variable to
control for as, in practice, lighting and furniture solutions
are not always optimized together. This study aimed to
overcome this by testing a diversity of arrangements with
a range of lighting to view relationships.
Fig. 8 Annual kWh from 4000K Task Lighting
(4000K vs 6500K Lighting + Sky) + 6500K Monitor
Figures 9 and 10 show EML_200 0900-1300 in Denver
North for the 90 and 120 furniture layouts at 6500K sky
and lighting. Figure 5 shows both of these options are
nearly equal in overall performance but here one can see
the variation based on view to lights, windows and walls.
Fig.9 EML_200 0900-1300 (Denver, 90, N)
Fig.10 EML_200 0900-1300 (Denver, 120, N)
© 2018 ASHRAE (www.ashrae.org) and IBPSA-USA (www.ibpsa.us). For personal use only. Additional reproduction, distribution, or transmission in either print or digital form is not permitted without ASHRAE or IBPSA-USA's prior written permission.
145
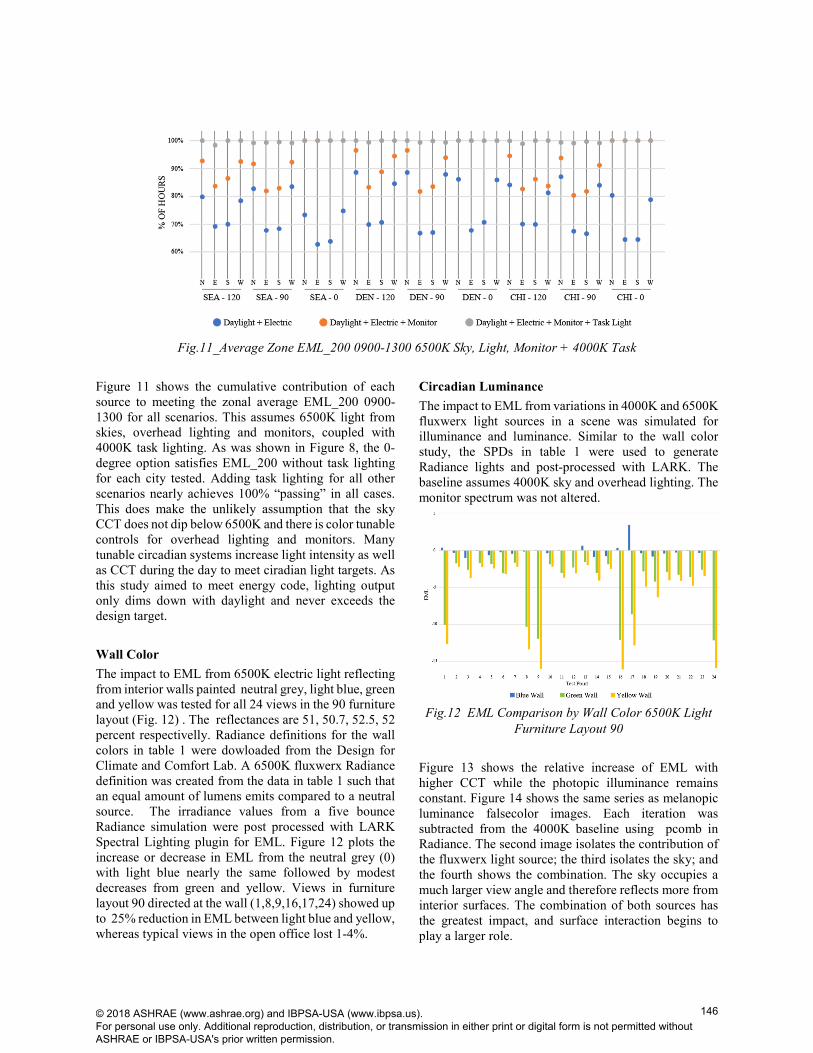
Fig.11_Average Zone EML_200 0900-1300 6500K Sky, Light, Monitor + 4000K Task
Figure 11 shows the cumulative contribution of each
source to meeting the zonal average EML_200 0900-
1300 for all scenarios. This assumes 6500K light from
skies, overhead lighting and monitors, coupled with
4000K task lighting. As was shown in Figure 8, the 0-
degree option satisfies EML_200 without task lighting
for each city tested. Adding task lighting for all other
scenarios nearly achieves 100% “passing” in all cases.
This does make the unlikely assumption that the sky
CCT does not dip below 6500K and there is color tunable
controls for overhead lighting and monitors. Many
tunable circadian systems increase light intensity as well
as CCT during the day to meet ciradian light targets. As
this study aimed to meet energy code, lighting output
only dims down with daylight and never exceeds the
design target.
Wall Color
The impact to EML from 6500K electric light reflecting
from interior walls painted neutral grey, light blue, green
and yellow was tested for all 24 views in the 90 furniture
layout (Fig. 12) . The reflectances are 51, 50.7, 52.5, 52
percent respectivelly. Radiance definitions for the wall
colors in table 1 were dowloaded from the Design for
Climate and Comfort Lab. A 6500K fluxwerx Radiance
definition was created from the data in table 1 such that
an equal amount of lumens emits compared to a neutral
source. The irradiance values from a five bounce
Radiance simulation were post processed with LARK
Spectral Lighting plugin for EML. Figure 12 plots the
increase or decrease in EML from the neutral grey (0)
with light blue nearly the same followed by modest
decreases from green and yellow. Views in furniture
layout 90 directed at the wall (1,8,9,16,17,24) showed up
to 25% reduction in EML between light blue and yellow,
whereas typical views in the open office lost 1-4%.
Circadian Luminance
The impact to EML from variations in 4000K and 6500K
fluxwerx light sources in a scene was simulated for
illuminance and luminance. Similar to the wall color
study, the SPDs in table 1 were used to generate
Radiance lights and post-processed with LARK. The
baseline assumes 4000K sky and overhead lighting. The
monitor spectrum was not altered.
Fig.12 EML Comparison by Wall Color 6500K Light
Furniture Layout 90
Figure 13 shows the relative increase of EML with
higher CCT while the photopic illuminance remains
constant. Figure 14 shows the same series as melanopic
luminance falsecolor images. Each iteration was
subtracted from the 4000K baseline using pcomb in
Radiance. The second image isolates the contribution of
the fluxwerx light source; the third isolates the sky; and
the fourth shows the combination. The sky occupies a
much larger view angle and therefore reflects more from
interior surfaces. The combination of both sources has
the greatest impact, and surface interaction begins to
play a larger role.
© 2018 ASHRAE (www.ashrae.org) and IBPSA-USA (www.ibpsa.us). For personal use only. Additional reproduction, distribution, or transmission in either print or digital form is not permitted without ASHRAE or IBPSA-USA's prior written permission.
146

Fig. 13 EML & Photopic Lux based on CCT:
Chicago, Jan 1, 10am, overcast, north zone, 0, seat 4
CONCLUSION
To achieve an annual EML_200 lighting design requires
evaluation of all occupant views, orientation, light
sources, a variation of source SPDs and the color and
reflectance of the surrounding environment. View to
light sources is the largest driver as was shown in layout
0, which inadvertently optimized desk orientation to
overhead lighting. Views to daylight can be significant if
there is proximity and the shades are up. Sunny climates
like Denver can expect shades down in the east and south
during the morning. Therefore, exterior daylight controls
are advised to reduce heat gain and glare without
deploying shading devices. Depending on brightness
and CCT, computer monitors can deliver 25% of
EML_200. It is likely that task lighting, which the
WELL Standard recognizes as a pathway to compliance,
will be required for many interior desk locations to
consistently reach EML_200. Task lights are bit of a
wildcard as they can deliver another 20% + but there is
no guarantee of timely and efficacious use for non-visual
requirements. Education, coupled with sensors that
measure and communicate circadian lighting data to
users, could be a solution.
It has been shown that there is a significant jump in EML
from higher CCT sources (4000K to 6500K), both
electric and daylight. One should not assume D65
daylight at an hourly resolution based on the dynamic
Fig. 14 Melanopic luminance based on CCT
effects of surrounding context, weather, and pollution.
The workflow presented allows the designer to post
process different assumptions for custom scenarios. As
for electric lighting, 3500K – 4100K is typically
specified in office design. However, the market is
responding with high CRI, tunable sources that achieve
6500K with no energy penalty. It has been shown that
energy can be saved with higher CCT sources by
reducing task light hours. Monitors controlled by
circadian color tuning software can close the gap further
with guaranteed brightness levels and 6500K CCT
during morning hours. Tunable task lighting would be
another option for challenged locations.
This study is an attempt to integrate annual daylight
analysis and point-in-time Radiance electric lighting
simulation with melanopic ratio post processing. Further
studies with multi-channel simulation evaluated the
impact of wall color. It is by no means exhaustive and
there are variations to explore to improve accounting of
spectral interaction in the interiors. Overall, the findings
point towards designs that maximize daylight, use high
CCT sources in the morning and carefully orient the field
of view to light sources. Where orientation is
challenging, understanding the lighting contribution
from monitors and task lights can prove to be highly
beneficial.
REFERENCES
Andersen M., Mardaljevic J., and Lockley SW. 2012. “A
framework for Predicting the Non-visual Effects of
Daylight – Part I: Photobiology based Model”,
Lighting Research and Technology, 44, 37-53.
Bellia L, Pedace A, Barbato G. 2014. “Daylighting
Offices: A First Step Toward an Analysis of
Photobiological Effects for Design Practice
Purposes”, Building and Environment 74 (2014) 54-
64
© 2018 ASHRAE (www.ashrae.org) and IBPSA-USA (www.ibpsa.us). For personal use only. Additional reproduction, distribution, or transmission in either print or digital form is not permitted without ASHRAE or IBPSA-USA's prior written permission.
147

Design for Climate and Comfort Lab, Lighting Materials
for Simulation. 2018. http://www.lighting-
materials.com/. Accessed May 2018.
Enezi, J, Revell V, Brown T, Wynne J, Schlangen L,
Lucas R. 2011. “A “Melanopic” Spectral Efficiency
Function Predicts the Sensitivity of Melanopsin
Photoreceptors to Polychromatic Lights”, Journal of
Biological Rhythms, 26(4), 314-323
Figueiro M.G., Brainard G.C., Lockley, S.W., Revell
V.L., and White R. 2008. Light and Human Health:
An Overview of the Impact of Optical Radiation on
Visual, Circadian, Neuroendocrine, and
Neurobehavioral Responses. Illuminating
Engineering Society Technical memorandum, IES
TM-18-08.
Finelite. 2018, Curve IES photometric files.
http://www.finelite.com/products/curve-overview/,
Accessed January 2018
Fluxwerx. 2018, Profile IES photometric files.
http://fluxwerx.com/products/profile/, Accessed
January 2018
Geisler-Moroder D. and Dur A. 2010. “Estimating
Melatonin Suppression and Photosynthesis Activity
in Real-World Scenes from Computer Generated
Images”, 5th European Conference in Graphics,
Imaging, and Vision and 12th International
Symposium on Multispectral Color Science,
Joensuu, Finland.
Hernandez-Andres J, Romero J, Nieves J. 2001. “Color
and Spectral Analysis of Daylight in Southern
Europe” Optical Society of America, 18(6)
Inanici M, Brennan M, and Clark E. 2015. "Multi-
spectral Lighting Simulations: Computing
Circadian Light," International Building
Performance Simulation Association (IBPSA) 2015
Conference, Hyderabad, India, December 7-9, 2015.
International WELL Building Institute. 2017. The
WELL Performance Verification Guidebook, Q2
2017. https://www.wellcertified.com/, Accessed
September 2017
International WELL Building Institute. 2018. Melanopic
Ratio.xls.http://standard.wellcertified.com/tables#
melanopicRatio, Accessed January 2018
Krzysztof W. 2006. “Calculation of Circadian
Illuminance Distribution with Radiance”, 5th
International Scientific Radiance Workshop,
Leicester, UK.
Lawrence Berkeley National Laboratory, International
Glazing Database. 2015.
https://windows.lbl.gov/materials/IGDB. Accessed
April 2015.
Lighting Research Center. 2018. “Circadian Stimulus
Calculator”.http://www.lrc.rpi.edu/programs/lightH
ealth/. Accessed January 2018
Lucas R, Peirson S, Berson D, Brown T, Cooper H,
Czeisler C, Figueiro M, Gamlin P, Lockley S,
O’Hagan J, Price L, Provencio I, Skene D, Brainard
G. 2014. “Irradiance Toolbox” .
http://lucasgroup.lab.manchester.ac.uk/research/me
asuringmelanopicilluminance/, Accessed January
2018.
Lockley S.W. 2009. “Circadian Rhythms: Influence of
Light in Humans”, Encyclopaedia of Neuroscience,
971-988.
Mardaljevic J., Andersen M., Roy N., and Christoffersen
J. 2013. “A framework for Predicting the Non-visual
Effects of Daylight – Part II: The Simulation
Model”, Lighting Research and Technology, 0, 1-
19.
Munsell Color Science Laboratory. 2002. Excel
Daylight Series Calculator. http://www.rit-
mcsl.org/UsefulData/DaylightSeries.xls , Accessed
January 2018
Pechacek C.S., Andersen M. and Lockley S.W. 2008.
“Preliminary Method for Prospective Analysis of
the Circadian Efficacy of (Day)Light with
Applications to Healthcase Architecture”, Leukos,
the Journal of the Illuminating Engineering Society,
5(1), 1-26.
Rea M, Figueiro M, Bullough J, Bierman A. 2005 “A
model of phototransduction by the human circadian
system” Brain Research Rev, 2005; 50(2):213-228
Reindl, D.T., Beckman W.A., 1990. “Diffuse Fractions
Correlations”, Solar Energy. 45(1), 1-7.
Seattle Department of Construction and Inspections.
2018. “2015 Seattle Energy Code”
https://www.seattle.gov/dpd/, Accessed January
2018
Ward G. 1994. The Radiance Lighting Simulation and
Rendering System. Proceedings of SIGGRAPH 94,
Computer Graphics Proceedings, Annual
Conference Series, 459-572.
© 2018 ASHRAE (www.ashrae.org) and IBPSA-USA (www.ibpsa.us). For personal use only. Additional reproduction, distribution, or transmission in either print or digital form is not permitted without ASHRAE or IBPSA-USA's prior written permission.
148