outagamie county sales tax analysis · sales tax analysis prepared by outagamie county financial...
TRANSCRIPT

OUTAGAMIE COUNTY SALES TAX ANALYSIS
PREPARED BY
Outagamie County Financial Services 4/11/2019
In December of 2018, a request was made by the Outagamie County Finance Committee
Chairperson to the Finance Department to complete an objective analysis of a possible
county‐wide half‐percent sales tax. This report is the product of that analysis and provides
information regarding the legal authority, background from comparable counties, various
uses’ advantages and disadvantages, revenue projections, various implementation options
and estimated impacts on Outagamie County taxpayers. The Outagamie County Corporation
Counsel and Outagamie County Development and Land Services Departments also assisted
with portions of this report.

1
TABLE OF CONTENTS
WHAT’S THE BOTTOM LINE? ‐ EXECUTIVE SUMMARY ................................................................................ 2
IS IT LEGAL? – STATUTORY AUTHORITY, LEGAL INTERPRETATIONS, PENDING BROWN CO. LAWSUIT ....... 4
WHAT DO OTHER COUNTIES DO? – COMPARABLE COUNTY’S USE OF SALES TAX REVENUE ..................... 7
PROS & CONS? – ADVANTAGES & DISADVANTAGES OF SALES TAX USE OPTIONS ..................................... 9
HOW MUCH REVENUE? – 2020 OUTAGAMIE COUNTY SALES TAX REVENUE PROJECTION ...................... 12
WHO WOULD PAY? – ESTIMATED COLLECTIONS FROM OUTSIDE OUTAGAMIE COUNTY ........................ 14
WHAT ARE THE OPTIONS? – FOUR APPROACHES FOR IMPLEMENTATION ……………………………………………..17
WHAT’S THE IMPACT? – COUNTY LEVY, AVERAGE HOMEOWNER & AVERAGE HOUSEHOLD IMPACTS …..21
HOW WOULD REVENUE SHARING WORK? – SHARED REVENUE METHODOLOGIES ……………………………….26
APPENDIX A – WISCONSIN ATTORNEY GENERAL’S 1998 OPINION ………………………………………………………….30
APPENDIX B – WISCONSIN COUNTIES ASSOCIATION AMICUS BRIEF ………………………………………………….....33
APPENDIX C – OUTAGAMIE COUNTY CORPORATION COUNSEL OPINION ……………………………………………….41
APPENDIX D – MUNICIPAL & SCHOOL DISTRICT ALLOCATION TABLES………………………………………..............42
APPENDIX E – MUNICIPAL DISTRIBUTION TABLE…………………………………………………………………………………….44
APPENDIX F – SCHOOL DISTRICT DISTRIBUTION TABLE ………………………………………………………………………….45

2
WHAT’S THE BOTTOM LINE?
EXECUTIVE SUMMARY
***********************
The first several pages of this analysis include a high level Executive Summary. The complete
report should be reviewed to gain an understanding of the assumptions, estimates, amounts
and options presented in the abbreviated Executive Summary. For example, four different
options of how sales tax revenue could be used by Outagamie County are included in the
analysis. The complete report must be read to understand both the short‐term impacts
(including the advantages and disadvantages of each), and the long‐term impacts as well.
ESTIMATED COUNTY SALES TAX REVENUE FOR 2020 $20 MILLION
ESTIMATED PERCENTAGE OF SALES TAX REVENUE COLLECTED FROM NON‐OUTAGAMIE COUNTY (OC) RESIDENTS/BUSINESSES 25%
Examples of additional 0.5% sales tax on common items:
Coffee of $2.00 would be $2.01 increase of a penny
Fish Fry of $10.00 would be $10.05 increase of a nickel
Clothing of $100.00 would be $100.50 increase of 50 cents
Flat Screen TV of $800.00 would be $804.00 increase of $4.00
Vehicle purchase of $25,000 would be $25,125 increase of $125.00

3
USE AND IMPACT OF SALES TAX REVENUE – FOUR OPTIONS
The tables below show the impact of implementing the sales tax under the four different options presented and the impact on an average Outagamie County household in the first year of possible implementation ‐ 2020 and projected in the 10th year following implementation – 2029 (as compared to the projections without the sales tax). OPTION 1 – ($20,000,000 = Use $7,000,000 Direct Reduction of Levy, Use $5,000,000 Direct Reduction of Debt Service Levy, Use $5,000,000 To pay for Capital Expenditures, Share 15% of total or $3,000,000 with Local Municipalities and School Districts) ESTIMATE OF ANNUAL DIRECT/INDIRECT OC TAXPAYER IMPACT
2020 2029
ESTIMATED AVERAGE OC PROPERTY TAX REDUCTION $134 $216
ESTIMATED AVERAGE OC HOUSEHOLD SALES TAX INCREASE (109) (130)
SUBTOTAL ESTIMATED AVERAGE OC HOUSEHOLD NET SAVINGS $25 $86
EST AVERAGE OC HOUSEHOLD MUNI/SD INDIRECT TAX BENEFIT 33 39
ESTIMATED AVERAGE OC HOUSEHOLD NET SAVINGS $58 $125
OPTION 2 – ($20,000,000 = Use $10,000,000 Direct Reduction of Levy, Use $5,000,000 Direct Reduction of Debt Service Levy, Use $5,000,000 to pay for Capital Expenditures) ESTIMATE OF ANNUAL DIRECT OC TAXPAYER IMPACT ONLY
2020 2029
ESTIMATED AVERAGE OC PROPERTY TAX REDUCTION $167 $259
ESTIMATED AVERAGE OC HOUSEHOLD SALES TAX INCREASE (109) (130)
ESTIMATED AVERAGE OC HOUSEHOLD NET SAVINGS $58 $129
OPTION 3 – ($20,000,000 = Use $15,000,000 Direct Reduction of Levy, Use $5,000,000 Direct Reduction of Debt Service Levy) ESTIMATE OF ANNUAL DIRECT OC TAXPAYER IMPACT ONLY
2020 2029
ESTIMATED AVERAGE OC PROPERTY TAX REDUCTION $222 $272
ESTIMATED AVERAGE OC HOUSEHOLD SALES TAX INCREASE (109) (130)
ESTIMATED AVERAGE OC HOUSEHOLD NET SAVINGS $113 $142
OPTION 4 – ($20,000,000 = Use $20,000,000 Direct Reduction of Levy) ESTIMATE OF ANNUAL DIRECT OC TAXPAYER IMPACT ONLY
2020 2029
ESTIMATED AVERAGE OC PROPERTY TAX REDUCTION $222 $273
ESTIMATED AVERAGE OC HOUSEHOLD SALES TAX INCREASE (109) (130)
ESTIMATED AVERAGE OC HOUSEHOLD NET SAVINGS $113 $143
IMPORTANT NOTE: All information presented is based on a January 1st, 2020 implementation date. If a later date was chosen, the revenue projection and household savings estimates would be reduced accordingly. This report is based upon the best information available at this time. Subsequent information obtained during the county budget process may impact final estimates.
4
IS IT LEGAL?
STATUTORY AUTHORITY, LEGAL INTERPRETATIONS,
PENDING BROWN COUNTY LAWSUIT
***********************
Wisconsin State Statute 77.70 allows Wisconsin counties the ability to impose a sales tax. The
statute is included below (emphasis added):
77.70 Adoption by county ordinance. Any county desiring to impose county sales and use taxes under
this subchapter may do so by the adoption of an ordinance, stating its purpose and referring to
this subchapter. The rate of the tax imposed under this section is 0.5 percent of the sales price
or purchase price. Except as provided in s. 66.0621 (3m), the county sales and use taxes may be
imposed only for the purpose of directly reducing the property tax levy and only in their entirety
as provided in this subchapter. That ordinance shall be effective on the first day of January, the
first day of April, the first day of July or the first day of October. A certified copy of that
ordinance shall be delivered to the secretary of revenue at least 120 days prior to its effective
date. The repeal of any such ordinance shall be effective on December 31. A certified copy of a
repeal ordinance shall be delivered to the secretary of revenue at least 120 days before the
effective date of the repeal. Except as provided under s. 77.60 (9), the department of revenue
may not issue any assessment nor act on any claim for a refund or any claim for an adjustment
under s. 77.585 after the end of the calendar year that is 4 years after the year in which the
county has enacted a repeal ordinance under this section.
In May of 1998, Ozaukee County requested an opinion from Wisconsin’s Attorney General on
the meaning of the term “directly reducing the property tax levy” as stated in State Statute
77.70. The Attorney General at that time, Jim Doyle, concluded the following: “I, therefore,
conclude that funds received from a county sales and use tax under section 77.70 may be
budgeted by the county board to reduce the amount of the countywide property tax levy or to
defray the cost of any budget item which can be funded by a countywide property tax”.
As noted later in this report, several counties use sales tax revenue for funding capital
projects/expenditures and referred to the portion of the Attorney General’s opinion that stated
an acceptable way to use the sales tax was to “defray the cost of any budget item which can be
funded by a countywide property tax”. If these counties did not use the sales tax revenue
(cash) to fund these projects, they would have to issue debt to fund them. In order to repay
the principal and interest on the debt, they would have to raise the tax levy – thus – they are
using the sales tax to essentially “defray” the cost of the debt service that would have to be
paid by property taxes. The full Attorney General’s opinion can be found in Appendix A.

5
Item of Note ‐ Pending Lawsuit on Use of Sales Tax Revenues – Brown County
There is currently a lawsuit pending from the Brown County Taxpayers’ Association regarding
Brown County’s implementation of the half‐cent sales tax. Brown County plans to use sales tax
revenue to pay for current and future capital projects. Brown County’s response to the lawsuit
has been that the tax levy would be going up to pay for these projects since the county would
have to issue debt and the debt would have to be repaid with an increase in the tax levy – thus
they are reducing what would be paid with property taxes in future budgets. The Taxpayers’
Association has stated that, according to the State Statute, the sales tax should be used to
“directly” reduce the current tax levy and not future levies. This lawsuit is still pending with
oral arguments scheduled for April 26, 2019. Brown County, as well as the other counties
noted later that use the sales tax for current and future capital projects/expenditures, have
relied on the Attorney General’s opinion referenced above as the basis for using the sales tax in
that manner. The Wisconsin Counties Association filed an Amicus Brief in the lawsuit, which
can be found in Appendix B.
Wisconsin State Statute 77.76(3) allows Wisconsin counties to share all or a portion of sales tax
revenue with underlying municipalities and school districts. The statute is included below
(emphasis added):
77.76(3) From the appropriation under s. 20.835 (4) (g) the department of revenue shall distribute
98.25 percent of the county taxes reported for each enacting county, minus the county portion
of the retailers' discounts, to the county and shall indicate the taxes reported by each taxpayer,
no later than 75 days following the last day of the calendar quarter in which such amounts were
reported. In this subsection, the “county portion of the retailers' discount" is the amount
determined by multiplying the total retailers' discount by a fraction the numerator of which is
the gross county sales and use taxes payable and the denominator of which is the sum of the
gross state and county sales and use taxes payable. The county taxes distributed shall be
increased or decreased to reflect subsequent refunds, audit adjustments, and all other
adjustments of the county taxes previously distributed. Interest paid on refunds of county sales
and use taxes shall be paid from the appropriation under s. 20.835 (4) (g) at the rate paid by this
state under s. 77.60 (1) (a). The county may retain the amount it receives or it may distribute
all or a portion of the amount it receives to the towns, villages, cities, and school districts in
the county. After receiving notice from the department of revenue, a county shall reimburse the
department for the amount by which any refunds, including interest, of the county's sales and
use taxes that the department pays or allows in a reporting period exceeds the amount of the
county's sales and use taxes otherwise payable to the county under this subsection for the same
or subsequent reporting period. Any county receiving a report under this subsection is subject to
the duties of confidentiality to which the department of revenue is subject under s. 77.61 (5)
and (6).

6
Outagamie County Corporation Counsel Joe Guidote was consulted on the legality of the
proposed use of sales tax revenues contained in this analysis. He has confirmed that the
various uses of sales tax revenues in all four options included in this report are consistent with
the guidelines established by the Attorney General’s opinion. In addition, he has concluded
that sharing sales tax revenue with municipalities and school districts is allowable under the
statutes. A copy of his opinion is included in Appendix C. Currently not included but will be
included upon receipt from Corporation Counsel.
7
WHAT DO OTHER COUNTIES DO?
COMPARABLE COUNTY’S USE OF SALES TAX REVENUE
***********************
As of January 2019, 66 of the 72 Wisconsin’s Counties have enacted the half‐percent county
sales tax. The six that haven’t include Manitowoc, Menominee, Outagamie, Racine, Waukesha
and Winnebago. The Manitowoc County Board is currently reviewing implementing the sales
tax. The last four counties to enact the sales tax were Calumet (effective April 2018), Brown
(effective January 2018), Kewaunee (effective April 2017) and Sheboygan (effective January
2017).
As part of this analysis, nine counties were contacted to determine how they use and account
for sales tax revenues. The counties surveyed included the four noted above who most
recently enacted the sales tax (Calumet, Brown, Kewaunee and Sheboygan) as well as five
similar‐sized counties (Marathon, La Crosse, Chippewa, Fond du Lac and Rock). These counties
indicated they use sales tax revenues in several different ways:
General county operational expenditures (levy reduction)
Capital projects/expenditures
Debt service payments
Share with local municipalities
A combination of all or some of the above
Specifically, here is the feedback from the counties contacted:
Calumet (enacted 2018) – Uses sales tax revenue to pay for capital
projects/expenditures instead of borrowing (which essentially reduces future years’
levies) or to reduce debt service levy. Excess collections above the budgeted amount go
towards paying for the next year’s capital budget.
Kewaunee (enacted 2017) – Uses sales tax revenue as a general fund revenue to reduce
overall property taxes (basically, the revenue was used to replace the Utility Aid portion
of the State Shared Revenues that was lost when the Kewaunee Nuclear Facility was
closed). Excess collections above the budgeted amount go back into the general fund
balance.
Brown (enacted 2018) ‐ Uses sales tax revenue to pay for specific capital expenditures
instead of borrowing (which essentially reduces future years’ levies). Excess collections
above budgeted amount go towards paying for the next year’s capital budget or future
capital projects. Sunsets after 6 years since it was enacted for specific
projects/expenditures.

8
Sheboygan (enacted 2017) – Uses sales tax revenue to pay for capital expenditures
(must be transportation related) instead of borrowing (which essentially reduces future
years’ levies) as well as sharing $1.5 million (approximately 16%) with local
municipalities on an equalized value basis. Entered into Intergovernmental Agreements
(IGA’s) with their local governments for this share. Excess collections above budgeted
amount go towards paying for the next year’s capital budget.
Marathon (enacted 1987) – Uses sales tax revenue to directly reduce the overall general
property tax levy. Excess collections above the budgeted amount go towards paying for
the next year’s capital budget.
La Crosse (enacted 1990) – Uses sales tax revenue to directly reduce the overall general
property tax levy. Excess collections above the budgeted amount go towards paying for
the next year’s capital budget.
Chippewa (enacted 1991) – Uses approximately $1.5 million of sales tax revenue to
directly reduce the overall general property tax levy and uses approximately $1.7 million
for debt service. Amounts over the $1.5 million and $1.7 million amounts
(approximately $2.8 million in 2019), go towards capital projects. Excess collections
above budgeted amount go towards paying for the next year’s capital budget or future
years’ projects.
Rock (enacted 2007) – Uses $7.5 million of sales tax revenue to directly reduce the
overall general property tax levy. (Decision made many years ago and the county keeps
the reduction at that level.) Amounts over the $7.5 million (approximately $6 million in
2019), go towards capital projects. Excess collections above that year’s capital projects
budget go towards paying for the next year’s capital budget.
Fond du Lac (enacted 2010) – Uses sales tax revenue for economic development
activity, specifically related to retaining major manufacturer Mercury Marine in the
community. Included a sunset provision that the County Board rescinded March of
2019. The county has yet to decide how they specifically will use the sales tax.
However, the County Board also voted to recommend sharing revenue (a flat
$1,000,000 or approximately 12.5%) with municipalities beginning in 2022.
Although a statewide survey of all 66 Wisconsin counties with the county sales tax was
not conducted, this sample represents a fair cross‐section of counties and how they use
sales tax revenues. Other counties not surveyed may take different approaches.

9
PROS & CONS?
ADVANTAGES & DISADVANTAGES OF SALES TAX USE OPTIONS
***********************
As noted previously, counties are using sales tax revenues to fund expenditures in different
ways. They are summarized below as follows:
1) Reduce overall tax levy only. 2) Reduce overall tax levy by budgeted amount and use remaining amounts above
budget to pay for current or future capital projects.
3) Pay for specific capital projects/expenditures and use remaining amounts above
budget to pay for other current or future capital projects.
4) Share with local municipalities and school districts – (Sheboygan County was the first
county to share a portion of their sales tax revenue according to press reports.
Although the statutes state that the sales tax revenues may be shared with local
municipalities and school districts, Sheboygan currently only shares with local
municipalities. They also require that it be used specifically for transportation‐
related expenditures. Fond du Lac County voted in March 2019 to recommend
sharing sales tax revenue with municipalities in 2022.)
Noted below are advantages and disadvantages of each of the four use options.
1) Reduce overall tax levy only. a. Advantage – Direct and immediate reduction for all taxpayers on
property tax bill – mainly a one‐time reduction and the tax bill would
remain at this lower level into the future.
b. Disadvantage – Allows for little flexibility in dealing with capital
projects and will most likely have to fund any current and future
capital projects with debt. These debt payments would raise the levy
in future years’ budgets. Reduction on tax bills is mainly one‐time.
Once the tax levy is lowered for operations, the ability to increase the
levy for net new construction in the Tax Levy Limit Calculation is
reduced due to the fact that the tax levy (at its reduced level) is a
factor in the levy limit calculation.
2) Reduce overall tax levy by budgeted amount and use remaining amounts above
budget to pay for one‐time capital projects.
a. Advantage – Direct and immediate reduction for all taxpayers on
property tax bill – mainly a one‐time reduction and the tax bill would
remain at this lower level into the future. Will also reduce future

10
budgets’ debt service levies due to funding some capital projects with
excess sales tax collections above budget instead of bonding.
b. Disadvantage – Allows for little flexibility in dealing with capital
projects and most likely results in funding future capital
projects/expenditures with debt. These debt payments will raise the
levy in future years’ budgets. Once the tax levy is lowered for
operations, the ability to increase the levy for net new construction in
the Tax Levy Limit Calculation is reduced due to the fact that the tax
levy (at its reduced level) is a factor in the levy limit calculation.
3) Pay for one‐time capital projects/expenditures and use remaining amounts above
budget to pay for future one‐time capital projects.
a. Advantage – Will reduce future budgets’ debt service levies due to
funding some capital projects with current sales tax collections as well
as future capital projects by using the excess collections above budget
instead of bonding. Will have an impact on mainly future years’
property tax bills by not having to repay debt service – both principal
and interest. If sales tax declines, a county can still issue debt for
projects and repay debt service by increasing the debt service levy
(which is an exception in the tax levy limit formula).
b. Disadvantage – Limited direct and immediate impact on lowering
average property tax bill. Taxpayer savings are realized in future
years, rather than immediately upon implementation.
4) Share with local municipalities and school districts.
a. Advantage – Would assist other local municipalities and school
districts in funding their expenditures for local direct
transportation/infrastructure or other needs as determined by the
county or their governing entity. Those contributing to the sales tax
are not only utilizing the county highway system but local roads and
infrastructure and other municipal or school district services as well.
Greater support from local municipalities and school districts if they
receive a portion of the sales tax. Should/could reduce municipal or
school district property taxes, either current year or in future years.
Would have an indirect impact on Outagamie County taxpayers who
also pay municipal and school district taxes.
b. Disadvantage – The portion shared with local municipalities and
school districts would not be able to be used directly by the county to
offset the county levy or assist in funding other county expenditures.

11
Other Considerations
Once fully implemented, a decline in the sales tax revenues due to an overall local, regional or
national economic downturn and/or a reduction in local or regional retail sales will impact all of
the options noted above. The greater the flexibility a county has to deal with any economic
downturn, the better.
Once the tax levy is lowered for operations, the ability to increase the levy for net new
construction in the Tax Levy Limit calculation is reduced due to the fact that the tax levy (at its
reduced level) is a factor in the levy limit calculation. The reduction will vary depending on how
the county uses the sales tax in its budgets. However, based on recent years, sales tax
collection growth year over year for various counties (and included in this report’s revenue
projections at a 3% increase) has increased greater than the net new construction increase
allowed under the Tax Levy Limit calculations (ranging from 1.5% to 2% over the past several
years).

12
HOW MUCH WOULD BE COLLECTED?
2020 OUTAGAMIE COUNTY SALES TAX REVENUE PROJECTION
***********************
In order to estimate the county sales tax revenue that could be generated in 2020, a report
completed by the UW‐Extension Local Government Center entitled “Sales Tax Forecasting for
Wisconsin Counties” was used. That report, completed in 2011, estimated the “2012 County
Sales Tax Yield Potential” for the 10 counties that did not have the sales tax at that time. Based
on this report, 2012 was used as the base year for this estimate. This was essentially the same
method used by Calumet, Sheboygan and Kewaunee counties to estimate their first year’s sales
tax revenues. They have all stated the UW‐Extension report’s 2012 estimates were a very good
basis for estimating their sales tax collections. Each county used the 2012 estimate as a base
year and then increased the projection by a certain percentage annually through their target
implementation date. (NOTE – Brown County used the actual .5% sales tax collected by the
Brown County Stadium District in 2015 and calculated increases from that point. That sales tax
was enacted to support improvements at Lambeau Field.)
The actual annual increase of the nine comparable counties (Eau Claire, Fond du Lac, Kenosha,
La Crosse, Marathon, Portage, Rock, Ozaukee and Washington) was calculated using 2012 as
the base year. The average annual increase was 4.9%. To be conservative, this analysis used a
3% annual growth from the 2012 base year to estimate 2020 sales tax revenue for Outagamie
County.
Once that estimate was calculated based on the 2012 base and increased 3% per year, that
gross amount was reduced by approximately 10% for the following reasons:
IMPLEMENTATION LAG ‐ There is a time lag following implementation for some
businesses to change their systems to collect the adjusted sales tax amount and
remit it to the state as well as potential non‐compliance.
ECONOMIC UNCERTAINTY ‐ Perhaps more importantly, this reduction accounts
for the possibility of a significant economic downturn, such as the “Great
Recession”. The average sales tax collections of eight of the nine counties noted
above dropped an average of 5% from 2007 to 2010 due to the 2008 recession.
(For Rock County, 2008 was used as the base year since they first implemented
the sales tax in 2007 and 2009 was used for La Crosse collections since that was
less than their 2010 collections. Fond du Lac was not included as they
implemented the sales tax in 2010).

13
RETAIL TRENDS ‐ This reduced estimate also recognizes the impact online sales is
having on more traditional bricks and mortar retail sales. The area has had
several closures of major brick and mortar stores in the past several years. While
the implementation of on‐line sales tax collections is increasing, it is important to
account for this retail trend.
The 10% reduction in projected sales tax revenue is a conservative and prudent measure to
take at this time. Adjustments would be made in subsequent years based on actual collections,
retail trends, economic growth and other factors.
Based upon this methodology, Outagamie County would collect an estimated
$20 million in sales tax revenue in 2020, if implemented on January 1st. (Per WI
State Statutes, implementation of a county sales tax can only take effect on the
following dates: January 1st, April 1st, July 1st or October 1st).
Several other methods of estimating sales tax revenues were reviewed to determine if this
projection is sound. A second method of projecting sales tax revenues in 2020 utilized a study
completed by the Wisconsin Taxpayers Alliance. That study estimated Outagamie County’s
sales tax collections for 2015, which was then increased by 3% annually. This methodology
resulted in a 2020 estimate of $20.6 million.
Finally, a per capita sales tax amount was calculated using Brown County’s 2019 budgeted sales
tax revenue amount of $29 million divided by their population of 260,616. This per capita sales
tax amount was then applied to Outagamie County’s population of 184,541 and increased by
3% to arrive at a 2020 sales tax revenue estimate of $21.2 million. Other comparable counties
were evaluated using this same per capita methodology which validated this approach.
Both of these methods appeared to confirm the sales tax revenue estimate of $20 million used
in this analysis is reasonable.

14
WHO WOULD PAY?
ESTIMATED COLLECTIONS FROM OUTSIDE OUTAGAMIE COUNTY
***********************
Visitors are heavy users of the Outagamie County transportation network and impact other
county services such as public safety and recreation. Implementing a county sales tax would
essentially collect a user fee from these visitors to help support the costs of building and
maintaining the highways, roads, bridges and other services necessary for visitors to take
advantage of all of the shopping, services, events and amenities Outagamie County has to offer.
Outagamie County residents pay this extra 0.5% sales tax anytime they purchase taxable items
in any of the other 66 counties that have enacted the county sales tax, including neighboring
counties like Brown, Calumet and Waupaca.
Several different sources were contacted to obtain direct out‐of‐county resident spending data,
including the Wisconsin Department of Revenue, Wisconsin Department of Administration,
Wisconsin Department of Tourism and Fox Cities Convention and Visitors Bureau. Some useful
data was provided, but no precise data could be obtained. None of the other counties surveyed
had any projections completed regarding out‐of‐county spending data. Therefore, what follows
is Outagamie County’s independent analysis that provides a reasonable basis for estimating the
proportional share of sales tax revenue.
The data evaluated was from the 2017 Consumer Expenditure Survey conducted by the U.S.
Department of Labor’s Bureau of Labor Statistics. Two different tables were utilized:
Average Annual Expenditures – Table 1800: Midwest Region
Average Annual Expenditures – Table 2400: Urban County (100,000 – 249,999)
Categories of spending subject to sales tax were tabulated, discounting several specific
categories based on the type of expenditure. For example, natural gas and electricity were
discounted 50% because they are exempt from sales tax in the winter (November – April). In
addition, the vehicle rental category was discounted 80% given the majority of car rentals occur
away from home. Other categories were reduced conservatively to account for the fact that
the Fox Cities metro spans three counties yet functions as one urban area, resulting in some
routine expenses like food, beverages and apparel occurring in neighboring counties.
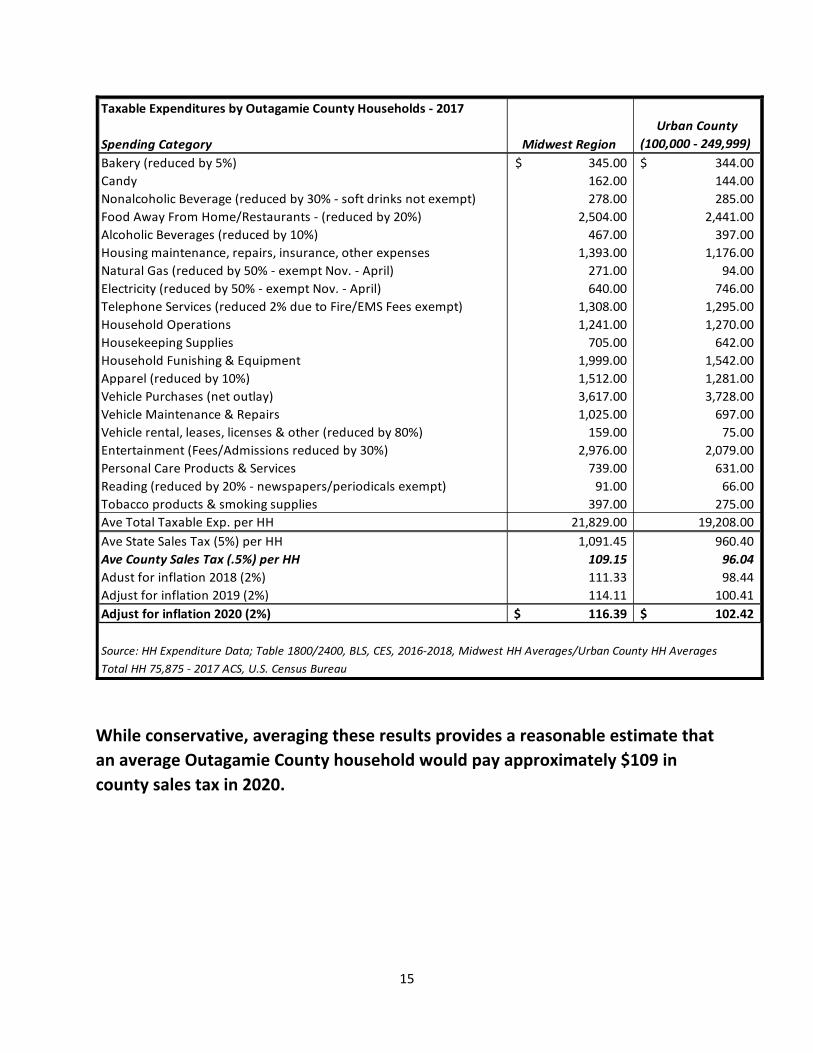
As the table below demonstrates, an average Outagamie County household is
estimated to incur $102 in county sales tax using the Urban County table and
$116 in county sales tax using the Midwest Region table in 2020.
15
Taxable Expenditures by Outagamie County Households ‐ 2017
Spending Category Midwest Region
Urban County
(100,000 ‐ 249,999)
Bakery (reduced by 5%) 345.00$ 344.00$
Candy 162.00 144.00
Nonalcoholic Beverage (reduced by 30% ‐ soft drinks not exempt) 278.00 285.00
Food Away From Home/Restaurants ‐ (reduced by 20%) 2,504.00 2,441.00
Alcoholic Beverages (reduced by 10%) 467.00 397.00
Housing maintenance, repairs, insurance, other expenses 1,393.00 1,176.00
Natural Gas (reduced by 50% ‐ exempt Nov. ‐ April) 271.00 94.00
Electricity (reduced by 50% ‐ exempt Nov. ‐ April) 640.00 746.00
Telephone Services (reduced 2% due to Fire/EMS Fees exempt) 1,308.00 1,295.00
Household Operations 1,241.00 1,270.00
Housekeeping Supplies 705.00 642.00
Household Funishing & Equipment 1,999.00 1,542.00
Apparel (reduced by 10%) 1,512.00 1,281.00
Vehicle Purchases (net outlay) 3,617.00 3,728.00
Vehicle Maintenance & Repairs 1,025.00 697.00
Vehicle rental, leases, licenses & other (reduced by 80%) 159.00 75.00
Entertainment (Fees/Admissions reduced by 30%) 2,976.00 2,079.00
Personal Care Products & Services 739.00 631.00
Reading (reduced by 20% ‐ newspapers/periodicals exempt) 91.00 66.00
Tobacco products & smoking supplies 397.00 275.00
Ave Total Taxable Exp. per HH 21,829.00 19,208.00
Ave State Sales Tax (5%) per HH 1,091.45 960.40
Ave County Sales Tax (.5%) per HH 109.15 96.04
Adust for inflation 2018 (2%) 111.33 98.44
Adjust for inflation 2019 (2%) 114.11 100.41
Adjust for inflation 2020 (2%) 116.39$ 102.42$
Source: HH Expenditure Data; Table 1800/2400, BLS, CES, 2016‐2018, Midwest HH Averages/Urban County HH Averages
Total HH 75,875 ‐ 2017 ACS, U.S. Census Bureau
While conservative, averaging these results provides a reasonable estimate that
an average Outagamie County household would pay approximately $109 in
county sales tax in 2020.

16
To estimate the percentage of sales taxes paid by non‐Outagamie County consumers and
businesses, the total estimated sales tax revenues of $20 million was divided by the .5% county
sales tax to equal total taxable sales of $4 billion. This $4 billion was then divided between
business sales and consumer sales. This was based on a 2018 Council on State Taxation study,
which indicated that 42% of sales tax revenues are generated by business sales while 58% are
generated by consumer sales in Wisconsin.
Business (42% of Total Taxable Sales): The business portion was divided between Outagamie County business sales (80%) and outside business sales (20%) based on a reasonable estimate. This calculation results in the outside business sales portion totaling 8.4% of total taxable sales.
Consumer (58% of Total Taxable Sales): The consumer portion is comprised of three components; Visitor (assume from outside of Outagamie County), Outagamie County consumer/residents and outside (local, non‐Outagamie) consumer.
Visitor: Based on WI Department of Tourism data, direct visitor spending (with visitor defined as someone staying overnight) is estimated to account for 9.2% of total taxable sales.
Outagamie County Consumer: Based on the estimate that the average Outagamie County household would pay $109 in county sales tax, the Outagamie County consumer portion was then calculated to be 41.4% of total taxable sales.
Outside (non‐Outagamie) Consumer: The Visitor and Outagamie County Consumer totals were subtracted from the total consumer taxable sales to arrive at an estimate for the outside consumer category of 7.4% of total taxable sales.
Adding the outside business, visitor and outside consumer categories of 8.4%,
9.2% and 7.4% respectively, results in a reasonable estimate that 25% of county
sales taxes would be incurred by non‐Outagamie County consumers and
businesses.

17
WHAT ARE THE OPTIONS?
FOUR APPROACHES FOR IMPLEMENTATION
***********************
As noted previously, there are a variety of options available to the county to use and account
for sales tax revenues. Options include all or some of the following:
A) DIRECT LEVY REDUCTION ‐ OPERATIONS – Revenues could be used to directly reduce the current overall property tax levy by paying for a portion of general
county operational expenditures. This would be an immediate reduction to the
overall property tax levy.
B) DIRECT LEVY REDUCTION – DEBT SERVICE – Revenues could be used to pay for all or a portion of the county’s current general government debt service levy. This would
not include the county’s enterprise funds (Airport, Brewster Village, Solid Waste or
Single Stream Recycling) as these funds would still be responsible for repaying their
own debt service. An immediate reduction of approximately $5 million to the
overall tax levy is estimated if the county paid for all of the estimated 2020 debt
service using sales tax revenue.
C) PAYING FOR CAPITAL PROJECTS (REDUCE BORROWING) – Revenues could be used
to pay for all or a portion of general government capital projects that would
normally be funded by taking out debt. The tax levy savings are generated by not
having to repay the principal and interest on the debt service issues over the next 7
to 15 years. [7 to 15 years is the typical time frame we have repaid our general
government debt, or an average close to 10 years.] The county budgets
approximately $5 million of general government capital projects using debt annually.
[$5 million dollars was computed by averaging the annual amount of debt we have
issued in the past 5 years as well as projected for the 2019 budget for a total of 6
years. This amount does not include the approximate $18 to $20 million dollars of
debt issued for downtown facility expansion and renovation project currently under
way. There are no major plans for any general government projects of this size or
magnitude in the foreseeable future.] These amounts would generally not include
any enterprise fund capital projects as those would typically be funded by their
respective fund’s operations. Based on these projections, in the 10th year of
implementation, county taxpayers are projected to save approximately $1,200,000
or more in debt service interest payments annually if the county fully funded
general government capital projects with sales tax revenues.
18
D) SHARING WITH LOCAL MUNICIPALITIES AND SCHOOL DISTRICTS – Revenues could
be shared with local municipalities and school districts that they could apply towards
capital projects (transportation infrastructure, equipment, school safety/security
enhancements, etc.), debt service payments or direct levy reduction. This is allowed
under Wisconsin State Statute 77.76(3).
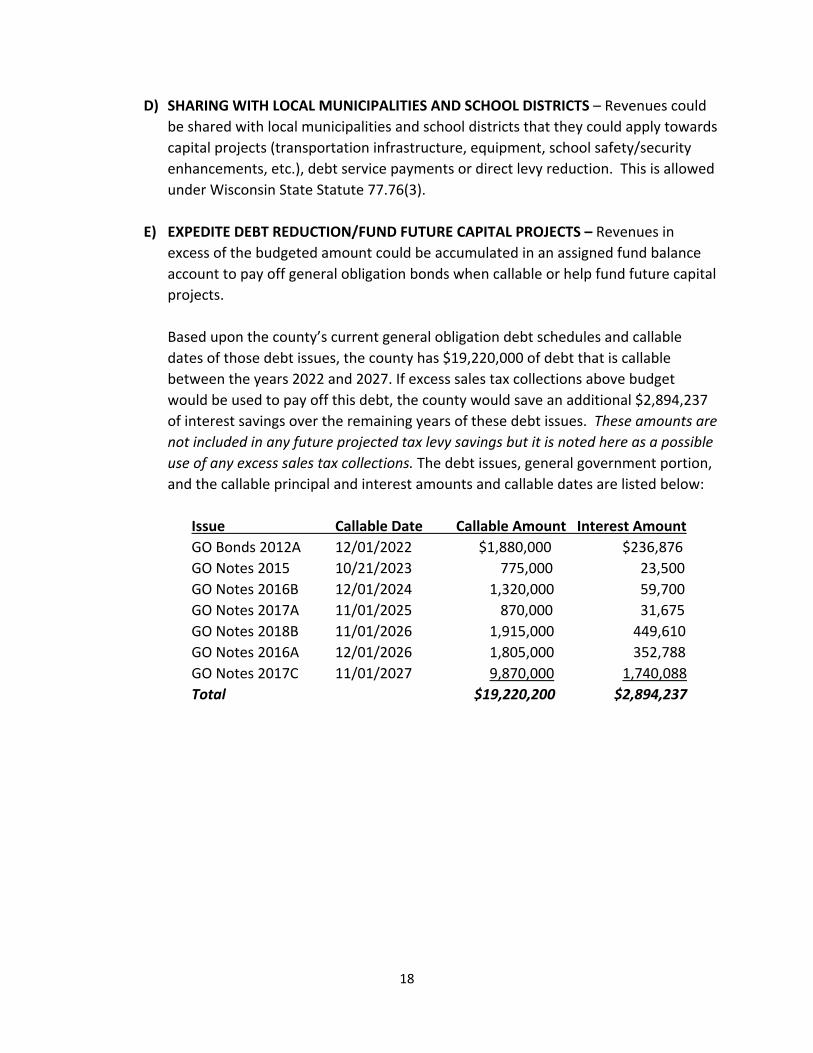
E) EXPEDITE DEBT REDUCTION/FUND FUTURE CAPITAL PROJECTS – Revenues in excess of the budgeted amount could be accumulated in an assigned fund balance
account to pay off general obligation bonds when callable or help fund future capital
projects.
Based upon the county’s current general obligation debt schedules and callable
dates of those debt issues, the county has $19,220,000 of debt that is callable
between the years 2022 and 2027. If excess sales tax collections above budget
would be used to pay off this debt, the county would save an additional $2,894,237
of interest savings over the remaining years of these debt issues. These amounts are
not included in any future projected tax levy savings but it is noted here as a possible
use of any excess sales tax collections. The debt issues, general government portion,
and the callable principal and interest amounts and callable dates are listed below:
Issue Callable Date Callable Amount Interest Amount
GO Bonds 2012A 12/01/2022 $1,880,000 $236,876
GO Notes 2015 10/21/2023 775,000 23,500
GO Notes 2016B 12/01/2024 1,320,000 59,700
GO Notes 2017A 11/01/2025 870,000 31,675
GO Notes 2018B 11/01/2026 1,915,000 449,610
GO Notes 2016A 12/01/2026 1,805,000 352,788
GO Notes 2017C 11/01/2027 9,870,000 1,740,088
Total $19,220,200 $2,894,237

19
FOUR POSSIBLE OPTIONS of how Outagamie could use its sales tax collection revenues are
detailed below. These four options consist of a combination of the various implementation
options noted previously.
OPTION 1 ‐ A) Pays for current debt service levy, B) Pays for direct property tax levy reduction
for operations, C) Pays for capital projects instead of borrowing, and D) Shares with local
municipalities and school districts.
This proposed use of the county’s sales tax revenue is summarized in the following table:
Item Approximate Amounts
A) Direct Reduction of Current Tax Levy for Debt Service $5,000,000
B) Direct Reduction of Current Tax Levy for General Operations 7,000,000
Subtotal Direct Reduction of Current Tax Levy $12,000,000
C) Cash Payments for Capital Projects/Expenditures 5,000,000
D) Share with Local Municipalities and School Districts 3,000,000
Total $20,000,000
NOTE: It is important to note that the average county property tax reduction calculated later in
this analysis only takes into account the county property tax reduction resulting from the
$12,000,000 direct levy reduction above. In addition to this direct and immediate savings,
taxpayers may also see their local property tax bills reduced due to the municipal/school district
sharing component and future county property tax savings due to the reduction of bonding and
associated debt service costs.
OPTION 2 ‐ A) Pays for current debt service levy, B) Pays for direct property tax levy reduction
for operations, and C) Pays for capital projects instead of borrowing (No revenue sharing).
This proposed use of the county’s sales tax revenue is summarized in the following table:
Item Approximate Amounts
A) Direct Reduction of Current Tax Levy for Debt Service $5,000,000
B) Direct Reduction of Current Tax Levy for General Operations 10,000,000
Subtotal Direct Reduction of Current Tax Levy $15,000,000
C) Cash Payments for Capital Projects/Expenditures 5,000,000
Total $20,000,000
NOTE: It is important to note that the average county property tax reduction calculated later in
this analysis only takes into account the county property tax reduction resulting from the
$15,000,000 direct levy reduction above. In addition to this direct and immediate savings,
taxpayers would also see their future local property tax bills reduced due to future county
property tax savings resulting from the reduction of bonding and associated debt service costs.

20
OPTION 3 ‐ A) Pays for current debt service levy, and B) Pays for direct reduction of tax levy for
operations (No payments for capital projects or revenue sharing).
This proposed use of the county’s sales tax revenue is summarized in the following table:
Item Approximate Amounts
A) Direct Reduction of Current Tax Levy for Debt Service $5,000,000
B) Direct Reduction of Current Tax Levy for General Operations
15,000,000
Total $20,000,000
NOTE: It is important to note that the average county property tax reduction calculated later in
this analysis only takes into account the county property tax reduction resulting from the
$20,000,000 direct levy reduction above. However, taxpayers would see an increase in their
future local property tax bills resulting from the increase in bonding and associated debt service
costs.
OPTION 4 ‐ A) Pays for direct reduction of tax levy for operations (No payments for capital
projects, revenue sharing or current debt service levy).
This proposed use of the county’s sales tax revenue is summarized in the following table:
Item Approximate Amounts
A) Direct Reduction of Current Tax Levy for General Operations
$20,000,000
Total $20,000,000
NOTE: It is important to note that the average county property tax reduction calculated later in
this analysis only takes into account the county property tax reduction resulting from the
$20,000,000 direct levy reduction above. However, taxpayers would see an increase in their
future local property tax bills resulting from the increase in bonding and associated debt service
costs.
What would happen if sales tax revenue estimates do not meet the projection calculated
previously and how would that impact the county budget?
The county would have to either utilize levy funding for debt service obligations, take out
debt to finance capital expenditures or some combination of both. Based on the current
Tax Levy Limit formula, the county would be able to increase the tax levy to pay for these
types of obligations. The county would not be able to increase the tax levy for operations
above the net new construction increase allowed without a separate county referendum.

21
WHAT’S THE IMPACT?
COUNTY LEVY, AVERAGE HOMEOWNER & AVERAGE HOUSEHOLD IMPACTS
***********************
Based on the assumptions of using the Outagamie County sales tax revenue as proposed in the
four options above, noted in the table below is the Impact on the County Tax Levy, Tax Rate
and Average Property Owner. In addition, the impact of the sales tax on the Average Household
and the net difference between the property tax reduction and sales tax increase is provided.
Please note this is a very high level projection as the county has not started development of a
much more detailed 2020 budget projection and some things could change between this
analysis and assumptions made, and the actual 2020 budget. It is also very important to note
the following tax levy assumptions used in this analysis:
No major changes in State Aids or other general government revenue sources.
No major changes to the current tax levy limit law.
No major changes in any tax levy funded county department's expenditures.
The increase in Net New Construction is similar to the 2019 and 2018 budgets (2.0%).
The economic increase in overall equalized valuation and specifically, for residential property is similar to the 2019 and 2018 budgets (4.0% and 3.0% respectively).
There are no other state law changes that would impact or shift the property tax from one area to another area such as from residential to commercial or vice versa.
The lawsuit against Brown County does not prevail.
Without the sales tax, the county would increase the current 2019 levy by
approximately $1.5 million. This is estimated to be the net new construction allowed
increase of approximately $1.3/$1.4 million as well as using most of the current
available levy capacity remaining of $100,000 to $200,000.

22
Year 2020 Projection:
Item Projected 2020
WITHOUT SALES TAX
Projected 2020
WITH SALES TAX –
OPTION 1
Projected 2020
WITH SALES TAX –
OPTION 2
Projected 2020
WITH SALES TAX –
OPTION 3
Projected 2020
WITH SALES TAX –
OPTION 4
Tax Levy $73,864,240 $61,659,934 $58,659,934 $53,659,088 $53,659,934
Tax Rate $4.680 $3.906 $3.716 $3.400 $3.400
Average Property Owner Share
$809.78 $675.98 $643.09 $588.28 $588.28
Average Property Owner Change
‐ ‐$133.80 ‐$166.69 ‐$221.50 ‐$221.50
Average Household Sales Tax Change
‐ +$109.00 +$109.00 +$109.00 +$109.00
Average Household Net Change
‐ ‐$24.80 ‐$57.69 ‐$112.50 ‐$112.50
Average Household Percent Change
‐ ‐3.1% ‐7.2% ‐13.9% ‐13.9%
Without the sales tax, the increase to the average property tax owner in 2020 would be $9.25
when compared to the prior year (2019 average property owner share is $800.53). With the
sales tax, in all four options, Outagamie County taxpayers would see an overall savings. The
savings as a result of implementing the sales tax vs. not implementing would be $133.80 for
2020. For Option 2, the difference is $166.69, Option 3 difference is $221.50 and Option 4
difference is also $221.50. These amounts exclude the average household sales tax increase
estimated at $109.00 as noted above.
As previously stated, it is important to continually note that the options vary in the short term
vs. longer term due to financing capital projects with cash versus bonding. The gap narrows
over time for the reasons noted on the next page and as shown on the ten year graphical
presentation on page 24.
23
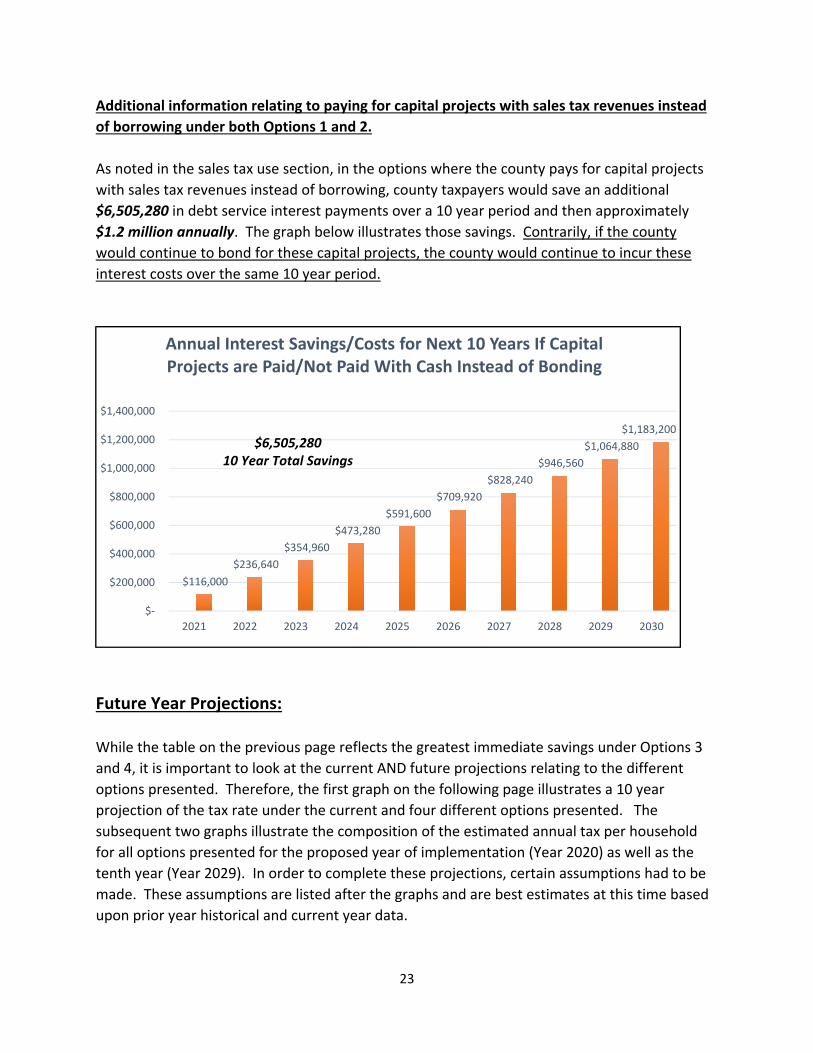
Additional information relating to paying for capital projects with sales tax revenues instead
of borrowing under both Options 1 and 2.
As noted in the sales tax use section, in the options where the county pays for capital projects
with sales tax revenues instead of borrowing, county taxpayers would save an additional
$6,505,280 in debt service interest payments over a 10 year period and then approximately
$1.2 million annually. The graph below illustrates those savings. Contrarily, if the county
would continue to bond for these capital projects, the county would continue to incur these
interest costs over the same 10 year period.
Future Year Projections:
While the table on the previous page reflects the greatest immediate savings under Options 3
and 4, it is important to look at the current AND future projections relating to the different
options presented. Therefore, the first graph on the following page illustrates a 10 year
projection of the tax rate under the current and four different options presented. The
subsequent two graphs illustrate the composition of the estimated annual tax per household
for all options presented for the proposed year of implementation (Year 2020) as well as the
tenth year (Year 2029). In order to complete these projections, certain assumptions had to be
made. These assumptions are listed after the graphs and are best estimates at this time based
upon prior year historical and current year data.
$116,000
$236,640
$354,960
$473,280
$591,600
$709,920
$828,240
$946,560
$1,064,880
$1,183,200
$‐
$200,000
$400,000
$600,000
$800,000
$1,000,000
$1,200,000
$1,400,000
2021 2022 2023 2024 2025 2026 2027 2028 2029 2030
Annual Interest Savings/Costs for Next 10 Years If Capital Projects are Paid/Not Paid With Cash Instead of Bonding
$6,505,28010 Year Total Savings

24
2.000
2.500
3.000
3.500
4.000
4.500
5.000
2020 2021 2022 2023 2024 2025 2026 2027 2028 2029
Tax Rate per $1,000
10‐Year Projected Tax Rate Comparison:Current Vs 4 Options Presented
Current Option 1 Option 2 Option 3 Option 4

25
Assumptions Used in All 5 Analyses (Current plus 4 Options)
Net New Construction: 2% annual increase.
Equalized Value: 4% annual increase (base value 1/1/18 ‐ $15,176,940,000).
Home Values: 3% annual increase (base year value 1/1/18 ‐ $168,001).
Consumer Price Index (CPI): 2% annual increase.
The operations portion of the tax levy would increase by the net new construction
(approximately 2%).
Additional Assumption Used in Options 1, 2 & 3 (Not applicable in Current and Option 4)
$5,000,000 used for payment of annual debt obligation (P&I); if annual obligation is less
than $5 million, the balance is used to reduce operations levy (property taxes).
Additional Assumption Used in Options 1, 2, 3 & 4 (Not applicable in Current projection)
The sales tax revenues would increase at a 3% factor. For the sales tax applied to direct
reduction of the levy, 50% of the increase would be used to reduce the operations
portion of the levy and 50% would be used for increased operations costs.
Additional Assumption Used in Current and Options 3 & 4 (Not applicable in Options 1 & 2)
New debt of $5 million issued annually for capital projects, interest rate 4% with 10‐year
repayment term.
One‐time Property Tax Reduction for General Operations:
Option 1: $7,000,000 direct levy reduction ‐ (balance of $13,000,000 is used for
$5,000,000 debt repayment; $5,000,000 new capital projects; $3,000,000 sharing with
Municipalities/School Districts).
Option 2: $10,000,000 direct levy reduction ‐ (balance of $10,000,000 is used for
$5,000,000 debt repayment; $5,000,000 new capital projects).
Option 3: $15,000,000 direct levy reduction ‐ (balance of $5,000,000 is used for debt
repayment).
Option 4: $20,000,000 direct levy reduction.

26
HOW WOULD REVENUE SHARING WORK?
SHARED REVENUE METHODOLOGIES
***********************
As noted above, Option 1 includes sharing a portion of sales tax revenue with local
municipalities and school districts. While there are a variety of ways in which this could be
structured, an option follows which could be further refined through additional conversations
between County Administration, the County Board and Corporation Counsel.
The first step in the methodology is A) How to share the distribution between the municipalities
and school district entities. The second step is B) How to distribute the funding between the
two subsets (B1 – municipalities and B2 – school districts). While we have included some
methodology of allocating funding to municipalities and school districts in this proposal, there
are other considerations that would have to be taken into account with this approach. We
have included some of those in C) Additional considerations for shared revenue approach.
These steps are further described below.
A) Allocating the Funding Between Local Municipalities and Local School Districts
The first step in the process is to allocate funding between the local municipalities and
school districts. This allocation was completed by considering each municipality/school
district as one unit of government. If a municipality or school district is located in more
than one county, the share of equalized value located within the county versus that
individual unit of government’s overall equalized value was used. For example, if 75% of a
municipality/school district’s equalized value is within the county, that municipality/school
district would be considered as a 0.75 unit. Based upon this analysis and a total of
$3,000,000 to be distributed to municipalities and school districts, 80% of the allocation
would be made to local municipalities ($2,400,000) and 20% would be made to local school
districts ($600,000). See tables in Appendix D for details.
B) Sharing the Funding between the two subsets – B1 Local Municipalities and B2 School
Districts
B1 – Local Municipalities – This example uses the following three‐pronged methodology to
distribute the estimated $2,400,000 million in sales tax to the local municipalities within the
county: 1) Equalized value at 33.33%, 2) Population at 33.33%, 3) Lane miles at 33.34%.
1) EQUALIZED VALUE ‐ 33.33% to be allocated based upon Equalized Value (including TIFs). Equalized value is the current method used to calculate the county’s tax rate.
[Note ‐ While the current tax rate calculation for the county share excludes the TIF
27
valuations, we have used the gross equalized valuation since this more accurately
reflects the overall equalized value of the municipalities within the county.] This is
consistent with the current approach to allocating tax increases (or decreases) to all
local units of government. The equalized values are obtainable from the Wisconsin
Department of Revenue and the values used would be the same values the county
uses for its budget and tax levy apportionments. This approach also recognizes that
the municipalities generating much of the sales tax revenue have a majority of the
equalized value in the county. [Note ‐ Sheboygan County uses only equalized value
for allocating 100% of their local municipality amounts.]
2) POPULATION ‐ 33.33% to be allocated based upon population. This portion would be based on the premise that the entire population within the county would be
paying county sales tax. Therefore, residents in each municipality would benefit
from the county contribution back to the local municipalities. The numbers used
would be based on the latest Wisconsin Department of Administration’s
Demographics Service Centers’ estimates.
3) LANE MILES ‐ 33.34% would be based on the number of lane miles within each
jurisdiction (and only within Outagamie County’s borders). The entire county’s
infrastructure needs to be well maintained and improved in order to support
economic growth and development. Due to tax levy limits and the lack of state aid
increases over the past 15 years, local governments have not been able to maintain
or improve their transportation infrastructure. This additional source of revenue
would provide resources to municipalities to do so. The number of lane miles each
local municipality is responsible for is available from the Wisconsin Department of
Transportation on an annual basis.
This balanced, three‐pronged approach would reasonably and equitably distribute the
sales tax back to the local municipalities based on the allocated share of the county’s
levy (equalized value), those that have paid it (population based) and those that need it
to fund transportation or other infrastructure or related expenditures (lane miles). The
estimated allocations for each local municipality based on this methodology are noted
in Appendix E.
B2 – Local School Districts ‐ We have used the following two‐pronged methodology to
distribute the estimated $600,000 in sales tax to the local school districts within the county:
1) Equalized value at 50% and 2) Enrollment at 50%.
1) EQUALIZED VALUE ‐ 50% to be allocated based on Equalized Value (Including TIFs). Equalized Value is the current method used to calculate county’s tax rate. [While the
current tax rate calculation for the county share excludes the TIF valuations, we have

28
used the gross equalized valuation since this more accurately reflects the overall
equalized value for them within the county.] This portion would maintain the
current approach to allocating tax increases (or decreases) to all local units of
government. The equalized values are obtainable from the Wisconsin Department
of Revenue and the values used would be the same values the county uses for its
budget and tax levy apportionments.
2) STUDENT ENROLLMENT ‐ 50% to be allocated based upon school enrollment. This
ensures that local school districts with higher student counts would receive a slightly
higher portion of the school districts’ allocation. The numbers used would be based
on the latest Wisconsin Department of Public Instruction enrollment data or on
other reasonable allocation methods if enrollment data by county is not readily
obtainable.
This balanced, two‐pronged approach would reasonably and equitably distribute the
sales tax back to the local school districts based on the allocated share of the county’s
levy (equalized value) and student enrollment. The estimated allocations for each local
school district based on this methodology are noted in Appendix F.
C) Additional Considerations for Shared Revenue Approach
This section of the analysis would need further deliberation by and between County
Administration, the County Board, County Corporation Counsel and the participating
municipalities/school districts as the following questions would have to be answered. Please
note that these questions are not meant to be all inclusive as there may be other items that
come to light during future discussions.
a. First and foremost, the County Board would have to approve of sharing the
county sales tax revenue.
b. If the County Board chooses to share sales tax revenues, how much of the
county sales tax would be allocated or shared with local municipalities/school
districts? Note: Option 1 in this analysis uses a 15% share.
c. How would the county be assured the shared revenues are being used in
accordance with the intended purpose and in accordance with the state
statutes? Would annual certifications be required from municipalities and
school districts that would attest that the shared revenue is being utilized in
conformance with Outagamie County Corporation Counsel’s legal opinion?

29
d. Would the County require Intergovernmental Agreements with the
municipalities and school districts?
e. Would the shared revenue be a fixed amount annually or percentage of total
sales tax revenue generated?
f. Would the shared revenue calculations be based on prior year information or
current year estimates (such as equalized value amounts, populations, lane miles
or enrollment data)?
g. What would happen if a municipality or school district chooses not to
participate, or fails to adhere to the annual certifications, or doesn’t meet the
requirements of the use of the sales tax? If required, how does the county
monitor compliance?
Additional Historical Note – In 2001, the County Executive at that time, Robert “Toby” Paltzer,
proposed the sales tax for the 2002 budget. The sales tax was voted down at that time by the
County Board.
This concludes the Outagamie County Sales Tax Analysis Report. The following pages include
various Appendices used to support information used in this analysis.

30
APPENDIX A
WISCONSIN ATTORNEY GENERAL’S 1998 OPINION ON COUNTY SALES TAX
***********************

31

32
33
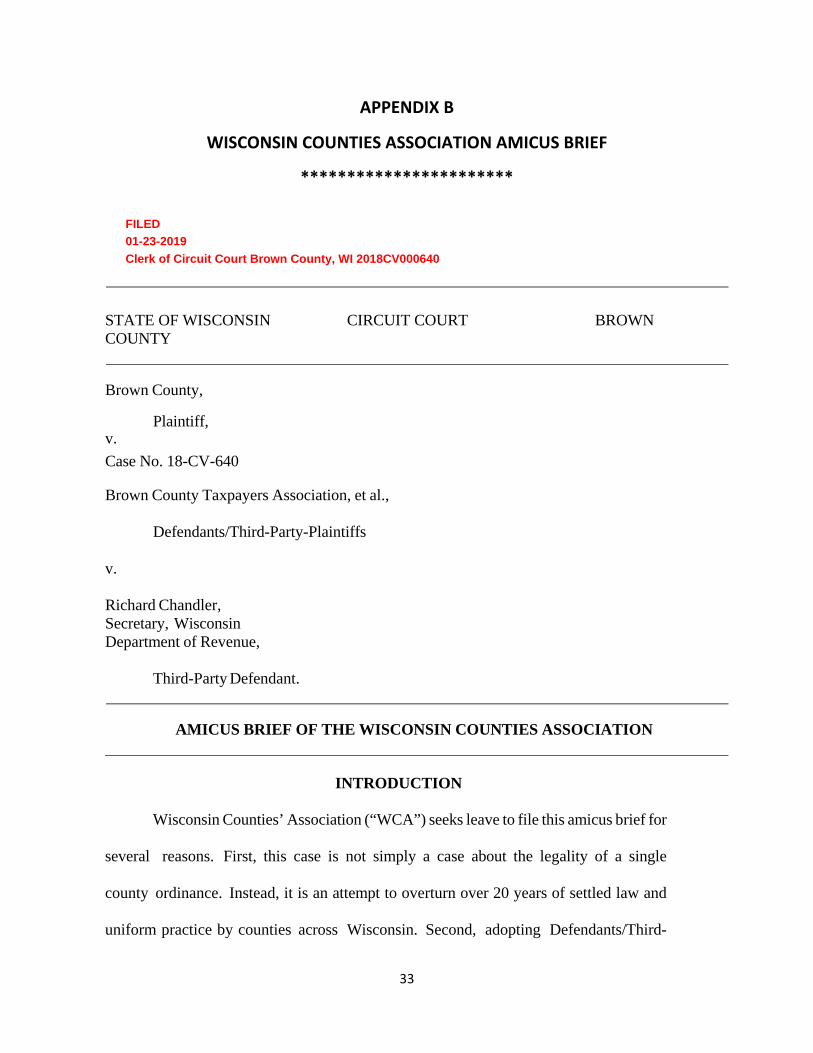
APPENDIX B
WISCONSIN COUNTIES ASSOCIATION AMICUS BRIEF
***********************
FILED
01-23-2019
Clerk of Circuit Court Brown County, WI 2018CV000640
STATE OF WISCONSIN CIRCUIT COURT BROWN COUNTY
Brown County,
Plaintiff, v.
Case No. 18-CV-640
Brown County Taxpayers Association, et al.,
Defendants/Third-Party-Plaintiffs
v.
Richard Chandler, Secretary, Wisconsin Department of Revenue,
Third-Party Defendant.
AMICUS BRIEF OF THE WISCONSIN COUNTIES ASSOCIATION
INTRODUCTION
Wisconsin Counties’ Association (“WCA”) seeks leave to file this amicus brief for
several reasons. First, this case is not simply a case about the legality of a single
county ordinance. Instead, it is an attempt to overturn over 20 years of settled law and
uniform practice by counties across Wisconsin. Second, adopting Defendants/Third-

34
Party Plaintiffs’ (together “BCTPA”) unique and unfounded construction of Wis. Stat.
§ 77.70 would fundamentally change county budget and financial practices and
procedures. Finally, and contrary to BCTPA’s claim that the sales and use tax is just
another mechanism to tax county residents, the sales and use tax provides the very tax
relief contemplated by Wis. Stat. § 77.70. Accordingly, the WCA asks this Court to
consider the information provided below as it decides the parties’ cross motions for
summary judgement.
I. This Court Should Adhere To The Plain Language of Wis. Stat. § 77.70 And The Attorney General’s Opinion Which Has Guided Counties’ Actions For Over Twenty Years.
As noted in the Parties’ opening briefs, the Attorney General issued a formal
Opinion interpreting Wis. Stat. § 77.70 in 1998 - over twenty years ago. The Attorney General
interpreted the plain language of the statute and correctly concluded that a county sales and use
tax “directly reduce[s] the property tax levy …” (section 77.70) if the “funds received from a
county sales and use tax [are] budgeted to reduce the amount of the countywide property tax
levy or to defray the cost of any budget item which can be funded by a property tax levy.”
1998 Wis. Att’y Gen. 2, 2. This reading of Wis. Stat. § 77.70 comports with its plain meaning.
Contrary to BCTPA’s arguments, nothing in the actual language of the statute requires a county
to set its budget and levy and then conduct a dollar-for-dollar reduction of the property tax
levy based upon sales and use tax proceeds, presumably with estimates of the next year’s
collections or the actual receipts from the prior year.
Under BCTPA’s approach, a county would be required to set its levy for a year based
on estimated sales and use tax revenues and then hope that the budget would be met by the end of
that fiscal year. If the estimated sales and use tax revenues are not met, then the county’s budget

35
would not be met. To make matters worse, a county’s levy limit would then be artificially low
because Wis. Stat. § 66.0602 establishes the prior year’s levy as the baseline for the levy limit
calculation. This is an absurd result and one that would provide none of the supposed taxpayer
protections BCTPA claims its interpretation would yield. The Attorney General’s Opinion
avoids this absurdity in favor of a rational reading that the only limitation on sales and use tax
revenues is that revenues be allocated to budget items that could otherwise be funded by the
property tax levy. The Opinion is faithful to both the language of the statute and the realities of
county budgeting.
BCTPA next claims that the enactment of levy limits in 2006 now renders the Attorney
Opinion moot. BCTPA has it exactly backwards. In 2005, the legislature enacted Wis. Stat.
§ 66.0602. That statute has placed a limit on the annual increase of a county’s operating levy.
A county’s debt levy is exempt from levy limits. Wis. Stat. § 66.0602. That statute has been
amended over 20 times since its enactment. In most instances, the amendments alter what types
of expenditures are exempt from the levy limits. See 2005 Wis. Acts. 25 & 484; 2007 Wis. Acts
20, 115 & 129; 2009 Wis. Act 28; 2011 Wis. Acts 32, 63, 75, 140, 145 & 258; 2013 Wis. Act
20;
2013 Wis. Act 165; 2013 Wis. Acts 222 & 310; 2015 Wis. Acts 55, 191 & 256; 2017 Wis. Acts
59, 207, 223, 243, 317 & 365.
For the majority of the amendments, the Legislature has considered how the levy is to
be calculated, whether it should be capped, and what expenditures should be excluded from the
cap. If the Legislature thought the Attorney General’s Opinion was incorrect, it would have
taken corrective action. But it did not. In light of this reality, this Court should refrain from
adopting BCTPA’s new interpretation of Wis. Stat. § 77.70.

36
Judicial restraint is also what the law requires. In Schill v. Wisconsin Rapids School
District, 2010 WI 86, 327 Wis. 2d 572, 786 N.W.2d 177, the Wisconsin Supreme Court opined
that the lack of legislative action to correct an Attorney General’s interpretation of a statute coupled
with other legislative activity on the same subject means that a court is to “regard [the opinion]
as presumptively correct.” Id. at ¶126, see also ¶ 125 (noting that inaction on the specific
question coupled with other legislative action “shows that the legislature has “contemplated
the specific problem at hand” and “acquiesce[ed] in the attorney general’s long-standing opinion
…”).
The policy undergirding the doctrine of stare decisis also supports judicial restraint here. As the Wisconsin Supreme Court has made clear,
One of the fundamental justifications for the rule of stare decisis is to provide a consistent predictable rule of law upon which society ... may properly order its affairs, i.e., engage in rational business decision-making, without the continuous, ominous threat of the legal bases for those decisions being changed.
Progressive Northern Insurance Company v. Romanshek, 2005 WI 67, ¶ 44, 281 Wis.2d 300,
697 N.W.2d 417; see also Khan v. State Oil Co., 93 F.3d 1358, 1367 (7th Cir. 1996)
(Ripple, J., concurring) (“[W]e ought to ensure, through strict application of the doctrine of stare
decisis and precedent, that the law is sufficiently predictable and certain to permit businesses
to order their affairs with a clear understanding of what the law requires.”)
Sixty-six county governments across this State have organized their affairs (e.g. setting tax
levies, approving capital projects, setting mill rates for real property, issuing bonds, incurring debt,
etc.) around the well-reasoned opinion of the Attorney General. A change to the interplay between
the levy and the sales tax would be catastrophic and would create uncharted territory for county
budgeting.

37
Indeed, since the year 2000 (just 2 years after the Attorney General issued its opinion),
fifteen counties have enacted a sales and use tax ordinance. Not a single county had a
corresponding dollar-for-dollar reduction in their levy to account for the sales tax revenue. See
Affidavit of Knapp, Exs. A & B. Altering the longstanding interpretation of Wis. Stat. ¶ 77.70
would upend the settled law and introduce uncertainty to the most important county function
– budget setting.
II. A Change in the Law Would Be Catastrophic To County Budgeting Across Wisconsin.
As noted above, every county that has enacted a sales and use tax since 2000
has implemented it in conformity with the Attorney General’s Opinion – by budgeting funds
received from a county sales and use tax to reduce the amount of the countywide property tax
levy or to defray the cost of any budget item which can be funded by a property tax levy.
The sales and use tax has been a significant source of revenue for the counties to reduce
reliance on the property tax levy. For instance, in 2017 Milwaukee County generated over
$74,000,000 of revenue from its sales and use tax - an amount equal to 25% of its levy. See
Affidavit of Knapp, Exs. A & B. Dane County generated over $57,000,000 – an amount equal
to 30% of its levy. Id. A dollar-for-dollar reduction in the levies would force counties to
choose between cutting essential services or forgoing necessary capital improvement projects.
And, it is not just the larger counties that would be significantly impacted. In 2017, Pepin
County (with a population of just 7,469 people) generated $535,543 from its sales and use
tax. That figure represents 12.8% of its levy for the same year. Id. A dollar-for-dollar reduction
of the levies based on sales and tax use revenue would be catastrophic.

38
This is where BCTPA’s hypothetical breaks down. The counties are not wayward
children, mired in debt who are jetting off to Europe on Daddy’s money. The reality is much
different. The counties are governmental entities comprised of duly-elected representatives,
regulated by Wisconsin law, charged with ensuring their citizens are safe, well protected, have
county resources at hand, and opportunities for economic growth. This Court should not adopt
an unprecedented reading of Wis. Stat. § 77.70 that forces the Counties to choose between these
important priorities.
III. A Sales and Use Tax Ordinance Under Wis. Stat. § 77.70 Provides Tax Relief to County Residents.
BCTPA misunderstands how sales and use taxes actually generate revenue. A consistent
theme in their brief is that the sales and use taxes are just another way for counties to tax their
residents. This is an incomplete and incorrect view of sales and use taxes. Because sales and
use taxes apply to goods and services, and not real estate, they generate revenue from non-
residents who shop, eat, vacation, enjoy various entertainment venues or stop for gas in a county.
In other words, a sales and use tax spreads the tax burden to all of the people that use the
infrastructure that the tax supports. As the tax base is broadened to include non-residents, county
property taxpayers receive tax relief.
In 2017, dollars spent by non-residents (“Direct Visitor Spending” in the terminology
of the tourism industry) accounted for $12.7 billion dollars of spending in the 72 counties.
See Affidavit of Knapp, Ex. D. In turn, this spending generated $1.5 billion dollars in state and
local taxes, a portion of which was county sales and use taxes. Id. In fact, by some estimates
tourists or visitors spend 58.3% of their dollars on items (food and beverage, lodging,

39
entertainment and general retail) that are subject to Wisconsin sales and use taxes. Affidavit of
Olson, Ex A.
The impact of this visitor spending yields significant savings to the counties’ residents. For
instance, Florence County experienced $5.7 million in Direct Visitor Spending in 2017. Florence
County adopted a sales and use tax in 2006. While, this new revenue source did not lead to
a dollar-for-dollar reduction in the total county property tax levy, it did reduce the tax burden
on Florence County taxpayers. In 2006, Florence County’s Mill Rate was $7.02/$1,000.
However, the Mill Rate immediately dropped to $6.27 the next year and $5.98 the following
year. Indeed, the Florence County Mill Rate has not exceeded $6.871 in any year since the
adoption of the sales and use tax. See Affidavit of Knapp, Exs. C & D.
This trend is not uncommon. Green County saw a similar reduction in its Mill Rate after
the adoption of a sales and use tax in 2003. Within 3 years, the Mill Rate had dropped by $0.98
and it remained below the 2003 level for seven years. Id. Trempealeau County also saw an
immediate reduction in the Mill Rate following the adoption of a sales and use tax in 2010. The
County’s Mill Rate stayed below the 2010 rate for 6 years. Id.
All of these examples serve as evidence that sales and use taxes necessarily provide
tax relief to county property owners by broadening the tax base to include non-residents.
Moreover, it is quite common for these new tax dollars to have a direct downward impact on the
mill rate. The decrease in the mill rate yields immediate and tangible tax savings to county
residents.
1 Indeed, $6.87 is the peak Mill Rate since the adoption of the sales and use tax. In no other year since the 2006 adoption of the sales and use tax has the Florence County Mill Rate exceeded $6.64 and it averaged $6.40 in the years following the adoption of the sales and use tax. This represents real tax savings to Florence County residents.

40
CONCLUSION
The law has been settled. Wisconsin counties have ordered their budgets and capital
projects in reliance on Wis. Stat. § 77.70 and the Attorney General’s Opinion. A change brought
about by litigation, as opposed to legislation, would be devastating to the counties and their
residents. BCTPA has proffered a novel interpretation of Wis. Stat. § 77.70, that is unknown
to the statute’s history. It is directly at odds with the Attorney General’s Opinion - an opinion
the Legislature has left undisturbed for 20 years despite almost constant legislative activity
on the subject of county tax levies. Any change in the operation of Wis. Stat. § 77.70 should
come from the Legislature, not a single trial court reviewing a case that is ostensibly a challenge
to a single ordinance adopted by a single county. The potential impacts on public funding,
public services and public policy across Wisconsin warrant restraint in this case.
Dated this 23rd day of January, 2019.
MICHAEL BEST & FRIEDRICH LLP
By: Electronically signed by Joseph L. Olson Joseph L. Olson, SBN 1046162 [email protected] 100 East Wisconsin Avenue, Suite 3300 Milwaukee, WI 53202-4124 Phone: (414) 271-6560 Fax: (414) 277-0656
Attorney for Wisconsin Counties Association

41
APPENDIX C
OUTAGAMIE COUNTY CORPORATION COUNSEL’S OPINION
To be inserted here

42
APPENDIX D
MUNICIPAL & SCHOOL DISTRICT ALLOCATION TABLES
***********************
BLACK CREEK 102,821,000$ 102,821,000$ 1.00
BOVINA 101,956,800 101,956,800 1.00
BUCHANAN 684,363,800 684,363,800 1.00
CENTER 378,915,000 378,915,000 1.00
CICERO 90,794,800 90,794,800 1.00
DALE 267,681,600 267,681,600 1.00
DEER CREEK 44,403,400 44,403,400 1.00
ELLINGTON 276,129,900 276,129,900 1.00
FREEDOM 533,827,200 533,827,200 1.00
GRAND CHUTE 2,657,993,100 2,657,993,100 1.00
GREENVILLE 1,323,094,600 1,323,094,600 1.00
HORTONIA 122,906,900 122,906,900 1.00
KAUKAUNA 140,412,400 140,412,400 1.00
LIBERTY 72,791,800 72,791,800 1.00
MAINE 75,697,100 75,697,100 1.00
MAPLE CREEK 46,737,000 46,737,000 1.00
ONEIDA 216,087,800 216,087,800 1.00
OSBORN 98,654,400 98,654,400 1.00
SEYMOUR 103,983,100 103,983,100 1.00
VANDENBROEK 172,130,300 172,130,300 1.00
BEAR CREEK 16,788,500 16,788,500 1.00
BLACK CREEK 69,657,000 69,657,000 1.00
COMBINED LOCKS 297,130,800 297,130,800 1.00
HORTONVILLE 199,760,600 199,760,600 1.00
HOWARD 1,809,530,400 25,000 0.00
KIMBERLY 524,142,700 524,142,700 1.00
LITTLE CHUTE 878,465,300 878,465,300 1.00
NICHOLS 9,157,000 9,157,000 1.00
SHIOCTON 41,281,400 41,281,400 1.00
WRIGHTSTOWN 254,760,200 43,542,300 0.17
APPLETON 5,443,435,200 4,586,364,300 0.84
KAUKAUNA 1,088,410,700 1,088,364,100 1.00
NEW LONDON 388,138,900 124,884,900 0.32
SEYMOUR 210,167,300 210,167,300 1.00
TOTALS 18,742,208,000$ 15,601,113,200$ 31.34
*WI Dept of Revenue ‐ 2018 Statement of Changes in Equalized Values
TOWNS
VILLAGES
CITIES
MUNICIPALITY
*TOTAL EQUALIZED
VALUE
*OC EQUALIZED
VALUE UNIT SHARE

43
SCHOOL DISTRICT
*TOTAL EQUALIZED
VALUE
*OC EQUALIZED
VALUE UNIT SHARE
APPLETON 8,129,465,172$ 7,137,207,575$ 0.88
KIMBERLY 2,156,682,752 1,257,653,218 0.58
KAUKAUNA 2,393,293,273 1,814,423,363 0.76
LITTLE CHUTE 549,592,535 549,592,535 1.00
HORTONVILLE 2,202,756,864 2,202,756,864 1.00
SEYMOUR 823,012,881 804,836,610 0.98
FREEDOM 925,383,873 925,383,873 1.00
SHIOCTON 336,846,131 336,846,131 1.00
CLINTONVILLE 651,189,274 66,666,495 0.10
NEW LONDON 1,126,138,908 354,557,852 0.31
WEST DEPERE 2,265,512,409 41,611,601 0.02
WRIGHTSTOWN 719,987,676 109,111,540 0.15
PULASKI 1,815,504,581 453,011 0.00
MENASHA 1,406,322,239 12,532 0.00
TOTALS 25,501,688,568$ 15,601,113,200$ 7.78
* WI Dept of Education ‐ The number of students enrolled on the 3rd Friday of Sept.
*****
County Distribution
MUNICIPAL UNITS 31.34 80% $2,400,000.00
SCHOOL DIST UNITS 7.78 20% $600,000.00
TOTALS 39.12 100% $3,000,000.00
MUNICIPAL & SCHOOL DISTRICT ALLOCATION TABLE:

44
APPENDIX E
MUNICIPAL DISTRIBUTION TABLE
***********************
Estimate of Potential Distributions to Local Government Municipalities
$2,400,000 allocated by: 33.33% Equalized Value, 33.33% Population, 33.34% Lane Miles
EQUALIZED
VALUE POPULATION LANE MILES TOTAL
MUNICIPALITY SHARE SHARE SHARE SHARE
BLACK CREEK 5,272$ 5,400$ 23,168$ 33,840$
BOVINA 5,232 5,024 18,248 28,504
BUCHANAN 35,096 30,208 24,880 90,184
CENTER 19,432 15,448 34,632 69,512
CICERO 4,656 4,824 26,024 35,504
DALE 13,728 12,360 24,992 51,080
DEER CREEK 2,280 2,808 17,840 22,928
ELLINGTON 14,160 13,000 31,416 58,576
FREEDOM 27,376 26,256 34,608 88,240
GRAND CHUTE 136,296 98,408 68,328 303,032
GREENVILLE 67,848 51,088 56,960 175,896
HORTONIA 6,304 4,736 10,864 21,904
KAUKAUNA 7,200 5,616 19,480 32,296
LIBERTY 3,736 3,800 12,584 20,120
MAINE 3,880 3,824 16,464 24,168
MAPLE CREEK 2,400 2,616 11,880 16,896
ONEIDA 11,080 20,504 43,176 74,760
OSBORN 5,056 5,240 15,032 25,328
SEYMOUR 5,336 5,152 20,808 31,296
VANDENBROEK 8,824 6,824 11,312 26,960
BEAR CREEK 864 1,920 2,096 4,880
BLACK CREEK 3,568 5,672 3,912 13,152
COMBINED LOCKS 15,240 15,280 9,264 39,784
HORTONVILLE 10,240 11,896 7,840 29,976
HOWARD ‐ ‐ ‐ ‐
KIMBERLY 26,880 28,984 17,632 73,496
LITTLE CHUTE 45,048 48,208 27,320 120,576
NICHOLS 472 1,176 1,840 3,488
SHIOCTON 2,120 4,024 2,832 8,976
WRIGHTSTOWN 2,232 864 1,408 4,504
APPLETON 235,160 266,896 142,920 644,976
KAUKAUNA 55,808 69,592 41,624 167,024
NEW LONDON 6,400 7,424 7,544 21,368
SEYMOUR 10,776 14,928 11,072 36,776
TOTALS 800,000$ 800,000$ 800,000$ 2,400,000$
33.33% 33.33% 33.34% 100.00%
CITIES
VILLAGES
TOWNS
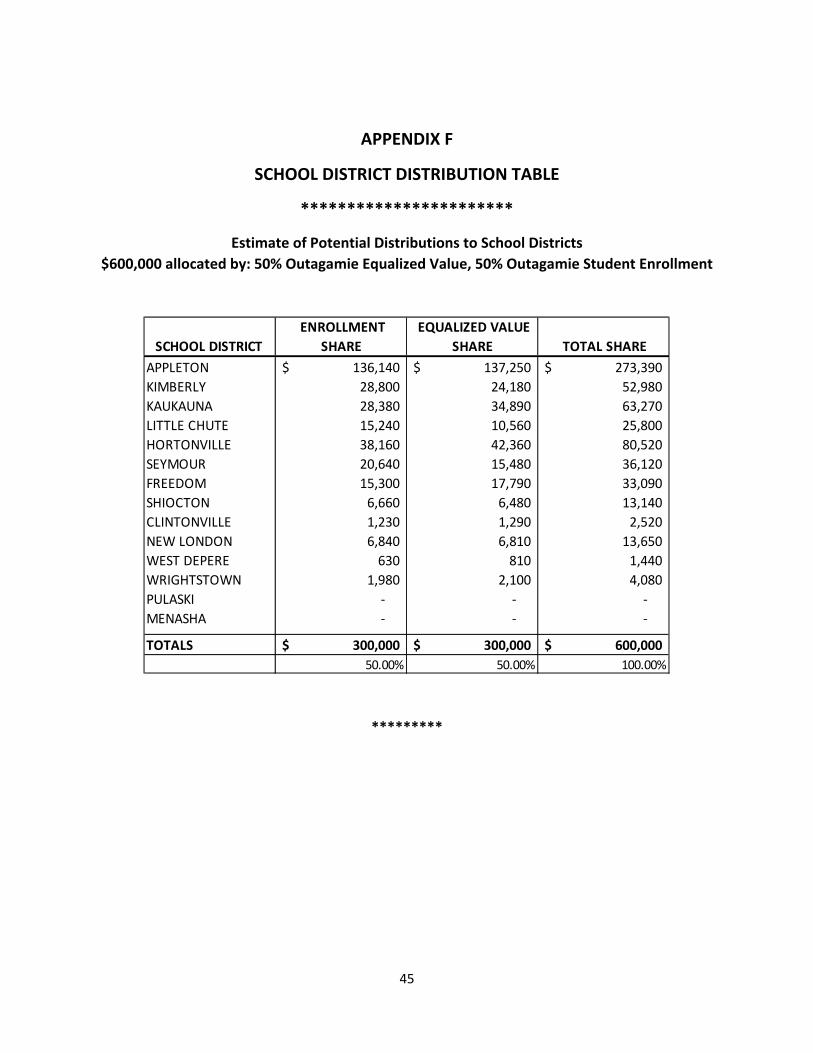
45
APPENDIX F
SCHOOL DISTRICT DISTRIBUTION TABLE
***********************
Estimate of Potential Distributions to School Districts
$600,000 allocated by: 50% Outagamie Equalized Value, 50% Outagamie Student Enrollment
SCHOOL DISTRICT
ENROLLMENT
SHARE
EQUALIZED VALUE
SHARE TOTAL SHARE
APPLETON 136,140$ 137,250$ 273,390$
KIMBERLY 28,800 24,180 52,980
KAUKAUNA 28,380 34,890 63,270
LITTLE CHUTE 15,240 10,560 25,800
HORTONVILLE 38,160 42,360 80,520
SEYMOUR 20,640 15,480 36,120
FREEDOM 15,300 17,790 33,090
SHIOCTON 6,660 6,480 13,140
CLINTONVILLE 1,230 1,290 2,520
NEW LONDON 6,840 6,810 13,650
WEST DEPERE 630 810 1,440
WRIGHTSTOWN 1,980 2,100 4,080
PULASKI ‐ ‐ ‐
MENASHA ‐ ‐ ‐
TOTALS 300,000$ 300,000$ 600,000$
50.00% 50.00% 100.00%
*********