out put b wind resource assessment report...
TRANSCRIPT

WINERGY 6 rue Henri Dunant 45 140 INGRÉFRANCEEmail : [email protected] PACIFIC BP7437 98801 NOUMEA NEW CALEDONIA mail : [email protected]
WINDRESOURCE ASSESSMENT,
FEASIBILITYSTUDY ANDPROJECT CONCEPT
DEVELOPMENT FOR AITUTAKI, COOK ISLANDS.
REPORTB:- WINDRESOURCEASSESSMENTREPORT.
Monday, 09 October 2006
Jérôme SUDRES–Sandrine BOUISSET
WINERGY NC
VERGNET PACIFIC
19 rue Papin
98800 NOUMEA
Nouvelle calédonie.
Tél : (687) 28 32 83
Tél : (687) 28 32 96
Email : [email protected]

WINERGY 6 rue Henri Dunant 45 140 INGRÉFRANCEEmail : [email protected] PACIFIC BP7437 98801 NOUMEA NEW CALEDONIA mail : [email protected]
Table of contents
Part1: AITUTAKI WIND ATLAS COOK ISLANDS ...................................1
ABSTRACT ................................................................................................................................................2
PRESENTATION OF THE STUDY ............................................................................................................3
1 Context and goal of the study.........................................................................................................3
1.1 Presentation of Cook Islands and the Aitutaki Islands...............................................................................3
1.2 Goal of the study .......................................................................................................................................5
2 General methodology of wind mapping..........................................................................................5
2.1 General analysis of the wind potential.......................................................................................................5
2.2 Location of windy sites ..............................................................................................................................5
3 GLOBAL WIND SAT Approach ......................................................................................................5
3.1 Presentation of GLOBAL WIND SAT ........................................................................................................5
3.2 A validated method..................................................................................................................................10
4 Data and simulation hypothesis ...................................................................................................11
4.1 Meteorological data: The wind.................................................................................................................11
4.2 Numerical Terrain Model .........................................................................................................................11
4.3 Roughness description............................................................................................................................11
4.4 Transposition of the wind reference potential to a specific zone .............................................................11
4.5 Calculation steps .....................................................................................................................................12
WIND ATLAS FOR AITUTAKI ISLANDS ................................................................................................13
CONCLUSION..........................................................................................................................................16
1 Synthesis of the study: favorable site for wind yield.....................................................................16
APPENDICES...........................................................................................................................................18
1 Additionnal Information about wind ..............................................................................................18
1.1 Location of the several global meteorological points ...............................................................................18
1.2 Wind Distribution (at 10m height) ............................................................................................................18
1.3 Wind Roses (at 10m height) ....................................................................................................................19
1.4 Monthly variation .....................................................................................................................................19
1.5 Evolution per year ...................................................................................................................................20
2 Aitutaki paper map........................................................................................................................20
Part 2: 8.5 MONI TORING MONTHS REPORT .........................................22
Introduction .............................................................................................................................................23
Results .....................................................................................................................................................24
1 Location ........................................................................................................................................24
2 Installation ....................................................................................................................................25
2.1 Installed equipment .................................................................................................................................25
2.2 Operations :.............................................................................................................................................25
2.3 Measured Parameters.............................................................................................................................25

WINERGY 6 rue Henri Dunant 45 140 INGRÉFRANCEEmail : [email protected] PACIFIC BP7437 98801 NOUMEA NEW CALEDONIA mail : [email protected]
3 Quality of the measurment ...........................................................................................................26
3.1 Completion rates .....................................................................................................................................26
3.2 Chronicle of the measurements...............................................................................................................26
4 Wind speed...................................................................................................................................26
4.1 Average wind speed................................................................................................................................27
4.2 Wind speed distribution and Weibull model.............................................................................................27
5 Direction .......................................................................................................................................28
6 Turbulence....................................................................................................................................28
wind speed estimation at 55m...............................................................................................................30
1 Vertical gradient............................................................................................................................30
2 Calculation of the wind speed at 55m ..........................................................................................30
3 Representativeness of the measurement period .........................................................................31
Conclusion...............................................................................................................................................32

WINERGY 6 rue Henri Dunant 45 140 INGRÉFRANCEEmail : [email protected] PACIFIC BP7437 98801 NOUMEA NEW CALEDONIA mail : [email protected]
1
Part1: AITUTAKI WIND ATLASCOOK ISLANDS

WINERGY 6 rue Henri Dunant 45 140 INGRÉFRANCEEmail : [email protected] PACIFIC BP7437 98801 NOUMEA NEW CALEDONIA mail : [email protected]
2
ABSTRACT
For a number of years, the Government of the Cook Islands has shown clear interest in thedevelopment of renewable energy sources as an alternative to diesel powered generators commonly used tosupply electricity to the population of its small islands.
This report, part of the approach, deals with wind mapping for Aitutaki - Cook Islands.
The study has been achieved to determine wind potential and location of windy sites.

WINERGY 6 rue Henri Dunant 45 140 INGRÉFRANCEEmail : [email protected] PACIFIC BP7437 98801 NOUMEA NEW CALEDONIA mail : [email protected]
3
PRESENTATION OF THE STUDY
1 Context and goal of the study
1.1 Presentation of Cook Islands and the Aitutaki Islands
GEOGRAPHY
The Cook Islands are located in the South Pacific Ocean between Samoa and Tonga on the West andFrench Polynesia on the East. The group is made up of fifteen islands scattered over 2 million square kilometresof ocean, an area as large as Western Europe.
Aitutaki Cook Islands is a triangular shaped ‘almost’ atoll: a central volcanic island surrounded by a barrier reef. The atoll rises up 4000 meters from the floor of the Pacific Ocean.The Main Island is Aitutaki, thereare other uninhabited islands along the edge of the lagoon: 3 volcanic and 12 coral islets (motus). The lagoonis so large that the largest island in the Cook Islands can fit inside (12km*15km). The highest point of Aitutaki isMt Maungapu, 124m.
CLIMATOLOGY
Cook Islands enjoy a mild maritime climate with a dry season (May to October) and a pronounced wetseason (November to April) with tropical showers and higher humidity (two thirds of the annual rain falls). The

WINERGY 6 rue Henri Dunant 45 140 INGRÉFRANCEEmail : [email protected] PACIFIC BP7437 98801 NOUMEA NEW CALEDONIA mail : [email protected]
4
temperatures range between 20° and 25°C.
The Cook Islands are in the southeast trade wind belt: the prevailing wind is from the southeast withoccasional shifts to the north. Typhoons could occur during the wet season.
WATER RESSOURCES
Lack of water is an important concern for Cook Islands: no water reservoir exists. The water source isfrom stream, roof catchment system, bore holes or water tanks.
HISTORY AND POLITICS FACTS
The fisrt settlers probably came during the Great Polynesian Migration in 800 AD. Spanish sightedPukapuka and Rakahanga in the late 16th and early 17th cent. Captain James Cook discovered Manuaes atoll,Palmersont, Takutea, Mangaia and Atiu 160 years later.
According to the legend, Aitutaki was settled by a polynesion chieftain Ru in 900 AD. He named it:Utataki Enua O Ru Ki Te Moana. The 1st recorded discovery by Europeans was Captain Bligh in 1789. Shortlyafterwards the mutiny occurred: Bligh returned later in 1792. He said to have introduced the paw paw fruit toAitutaki which is now an important export product from the Cook Islands. The first missionary to the Cooks wasJohn Williams. He landed on Aitutaki before any of the other islands.
Cook Islands were proclaimed a British protectorate at the end of 19h century and annexed the Islandsin 1901. The country became self-governing in free association with New Zealand on 4 august 1965 and is freeto unilaterally declare their complete independence.
Cook islanders have a New Zealand citizenship: they are able to live and work in New Zealand. Aneconomic crisis in the mid-1990s led to outmigration and a significant drop in the islands population.
POPULATION
The current population is estimated at 20 000 people and half of the Cook Islanders live on the mainIsland Rarotonga. The people are mostly Polynesian (90%) and the minorities are principally Europeans orChinese. The local language is Cook Islanders Maori but everyone speaks English. Aitutaki has a population ofabout 2000.
ECONOMIC ACTIVITIES
In Cook Islands Tourism is the major income earner and Aitutaki is the second most visited island. Thesecond most important sector is the production of pearls. Exportations are also based on agriculture, fishing,pearls production and clothes manufacturing.
Agriculture produces copra, canned citruis fruit, papaya, coffee, pineapples, tomatoes, pawpaws,bananas, yams and taro. Manufacturing activities are based above all on fruit processing but also on clothingand handicrafts. Mining and fishing industries are being expanded.
ELECTRICITY
Electricity production system of Cook Islands completly relies on imported fossil fuels. Solar energycontributes to a very small proportion in energy generation.
The electricity consumption of the Cook Islands is 25.51 million of kWh (2001) or 1214.29 kWh perperson (2001). Today thanks to government commitment 98% of the homes on Cook Islands have electricity.
WIND ENERGY: A PART TO PLAY
Wind is clean, renewable, and increasingly economical. This is an incredible opportunity to create acleaner environmental future. Cook Islands benefits good wind conditions and enormous opportunities in windpower: this potential is worth to being valorized.
Wind could not solve all energy difficulties but it could contribute to play a role in energy power supply.The decentralized solutions have advantages:

WINERGY 6 rue Henri Dunant 45 140 INGRÉFRANCEEmail : [email protected] PACIFIC BP7437 98801 NOUMEA NEW CALEDONIA mail : [email protected]
5
- protection of the environment and energetic economy
- low impact and integration in the economic web
- low cost of operation
- well tried technology
Wind energy could be valorized thanks to wind power plan linked to islands existing grids or with avillage wind power network for rural electrification. It is a reliable solution for rural electrification and also a goodway to reinforce the electric grid.
Moreover wind energy could help to reduce the dependency of Cook Islands on imported petroleumproducts and to reduce the country's energy costs.
1.2 Goal of the studyEnergy division of Government of the Cook Islands have expressed interest in determining the wind
regime of Aitutaki Islands for wind power production.
The aim of the study is to realize the wind mapping for Aitutaki Islands.
2 General methodology of wind mapping
The wind potential is studied according to a 3 steps methodology.
2.1 General analysis of the wind potentialThe wind cartography for Aitutaki Islands has been realized thanks to meteorological and geographical
data.
First, global meteorological input data were defined above the sea. Secondly, the terrain model and thevegetation data are digitalized and formatted. Finally, wind mapping is calculated by exploiting therepresentative meteorological input data, the land cover and numerical terrain model.
A global meteorological input data have been used to calculate wind reference potential. This windreference potential has been transposed to the whole zone of study taking in account the vegetation and theelevation. Then the numerical simulation of wind mapping is launched (with wind expert software WAsP®).
2.2 Location of windy sitesThanks to the wind map, the potential windy sites are pointed up. The windy sites should have a wind
speed higher than 7m/s at a height of 30m above ground and should check the feasibility constraints of windturbine project.
The best wind sites are deepened is the conclusion of this report.
3 GLOBAL WIND SAT Approach
3.1 Presentation of GLOBAL WIND SATThe study of wind potential Aitutaki Islands uses an innovative method based on its characterization and
quantification: The Global Wind Sat Approach.
The Global Wind Sat approach implements global wind data (from Winergy wind archive), numericalterrain model (which describes relief) and a rugosity model (which describes vegetation territories).
In this approach, cartographic calculation for wind mapping has been realized with wind expert softwareWAsP®.
This method is described and compared to the standard approach in order to define the wind potential.

WINERGY 6 rue Henri Dunant 45 140 INGRÉFRANCEEmail : [email protected] PACIFIC BP7437 98801 NOUMEA NEW CALEDONIA mail : [email protected]
6
Comparison between the standard methods and the innovative one
Standard Method : The standard principle of the wind calculation software is described in the diagrambelow.
The standard principle of the wind calculation implies to have
- Some reliable and representative numerical wind data at one or several points (1)
- A precise Numerical terrain model for the concerned zone
- A precise description of the environment of the meteorological reference station (2)
Ground meteorological stations are often badly located; the neighboring environment (vegetation andbuildings) disturbs wind measures. In addition, the relief around the meteorological station has influence onmeasure and therefore it should be accurately described.
The first and the second calculation stages have to be based on precise meteorological data. Indeed,meteorological data conditions take an important part in calculations and unfortunately there are manyuncertainties about data from ground meteorological station.
Therefore it is necessary to have reliable, precise and non perturbed data which describes the localwind regime. Global wind data which are calculated above the ocean check all these criteria and thus thedifficulties of stages 1 and 2 disappear.
An innovative method: The Global Wind Sat Approach: use of expert software WAsPfrom globalmeteorological data and numerical terrain model.
3. Transposition of thewind referenceregime to aparticular site
1. Definition of the regionalwind regime on theground
Studied site
Meteorologicalreference stationIdeal site
2. Model of regional windreference regimereference
Numerical Terrain

WINERGY 6 rue Henri Dunant 45 140 INGRÉFRANCEEmail : [email protected] PACIFIC BP7437 98801 NOUMEA NEW CALEDONIA mail : [email protected]
7
Studied site*
1. Definition and Modeling ofthe regional referencewind regime
2. Transpositionof the windreferenceregime to aparticular site
Numerical Terrain ModelIdeal site
Layout of Model
Integration of theroughness
Global Wind data
In order to exploit global wind data, within the context of wind site prospection, Winergy have set up adatabaseat a 10m height.
Wind data from this archive have several origins :
- Satellite wind measures realized within the context of « Defense Meteorological SatelliteProgram » of the NASA. Satellites are equipped with Special Sensor Microwave Imager(SSM/I). Wind data are recorded at 10m height above the seas and the oceans of the world.
- Re-Analysis data from the European Center of Meteorological Predictions at Middle Course.
- Raw data measured in the national meteorology centers.
A numerical model (a method of 2D variational analysis) combines data from the several observationsources. This method enables to generate vectorial field at a 10m height above the surface. A complexnumerical model of atmospheric flows is also involved. The reliability of these data is linked for one hand to itsdiverse origin (satellite sensors, surface measure) and for the other hand to the overall coherence obtained withthe global atmospheric circulation. It enables to correct possible error or measure imprecision. This work hasbeen realized by experts and scientifics within the context of research strategic programs (defense,meteorological prevision). That is an additional guarantee of its performance.
Files of Winergy Wind Archive contain the component u and v of the wind speed at 10m height abovethe sea.
These values have been calculated every 6 hours UTC during a 13 years period (from 1998 to 2001).That gives precise long course estimation from various and regular measures.
Measures have been geographically referenced from a mesh: the grid is made up with cells defined by:
- A latitude range [-90° ;+90°] with a 1° step
- A longitude range [-180° ;+180°] with a 1° step
This meteorological grid is significant and reliable for studying wind potential above the ground.
The major interest of this prospective approach consists in exploiting global wind data which arerecorded above the ocean. Thus we have at our disposal wind data for all points of the globe which are notdisrupted by the surrounding relief. So these points are representatives of wide zones (100km radius). Thefollowing map is based on an historic of 12 years measure period (1998-2000) and resumes the average windintensity and direction at 10m height above the ground.

WINERGY 6 rue Henri Dunant 45 140 INGRÉFRANCEEmail : [email protected] PACIFIC BP7437 98801 NOUMEA NEW CALEDONIA mail : [email protected]
8
FIGURE 1ILLUSTRATION OF GLOBAL WIND DATA
Calculation Methodology
The calculation methodology follows a 4 stages reasoning:
- 1st stage : meteorological and topographical input data were treated and integrated: with apeculiar treatment for vegetation (cf. 4th paragraph)
- 2nd stage: calculation with WAsP® : mode calculation are set up. Simulations are launched.(Beforehand a calculation of wind reference potential has been realized).
- 3rd stage: the presentation of wind maps is finalized: Layout of the iso-speed plots given byWAsP® simulation.
- 4th stage: The wind geographical information system (GIS) is developed. A multi-criteriaapproach is suggested in order to set up a directive plan for wind power in Aitutaki Islands.

WINERGY 6 rue Henri Dunant 45 140 INGRÉFRANCEEmail : [email protected] PACIFIC BP7437 98801 NOUMEA NEW CALEDONIA mail : [email protected]
9
1.1Terrain Informations
(paper map)
Identification of the windy zones
Wind speed >7m/s
Best sites selection
Development of a wind directive plan
Numerical terrain modeland vegetation model
(paper map)
Wind Simulation software WAsP
(General calculation)
Regional data basis of the windpotential
Layout with Arcview®
Wind potential cartographyDevelopment of the wind GIS
Wind Atlas
Simulation: calculation of windpotential cartographies at 30m height
Prospects of the study
Global meteorologicalwind data
(Winergy wind archive)

WINERGY 6 rue Henri Dunant 45 140 INGRÉFRANCEEmail : [email protected] PACIFIC BP7437 98801 NOUMEA NEW CALEDONIA mail : [email protected]
10
Interest and performance of the methodThis innovative method distinguishes itself from the standard approach for determination of wind
potential.
Interest:
- No research of land meteorological data.
- High quality of series of data wind (long and unbroken).
- Preliminary characterization of it wind regime without sites instrumentation.
- Performances:
- Acceleration of wind study stage.
- Feasibility of study about area with rare or unworkable wind data.
- Precise evaluation of the wind potential on a zone at global scale.
- Identification and selection of wind farm sites.
- Tool for energy choices and country planning policy.
3.2 A validated methodThis prospective method for wind potential determination has been validated by WINERGY and
VERGNET over the New Caledonian territory.
VERGNET has been in New Caledonia for many years. Various measure campaigns are under way andsome wind power plants came into being. Thus, it has been possible to compare the innovative approach withreliable measure campaigns.
This validation stage has allowed checking the quality of global wind data. It has demonstrated theinterest and the pertinence of using that type of meteorological data for the wind potentiel determination.
Besides, Global Wind Sat approach was implemented to realize:
- Wind atlas of the Large coast of Senegal (initiated by the Energy and Hydraulics Ministry,the Senegalese Agency for rural Electrification and the Electricity firm SENELEC)
- Wind atlas of a coastal zone of Morocco.
- Wind atlas of the East of Madagascar (initiated by the Environment and Energymanagement agency–ADEME-DAI with the support of the Malagasy Energy and MiningMinistry)
- Wind map of Mangaia Island - Cook Islands (funded by the Secretariat of the PacificCommunity (SPC)).
- Wind map of New Caledonia Main Island (EEC and Caledonian government).
- Wind atlas of Vanua Levu and Ovalau Islands (Republic of the Fiji Island - Department ofEnergy and Fiji Electricity Authority)

WINERGY 6 rue Henri Dunant 45 140 INGRÉFRANCEEmail : [email protected] PACIFIC BP7437 98801 NOUMEA NEW CALEDONIA mail : [email protected]
11
4 Data and simulation hypothesis
This paragraph describes the calculation hypothesis and the data which are integrated in the windexpert software WAsP®.
4.1 Meteorological data: The windThe meteorological data of this study come from the Winergy wind archive: it is a matter of global wind
data from several origins as explained in the previous paragraphs.
For one meteorological input point of the Winergy wind archive, one statistic file is available. This filecontains wind speed and wind direction every 6 hours over a 13 years period.
Wind data treatment consist in calculating from this annual chronics over 13 years: contingency tables,wind repartition tables per wind speed class (1m/s) and directional sectors (20°). It is the statistical treatment ofwind information.
First, before calculation phase, meteorological input data have been analyzed in order to have a generalapproach of the climatology of the islands. Annual variation, seasonal variation and hourly variation aredisplayed in appendix (additional information about wind). Four meteorological points have been extracted andstudied. The results of this process (contingency tables, wind rose and distribution) are available in appendix 1named “additional information about wind”.
One point has been used to calculate the wind mapping. It is the most representative and the nearestpoint which has been used to characterize Aitutaki Islands: 19°W, 159°S.
4.2 Numerical Terrain ModelRelief description is fundamental to calculate wind circulation on a zone: the relief has a great influence
on wind flows in low atmosphere layer. Consequently, specific sites effect speed up or slow down wind. That iswhy topographic are required for wind mapping calculation.
The elevation contours have been digitalized and formatted from a paper map of Aitutaki Islands 1:25000 to obtain a numerical terrain model compatible with the expert simulation software WAsP® (cf.appendice 2).
The map precision was one elevation contour every 10m height. The relief of Aitutaki varies from 0 to124 m.
4.3 Roughness descriptionThe wind flow is disturbed by land uses. The simulation software take into account this influence
through a roughness description.
Vegetation data was also numerised with the same method as the numerical terrain model.
Each land use class has been defined and each class corresponds to a roughness value:
- Ocean or expanse of water
- Forest
- Village
- Plantation . . .
Vegetation of Aitutaki islands is composed of forest, trees and plantation.
4.4 Transposition of the wind reference potential to a specific zoneThe definition of a regional wind potential is realized from global meteorological data statistic files
(extracted from Winergy wind Archive). Beforehand, these files have been converted to the simulation softwarestandard. The wind referent regime is then transposed to the specific zone with relief, roughness conditions.
WAsP® calculates the wind potential at a specified height by spitting up the map according to a grid :
WINERGY 6 rue Henri Dunant 45 140 INGRÉFRANCEEmail : [email protected] PACIFIC BP7437 98801 NOUMEA NEW CALEDONIA mail : [email protected]
12
on each point of the mesh, wind characteristics are calculated with a 2 dimensions flow analysis model. Then itis possible to link points with the same value, to plot iso-speed curves and thus to realize precise maps of thewind potential of the zone.
4.5 Calculation stepsThe wind was calculated at 30m height.
Two calculation zones have been defined. First wind speed was calculated all over the Aitutaki Islandsgroup with a 75m calculation step (each calculation points are 75m far from one to each other). Secondly, amore precised calculation has been realized for the inhabited Aitutaki Island: 35m calculation step.
WINERGY 6 rue Henri Dunant 45 140 INGRÉFRANCEEmail : [email protected] PACIFIC BP7437 98801 NOUMEA NEW CALEDONIA mail : [email protected]
13
WIND ATLAS FOR AITUTAKI ISLANDS
The wind cartography of Aitutaki islands has been calculated at 30m height.
Colour scale has been chosen in order to differentiate low or moderate wind potential (green) from highones which are favorable to wind turbines implantation (orange and red).

WINERGY 6 rue Henri Dunant 45 140 INGRÉFRANCEEmail : [email protected] PACIFIC BP7437 98801 NOUMEA NEW CALEDONIA mail : [email protected]
14
FIGURE 2 WIND POTENTIEL AT 30M ABOVE THE GROUND–AITUTAKI ISLANDS GROUP (CALCULATION STEP:75M)

WINERGY 6 rue Henri Dunant 45 140 INGRÉFRANCEEmail : [email protected] PACIFIC BP7437 98801 NOUMEA NEW CALEDONIA mail : [email protected]
15
FIGURE 3 WIND POTENTIEL AT 30M ABOVE THE GROUND–AITUTAKI ISLAND (CALCULATION STEP:35M)

WINERGY 6 rue Henri Dunant 45 140 INGRÉFRANCEEmail : [email protected] PACIFIC BP7437 98801 NOUMEA NEW CALEDONIA mail : [email protected]
16
CONCLUSION
1 Synthesis of the study: favorable site for wind
yield
The exercise of wind mapping has allowed quantifying the available wind potential.
The wind mapping confirms that trade winds come from southeastern: wind over the easthern coast isreinforced whereas wind speed over ther western coast is slow down.
The trade wind seems to be more important on the northern hills of the Island.
Aitutaki Islands is composed of good sites with average wind speed higher than 7m/s (average valueover 1 year at 30m height).
Best sites are encircled on the following maps. Wind measurements should be realized in that zone.

WINERGY 6 rue Henri Dunant 45 140 INGRÉFRANCEEmail : [email protected] PACIFIC BP7437 98801 NOUMEA NEW CALEDONIA mail : [email protected]
17
FIGURE 4 LOCATION OF GOOD WIND POTENTIAL SITES–AITUTAKI ISLAND

WINERGY 6 rue Henri Dunant 45 140 INGRÉFRANCEEmail : [email protected] PACIFIC BP7437 98801 NOUMEA NEW CALEDONIA mail : [email protected]
18
APPENDICES
1 Additionnal Information about wind
1.1 Location of the several global meteorological pointsFour global wind sat point have been analyzed in order to have a general approach of the climatology of
the islands. Annual variation, seasonal variation and hourly variation are displayed in appendix (additionalinformation about wind).
One point has been used to calculate the wind mapping. It is the most representative and the nearestpoint which has been used to characterize Aitutaki Islands: 19°W, 159°S.
XUTM X ° YUTM Y°station 1 605254 -19 7898874 -158station 2 500000 -19 7899173 -159station 3 605867 -18 8009529 -158station 4 500000 -18 8009815 -159
station used to calculate the wind mapping
Latitude Longitude
1.2 Wind Distribution (at 10m height)
V moy A kstation 1 6.2 7.0 2.31station 2 6.3 7.1 2.34station 3 6.3 7.1 2.36station 4 6.4 7.2 2.40

WINERGY 6 rue Henri Dunant 45 140 INGRÉFRANCEEmail : [email protected] PACIFIC BP7437 98801 NOUMEA NEW CALEDONIA mail : [email protected]
19
1.3 Wind Roses (at 10m height)
AITUTAKI WIND ATLAS (COOK ISLANDS)Wind roses - 1987 to 2001
satellite data
0%
5%
10%
15%
20%
25%360
20
40
60
80
100
120
140
160
180
200
220
240
260
280
300
320
340
station 1
station 2
station 3
station 4
Wind direction above the ocean around Aitutaki is 100-120° thus Aitutaki is as expected in the southeasttrade wind belt.
1.4 Monthly variation
AITUTAKI WIND ATLAS (COOK ISLANDS)Monthly windspeed evolution - 1987 to 2001
satellite data
4
5
6
7
8
jan feb mar apr may jun jul aug sep oct nov dec
spee
dm
/s
station 1 station 2 station 3 station 4
WINERGY 6 rue Henri Dunant 45 140 INGRÉFRANCEEmail : [email protected] PACIFIC BP7437 98801 NOUMEA NEW CALEDONIA mail : [email protected]
20
The average wind speed varies with the month of the year. We could notice that during the rainy seasonthe wind speed is less important whereas during the dried season the wind speed keeps increasing.
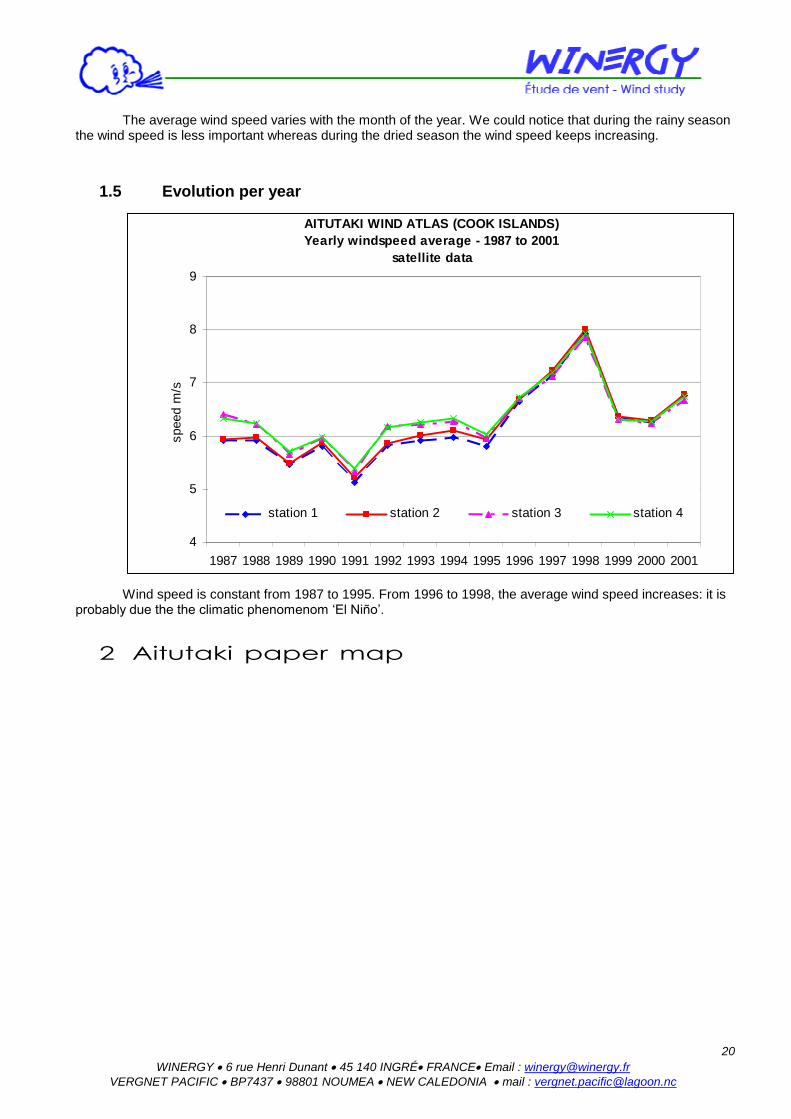
1.5 Evolution per year
AITUTAKI WIND ATLAS (COOK ISLANDS)Yearly windspeed average - 1987 to 2001
satellite data
4
5
6
7
8
9
1987 1988 1989 1990 1991 1992 1993 1994 1995 1996 1997 1998 1999 2000 2001
spee
dm
/s
station 1 station 2 station 3 station 4
Wind speed is constant from 1987 to 1995. From 1996 to 1998, the average wind speed increases: it isprobably due the the climatic phenomenom ‘El Niño’.
2 Aitutaki paper map

WINERGY 6 rue Henri Dunant 45 140 INGRÉFRANCEEmail : [email protected] PACIFIC BP7437 98801 NOUMEA NEW CALEDONIA mail : [email protected]
21

WINERGY 6 rue Henri Dunant 45 140 INGRÉFRANCEEmail : [email protected] PACIFIC BP7437 98801 NOUMEA NEW CALEDONIA mail : [email protected]
22
Part 2: 8.5 MONI TORING MONTHS REPORT

WINERGY 6 rue Henri Dunant 45 140 INGRÉFRANCEEmail : [email protected] PACIFIC BP7437 98801 NOUMEA NEW CALEDONIA mail : [email protected]
23
Introduction
In a first part, a wind atlas has been calculated for the whole island of Aitutaki.
In a second part, a 30m height monitoring mast has been tilled up in order to precise the wind potential.
This report summarizes the result of the wind analysis at the mast.

WINERGY 6 rue Henri Dunant 45 140 INGRÉFRANCEEmail : [email protected] PACIFIC BP7437 98801 NOUMEA NEW CALEDONIA mail : [email protected]
24
Results
1 Location
FIGURE 5 : LOCATION OF THE WIND MONITORING MAST
ZOOM
= WIND MONITORING
1km

WINERGY 6 rue Henri Dunant 45 140 INGRÉFRANCEEmail : [email protected] PACIFIC BP7437 98801 NOUMEA NEW CALEDONIA mail : [email protected]
25
A tall tower was erected approximately at 100m South-East of the Maungapu peak. The elevation of themast is approximately 80m a.s.l.
The approximated coordinates of the mast are:
X = 417 574m,
Y = 7 916 696m.
The site is named “Maungapu site”.
2 Installation
2.1 Installed equipment
Type : Tubular tower
Brand : NRG systems
Hauteur : 30m
Instrumentation :
1 anemometer at 30m,
1 anemometer at 20m,
1 wind vane at 30m.
Acquisition : logger NRG 9200
2.2 Operations :
Erection and set up: the tower erection was finished on the 14th July 2005 but datarecord started on the 17th August 2005.
Frequency of the data recovery : every month
2.3 Measured Parameters
Wind speed
Measured at 30m and 20m.
Wind speed is measured at a 2 seconds interval and averaged every 10 minutes.
Wind Turbulence
Measured at 30m and 20m.
This parameter quantifies rapid variation (<10min) in the wind speed.
Turbulence is expressed by the typical variation in wind speed over 10 minutes.
Wind direction
Measured at 30m
Wind direction is measured at a 2 seconds interval and averaged every 10 minutes.

WINERGY 6 rue Henri Dunant 45 140 INGRÉFRANCEEmail : [email protected] PACIFIC BP7437 98801 NOUMEA NEW CALEDONIA mail : [email protected]
26
3 Quality of the measurment
3.1 Completion ratesCompletion rate = number of measurements achieved /number of possible measurements
parameter period of recording completion rate %
speed at 30m A1 from 17/08/05 10:00 to 01/05/06 12:00 92%
speed at 20m A12 from 17/08/05 10:00 to 01/05/06 12:00 92%
direction at 30m G1 from 17/08/05 10:00 to 01/05/06 12:00 92%
Some data have been lost from 30/11/05 au 19/12/05. The completion rate is good; therefore all therecords are representative of the measurement period.
3.2 Chronicle of the measurements
Maungapu Site - 30m mastChronicle of Anemometers
2 weeks extract
0
5
10
15
20
25
30/8/
050:0
0
1/9/05
0:00
3/9/05
0:00
5/9/05
0:00
7/9/05
0:00
9/9/05
0:00
11/9/
050:0
0
13/9/
050:0
0
15/9/
050:0
0
17/9/
050:0
0
time
win
dsp
eed
(m/s
)
Anemometer A1 - 30m Anemometer A2 - 20m
FIGURE 6 : CHRONICLE OF THE ANEMOMETERS (EXTRACT 2 WEEKS)
The chronicle shows that during all measurement period, wind speed record at 30m and 20m were keptup faithful and as expected the wind speed at 30m is always higher than the wind speed at 20m. The wind vaneseems also to work correctly during all the measurement period.
4 Wind speed

WINERGY 6 rue Henri Dunant 45 140 INGRÉFRANCEEmail : [email protected] PACIFIC BP7437 98801 NOUMEA NEW CALEDONIA mail : [email protected]
27
4.1 Average wind speeda-05 s-05 o-05 n-05 d-05 j-06 f-06 m-06 a-06 average speed
speed at 30m A1 (m/s) 7.3 8.1 5.9 5.4 5.2 6.0 4.8 5.1 7.4 6.1speed at 20m A2 (m/s) 6.6 7.4 5.5 5.0 5.0 5.6 4.5 4.8 6.7 5.7
(* note that august month is since 17/08/05)
We can note that the wind speed varies with seasons. We have not a complete year measurement butas expected the dry season from May to October appears to be windier than the wet season from November toApril. The months we did not have (May, June, July and half of August month until 16/08) would have been inthe windy season and increase the mean wind speed.
Wind speed hardly varies along the day.
4.2 Wind speed distribution and Weibull modelThe wind speed varies from the time. The experience shows that the wind speed distribution is well
modeled by the Weibull curve. The graphic bellow shows the Weibull distribution and determines the shapefactor k and scale factor A of the model.
The wind distribution at the mast is well modeled by the Weibull model.
Maungapu Site - 30m mast - Anemometer A1 at 30mWind speed distribution
at 30m above ground level - from 17/08/05 10:00 to 01/05/06 12:50
0%
2%
4%
6%
8%
10%
12%
14%
16%
0-1
1-2
2-3
3-4
4-5
5-6
6-7
7-8
8-9
9-10
10-1
111
-12
12-1
313
-14
14-1
515
-16
16-1
717
-18
18-1
919
-20
20et
plus
classes de vent (m/s)
occu
renc
es
Distributionréelle desclasses de vent
Distribution deWEIBULLthéorique
Vmoy = 6.1 m/sA = 6.9k = 2.4
FIGURE 7 : WEIBULL DISTRIBUTION AT 30 M
Average wind speed = 6.1 m/s
A = 6.9 m/s
k = 2.4

WINERGY 6 rue Henri Dunant 45 140 INGRÉFRANCEEmail : [email protected] PACIFIC BP7437 98801 NOUMEA NEW CALEDONIA mail : [email protected]
28
5 Direction
The wind conditions of a site are depending on the direction of the wind. Topographical effects andregional climate determine the main direction of the flow.
A wind rose is calculated on the site: it defines the frequency of the wind for each direction and therepartition of the energy of the wind for each direction.
Maungapu Site - 30m mast - Wind Vane G1 at 30mRose des vents et rose des vents énergétique
at 30m above ground level - from 17/08/05 10:00 to 01/05/06 12:50threshold 3 m/s
0%
5%
10%
15%
20%
25%North
30
60
East
120
150
South
210
240
West
300
330
frequency (%) wind energy distribution (%)
FIGURE 8 : WIND ROSE AT 30M
As expected we find the direction characteristic of the trade winds in the South Pacific: from East toSouth.
main energy sector ° 80° - 120°
energy in this sector %
main direction °
G1
73%
100°
6 Turbulence

WINERGY 6 rue Henri Dunant 45 140 INGRÉFRANCEEmail : [email protected] PACIFIC BP7437 98801 NOUMEA NEW CALEDONIA mail : [email protected]
29
Maungapu Site - 30m mast - Anemometers A1 at 30m and A2 at 20mTurbulence - comparison to IEC norm
30m et 20m above ground level - from 17/08/05 10:00 to 01/05/06 12:50
0
0.5
1
1.5
2
2.5
3
3.5
4
0-1
1-2
2-3
3-4
4-5
5-6
6-7
7-8
8-9
9-10
10-1
111
-12
12-1
313
-14
14-1
515
-16
16-1
717
-18
18-1
919
-20
20an
d more
wind speed (m/s)
turb
ulen
ce(m
/s)
0%
10%
20%
30%
40%
50%
60%
70%
80%
90%
100%
turb
ulen
cein
tens
ityT
I(%
)
IEC Norm - Low limit
IEC Norm - High limit
Turbulence at 30m - A1
Turbulence at 20m - A2
TI à 30m % - A1
TI à 20m % - A2
FIGURE 9 : TURBULENCE AT 30M ET 20M
TI at 8m/sA1 - 30 13%A2 - 20 14%
Turbulence means rapid variations (<10min) of the wind speed. An irregular wind could have bad effectson wind turbines: it could affect the lifespan of the turbines and the production.
Turbulence is expressed in m/s: this is the typical range (σ) of the wind speed recorded every 2 secondsover 10min.
Turbulence intensity is defined as: TI = σ/average wind speed (%)
Turbulence study consists in comparing site turbulence to the theoretical admissible turbulence fixed bythe international norm IEC 61 400-1:
The lower limit is the threshold beyond which turbulence leads to disturbance in production
The upper limit is the threshold beyond which turbulence provokes either premature wear ordegradation to the machine
The turbulence level on the site stays under the limit. Turbulence is not a problem for wind turbineinstallation. The turbulence at 30m is lower than 20m; we can suppose that it would be lower at 55m.

WINERGY 6 rue Henri Dunant 45 140 INGRÉFRANCEEmail : [email protected] PACIFIC BP7437 98801 NOUMEA NEW CALEDONIA mail : [email protected]
30
wind speed estimation at 55m
1 Vertical gradient
This parameter defines the wind speed variation with elevation. The wind speed increases more or lessrapidly with elevation in relation with the land cover of the site.
α = (ln(VH1 / VH2)) / (ln (H1/H2)), avec H1>H2
H1= 30m and H2=20mWith the vertical gradient we can estimate the wind speed at higher elevation.
VH3 = VH1*(H3/H1) α
0
10
20
30
40
50
60
70
0 2 4 6 8
V (m/s)
H(m
)
α = 0.19
This vertical gradient is high. No photo is available but in the map we could read that there is no highvegetation on the site. Therefore, this vertical gradient could be not representative of the wind profile between30m and 55m. To be conservative and not to overestimate the potential a vertical gradient of 0.15 will beused for the following calculations.
2 Calculation of the wind speed at 55m
We can estimate the wind speed at 55m with the vertical gradientα:
Wind speed 2 = wind speed1*(height2/height1) α
With: α = 0.15
Wind speed at 55m at the mast from 17/08/05 to 01/05/06 = 6.7 m/s
(With α = 0.2 we would have found 6.9 m/s)

WINERGY 6 rue Henri Dunant 45 140 INGRÉFRANCEEmail : [email protected] PACIFIC BP7437 98801 NOUMEA NEW CALEDONIA mail : [email protected]
31
3 Representativeness of the measurement
period
Wind turbines are installed for a period of 10 or 20 years. Wind has a seasonal variation but it changesalso from one year to another. Therefore, it is interesting to know the average wind speed at long term that iswhy it is used to correlate the wind data at a site and some meteorological data available at long term.
WINERGY had no meteorological data in Cook Islands.
Some meteorological wind speed data are available at the web site:http://www.weatherunderground.com/:
Meteorological station of Rarotonga Island : from August 98 to August 06
Meteorological Station of Aitutaki Island : from June 04 to August 06
It is important to note that we do not know the quality of the data which could be downloading on theweb site.
Station Rarotonga from 17/08/05 to 01/05/06 from 01/01/98 to 31/08/06Completion rate 100% 97%
Wind speed (m/s) 3.7 3.6
Station Aitutaki from 17/08/05 to 01/05/06 from 01/06/04 to 31/08/06Completion rate 85% 85%
Wind speed (m/s) 9.5 9.6
Rarotonga station tends to show that the measurement period is a little windier that the long termwhereas the Aitutaki station shows that it is a little less windy. But it is important to notice that the completionrate of Aitutaki is not perfect and we have few measurement years.
In Rarotonga station, we can notice that there is a real yearly variation. In Rarotonga station, we couldnotice the 2 seasons (wet and dry) but the wind speed is practically the same.
It is not possible to conclude if the measurement period is or is not windier than a typical year. We couldjust note that the period seems not to be exceptionally windier or less windy than usual.

WINERGY 6 rue Henri Dunant 45 140 INGRÉFRANCEEmail : [email protected] PACIFIC BP7437 98801 NOUMEA NEW CALEDONIA mail : [email protected]
32
Conclusion
8.5 months of data have been collected and analyzed in this report at 30m mast.
It allows knowing the wind potential of the Mangapu site in Aitutaki.
During the period of the measurement campaign:
A wind speed at 30m of 6.1 m/s,
A Weibull shape factor of 2.4,
An estimated wind speed at 55m of 6.7 m/s,
WARNING:
We have not one year measurements: it lacks May, June, July and half of the august month; thesemonths seem to be in the dry season and therefore more windy than usual. That could increase the yearlyaverage wind speed.
No meteorological data were available for this study. Some meteorological data were downloading onthe web but the quality and accuracy of theses data in unknown. It just helps to conclude that the measurementperiod seems not to be exceptionally more or less windy than usual.