oursutoy5woh5y e - nic bank · temenos (t24) core banking system. ... traditional collateral for...
TRANSCRIPT


3Annual Report & Financial Statements • 2016 I
BUILDING TRUST BYBUILDING PEOPLE
BUSINESS REVIEW
Our Story 5
Who We Are 7
Five Year Financial Review 16
Chairman’s Statement 20
Taarifa ya Mwenyekiti 23
Group Managing Director’s Statement 26
Taarifa ya Mkurugenzi Mkuu 28
CORPORATE GOVERNANCE
The Board of Directors 32
Executive Management 36
Corporate Information 40
Statement on Corporate Governance 41
Corporate Citizenship 55
Employee Welfare 66
Directors’ Report 69
Statement of Directors’ Responsibilities 70
INDEPENDENT AUDITOR’S REPORT 71
FINANCIAL STATEMENTS
Statement of Profit or Loss 76
Statement of Comprehensive Income 77
Statement of Financial Position 78
Consolidated Statement of Changes in Equity 79
Bank Statement of Changes in Equity 80
Statement of Cash Flows 81
Notes to the Financial Statements 82
OTHER INFORMATION
Notice of the Annual General Meeting 163
Tangazo la Mkutano Mkuu wa Mwaka 164
Proxy Form 165
Fomu ya Uwakilishi 166
CONTENT
Annual Report & Financial Statements • 2016 I
BUILDING TRUST BY BUILDING PEOPLE
4 I Annual Report & Financial Statements • 2016
BUILDING TRUST BYBUILDING PEOPLE
5Annual Report & Financial Statements • 2016 I
BUILDING TRUST BYBUILDING PEOPLE
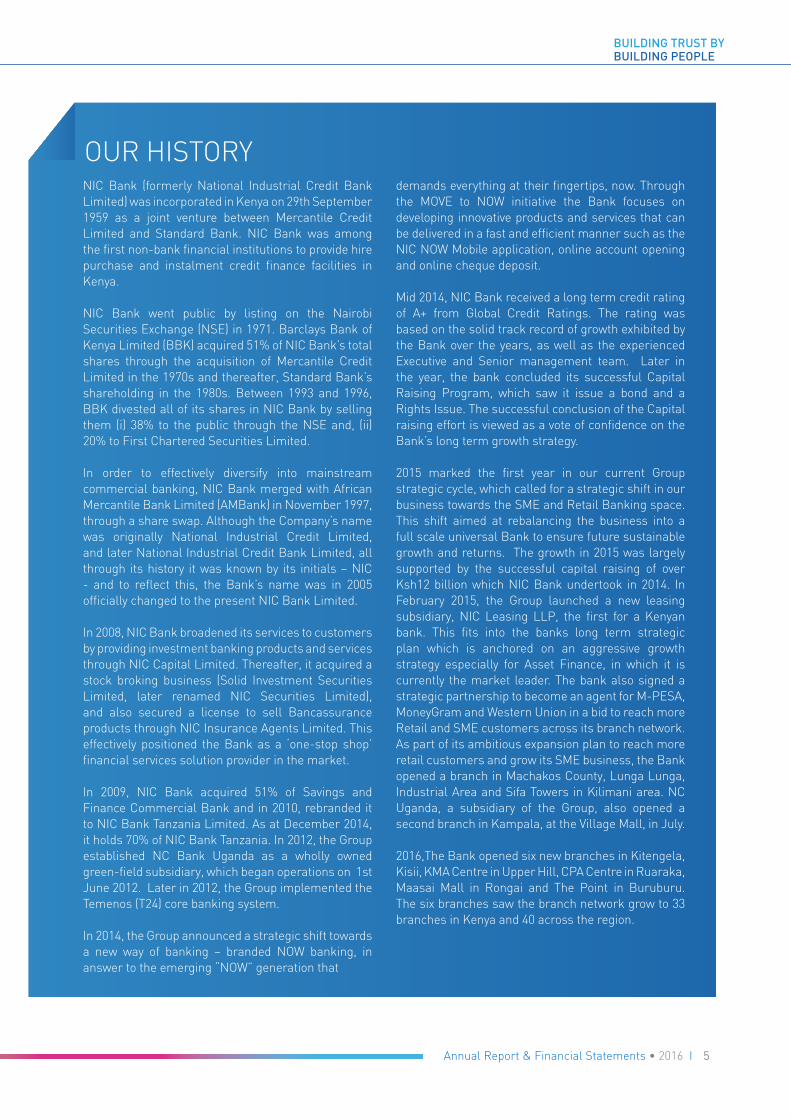
OUR HISTORY NIC Bank (formerly National Industrial Credit Bank Limited) was incorporated in Kenya on 29th September 1959 as a joint venture between Mercantile Credit Limited and Standard Bank. NIC Bank was among the first non-bank financial institutions to provide hire purchase and instalment credit finance facilities in Kenya.
NIC Bank went public by listing on the Nairobi Securities Exchange (NSE) in 1971. Barclays Bank of Kenya Limited (BBK) acquired 51% of NIC Bank’s total shares through the acquisition of Mercantile Credit Limited in the 1970s and thereafter, Standard Bank’s shareholding in the 1980s. Between 1993 and 1996, BBK divested all of its shares in NIC Bank by selling them (i) 38% to the public through the NSE and, (ii) 20% to First Chartered Securities Limited.
In order to effectively diversify into mainstream commercial banking, NIC Bank merged with African Mercantile Bank Limited (AMBank) in November 1997, through a share swap. Although the Company’s name was originally National Industrial Credit Limited, and later National Industrial Credit Bank Limited, all through its history it was known by its initials – NIC - and to reflect this, the Bank’s name was in 2005 officially changed to the present NIC Bank Limited.
In 2008, NIC Bank broadened its services to customers by providing investment banking products and services through NIC Capital Limited. Thereafter, it acquired a stock broking business (Solid Investment Securities Limited, later renamed NIC Securities Limited), and also secured a license to sell Bancassurance products through NIC Insurance Agents Limited. This effectively positioned the Bank as a ‘one-stop shop’ financial services solution provider in the market.
In 2009, NIC Bank acquired 51% of Savings and Finance Commercial Bank and in 2010, rebranded it to NIC Bank Tanzania Limited. As at December 2014, it holds 70% of NIC Bank Tanzania. In 2012, the Group established NC Bank Uganda as a wholly owned green-field subsidiary, which began operations on 1st June 2012. Later in 2012, the Group implemented the Temenos (T24) core banking system.
In 2014, the Group announced a strategic shift towards a new way of banking – branded NOW banking, in answer to the emerging “NOW” generation that
demands everything at their fingertips, now. Through the MOVE to NOW initiative the Bank focuses on developing innovative products and services that can be delivered in a fast and efficient manner such as the NIC NOW Mobile application, online account opening and online cheque deposit.
Mid 2014, NIC Bank received a long term credit rating of A+ from Global Credit Ratings. The rating was based on the solid track record of growth exhibited by the Bank over the years, as well as the experienced Executive and Senior management team. Later in the year, the bank concluded its successful Capital Raising Program, which saw it issue a bond and a Rights Issue. The successful conclusion of the Capital raising effort is viewed as a vote of confidence on the Bank’s long term growth strategy.
2015 marked the first year in our current Group strategic cycle, which called for a strategic shift in our business towards the SME and Retail Banking space. This shift aimed at rebalancing the business into a full scale universal Bank to ensure future sustainable growth and returns. The growth in 2015 was largely supported by the successful capital raising of over Ksh12 billion which NIC Bank undertook in 2014. In February 2015, the Group launched a new leasing subsidiary, NIC Leasing LLP, the first for a Kenyan bank. This fits into the banks long term strategic plan which is anchored on an aggressive growth strategy especially for Asset Finance, in which it is currently the market leader. The bank also signed a strategic partnership to become an agent for M-PESA, MoneyGram and Western Union in a bid to reach more Retail and SME customers across its branch network. As part of its ambitious expansion plan to reach more retail customers and grow its SME business, the Bank opened a branch in Machakos County, Lunga Lunga, Industrial Area and Sifa Towers in Kilimani area. NC Uganda, a subsidiary of the Group, also opened a second branch in Kampala, at the Village Mall, in July.
2016,The Bank opened six new branches in Kitengela, Kisii, KMA Centre in Upper Hill, CPA Centre in Ruaraka, Maasai Mall in Rongai and The Point in Buruburu. The six branches saw the branch network grow to 33 branches in Kenya and 40 across the region.

6 I Annual Report & Financial Statements • 2016
BUILDING TRUST BYBUILDING PEOPLE
OUR KEY MILESTONES
2005»
1959
1995
1997
2005
2006
2009
2012
2014
2015
National Industrial Credit Bank Limited incorporated in Kenya
National Industrial Credit Bank Limited merges with African Mercantile Bank Limited
NIC introduces Investment Banking (NIC Capital) and Securities Brokerage services (NIC Securities)
Started operation in Uganda, under the name NC Bank Uganda
Launch of Now Banking
Renamed NIC Bank Limited and developed into Regional“One Stop” Financial Services Shop
National Industrial Credit Bank Limited obtains Commercial Banking License
Establishment of NIC Leasing (LLP)
NIC Bank aquires a stake in Savings Finance Commercial Bank - Tanzania

7Annual Report & Financial Statements • 2016 I
BUILDING TRUST BYBUILDING PEOPLE
OUR STRUCTURE
Post Reorganisation Structure
Pre- Reorganisation Structure
Group Reorganisation:
The Company intends to reorganise to achieve a group structure that has a listed non-operating holding company which
holds:
(a) a subsidiary that is licensed to undertake banking business in Kenya;
(b) subsidiaries that engage in non-banking activities in Kenya; and
(c) subsidiaries licensed to undertake banking businesses in other jurisdictions.
The group has received regulatory approval for the non-operating company NIC Group PLC and a license for the new operating
company NIC Bank Kenya PLC. The group awaits final regulatory approval to complete reorganisation.
Merger of Investment Banking and Brokerage Businesses
The Group also intends to merge its brokerage business with its investment banking business in the next 12 to 24 months.
Presently, the brokerage business and the investment banking business are being undertaken by NIC Securities Limited (NIC
Securities) and NIC Capital Limited (NIC Capital) respectively. NIC Capital is a wholly owned private subsidiary of NIC Bank
and in turn owns NIC Securities. To achieve this merger, NIC Capital will transfer its business and assets to NIC Securities in
return for an allotment of shares. NIC Securities will upgrade its license to that of an investment bank and change its name
to “NIC Investment Bank Limited”.
KENYA PLC

8 I Annual Report & Financial Statements • 20168 I Annual Report & Financial Statements • 2016
CORPORATE BANKING SOLUTIONS
At NIC bank Limited, we strive to be leaders in Corporate Banking backed by our uniquely competent trade and corporate banking experts, wide correspondent banking network, a unique ability to handle your risk management.
We offer a competitive funding solution and an experienced team to help your business meet with success in each transaction. We can also help clients leverage non-traditional collateral for use to access liquidity. We customize our products and services to meet our clients’ specific account management, payments, collections and liquidity management requirements.
1. Corporate Loans
Term loans
Due to the long term nature of capital expenditure for companies, financing is required for a matching term. Revenue from projects and equipment on term funding is usually generated after completion hence the need to match repayments to the customers future cash flow.
Corporate Overdraft
This product caters for the financing of customers’ working capital cycle taking into account the lead times in procurement of stocks, the manufacturing process and any terms of supplier credit including credit extended to custom
2. Asset Finance
This is a credit facility that assists you to finance the purchase of vehicles, machinery and specialized equipment.
We offer the following financing options:
a. Hire Purchase (HP)
b. Leasing
c. Insurance Premium Finance (IPF)
d. Insurance Brokerage Services for assets purchased
BUILDING TRUST BYBUILDING PEOPLE
OUR PRODUCTS & SERVICES

9Annual Report & Financial Statements • 2016 I 9Annual Report & Financial Statements • 2016 I
Assets we finance
NIC Bank Asset Financing gives you the choice of both motor vehicle and non – motor vehicle financing. We have partnered with both new and second hand motor dealers to offer our customers the most competitive pricing in the market
We offer financing for the below:
Moveable & Identifiable assets such as;
• Saloon cars
• Commercial vehicles (Prime movers, trailers, distribution vans e.t.c)
• PSV vehicles ( Taxis, matatus, buses e.t.c)
• Plant & machinery (Installed at factories)
• Construction equipment (Bull dozers, cranes e.t.c.)
• Agricultural equipment
• Office equipment
• IT equipment (Only hardware)
• Other specialized equipment (Medical, telecoms)
3. Transactional Banking
NIC bank has a wide range of transactional banking services including cash management, trade financing, custodial services, online banking, mobile banking and agent banking.
Our consistent performance and commitment to innovation supports the delivery of tailored client solutions that aim to solve challenges at any stage of the business cycle.
Our cash management solutions
Enjoy easy access and transact from anywhere and at any time via our channels:
• Online Banking
• NIC Bank Branches
• Agency Banking (Postbank)
• Mobile Banking
• ATMs namely NIC Bank ATMs, PesaPoint and VISA affiliated ATMs
BUILDING TRUST BYBUILDING PEOPLE

10 I Annual Report & Financial Statements • 2016
BUILDING TRUST BYBUILDING PEOPLE
Enjoy total control of your account to allow for quick decision making. Invest, make payments, check your cash position and enjoy total control of your account:
• Access to online banking & international payments
• Access to local clearing
• Control over disbursements
• Standard payment templates
• Invest, trade, make payments, check account balances
• Pay utility bills
• KRA Payments - pay your customs duties and other taxes
Convenient collection channels
• Access to on – site cash
• Electronic Collections
• Cash- in - transit
• Online Cheque Collections
• Mobile Collections via Paybill
Trade Finance Solutions
The East African Community (EAC) has become important in the continent’s trade economy. With the current emphasis on the need to promote intra-regional trade, coupled with increased volumes of trade in the various non-traditional sectors, while the global trade volumes have continued to shrink, there is need for an improved and readily accessible liquidity for trade supported by a robust trade risk management platform.
We at NIC bank Ltd strive to be leaders in trade finance backed by our uniquely competent trade and corporate banking experts, a wide correspondent banking network, and a unique ability to handle your trade risk management.
We offer competitive funding costs and an experienced team to help your business meet with success in each transaction. We can also help clients leverage non-traditional collateral for use to access liquidity. We customize our products and services to meet our clients’
specific account management, payments, collections and liquidity management requirements.
Our Trade Finance Solutions:
• Import and export financing.
• Pre-export financing.
• Documentary credits and collections.
• Contract pre-payment.
• Pre-production financing.
• Stock, storage and inventory financing.
• Receivables financing and invoice discounting.
• Export Credit Agency supported capital expenditure programs
• Insurance cover for your trade requirements through ATI
• Insurance Premium Financing for your trade needs
Custodial Services
We have been offering custodial services for the last 15 years to pension schemes and provident funds, unit trusts and high net worth corporates and have gained valuable experience as the industry evolved. Guided by the RBA Act (1997) and Regulations (2000) as well as the CMA Act, we have been able to successfully perform all the Custody duties as expected in both Acts, while accommodating
BUILDING TRUST BY BUILDING PEOPLE

11Annual Report & Financial Statements • 2016 I
BUILDING TRUST BYBUILDING PEOPLE
client-specific requirements based on our relationship. Our role as Custodians will be to ensure that all assets under our care are properly controlled and that they are only released from safekeeping in accordance with authorized instructions from our customers or appointed representatives.
The range of services to be provided will include:-
• Settlement of trades
• Safe keeping of securities
• Portfolio valuations
• Reporting and communications
• Inward and outward remittances (cash transfers)
• Foreign exchange conversion
Registration of securities
• Corporate actions
• Income collection
• Tax reclamation
Treasury
• Cash transactions or Bureau De Change
• Fixed and Call deposits
• Spot FX Operations
• Inward foreign remittances
• Outward foreign remittance
• Foreign Demand Drafts
• FX Accounts
• Forward Exchange Contract
• Foreign Exchange Swaps
We help you create the strategy to fit your liquidity management and Forex requirements, and risk appetite. After defining the initial strategy, we monitor and advise you on market fluctuations, investments and hedging of currency exposure to improve your returns and portfolio diversification.
• Dedicated team of product specialists with strong markets background.
• Direct market trading access, offering immediate pricing and execution.
• 24 hour execution coverage in a broad number of products.
From Forex to fiduciaries and spots to swaps
Our specialist knowledge and access to in-depth market research and technical analysis ideally equips us to advise you on a broad range of products, including: • Savings/Liquidity accounts, time deposits and fiduciaries. • Spots,forwards and swaps in foreign exchange and
precious metals. • Forex margin trading. • Over-the-counter plain vanilla and exotic options.
• Listed securities execution: bonds, equities and funds. • Tailor-made structured products linked to Forex, interest
rates and equities.
4. Institutional Banking
Institutional Banking is a dedicated arm of Corporate Business within the Bank that focuses on meeting the liability management and service delivery needs of the Bank’s non-borrowing Corporates and Not for Profit Organizations.
Institutional Banking Department boasts an experienced team of Relationship Managers with the requisite skills and knowledge to give dedicated attention to customers in the following market segments:
• The Faith Based Organizations
• Local and International Non-Governmental Organizations
• Diplomatic Missions and their affiliate Donor / Aid related entities
• Donor funded Government Parastatals and Government Ministries
• Medium to High Net Worth Individuals
Institutional Banking clients enjoy the following special facilities:
a. Concessions on Current Account Charges
b. Loyalty Premium on Current Accounts
c. Deposit Accounts - Time and Call Deposits
d. Preferential Foreign Currency Conversion Rate
e. Transfer and Receipts of Funds: Inward and Outward Remittances
RETAIL BANKING SOLUTIONS
1. Personal Banking
Our Personal Banking division recognizes that “people bank with their bankers and not their bank”. It is in this spirit that we offer personalized service to our individual customers by providing robust products and services. Our team of dedicated Relationship Managers are readily available to make your banking experience memorable and your financial goals more attainable.
NIC Personal Banking products range from current and savings accounts, personal loans, online and mobile banking solutions and so on. Our products and services offer you solutions that fit your life and make it easier to do what you need to and achieve what you want.

12 I Annual Report & Financial Statements • 201612 I Annual Report & Financial Statements • 2016
We offer a wide range of savings and current accounts which include:
NIC Savers Account:
This targets general customers with a keen interest on saving their money.
Young Movers Savings Account:
A child account specifically tailored to encourage saving on a regular basis, opened by parents and guardians.
All our savings accounts offer great benefits, are available in all major currencies and pay high interest rates.
Our current accounts come in two categories:
• Pay as you go/transact – The pay as you go option allows you to be in full control of the fees you pay on your account as you pay only for the services that you access.
• Flat fee/bundled options – The flat fee option allows you to pay one discounted flat fee for a wider range of services for all your transactional needs.
2. Mortgage
At NIC Bank we have a dedicated team of mortgage specialists to walk with you through the journey towards securing your dream home or property.
NIC Mortgage offers you a variety of options:
• Equity Release – Financing against your already existing house
• Purchase Financing – Financing to buy a readymade house
• Top-Up – Increase in value of your existing mortgage due to reduction of loan amount or appreciation of property value
• Balance Transfer/Refinance - Transfer of an existing mortgage from one financier to another
• Construction Finance – Loan that funds the building of a residential home or residence
• Plot Purchase – Financing to buy vacant land

13Annual Report & Financial Statements • 2016 I
BUILDING TRUST BYBUILDING PEOPLE
3. Credit Cards
NIC Bank Credit Cards offer flexibility and convenience in settling of daily transactions. Our cards can be used worldwide at any establishment with a VISA logo to make payments from the supermarket, chemist, fuel station, hospitals among others.
The best thing about our credit cards is that you do not need to have a bank account with us to own your credit card. Find the NIC Credit Card that’s right for your personal or business needs now.
We offer the following credit cards to suit your purchase needs:
• Freedom Credit Card
The NIC Freedom Credit Card is a modern and convenient financial tool that facilitates easy and convenient settlement of daily financial transactions. It gives you flexibility, convenience and security. The limit is as low as low as Shs. 20,000.
• The Gold Credit Card
The NIC Gold Credit Card delivers the financial freedom that you seek. This card is perfect for individuals who need to make higher financial transactions in the month while enjoying preferential services. The Gold credit card limit ranges between Shs. 200,000 and Shs. 1,000,000.
• The Platinum Credit Card
The NIC Visa Platinum Credit Card offers the best personal service and hand-picked privileges worldwide. The services attached to the card gives you access to a range of services that reflect your lifestyle and exquisite taste in dining, travel and shopping.
• The Prepaid Card
The NIC Prepaid card is a payment option which enables you to purchase goods and services, from Point Of Sale and also online both locally and internationally, without necessarily having a bank account.
Below are the features of the NIC Prepaid Cards:
a. The NIC Multicurrency Prepaid Card
- Available in USD, EUR and KES all in one card
- Reloadable in any of the above currencies
b. The NIC Prepaid Gift Card
- Available only in Kenya Shillings
- Not reloadable and is perfect for gifting
• The Kenya Red Cross Card
NIC Bank and the Kenya Red Cross Society (KRCS) have partnered to give customers the opportunity to give back to society through the NIC Bank-Kenya Red Cross Credit Card. The VISA enabled card automatically gives existing and non-existing members the opportunity to sign up and donate to the humanitarian efforts nationwide. In addition, the co-branded card offers access to VIP lounges for international flights at the two main airports in Kenya, JKIA and Moi International Airport, at no additional cost.
4. SME Banking
• NIC Entrepreneur Account
This is a contemporary business account that provides customized business solutions for clients’ business needs. The NIC Bank Entrepreneur Account is designed to give clients a total solution for all their business needs ranging from transactional, cash flow management, insurance, asset finance to savings and investments.
This account also gives you access to the NIC Entrepreneur Club. The club regularly hosts workshops that bring together business people across industries. At the workshops, clients network and receive valuable training on emerging issues and needs.

14 I Annual Report & Financial Statements • 2016
BUILDING TRUST BYBUILDING PEOPLE
We offer a wide range of SME products including the following:• Business Accounts• Business Loans• Overdrafts• Term Loans• Working Capital• Entrepreneur Club Membership
NIC BANK SUBSIDIARIES
1. Investment Banking through NIC Capital
NIC Capital is a subsidiary of NIC Bank and has its origins in 2005 when the Board of Directors resolved to establish an Investment Bank that would support the ever growing advisory and financing needs of Kenyan corporates. NIC Capital, through its debt and equity platforms, advises companies on optimal capital raising alternatives. The Investment Bank is qualified in mergers & acquisitions, de-mergers, sale of stake, capital structure advisory as well as in pursuing capital raising initiatives – both in the private and public realms.
2. Stock Brokerage through NIC Securities
NIC Securities is a stock brokerage firm licensed by the Capital Markets Authority and a member of the Nairobi Securities Exchange. NIC Securities provides investors with a secure platform to participate in a diversified array of investments in the equity and bond markets, backed by solid advice from the research and advisory teams, to enable clients meet their return objectives.
3. Bancassurance through NIC Insurance Agents
We offer insurance for all through our insurance brokerage function available at all the Group’s branches. Products on offer include Health Insurance i.e. inpatient and outpatient medical covers; Business
Risks Insurance which covers property damage, Group Personal Accident covers; Travel Insurance which covers medical expenses, loss of luggage, and emergency evacuation for travellers; Home Insurance for household property including personal effects and Motor Vehicle Insurance for both private and commercial vehicles.
4. NIC Leasing LLP
NIC Leasing LLP is a partnership between NIC Bank Limited and Mercantile Finance Company Limited and is part of the NIC Bank Group. The LLP was incorporated in 2015 to undertake direct operating lease business. NIC Leasing LLP allows customers to take up various types of assets on lease over specified periods of time. Maintenance and insurance are part of the lease structuring therefore providing flexibility and convenience for the customer.
The customers therefore get to enjoy the use of the assets and derive benefits over the contractual period.
Types of Leases that we offer:
a. Direct Lease
New purchases lessor pays the supplier for the selected asset.
b. Sale and Lease Back
Lessor buys Asset from lessee (existing assets), Lessor pays the lessee and enters into lease agreement for same asset. Good in case of cash release from assets.
c. Back to Back Lease
Supplier enters into lease with lessor and leases the equipment to their customers – end lessee.
Good when supplier has special relationship with end lessee and items that need specialized after sales support.
15Annual Report & Financial Statements • 2016 I
BUILDING TRUST BYBUILDING PEOPLE
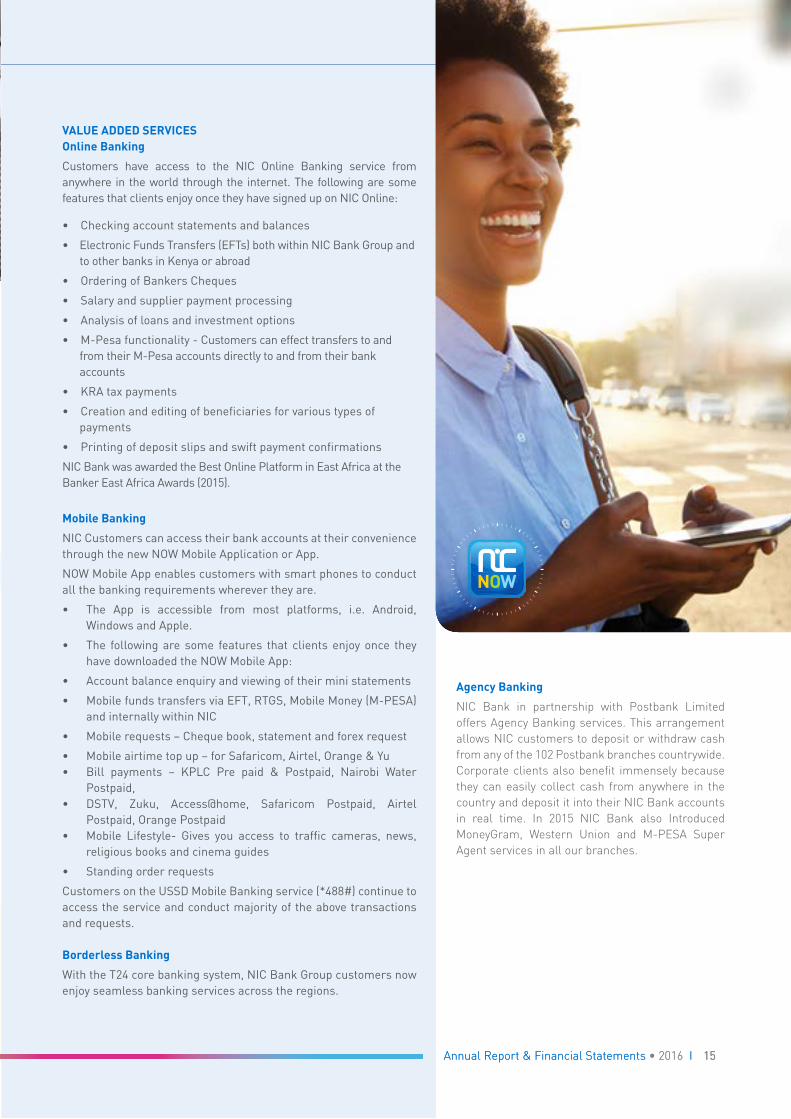
VALUE ADDED SERVICESOnline Banking
Customers have access to the NIC Online Banking service from anywhere in the world through the internet. The following are some features that clients enjoy once they have signed up on NIC Online:
• Checking account statements and balances
• Electronic Funds Transfers (EFTs) both within NIC Bank Group and to other banks in Kenya or abroad
• Ordering of Bankers Cheques
• Salary and supplier payment processing
• Analysis of loans and investment options
• M-Pesa functionality - Customers can effect transfers to and from their M-Pesa accounts directly to and from their bank accounts
• KRA tax payments
• Creation and editing of beneficiaries for various types of payments
• Printing of deposit slips and swift payment confirmations
NIC Bank was awarded the Best Online Platform in East Africa at the Banker East Africa Awards (2015).
Mobile Banking
NIC Customers can access their bank accounts at their convenience through the new NOW Mobile Application or App.
NOW Mobile App enables customers with smart phones to conduct all the banking requirements wherever they are.
• The App is accessible from most platforms, i.e. Android, Windows and Apple.
• The following are some features that clients enjoy once they have downloaded the NOW Mobile App:
• Account balance enquiry and viewing of their mini statements
• Mobile funds transfers via EFT, RTGS, Mobile Money (M-PESA) and internally within NIC
• Mobile requests – Cheque book, statement and forex request
• Mobile airtime top up – for Safaricom, Airtel, Orange & Yu • Bill payments – KPLC Pre paid & Postpaid, Nairobi Water
Postpaid, • DSTV, Zuku, Access@home, Safaricom Postpaid, Airtel
Postpaid, Orange Postpaid• Mobile Lifestyle- Gives you access to traffic cameras, news,
religious books and cinema guides
• Standing order requests
Customers on the USSD Mobile Banking service (*488#) continue to access the service and conduct majority of the above transactions and requests.
Borderless Banking
With the T24 core banking system, NIC Bank Group customers now enjoy seamless banking services across the regions.
15Annual Report & Financial Statements • 2016 I
Agency Banking
NIC Bank in partnership with Postbank Limited offers Agency Banking services. This arrangement allows NIC customers to deposit or withdraw cash from any of the 102 Postbank branches countrywide. Corporate clients also benefit immensely because they can easily collect cash from anywhere in the country and deposit it into their NIC Bank accounts in real time. In 2015 NIC Bank also Introduced MoneyGram, Western Union and M-PESA Super Agent services in all our branches.

16 I Annual Report & Financial Statements • 2016
BUILDING TRUST BYBUILDING PEOPLE
CONSOLIDATED STATEMENT OF FINANCIAL POSITION 2012 2013 2014 2015 2016Shs`000 Shs`000 Shs`000 Shs`000 Shs`000
Assets
Government securities 17,478,232 18,093,150 19,223,686 27,911,907 30,698,495
Loans and advances to customers 71,540,092 83,493,313 100,575,330 114,657,644 113,040,863
Property and equipment 1,009,891 1,119,264 1,079,110 1,063,760 1,043,497
Others 18,320,378 18,357,012 24,902,379 22,154,957 24,676,130
Total Assets 108,348,593 121,062,739 145,780,505 165,788,268 169,458,985
Liabilities
Customer Deposits 83,379,576 91,565,005 100,434,954 112,364,637 111,824,685
Line of credit 3,655,414 3,628,169 14,358,480 15,356,190 19,965,484
Other liabilities 5,831,981 8,300,659 7,636,358 11,721,299 7,323,452
Total Liabilities 92,866,971 103,493,833 122,429,792 139,442,126 139,113,621
Total Equity 15,481,622 17,568,906 23,350,713 26,346,142 30,345,364
Total Liabilities and Equity 108,348,593 121,062,739 145,780,505 165,788,268 169,458,985
CONSOLIDATED INCOME STATEMENT Interest income 11,467,574 11,642,416 13,711,068 17,014,132 19,020,675
Interest expense 5,983,706 4,374,437 5,712,949 7,271,599 6,852,078
Net interest income 5,483,868 7,267,979 7,998,119 9,742,533 12,168,597
Impairment on Loans and advances 297,485 1,092,873 329,133 1,652,475 3,749,530
5,186,383 6,175,106 7,668,986 8,090,058 8,419,067
Non-interest income 2,832,257 3,155,207 3,508,139 3,955,634 3,919,149
Operating income 8,018,640 9,330,313 11,177,125 12,045,692 12,338,216
Operating expenses 3,500,673 4,320,742 4,946,475 5,648,417 6,171,267
Profit before Tax 4,517,967 5,009,571 6,230,650 6,397,275 6,166,949
Income tax expense 1,481,173 1,772,270 2,113,976 1,912,150 1,836,553
Profit for the year 3,036,794 3,237,301 4,116,674 4,485,125 4,330,396
Less profit /(loss) attributable to non-controlling interests 52,388 (86,080) (4,181) 7,770 20,511
Profit attributable to equity holders of the Bank 2,984,406 3,323,381 4,120,855 4,477,355 4,309,885
Earnings Per Share (Shs) 6.03 6.12 7.07 7.00 6.73
Dividend Per Share (Shs) 1.00 1.00 1.00 1.25 1.25
OTHER DISCLOSURESNon-performing loans and advances a) Non-performing loans and advances 2,332,701 4,520,926 4,032,008 13,228,534 12,883,832
b) Allowance for impairment 1,652,986 2,592,033 2,680,360 2,776,627 5,022,089
c) Net Non-performing loans and advances (a-b) 679,715 1,928,893 1,351,648 10,451,907 7,861,743
Number of Employees 783 909 1001 1069 1095
Number of Branches 24 30 32 35 40
KEY PERFORMANCE INDICATORSReturn on capital employed (ROCE) 29.18% 28.51% 26.68% 24.28% 20.32%
Non-interest income to operating income 34.06% 30.27% 30.49% 28.88% 24.36%
Non-performing loans to total loans 3.26% 5.55% 4.01% 11.54% 11.40%
Return on total assets 4.17% 4.14% 4.27% 3.86% 3.64%
Cost to Income ratio 42% 41% 43% 41% 38%
FIVE YEAR FINANCIAL REVIEW

17Annual Report & Financial Statements • 2016 I
BUILDING TRUST BYBUILDING PEOPLE
FIVE YEAR FINANCIAL REVIEW

18 I Annual Report & Financial Statements • 2016
BUILDING TRUST BYBUILDING PEOPLE
FIVE YEAR FINANCIAL REVIEW

19Annual Report & Financial Statements • 2016 I

20 I Annual Report & Financial Statements • 2016
BUILDING TRUST BYBUILDING PEOPLE
Operating Environment in 2016
The three markets of Kenya, Uganda and Tanzania in which the Group operates, experienced relatively stable economic environments in 2016 despite headwinds in the second half of the year.
Kenya’s GDP is reported to have grown at 5.8% in 2016. This growth can be attributed to lower oil prices, supportive monetary policy, a rebound in the tourism sector and on-going infrastructure projects.
The Kenyan Shilling remained stable over the course of the year, averaging at 101.5 against the dollar largely supported by a narrowing current account deficit, as a result of lower petroleum prices, reduced imports of machinery & equipment and higher diaspora remittances. However, towards the end of the year, the Kenya Shilling reached a low of 102.5 following a federal rate hike in the US and a surge in year-end demand by importers. This warranted regular Central Bank of Kenya (CBK) intervention which comprised of increased US dollar sales and the mopping up of excess liquidity in the local market. Inflation significantly declined to 6.35% in December 2016 from 8.01% in December 2015 on the back of lower food and fuel inflation owing to a stable currency and adequate rains in the March to May long rains season. However below average rains in the October to December season will result in upward inflationary pressure in 2017.
Tanzania’s GDP growth remained strong at an estimated 7%, the second fastest in sub-Saharan Africa according to the World Bank. This was attributed to increased public consumption together with growth in the construction, communication, financial services and mining sectors. Inflation at the beginning of the year started at a high of
6.5% in January due to higher domestic food prices and lagged effects of the Tanzanian Shilling’s depreciation before declining to the inflation target of 5% in December 2016 on food deflation. The economy is expected to continue its growth trajectory in 2017 owing to the commencement of key infrastructure projects such as the expansion of the port of Dar es Salaam and the upgrade of the Central Line Railway to Standard Gauge.
Uganda on the other hand, experienced slower than projected growth in the range of 4.5% to 5% during the financial year 2015/16 due to a slowdown in private sector activity during the election period and declining commodity prices. Lower oil prices slowed down investment in Uganda’s nascent oil and gas sector while lower export revenues due to civil war in its key export market of South Sudan, resulted in reduced consumption spending and limited public investment. However, 2017 bodes a more positive outlook for Uganda as private sector activity picks up following the electoral cycle and a modest rebound in global commodity prices. In addition, the service and industrial sectors continue to drive growth, gradually easing the burden on the agricultural sector.
Overall, the region is making good headway in implementing major infrastructural projects. In Kenya, the first phase of the Standard Gauge Railway (SGR) from Mombasa to Nairobi, which should lower the cost of doing business in East Africa is essentially complete with Phase 2 already underway. In Uganda, the Karuma and Isimba dams which are expected to double power output are set for completion in 2018. Tanzania is also set to tap its vast natural gas reserves with the immediate use being to boost electricity generation, helping reduce the over-reliance on hydroelectricity.
FROM THECHAIRMAN’SDESKJAMES NDEGWA
Dear Shareholders,
I am pleased to present the NIC Bank Group Annual Report and Financial Statements for the year ended 31 December 2016.
Despite a challenging and subdued business environment, NIC Bank has remained resilient. In line with its Strategy, the Bank has been able to return a solid performance, especially in the key focus segments of Retail, SME and Asset Finance.

21Annual Report & Financial Statements • 2016 I
BUILDING TRUST BYBUILDING PEOPLE
CHAIRMAN’S STATEMENT
The Kenyan Banking Sector
The banking sector continues to play a key role of fostering economic growth. The sector is the largest private sector formal employer in the country and banks are amongst the largest contributors of corporate tax in Kenya. Furthermore, the Kenyan banking sector has set up more cross border operations than any other sector in East Africa, flying the Kenyan flag high across the entire East Africa community.
Against this vibrant background the signing into law of the Banking (Amendment) Act, 2016, which came into effect on 14th September 2016 marked a watershed moment for the sector. The Act introduced controls on the interest rates that banks can charge on loans and pay on deposits, and its assent into law has resulted in many banks reconfiguring their business models and reassessing their risk appetite, which has resulted in a slowdown in credit extension across the market.
The slowdown in credit, coupled with a challenging business environment has resulted in a growth in Non-Performing Loans (NPLs) across the sector. As at December 2016, the ratio of Gross NPLs to Gross Loans has increased to 9.1% from 6.8% a year earlier.
The last 2 years have been very challenging for the banking sector, with three banks being placed under receivership. These unfortunate events have served to erode consumer confidence in the banking sector. Despite these challenges, we remain optimistic and supportive of the increased oversight and interventions introduced by the Central Bank of Kenya over the last year as we believe these changes will certainly enhance governance and restore consumer confidence in the sector.
Profitability & Dividend Payout
Given the Group’s performance over the course of 2016, during which, despite the need to make significant additional provisions and the challenging environment, it recorded consistent operating profit growth quarter on quarter to end the year with a profit before tax of Shs. 6.2 billion, the Board of Directors recommended a dividend of Shs. 1.25 per share.
This amounts to a total dividend pay-out of Shs. 800 million, similar to the prior year pay-out and is in line with the Bank’s strategy to maintain sufficient levels of capital reserves through retained earnings.
Employees
During the year, the Group conducted a review of its workforce as a result of the changes in the operating environment. The review resulted in 40 positions across the Group in Kenya being eliminated as we streamlined our business operations. We are confident that the
changes we have made to our staffing model will not hamper or affect the standard of service we offer to our customers nor our ability to achieve our strategic targets in 2017 and beyond. By the end of the year the workforce stood at 1,095 compared to 1,069 in 2015.
The Group continues to actively refine and enhance its employee reward and retention practices to be the ‘Employer of Choice’ as we compete for the best talent in a highly competitive market.
Subsidiaries
The growth and development of our subsidiary companies remains a key strategic objective and one that is aimed at both broadening the range of financial services offered to customers and enhancing earnings diversity in the NIC Bank Group.
The Bank continued with its strategy to increase the contribution from the subsidiaries’ in the year under review. I am pleased to report that NC Bank Uganda, NIC Bank Tanzania, NIC Securities and NIC Insurance Agency (Bancassurance) all contributed positively to the Group’s financial performance in 2016.
Group Reorganisation
In 2016, the Group took a strategic decision to reorganise and create a Non-Operating Holding Company that will hold both banking and non-banking subsidiaries. This is part of the Group’s strategy to expand the scale and scope of operations of its subsidiary companies alongside growing its banking business and brings the Group in line with international best practice, aligned to CBK’s banking regulations of 2013.
On 11th October 2016, at an Extraordinary General Meeting (EGM), Shareholders passed the required resolutions to reorganise the business which will lead to NIC Bank Limited becoming the Non-Operating Holding Company and the creation of a new operating company to be named NIC Bank Kenya PLC. This move will enable the Group to operate and utilise its capital more efficiently while having minimal impact on shareholders, regulators, employees and our customers.
The process is expected to be completed in the second quarter of 2017.
Corporate governance
NIC Bank Group adheres to the highest standards of corporate governance. We continuously review our corporate governance structures in line with existing and emerging regulatory requirements. Our continuous focus on maintaining high governance standards resulted in NIC Bank being recognised as the winner in the Finance and Investments Category at the Champions of Governance

22 I Annual Report & Financial Statements • 2016
BUILDING TRUST BYBUILDING PEOPLE
CHAIRMAN’S STATEMENT (Continued)
Awards. Our Group structures and processes are outlined in greater detail later in this report.
Citizenship
We believe that we can only succeed by partnering with and supporting the communities in which we operate. Our business places the right balance of focus on both the financial performance of our franchise and our role as a good citizen in our communities.
In 2014, the Bank launched a robust three-year Citizenship strategy hinged on four key pillars: Education, Innovation, Health and Humanitarian Assistance/Emerging Business Needs.
In 2016, under the Education pillar, the Bank continued its partnership with the Edumed Trust and the Palm House Foundation. The Bank also continued with its partnership with the Kenya Community Development Foundation (KCDF) where male NIC Bank staff continued to mentor young male students at Upper Hill Boys High School. We have partnered with Dr. Choksey Albinism Foundation to support the plight of the Albino through provision of education and employment opportunities.
The Bank continued with its University Internship Programme, which was started in 2015. Since the inception of the programme we have trained and prepared over 70 interns for demands of the work place. All the interns have landed a job at the end of the training.
Under the Innovation pillar, the Bank enhanced its engagement with Junior Achievement with the roll out of the University Innovation Challenge. The Bank also partnered with the Kenya Red Cross in 2016 to launch a co-branded credit card. This first in the market allows card holders to contribute directly to the Kenya Red Cross humanitarian efforts each time they swipe their cards.
The Group continued with its sponsorship of the NIC Bank T20 Cricket Cup which is an annual Mombasa Cricket tournament. The tournament has proven to be extremely successful and brings together young and talented players from all over Mombasa. We believe that through sports we can enhance both the Education and Health pillars.
Outlook
We expect 2017 to be a challenging year defined by the upcoming election in Kenya, drought in the first quarter after poor short rains in October to December 2016 and increased global uncertainties. Furthermore, we expect the full impact of the Banking (Amendment) Act, 2016 to come into play in 2017, which will undoubtedly have an impact on the Group’s financial performance.
Despite these headwinds we remain steadfast in our ambition to grow our franchise, especially in the focus areas of Retail, SME and Asset Finance.
NIC Bank remains an innovative institution. Already the Bank has embarked on a process to ensure we are fit for the future. The Bank is cognisant it is no longer business as usual and will need to adopt new ways of doing business to survive the competitive environment it operates in.
NIC Bank Group launched a new culture, which was a culmination of an intensive engagement process with staff aimed at redefining a winning culture that creates unity of purpose and positions the organization as an employer of choice. This process dubbed the Trail Blaze Culture led to a redefinition of the Group’s vision to “Building Prosperity Together”. The values were also redefined and given new meaning to reflect the desired behaviours expected of all staff. The launch was conducted across Kenya, Uganda and Tanzania.
The Board is keen to support innovation across the Group, and working with management, shall continue to prioritise technology investments to ensure NIC Bank meets customers’ needs and adds value to our customer’s lives.
Appreciation
We would not be where we are today without the consistent, unwavering support of our various stakeholders.
The Board, Management and Staff highly appreciate the support of our over 25,000 shareholders. Their support has allowed the Group to continue making critical investments to ensure future growth.
Our customers are the reason for our business. We do not take their support for granted and continually strive to be worthy of the trust bestowed on us.
We also remain highly appreciative of our business partners and the regulators who continue to provide invaluable support, not just in Kenya, but across the region where we have a presence.
On behalf of the Board, I wish to thank each and every employee of NIC Bank Group for playing their part in making 2016 a successful year despite the considerable challenges that it presented.
Finally, I thank my fellow Directors for their contribution and commitment to the Group at both Board and committee levels.
J P M Ndegwa
Chairman

23Annual Report & Financial Statements • 2016 I
BUILDING TRUST BYBUILDING PEOPLE
TAARIFA YA MWENYEKITI
Enyi Wenyehisa wapendwa,
Nina furaha kuwasilisha kwenu Ripoti ya Mwaka na ya Kifedha ya Shirika la Benki ya NIC ya mwaka unaomalizikia tarehe 31 Disemba 2016.
Pamoja na kuweko kwa mazingira yenye changamoto ya kibiashara, Benki ya NIC imezidi kuwa kakamavu. Kwa mujibu wa Mkakati wake, Benki hii imeweza kudhihirisha utendaji imara, hasa katika vitengo muhimu vya Rejareja, SME na Utoaji fedha za Rasilimali.
Mazingira ya Utekelezaji Shughuli katika 2016
Kwenye masoko matatu ya Kenya, Uganda na Tanzania ambako Kundi hili hutekeleza shughuli zake, kulikuwa na hali tulivu ya kibiashara katika 2016 licha ya kuweko kwa mawimbi ya msukosuko katika nusu ya pili ya mwaka.
Pato la Taifa la Kenya (GDP) liliripotiwa kukuwa kwa kima cha 5.8% katika 2016. Ukuaji huu unaweza kuhusishwa na kupungua kwa bei ya mafuta, kuweko kwa sera za kifedha zinazoleta afueni, kufufuka tena kwa sekta ya utalii na miradi ya miundombinu inayoendelea humu chini.
Shilingi ya Kenya ilibaki imara katika kipindi cha mwaka tunaoutazama, ikiwa na wastani wa 101.5 dhidi ya dola hasa zaidi ikisaidiwa na na kupungua kwa nakisi ya akaunti ya current, kutokana na kwenda chini kwa bei ya petroli, kupunguza uagizaji wa mashine na vifaa kutoka nje na fedha kutoka kwa wanaoishi ughaibuni. Hata hivyo, ilipokaribia mwisho wa mwaka, thamani ya shilingi ya Kenya ilifikia kiwango cha chini 102.5 kufuatia kupandishwa kwa kiwango cha ubadilishanaji na Serikali ya Marekani na kuongezeka kwa mahitaji na waagizaji mwishoni mwa mwaka. Hii ilisababisha uingiliwaji wa kati na Benki kuu ya Kenya (CBK) ambako kulijumuisha kuongeza kwa mauzo ya Dola za Marekani na ukusunyaji wa ukwasi wa ziada katika soko la humu nchini. Mfumuko wa bei kwa kiasi kikubwa ulipungua kwa 6.35% katika Disemba 2016 kutoka 8.01% katika Disemba 2015 nyuma yake kukiwa na kupungua kwa bei ya chakula na mfumuko wa bei ya mafuta kutokana na kuimarika kwa fedha na kunyesha kwa mvua ya kutosha msimu wa mvua kubwa wa Machi na Mei. Hata hivyo mvua ya kiwango cha wastani katika msimu wa Oktoba hadi Disemba kutasababisha shinikizo la mfumuko zaidi wa bei katika 2017.
Ukuaji wa Pato la Taifa nchini Tanzania (GDP) uliendelea kuimarika kwa kima cha 7%, ikiwa ni ukuaji wa pili kasi zaidi kote katika Afrika Kusini mwa jangwa la Sahara kwa mujibu wa Benki kuu ya Dunia. Hili lilitokana na kuongezeka kwa matumizi ya umma pamoja na ukuaji katika ujenzi, sekta za mawasiliano, huduma za fedha na ya madini. Mfumuko wa bei katika mwanzo wa mwaka kulianza kwa kiwango kikubwa cha 6.5% mnamo Januari kutokana na bei ya juu ya chakula ya ndani na madhara ya kushuka kwa thamani Shilingi ya Tanzania kabla ya kupungua kwa mfumuko wa bei uliotarajiwa wa 5% katika Desemba ya 2016 wa kupungua
kwa chakula. Hali ya uchumi inatarajiwa kuendelea kuimarika katika 2017 kutokana na kuanzishwa kwa miradi mikubwa ya muundomsingi kama vile upanuzi wa bandari ya Dar es Salaam na uboreshwaji wa njia kuu ya Reli kuwa ya kisasa ya Standard Gauge
Kwa upande mwingine Uganda, ilishuhudia upunguaji kasi ya ukuaji kinyume na ilivyotarajiwa katika kiwango cha 4.5% hadi 5% katika kipindi cha mwaka wa kifedha wa 2015/16 kutoka na kufifia kwa shughuli katika sekta ya kibinafsi katika kipindi cha upigaji kura na kupungua kwa bei za chakula. Bei ya chini ya mafuta ilipunguza kasi ya uwekezaji katika changa ya mafuta na gesi ya Uganda wakati ambapo mapato ya kuuza bidhaa nje ya nchi yakipungua kutokana na vita vya wenyewe kwa wenyewe katika soko lake muhimu la Sudan Kusini, kukisababisha kupungua kwa gharama za matumizi na uwekezaji mdogo wa umma. Hata hivyo, 2017 inakaribisha mtazamo chanya zaidi kwa Uganda ambapo shughuli za sekta kibinafsi zinaimarika kufuatia mzunguko wa uchaguzi na kupata afueni kidogo kwa bei za bidhaa kimataifa. Aidha, sekta za huduma na viwanda zinaendelea kuchochea ukuaji, hatua kwa hatua ikipunguza mzigo katika sekta ya kilimo.
Kwa ujumla, eneo hili linapata mafanikio mazuri katika utekelezaji wa miradi mikubwa ya miundombinu. Nchini Kenya, awamu ya kwanza reli ya kisasa ya Standard Gauge Railway (SGR) kutoka Mombasa hadi Nairobi, ambayo inatarajiwa kupunguza gharama za kufanya biashara katika Afrika Mashariki kimsingi imekamilika na tayari awamu ya pili sasa imeanzishwa. Katika Uganda, mabwawa ya Karuma na Isimba ambayo yanayotarajiwa kuongeza maradufu utoaji nguvu za umeme yatakamilika katika 2018. Tanzania is also set to tap its vast natural gas reserves with the immediate use being to boost electricity generation, helping reduce the over-reliance on hydroelectricity. Tanzania pia inatarajiwa kuchimbua gesi yake asilia ambayo kubwa kwa matumizi mara moja ili kuongeza uzalishaji nguvu za umeme, na kusaidia kupunguza utegemewaji nguvu za kawi kutokana na maji.
Sekta ya Benki ya Kenya
Sekta na benki inaendelea kutekeleza jukumu muhimu la kuimarisha ukuaji wa uchumi. Sekta hii ndio kubwa zaidi ya kibinafsi muajirihapa nchini na benki ndio miongoni mwa mashirika yanayochangia pakubwa katika ulipaji kodi ya mashirika hapa Kenya. Zaidi ya hayo, sekta ya benki ya Kenya imeanzisha operesheni ya shughuli zaidi zinazovuka mipaka kuliko sekta nyingine yoyote katika Afrika Mashariki, ikipeperusha juu bendera ya Kenya kote katika jumuiya ya Afrika Mashariki.
Kukiwa na hali hii chanagmfu, kule kusainiwa kwa sheria ya Benki (Marekebisho), ya 2016, ambayo ilianza kutumika tarehe 14 Septemba 2016 kulirekodiwa kama mwanzo wa muda mgumu kwa sekta hii. Sheria hii ilileta usimamizi wa viwango vya riba ambayo benki zitakubaliwa kutoza kwa

24 I Annual Report & Financial Statements • 2016
BUILDING TRUST BYBUILDING PEOPLE
TAARIFA YA MWENYEKITI (Inaendelea)
mikopo zinazotoa na malipo kwa amana, na kuidhinishwa kwake kuwa sheria kukisababisha benki nyingi kuunda upya mifumo ya biashara zao na kutathmini upya hamu ya mashaka, jambao ambalo limeleta upunguaji kasi wa kueneza utoaji mikopo kote katika soko hili.
Kushuka kwa utoaji mikopo, pamoja na kuwepo kwa mazingira ya kibiashara yenye changamoto yakisababisha ukuaji wa Mikopo isiyotarajiwa kulipwa (NPLs) kote katika sekta. Kufikia Desemba 2016, uwiano wa Pato la ghafi la NPLs kwa Pato la Mikopo ghafi likiongezeka kwa 9.1% kutoka 6.8% katika mwaka uliotangulia.
Miaka 2 iliyopita ilikuwa na changamoto sana kwa sekta ya mabenki, huku benki tatu zikiwekwa chini ya ufilisi. Matukio haya ambayo sio mazuri yaliwahi kudororesha matumaini ya wateja katika sekta ya benki. Licha ya changamoto hizi, bado sisi tuko na matarajio makubwa na tunaunga mkono juhudi za usimamizi ziilizoanzishwa na Benki Kuu ya Kenya mwishini mwa mwaka kwa vile tunaamini mabadiliko haya bila shaka yataboresha usimamizi na kurejesha matumaini ya wateja katika sekta hii.
Faida na Malipo ya Mgao
Kutokana na matokeo ya Kundi katika kipindi cha 2016, wakati ambao, licha ya kuweko na haja ya kuongeza masharti na vigezo vya ziada na mazingira yenye changamoto tele, tulirekodi ukuaji imara wa faida kutokana uendeshaji shughuli robo kwa robo ya mwisho wa mwaka kukiwa na faida kabla ya kulipa kodi ya Shs. bilioni 6.2, Bodi ya Wakurugenzi inapendekeza mgao wa Shs. 1.25 kwa kila hisa.
Hii ni sawa na jumla ya malipo ya mgao ya kiasi cha Shs. milioni 800, sawa na mwaka malipo ya mwaka uliotangulia na kulingana na mkakati Benki wa kudumisha viwango vya kutosha vya hifadhi ya mtaji wetu.
Wafanyikazi
Katika mwaka huo tunaoukariria, Kundi lilifanya tathmini ya idadi ya wafanyakazi wake kutokana na mabadiliko yaliyopo katika mazingira ya uendeshaji shughuli. Ukaguzi huo ulisababisha kuondolewa kwa nafasi 40 za kazi kote katika shirika nchini Kenya wakati tunapozidi kuboresha utekelezaji wa shughuli za biashara yetu. Tuna matumaini kuwa mabadiliko tuliofanya katika mfumo wetu wa uajiri hayatadhoofisha au kuathiri hali ya huduma tunazotoa kwa wateja wetu wala kuathiri uwezo wetu wa kufikia malengo yetu ya kimkakati ya mwaka 2017 na baadaye. Mwishoni mwa mwaka idadi ya wafanyikazi wetu ilisimama kwa 1,095 ikilinganishwa na 1,069 katika mwaka wa 2015.
Kundi linaendelea kuchangamkia uboreshaji na uongezaji wa zawadi kwa wafanyikazi wake na mipango kabambe ya kudumu na wafanyikazi ili tuwe “Muajiri Mteule” wakati ambapo tunapozidi kushindana kupata vipaji bora katika soko hili lenye ushindani mkubwa.
Kampuni tanzu
Ukuaji na maendeleo ya kampuni zetu tanzu bado ni muhimu kimkakati kwa lengo letu na inayodhamiria katika upanuzi wa sehemu mbali mbali za huduma za kifedha tunazotoa kwa wateja na kuboresha njia tofauti tofauti za mapato katika Shirika la Benki ya NIC.
Benki iliendelea kufuatilia mkakati wake wa kuongeza mapato kutoka kwa kampuni zake tanzu katika kipindi cha mwaka tunaouangazia. Nimejawa na furaha kuwaripotia kuwa Benki ya NIC Uganda, Benki ya NIC Tanzania, Shirika la NIC la Hati ya fedha na Shirika la uwakala wa Bima la NIC (Bancassurance) zote hizi zilichangia vyema katika Matokeo haya ya Kifedha ya Kundi katika mwaka wa 2016.
Kuundwa upya kwa Kundi
Katika 2016, Kundi hili lilichukua azimio la kimkakati la kuunda upya na kubuni Kampuni Kuu Shikilizi isiyo-tendaji itakayoshikilia kampuni zote tanzu za shughuli za benki na zile zisizo katika shughuli za benki. Hii ni sehemu ya mpango wa Kundi hili wa kupanua uwezo na upeo wa uendeshaji za makampuni yake tanzu pamoja na kukuza biashara ya benki na kuweka Kundi hili kuwa sambamba na mazoezi bora ya kimataifa, na pia kuwa na uwiano na kanuni za Benki Kuu ya Kenya (CBK) za 2013.
Mnamo tarehe 11 Oktoba 2016, katika Mkutano Mkuu Maalum (EGM), Wenyehisa walipitisha azimio lililohitajika la kupanga upya biashara hii yetu ambalo litapelekea Shirika la Benki ya NIC kuwa Kampuni Kuu Shikilizi isiyo-tendaji na kuundwa kwa kampuni mpya ya uendeshaji itakayojulikana kama NIC Bank Kenya PLC. Hatua hii itawezesha Kundi hili kufanya kazi na kutumia mtaji wake kwa ufanisi zaidi huku ikiwa na athari ndogo kwa wanahisa, wathibiti kanuni, wafanyakazi na wateja wetu.
Mchakato huu unatarajiwa kukamilika kwenye robo ya pili ya mwaka wa 2017.
Usimamzi wa Shirika
Kundi la Benki ya NIC linazingatia viwango bora na vya juu zaidi vya usimamizi wa shirika. Huwa tunatekeleza mapitio ya mara kwa mara ya vigezo vya usimamizi wa shirika kuambatana na mahitaji ya kanuni zilizopo na ibuka. Mtazamo wetu endelevu wa kudumisha viwango vya juu vya uongozi wa shirika ulisababisha Benki ya NIC kutambuliwa katika tuzo za Champions of Governance Awards na kuteuliwa mshindi wa kitengo cha Fedha na Uwekezaji (Finance and Investments Category). Mundo na utaratibu wa Kundi hili letu ni umefafanuliwa kwa undani zaidi baadaye kwenye ripoti hii.
Uraia
Tunaamini kuwa tunaweza tu kufanikiwa kwa kushirikiana na kusaidiana na jamii kwenye sehemu ambako tunaendesha shughuli zetu. Biashara yetu huhakikisha kuna mizania sawa ya kuzingatia mambo yote matokeo mazuri ya kifedha kwa biashara yetu na utekelezaji wa wajibu wetu kama raia mwema kwenye jumuiya zetu.

25Annual Report & Financial Statements • 2016 I
BUILDING TRUST BYBUILDING PEOPLE
TAARIFA YA MWENYEKITI (Inaendelea)
Katika mwaka wa 2014, Benki hii ilizindua mkakati wa miaka mitatu wa Uraia ulioegemezwa kwenye nguzo nne muhimu: Elimu, Ubunifu, Afya na Msaada wa kibidanamu / Mahitaji ibuka ya Biashara.
Katika 2016, chini ya nguzo ya Elimu, Benki hii iliendeleza ushirikiano wake na taasisi za utoaji ufadhili za Edumed Trust na Palm House Foundation. Benki hii vile vile iliendeleza ushirikiano wake na shirika la Kenya Community Development Foundation (KCDF) ambapo wafanyikazi waume wa Benki ya NIC waliendelea kuwashauri wanafunzi vijana wa kiume katika shuke ya upili ya wavulana ya Upper Hill Boys High School. We have partnered with Dr. Choksey Albinism Foundation to support the plight of the Albino through provision of education and employment opportunities. Tuna ushirikiano na shirika la Dr. Choksey Albino Foundation kusaidia ndugu zetu mazeruzeru kwa kuwapa fursa za elimu na ajira.
Benki iliendelea na mpango wake wa ukufunzi kwa wanafunzi wa Chuo Kikuu, ambao ulianza mwaka wa 2015. Tangu kuanzishwa kwa mpango tumefunza na kutayarisha wakufunzi zaidi ya 70 kuweza kukidhi mahitaji ya mahali pa kazi. Wakufunzi wote tayari wameajiriwa baada ya kukamilisha mafunzo hayo.
Chini ya nguzo ya ubunifu, Benki iliimarisha ushirikiano wake na Junior Achievement baada ya kuanzishwa kwa mashindano ya ubunifu ya Chuo Kikuu ya Innovation Challenge. Benki pia ilishirikiana na Shirika la Msalaba Mwekundu mwaka wa 2016 na kuzindua kadi za mikopo zenye chapa zote mbili. Hii ikiwa ni kwa mara ya kwanza katika soko kwa kuruhusu wamiliki wa kadi kuweza kuchangia moja kwa moja kwa juhudi za utoaji msaada ya kibinadamu za Shirika la Msalaba Mwekundu kila wakati wanapotumia kadi zao.
Kundi liliendeleza udhamini wake wa mchezo wa kriketi wa NIC Bank T20 Cricket Cup ambayo ni mashindano ya mchezo wa kriketi ya kila mwaka kule Mombasa. Mashindano haya yamedhihirisha kuwa na mafanikio makubwa na huleta pamoja vijana na wachezaji wenye vipaji kutoka kote mjini Mombasa. Tunaamini kuwa kupitia michezo tunaweza kuboresha nguzo zote mbili za Elimu na Afya.
Mtazamo wa siku zijazo
Tunatarajia mwaka wa 2017 kuwa mwaka wenye changamoto hii ikitokana na uchaguzi ujao nchini Kenya, ukame katika robo ya kwanza ya mawaka baada ya mvua ya msimu mfupi wa Oktoba hadi Desemba 2016 kuwa chache na kuongezeka kwa hali isiotabirika ya kimataifa. Zaidi ya hayo, tunatarajia athari kamili za Sheria za Benki (Marekebisho), za 2016 kupatikana katika mwaka wa 2017, jambo ambalo bila shaka litaathiri pakubwa utendaji wa kifedha wa Shirika hili.
Licha ya kuweko kwa hali hii ngumu sisi tungali imara katika kufuatilia nia yetu ya kukuza biashara hii, hasa katika maeneo tunayozingatia zaidi ya Benki rejareja, SME na Utoaji Fedha za Rasilimali.
Benki ya NIC Bank bado ni taasisi iliyojaa ubunifu. Tayari Benki hii imeanzisha mchakato wa kuhakikisha kuwa tuko katika hali muafaka tunapoelekea kwenye mustakabala wetu. Benki hii yatambua kuwa hali ya biashara sio ya kawaida tena na inahitajika kubuni njia mpya za kufanya biashara ili kuishi kwenye mazingira haya ya ushindani wa kibiashara.
Kundi la Benki ya NIC lilizindua utamaduni mpya wa kutekekeza shughuli, ambao kilele chake kilikuwa mchakato wa ushirikiano wa wafanyakazi kwa lengo la kuzindua upya desturi ya kujenga umoja wa ushirikiano kikazi na kufanya shirika hili kuwa muajiri bora teule. Utaratibu huu uliopewa jina la Trail Blaze Culture umesababisha kuwe na tafsiri mpya ya maono ya Kundi hili na kuwa “Kujenga Mafanikio Pamoja”. Maadili pia yalikaririwa upya na kupewa maana mpya ya kutafakari desturi inayotarajiwa kwa wafanyakazi wote. Uzinduzi huu ulifanyika katika Kenya, Uganda na Tanzania.
Bodi hii iko na nia ya kusaidia ubunifu kote katika Kampun hiii, na kufanya kazi na wasimamizi, kutaendelea kupatia kipaumbele uwekezaji wa teknolojia ili kuhakikisha Benki ya NIC inakidhi mahitaji ya wateja na pia kuongeza thamani kwa maisha ya wateja wetu.
Shukrani
Hatungefika mahali tulipo kama sio uungwaji mkono uliyo thabiti na usaidizi kutoka wadau wetu mbalimbali.
Bodi hii, Wasimamizi na Wafanyikazi wanafurahia mno usaidizi kutoka kwa wanahisa wetu zaidi ya 25,000. Usaidizi wao umewezesha Shirika hili kuendelea kufanya uwekezaji muhimu ili kuhakikisha ukuaji unadumu hadi katika siku zijazo.
Wateja wetu ni sababu ya kuwepo kwa hii biashara yetu. Hatuwezi kuchukua msaada wao kama kitu rahisi na daima tutajitahidi kudumisha uaminifu tuliopewa.
Vile vile tunazidi kutoa shukrani za dhati kwa washirika wetu wa kibiashara na wadhibiti kanuni ambao wanaendelea kutoa msaada muhimu sana, sio tu hapa nchini Kenya pekee, bali kote katika kanda tunakoendesha shughuli zetu.
Kwa niaba ya Bodi, napenda kumshukuru kila mfanyikazi wa Shirika la Benki ya NIC kwa kutekeleza jukumu kubwa la kufanya mwaka wa 2016 kuwa wa mafanikio licha ya kuweko kwa changamoto tele humo.
Kutamatisha, nawashukuru wakurugenzi wenzangu kwa mchango wao na kujitolea kwao kwenye Shirika hili katika viwango vyote kwenye Bodi na Kamati mbali mbali.
J P M Ndegwa
Mwenyekiti
26 I Annual Report & Financial Statements • 2016
BUILDING TRUST BYBUILDING PEOPLE
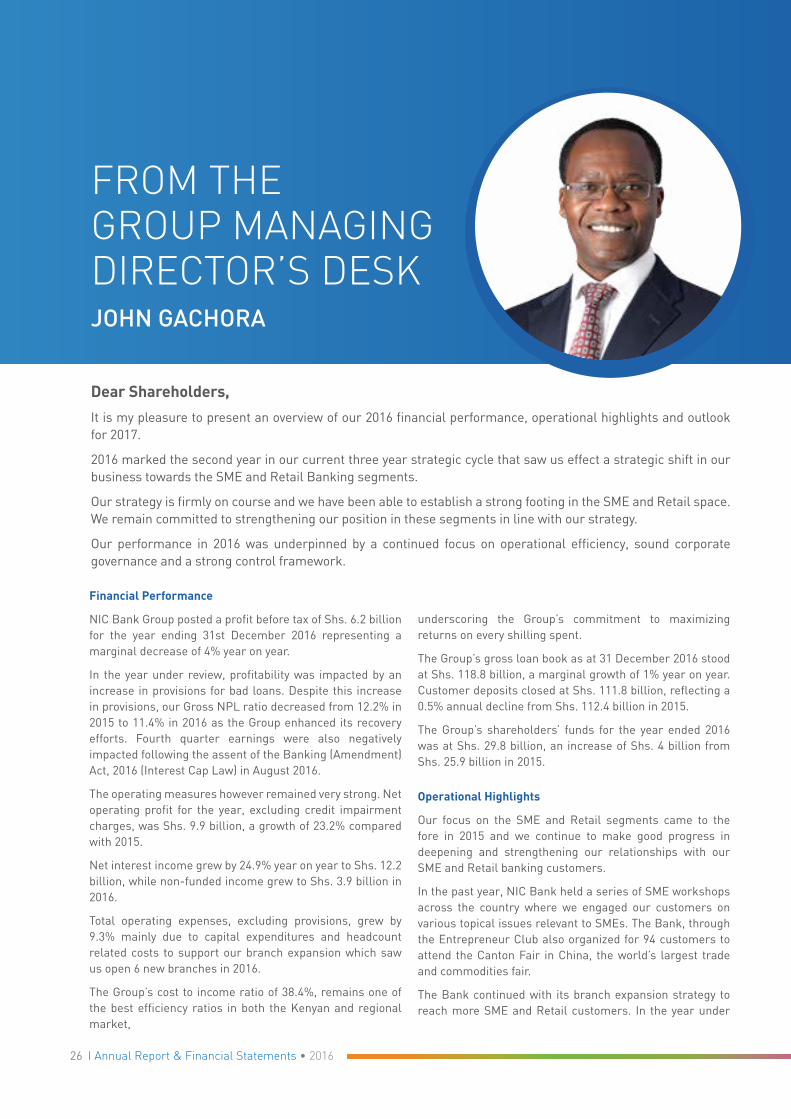
FROM THEGROUP MANAGING DIRECTOR’S DESKJOHN GACHORA
Financial Performance
NIC Bank Group posted a profit before tax of Shs. 6.2 billion for the year ending 31st December 2016 representing a marginal decrease of 4% year on year.
In the year under review, profitability was impacted by an increase in provisions for bad loans. Despite this increase in provisions, our Gross NPL ratio decreased from 12.2% in 2015 to 11.4% in 2016 as the Group enhanced its recovery efforts. Fourth quarter earnings were also negatively impacted following the assent of the Banking (Amendment) Act, 2016 (Interest Cap Law) in August 2016.
The operating measures however remained very strong. Net operating profit for the year, excluding credit impairment charges, was Shs. 9.9 billion, a growth of 23.2% compared with 2015.
Net interest income grew by 24.9% year on year to Shs. 12.2 billion, while non-funded income grew to Shs. 3.9 billion in 2016.
Total operating expenses, excluding provisions, grew by 9.3% mainly due to capital expenditures and headcount related costs to support our branch expansion which saw us open 6 new branches in 2016.
The Group’s cost to income ratio of 38.4%, remains one of the best efficiency ratios in both the Kenyan and regional market,
underscoring the Group’s commitment to maximizing returns on every shilling spent.
The Group’s gross loan book as at 31 December 2016 stood at Shs. 118.8 billion, a marginal growth of 1% year on year. Customer deposits closed at Shs. 111.8 billion, reflecting a 0.5% annual decline from Shs. 112.4 billion in 2015.
The Group’s shareholders’ funds for the year ended 2016 was at Shs. 29.8 billion, an increase of Shs. 4 billion from Shs. 25.9 billion in 2015.
Operational Highlights
Our focus on the SME and Retail segments came to the fore in 2015 and we continue to make good progress in deepening and strengthening our relationships with our SME and Retail banking customers.
In the past year, NIC Bank held a series of SME workshops across the country where we engaged our customers on various topical issues relevant to SMEs. The Bank, through the Entrepreneur Club also organized for 94 customers to attend the Canton Fair in China, the world’s largest trade and commodities fair.
The Bank continued with its branch expansion strategy to reach more SME and Retail customers. In the year under
Dear Shareholders,
It is my pleasure to present an overview of our 2016 financial performance, operational highlights and outlook for 2017.
2016 marked the second year in our current three year strategic cycle that saw us effect a strategic shift in our business towards the SME and Retail Banking segments.
Our strategy is firmly on course and we have been able to establish a strong footing in the SME and Retail space. We remain committed to strengthening our position in these segments in line with our strategy.
Our performance in 2016 was underpinned by a continued focus on operational efficiency, sound corporate governance and a strong control framework.

27Annual Report & Financial Statements • 2016 I
BUILDING TRUST BYBUILDING PEOPLE
GROUP MANAGING DIRECTOR’S STATEMENT
review, the Bank opened six new branches in Kitengela, Kisii, KMA Centre in Upper Hill, CPA Centre in Ruaraka, Maasai Mall in Rongai and The Point in Buruburu. The six branches saw the branch network grow to 33 branches in Kenya and 40 across the region.
NIC Leasing LLP, the leasing subsidiary that was established in 2015, gained substantial traction in the market as it inked partnerships with leading corporates such as Deacons.
NIC Bank continued to be the market leader in Asset Finance partnering with several leading dealers including Simba Colt Motors, Nissan Kenya, CMC Motors, Delights Kenya and General Motors (GM) to offer customers competitive financing to acquire assets. In addition the Bank also opened its new Asset Finance Centre of Excellence in Upper Hill.
The Bank continued to leverage on technology to improve efficiencies and to deliver convenience to all its customers. Over the course of the year there was transactional growth in both our mobile platform and our award winning online banking platform.
In 2016, we also launched a fully automated online platform enabling employees of corporate organisations to apply for loans online. This innovative new portal significantly streamlined the loan application process by allowing for online approval and processing.
In June 2016, the Kenya Deposit Insurance Corporation (KDIC) appointed NIC Bank to act as the Assets and Liabilities Consultant for Imperial Bank Limited (in Receivership) (IBLIR). The mandate included, amongst others, an assessment of the quality of IBLIR’s assets and liabilities, disbursement of funds to IBLIR depositors and other advisory services to KDIC. We are pleased to report that in our role we have been able to disburse more than Shs. 10 billion to IBLIR depositors.
Furthermore, as the appointed consultant, NIC Bank enhanced the collection processes, communication, loan restructurings, system reactivation and disbursement processes.
Culture Transformation
In 2016, the organization underwent a transformational cultural change, to ensure that it continues putting customers at the centre of everything it does. The statement, “Putting the customer first,” is not just words at NIC Bank, it is our culture and the way we operate. The Bank has adopted a Trailblazing culture which speaks to the newly defined Vision - “Building Prosperity Together” and the redefined values that will ensure we are building prosperity for all stakeholders, including our customers and staff members.
2017 outlook
The economic outlook for 2017 is primarily driven by the events surrounding the upcoming elections in August. As history has taught us, investors are expected to adopt a wait-and-see approach ahead of the elections. This slowdown is expected to impact growth across the board, and closer to home, the banking sector. Furthermore, the effects of the Banking (Amendment) Act 2016 are expected to become more visible this year. The banking sector as a whole is expected to slow down on account of the Act.
Despite these headwinds, we remain confident that our business strategy will continue driving sustained growth and act as a counterweight to the challenges in our business environment. We have positioned ourselves to capitalize on any emerging opportunities in the retail and SME segments of the banking sector and, to this end, we will open two new branches in the first quarter of 2017.
On behalf of the management and staff of NIC Bank Group, I extend our sincere appreciation to our Board, Shareholders, Customers, Regulators and Business Partners.
We shall count on your continued support and commitment as we steer NIC Bank to even greater heights.
John GachoraGroup Managing Director

28 I Annual Report & Financial Statements • 2016
BUILDING TRUST BYBUILDING PEOPLE
TAARIFA YA MKURUGENZI MKUU (Inaendelea)
Enyi Wanahisa wapendwa,
Ni furaha yangu kuwasilisha kwenu maelezo ya jumla ya matokeo ya utendaji wa kifedha katika 2016 pamoja na mambo muhimu ya uendeshaji shughuli pamoja na matarajio ya 2017.
2016 ulikuwa mwaka wa pili katika mzunguko wetu wa sasa wa miaka mitatu ya mkakati ambao ulitupelekea kwenye mageuzi ya kimkakati ya biashara yetu kuangazia zaidi kwenye vitengo vya Waikezaji wadogo (SME) na Shughuli za Benki rejareja.
Mkakati wetu unaendelea vyema kabisa na tumefaulu kujistawisha kwa njia imara kwenye vitengo vya Waikezaji wadogo (SME) na Benki ya rejareja. Sisi bado tunazidi kujitolea kuimarisha msimamo wetu kwa vitengo hivi kuambatana na mkakati wetu
Utendaji wetu katika 2016 uliimarishwa na usisitizaji wa ufanisi katika utendakazi, usimamizi bora wa shirika na udhibiti imara wa mifumo
Utendaji wa Kifedha
Shirika la NIC Bank lilipata faida kabla ya kulipa ushuru ya Shs. bilioni 6.2 katika kipindi cha mwaka unaomalizikia tarehe 31 Disemba 2016 ikiwakilisha upungufu kidogo kwa kima cha 4% mwaka juu ya mwaka.
Katika mwaka tunaoukariria, upatikanaji wa faida uliathiriwa na kuzidishwa kwa maandalizi ya mikopo isiotegemewa kulipwa. Licha ya kuzidi kwa maandalizi hayo, Uwiano wetu wa Pato la NPL ulipungua kutoka 12.2% katika 2015 hadi kufika 11.4% katika 2016 wakati Kundi lilipozidi kuimarisha jitihada za kutafuta afueni. Mapato ya robo ya nne ya mwaka pia yaliathiriwa vibaya kufuatia kutiwa saini kwa Sheria za Benki (za Marekebisho), 2016 (Sheria za Kuwekea kikomo kiwango cha riba) mnamo mwishoni mwa mwaka.
Hata hivyo hatua ya uendeshaji zingali imara. Faida halisi ya uendeshaji katika mwaka tunaoungazia, ukiondoa gharama za mikopo ilioharibika, ilikuwa Shs. bilioni 9.9, ikiwa ni ukuaji wa 23.2% ikilinganishwa na 2015.
Mapato halisi kutokana na riba yaliongezeka kwa 24.9% mwaka kwa mwaka hadi Shs. bilioni 12.2, huku mapato ya shughuli zisiiofadhiliwa yaliongezeka kwa Shs. bilioni 3.9 katika 2016.
Jumla ya gharama za uendeshaji shughuli, ukiondoa maandalizi, yaliongezeka kwa 9.3% hasa zaidi kutokana na gharama za mtaji na gharama zinazohusu idadi ya wafanyikazi katika kusaidia upanuzi wa matawi yetu ambapo tulishuhudia uzinduzi wa matawi 6 mapya katika 2016.
Gharama za Kundi kwa uwiano na mapato bado ni chini ya 38.4%. Hii ni chini ya wastani wa sekta hii na inawakilisha
moja ya uwiano bora wa ufanisi kote katika soko la hapa Kenya na katika soko la kanda hii, hii ikidhihirisha ahadi yetu ya kukuza mapato kwa kila shilingi iliyotumiwa na kila kitengo.
Pato la Kundi katika daftari ya mkopo kufikia tarehe 31 Disemba 2016 ilisimamia kwa Shs. bilioni 118.8, ikiwa ni ukuaji mdogo wa 1% mwaka kwa mwaka. Amana za wateja ilifungia katika Shs. bilioni 111.8, hii ikionyesha kupungua kwa 0.5% katika mwaka kushuka kutoka Shs. bilioni 112.4 katika mwaka wa 2015.
Fedha za wanahisa wa Kundi katika mwaka unaomalizika wa 2016 zilikuwa katika Shs. bilioni 29.8, ikiwa ni ongezeko la Shs. bilioni 4 kutoka Shs. bilioni 25.9 katika 2015.
Mambo muhimu ya Utekelezaji shughuli
Kutilia mkazo kwetu katika vitengo vya SME na shughuli za Benki za Reja reja kulidhihirika katika mwaka wa 2016 na tunaendelea kupata mafanikio mazuri katika kukuza na kuimarisha mahusiano yetu na wateja wa SME na wa Benki Reja reja.
Katika mwaka uliopita, Benki ya NIC iliandaa mfululizo wa warsha za SME kote nchini ambapo tulishirikisha wateja wetu katika masuala mbalimbali muhimu yahusuyo SMEs. Benki hii, kupitia klabu cha wajasiria mali cha Entrepreneur Club pia iliwapangia wateja 94 kusafiri na kuhudhuria tamasha la Canton Fair kule Uchina, ambalo ndio kubwa zaidi duniani la kibiashara na bidhaa.
Benki iliendelea na mkakati wake wa upanuzi wa matawi ili kufikia wateja zaidi wa SME na wa Reja reja. Katika mwaka unaokaguliwa, Benki ilifungua matawi mapya sita katika sehemu za Kitengela, Kisii, KMA Centre katika Upper Hill, CPA Centre kule Ruaraka, Maasai Mall katika Rongai na The Point katika Buruburu. Matawi haya sita yalifanya mtandao wa matawi yetu nchini Kenya kuongezeka hadi 33 kutoka 27 katika mwaka uliotangulia na 40 kote katika kanda hii.
NIC Leasing LLP, kampuni tanzu ya kukodisha ambayo ilianzishwa mwaka wa 2015, ilipata uthibiti mkubwa katika soko ilipofaulu kufanya ushirikiano na mashirika yanayoongoza kama vile Deacons.
Benki ya NIC iliendelea kuongoza katika soko la Utoaji Fedha za Rasilimali yaani Asset Finance kwa kufanya ushirikiano na wafanyabiashara wauzaji kadhaa wanaongoza ikiwa ni pamoja na Simba Colt Motors, Nissan Kenya, CMC Motors, Delights Kenya na General Motors (GM) kwa kuwatolea fedha wateja wao kwa viwango vya kuvutia vya fedha za kumiliki rasilimali. Aidha Benki pia ilifungua kituo kipya cha ubora cha Utoaji Fedha za Rasilimali katika sehemu ya Upper Hill.
Benki iliendelea kujiinua katika nyanja ya teknolojia

29Annual Report & Financial Statements • 2016 I
BUILDING TRUST BYBUILDING PEOPLE
TAARIFA YA MKURUGENZI MKUU (Inaendelea)
ili kuboresha huduma na kuwasilisha urahisishaji wa shughuli kwa wateja wake wote. Katika kipindi cha mwaka tunaoutazama kulikuwa na ukuaji wa shughuli katika majukwaa yote mawili ya huduma kupitia simu za rununu na mfumo wetu wa kushinda tuzo wa kupitia mtandao wa internet.
Katika mwaka wa 2016, vile vile tulizindua mfumo kamili otomatiki wa mtandao wa internet wa kuwezesha wafanyakazi wa mashirika ya kibinafsi kuomba mikopo moja kwa moja mtandaoni. Njia hii mpya bunifu kwa kiasi kikubwa ilifanikisha mfumo wa uombaji mikopo kwa kuruhusu usindikaji na uidhinishaji kupitia mtandao wa internet.
Mnamo mwezi wa Juni 2016, Shirika la Kenya Deposit Insurance Corporation (KDIC) liliteuwa Benki ya NIC kuwa kama Mshauri wa Rasilimali na Madeni kwa Benki ya Imperial (Mpokeaji Mali ya Ufilisi). Majukumu yakiwa ni pamoja na, miongoni mwa mengine, utathmini wa ubora wa rasimali na madeni ya IBLIR, utoaji wa fedha kwa wawekaji pesa wa IBLIR pamoja na huduma nyingine za ushauri kwa KDIC. Tuna furaha kuwaripotia kuwa katika kutekeleza jukumu hili tumefanikiwa kugawa takriban Shs. bilioni 10 kwa wawekaji pesa wa IBLIR.
Isitoshe, kama mshauri, NIC Bank iliboresha mfumo wa ukusanyaji wa fedha, mawasiliano, marekebisho ya mikopo, kuanzishwa upya kwa mfumo na mchakato wa kugawa fedha.
Mabadiliko ya Desturi
Katika 2016, shirika lilipitia mabadiliko ya desturi zake, ili kuhakikisha kuwa wanaendelea kuwazingatia zaidi wateja katika kila jambo wanalotekeleza. Ule msemo wa, ‘Kumzingatia mteja kwanza” sio maneno tu katika benki ya NIC, bali ndio utamaduni wetu na jinsi tunavyotekeleza kazi yetu. Benki hii iliazimia kuchukua desturi ya kisasa kabisa ambayo inaenda na maono mapya yaliyofafanuliwa ya “Kujenga Mafanikio Pamoja” na maadili yaliyofafanuliwa upya ili kuhakikisha juhudi zetu zinaleta mafanikio kwa wadau wote, ikiwa ni pamoja na wateja wetu na wafanyakazi.
Mtazamo wa 2017
Mtazamo wa hali ya kiuchumi wa 2017 unaongozwa pakubwa na matukio yanayozunguka uchaguzi ujao wa Agosti. Kama historia ilivyotufunza, wawekezaji wanatarajiwa kuchukua msimamo wa kusubiri na kuangalia mambo yatakavyokuwa kabla ya kufanyika uchaguzi. Kupungua kasi huku kunatarajiwa kuathiri ukuaji mahala kote, na kwa ynayotuhusu hasa, sekta ya benki. Zaidi ya hayo, athari za Sheria za benki (Marekebisho) za 2016 kunatarajiwa kudhihirika zaidi mwaka huu. Sekta ya benki kwa ujumla inatarajiwa kupunguza kasi ya shughuli kutokana na Sheria hii.
Licha ya kuwepo kwa upepo huo wa kutatanisha, sisi bado tuna matumaini kuwa mkakati wa biashara mkakati yetu utaendelea kuchochea ukuaji wa kudumu na kutumika kama pingamizi yetu dhidi ya mazingira ya kibiashara yenye changamoto tele. Tumejiweka katika nafasi muafaka ya kujifaidi na fursa zozote zinazoibuka katika vitengo vya Benki Rejareja na SME katika sekta ya benki na tunadhamiria kufungua matawi mawili mapya katika robo ya kwanza ya 2017.
Kwa niaba ya wasimamizi na wafanyikazi wa Shirika la Benki ya NIC Bank, Natoa shukrani zetu za dhati kwa Bodi ya wakurugenzi, Wamilikihisa, Wateja, Wadhibiti kanuni na Wafanyibiashara Washirika wetu. Tutazidi kutegemea dhamira na msaada wenu wa kudumu wakati huu tunapoendelea kuongoza Benki hii ya NIC kufikia kilele cha juu zaidi
John Gachora
Mkurugenzi Mkuu wa Shirika
30 I Annual Report & Financial Statements • 2016
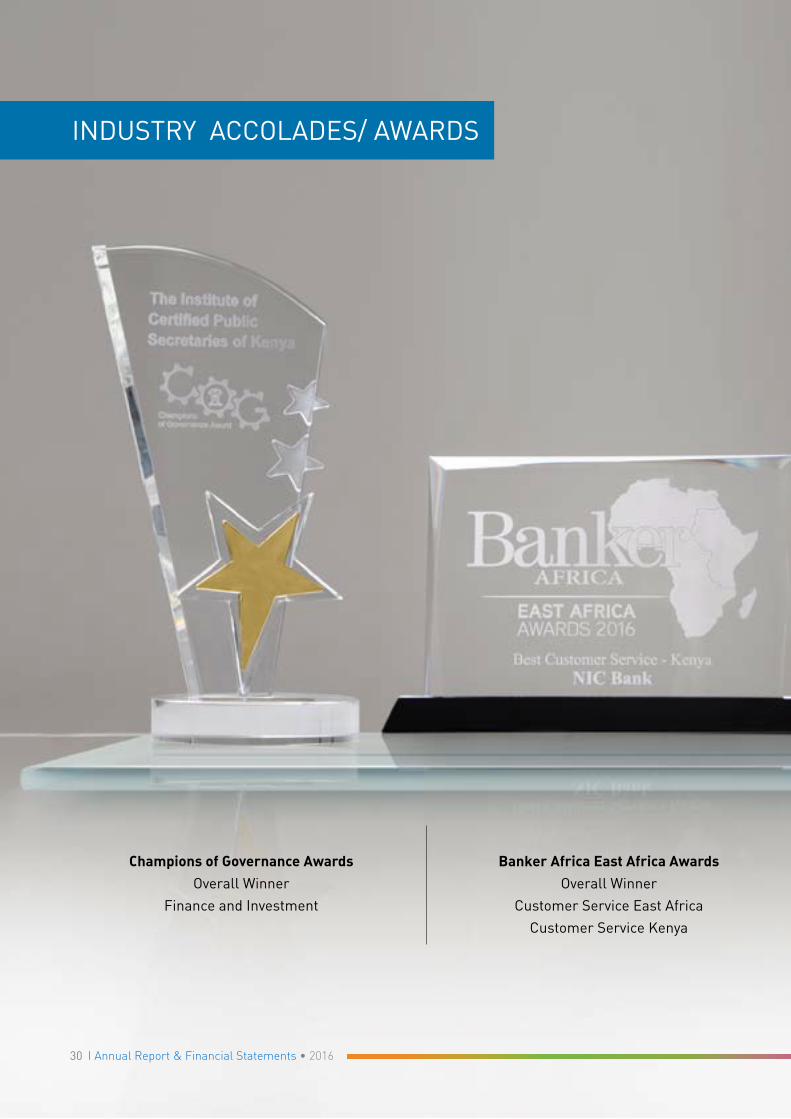
Banker Africa East Africa AwardsOverall Winner
Customer Service East Africa
Customer Service Kenya
Champions of Governance AwardsOverall Winner
Finance and Investment
INDUSTRY ACCOLADES/ AWARDS

31Annual Report & Financial Statements • 2016 I
Think Business2nd Runners Up
Best Bank in Asset Finance
Annual Visa AwardsOne of the Pioneer Banks
to launch MVisa

32 I Annual Report & Financial Statements • 2016
BUILDING TRUST BYBUILDING PEOPLE
THE BOARD OF DIRECTORS
From left to right seated: John Gachora I James P M Ndegwa I Frederick M Mbiru
From left to right standing: Andrew S M Ndegwa I Paras V Shah I Francis N Mwanzia I Esther Ngaine I I Ochola – Wilson I George A Maina I Kairo Thuo I Livingstone Murage I Alan J Dodd

33Annual Report & Financial Statements • 2016 I
BUILDING TRUST BYBUILDING PEOPLE
From left to right standing: Andrew S M Ndegwa I Paras V Shah I Francis N Mwanzia I Esther Ngaine I I Ochola – Wilson I George A Maina I Kairo Thuo I Livingstone Murage I Alan J Dodd

34 I Annual Report & Financial Statements • 2016
BUILDING TRUST BYBUILDING PEOPLE
JAMES P M NDEGWA
CHAIRMAN (NON-EXECUTIVE)
Mr. Ndegwa holds a MA (Hons) degree from Oxford University, UK, and is an Associate of the Chartered Insurance Institute, UK. He is the Chairman of First Chartered Securities Limited, the ICEA LION Group, the Mitchell Cotts Kenya Group and the Capital Markets Authority. Prior to his present position, he was the Managing Director of Lion of Kenya Insurance Company until 2003. He joined the Board on 19th November 2003 and was appointed Chairman in 2005.
I OCHOLA – WILSON
DIRECTOR (NON-EXECUTIVE)
Mrs. Ochola-Wilson holds a Bachelor of Arts degree from Dar-es-Salaam University and a Masters in Business Administration from University of British Columbia, Canada. She is currently a Business Consultant, Chairman of Unga Group Limited and a director of several other companies having retired as a Project Manager for DFID’s Business Partnership Programme in 2005. She joined the Board on 5th November 1999.
JOHN GACHORA
GROUP MANAGING DIRECTOR (EXECUTIVE)
Mr. Gachora holds a Masters Degree in Electrical Engineering and Computer Science from the Massachusetts Institute of Technology, USA as well as a Masters in Business Administration from the Wharton School, University of Pennsylvania, USA. He is a director of several other companies and joined NIC from Barclays Africa where he had been Managing Director and Head of Corporate & Investment Banking. Prior to this, he held several executive positions at Absa Bank, in South Africa, as well as Bank of America and Credit Suisse First Boston in the United States. He joined NIC Bank in September 2013 as Group Managing Director and was appointed to the Board on 21st August 2013.
PARAS V SHAH
DIRECTOR (NON-EXECUTIVE)
Mr. Shah, is a lawyer by profession and a Certified Public Secretary. He holds an LLB (Hons) degree, from King’s College London, Diploma in legal practice from the College of Law, London, Diploma in Legal practice from Kenya School of Law and Diploma in Management from Henley School of Management. He is an Advocate of the High Court of Kenya, a director of several other companies and currently a partner at Coulson Harney Advocates. He joined the Board on 23rd February 2010.
FREDERICK M MBIRU
VICE CHAIRMAN(NON-EXECUTIVE)
Mr. Mbiru holds a Bachelor of Arts degree in Business Administration (Hons) from Makerere University and is an Associate of the Chartered Institute of Bankers. He is currently a Management Consultant and a director of several other companies having retired as General Manager of Barclays Bank of Kenya in 1993. He joined the Board on 16th February 1993.
THE BOARD OF DIRECTORS
KAIRO THUO
DIRECTOR (NON-EXECUTIVE)
Mr. Thuo is both a lawyer and accountant by profession. He is a consultant and a founder member of Viva Africa Consulting LLP and Viva Africa Consulting Limited and was previously responsible for establishing and running the Tax Transaction Advisory group at Deloitte and Touche. He also serves on the Boards of Kenya Power and Lighting Company Limited and the Special Economic Zones Authority. He joined the Board on 27th November 2013.

35Annual Report & Financial Statements • 2016 I
BUILDING TRUST BYBUILDING PEOPLE
THE BOARD OF DIRECTORS
ALAN J DODD
EXECUTIVE DIRECTOR
Mr. Dodd holds a BA (Hons) degree in Economics from Portsmouth University, UK. He is an Associate of the Chartered Institute of Bankers. He has extensive regional and international banking experience covering East and Southern Africa, Middle East and Asia. He is a director of several other companies and joined NIC Bank in January 2006 as Director, Corporate Banking, and was appointed to the Board on 22nd February 2006.
GEORGE A MAINA
DIRECTOR (NON-EXECUTIVE)
Mr. Maina holds a B. Tech (Hons) degree in Aeronautical Engineering and Design from Loughborough University, UK. He is currently a Business Consultant, Chairman of British American Tobacco Kenya Limited and a director of several other companies. He has extensive experience in the oil industry in Africa, the Caribbean and Central America including being Managing Director of Kenya Shell and BP Kenya Limited from 1998 to 2002. He joined the Board on 1st June 2002.
ESTHER NGAINE
DIRECTOR (NON-EXECUTIVE)
Ms. Ngaine holds a Bachelor of Science in International Business Administration (Finance option) from United States International University (USIU). She is a senior banker with over 36 years of experience in a global financial institution. Prior to joining the NIC Bank Board, Ms. Ngaine was the Director and Head of Public Sector at Citibank. She is a director of several other companies, has extensive banking experience and over the years has a played a role in the development of the Financial Services Sector in Kenya and the East Africa Region. She joined the Board in June 2014.
ANDREW S M NDEGWA
DIRECTOR (NON-EXECUTIVE)
Mr. Ndegwa holds a MA (Hons) degree in Philosophy, Politics and Economics from Oxford University, UK. He is the Executive Director of First Chartered Securities Limited, Non-Executive Director of Unga Group Limited and a director of several other companies. He previously worked for Citibank and AMBank until 1995. He joined the Board on 23rd April 1997.
FRANCIS N MWANZIA
DIRECTOR (NON-EXECUTIVE)
Mr. Mwanzia holds a Bachelor of Commerce (Hons) degree from University of Nairobi and is a qualified member of the Association of Chartered Certified Accountants, UK and Chartered Institute of Secretaries and Administrators, UK. He is also a member of ICPAK and ICPSK. He is currently a businessman and a director of several other companies having retired as Group Financial Controller and Company Secretary of NAS Airport Services in 1999. He joined the Board on 3rd August 1995.
LIVINGSTONE MURAGE
GROUP COMPANY SECRETARY
Mr. Murage holds a Bachelor of Commerce (Hons) degree from University of Nairobi and is a Certified Public Accountant and a Certified Public Secretary. He is also a member of ICPAK and ICPSK. He previously worked for PriceWaterhouse and Mobil Oil before joining the banking sector in 1986. He was appointed Company Secretary on 2nd September 1999.

36 I Annual Report & Financial Statements • 2016
BUILDING TRUST BYBUILDING PEOPLE
EXECUTIVE MANAGEMENT
JOHN GACHORA
GROUP MANAGING DIRECTOR
Mr. Gachora holds a Masters Degree in Electrical Engineering and Computer Science from the Massachusetts Institute of Technology, USA as well as an Masters in Business Administration from the Wharton School, University of Pennsylvania, USA. He joined NIC from Barclays Africa where he had been Managing Director and Head of Corporate & Investment Banking. Prior to this, he held several executive positions at Absa Bank, in South Africa, as well as Bank of America and Credit Suisse First Boston in the United States. He joined NIC Bank in September 2013 as Group Managing Director and was appointed to the Board on 21st August 2013.
ALAN J DODD
EXECUTIVE DIRECTOR
Mr. Dodd holds a BA (Hons) degree in Economics from Portsmouth University, UK. He is an Associate of the Chartered Institute of Bankers. He has extensive regional and international banking experience covering East and Southern Africa, Middle East and Asia. He joined NIC Bank in January 2006 as Director, Corporate Banking, and was appointed to the Board on 22nd February 2006.
LIVINGSTONE MURAGE
GROUP COMPANY SECRETARY
Mr. Murage holds a Bachelor of Commerce (Hons) degree from University of Nairobi and is a Certified Public Accountant and a Certified Public Secretary. He is also a member of ICPAK and ICPSK. He previously worked for PriceWaterhouse and Mobil Oil before joining the banking sector in 1986. He was appointed Company Secretary on 2nd September 1999.
JULIUS KAMAU
DIRECTOR, OPERATIONS & TECHNOLOGY
Mr. Kamau holds a degree in Bachelor of Commerce, Marketing from the University of Nairobi. He joined NIC Bank from Ecobank-Kenya where he was the Head of Operations & Technology. Prior to this, he held various positions at Citi Bank and Standard Chartered Bank respectively. He is a Certified Public Accountant, CPA (K) with 17 years of extensive experience in managing banking, IT operations and projects.
SANKUL MANDAVIA
DIRECTOR, TREASURY
Mr. Mandavia holds a Bachelor of Science in Business Administration from United States International University (USIU). Before his appointment he was the Assistant General Manager Institutional Banking and Liability Management at Commercial Bank of Africa. He also served as Head of Treasury at First American Bank of Kenya.

37Annual Report & Financial Statements • 2016 I
BUILDING TRUST BYBUILDING PEOPLE
EXECUTIVE MANAGEMENT
MARGARET KIMUMA
DIRECTOR, CREDIT RISK
Ms. Kimuma holds a Bachelor of Science in International Business Administration from United States International University (USIU) as well as a Diploma in Customer Relationship Management from the Institute of Financial Services (UK). Prior to her appointment, she was the Head of Credit Risk. She has 24 years of experience in banking having also worked for Barclays Bank (K) Limited. Ms. Kimuma is an Associate of the Kenya Institute of Bankers.
ROSALIND KIMANI-GICHURU
DIRECTOR, MARKETING, COMMUNICATION & CITIZENSHIP
Mrs. Gichuru holds a Masters in Business Administration from Northeastern University, Boston, US and a Bachelor of Commerce degree from McMaster University, Hamilton, Ontario, Canada. She is a seasoned Marketer with over 19 years of Marketing Strategy, Trade Execution and Leadership experience in the United States and across Africa. Her Marketing career began at The Gillette Company in Boston Massachusetts where she held Brand Management positions in the Duracell and Oral B / Braun Divisions for the US market. She then joined NIC Bank from The Coca-Cola System where she held leadership positions with Coca-Cola SABCO and The Coca-Cola Company across 39 countries in Sub Sahara Africa.
MONICAH W. KIHIA
DIRECTOR, HUMAN RESOURCES
Mrs. Kihia holds a Masters in Business Administration in Marketing & Strategic Management from the University of Nairobi, and Bachelor of Education (Mathematics & Economics) from Egerton University. Prior to joining NIC Bank, Mrs. Kihia held various roles with Citibank N.A with the latest being Head of Learning & Development – Sub Sahara Africa cluster and Deputy East Africa HR Head & Senior HR Business Partner – Kenya. Monica is a Certified Executive Coach by the Academy of Executive Coaching.
DAVID ABWOGA
DIRECTOR, FINANCE & STRATEGY
Mr. Abwoga holds a Bachelor of Arts degree in Economics from Moi University and an MBA (Strategic Management) from the University of Nairobi. He joined NIC Bank from Citibank N.A where he was the East Africa Cluster Chief Financial Officer (CFO), responsible for Kenya, Tanzania, Uganda and Zambia. Prior to this, he held various executive management positions at Citi, Marshalls (EA) Ltd and Deloitte & Touché. David is a Certified Public Accountant, CPA (K) and CPS (K) with 24 years of extensive experience in Audit, Operations and Finance.

38 I Annual Report & Financial Statements • 2016
BUILDING TRUST BYBUILDING PEOPLE
EXECUTIVE MANAGEMENT
PANKAJ KANSARA
MANAGING DIRECTOR, NIC BANK TANZANIA LTD
Mr. Kansara holds a Masters in Business Administration in Finance and Banking from the University of Wisconsin, USA as well as a Bachelor of Business Administration in Accounting from Loyola College of Baltimore, USA. Mr. Kansara has been in the banking industry for over 26 years having worked with several Local and Multinational Banks in Kenya.
SAM NTULUME
MANAGING DIRECTOR, NC BANK UGANDA LTD
Mr. Ntulume holds an MBA from the East & Southern Africa Management Institute (ESAMI), is a Fellow of the Association of Chartered Certified Accountants (FCCA), is a Certified Public Accountant (Institute of Certified Public Accountants of Uganda) and also holds a Diploma in Business Studies. He has over 20 years’ experience in financial management, financial reporting and business leadership in the financial services sector, distribution & marketing, public and manufacturing sectors.
JERRY SIMU
DIRECTOR, INVESTMENT BANKING
Mr. Simu holds an Msc in International Securities Investment Banking from University of Reading, ICMA Centre. Jerry previously worked for HSBC Africa where he held various senior management positions including Head of Coverage, Sub Saharan Africa with responsibility for the Representative Offices in Africa and covering fund raising across debt and equity platforms including syndications, debt capital markets and project export finance. His last position at HSBC was Managing Director prior to joining NIC in July 2015 as Director, Investment Banking.
ELLIE CHIURI
DIRECTOR, CORPORATE BANKING
Mr. Chiuri holds an MBA in International Business from Liverpool University. He joined NIC Bank in 2004, as an Analyst within the Corporate Banking Division, and has, over the years grown through the ranks and taken on increasing responsibilities within the Division. In 2014 he was appointed as the Head of Corporate Banking. He was appointed Director, Corporate Banking, in January 2016.
ROBERT KIBAARA
DIRECTOR, RETAIL BANKING
Mr. Kibaara holds a Bachelor of Arts degree in Banking from University of Sunderland (UK) and a Post- Graduate Diploma in Marketing from Chartered Institute of Marketing – UK. He is currently pursuing a Masters of Business Administration degree, at Edinburgh Business School (Heriot Watt University – UK). Prior to joining NIC Bank, he was the Executive Director in charge of Retail and Business Banking at National Bank of Kenya. He has over 22 years of extensive experience in Banking and has held various senior management positions with Barclays Bank and Standard Chartered Bank.

NOW YOU SEE AFLEET OWNER
WE SAWHIS AMBITION
BUILDING TRUST BY BUILDING PEOPLEASSET FINANCE • SME LOANS • PERSONAL LOANS • MORTGAGES
39Annual Report & Financial Statements • 2016 I

40 I Annual Report & Financial Statements • 2016
BUILDING TRUST BYBUILDING PEOPLE
CORPORATE INFORMATION
DIRECTORS
J P M Ndegwa - ChairmanF M Mbiru - Vice ChairmanJ Gachora • - Group Managing DirectorA Dodd• **G A MainaF N MwanziaA S M NdegwaI Ochola-WilsonP V ShahK ThuoE N Ngaine
•Executive directors**British
CREDIT RISK COMMITTEE
F M Mbiru - ChairmanF N MwanziaA S M NdegwaP V ShahE N NgaineJ GachoraA Dodd
EXECUTIVE COMMITTEE
A S M Ndegwa - ChairmanG A MainaP V ShahE N NgaineJ GachoraA Dodd
RISK MANAGEMENT COMMITTEE
G A Maina - ChairmanF M MbiruI Ochola-Wilson
AUDIT COMMITTEE
F N Mwanzia - ChairmanF M MbiruI Ochola-WilsonK Thuo
GOVERNANCE AND NOMINATIONS COMMITTEE
G A Maina - ChairmanA S M NdegwaP V ShahE N Ngaine
INFORMATION, COMMUNICATIONS AND TECHNOLOGY (ICT) COMMITTEE
E N Ngaine - ChairmanA S M NdegwaP V ShahK Thuo
HUMAN RESOURCES AND COMPENSATION COMMITTEE
I Ochola-Wilson - ChairmanF M MbiruA S M Ndegwa
GROUP COMPANY SECRETARY
L MurageCertified Public Secretary (Kenya)NIC House, Masaba RoadP.O Box 44599 - 00100Nairobi
REGISTERED OFFICE
NIC HouseMasaba RoadP.O Box 44599 - 00100Nairobi
REGISTRARS AND TRANSFERS OFFICE
Custody & Registrars Services Limited6th Floor, Bruce House, Standard StreetP.O Box 8484 - 00100Nairobi
AUDITOR
PricewaterhouseCoopersCertified Public Accountants (Kenya)PwC TowerWaiyaki Way/Chiromo Road, WestlandsP.O Box 43963 - 00100Nairobi
Notes:- All Board Committees were Chaired by Non-Executive Directors;- The Executive Directors were members of the Executive and Credit
Risk Committees while the rest of Management were not members of any Board Committee but attend some Committee meetings by invitation;
- All other Board Committees were made up entirely of Non-Executive Directors; - None of the Directors held a similar position in more than three
public listed companies during the course of the year;- The Chairman did not hold any other similar position in public
listed companies during the course of the year;- Two Directors have attained the age of 70 years and, being eligible
and willing to continue with service on the Board, will seek shareholders’ approval at the Annual General Meeting.

41Annual Report & Financial Statements • 2016 I
BUILDING TRUST BYBUILDING PEOPLE
STATEMENT ON CORPORATE GOVERNANCE
In recognition of the importance of good corporate governance practices in the sustainable management of companies and delivery of sustainable stakeholder value, the NIC Bank Group remains committed and at the forefront in adopting best practices in corporate governance and risk management in the rapidly evolving financial landscape.
The year 2016 saw the further development of the regulatory framework relating to corporate governance with the publication of the effective date for the Capital Markets Authority Guidelines on Corporate Governance Practices for Issuers of Securities to the Public, 2015. The Code sought to bring into Kenya’s regulatory regime the current global best practices in corporate governance. The application of the Code is based on the “Apply or Explain” principle, which is a departure from the previous principle of “Comply or Explain” in recognition of the vast differences between organizations in various sectors of the economy and the efficiency of adopting a principle-led risk based approach to regulation as opposed to a rule-based approach.
The Board of Directors has outlined within this Annual Report the status of compliance with the corporate governance principles outlined in the Code and the measures being undertaken to fully comply where review and implementation is ongoing. The Board is glad to report that, with the exception of the Board Composition which is under review with the ongoing Group structure reorganization, that requires Central Bank of Kenya approval, the Group is essentially compliant with the prescribed corporate governance requirements. These include the updated Board Committee Terms of Reference due for Board approval during the 2017 review cycle, establishment of procedures such as the governance and legal and compliance audits that are to be scheduled for year 2017 and integrated reporting which the Group has commenced procedures for implementation.
The Board of Directors is committed to ensuring that the business is run in a professional, transparent, just and equitable manner so as to protect and enhance shareholder value and satisfy the interests of all its stakeholders. In addition to the above considerations, the principles and standards adhered to by the Board and NIC Bank Group’s governance structure, have been developed with close reference to guidelines on corporate governance issued by the Capital Markets Authority for public listed companies in Kenya, the Central Bank of Kenya for the banking industry, and other best practices including but not limited to the King Principles on Corporate Governance, which provide practical guidance to Directors and Senior Management of Companies in discharging their Corporate Governance responsibilities.
Among the principles that continue to guide the Board in its corporate governance practices are the following:
• Well defined Board and Management duties and accountabilities, ensuring appropriate director competencies, maintaining an appropriate mix of executive, non-executive and independent non-executive directors, establishment of independent committees and undertaking annual board evaluations;
• Optimising shareholder returns through the adoption of appropriate strategies aimed at enabling and promoting the long term prosperity of the business;
• Timely, transparent and relevant disclosures to provide stakeholders with a clear understanding of our businesses;
• Implementation of strong audit procedures through ensuring audit independence, applying internationally recognised accounting principles, ensuring the undertaking of a well-scoped annual audit and maintenance of robust internal controls;
• Alignment of remuneration with the long term interests of shareholders and employee participation in enhancing stakeholders’ long term interests;
• Compliance with the Constitution of Kenya, laws and regulations, relevant national and international standards and internal policies with disclosure of applicable policies to all relevant stakeholders; and
• Upholding the highest levels of integrity in the organisation’s culture and practices through a well-defined and implemented code of conduct and ethics.

42 I Annual Report & Financial Statements • 2016
BUILDING TRUST BYBUILDING PEOPLE
STATEMENT ON CORPORATE GOVERNANCE (Continued)
NIC Bank Group’s governance structure is summarized in the chart below:
The roles played by each of the above committees are described later in this section of the Annual Report.
During 2016, the Board’s focus was geared towards the understanding and application of the principles of the new CMA Code of Corporate Governance Practices for Issuers of Securities to the Public, 2015 in line with the objective of being in the best-in-class category in the area of corporate governance.

43Annual Report & Financial Statements • 2016 I
BUILDING TRUST BYBUILDING PEOPLE
STATEMENT ON CORPORATE GOVERNANCE (Continued)
Board Size, Composition and Independence
During 2016, the Board consisted for most of the year of eleven Directors, nine of whom were Non-Executive Directors (including the Chairman), and two Executive Directors. This followed the sad demise of one of our long-serving Board members Mr. Michael Somen, in the month of March, 2016.
The Board is committed to ensuring that its composition reflects strong levels of Board independence and adequate representation of the minority shareholders. In addition, the policies and procedures enacted by the Board through the Board Charter and Board Committee Terms of Reference ensure that each Board member’s independence is recognised and upheld at all times.
The status of Independent Non-Executive Directors is reviewed and determined by the Board Governance and Nominations Committee having taken into consideration the potential for conflict of interest that may affect continued service as an Independent Non-Executive Director and the definition provided by the Central Bank of Kenya and the Capital Markets Authority.
In December 2015, the Capital Markets Authority enacted the new Code of Corporate Governance Practices for Issuers of Securities to the Public, 2015 (the Code). To allow for sufficient time for companies to appreciate and embed the practices and structures recommended by the Capital Markets Authority, a transition period was granted hence providing for 4th March 2017 as the effective date for the implementation of the Code. The Board has considered the requirements of the Code and reviewed its governance structures and practices to ensure that the Bank complies with the principles and practices outlined therein.
In light of the new definition of Independent Non-Executive Director as outlined in the Code, only two of the Non-Executive Directors now qualify as Independent Non-Executive Directors. The Board has embarked on a review of its composition in order to achieve the recommended one-third Independent Non-Executive Director threshold as early as possible.
The Non-executive Directors are independent of Management. Their role is to advise, constructively challenge, provide oversight, and monitor the success of Management in delivering the agreed strategy within the approved risk appetite and control framework that is set by the Board.
The Board is well composed in terms of the range and diversity of skills, background and experience of Directors. The Directors’ abridged biographies appear on page 34 to 35 of this Annual Report.
All the Non-executive Directors are subject to retirement
by rotation, and must seek re-election by shareholders at least once every three years in accordance with the Articles of Association. Any Director appointed during the year is required to retire and seek re-election at the next Annual General Meeting.
Board Responsibilities
The Board’s principal duty is to promote the long-term success of the Group by creating and delivering sustainable shareholder value. The Board Charter defines the governance parameters within which the Board exists and operates, sets out specific responsibilities to be discharged by the Board, its committees and Directors collectively, as well as certain roles and responsibilities incumbent upon the Directors as individuals.
A summary of the Board’s responsibilities is as follows:
• Providing entrepreneurial leadership to the Group within a framework of prudent and effective controls which enable risk to be assessed and managed;
• Strategy formulation and ensuring that there are adequate policies, systems and structures to successfully implement the Group strategies;
• Monitoring the Group’s performance against its strategic plans and objectives on an ongoing basis, as well as through mandatory quarterly meetings;
• Review and approval of the publication of the quarterly financial statements;
• The selection, appointment and appraisal of senior executive officers who are qualified and competent to manage the affairs of the Group effectively;
• The periodic selection and rotation of independent auditors to ensure independent and objective assessment of the financial, operational and governance systems employed by the Group;
• Approval of the risk management framework, and ensuring that there are adequate structures and systems to identify, measure, control and monitor the key risks facing the Group, including compliance related risks;
• Reviewing the effectiveness of the systems for monitoring and ensuring compliance with the Constitution and relevant laws, regulations, industry rules and standards;
• Determining the terms of reference of all Board Committees, and the reviewing of reports and minutes of those committees’ deliberations;
• Developing, reviewing and monitoring the Group’s corporate governance policies and practices; and
• Reviewing the Group’s capital levels to ensure that there is adequate capacity for the planned growth and expansion within the strategic cycle, and approving major capital expenditure, acquisitions and divestitures.

44 I Annual Report & Financial Statements • 2016
BUILDING TRUST BYBUILDING PEOPLE
STATEMENT ON CORPORATE GOVERNANCE (Continued)
Chairman and Group Managing Director
The roles and responsibilities of the Chairman of the Board and the Group Managing Director remain distinct and separate. The Chairman provides overall leadership to the Board without limiting the principles of collective responsibility for Board decisions. The Group Managing Director is responsible to the Board and takes responsibility for the effective and efficient running of the Group businesses on a day-to-day basis.
The Deputy Chairman acts for the Chairman during his absence, or abstention in decision making due to conflict of interest should it arise, at meetings of the Board and supports him in his role.
Board Remuneration
Non-executive Directors are paid a monthly fee, together with a sitting allowance for every meeting attended. They are not eligible for pension scheme membership, and do not participate in any of the Company’s remuneration or compensation schemes.
Details of the Directors’ fees for the Non-executive Directors and remuneration of the Executive Directors paid in 2016 are set out on page 162 note 40(c) of these financial statements.
Directors’ Shareholding
None of the Directors as at the end of year 2016 held shares in their individual capacity of more than 1% of the Company’s total equity.
Board and Strategy Meetings
The Board and its Committees meet regularly in accordance with business requirements. All Directors participate in discussing the strategy, financial performance, internal control systems and the risk management practices of the Group. Meetings of the Board are structured to allow sufficient time for consideration of all matters and the Chairman encourages constructive challenge and debate.
The Board Work Plan together with the calendar of meetings for 2016 was fixed in advance and provided to all Directors. The Work Plan is structured in a manner that enables the Board to develop and review the strategic plan, assess management’s strategies, policies and plans, assess risk, review budgeting and financial management, apply quality assurance processes and schedule the Board evaluation among other priorities. Adequate notice was given for each meeting and the agenda and supporting papers were distributed in advance of all Board and its Committee meetings to allow time for appropriate review and to facilitate full discussion at all meetings.
• In 2016 in addition to the four scheduled Board meetings and being the second year in the Bank’s current Strategic Plan cycle, the Board met to review the progress of implementing the Plan, consider the impact of the prevailing economic and industry circumstances and deliberated on a number of new initiatives, including the implementation of the inspirational Trail Blaze Culture across the Group.
The Board in the course of the year, reviewed the following reports and matters:
• Progress against financial objectives, business developments, and investor and external relations.
• Board Committees reports on their respective activities.
• Presentations from the Group Managing Director on the macroeconomic environment and the impact on banking business, a review of the financial services industry and capital markets overview, a review of the regulatory and competitive environment, strategy and business development, and the financial performance of the banking industry.
• The Group’s risk appetite profile, top and emerging risks, risk management, liquidity, litigations, compliance, and any reputational issues.
Members of Executive Management are regularly invited to attend Board and its Committee meetings as required and make presentations to give the Directors greater insights into their business areas.
The Board has ownership over the Group’s strategic direction. At each Board meeting, progress towards the targets of the approved business plans is reviewed and guidance provided to Senior Management as appropriate.
Directors are at complete liberty to communicate directly with Senior Management with a view to clarifying any issues that have a significant effect on the Group’s performance.
The summary of the Board and Board Committee meetings and attendance is shown on page 53 of this report.
Directors’ external activities and Conflicts of Interest
Directors have a statutory duty to avoid situations in which they have or may have interests that conflict with those of the Group. Business transactions with all parties, including the Directors or their related parties are carried out at arms’ length.
In 2016 the Directors submitted their annual declarations of interests which included:
• An acknowledgement that should it come to the attention of a Director that a matter concerning the Group may result in a conflict of interest, they are obliged to declare the same and will exclude themselves from any discussion or decision over the matter in question.

45Annual Report & Financial Statements • 2016 I
BUILDING TRUST BYBUILDING PEOPLE
STATEMENT ON CORPORATE GOVERNANCE (Continued)
• An acknowledgement that should the Director be appointed to the Board or acquire a significant interest in a business competing with the Group, the Director will be obliged to offer their resignation.
• An acknowledgement that should the Director be appointed to the Board of an entity, including a Government entity, that may expose the Director to potential or actual conflict of interest, the Director will be obliged to declare such appointment, undergo an assessment to determine the extent of such conflict and, where applicable, offer their resignation as a Director where the conflict cannot be mitigated by the existing Board policies for the management of conflicts of interest.
• An acknowledgement that the foregoing also applies to interests of the immediate family members of the Directors.
In addition at every Board and Committee meeting, the Directors must declare any interest they might have in the matters to be discussed at the meeting.
Business transactions with the Directors or their related parties are disclosed on page 160 note 40 of these financial statements.
Insider Trading
Internal policy and various laws, regulations and guidelines that regulate the Group businesses prohibits Directors, Management and staff from trading in the securities, (including equity securities, convertible securities, options, bonds and any stock index containing the security), of any company while in possession of material, non- public information, (also known as “insider information”), regarding the company.
Information is considered to be “non-public” unless it has been publicly disclosed, and adequate time has passed for the securities markets to digest the information. Staff are required to adhere to the Staff & Related Parties Securities Trading Policy for additional details on permissible trading activity.
The Board is glad to report that during the year 2016, there were no known or identified instances of insider trading by the Directors, Management and Staff of the Group.
Board Structure
The Board operates under a comprehensive structure made up of Committees established to assist it in discharging its responsibilities and obligations. The Committees assist the Board in carrying out its functions and ensuring that there is independent oversight of internal controls and risk management.
The Board has determined the purpose and number of Committees required to support it in carrying out its duties and responsibilities and in guiding Management. The Committees, whose mandate and authority has been entrenched in the Board Charter, have been established with sets of specific terms of reference which are regularly reviewed and up-dated. The appointment of the members to these Committees draws on the skills and experience of individual Directors. The role played by the Board committees has become increasingly important over the years and forms a principal point of contact between the Directors and Senior Management.
The Board Committees are : Audit; Credit Risk; Executive; Human Resources & Compensation; Governance and Nominations; Information, Communication & Technology (ICT) and Risk Management and are supported by seven key Management Committees: Executive Management (EXCOM), Assets and Liabilities Management (ALCO), Credit Risk Management and Credit Portfolio Review, ICT Steering, Procurement and Risk Management Committees. Membership of the various Board Committees is shown on page 40 of this report.
All the Board Committees have at least three non-executive directors as members. The Chairpersons of the Committees must be non-executive Directors as prescribed by the Central Bank of Kenya Prudential Guidelines and the CMA Code of Corporate Governance Practices for Issuers of Securities to the Public.
At every meeting of the Board, the Chair of each Committee presents an update of its activities, decisions and recommendations of their respective Committees since the previous Board meeting.
The Group Company Secretary sits in all the Board and Committee meetings and is responsible for providing guidance to the Board on its duties and responsibilities and on other matters of governance and monitoring and coordinating the completion and dispatch of Board and Committee agenda papers, and other briefing materials. The Group Company Secretary is also responsible for ensuring that the minutes of the Committees deliberations are circulated in a timely manner to the Committees’ members and the Board. All Directors have access to the services and advice of the Group Company Secretary. Details of the skills, experience and expertise of the Group Company Secretary are set out on page 35 of this Report.
Management and external service providers plus any required Subject Matter Experts attend by invitation from time to time as circumstances dictate.

46 I Annual Report & Financial Statements • 2016
BUILDING TRUST BYBUILDING PEOPLE
STATEMENT ON CORPORATE GOVERNANCE (Continued)
Details of the Board Committees are given here below:
• Audit Committee
The Audit Committee is composed of Non-Executive Directors including its Chairperson and at least one member holds a professional qualification in accounting or audit and is a registered member of good standing with his/her professional body (ICPAK or equivalent international institute recognised by ICPAK). The Executive Directors are not members of the Audit Committee. The Committee plays a vital role in ensuring the integrity of the financial statements prior to the review and approval by the Board. To this end, the Audit Committee reviews the accounting policies, financial reporting and regulatory compliance practices of the Group. The Committee also continually evaluates the effectiveness of the internal control systems of the Group in accordance with its approved audit plan.
The Committee is involved in the appointment, supervision and performance appraisal of the external auditor and the internal auditor. The Committee receives reports on the findings of the internal and external auditors and Management’s corrective actions in response to the findings. The Committee meets quarterly and the external auditors are invited to attend whenever necessary but at least twice in a year where they meet without Senior Management’s presence. Each year, the Committee reviews and approves the overall scope and plans for the external audit activities, including the fees which have to be ratified by the shareholders. External audit performance is reviewed annually.
To maintain independence, objectivity and professionalism of the auditors, the Committee invites prequalified audit firms to bid for professional audit and tax services every four years. The audit firms make presentations to the Committee and are evaluated on a set criteria and the Committee recommends to the Board the appointment of a suitable audit firm. The Board then recommends to the shareholders the appointment of the proposed auditor subject to the approval of appointment by the Central Bank of Kenya.
The Audit Committee is involved in the appointment and performance assessment of the Head of Internal Audit, who reports directly to this Committee. The Committee also reviews the overall scope, annual plans and budget for the Internal Audit function’s activities and oversees the alignment of risk management programs and Internal Audit activities. The Committee reviews all Internal Audit reports and has regular direct access to the Head of Internal Audit.
The above processes have been developed to ensure the competence and independence of the internal and external auditors hence ensuring timely, accurate and transparent reporting and disclosures on financial and internal control performance.
In order to ensure that the Group is adhering to all laws, regulations and standards applicable to it and for the purposes of providing assurance to its stakeholders and complying with the CMA Code of Corporate Governance Practices for Issuers of Securities to the Public, the Committee through the Group Company Secretary will facilitate a comprehensive independent legal audit at least once every two years by a legal professional in good standing with the Law Society of Kenya. An internal legal and compliance audit shall be carried out in each year preceding the independent legal audit to achieve the same purpose and ensure that any departures from the required levels of compliance are identified and corrected in a timely manner
• Credit Risk Committee
Chaired by a Non-Executive Director, the Committee reviews and oversees the overall lending policies of the Group and approves credit applications that are above the approval limits for management. It ensures that there are effective procedures to identify and manage irregular and problem facilities, minimize credit loss and maximize recoveries.
The Committee also considers issues that may materially impact on the current and future quality of the loan portfolio and credit risk management and further ensures that adequate provisions for bad and doubtful debts have been made in compliance with the regulatory requirements and prudent credit management practices.
The Committee regularly reviews and recommends to the Board discretionary credit limits for the Board Credit Risk Committee and Management Credit Risk Committee.
• Executive Committee
The committee assists the Board in discharging its responsibilities relative to strategy, human resources and general operations oversight. The committee meets regularly to review and recommend for Board approval major capital projects, periodic strategic plans, and key policy guidelines as developed by management.
• Human Resources and Compensation Committee
The Committee reviews the Human Resources policies and procedures and ensures that they adequately support the Group’s strategy. It ensures that the Group continues to provide remuneration packages that fairly reward staff for their contribution to the business and continues to attract, motivate and retain staff of the highest caliber.
The committee ensures succession plans are in place for all senior executive management of the Group. The Committee is also ultimately responsible for developing and approving the compensation structures of management and employees of the Group. These are geared towards

47Annual Report & Financial Statements • 2016 I
BUILDING TRUST BYBUILDING PEOPLE
STATEMENT ON CORPORATE GOVERNANCE (Continued)
minimizing irresponsible and unnecessary risk taking and ensuring that management and employees are motivated to achieve superior performance whilst enhancing the strength and stability of the Group.
• Governance and Nominations Committee
The Governance and Nominations Committee is chaired by a Non-Executive Director. On behalf of the Board, the Committee maintains an overview of the Board’s composition and ensures that the Directors collectively possess the required skills, expertise and experience to grow and sustain the business and uphold the principles and practices of good Corporate Governance as determined by the Board and its Charter.
The Committees’ objective is to establish a robust Board of Directors who can deliver on NIC’s strategic plans; assessing its effectiveness by creating and implementing a Board Charter to be implemented by the Board of Directors towards ensuring the protection, maintenance and enhancement of a sustainable return for NIC’s stakeholders.
The Committee also oversees the Board’s annual performance evaluation and is responsible for assessing the extent of any conflict of interest posed by a Director’s other interests or duties.
In addition, the Committee ensures that the term of office of the Directors is organised in a manner that ensures that there is a smooth transition in the event of changes to the Board’s membership, establishes an induction program for new members and recommends continuous professional development programs for the Board including at least twelve hours of development annually on areas of governance.
In relation to the process for appointments to the Board, the Committee considers recommendations on proposed members from the Directors and the Shareholders. The Committee then assesses the suitability of candidates for appointment to the Board, whereby the person(s) should possess:
- High levels of integrity with impeccable professional, technical and moral credentials;
- Strong business acumen with demonstrated positive and knowledgeable contribution to discussions relative to banking business; and
- Strategic and tactical vision and thought.
The Committee also considers the regulatory requirements for the appointment of Board members and thereafter makes a recommendation of the person to be considered for appointment to the Chairman of the Board who, upon supporting the appointment, provides a brief background of the proposed Director to the Board members while seeking the Board’s approval for the appointment of the nominee.
Upon approval by the Board, the Chairman instructs the Group Company Secretary to seek approval of the appointment from the Central Bank of Kenya and thereafter from the Shareholders during the Annual General Meeting. No Director appointed by the Board shall take up the position prior to being approved by the Central Bank of Kenya and/ or any other regulatory authority under whom the company operates and such approval is required.
In order to ensure that the Group is adhering to its policies and regulatory requirements and for the purposes of providing assurance to its stakeholders on good corporate governance structures and practices and in compliance with the CMA Code of Corporate Governance Practices for Issuers of Securities to the Public, the Committee through the Group Company Secretary will facilitate an annual governance audit by a recognised professional accredited for that purpose by the Institute of Certified Public Secretaries of Kenya (ICPSK), in order to check on the level of compliance with sound governance practices. The Board will thereafter provide a statement on the level of compliance in the annual report.
• Risk Management Committee
The Risk Management Committee is chaired by a Non-Executive Director. The Executive Directors are not members of the Committee. The Committee is responsible for setting the strategic risk parameters through policies/ guidelines, tolerance limits, and approving the risk management strategy as well as significant policies and programs. Thereafter, it monitors compliance with the risk policies, limits and programs. It also reviews the adequacy of the risk management framework in relation to the risks faced by the Group and in comparison to the approved tolerances. The Committee is assisted in these functions by various risk management committees which undertake both regular and ad-hoc reviews of the Group’s risk management environment, the results of which are reported at appropriate levels for review and action.
The risk management policies which are reviewed by the committee are detailed on pages 98 to 127 and are in line with International Financial Reporting Standards.
• Information Communication Technology (ICT) Committee
The Committee oversees the cultivation and promotion of an ethical ICT governance and management culture and awareness and provides the required leadership to achieve this institution‘s strategic objective.
ICT governance is considered as a framework that supports effective and efficient management of ICT resources to facilitate the achievement of an institution‘s strategic objectives
The Committee ensures that ICT management is a regular item on the Board’s agenda and that it is addressed in a

48 I Annual Report & Financial Statements • 2016
BUILDING TRUST BYBUILDING PEOPLE
STATEMENT ON CORPORATE GOVERNANCE (Continued)
structured manner. In addition, the Committee ensures that the Board has the information it needs to make informed decisions that are essential to achieve the ultimate objectives of ICT governance.
Other objectives of the Committee include ; the alignment of ICT and the business; the delivery of value by ICT to the business; the sourcing and use of ICT resources; the management of ICT-related risks; and the measurement of ICT performance.
In recognising the importance of information technology in the management of the Group’s business activities, the Board through the ICT Committee:
- Ensures that the Group has in place an appropriate ICT governance structure and risk management framework which suits the business needs and risk tolerance;
- Develops and periodically reviews the alignment of ICT strategy with the overall business strategies and significant policies of the Group;
- Approves the ICT risk management strategies and policies;
- Sets the ethical and integrity standards and establishes a culture that emphasizes and demonstrates the importance of ICT risk management;
- Establishes an ICT steering committee consisting of representatives from senior management, the ICT function and major business units to oversee the ICT activities and report to senior management and the Board on the effectiveness of strategic ICT planning, budgets and expenditure, ICT performance and its optimization;
- Ensures effective periodic internal and external audit procedures are carried out on the ICT risk management practices with reports submitted to the Board Audit Committee;
- Ensures the appropriation of required funding for ICT risk management functions; and
- Understands the major ICT risks inherent in the Group’s business while setting acceptable tolerance levels for the risks and ensures the implementation of the measures necessary to identify, measure, monitor and control / mitigate ICT risks.
Management Committees
A significant factor in the Group’s ongoing success is the strength of the management team. Members of the management team bring together a vital combination of leadership skills and extensive experience from both local and international banks. To harness that strength, the Group Managing Director has established committees to assist him in
the management of the Group. These committees are chaired by the Group Managing Director and include the respective Heads of Departments, with other senior managers being co-opted on a need basis. These committees include:
• The Executive Management Committee (EXCOM)
This committee meets regularly and at least monthly to discuss strategy formulation and implementation, policy matters and financial performance. It is also charged with the responsibility of ensuring compliance with the regulatory framework and guidelines and adherence to Group policies and procedures. This committee also serves as a link between the Board and Management.
• The Assets and Liabilities Management Committee (ALCO)
This committee meets every month or more frequently if necessary. ALCO, a risk management committee, is tasked with the responsibility of ensuring that all foreseeable funding commitments and deposit withdrawals can be met as and when they fall due, and that the Group will not encounter difficulties in meeting its obligations or financial liabilities as they fall due. This includes management of operational risks, interest rate, market and exchange rate risks and ensuring compliance with statutory requirements governing liquidity, cash ratio and foreign exchange exposure, investment policies, and its internal capital adequacy management.
• The Management Credit Risk Committee
This committee meets regularly to approve new credit applications and renewals within the delegated limits set by the Board. The committee also regularly makes recommendations to the Board Credit Risk Committee on the revision of limits. All approvals are independent of the originating business unit.
• The Credit Portfolio Review Committees
The committee meets monthly to review the performance of the Group’s lending book and determine the adequacy of provisions required in accordance with the approved policies and regulatory guidelines while also determining strategies to prudently manage the lending book, taking into consideration the dynamic economic and business environment.
• Information, Communication & Technology (ICT) Steering Committee
The committee meets regularly to review major ICT projects to ensure that they meet the minimum standards for implementation as per the ICT strategic plan, ensuring that they have undergone appropriate risk assessment and that they will serve the long term needs of the Group in enhancing stakeholder value.

49Annual Report & Financial Statements • 2016 I
BUILDING TRUST BYBUILDING PEOPLE
STATEMENT ON CORPORATE GOVERNANCE (Continued)
• Procurement Committee
The committee meets regularly to review various Group procurement needs, align them to the Group’s strategic plans and prioritize various needs against critical implementation plans and budgetary allocations and hence ensure prudent allocation of resources in enhancing stakeholder value.
The Committee is governed by the requirements of the Procurement Policy which applies very high ethical standards through subscribing to principles of openness, integrity and fairness in implementing the Group’s procurement practices. This is achieved through:
- Providing opportunities to as many qualified suppliers as is reasonably possible to tender for provision of goods and services to the Group;
- Transparency in the procurement process, including inviting all shortlisted suppliers to witness the opening of bids;
- Purchase of high quality goods and services at the most economically favourable terms to ensure that the goods and services add value to the Group and match the businesses standards and image;
- Providing preference to suppliers who are committed to protection of environmental and social matters in keeping with the Group’s commitment and policies on environmental and social protection;
- Maintaining suitable inventory systems to ensure accountability for all items purchased; and
- Upholding the anti-bribery and anti-corruption policies and legal requirements in the Group’s dealings with suppliers and other stakeholders in the procurement process.
• Risk Management Committee
The Risk Management Committee meets quarterly to review the key risks facing the Group. The source and potential impact of the risks are derived from the risk reports based on the tracking and monitoring initiatives conducted by the Risk Management and Compliance Department. Management develops mitigation and corrective action plans based on the reports discussed during this committee’s meetings.
Board and Directors Effectiveness and Evaluation in 2016
In order to ensure that Board members are effective in their contribution to the management of the Group, it is important that they develop a good understanding of the Group and its operations. This is achieved through various training and development sessions to ensure that they understand the relevant facets of the complex and constantly evolving financial services industry. This is particularly important to ensure that they appreciate all the risks to which the Group is exposed, the
impact on the Group and its operations, and how to effectively manage and mitigate these risks.
As part of the Continuous Professional Development programme, the Directors attended a two days training in October, 2016 covering:
• Board, Board Committees and Directors’ Evaluation Process.
• Culture Change in organisations, with a focus on the NIC Trail blaze culture journey.
• Financial analytical review and review of the regional regulatory environment.
Directors also gain further knowledge about the Group through site visits, informal interactions with management and staff, regular in-depth reports and presentations.
In order to assess and improve the capacity, functionality and effectiveness of the Board and its committees, the Board is required to carry out an evaluation of each director, each committee and the Board as a whole as well as the Chairman, the Group Managing Director and the Group Company Secretary. In 2016, the Board decided to undertake the evaluation through an independent external party. The review was conducted in accordance with the requirements of the Central Bank of Kenya Prudential Guidelines on Corporate Governance and the CMA Code of Corporate Governance Practices for Issuers of Securities to the Public.
The evaluation process was conducted through questionnaires and the Directors were evaluated against the following Board approved criteria amongst others;
• Effective preparation for and participation at meetings of the Board and its Committees.
• Understanding of business and specifically the financial industry, and keeping abreast of the latest developments in the economy generally and particularly the banking sector.
• Communications with fellow Directors, management and other stakeholders.
• Ability to take an independent view on matters brought for discussion at Board and Committee meetings.
• Declaration of personal interests and ensuring that they avoid participation in decision making where such interests are discussed.
• Awareness and compliance with regulatory guidelines.• Regular attendance at Board and Committee meetings.
Overall it is considered that in 2016 the Board and its Committees;
• Carried out their roles and responsibilities satisfactorily.
• Regularly reviewed, formulated and approved the strategic direction of the Group in light of the business environment and regulatory framework.

50 I Annual Report & Financial Statements • 2016
BUILDING TRUST BYBUILDING PEOPLE
STATEMENT ON CORPORATE GOVERNANCE (Continued)
• Developed appropriate policy guidelines to assist Management in decision making.
• Fulfilled their role to the Group’s various stakeholders.
• Generally guided and supported the Management which has been responsive to the advice provided.
A report on the overall evaluation assessment was submitted to the Central Bank of Kenya in accordance with the Prudential Guidelines on Corporate Governance.
Code of Conduct & Ethics
The Group has a Code of Conduct & Ethics that binds both the Directors and employees. The NIC Group takes cognizance of the fact that its success is dependent on the environment and the communities in which it operates. The Group policy ensures that its activities meet and exceed the social, economic and environmental expectations of its stakeholders.
The Code of Conduct & Ethics also includes a chapter on Governance, Risk and Compliance that highlights the Group’s commitment to having an integrated risk management framework. The document provides the Group’s ethics profile from which the Board and Management monitor and address ethical issues and through which mechanisms have been entrenched for stakeholder communication.
All Directors, Management and staff of NIC Bank Group must sign an acknowledgement they have read and understood the Code of Conduct & Ethics. The Code of Conduct & Ethics, along with our Vision Statement: “Building Prosperity Together”; and our Values: “Integrity, Passion, Responsiveness, Innovation and Professionalism”; guide our ethical decision making and the conduct of our Directors, officers, and employees.
The Group encourages employees and officers to raise concerns about ethical conduct and violations of the Code of Conduct & Ethics. Senior Management investigates complaints and takes appropriate action, escalating to the Board Human Resources Committee if necessary. Our whistleblower procedures allow employees and our stakeholders to report concerns anonymously, without fear of retaliation.
The Whistle Blowing Policy sets out the Board of Directors’, Managements’ and Staff members’ commitment to upholding the highest levels of integrity and observance of the rule of law. It provides a definition of who a whistle blower is, protection and remedies for whistle blowers, dispute resolution mechanism, voluntary disclosure program, reporting channels and procedures and data retention. The policy is consistent with the commitments made in the Board Charter and Code of Conduct and Ethics and is applicable to
all stakeholders of the Bank. The policy has been published on the Bank’s website, (www.nic-bank.com), for ease of access and reference by the Group’s stakeholders.
The Group Code of Conduct & Ethics, which has also been published on the Bank’s website (www.nic-bank.com), also contains a section highlighting the Group’s policy on Conflict of Interest thereby disclosing the principles which govern employees, Management, Directors and Stakeholders activities.
Relationship with Shareholders and other Stakeholders
The Group is committed to relating openly with its shareholders and stakeholders by providing regular information on its performance and addressing any areas of concern. This is achieved through quarterly publication of extracts of its financial performance in the daily newspapers in line with the Central Bank of Kenya requirements, publication of annual audited accounts, and holding of the Annual General Meeting. The most recently published financial results are also available on the Group’s website, (www.nic-bank.com) which is interactive and has all the relevant information relating to the companies.
In order to foster transparent and accountable long term relationships, the Board has in place formal strategies to promote sustainability including aspects relating to the companies’ environmental, social and governance activities and, through the Group Company Secretary, facilitates effective communication between the Group and its shareholders and stakeholders, hence ensuring that their rights are protected at all times. This includes giving shareholders the opportunity to place items on the agenda at Annual General Meetings, according them the opportunity to question management of the companies and develop a program for regular investor briefings on the Group’s economic, social and environmental performance.
The Group has engaged the services of a registrar, C&R Group who, together with the Group Company Secretary, regularly address issues raised by the shareholders.
Internal Control
The Directors acknowledge their responsibility as set out on page 70 of this report for the Group’s internal control systems, including taking reasonable steps to ensure that adequate systems are being maintained. Internal control systems are designed to meet the particular needs of the Group, and the risks to which it is exposed with procedures intended to provide effective internal financial and operational control. However, it is to be recognized that such systems can only provide reasonable, but not absolute, assurance against material misstatement.

51Annual Report & Financial Statements • 2016 I
BUILDING TRUST BYBUILDING PEOPLE
STATEMENT ON CORPORATE GOVERNANCE (Continued)
The Board has reviewed the Group’s internal control policies and procedures and is satisfied that appropriate controls and procedures are in place.
The Board has put in place a comprehensive risk management framework to identify all key risks, measure these risks, manage the risk positions and determine capital allocations. The policies are integrated in the overall management reporting structure.
The Group’s performance trend is reported regularly to the Board and includes an analysis of performance against budget and prior periods. The financial information is prepared using appropriate accounting policies which are applied consistently.
The Group has an Internal Audit Department which is an independent function that reports directly to the Board Audit Committee and provides independent confirmation that the Group’s business standards, policies and procedures are being complied with. Where found necessary, corrective action is recommended.
The Group also has a Risk Management and Compliance Department, headed by a senior officer who reports directly to the Board Risk Management Committee. The Board Committee oversees the development and implementation of the Risk Management and Compliance framework while ensuring adherence to the Group’s internal policies and regulatory requirements.
Going Concern
The Board confirms the financial statements are prepared on a going concern basis, as the Directors are satisfied that the Group has adequate resources to continue in business for the foreseeable future. In making this assessment, the Directors have considered a wide range of information relating to present and future conditions, including future projections of profitability, cash flows and capital resources. For this reason, it continues to adopt the going concern basis when preparing the financial statements.

52 I Annual Report & Financial Statements • 2016
BUILDING TRUST BYBUILDING PEOPLE
SHARE HOLDING PROFILES
The Company, through its Registrar, files returns regularly in line with the requirement of the Capital Markets Authority and the Nairobi Securities Exchange under the listing regulations on transactions related to shareholders.
The number of shareholders as at 31st December 2016 was 25,588 (2015 – 25,642)
A. Principal Shareholders
The top 10 major shareholders, based on the Group’s share register as at 31st December 2016 are as follows:
Names Number of Shares
%
First Chartered Securities Ltd 101,383,047 15.84
ICEA Asset Management Ltd A/C 2000 58,603,280 9.16
Livingstone Registrars Ltd 55,870,153 8.73
Rivel Kenya Ltd 53,063,367 8.29
Saimar Ltd 25,674,767 4.01
Amwa Holdings Ltd 13,592,676 2.12
Makimwa Consultants Ltd 8,664,740 1.35
Murwoki Holdings Limited 7,389,741 1.15
SCB A/C Pan African Unit Linked FD 6,452,300 1.01
Thuthuma Limited 6,436,787 1.01
Total 337,130,858 51.97
B. Distribution Schedule
Category Number of Shareholders
Number of Shares %
1-500 shares 8,751 1,602,825 0.25
501-5,000 shares 12,991 26,110,049 4.08
5,001-10,000 shares 1,616 11,835,240 1.85
10,001-100,000 shares 1,806 51,481,038 8.04
100,001-1,000,000 shares 362 104,331,478 16.30
1,000,001 and over 62 444,584,973 69.48
Total 25,588 639,945,603 100.00
C. Shareholder Profile
Category Number of Shareholders
Number of Shares %
Local individual investors 23,738 110,271,428 17.23
Local institutional investors 1,635 518,067,007 80.95
Foreign individual investors 195 4,917,118 0.77
Foreign institutional investors 20 6,690,050 1.05
Total 25,588 639,945,603 100.00
STATEMENT ON CORPORATE GOVERNANCE (Continued)

53Annual Report & Financial Statements • 2016 I
BUILDING TRUST BYBUILDING PEOPLE
2016 BOARD & BOARD COMMITTEES MEMBERSHIP AND ATTENDANCE
Director Classification Designation Board Audit Credit RiskRisk
ManagementHuman Resources & Compensation Executive
Stategy & Training*
Governance & Nominations
Information Communication
& Technology
J P M Ndegwa
Non-executiveChairmanBoard
Membership √ √
Attendance5/6 1/1
F M Mbiru Non-executiveChairmanCredit Risk Committee
Membership √ √ √ √ √ √
Attendance 5/6 4/4 11/11 2/2 3/3 1/1
J Gachora ExecutiveGroup Managing Director
Membership √ √ √ √
Attendance 6/6 10/11 3/3 1/1
G A Maina Non-executive
Chairman Governance &Nominations & Risk ManagementCommittees
Membership √ √ √ √ √
Attendance 6/6 2/2 3/3 1/1 3/3
F N Mwanzia Non-executiveChairmanAudit Committee
Membership √ √ √ √
Attendance 6/6 4/4 10/11 1/1
A S M Ndegwa
Non-executiveChairmanExecutive Committee
Membership √ √ √ √ √ √ √
Attendance 5/6 10/11 3/3 3/3 1/1 3/3 3/3
I Ochola-Wilson
Non-executive
ChairmanHuman Resources and CompensationCommittee
Membership √ √ √ √ √
Attendance 6/6 4/4 2/2 3/3 1/1
A Dodd ExecutiveMembership √ √ √ √
Attendance 6/6 11/11 3/3 1/1
K Thuo Non-ExecutiveMembership √ √ √ √
Attendance 5/6 4/4 1/1 2/3
P Shah Non-ExecutiveMembership √ √ √ √ √ √
Attendance 5/6 7/11 3/3 1/1 1/3 1/3
E.Ngaine Non-Executive
ChairmanInformation, Communication & TechnologyCommittee
Membership √ √ √ √ √ √
Attendance 6/6 11/11 3/3 1/1 3/3 3/3
* Represents 2 days strategy and training sessions held by the Board in October 2016.
Notes:
√ Member of respective committee
• Where a director did not attend a Board or Board Committee meeting, an acceptable apology had been received by the Chairman well in advance of the scheduled meeting.
STATEMENT ON CORPORATE GOVERNANCE (Continued)

NOW YOU SEE ATHRIVING SCHOOL
WE SAWHER DEDICATION
BUILDING TRUST BY BUILDING PEOPLEASSET FINANCE • SME LOANS • PERSONAL LOANS • MORTGAGES
54 I Annual Report & Financial Statements • 2016

55Annual Report & Financial Statements • 2016 I
NOW YOU SEE ATHRIVING SCHOOL
WE SAWHER DEDICATION
BUILDING TRUST BY BUILDING PEOPLEASSET FINANCE • SME LOANS • PERSONAL LOANS • MORTGAGES
BUILDING TRUST BYBUILDING PEOPLE
OUR 4 KEY PILLARS
As NIC Bank, we realized that in order for us to achieve long term sustainable success, we have to be good corporate citizens and deliver on our social, cultural, economic and environmental responsibilities. Our business places the right balance of focus on both the financial performance of our franchise and our role as good citizens in our communities.
This consciousness of our role as corporate citizens led us to change our company vision to Building Prosperity Together, which shows that our existence as a business is solely dependent on the successes of our stakeholders, customers and the community at large. Bringing together the needs of business and the needs of society, is a defining business issue of our time. As we look towards the future as a business, we want to remain committed to contributing to economic and societal development, while behaving ethically and improving the quality of life in the local communities we operate in.
Our Citizenship strategy focuses on four key pillars namely;
1. Education
2. Innovation
3. Health
4. Humanitarian Assistance/Emerging Business Needs/Environment
With these four pillars, the Bank seeks to shape a sustainable future for the community through strategic partnerships with reputable Not-For-Profit organizations.
FROM THE DIRECTORMARKETING, COMMUNICATIONS& CITIZENSHIP
ROSALIND GICHURU
Life is more than just about making money. It is about service. Wherever you go, you will never find peace and contentment except in humble service to the community.
– NIC Bank GMD, John Gachora

56 I Annual Report & Financial Statements • 2016
BUILDING TRUST BYBUILDING PEOPLE
Education is the most significant indicator of social progress for the developing world. With the increasing global realization of how the business community can (and should) contribute to social objectives, supporting education is an important agenda for NIC Bank. We support various reputable charitable organizations to fund for scholarships of needy and bright students around the country.
PALMHOUSE FOUNDATION
EDUMED TRUST
Founded in 1996, the trust has supported hundreds of needy students to secondary education. In 2016, the trust supported 331 students, of whom 252 have completed their secondary education.
The trust’s strategic approach is one that aims to address secondary school education needs by being the trusted
organization for channeling funds to students through observing the highest standards of integrity and accountability. This is
achieved through the students’ selection criteria and the prudent use of funds entrusted to them by its partners. The bank has supported
the trust with an annual donation of Shs. 450,000 which caters for the education needs of 15 students per year.
Other than offering sponsorships, NIC Bank also supports the students by offering mentorship during school holidays and participating in the students’ selection process.
The foundation started as a family initiative by Mr. Eric Kimani and his wife Margaret to assist children from needy families in Kiambu County who
regularly dropped out of school due to lack of fees. As the requests for support increased from needy locals, the founders formalized their support and thus established the foundation in 2002.
The trust focuses on financing secondary education to deserving students who have gained admission to national and provincial secondary schools, mentoring them through life thus encouraging the students to have positive contributions to society.
NIC Bank started sponsoring Palmhouse in 2008 by supporting 4 students. Since then, the bank’s annual contribution grew to
Shs. 1.82 Million and has sponsored 8 students per year. Other than offering sponsorships, NIC Bank also supports the students by offering
mentorship during school holidays and participating in the students’ selection process.
CORPORATE CITIZENSHIP (Continued)

57Annual Report & Financial Statements • 2016 I
BUILDING TRUST BYBUILDING PEOPLE
DR. CHOKSEY FOUNDATION
Albinism is a genetic condition present from birth occurring due to lack of the melanin skin pigment in the skin, hair and eyes. This causes extreme skin sensitivity to ultra violet radiation from the sun and skin cancer in cases of prolonged exposure. In Kenya, there are many misconceptions of the condition, with the most common being a curse, which leads to those suffering from the condition being treated as outcasts in society. Nationwide stigma prevents these children from receiving an education while poverty impedes corrective health treatments. Over 99% of children with albinism are not legally blind contrary to popular misconception. Unfortunately, a large proportion study in schools for the blind without professional consultation from an eye specialist.
NIC Bank has partnered with The Dr. Choksey Albinism Foundation, ran by Dr.
Prabha Choksey, a leading Kenyan ophthalmologist, to improve the quality of life of children with albinism through provision of education and professional advice for visual impairments caused by albinism. Through the banks and other partners’ support, the foundation
supports 60 students per year. Through NIC Bank, 5 students from the
foundation will join the MPesa Academy for their secondary school education.
As part of the Bank’s health and education pillars, the mission of the partnership focuses on:
• Raising awareness about albinism
• Providing corrective treatment for skin care and visual impairment
• Sponsoring education for children with albinism
CORPORATE CITIZENSHIP (Continued)

58 I Annual Report & Financial Statements • 2016
BUILDING TRUST BYBUILDING PEOPLE
MENTENDA
NIC Bank continued in its support of the Kenya Community Development Foundation’s (KCDF) Mentenda program, a project we have been supporting since 2015. The aim of the Mentenda program is to spur young men in the community to address the pressing challenges facing the boy child in Kenya. The program develops responsibility and leadership skills in boys
between the ages 14 – 25 years while unlocking their potential and confidence through life skills. A total of 25 NIC Bank male
staff members volunteered as sponsors and mentored 120 Form Two students at Upper Hill School.
This is the second year running of the programme in which NIC Bank male members of staff volunteer their time and expertise to mentor students over a period of one year. The weekly sessions cover topics including careers, family, being a man, sexuality and community service. The initiative is a true reflection of the Bank’s commitment to the community and development of the youth through education to nurture, care and inspire.
NSE YOUTH INVESTMENT CHALLENGE
The bank, through its subsidiary, NIC Securities, continued its support of the NSE Youth Investment Challenge for the 9th year which is run by the Nairobi Securities Exchange (NSE) together with Smart Youth. The competition targets university and college students around the country and is an edutainment public education initiative aimed at teaching the youth on how to invest on the NSE through the provision of an online Smart Trader software that simulates trading of virtual shares & bonds listed on the NSE as well as loans and fixed deposits.
The intention of the competition is to build a culture of saving and investing in the youth hence popularizing trading of stocks & bonds at the NSE amongst the youth. NIC Securities has co-sponsored along with NSE and Smart Youth since 2010 and has supported the initiative with a total of Shs. 3.1 Million. Furthermore, the team supports the youth through mentorship programmes and has taken in several interns over the years.
CORPORATE CITIZENSHIP (Continued)

59Annual Report & Financial Statements • 2016 I
BUILDING TRUST BYBUILDING PEOPLE
JUNIOR ACHIEVEMENT KENYA
NIC Bank continued to support Junior Achievement Kenya, the country’s largest organisation dedicated to educating students and youth about entrepreneurship, work readiness and financial literacy through experiential, hands on programs. The organization’s programs prepare young people for the real world by showing them how to generate wealth and effectively manage it, how to create jobs which make their communities more robust, and how to apply entrepreneurial thinking
to the work place. This year, the bank conducted a Job Shadow day activity in Kenya, Uganda and Tanzania through which over 150
students were hosted. Staff members shared practical learning skills for the workplace and career guidance
HIGH SCHOOL & UNIVERSITY INNOVATION CHALLENGES
Through our partnership with Junior Achievement Kenya, the bank launched the High School and University Innovation challenges in 2015. The aim of the challenges is to involve the youth in identifying and developing solutions that address the gaps and needs in the financial sector. Acknowledging that the talent and creativity in the youth promotes innovation, the context of these challenges falls under three categories;
1. Financial Inclusion - this is delivery of financial services at affordable costs to sections of young, disadvantaged and low-income segments of
society e.g. apps, games, products etc.
2. Financial Literacy - innovations that advance financial literacy i.e. earning, managing, and investing such as a repository of financial information or an app that
encourages students to save.
3. Financial Solutions - these are products and services that address monetary needs e.g. to ease payment processes.
Since the launch of the program, over 300 JA High School Clubs and 15 Universities have been accessed. This year alone, 791 ideas were submitted in the High School challenge and 38 ideas in the University edition. This year’s High School Innovation Challenge winners were from Mama Ngina High School and the University Challenge winners were from Strathmore University.
The winners of the challenges received a cheque donation of Kshs. 250,000 and mentorship opportunities by the NIC Bank, Junior Achievement Kenya and digital partner, BRCK Education.
The bank set aside an annual budget of Shs. 3.5 million for this project.
CORPORATE CITIZENSHIP (Continued)

60 I Annual Report & Financial Statements • 2016
BUILDING TRUST BYBUILDING PEOPLE
AHADI KENYA TRUST
NIC Bank has supported Ahadi Kenya Trust in their anti-jigger outreach campaigns in various parts of the country by donating funds for the purchase of shoes, slippers and medicines for during the treatment camps.
This year, the bank donated 5,000 shoes and slippers to various students in Kisii County from Kisii Primary, Daraja Mbili, Nyaura and Nyambera Primary Schools and also treated the students and community members who had jigger infestations. The bank’s Vice Chairman, Mr. Frederick Mbiru, Board member, Ms. I Ochola – Wilson along with the bank’s Group Managing Director, Mr. John Gachora and other Executive Committee participated in the activity.
We also held a similar outreach in the Coast region where NIC Bank staff members visited Chanagande Primary School, Grandsons of Abraham Orphanage, Jomo Kenyatta Primary School and Bahati Community schools.
CORPORATE CITIZENSHIP (Continued)
FARAJA CANCER SUPPORT CENTRE
NIC Bank once again supported the annual Faraja Cancer Centre White Water Rafting challenge funds drive held at Savage Wilderness Camp.
MATER HEART RUN
The Bank continued its annual support to Mater Hospital for the Mater Heat Run. These funds go towards facilitating free heart operations for needy children. NIC Bank staff also contributed funds towards this worthy cause.

NATIONAL AIDS CONTROL COUNCIL (NACC)
This year, the bank donated a Shs. 1 Million to the NACC to assist the organization’s efforts in the fight against the increase of HIV/AIDS infections in Kenya.
The NACC had been conducting the nation-wide Maisha County League which culminated in a final match held during the 1st December during World AIDS Day commemoration. This initiative leveraged on the power of football to mobilize young people for a nationwide campaign to end HIV stigma and link young people to stigma-free HIV testing, treatment and care.
NACC’s main focus is to spread awareness about the status of the epidemic and encourage progress in HIV and AIDS prevention, treatment and care. It also gives an opportunity for people to think about the health, social and personal costs of a global epidemic and to show support for the individuals and communities who are infected and affected by HIV.
As per the Kenya HIV estimates in 2016, new HIV infections have reduced to 77,600 compared to approximately 100,000 in 2014. Of these new infections, 71,000 were in adults. 51% of these adult infections were in adolescents and young people aged 15 – 24 years of which two thirds were adolescent girls and young women. Adolescents and youth face a lot of stigma and discrimination that prevents them from seeking HIV preventive and treatment services.
61Annual Report & Financial Statements • 2016 I
BUILDING TRUST BYBUILDING PEOPLE
KENYA RED CROSS SOCIETY
In March 2016, the bank launched the co-branded NIC Bank Kenya Red Cross Society credit card. The VISA enabled card automatically gives existing and non-existing members the opportunity to sign up and donate to the humanitarian efforts nationwide. In addition, the co-branded card offers access to VIP lounges
for international flights at the two main airports in Kenya, JKIA and Moi International Airport, at no additional cost.
CORPORATE CITIZENSHIP (Continued)

62 I Annual Report & Financial Statements • 2016
BUILDING TRUST BYBUILDING PEOPLE
SPECIAL OLYMPICS
Every year, a team of 12 Kenyan athletes with intellectual disabilities participate in the Special Olympics. NIC Bank continued to support the team for this year’s Special Olympics and aims to maintain the sponsorship for the coming year.
ELEPHANT NEIGHBORS CENTRE
Elephant Neighbors Centre (ENC), a local non-governmental organization, which NIC Bank supports, launched a 3,200 kilometer walk from Kenya to Tanzania, Uganda and back to Kenya in April, 2016. The founder, Mr. Jim Nyamu, walked approximately 3,200 kilometers over 6 months, stopping at major towns to interact with local communities with the aim of creating awareness on and encouraging wildlife conservancy, especially that of elephants.
ENC believes that community collaboration and their support for conservation is critical in the fight against the poaching of Africa’s elephants for their ivory.
Over 100 NIC Bank staff participated in the walks during the flag off ceremonies.
RHINO CHARGE
In 2016, the bank sponsored a total of 9 cars in support of Rhino Ark’s efforts to fence and maintain the forests and ecosystems around Kenya’s water catchment areas. The winning team was also partly sponsored by the bank.
CORPORATE CITIZENSHIP (Continued)
NIC BANK T20 CRICKET CUP CHALLENGE
We sponsored the Coast Cricket Association’s Annual Cricket
tournament held in Mombasa from March to May 2016 in which a total of 15 teams participated. The main aim of the tournament was to support youth and uplift
the community.
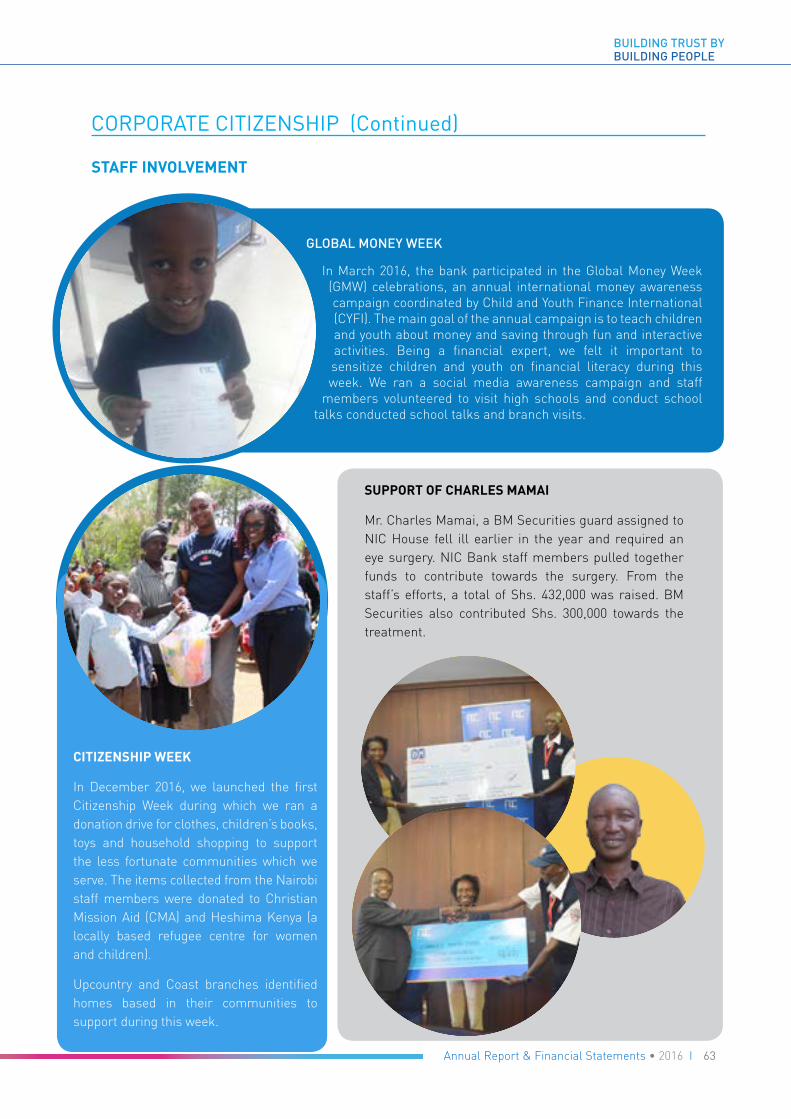
63Annual Report & Financial Statements • 2016 I
BUILDING TRUST BYBUILDING PEOPLE
CORPORATE CITIZENSHIP (Continued)
STAFF INVOLVEMENT
GLOBAL MONEY WEEK
In March 2016, the bank participated in the Global Money Week (GMW) celebrations, an annual international money awareness campaign coordinated by Child and Youth Finance International (CYFI). The main goal of the annual campaign is to teach children and youth about money and saving through fun and interactive activities. Being a financial expert, we felt it important to sensitize children and youth on financial literacy during this week. We ran a social media awareness campaign and staff
members volunteered to visit high schools and conduct school talks conducted school talks and branch visits.
SUPPORT OF CHARLES MAMAI
Mr. Charles Mamai, a BM Securities guard assigned to NIC House fell ill earlier in the year and required an eye surgery. NIC Bank staff members pulled together funds to contribute towards the surgery. From the staff’s efforts, a total of Shs. 432,000 was raised. BM Securities also contributed Shs. 300,000 towards the treatment.
CITIZENSHIP WEEK
In December 2016, we launched the first Citizenship Week during which we ran a donation drive for clothes, children’s books, toys and household shopping to support the less fortunate communities which we serve. The items collected from the Nairobi staff members were donated to Christian Mission Aid (CMA) and Heshima Kenya (a locally based refugee centre for women and children).
Upcountry and Coast branches identified homes based in their communities to support during this week.

64 I Annual Report & Financial Statements • 2016
BUILDING TRUST BYBUILDING PEOPLE
SUSTAINABLE FINANCE TRAINING PROGRAM
The Kenya Banker’s Association (KBA) launched the Sustainable Finance Initiative (SFI) in efforts ingrain sustainability in commercial banks in Kenya. Member banks were therefore supposed to participate in the SFI Training Program, of which 98% of NIC Bank staff members completed. The bank was ranked 3rd position and two NIC Bank staff members were
awarded with overall prizes of a 2-nights, all-inclusive holiday at the Voyager Beach Hotel for their excellent performance in the
course.
CORPORATE CITIZENSHIP (Continued)
ENVIRONMENTAL POLICY
As part of the commitment to environmental sustainability, the Bank has undertaken various initiatives to ensure less energy consumption, wastage and thus a lower carbon footprint. Within the working environment, NIC Bank:
• Adopts open plan offices to reduce the need for electricity and maximize on natural light
• Introduced water saving mechanisms and energy saving bulbs at all units to reduce consumption
• Allocates printer ID codes for accountability on paper usage while developing and encouraging the use of e-documents. Printing in colour is also minimized.
• Is a member of the Kenya Bankers Association Working Group on Sustainable Finance Initiative developing guidelines on environmental, social and governance policy to enable Bank’s operate in a sustainable manner.
Through the Environmental Social Management System (ESMS), NIC Bank is able to ensure that day to day business incorporates environmental and social sustainability. ESMS is an assessment for corporate clients taking facilities from the Bank for large projects to ensure that their operations and processes do not adversely affect the environment and the community. With the use of this system, NIC Bank is better able to perpetuate a positive change of environmental sustainability in the corporate environment.

BUILDING TRUST BYBUILDING PEOPLE
NOW YOU SEEA DREAM HOME
WE SAWTHEIR DESIRE
BUILDING TRUST BY BUILDING PEOPLEASSET FINANCE • SME LOANS • PERSONAL LOANS • MORTGAGES
65Annual Report & Financial Statements • 2016 I

66 I Annual Report & Financial Statements • 2016
BUILDING TRUST BYBUILDING PEOPLE
FROM THE DIRECTOR,HUMAN RESOURCESMONICAH KIHIA
NIC Bank is committed to being an “Employer of Choice”. Our vision of Building Prosperity Together begins by creating a supportive working environment that allows our staff to deliver their best to the organization and all its stakeholders.
In 2016, we continued our focus of building a great organization that attracts, develops and retains the best talent. In addition, the Group invested in development programs that support and empower our staff to deliver excellence.
NIC TRAILBLAZE CULTURE LAUNCH
In August this year, we launched a new culture, which was a culmination of a year-long intensive engagement with staff
aimed at shaping the company culturally to be an “Employer of Choice.” The Launch was conducted across the three countries i.e.
Kenya, Uganda & Tanzania. This new culture aims at ensuring that our internal brand is well aligned to our external brand. We recognize
that “Culture is brand and brand is Culture”, hence the need to ensure that the culture of our people who are the custodians of customer experience is fully aligned to our brand promise.

67Annual Report & Financial Statements • 2016 I
BUILDING TRUST BYBUILDING PEOPLE
EMPLOYEE WELFARE
UNIVERSITY INTERNSHIP PROGRAM (UIP)
The Bank’s University Internship Program which started in May 2015 has continued to develop a pool of enthusiastic young talent through practical career-related work experience while contributing to the organization’s citizenship agenda as well as providing a talent pipeline for the Bank’s future entry level graduate positions.
The program takes 12 weeks to complete. Since inception, we have provided internship opportunities for a total of 58 candidates out of which
33 have been absorbed in the bank.
NIC WELLNESS PROGRAM
Each year, we conduct wellness programs for NIC Bank staff. This year’s programs were well received by staff who actively participated in the
wellness check ups and fitness activities. Through the program, staff members appreciated the importance of embracing wellness and staying fit so as to have a higher quality of life that leads to happiness. Generally the employees were enthusiastic about the initiative and showed commitment to participate in future activities. They also appreciated the fact that the
bank was committed to their wellbeing. The key highlight was the creation of “Whatsapp” group – “Fitness Goals Club” where staff communicate their
health and fitness milestones and encourage each other to keep the wellness initiatives alive.
STAFF DEVELOPMENT
We continued to focus on delivering strategic learning and development programs to ensure that our employees have requisite competencies to perform their jobs. During the year we launched NIC Leadership Development programs targeted to upcoming leaders within the bank. A total of 96 middle level managers participated in the program.
We have also continued to promote employee self-learning courses through the E-learning Portal to ensure a cost-effective delivery of learning across the group.
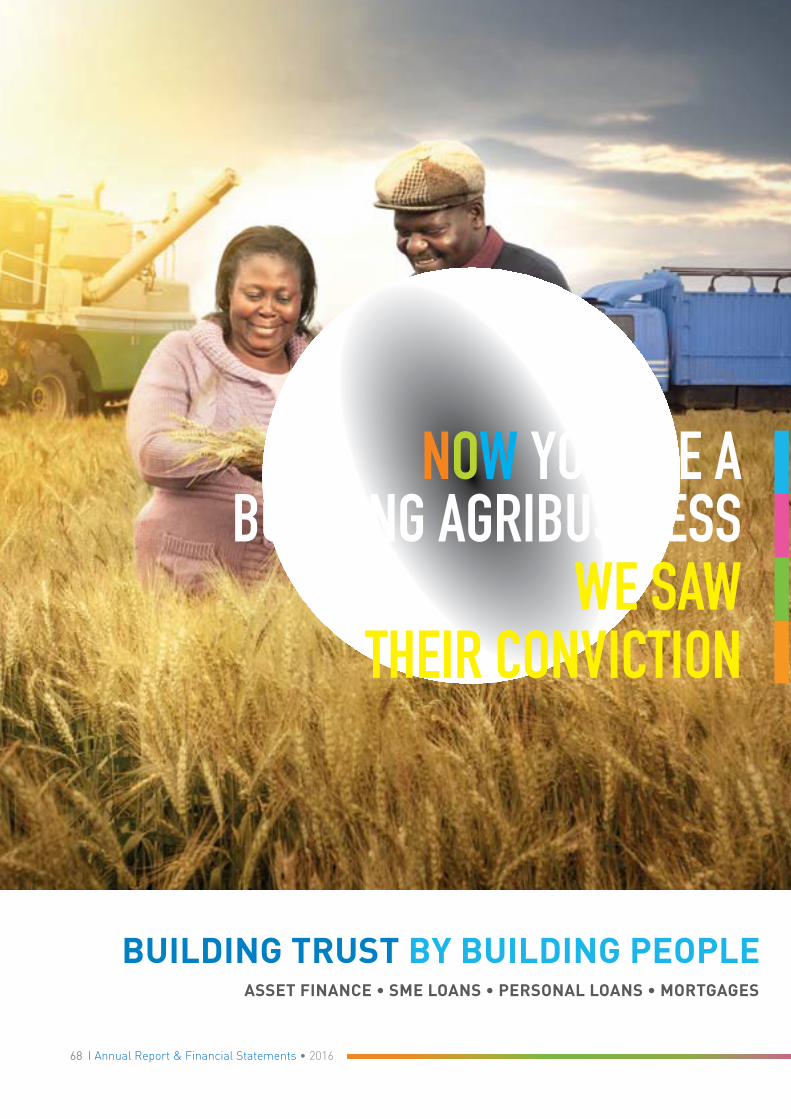
BUILDING TRUST BYBUILDING PEOPLE
NOW YOU SEE ABOOMING AGRIBUSINESS
WE SAWTHEIR CONVICTION
BUILDING TRUST BY BUILDING PEOPLEASSET FINANCE • SME LOANS • PERSONAL LOANS • MORTGAGES
68 I Annual Report & Financial Statements • 2016

69Annual Report & Financial Statements • 2016 I
BUILDING TRUST BYBUILDING PEOPLE
NOW YOU SEE ABOOMING AGRIBUSINESS
WE SAWTHEIR CONVICTION
BUILDING TRUST BY BUILDING PEOPLEASSET FINANCE • SME LOANS • PERSONAL LOANS • MORTGAGES
DIRECTORS’ REPORTThe Board of Directors has pleasure in submitting the annual report together with the audited financial statements for the year ended 31 December 2016 in accordance with Section 22 of the Banking Act and Section 147 to 163 of the repealed Kenyan Companies Act Cap 486 Act which discloses the state of affairs of NIC Bank Limited (the “Bank”/”Company”) and its subsidiaries (together, the “Group”).
1. ACTIVITIES
The principal activities of the Group are the provision of retail and corporate banking, stock brokerage, bancassurance, leasing and investment banking services.
2. RESULTS FOR THE YEAR
The Group profit for the year of Shs 4,330,396,000 (2015: Shs 4,485,125,000) has been added to retained earnings
3. DIVIDENDS
An interim dividend of Shs 0.25 per share amounting to Shs 159,986,000 (2015: 159,986,000) was paid to shareholders on 17th October 2016. The Board has resolved to recommend to the shareholders at the forthcoming Annual General Meeting, scheduled for 22nd May 2017, the payment of a final dividend for the year of Shs 1.00 per share (2015: final dividend of Shs 1.00 per share). The dividend will be payable to the shareholders registered on the Company’s register at the close of business on 6th April 2017 and will be paid on or after 22nd May 2017. The register will remain closed for one day on 7th April 2017.
The total dividend for the year, therefore is Shs 1.25 (2015: Shs 1.25) for every one ordinary share amounting to Shs 799,932,000 (2015: Shs 799,932,000).
4. DIRECTORS
The directors who held office during the year and to the date of this report are shown on page 40.
In accordance with Articles 108, 109 and 110 of the Articles of Association, A S M Ndegwa and K Thuo retire by rotation and, being eligible, offer themselves for re-election.
In accordance with Part 1 Article 7 of the Company’s Board Charter and Article 2.5 of the CMA Code of Corporate Governace Practices for !ssuers of Securities to the Public, 2015, F M Mbiru and F N Mwanzia having attained the age of 70 years retire and offer themselves for re-election.
In accordance with the provisions of section 769 of the Companies Act, 2015, F N Mwanzia (Chairman), I Ochola- Wilson, F M Mbiru & K Thuo, being members of the Board Audit Committee are subject to election to continue to serve as members of the Committee.
5. AUDITOR
The Group’s auditor, PricewaterhouseCoopers has expressed its willingness to continue in office in accordance with Section 721 (4) of the Companies Act, 2015 and subject to Section 24 (1) of the Banking Act (Cap. 488).
6. APPROVAL OF FINANCIAL STATEMENTS
The financial statements were approved and authorised for issue by the Board of Directors on 8th March 2017.
BY ORDER OF THE BOARD
L MURAGE Group Company Secretary

70 I Annual Report & Financial Statements • 2016
BUILDING TRUST BYBUILDING PEOPLE
STATEMENT OF DIRECTORS’ RESPONSIBILITIESThe Kenyan Companies Act 2015 requires the directors to prepare financial statements for each financial year which give a true and fair view of the financial position of the Group and the Bank as at the end of the financial year and their financial performance for the year then ended. The directors are responsible for ensuring that the Group and the Bank keep proper accounting records that are sufficient to show and explain the transactions of the Group and the Bank; disclose with reasonable accuracy at any time the financial position of the Group and the Bank; and that enables them to prepare financial statements of the Group and the Bank that comply with prescribed financial reporting standards and the requirements of the Kenyan Companies Act 2015. They are also responsible for safeguarding the assets of the Group and the Bank and for taking reasonable steps for the prevention and detection of fraud and other irregularities.
The directors accept responsibility for the preparation and presentation of these financial statements in accordance with International Financial Reporting Standards and in the manner required by the Kenyan Companies Act 2015. They also accept responsibility for:
(i) Designing, implementing and maintaining internal control as they determine necessary to enable the preparation of financial statements that are free from material misstatements, whether due to fraud or error;
(ii) Selecting suitable accounting policies and then apply them consistently; and
(iii) Making judgements and accounting estimates that are reasonable in the circumstances.
In preparing the financial statements, the directors have assessed the Group’s and the Bank’s ability to continue as a going concern and disclosed, as applicable, matters relating to the use of going concern basis of preparation of the financial statements. Nothing has come to the attention of the directors to indicate that the Group and the Bank will not remain a going concern for at least the next twelve months from the date of this statement.
The directors acknowledge that the independent audit of the financial statements does not relieve them of their responsibility.
Approved by the Board of Directors on 8th March 2017 and signed on its behalf by:
J P M NDEGWA J GACHORA(Chairman) (Group Managing Director)

BUILDING TRUST BYBUILDING PEOPLE
INDEPENDENT AUDITOR’S REPORTTO THE SHAREHOLDERS OF NIC BANK LIMITED
Report on the financial statements
Our opinion
We have audited the accompanying financial statements of NIC Bank Limited (the ‘Bank’/’Company’) and its subsidiaries (together, the ‘Group’) set out on pages 76 to 162 which comprise the consolidated statement of financial position at 31 December 2016 and the consolidated statements of profit or loss, comprehensive income, changes in equity and cash flows for the year then ended, together with the separate statement of financial position of the Bank at 31 December 2016 and the statements of profit or loss, comprehensive income, changes in equity and cash flows of the Bank for the year then ended, and the notes to the financial statements, including a summary of significant accounting policies.
In our opinion, the financial statements give a true and fair view of the financial position of the Group and the Bank at 31 December 2016 and of the financial performance and cash flows of the Group and the Bank for the year then ended in accordance with International Financial Reporting Standards and the requirements of the Kenyan Companies Act 2015.
Basis for opinion
We conducted our audit in accordance with International Standards on Auditing (ISAs). Our responsibilities under those standards are further described in the Auditor’s responsibilities for the audit of the financial statements section of our report.
We are independent of the Group and the Bank in accordance with the International Ethics Standards Board for Accountants’ Code of Ethics for Professional Accountants (IESBA Code) together with the ethical requirements that are relevant to our audit of the financial statements in Kenya, and we have fulfilled our ethical responsibilities in accordance with these requirements and the IESBA Code.
We believe that the audit evidence we have obtained is sufficient and appropriate to provide a basis for our opinion.
Key audit matters
Key audit matters are those matters that, in our professional judgment, were of most significance in our audit of the financial statements of the current period. These matters were addressed in the context of our audit of the financial statements as a whole, and in forming our opinion thereon, and we do not provide a separate opinion on these matters.
71
PricewaterhouseCoopers CPA. PwC Tower, Waiyaki Way/Chiromo Road, WestlandsP O Box 43963 – 00100 Nairobi, KenyaT: +254 (20)285 5000 F: +254 (20)285 5001 www.pwc.com/ke
Partners: A Eriksson K Muchiru M Mugasa F Muriu P Ngahu A Murage, SN Ochieng, R Njoroge B Okundi K Saiti R Shah
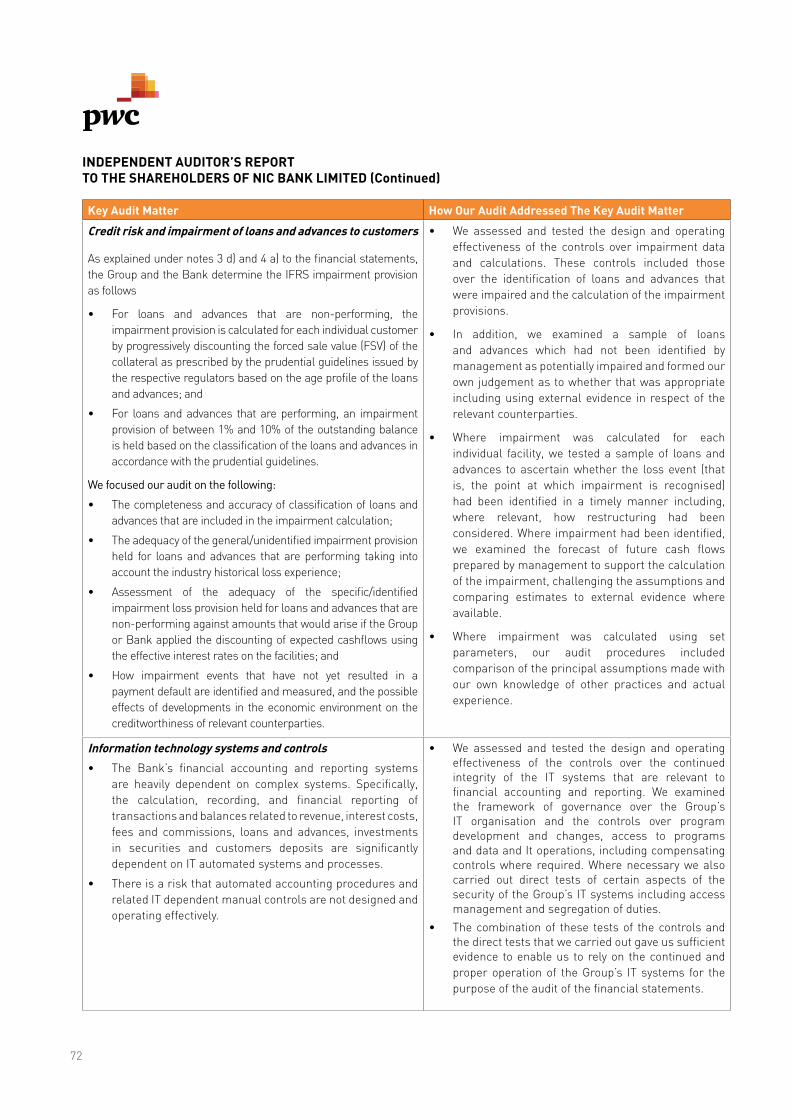
72
INDEPENDENT AUDITOR’S REPORTTO THE SHAREHOLDERS OF NIC BANK LIMITED (Continued)
Key Audit Matter How Our Audit Addressed The Key Audit Matter
Credit risk and impairment of loans and advances to customers
As explained under notes 3 d) and 4 a) to the financial statements, the Group and the Bank determine the IFRS impairment provision as follows
• For loans and advances that are non-performing, the impairment provision is calculated for each individual customer by progressively discounting the forced sale value (FSV) of the collateral as prescribed by the prudential guidelines issued by the respective regulators based on the age profile of the loans and advances; and
• For loans and advances that are performing, an impairment provision of between 1% and 10% of the outstanding balance is held based on the classification of the loans and advances in accordance with the prudential guidelines.
We focused our audit on the following:
• The completeness and accuracy of classification of loans and advances that are included in the impairment calculation;
• The adequacy of the general/unidentified impairment provision held for loans and advances that are performing taking into account the industry historical loss experience;
• Assessment of the adequacy of the specific/identified impairment loss provision held for loans and advances that are non-performing against amounts that would arise if the Group or Bank applied the discounting of expected cashflows using the effective interest rates on the facilities; and
• How impairment events that have not yet resulted in a payment default are identified and measured, and the possible effects of developments in the economic environment on the creditworthiness of relevant counterparties.
• We assessed and tested the design and operating effectiveness of the controls over impairment data and calculations. These controls included those over the identification of loans and advances that were impaired and the calculation of the impairment provisions.
• In addition, we examined a sample of loans and advances which had not been identified by management as potentially impaired and formed our own judgement as to whether that was appropriate including using external evidence in respect of the relevant counterparties.
• Where impairment was calculated for each individual facility, we tested a sample of loans and advances to ascertain whether the loss event (that is, the point at which impairment is recognised) had been identified in a timely manner including, where relevant, how restructuring had been considered. Where impairment had been identified, we examined the forecast of future cash flows prepared by management to support the calculation of the impairment, challenging the assumptions and comparing estimates to external evidence where available.
• Where impairment was calculated using set parameters, our audit procedures included comparison of the principal assumptions made with our own knowledge of other practices and actual experience.
Information technology systems and controls
• The Bank’s financial accounting and reporting systems are heavily dependent on complex systems. Specifically, the calculation, recording, and financial reporting of transactions and balances related to revenue, interest costs, fees and commissions, loans and advances, investments in securities and customers deposits are significantly dependent on IT automated systems and processes.
• There is a risk that automated accounting procedures and related IT dependent manual controls are not designed and operating effectively.
• We assessed and tested the design and operating effectiveness of the controls over the continued integrity of the IT systems that are relevant to financial accounting and reporting. We examined the framework of governance over the Group’s IT organisation and the controls over program development and changes, access to programs and data and It operations, including compensating controls where required. Where necessary we also carried out direct tests of certain aspects of the security of the Group’s IT systems including access management and segregation of duties.
• The combination of these tests of the controls and the direct tests that we carried out gave us sufficient evidence to enable us to rely on the continued and proper operation of the Group’s IT systems for the purpose of the audit of the financial statements.

73
INDEPENDENT AUDITOR’S REPORTTO THE SHAREHOLDERS OF NIC BANK LIMITED (Continued)
Other information
The directors are responsible for the other information. The other information comprises the information included in the annual report but does not include the financial statements and our auditor’s report thereon.
Our opinion on the financial statements does not cover the other information and we do not and will not express any form of assurance conclusion thereon.
In connection with our audit of the financial statements, our responsibility is to read the other information identified above and, in doing so, consider whether the other information is materially inconsistent with the financial statements or our knowledge obtained in the audit, or otherwise appears to be materially misstated.
If, based on the work we have performed on the other information that we obtained prior to the date of this auditor’s report, we conclude that there is a material misstatement of this other information, we are required to report that fact. We have nothing to report in this regard.
Responsibilities of management and those charged with governance for the financial statements
The directors are responsible for the preparation of financial statements that give a true and fair view in accordance with International Financial Reporting Standards and the requirements of the Kenyan Companies Act 2015, and for such internal control as the directors determine is necessary to enable the preparation of financial statements that are free from material misstatement, whether due to fraud or error.
In preparing the financial statements, the directors are responsible for assessing the Group’s ability to continue as a going concern, disclosing, as applicable, matters related to going concern and using the going concern basis of accounting unless the directors either intend to liquidate the Group or to cease operations, or have no realistic alternative but to do so.
The directors are responsible for overseeing the Group’s financial reporting process.
Auditor’s responsibilities for the audit of the financial statements
Our objectives are to obtain reasonable assurance about whether the financial statements as a whole are free from material misstatement, whether due to fraud or error, and to issue an auditor’s report that includes our opinion. Reasonable assurance is a high level of assurance, but is not a guarantee that an audit conducted in accordance with ISAs will always detect a material misstatement when it exists. Misstatements can arise from fraud or error and are considered material if, individually or in the aggregate, they could reasonably be expected to influence the economic decisions of users taken on the basis of these financial statements.
As part of an audit in accordance with ISAs, we exercise professional judgment and maintain professional scepticism throughout the audit. We also:
• Identify and assess the risks of material misstatement of the financial statements, whether due to fraud or error, design and perform audit procedures responsive to those risks, and obtain audit evidence that is sufficient and appropriate to provide a basis for our opinion. The risk of not detecting a material misstatement resulting from fraud is higher than for one resulting from error, as fraud may involve collusion, forgery, intentional omissions, misrepresentations, or the override of internal control.
• Obtain an understanding of internal control relevant to the audit in order to design audit procedures that are appropriate in the circumstances, but not for the purpose of expressing an opinion on the effectiveness of the Group’s internal control.
• Evaluate the appropriateness of accounting policies used and the reasonableness of accounting estimates and related disclosures made by the directors.
• Conclude on the appropriateness of the directors’ use of the going concern basis of accounting and, based on the audit evidence obtained, whether a material uncertainty exists related to events or conditions that may cast significant doubt on the Group’s ability to continue as a going concern. If we conclude that a material uncertainty exists, we are required to draw attention in our auditor’s report to the related disclosures in the financial statements or, if such disclosures are inadequate, to modify our opinion. Our conclusions are based on the audit evidence obtained up to the date of our auditor’s report. However, future events or conditions may cause the Group to cease to continue as a going concern.
74
INDEPENDENT AUDITOR’S REPORTTO THE SHAREHOLDERS OF NIC BANK LIMITED (Continued)
Auditor’s responsibilities for the audit of the financial statements
• Evaluate the overall presentation, structure and content of the financial statements, including the disclosures, and whether the financial statements represent the underlying transactions and events in a manner that achieves fair presentation.
• Obtain sufficient appropriate audit evidence regarding the financial information of the entities or business activities within the Group to express an opinion on the financial statements. We are responsible for the direction, supervision and performance of the Group audit. We remain solely responsible for our audit opinion.
We communicate with those charged with governance regarding, among other matters, the planned scope and timing of the audit and significant audit findings, including any significant deficiencies in internal control that we identify during our audit.
We also provide directors with a statement that we have complied with relevant ethical requirements regarding independence, and to communicate with them all relationships and other matters that may reasonably be thought to bear on our independence, and where applicable, related safeguards.
From the matters communicated with the directors, we determine those matters that were of most significance in the audit of the financial statements of the current period and are therefore the key audit matters. We describe these matters in our auditor’s report unless law or regulation precludes public disclosure about the matter or when, in extremely rare circumstances, we determine that a matter should not be communicated in our report because the adverse consequences of doing so would reasonably be expected to outweigh the public interest benefits of such communication.
Report on other legal and regulatory requirements
As required by the Kenyan Companies Act 2015 we report to you, based on our audit, that:
• we have obtained all the information and explanations which to the best of our knowledge and belief were necessary for the purposes of our audit;
• in our opinion proper books of account have been kept by the Company, so far as appears from our examination of those books; and
• the Company’s statement of financial position and statement of comprehensive income are in agreement with the books of account.
The engagement partner responsible for the audit resulting in this independent auditor’s report is CPA Kang’e Saiti -
P/No.1652.
Certified Public Accountants
Nairobi
8 March 2017

75Annual Report & Financial Statements • 2016 I
BUILDING TRUST BYBUILDING PEOPLE
John GachoraGroup Managing Director
Over the course of 2016, we maintained progressively good growth, delivering against a balanced scorecard of growth and efficiency supported
by a strong governance and control framework.

76 I Annual Report & Financial Statements • 2016
BUILDING TRUST BYBUILDING PEOPLE
STATEMENT OF PROFIT OR LOSS FOR THE YEAR ENDED 31 DECEMBER 2016
Bank Group
2016 2015 2016 2015
Shs’000 Shs’000 Note Shs’000 Shs’000
17,509,527 15,509,237 Interest income 7 19,020,675 17,014,132
(6,329,902) (6,661,165) Interest expense 8 (6,852,078) (7,271,599)
11,179,625 8,848,072 NET INTEREST INCOME 12,168,597 9,742,533
(3,711,702) (1,539,452) Credit impairment charges 12(c) (3,749,530) (1,652,475)
7,467,923 7,308,620 Net interest income after credit impairment charges 8,419,067 8,090,058
1,828,065 1,670,776 Fee and commission income 9(a) 2,010,351 1,844,430
(88,059) (63,794) Fee and commission expense 9(b) (100,410) (76,527)
1,740,006 1,606,982 NET FEE AND COMMISSION INCOME 1,909,941 1,767,903
1,232,078 1,391,914 Net trading income 10 1,304,143 1,563,091
432,773 356,140 Other operating income 11 705,065 624,640
10,872,780 10,663,656 NET OPERATING INCOME 12,338,216 12,045,692
(2,764,425) (2,466,156) Employee benefits 13 (3,397,131) (3,063,909)
(383,343) (382,524) Depreciation and amortisation 14(a) (499,842) (492,455)
(1,799,502) (1,555,320) Other operating expenses 14(b) (2,274,294) (2,092,053)
(4,947,270) (4,404,000) OPERATING EXPENSES (6,171,267) (5,648,417)
5,925,510 6,259,656 PROFIT BEFORE INCOME TAX 6,166,949 6,397,275
(1,783,363) (1,868,333) Income tax expense 15(a) (1,836,553) (1,912,150)
4,142,147 4,391,323 PROFIT FOR THE YEAR 4,330,396 4,485,125
Profit for the year attributable to:
4,142,147 4,391,323 Equity holders of the Bank 4,309,885 4,477,355
- - Non-controlling interests 20,511 7,770
4,142,147 4,391,323 4,330,396 4,485,125
Shs 6.47 Shs 6.86 EARNINGS PER SHARE (SHS) - BASIC AND DILUTED 16 Shs 6.73 Shs 7.00
The notes on pages 82 to 162 are an integral part of these financial statements.
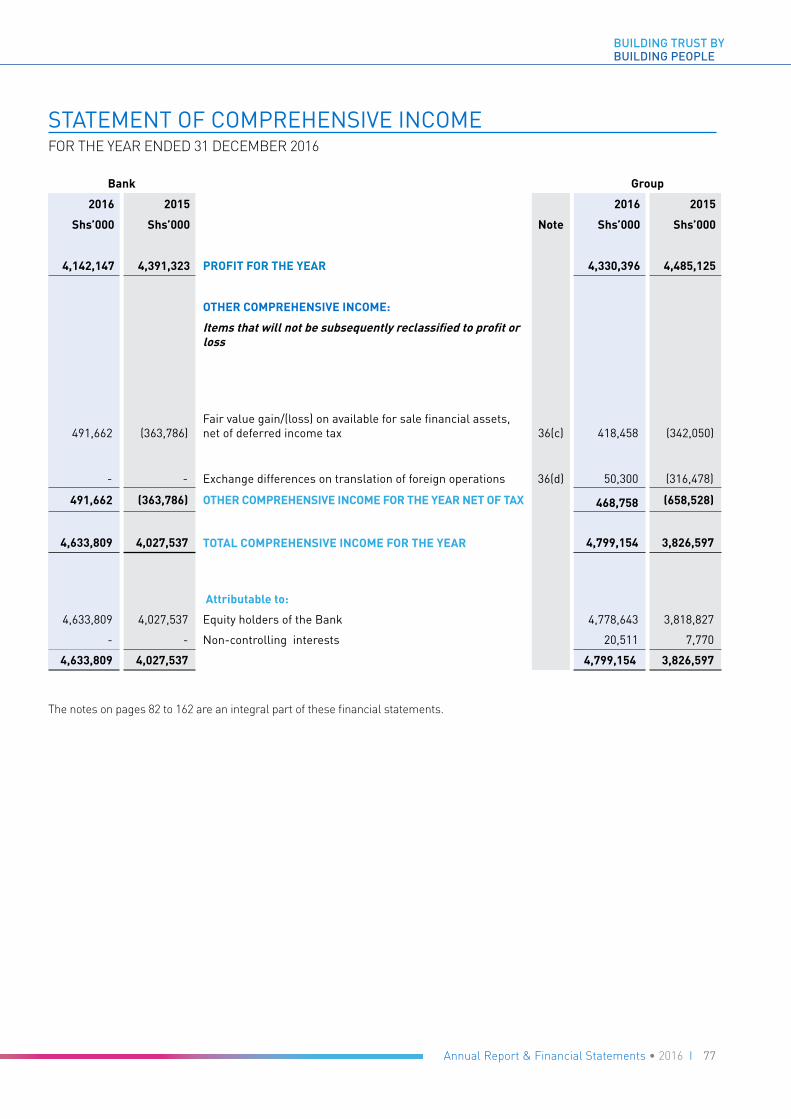
77Annual Report & Financial Statements • 2016 I
BUILDING TRUST BYBUILDING PEOPLE
STATEMENT OF COMPREHENSIVE INCOME FOR THE YEAR ENDED 31 DECEMBER 2016
Bank Group
2016 2015 2016 2015
Shs’000 Shs’000 Note Shs’000 Shs’000
4,142,147 4,391,323 PROFIT FOR THE YEAR 4,330,396 4,485,125
OTHER COMPREHENSIVE INCOME:
Items that will not be subsequently reclassified to profit or loss
491,662 (363,786)Fair value gain/(loss) on available for sale financial assets, net of deferred income tax 36(c) 418,458 (342,050)
- - Exchange differences on translation of foreign operations 36(d) 50,300 (316,478)
491,662 (363,786) OTHER COMPREHENSIVE INCOME FOR THE YEAR NET OF TAX 468,758 (658,528)
4,633,809 4,027,537 TOTAL COMPREHENSIVE INCOME FOR THE YEAR 4,799,154 3,826,597
Attributable to:
4,633,809 4,027,537 Equity holders of the Bank 4,778,643 3,818,827
- - Non-controlling interests 20,511 7,770
4,633,809 4,027,537 4,799,154 3,826,597
The notes on pages 82 to 162 are an integral part of these financial statements.

78 I Annual Report & Financial Statements • 2016
BUILDING TRUST BYBUILDING PEOPLE
STATEMENT OF FINANCIAL POSITION AS AT 31 DECEMBER 2016
Bank Group2016 2015 2016 2015
Shs’000 Shs’000 Note Shs’000 Shs’000ASSETS
5,946,309 7,291,629 Cash and balances with Central Banks 17 7,263,501 8,940,056405,412 804,882 Items in the course of collection 18 399,772 848,819
9,218,836 5,464,120 Due from banking institutions 19 9,682,207 6,675,64027,286,659 25,012,995 Government securities 20 30,698,495 27,911,907
105,671,725 106,516,052 Loans and advances to customers 22 113,040,863 114,657,6441,132,733 1,030,367 Other assets 23 1,338,613 1,192,9941,383,185 2,436,739 Due from group companies 24 - -
- - Current income tax 15(c) 137,003 112,7296,783,112 5,709,359 Investments 25 1,507,847 1,517,656
861,294 809,600 Property and equipment 27 1,043,497 1,063,760605,547 511,896 Intangible assets 28 1,071,441 991,513
6,875 7,000 Operating lease prepayments 29 522,875 523,0002,545,664 1,167,586 Deferred income tax 26 2,752,871 1,352,550
161,847,351 156,762,225 Total assets 169,458,985 165,788,268
LIABILITIES104,160,200 105,194,000 Customer deposits 30 111,824,685 112,364,637
2,627,565 7,734,613 Due to banking institutions 31 2,775,926 9,064,55218,976,920 14,131,007 Borrowings 32(a) 19,965,484 15,356,190
57,552 77,389 Derivative liabilities 21 57,552 77,3891,847,305 1,059,017 Due to group companies 33 - -
446,765 138,567 Current income tax 15(c) 455,649 148,4803,407,182 1,920,775 Other liabilities 34 3,998,726 2,378,407
35,599 52,471 Unclaimed dividends 35 35,599 52,471131,559,088 130,307,839 Total liabilities 139,113,621 139,442,126
EQUITYCapital and reserves attributable to equity holders of the Bank
3,199,728 3,199,728 Share capital 36(a) 3,199,728 3,199,7282,700,017 2,700,017 Share premium 36(a) 2,700,017 2,700,017
175,202 179,983 Revaluation surplus on property 36(b) 175,202 179,983(74,781) (566,443) Investments revaluation reserve 36(c) (208,875) (627,333)
- - Foreign currency translation reserve 36(d) (760,327) (810,627)961,793 937,629 Regulatory reserve(s) 36(e) 1,238,486 1,314,333
- - Other reserves 36(f) (157,172) (157,172)22,686,358 19,363,526 Retained earnings 36(g) 23,012,504 19,421,923
639,946 639,946 Proposed dividend 35 639,946 639,946
30,288,263 26,454,386Total capital and reserves attributable to equity holders of the Bank 29,839,509 25,860,798
- - Non-controlling interests 37 505,855 485,34430,288,263 26,454,386 Total equity 30,345,364 26,346,142
161,847,351 156,762,225 Total liabilities and equity 169,458,985 165,788,268
The financial statements on pages 76 to 162 were approved and authorised for issue by the Board of Directors on8th March 2017 and were signed on its behalf by
J P M NDEGWA J GACHORA(Chairman) (Group Managing Director)
F N MWANZIA L MURAGE(Director) (Group Company Secretary)

79Annual Report & Financial Statements • 2016 I
BUILDING TRUST BYBUILDING PEOPLE
CO
NSO
LID
ATED
STA
TEM
ENT
OF
CH
AN
GES
IN E
QU
ITY
FOR
TH
E YE
AR E
ND
ED 3
1 D
ECEM
BER
201
6
Shar
eCa
pita
lSh
are
Prem
ium
Rev
alua
-tio
nsu
rplu
s on
pr
oper
ty
Inve
st-
men
ts
reva
luat
ion
rese
rve
Fore
ign
curr
ency
tr
ansl
atio
n re
serv
e
Reg
ula-
tory
Res
erve
sOt
her
Res
erve
sR
etai
ned
earn
ings
Prop
osed
di
vide
nd
Capi
tal a
nd
rese
rves
at
trib
utab
le to
eq
uity
hol
ders
of
the
Ban
k
Non
-co
n-tr
ollin
g in
tere
sts
Tota
lEq
uity
Not
eSh
s’00
0Sh
s’00
0Sh
s’00
0Sh
s’00
0Sh
s’00
0Sh
s’00
0Sh
s’00
0Sh
s’00
0Sh
s’00
0Sh
s’00
0Sh
s’00
0Sh
s’00
0
At 1
Jan
uary
201
53,
199,
728
2,73
1,25
518
4,76
4(2
85,2
83)
(494
,149
)1,
041,
058
(157
,172
)16
,012
,992
639,
946
22,8
73,1
3947
7,57
423
,350
,713
Pro
fit fo
r th
e ye
ar-
--
--
--
4,47
7,35
5-
4,47
7,35
57,
770
4,48
5,12
5
Oth
er c
ompr
ehen
sive
inco
me,
net
of t
ax-
--
(342
,050
)(3
16,4
78)
--
--
(658
,528
)-
(658
,528
)
Tota
l com
preh
ensi
ve in
com
e fo
r th
e ye
ar-
--
(342
,050
)(3
16,4
78)
--
4,47
7,35
5-
3,81
8,82
77,
770
3,82
6,59
7
Tran
sfer
of e
xces
s de
prec
iatio
n36
(b)
-(6
,830
)-
--
-6,
830
--
--
Def
erre
d ta
x on
tran
sfer
of e
xces
s de
prec
iatio
n36
(b)
--
2,04
9-
--
-(2
,049
)-
--
-
Tran
sfer
to re
gula
tory
rese
rves
--
--
-27
3,27
5-
(273
,275
)-
--
-
Tran
sact
ions
with
ow
ners
, rec
orde
d di
rect
ly th
roug
h eq
uity
Rig
hts
issu
e ex
pens
es p
aid
-(3
1,23
8)-
--
--
--
(31,
238)
-(3
1,23
8)
Div
iden
ds p
aid
– Fi
nal f
or 2
014
35-
--
--
--
-(6
39,9
46)
(639
,946
)-
(639
,946
)D
ivid
ends
pai
d –
Inte
rim
for
2015
35-
--
--
--
(159
,984
)-
(159
,984
)-
(159
,984
)
Div
iden
ds P
ropo
sed
– Fi
nal f
or 2
015
--
--
--
-(6
39,9
46)
639,
946
--
-
At 3
1 D
ecem
ber
2015
3,
199,
728
2,70
0,01
717
9,98
3(6
27,3
33)
(810
,627
)1,
314,
333
(157
,172
)19
,421
,923
639,
946
25,8
60,7
9848
5,34
426
,346
,142
At 1
Jan
uary
201
63,
199,
728
2,70
0,01
717
9,98
3(6
27,3
33)
(810
,627
)1,
314,
333
(157
,172
)19
,421
,923
639,
946
25,8
60,7
9848
5,34
426
,346
,142
Pro
fit fo
r th
e ye
ar-
--
--
--
4,30
9,88
5-
4,30
9,88
520
,511
4,33
0,39
6O
ther
com
preh
ensi
ve in
com
e, n
et o
f tax
--
-41
8,45
850
,300
--
--
468,
758
-46
8,75
8
Tota
l com
preh
ensi
ve in
com
e fo
r th
e ye
ar-
--
418,
458
50,3
00-
-4,
309,
885
-4,
778,
643
20,5
114,
799,
154
Tran
sfer
of e
xces
s de
prec
iatio
n36
(b)
--
(6,8
30)
--
--
6,83
0-
--
-
Def
erre
d ta
x on
tran
sfer
of e
xces
s de
prec
iatio
n36
(b)
--
2,04
9-
--
-(2
,049
)-
--
-
Tran
sfer
to re
gula
tory
rese
rves
--
--
-(7
5,84
7)-
75,8
47-
--
-Tr
ansa
ctio
ns w
ith o
wne
rs, r
ecor
ded
dire
ctly
thro
ugh
equi
tyD
ivid
ends
pai
d –
Fina
l for
201
535
--
--
--
--
(639
,946
)(6
39,9
46)
-(6
39,9
46)
Div
iden
ds p
aid
– In
teri
m fo
r 20
1635
--
--
--
-(1
59,9
86)
-(1
59,9
86)
-(1
59,9
86)
Div
iden
d pr
opos
ed –
Fin
al fo
r 20
1635
--
--
--
(639
,946
)63
9,94
6-
--
At 3
1 D
ecem
ber
2016
3,19
9,72
82,
700,
017
175,
202
(208
,875
)(7
60,3
27)
1,23
8,48
6(1
57,1
72)
23,0
12,5
0463
9,94
629
,839
,509
505,
855
30,3
45,3
64
The
note
s on
pag
es 8
2 to
162
are
an
inte
gral
par
t of t
hese
fina
ncia
l sta
tem
ents
.
Non
-Dis
trib
utab
le
Dis
trib
utab
le

80 I Annual Report & Financial Statements • 2016
BUILDING TRUST BYBUILDING PEOPLE
BA
NK
STA
TEM
ENT
OF
CH
AN
GES
IN E
QU
ITY
FOR
TH
E YE
AR E
ND
ED 3
1 D
ECEM
BER
201
6
Shar
eC
apit
alSh
are
Pre
miu
m
Rev
alua
tion
surp
lus
on
prop
erty
Inve
stm
ents
re
valu
atio
n re
serv
eR
egul
ator
yre
serv
eR
etai
ned
earn
ings
Pro
pose
d di
vide
nd T
otal
Equi
tyN
ote
Shs’
000
Shs’
000
Shs’
000
Shs’
000
Shs’
000
Shs’
000
Shs’
000
Shs’
000
At J
anua
ry 2
015
3,19
9,72
82,
731,
255
184,
764
(202
,657
)91
9,00
415
,785
,977
639,
946
23,2
58,0
17P
rofit
for
the
year
--
--
-4,
391,
323
-4,
391,
323
Oth
er c
ompr
ehen
sive
inco
me,
net
of t
ax-
--
(363
,786
)-
--
(363
,786
)To
tal c
ompr
ehen
sive
inco
me
for
the
year
--
-(3
63,7
86)
-4,
391,
323
-4,
027,
537
Tran
sfer
of e
xces
s de
prec
iatio
n36
(b)
--
(6,8
30)
--
6,83
0-
-D
efer
red
tax
on tr
ansf
er o
f exc
ess
depr
ecia
tion
36 (b
)-
-2,
049
--
(2,0
49)
--
Tran
sfer
to r
egul
ator
y re
serv
e-
--
-18
,625
(18,
625)
--
Tran
sact
ions
with
ow
ners
, rec
orde
d di
rect
ly th
roug
h eq
uity
Rig
hts
issu
e ex
pens
es p
aid
-(3
1,23
8)-
--
--
(31,
238)
Div
iden
ds p
aid
– Fi
nal f
or 2
014
35-
--
--
-(6
39,9
46)
(639
,946
)D
ivid
ends
pai
d –
Inte
rim
for
2015
35-
--
--
(159
,984
)-
(159
,984
)D
ivid
ends
pro
pose
d –
Fina
l for
201
535
--
--
-(6
39,9
46)
639,
946
-
At 3
1 D
ecem
ber
3,19
9,72
82,
700,
017
179,
983
(566
,443
)93
7,62
919
,363
,526
639,
946
26,4
54,3
86
At 1
Jan
uary
201
63,
199,
728
2,70
0,01
717
9,98
3(5
66,4
43)
937,
629
19,3
63,5
2663
9,94
626
,454
,386
Pro
fit fo
r th
e ye
ar-
--
--
4,14
2,14
7-
4,14
2,14
7O
ther
com
preh
ensi
ve in
com
e, n
et o
f tax
--
-49
1,66
2-
--
491,
662
Tota
l com
preh
ensi
ve in
com
e fo
r th
e ye
ar-
--
491,
662
-4,
142,
147
-4,
633,
809
Tran
sfer
of e
xces
s de
prec
iatio
n36
(b)
--
(6,8
30)
--
6,83
0-
-D
efer
red
tax
on tr
ansf
er o
f exc
ess
depr
ecia
tion
36 (b
)-
-2,
049
--
(2,0
49)
--
Tran
sfer
to r
egul
ator
y re
serv
e-
--
-24
,164
(24,
164)
--
Tran
sact
ions
with
ow
ners
, rec
orde
d di
rect
ly th
roug
h eq
uity
Div
iden
ds p
aid
– Fi
nal f
or 2
015
35-
--
--
-(6
39,9
46)
(639
,946
)D
ivid
ends
pai
d –
Inte
rim
for
2016
35-
--
--
(159
,986
)-
(159
,986
)D
ivid
ends
pro
pose
d –
Fina
l for
201
635
--
--
-(6
39,9
46)
639,
946
-A
t 31
Dec
embe
r 20
163,
199,
728
2,70
0,01
717
5,20
2(7
4,78
1)96
1,79
322
,686
,358
639,
946
30,2
88,2
63
The
note
s on
pag
es 8
2 to
162
are
an
inte
gral
par
t of t
hese
fina
ncia
l sta
tem
ents
.
Non
-Dis
trib
utab
le
Dis
trib
utab
le
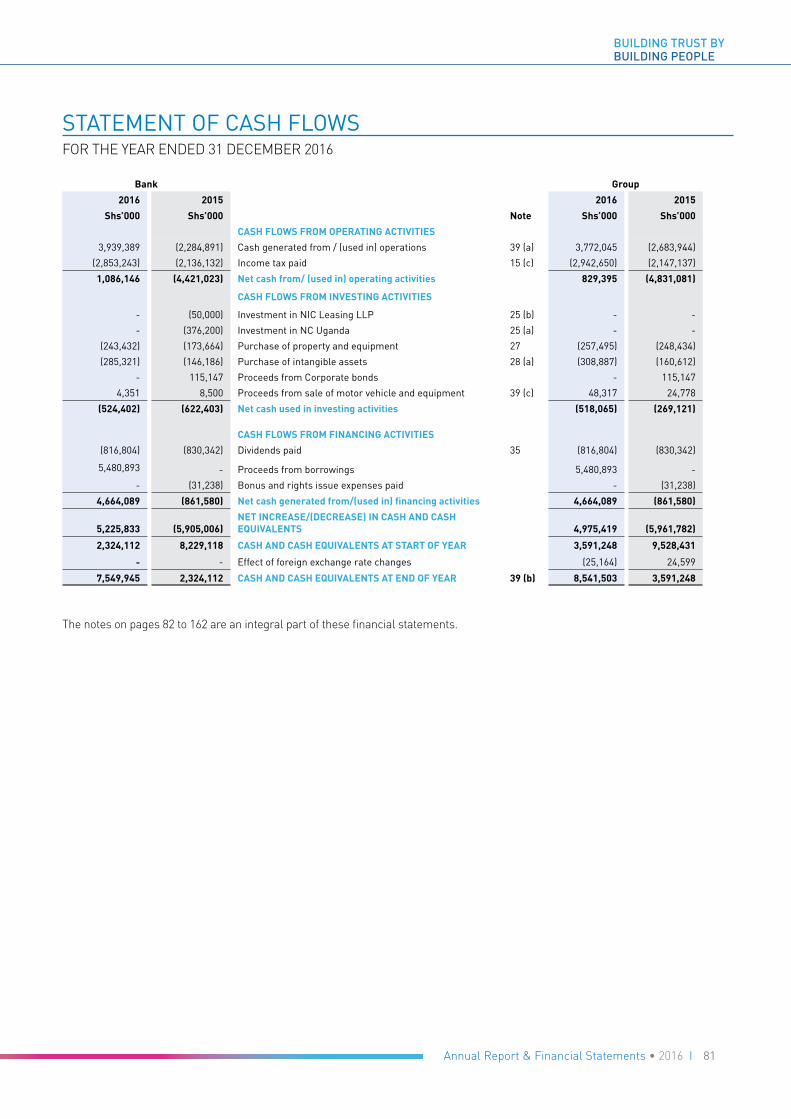
81Annual Report & Financial Statements • 2016 I
BUILDING TRUST BYBUILDING PEOPLE
STATEMENT OF CASH FLOWS FOR THE YEAR ENDED 31 DECEMBER 2016
Bank Group
2016 2015 2016 2015
Shs’000 Shs’000 Note Shs’000 Shs’000
CASH FLOWS FROM OPERATING ACTIVITIES
3,939,389 (2,284,891) Cash generated from / (used in) operations 39 (a) 3,772,045 (2,683,944)
(2,853,243) (2,136,132) Income tax paid 15 (c) (2,942,650) (2,147,137)
1,086,146 (4,421,023) Net cash from/ (used in) operating activities 829,395 (4,831,081)
CASH FLOWS FROM INVESTING ACTIVITIES
- (50,000) Investment in NIC Leasing LLP 25 (b) - -
- (376,200) Investment in NC Uganda 25 (a) - -
(243,432) (173,664) Purchase of property and equipment 27 (257,495) (248,434)
(285,321) (146,186) Purchase of intangible assets 28 (a) (308,887) (160,612)
- 115,147 Proceeds from Corporate bonds - 115,147
4,351 8,500 Proceeds from sale of motor vehicle and equipment 39 (c) 48,317 24,778
(524,402) (622,403) Net cash used in investing activities (518,065) (269,121)
CASH FLOWS FROM FINANCING ACTIVITIES
(816,804) (830,342) Dividends paid 35 (816,804) (830,342)
5,480,893 - Proceeds from borrowings 5,480,893 -
- (31,238) Bonus and rights issue expenses paid - (31,238)
4,664,089 (861,580) Net cash generated from/(used in) financing activities 4,664,089 (861,580)
5,225,833 (5,905,006)NET INCREASE/(DECREASE) IN CASH AND CASH EQUIVALENTS 4,975,419 (5,961,782)
2,324,112 8,229,118 CASH AND CASH EQUIVALENTS AT START OF YEAR 3,591,248 9,528,431
- - Effect of foreign exchange rate changes (25,164) 24,599
7,549,945 2,324,112 CASH AND CASH EQUIVALENTS AT END OF YEAR 39 (b) 8,541,503 3,591,248
The notes on pages 82 to 162 are an integral part of these financial statements.

82 I Annual Report & Financial Statements • 2016
BUILDING TRUST BYBUILDING PEOPLE
NOTES TO THE FINANCIAL STATEMENTSFOR THE YEAR ENDED 31 DECEMBER 2016
1) Reporting Entity
NIC Bank Limited (the “Bank/Parent”) and its subsidiaries (together, the “Group”) provide retail, corporate banking, brokerage, bancassurance, property and investment banking services. NIC Bank Limited is incorporated in Kenya under the Kenyan Companies Act 2015 as a public limited liability company and is domiciled in Kenya. The Bank’s shares are listed on the Nairobi Securities Exchange (NSE). NIC Bank Limited and its subsidiaries operate in Kenya, Tanzania and Uganda through its subsidiaries NIC Bank Tanzania Limited and NC Bank Uganda Limited.
The address of its registered office is as follows:
LR Plot No.8182NIC House, Masaba RoadP O Box 44599-00100Nairobi
For the Kenyan Companies Act 2015 reporting purposes, the balance sheet is represented by the statement of financial position and profit and loss account by the statement of profit or loss in these financial statements.
2) Standards and interpretations affecting the reported result or financial position
The principal accounting policies applied in the preparation of these financial statements are set out below. These policies have been consistently applied to all years presented, unless otherwise stated.
Basis of preparation
The financial statements have been prepared in accordance with International Financial Reporting Standards (IFRS) and the interpretations issued by the International Financial Reporting Interpretation Committee of the IASB (IFRIC) and the requirements of the Companies Act of Kenya, as amended.
i) Basis of measurement The measurement basis used is the historical cost basis except where otherwise stated in the accounting policies below.
For those assets and liabilities measured at fair value, fair value is the price that would be received to sell an asset or paid to transfer a liability in an orderly transaction between market participants at the measurement date. When measuring the fair value of an asset or a liability, the Bank uses market observable data as far as possible. If the fair value of an asset or a liability is not directly observable, it is estimated by the Bank using valuation techniques that maximise the use of relevant observable inputs and minimise the use of unobservable inputs (e.g. by use of the market comparable approach that reflects recent transaction prices for similar items or discounted cash flow analysis). Inputs used are consistent with the characteristics of the asset / liability that market participants would take into account.
Fair values are categorised into three levels of fair value hierarchy based on the degree to which the inputs to the measurements are observable and the significance of the inputs to the fair value measurement in its entirety:
- Level 1 fair value measurements are derived from quoted prices (unadjusted) in active markets for identical assets or liabilities.- Level 2 fair value measurements are derived from inputs other than quoted prices included within Level 1 that are observable for the asset or liability, either directly (i.e. as prices) or indirectly (i.e. derived from prices). - Level 3 fair value measurements are those derived from valuation techniques that include inputs for the asset or liability that are not based on observable market data (unobservable inputs)
Transfers between levels of the fair value hierarchy are recognised by the Bank at the end of the reporting period during which the change occurred.

83Annual Report & Financial Statements • 2016 I
BUILDING TRUST BYBUILDING PEOPLE
NOTES TO THE FINANCIAL STATEMENTS (Continued)FOR THE YEAR ENDED 31 DECEMBER 2016
2) Standards and interpretations affecting the reported result or financial position (Continued)
a) Basis of preparation(Continued)
ii) Use of estimatesThe preparation of financial statements in conformity with IFRS requires the use of certain critical accounting estimates. It also requires the directors to exercise their judgment in the process of applying the Group’s and Bank’s accounting policies. The areas involving a higher degree of judgment or complexity, or areas where assumptions and estimates are significant to the financial statements are disclosed in note 5.
iii) Changes in accounting policy and disclosures
New standards, amendments and interpretations adopted by the Group All new and revised standards and interpretations that have become effective for the first time in the financial year beginning 1 January 2016 merely clarify the existing requirements, thus do not affect the Group’s accounting policies or any of the disclosures. These include:
Amendments to IAS 1, ‘Presentation of Financial Statements’: The amendments provide clarifications on a number of issues, including:
• Materiality: An entity should not aggregate or disaggregate information in a manner that obscures useful information. Where items are material, sufficient information must be provided to explain the impact on the financial position or performance.
• Disaggregation and subtotals: Line items specified in IAS 1 may need to be disaggregated where this is relevant to an understanding of the entity’s financial position or performance.
• Notes: Confirmation that the notes do not need to be presented in a particular order.
• OCI arising from investments accounted for under the equity method: The share of OCI arising from equity-accounted investments is grouped based on whether the items will or will not subsequently be reclassified to profit or loss. Each group should then be presented as a single line item in the statement of other comprehensive income.
According to the transitional provisions, the disclosures in IAS 8 regarding the adoption of new standards/accounting policies are not required for these amendments.
Annual Improvements to IFRSs 2012-2014 Cycle: The latest annual improvements, clarify:
• IFRS 5: when an asset (or disposal group) is reclassified from ‘held for sale’ to ‘held for distribution’ or vice versa, this does not constitute a change to a plan of sale or distribution and does not have to be accounted for as such.
• IFRS 7: Gives specific guidance for transferred financial assets to help management determine whether the terms of a servicing arrangement constitute ‘continuing involvement’ and, therefore, whether the asset qualifies for de recognition.
• IFRS 7: Improvements clarified that the additional disclosures relating to the offsetting of financial assets and financial liabilities only need to be included in interim reports if required by IAS 34.
• IAS 19: Improvements clarified that when determining the discount rate for post-employment benefit obligations, it is the currency that the liabilities are denominated in that is important and not the country where they arise.
• IAS 34: Improvements clarified what is meant by the reference in the standard to ‘information disclosed elsewhere in the interim financial report’ and adds a requirement to cross-reference from the interim financial statements to the location of that information and make the information available to users on the same terms and at the same time as the interim financial statements.
Amendment to IAS 27 ‘Separate Financial Statements’: The amendments allow entities to use the equity method in their separate financial statements to measure investments in subsidiaries, joint ventures and associates. IAS 27 currently allows entities to measure their investments in subsidiaries, joint ventures and associates either at cost or as a financial asset in their separate financial statements. The amendments introduce the equity method as a third option. The election can be made independently for each category of investment (subsidiaries, joint ventures and associates). Entities wishing to change to the equity method must do so retrospectively.

84 I Annual Report & Financial Statements • 2016
BUILDING TRUST BYBUILDING PEOPLE
NOTES TO THE FINANCIAL STATEMENTS (Continued)FOR THE YEAR ENDED 31 DECEMBER 2016
2) Standards and interpretations affecting the reported result or financial position (Continued)
a) Basis of preparation(Continued)
Amendments to IFRS 11 ‘joint arrangement’: These amendments clarifies the accounting for the acquisition of an interest in a joint operation where the activities of the operation constitute a business. They require an investor to apply the principles of business combination accounting when it acquires an interest in a joint operation that constitutes a business. This includes measuring identifiable assets and liabilities at fair value; expensing acquisition-related costs; recognising deferred tax, and; recognising the residual as goodwill, and testing this for impairment annually. Existing interests in the joint operation are not re-measured on acquisition of an additional interest, provided joint control is maintained. The amendments also apply when a joint operation is formed and an existing business is contributed.
Amendments to IAS 16 and IAS 38: The IASB has amended IAS 16 Property, Plant and Equipment to clarify that a revenue-based method should not be used to calculate the depreciation of items of property, plant and equipment. IAS 38 Intangible Assets now includes a rebuttable presumption that the amortisation of intangible assets based on revenue is inappropriate. This presumption can be overcome if either: the intangible asset is expressed as a measure of revenue (i.e. where a measure of revenue is the limiting factor on the value that can be derived from the asset), or it can be shown that revenue and the consumption of economic benefits generated by the asset are highly correlated.
Amendments to IFRS 10 Consolidated Financial Statements and IAS 28 Investments in associates and joint ventures: Clarifies that:
• The exception from preparing consolidated financial statements is also available to intermediate parent entities which are subsidiaries of investment entities
• An investment entity should consolidate a subsidiary which is not an investment entity and whose main purpose and activity is to provide services in support of the investment entity’s investment activities.
• Entities which are not investment entities but have an interest in an associate or joint venture which is an investment entity have a policy choice when applying the equity method of accounting. The fair value measurement applied by the investment entity associate or joint venture can either be retained, or a consolidation may be performed at the level of the associate or joint venture, which would then unwind the fair value measurement.
New and revised standards and interpretations which have been issued but are not yet effective
The Group has not applied the following revised standards and interpretations that have been published but are not yet effective for the year beginning after 1 January 2016.
IFRS 9, ‘Financial instruments’, addresses the classification, measurement and recognition of financial assets and financial liabilities. The complete version of IFRS 9 was issued in July 2014. It replaces the guidance in IAS 39 that relates to the classification and measurement of financial instruments. IFRS 9 retains but simplifies the mixed measurement model and establishes three primary measurement categories for financial assets: amortised cost, fair value through OCI and fair value through P&L. The basis of classification depends on the entity’s business model and the contractual cash flow characteristics of the financial asset. Investments in equity instruments are required to be measured at fair value through profit or loss with the irrevocable option at inception to present changes in fair value in OCI not recycling. There is now a new expected credit losses model that replaces the incurred loss impairment model used in IAS 39. For financial liabilities there were no changes to classification and measurement except for the recognition of changes in own credit risk in other comprehensive income, for liabilities designated at fair value through profit or loss. IFRS 9 relaxes the requirements for hedge effectiveness by replacing the bright line hedge effectiveness tests. It requires an economic relationship between the hedged item and hedging instrument and for the ‘hedged ratio’ to be the same as the one management actually use for risk management purposes.
Contemporaneous documentation is still required but is different to that currently prepared under IAS 39. The standard is effective for accounting periods beginning on or after 1 January 2018. Early adoption is permitted.

85Annual Report & Financial Statements • 2016 I
BUILDING TRUST BYBUILDING PEOPLE
NOTES TO THE FINANCIAL STATEMENTS (Continued)FOR THE YEAR ENDED 31 DECEMBER 2016
2) Standards and interpretations affecting the reported result or financial position (Continued)
a) Basis of preparation(Continued)
New and revised standards and interpretations which have been issued but are not yet effective (Continued)
IFRS 15, ‘Revenue from contracts with customers’ deals with revenue recognition and establishes principles for reporting useful information to users of financial statements about the nature, amount, timing and uncertainty of revenue and cash flows arising from an entity’s contracts with customers. Revenue is recognised when a customer obtains control of a good or service and thus has the ability to direct the use and obtain the benefits from the good or service. The standard replaces IAS 18 ‘Revenue’ and IAS 11 ‘Construction contracts’ and related interpretations. The standard is effective for annual periods beginning on or after 1 January 2018 and earlier application is permitted.
IFRS 16,’Leases’: This standard requires that lessees should be required to recognise assets and liabilities arising from all leases (with limited exceptions) on the balance sheet. Lessor accounting has not substantially changed in the new standard. The model reflects that, at the start of a lease, the lessee obtains the right to use an asset for a period of time and has an obligation to pay for that right. In response to concerns expressed about the cost and complexity to apply the requirements to large volumes of small assets, the IASB decided not to require a lessee to recognise assets and liabilities for short-term leases (less than 12 months), and leases for which the underlying asset is of low value (such as laptops and office furniture). The standards is effective for annual periods beginning 1 January 2019. Early adoption is permitted only if IFRS 15 is adopted at the same time.
Recognition of Deferred Tax Asset for Unrealised Losses: IAS 12 has been amended to clarify the accounting for deferred tax where an asset is measured at fair value and that fair value is below the asset’s tax base. Specifically, the amendments confirm that:
• A temporary difference exists whenever the carrying amount of an asset is less than its tax base at the end of the reporting period.
• An entity can assume that it will recover an amount higher than the carrying amount of an asset to estimate its future taxable profit.
• Where the tax law restricts the source of taxable profits against which particular types of deferred tax assets can be recovered, the recoverability of the deferred tax assets can only be assessed in combination with other deferred tax assets of the same type.
• Tax deductions resulting from the reversal of deferred tax assets are excluded from the estimated future taxable profit that is used to evaluate the recoverability of those assets.
The amendment to IAS 12 is effective 1 January 2017.
Disclosure Initiative – Amendments to IAS 7: Effective 1 January 2017, entities will be required to explain changes in their liabilities arising from financing activities. This includes changes arising from cash flows (e.g. drawdowns and repayments of borrowings) and on cash changes such as acquisitions, disposals, accretion of interest and unrealized exchange differences. Changes in financial assets must be included in this disclosure if the cash flows were, or will be included in cash flows from financing activities. This could be the case, for example, for assets that hedge liabilities arising from financing liabilities.
Entities may include changes in other items as part of this disclosure, for example, by providing a, net debt, reconciliation. However, in this case the changes in other items must be disclosed separately from the changes in liabilities arising from financing activities. The information may be disclosed in tabular format as a reconciliation from opening and closing balances, but a specific format is not mandated.
The Directors are assessing the impact of the standards and will subsequently choose the adoption date. There are no other IFRSs or IFRIC interpretations that are not yet effective that would be expected to have a material impact on the Group.

86 I Annual Report & Financial Statements • 2016
BUILDING TRUST BYBUILDING PEOPLE
NOTES TO THE FINANCIAL STATEMENTS (Continued)FOR THE YEAR ENDED 31 DECEMBER 2016
3. Summary of significant accounting policies
a) Consolidation
i) Subsidiaries
The consolidated financial statements comprise the financial statements of NIC Bank Limited and its subsidiary companies made up to 31 December. Subsidiary undertakings have been fully consolidated. All intercompany transactions, balances and unrealised surpluses and deficits on transactions between Group companies have been eliminated.
Subsidiaries are all entities over which the Group has control. The group controls an entity when the group is exposed to, or has rights to, variable returns from its involvement with the entity and has the ability to affect those returns through its power over the entity. Subsidiaries are fully consolidated from the date on which control is transferred to the group. They are deconsolidated from the date that control ceases.
The accounting policies of subsidiaries have been changed when necessary to align them with the policies adopted by the Group.
A listing of the Bank’s subsidiaries is set out in Note 25 (b).
The acquisition method of accounting is used when subsidiaries are acquired by the group. The cost of an acquisition in a business combination is measured at fair value, which is calculated as the sum of the acquisition-date fair values of the consideration transferred by the Group, liabilities assumed by the Group from the former owners of the acquiree and the equity interests issued by the Group in exchange for control of the acquiree. Acquisition-related costs are recognised in profit or loss as incurred.
At the acquisition date, the acquired identifiable assets and the liabilities assumed are generally measured and recognized at their fair value.
Goodwill is measured as the excess of the sum of the consideration transferred, the amount of any non-controlling interests in the acquiree, and the fair value of the Group’s previously held equity interest in the acquiree (if any) over the net of the acquisition-date amounts of the identifiable assets acquired and the liabilities assumed.
In the event that the amounts of net assets acquired is in excess of the aggregate of the consideration transferred, the amount of non-controlling interest and the fair value of Group’s previously held equity interest, the difference is recognised immediately in profit or loss as a bargain purchase.
In a business combination achieved in stages, the previously held equity interest is re-measured at the acquisition-date fair value with the resulting gain or loss recognised in profit or loss.
Non-controlling interests that are present ownership interests and entitle their holders to a proportionate share of the entity’s net assets in the event of liquidation may be initially measured either at fair value or at the non-controlling interests’ proportionate share of the recognised amounts of the acquiree’s identifiable net assets. The choice of measurement basis is made on a transaction-by-transaction basis. Other types of non-controlling interests are measured at fair value or, when applicable, on the basis specified in another IFRS.
Additional information required by the regulatory bodies is included where appropriate.
ii) Changes in ownership interest in subsidiaries without change of controlTransactions with non-controlling interests that do not result in loss of control are accounted for as equity transactions – that is, as transactions with the owners in their capacity as owners. The difference between fair value of any consideration paid and the relevant share acquired of the carrying value of net assets of the subsidiary is recorded in equity. Gains or losses on disposals to non-controlling interests are also recorded in equity.

87Annual Report & Financial Statements • 2016 I
BUILDING TRUST BYBUILDING PEOPLE
NOTES TO THE FINANCIAL STATEMENTS (Continued)FOR THE YEAR ENDED 31 DECEMBER 2016
3) Summary of significant accounting policies (Continued)
b) Foreign currencies
i) Functional and presentation currencyThe financial statements of each of the Group’s entities are measured using the currency of the primary economic environment in which the entity operates (the “Functional Currency”). The financial statements are presented in Kenya Shillings, which is the Group and the Bank’s Functional and Presentation Currency. Except as indicated, financial information presented in Kenya Shillings has been rounded to the nearest thousand.
ii) Transactions and balances
Foreign currency transactions that are transactions denominated, or that require settlement, in a foreign currency are translated into the respective functional currencies of the operations using the exchange rates prevailing at the dates of the transactions.
At the end of each reporting period, monetary items denominated in foreign currencies are retranslated at the rates prevailing at that date.
Foreign currency exchange gains and losses resulting from the settlement of such transactions and from the translation at year end exchange rates of monetary assets and liabilities denominated in foreign currencies are recognised in profit or loss.
Translation differences on non-monetary financial instruments, such as equities held at fair value through profit or loss, are reported as part of the fair value gain or loss. Translation differences on non-monetary financial instruments, such as equities classified as available-for-sale financial assets, are included in other comprehensive income.
iii) Group companies
The results and financial position of Group entities that have a functional currency different from the presentation currency are re-translated into the presentation currency as follows:
For the purpose of presenting consolidated financial statements, the assets and liabilities of the Group’s foreign operations are expressed in Kenyan shillings using exchange rates prevailing at the reporting date. Income and expense items of foreign operations are retranslated at average exchange rates for the period.
Foreign currency exchange differences are reported as “exchange differences on translations of foreign operations” and are recognised in other comprehensive income and presented in the foreign currency translation reserve in equity.
c) Income recognition
i) Interest income and expense
Interest income and expense for all interest bearing financial instruments are recognised in profit or loss on accrual basis using the effective interest method. The effective interest rate is the rate that exactly discounts the estimated future cash payments and receipts through the expected life of the financial instruments (or, where appropriate, a shorter period) to the carrying amount of the financial instruments. The effective interest rate is established on initial recognition of the financial instrument.
The calculation of the effective interest rate includes all fees and points paid or received transaction costs, and discounts or premiums that are an integral part of the effective interest rate. Transaction costs are incremental costs that are directly attributable to the acquisition, issue or disposal of a financial instrument.
Once a financial asset or a group of similar financial assets has been written down as a result of an impairment loss, interest income is recognised using the rate of interest that was used to discount the future cash flows for purposes of measuring the allowance for impairment.
Interest income and expense on all trading assets and liabilities are considered to be incidental to the Group’s trading operations and are presented together with all other changes in the fair value of trading assets and liabilities in net trading income.

88 I Annual Report & Financial Statements • 2016
BUILDING TRUST BYBUILDING PEOPLE
NOTES TO THE FINANCIAL STATEMENTS (Continued)FOR THE YEAR ENDED 31 DECEMBER 2016
3) Summary of significant accounting policies (Continued)
c) Income recognition (Continued)
ii) Fee and commission income and expenses
In the normal course of business, the Group earns fees and commission income from a diverse range of services to its customers. Fees and commission income and expenses that are integral to the effective interest rate on a financial instrument are included in the measurement of the effective interest rate.
Other fees and commission income, including account servicing fees, investment management fees, placement fees, brokerage fees, bancassurance fees, and syndication fees, are recognised as the related services are performed. When a loan commitment is not expected to result in the draw-down of a loan, loan commitment fees are recognised on a straight-line basis over the commitment period.
Other fees and commission expense relates mainly to transaction and service fees, which are incurred as the services are received.
iii) Net trading income
Net trading income arises from the margins which are achieved through market-making and customer business and from changes in market value caused by movements in interest and exchange rates, equity prices and other market variables. It comprises gains less losses related to trading assets and liabilities, and includes all realised and unrealised fair value changes, interest, dividends and foreign exchange differences.
d) Financial instruments
i) RecognitionRegular purchases and sales of financial assets are recognised on the trade-date – the date on which the Group commits to purchase or sell the asset. Loans and receivables are initially recognised at fair value plus transaction costs and subsequently carried at amortised cost using the effective interest method.
ii) Classification
1. Financial assets
The Group classifies its financial assets into the following categories:
• At fair value through profit or loss• Loans and receivables• Held-to-maturity investments• Available-for-sale investments
Management determines the appropriate classification of its investments at initial recognition.
a) Financial assets at fair value through profit or loss
This category has two sub-categories: Financial assets classified as held for trading and those designated at fair value through profit or loss at inception.
A financial asset is classified as held for trading if acquired principally for the purpose of selling in the short term. Derivatives are also categorised as held for trading unless they are designated and effective as hedging instruments. Financial instruments included in this category are recognised initially at fair value, transactions costs are taken directly to profit or loss. Gains and losses arising from changes in fair value are included directly in profit or loss.

89Annual Report & Financial Statements • 2016 I
BUILDING TRUST BYBUILDING PEOPLE
NOTES TO THE FINANCIAL STATEMENTS (Continued)FOR THE YEAR ENDED 31 DECEMBER 2016
3) Summary of significant accounting policies (Continued)
d) Financial instruments (Continued)
II) Classification (Continued)
1. Financial assets (Continued)
a) Financial assets at fair value through profit or loss (Continued)
The group designates certain financial assets upon initial recognition as at fair value through profit or loss (fair value option). This designation cannot subsequently be changed and can only be applied when the following conditions are met:
- the application of the fair value option reduces or eliminates an accounting measurement mismatch or
- the financial assets are part of a portfolio of financial instruments which is risk managed and reported to key management personnel on a fair value basis.
For the Group, these comprise derivative assets (Note 21), certain government securities as set out in Note 20, quoted shares and unquoted equity investments (Note 25). Fair value changes relating to financial assets designated at fair value through profit or loss are recognised in ‘Net gains on financial instruments designated at fair value through profit or loss’ under ‘net trading income’ (Note 10).
b) Loans and receivables
Loans and advances to customers and trade receivables are non-derivative financial assets with fixed or determinable payments and fixed maturities that are not quoted in an active market and which the Group does not intend to sell immediately or in the near term. Loans and advances to customers are recognised when cash is advanced to borrowers.
c) Held-to-maturity investments
These are non-derivative financial assets with fixed or determinable payments and fixed maturities that the Group has the positive intention and ability to hold to maturity. Where a sale occurs, other than an insignificant amount of held-to-maturity assets, the entire category would be tainted and classified as available for sale.
d) Available-for-sale investments
Available-for-sale financial assets are assets that are intended to be held for an indefinite period of time, which may be sold in response to needs for liquidity or changes in interest rates, exchange rates or equity prices or that are not classified as (a) financial assets at fair value through profit or loss, (b) loans and receivables, or (c) financial assets held to maturity.
Available for sale financial assets are initially recognised at fair value and measured subsequently at fair value with gains and losses being recognised in other comprehensive income and accumulated in the investments revaluation reserve with the exception of;
• impairment losses,• interest calculated using the effective interest rate method,• foreign exchange gains and losses on monetary assets which are recognised in profit or loss.
2. Financial liabilities
Financial liabilities are recognised when the Group enters into the contractual provisions of the arrangements with counterparties, which is generally on trade date, and initially measured at fair value, which is normally the consideration received, net of directly attributable transaction costs incurred. Subsequent measurement of financial liabilities is at amortised cost using effective interest rate method. Financial liabilities include deposits from banks or customers, trade payables in the brokerage and borrowings for which the fair value option is not applied.
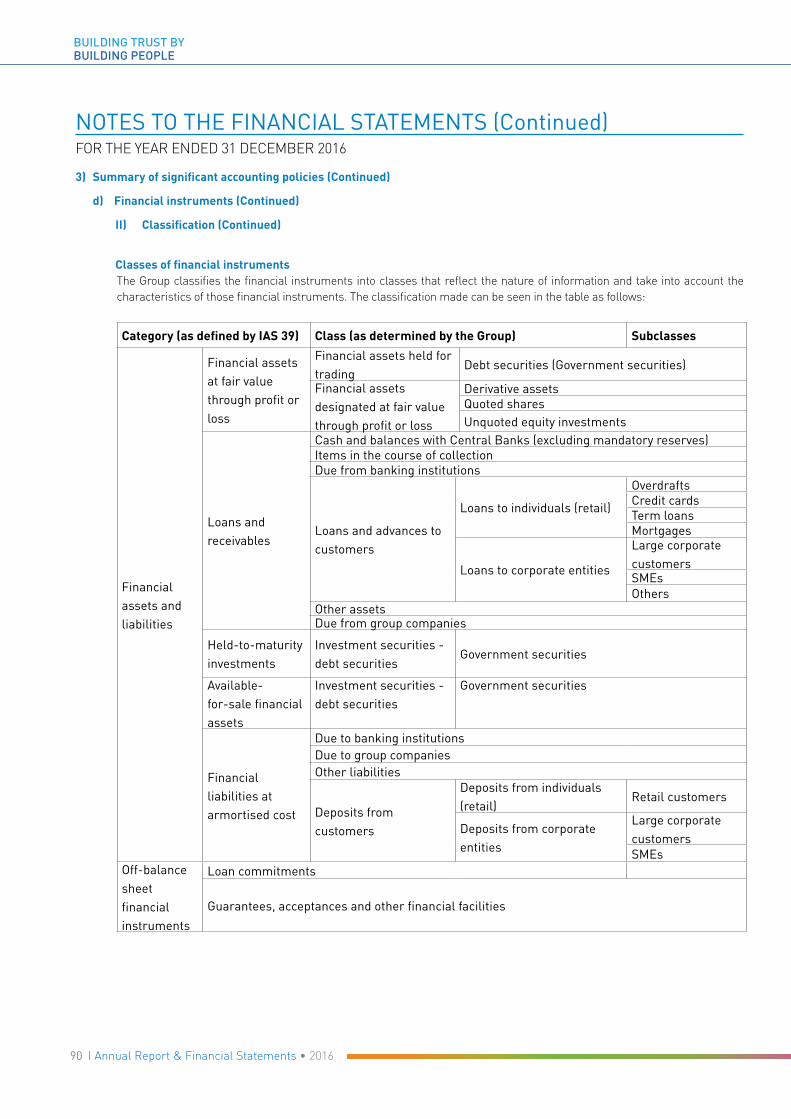
90 I Annual Report & Financial Statements • 2016
BUILDING TRUST BYBUILDING PEOPLE
NOTES TO THE FINANCIAL STATEMENTS (Continued)FOR THE YEAR ENDED 31 DECEMBER 2016
3) Summary of significant accounting policies (Continued)
d) Financial instruments (Continued)
II) Classification (Continued)
Classes of financial instrumentsThe Group classifies the financial instruments into classes that reflect the nature of information and take into account the characteristics of those financial instruments. The classification made can be seen in the table as follows:
Category (as defined by IAS 39) Class (as determined by the Group) Subclasses
Financial assets and liabilities
Financial assets at fair value through profit or loss
Financial assets held for trading
Debt securities (Government securities)
Financial assets designated at fair value through profit or loss
Derivative assetsQuoted sharesUnquoted equity investments
Loans and receivables
Cash and balances with Central Banks (excluding mandatory reserves)Items in the course of collectionDue from banking institutions
Loans and advances to customers
Loans to individuals (retail)
OverdraftsCredit cardsTerm loansMortgages
Loans to corporate entities
Large corporate customersSMEsOthers
Other assetsDue from group companies
Held-to-maturity investments
Investment securities - debt securities
Government securities
Available-for-sale financial assets
Investment securities - debt securities
Government securities
Financial liabilities at armortised cost
Due to banking institutionsDue to group companiesOther liabilities
Deposits from customers
Deposits from individuals (retail)
Retail customers
Deposits from corporate entities
Large corporate customersSMEs
Off-balance sheet financial instruments
Loan commitments
Guarantees, acceptances and other financial facilities

91Annual Report & Financial Statements • 2016 I
BUILDING TRUST BYBUILDING PEOPLE
NOTES TO THE FINANCIAL STATEMENTS (Continued)FOR THE YEAR ENDED 31 DECEMBER 2016
3) Summary of significant accounting policies (Continued)
d) Financial instruments (Continued)
iii) DerecognitionThe Group derecognises a financial asset when the contractual rights to the cash flows from the asset expire, or substantially all the risks and rewards of ownership incidental to the financial asset are transferred. A financial liability is derecognised when its contractual obligations are redeemed or otherwise extinguished.
iv) Measurement
Financial instruments are initially recognised at fair value plus transaction costs.
Financial assets at ‘fair value through profit or loss’ are subsequently carried at fair value. Gains and losses arising from changes in the fair value in those assets are recognised in profit or loss.
Gains and losses arising from changes in the fair value of ‘available-for-sale financial assets’ are recognised in other comprehensive income in the period in which they arise and accumulated in the investment revaluation reserves.
When securities classified as available-for-sale are sold or impaired, the accumulated fair value adjustments previously recognised in the investment revaluation reserves are reclassified to profit or loss.
Dividends on available-for-sale equity instruments are recognised in profit or loss as part of other income when the Group’s right to receive payments is established.
The fair values of quoted investments are based on the most representative price within the bid-ask spread. If the market for a financial asset is not active (and for unquoted securities), the Group establishes fair value by using valuation techniques that include the use of various valuation methodology. The fair value of financial instruments where no active market exists or where quoted prices are not otherwise available are determined by using valuation techniques. In these cases, the fair values are estimated from observable data in respect of similar financial instruments or using models. Where market observable inputs are not available, they are estimated based on appropriate assumptions. Where valuation techniques (for example, models) are used to determine fair values, they are validated and periodically reviewed by qualified personnel independent of those that sourced them.
Loans and receivables and held to maturity investments are carried at amortised cost using the effective interest rate method.
Financial liabilities are subsequently measured at amortised cost.
v) Impairment of financial assets
1. Amounts carried at amortised cost
The Group reviews regularly, on a case-by–case basis, whether any objective evidence exists of impairment, individually for financial assets that are significant and individually or collectively for financial assets that are not individually significant. Financial assets are impaired when objective evidence demonstrates that a loss event has occurred after the initial recognition of the asset and that the loss event has an impact on the future cash flows of the asset that can be estimated reliably.
Loans and receivables are recognised initially at fair value and subsequently measured at amortised cost using the effective interest method, less provision for impairment. A provision for impairment of loans and receivables is established when there is objective evidence that the Group will not be able to collect all amounts due according to the original terms of the receivables. The amount of provision is the difference between the asset’s carrying amount and the present value of estimated future cash flows, discounted at the original effective interest rate. The carrying amount of the asset is reduced through the use of an allowance account, and the amount of the loss is recognised in profit or loss as ‘Credit impairment charges’. When a loan or receivable is uncollectible, it is written off against the related allowance account. Subsequent recoveries of amounts previously written off are credited through profit or loss.

92 I Annual Report & Financial Statements • 2016
BUILDING TRUST BYBUILDING PEOPLE
NOTES TO THE FINANCIAL STATEMENTS (Continued)FOR THE YEAR ENDED 31 DECEMBER 2016
3) Summary of significant accounting policies (Continued)
d) Financial instruments (Continued)
v) Impairment of financial assets (Continued)
1. Amounts carried at amortised cost (Continued)Objective evidence that loans and receivables are impaired includes significant financial difficulties of the debtor, probability that the debtor will enter bankruptcy or financial reorganisation, and default or delinquency in payments (more than 30 days overdue), the disappearance of an active market for a security, or other observable data relating to a group of assets such as adverse changes in the payment status of borrowers or issuers in the group, or economic conditions that correlate with defaults in the Group are considered indicators that the loans or receivable is impaired. In assessing impairment losses, the Group considers the following factors, in each category:
a. Individually assessed loans• The aggregate exposure to the Group.• The viability of the customer’s business model and its capacity to trade successfully out of financial
difficulties and generate sufficient cash flows to meet its debt obligations. • The realisable value of the security (or other mitigants) and likelihood of successful repossession net of
any costs involved in recovery of amounts. • The amount and timing of expected receipts and, in cases of liquidation or bankruptcy, dividend available. • The extent and complexity of other creditors’ commitment ranking pari passu with the Group and the
likelihood of other creditors continuing to support the customer.
b. Collectively assessed • For loans not subject to individual assessment, to cover losses which have been incurred but have not
yet been identified. • For homogeneous groups of loans that are not considered individually significant, where there is objective
evidence of impairment.
Homogeneous groups of loansFor homogeneous groups of loans that are not considered individually significant, or in other cases, when the portfolio size is small or when information is insufficient or not reliable enough, the Group adopts a formulaic approach which allocates progressively higher percentage loss rates in line with the period of time for which a customer’s loan is overdue. Loss rates are calculated from the discounted expected future cash flows from a portfolio. These rates and the expected timing of future recoveries are regularly benchmarked against actual outcomes to ensure they remain appropriate.
Loan write – offs An uncollectible loan is written off against the relevant provision for impairment, either partially or in full, when there is no realistic prospect of recovery and the proceeds from realising the security have been substantially or fully recovered.
Restructured loans Restructured loans, whose terms have been renegotiated are no longer considered to be past due but are treated as new loans after the minimum required number of payments under the new arrangement have been received.
2. Amounts classified as available for saleIn the case of equity securities classified as available-for-sale, a significant or prolonged decline in the fair value of the security below its cost is considered as an indicator that the securities are impaired. If any such evidence exists for available-for-sale financial assets, the cumulative loss measured as the difference between the acquisition cost and the current fair value, less any impairment loss on that financial asset previously recognised in profit or loss – is removed from other comprehensive income and recognised in profit or loss. Impairment losses recognised in profit or loss on equity instruments are not reversed through profit or loss.
93Annual Report & Financial Statements • 2016 I
BUILDING TRUST BYBUILDING PEOPLE
NOTES TO THE FINANCIAL STATEMENTS (Continued)FOR THE YEAR ENDED 31 DECEMBER 2016
3) Summary of significant accounting policies (Continued)
d) Financial instruments (Continued)
vi) Impairment of non-financial assets
At the end of each reporting period, the Group reviews the carrying amount of its tangible and intangible assets to determine whether there is any indication that these assets have suffered an impairment loss.
If objective evidence on impairment losses exists, the recoverable amount of the asset is estimated in order to determine the extent of the impairment loss. The carrying amount of the asset is reduced through the use of an allowance account and the amount of the loss is recognised in profit or loss. In cases where the asset is carried at revalued amount, the impairment loss is treated as a revaluation decrease.
In determining the recoverable amount, the Group considers the higher of the fair value of the asset less costs to sell, and value in use. In estimating value in use, the Group is cognisant of the estimated future cash flows discounted to the present value using a pre-tax discount rate that is reflective of the current market assessment of time value of money and the risks specific to the asset itself.
Intangible assets with indefinite useful life are tested for impairment annually, and when there is indication that the asset may be impaired.
Where impairment loss subsequently reverses, the carrying amount of the asset (or cash-generating unit) is increased to the revised estimate of its recoverable amount, but so that the increased carrying amount does not exceed the carrying amount that would have been determined had no impairment loss been recognised, unless such asset is carried at revalued amount, in which case the reversal of the impairment loss is treated as revaluation income.
Impairment loss on goodwill is not reversed.
e) Offsetting Financial instruments are offset and the net amount reported in the statement of financial position when there is a legal right to set off the amounts and there is an intention to settle on a net basis or to realise the asset and settle the liability simultaneously.
f) Employee expenses
i) Retirement benefit obligations
The Group operates a defined contribution plan under which the Group pays fixed contributions into a separate entity. The Group has no obligation, legal or constructive, to pay further contributions if the scheme does not have sufficient assets to pay all employees the benefits relating to employee service in the current and prior periods. The assets of the scheme are held in a separate trustee administered fund, which is funded by contributions from both the Group and the employees.
In addition, the Group also contributes to the National Social Security Fund in Kenya, Parastatal Pension Fund in Tanzania and National Social Security Fund in Uganda, which are defined contribution scheme registered under respective Acts of Parliament in the respective countries.
The Group’s contributions to the defined contribution schemes are charged to the profit or loss in the year in which they relate.
Contract staff are entitled to gratuity payment at the completion of the contract. Provision is made for gratuity in line with the contracts.
ii) Short-term benefitsShort-term employee benefit obligations (e.g. medical reimbursements and insurance) are measured on an undiscounted basis and are expensed as the employee renders service.
The monetary benefits for employee accrued leave entitlement at the reporting date are recognised as an expense accrual.
94 I Annual Report & Financial Statements • 2016
BUILDING TRUST BYBUILDING PEOPLE
NOTES TO THE FINANCIAL STATEMENTS (Continued)FOR THE YEAR ENDED 31 DECEMBER 2016
3) Summary of significant accounting policies (Continued)
g) Leasehold landPayments to acquire leasehold interest in land are treated as prepaid operating lease rentals and amortised on straight line basis over the period of the lease. When a lease includes land and buildings elements, the bank assesses the classification of each element as either a finance lease or an operating lease. In determining classification of the land element, an important consideration is that land normally has an indefinite economic life. Therefore the finance lease or operating lease classification of the land is considered a critical area of judgment. See note 5 to these financial statements.
h) Income tax expense
Income tax expense comprises current and deferred tax. Current tax is the expected tax payable on the taxable profit for the year using currently enacted tax rates, and any adjustment to tax payable in respect of previous years.
The current income tax charge is calculated on the basis of tax laws enacted or substantively enacted at the reporting date. Management periodically evaluates positions taken in tax returns with respect to situations in which applicable tax regulation is subject to interpretation.
Management establishes provisions where appropriate on the basis of amounts expected to be paid to the tax authorities.
Deferred tax is provided using the liability method, for temporary differences between the carrying amounts of assets and liabilities for financial reporting purposes and the amounts used for taxation purposes. Deferred tax is measured at the tax rates that are expected to be applied to the temporary differences when they reverse, based on the laws that have been enacted or substantively enacted by the reporting date. Currently enacted tax rates are used to determine deferred tax.
A deferred tax asset is recognised only to the extent that it is probable that future taxable profits will be available against which the asset can be utilised. Deferred tax assets are reviewed at each reporting date and are reduced to the extent that it is no longer probable that the related tax benefit will be realised.
The tax effects of carry-forwards of unused losses or unused tax credits are recognised as an asset when it is probable that future taxable profits will be available against which these losses can be utilised.
Current and deferred tax are recognised in profit or loss, except when they relate to items that are recognised in other comprehensive income or directly in equity, in which case, the current and deferred tax are also recognised in other comprehensive income or directly in equity respectively. Where current tax or deferred tax arises from the initial accounting for a business combination, the tax effect is included in the accounting for the business combination.
i) Earnings per share
The Group presents basic and diluted earnings per share (EPS) data for its ordinary shares in the financial statements. Basic EPS is calculated by dividing the profit or loss attributable to ordinary shareholders of the Bank by the weighted average number of ordinary shares outstanding during the period. Diluted EPS is determined by adjusting the profit or loss attributable to ordinary shareholders and the weighted average number of ordinary shares outstanding adjusted for the effects of all potentially dilutive ordinary shares.
j) Dividends on ordinary shares
Dividends are charged to equity in the period in which they are declared. Proposed dividends are not accrued until they have been ratified at the Annual General Meeting.
k) Leases
When the Group is the lessor in a lease agreement that transfers substantially all of the risks and rewards incidental to ownership of an asset to the lessee, the arrangement is classified as a finance lease within loans and receivables. All other lessees are classified as operating leases.
Minimum lease payments made under finance leases are apportioned between the finance income and the reduction of the outstanding principal. The finance income is allocated to each period during the lease term so as to produce a constant periodic rate of interest on the remaining balance of the asset.
Rental income from operating leases is recognised on a straight-line basis over the term of the relevant lease. Rentals payable under operating leases are charged to profit or loss over the terms of the relevant lease.
95Annual Report & Financial Statements • 2016 I
BUILDING TRUST BYBUILDING PEOPLE
NOTES TO THE FINANCIAL STATEMENTS (Continued)FOR THE YEAR ENDED 31 DECEMBER 2016
3) Summary of significant accounting policies (Continued)
l) Repurchase agreements
When the Group purchases a financial asset and simultaneously enters into an agreement to re-sell the asset (or a substantially similar asset) at a fixed price on a future date (“reverse repo or stock borrowing”), the arrangement is accounted for as a loan or receivable, and the underlying asset is not recognised in the Group’s financial statements.
m) Property and equipment
i. Recognition and measurement
Items of fixtures and equipment are stated at historical cost less accumulated depreciation. Buildings comprising mainly of the head office are stated in the statement of financial position at their revalued amounts, being the fair value at the date of revaluation, less any subsequent accumulated depreciation. Valuations are performed with sufficient regularity to ensure that the fair value of a revalued asset does not differ materially from its carrying amount. Any accumulated depreciation at the date of revaluation is eliminated against the gross carrying amount of the asset, and the net amount is restated to the revalued amount of the asset.
Cost includes expenditures that are directly attributable to the acquisition of the asset. The cost of self-constructed assets includes the cost of materials, direct labour and any other costs directly attributable to bringing the asset to a working condition for its intended use. Purchased software that is integral to the functionality of the related equipment is capitalised as part of that equipment.
When parts of an item of property or equipment have different useful lives, they are accounted for as separate items of property and equipment.
The gain or loss arising on the disposal or retirement of an item of property or equipment is determined as the difference between the sales proceeds and the carrying amount of the asset and is recognised in profit or loss for the year.
ii. Subsequent costs
The cost of replacing part of an item of property or equipment is recognised in the carrying amount of the item if it is probable that the future economic benefits embodied within the part will flow to the Group and its cost can be measured reliably. The costs of the day-to-day servicing of property and equipment are charged to profit or loss for the year as incurred.
In relation to buildings, revaluations are performed with sufficient regularity such that the carrying amounts do not differ materially from those that would be determined using fair value at the reporting date. Any increase arising on the revaluation is recognised in other comprehensive income and accumulated in the revaluation surplus on property. Decreases that offset previous increases of the same asset are recognised in other comprehensive income and charged against the revaluation surplus on property; all other decreases are charged to the profit or loss for the year
iii. Depreciation
Depreciation which is recognised in profit or loss is calculated on a straight-line basis to allocate the costs or revalued amounts over their estimated useful lives as follows:
Building 2.5%
Furniture, fittings and equipment 20.0%
Motor vehicles 20.0%
Computers 33.3%
The assets’ residual values and useful lives are reviewed, and adjusted if appropriate, at the end of each reporting period. Assets are reviewed for impairment whenever events or changes in circumstances indicate that the carrying amount may not be recoverable. Excess depreciation, representing the additional depreciation based on revalued amounts over depreciation based on historical costs, is transferred annually from revaluation surplus on property to retained earnings, net of deferred tax.
96 I Annual Report & Financial Statements • 2016
BUILDING TRUST BYBUILDING PEOPLE
NOTES TO THE FINANCIAL STATEMENTS (Continued)FOR THE YEAR ENDED 31 DECEMBER 2016
3) Summary of significant accounting policies (Continued)
n) Intangible assets
i. Goodwill
Goodwill arises on business combinations through acquisition of subsidiaries when the cost of acquisition exceeds the fair value of the Group’s share of the identifiable assets, liabilities and contingent liabilities acquired. If the Group’s interest in the fair value of the identifiable assets, liabilities and contingent liabilities of an acquired business is greater than the cost to acquire, the excess is recognised immediately in profit or loss.
Goodwill is allocated to cash-generating units for the purpose of impairment testing, which is undertaken at the lowest level at which goodwill is monitored for internal management purposes. Impairment testing is performed at least annually, and whenever there is an indication that the cash-generating unit may be impaired, by comparing the present value of the expected future cash flows from a business with the carrying value of its net assets, including attributable goodwill. Goodwill is stated at cost less accumulated impairment losses which are charged to profit or loss.
ii. Computer software Costs associated with maintaining computer software programs are recognised as an expense as incurred. Development costs that are directly attributable to the design and testing of identifiable and unique software products controlled by the Group are recognised as intangible assets when the following criteria are met:
• it is technically feasible to complete the software product so that it will be available for use;
• management intends to complete the software product and use or sell it;
• there is an ability to use or sell the software product;
• it can be demonstrated how the software product will generate probable future economic benefits;
• adequate technical, financial and other resources to complete the development and to use or sell the software product are available; and
• the expenditure attributable to the software product during its development can be reliably measured.
Directly attributable costs that are capitalized as part of the software product include the software development employee costs and an appropriate portion of relevant overheads.
Computer software development costs recognised as assets are amortised over their estimated useful lives, which is three to five years.
Acquired computer software licences are capitalized on the basis of the costs incurred to acquire and bring to use the specific software. These costs are amortised on the basis of the expected useful lives. Software has a maximum expected useful life of 5 years.
iii. License Separately acquired licences in business combination are initially recognised at their fair value at the acquisition date. Licences with an indefinite useful life are not amortised and are reviewed at each reporting date to determine whether events and circumstances continue to support an indefinite useful life assessment of the asset. Where the Group re-assesses the useful life of an intangible asset as finite rather than indefinite, the asset may be considered to be impaired. The Group tests the asset for impairment annually and whenever there is an indication that the intangible asset may be impaired by comparing it’s recoverable amount, with the carrying amount and recognising any excess of the carrying amount over the recoverable amount as an impairment.
o) Legal and other claims
Provisions for legal claims are recognised when the Group has a present legal or constructive obligation as a result of past events; it is probable that an outflow of resources will be required to settle the obligation; and the amount has been reliably estimated. Provisions are not recognised for future operating losses.
Where there are a number of similar obligations, the likelihood that an outflow will be required in settlement is determined by considering the class of obligations as a whole. A provision is recognised even if the likelihood of an outflow with respect to any one item included in the same class of obligations may be small.

97Annual Report & Financial Statements • 2016 I
BUILDING TRUST BYBUILDING PEOPLE
NOTES TO THE FINANCIAL STATEMENTS (Continued)FOR THE YEAR ENDED 31 DECEMBER 2016
3) Summary of significant accounting policies (Continued)
p) Cash and cash equivalents
Cash and cash equivalents comprise balances with less than three months’ maturity from the date of acquisition. These includes notes and coins on hand, unrestricted balances held with Central Banks, items in the course of collection from other banks, deposits held at call with banks, net of deposits and balances due to banking institutions and treasury bills with original maturities of less than three months. Such assets are generally subject to insignificant risk of changes in their fair value, and are used by the Group in the management of its short-term commitments.
q) Share capital and share premiumOrdinary shares are classified as equity. Incremental costs directly attributable to the issue of new shares are shown in equity as a deduction, net of tax, from the proceeds.
r) Regulatory reservesIAS 39 requires the Group to recognise an impairment loss when there is objective evidence that loans and receivables are impaired. However, prudential guidelines issued by banking regulators require the Group to set aside amounts for impairment losses on loans and receivables based on their guidelines. Extra losses over and above those already recognised under IAS 39 are accumulated under regulatory reserves through appropriations of retained earnings.
s) Contingent liabilitiesLetters of credit, acceptances, guarantees and performance bonds, which are credit-related instruments, are generally given by the Group to support performance by a customer to third parties. Nominal principal amounts represent amounts at risk should the Group be required to meet these obligations in the event the customer defaults. These obligations are accounted for as off balance sheet transactions and disclosed as contingent liabilities.
t) Fiduciary activitiesThe Group provides custody, trustee, corporate administration, investment management and advisory services to third parties, which involve the Group making allocation and purchase and sale decisions in relation to a wide range of financial instruments. Those assets that are held in a fiduciary capacity are not included in these financial statements.
u) Derivative financial instruments Derivatives are financial instruments that derive their value from the price of underlying items such as equities, bonds, interest rates, foreign exchange, credit spreads, commodities and equity or other indices. Derivatives are intended to acquire, increase, reduce or alter exposure to market risks. The group uses derivatives for its customers and on its own account to manage exposure to market risks. Derivative assets and liabilities on different transactions are only set off if the transactions are with the same counterparty, a legal right of set-off exists and the cash flows are intended to be settled on a net basis.
v) Segmental reporting Operating segments are reported in a manner consistent with the internal reporting provided to the chief operating decision maker (Group management). The management then allocates resources to each operating segment of the Group and assesses their performance. The operating segments are based on the Group’s management and internal reporting structure.
In accordance with IFRS 8, Operating Segments, the Group has the following business segments; corporate and institutional banking, treasury dealing and brokerage, retail banking, asset finance and investment banking and others (see note 6).
w) Proposed dividendsDividends on ordinary shares are charged to equity in the period in which they are declared. Proposed dividends are shown as a separate component of equity until approved by the shareholders at the Annual General Meeting.
x) ComparativesExcept otherwise required, all amounts are reported or disclosed with comparative information. Where necessary, comparative figures have been adjusted to conform to changes in presentation in the current year.

98 I Annual Report & Financial Statements • 2016
BUILDING TRUST BYBUILDING PEOPLE
NOTES TO THE FINANCIAL STATEMENTS (Continued)FOR THE YEAR ENDED 31 DECEMBER 2016
4) Financial risk management objectives
Group risk management framework and governance structures
Risk management overview
In the financial services sector, sustainable growth in profitability involves selectively taking and managing risks. The Group’s goal is to earn, on behalf of the stakeholders, an optimal, stable and sustainable rate of return for every shilling of risk we take, while continually investing in our business to meet our future growth objectives. The risk management resources and processes are designed to identify, understand, measure and report risks that the Group’s businesses are exposed to, and develop governance, controls, and risk management frameworks necessary to mitigate these risks as appropriate. These resources and processes are strengthened by the Group’s culture which emphasises transparency, accountability and responsibility for managing the risks we are exposed to.
The Group defines risk as an event or events of uncertainty which can be caused by internal or external factors resulting in the possibility of losses (downside risk). However, the Group appreciates that some risk events may result into opportunities (upside risk) and should therefore be actively sought and exploited.
The Group operates in an environment of numerous risks as shown below that may cause financial and non-financial results to differ significantly from the expected outcomes. The Group has an enterprise-wide approach to the identification, measurement, monitoring and management of risks faced across the region. These financial risks are classified as follows:
• Credit and counterparty risk• Liquidity and funding risk• Market risk that fall within:
- Interest rate risk- Foreign exchange risk- Price risk
a) Credit and counterparty risk
Credit and counterparty risk is the potential for loss due to the Group’s customers’ or counterparties’ failure or unwillingness to meet their contractual credit obligations. It is the single largest financial risk that the Group faces. It arises principally from, but is not limited to, commercial and retail loans and advances, commitments from forward foreign exchange contracts , financial guarantees, letters of credit and acceptances, investments in debt securities and other exposures arising from trading and settlement activities with market counterparties.
The amounts presented in these financial statements are net of impairment allowances based on prudent assessment of the customers’ or counterparties’ abilities to meet their contractual obligations.
The Group’s lending principles are laid out in an elaborate series of corporate strategies, policies, standards, guidelines, directives and procedures, all of which are developed, approved and reviewed regularly by the Board Credit Risk Committee and respective Risk Management Committees. This is to ensure policies are current and consistent with the Group’s risk appetite. The structure, limits, collateral requirements, ongoing management, monitoring and reporting of credit exposures are all governed by these principles.
Who manages credit & counterparty risk
The Board of Directors and Senior Management pay special attention to credit risk exposure at all times. The Board retains the responsibility for under-writing and independent review of the credit risk exposures through specifically constituted Board sub-committees: the Board Credit Risk Committee and the Board Risk Management Committee respectively. To facilitate the day to day management of credit risk i.e. under-writing functions, monitoring and control, there is a specialised, independent and centralised credit review/approval team headed by the Head of Credit who reports to the Group Managing Director. The Board of Directors retains the authority to approve credit facilities that are significant in size or complexity.
Effective credit risk management begins with experienced and professional lending officers who have been formally mandated to authorise credit exposures for the Group. These individuals are subjected to a rigorous lender qualification process and operate within a disciplined environment with clear delegation of management discretionary limits at both the individual and joint levels depending on the size and complexities of the credit decisions they make.

99Annual Report & Financial Statements • 2016 I
BUILDING TRUST BYBUILDING PEOPLE
NOTES TO THE FINANCIAL STATEMENTS (Continued)FOR THE YEAR ENDED 31 DECEMBER 2016
4) Financial risk management objectives (Continued)
Group risk management framework and governance structures (Continued)
Risk management overview (Continued)
a) Credit and counterparty risk (Continued)
Who manages credit & counterparty risk (Continued)
To facilitate quick credit decisions, the Board Credit Risk Committee has granted formal discretionary limits to several Senior Managers (at individual and committee levels), in line with their skills, experience and ability to make sound credit decisions.
To separate the sales and credit under-writing functions from credit operations, a credit administration unit that reports directly to the Head of Technology and Operations, handles post-approval credit administration as well as the daily monitoring of credit exposures against approved limits. This together with the complete segregation of sales activities from the underwriting process, maintains an adequate governance structure that eliminates conflicts of interest that may occur in the course of business.
Credit risk management key performance indicators, including the quality of our credit portfolios, portfolio concentrations, amongst others, are independently reviewed by the Head of Risk Management & Compliance with oversight from the Board Risk Management Committee.
Regular independent audits of the approval process and adherence to credit risk management programs are carried out by the Internal Audit Department. Adverse findings are submitted to Senior Management and the Board Audit Committee for information and corrective actions implementation. Furthermore, audit programs are carried out using a risk based approach to concentrate activities where high probability and/or high impact risk events are envisaged.
How credit and counterparty risk is managed
Credit and counterparty risk measurement & assessment
The estimation of credit exposures at the individual and portfolio levels is complex and requires the use of special models, as the value of products or portfolios varies with changes in market variables, expected cash-flows and the passage of time. The assessment of a portfolio of assets’ credit exposures entails further estimation of the likelihood of defaults occurring, of associated losses, and of default correlations between borrowers or counterparties, the facilities granted, and their industries. This is achieved using a credit rating model developed internally for use in the business.
Credit & counterparty risk limit control and mitigation policies
The Board Credit Risk Committee regularly sets, reviews and approves exposure limits for the larger counterparties as well as tolerance limits on a portfolio basis. In turn, the Group manages the limits and controls concentrations of credit risk exposures against internal and regulatory requirements with respect to individual counterparties or related groups of counterparties, industry sectors, amongst others.
Exposures to any one borrower (including bank counterparties) are further restricted by sub-allocating limits covering separate on and off – balance sheet exposures, as well as daily delivery exposures in relation to trading items e.g. forward foreign exchange contracts.
Lending limits are reviewed regularly in line with the changing business/financial risks of the borrowers, in addition to industry and general economic conditions in which they operate. To enable prudent and consistent credit assessments at the individual level, the Group has robust approval processes and models covering different business segments. This process basically captures the borrower’s financial viability, industry / economic performance, geopolitical risks and its managements’ ability to steer the organisation. These models are suited to counterparties who are homogeneous in nature for ease of their use.
Limits for commercial and corporate clients are reviewed at least once annually. The credit review process ensures that an appropriate facility structure, including covenant monitoring, is in place for each client. The frequency of reviews is increased in accordance with the likelihood and size/complexity of potential credit losses, with deteriorating higher-risk situations referred to independent debt recovery units for closer attention and remediation where appropriate.
The risks in industry sectors are managed through limits and lending criteria / guidelines relevant to each particular industry. Borrower limits are set within the context of established guidelines for individual borrowers and particular industries to ensure the Group does not have excessive concentration in any related group of borrowers or industry. Through this portfolio management process, loans may be syndicated to reduce overall exposure to a single name and/ or industry.
100 I Annual Report & Financial Statements • 2016
BUILDING TRUST BYBUILDING PEOPLE
NOTES TO THE FINANCIAL STATEMENTS (Continued)FOR THE YEAR ENDED 31 DECEMBER 2016
4) Financial risk management objectives (Continued)
Group risk management framework and governance structures (Continued)
Risk management overview (Continued)
a) Credit and counterparty risk (Continued)
Credit & counterparty risk limit control and mitigation policies (Continued)
Exposures against tolerance limits in relation to credit risk categories are measured and monitored periodically on an aggregated basis. Actual exposures against limits are monitored daily through the well-established credit management information systems that are in place.
Other specific control and mitigation measures are outlined belowAlthough the Group only lends to counterparties that primarily demonstrate adequate capacity to repay loans, it also employs a range of policies, guidelines and models to mitigate credit risk as follows:
i. Collateral
This is only considered in those cases where the Group would want to take a credit risk mitigant. The Group has developed specific policies and guidelines for the acceptance of different classes of collateral whose estimated fair values are well understood.
Estimates of the collateral’s fair values are based on the value of collateral independently and professionally assessed at the time of borrowing, and re-valued with a frequency commensurate with nature and type of the collateral and credit advanced. Collateral structures and covenants are subjected to regular review to ensure they continue to fulfil the intended purpose to the Group.
Collateral is generally not held in respect of deposits and balances due from banking institutions, items in the course of collection, and Government securities, except when securities are held for reverse purchase and securities borrowing activity.
ii. Credit rating
The Group uses an internal rating system for its borrowing clients. The system sets maximum exposure limits for individuals or groups of clients using the rating attained by the borrowers. The rating system will also inform the basis of determining the value and classes of collateral acceptable for the borrower(s).
iii. Settlement risk
This is the risk of loss due to the failure by counterparty to honour its obligations to deliver cash, securities or other assets as contractually agreed. It arises in situations where a payment in cash is made in anticipation of corresponding receipt of cash securities or other assets. Daily settlement limits are approved by the relevant authority levels and established for each counterparty to cover the aggregate of all settlement risks arising from the counterparty’s market transactions on a single day. Acceptance of the counterparty’s settlement risk is determined on the basis of financial strengths and other non-financial considerations subject to Board Credit Risk Committee’s approvals.
Impairment policies
Across all its loan portfolios, the Group employs a disciplined approach to impairment allowances evaluation, with prompt identification of problem loans being a key risk management objective. The Group maintains both collective and specific impairment allowances for credit losses, the sum of which is sufficient to reduce the book value of credit assets to their estimated realisable value. Specific impairment allowances reduce the aggregate carrying value of credit assets where there is specific evidence of deterioration in credit quality. In line with regulatory guidelines, a collective allowance is maintained to cover potential impairment in the existing portfolio that cannot be associated with specific credit. These allowances are reviewed and updated on a regular basis. Loans and advances are classified into five prudential guidelines categories as follows.• Normal• Watch• Sub-standard• Doubtful• Loss

101Annual Report & Financial Statements • 2016 I
BUILDING TRUST BYBUILDING PEOPLE
NOTES TO THE FINANCIAL STATEMENTS (Continued)FOR THE YEAR ENDED 31 DECEMBER 2016
4) Financial risk management objectives (Continued)
Group risk management framework and governance structures (Continued)
a) Credit and counterparty risk (continued)
Write-off policy
The Group writes off loans and advances net of any related allowances for impairment losses when it determines that the loans are uncollectable and securities unrealisable. This determination is reached after accessing objective evidence or occurrence of significant changes in the borrower or issuer’s financial position such that they are no longer able to repay the obligation, or that proceeds from the sale of collateral will not be sufficient to pay back the entire exposures. This is done after exhausting all other means including litigation. For Retail and Asset Finance loans, charge off decisions are generally based on product specific days past due status and the size of balances owed per borrower.
I. Maximum exposure to credit risk before collateral held
GROUP 2016 2015Note Shs’000 % Shs’000 %
Credit exposures On – balance sheet itemsBalances with Central Banks 17 5,344,124 3 7,277,322 4Items in the course of collection 18 399,772 - 848,819 -Due from banking institutions 19 9,682,207 6 6,675,640 5Loans and advances to customers 22 113,040,863 64 114,657,644 67Government securities 20 30,698,495 17 27,911,907 16Other assets – trade receivables 23 28,762 - 47,121 -
159,194,223 90 157,418,453 92Off-balance sheet itemsLetters of credit 38 5,034,944 3 2,447,972 1Guarantees and performance bonds 11,898,326 7 11,988,684 7
16,933,270 10 14,436,656 8176,127,493 100 171,855,109 100
II. Maximum exposure to credit risk before collateral held
BANK 2016 2015Note Shs’000 % Shs’000 %
Credit exposures
On – balance sheet items
Balances with Central Bank 17 4,360,474 3 6,001,492 4Items in the course of collection 18 405,412 - 804,882 1Due from banking institutions 19 9,218,836 6 5,464,120 3Loans and advances to customers 22 105,671,725 67 106,516,052 67Government securities 20 27,286,659 17 25,012,995 16
146,943,106 93 143,799,541 91Off-balance sheet itemsLetters of credit 38 4,851,664 3 2,405,342 2Guarantees and performance bonds 38 7,067,362 4 11,763,879 7
11,919,026 7 14,169,221 9 158,862,132 100 157,968,762 100

102 I Annual Report & Financial Statements • 2016
BUILDING TRUST BYBUILDING PEOPLE
NOTES TO THE FINANCIAL STATEMENTS (Continued)FOR THE YEAR ENDED 31 DECEMBER 2016
4) Financial risk management objectives (Continued)
Group risk management framework and governance structures (Continued)
a) Credit and counterparty risk (continued)
The above represents the worst case scenario of credit exposure for both years, without taking into account collateral held or other credit enhancements/mitigants.
The Group Loans and advances to customers and other trade related items (off-balance sheet items) comprise of 74% (2015: 75%) of the total credit exposure.
Collateral
The Group routinely obtains collateral and security to mitigate credit risk. The Group ensures that any collateral held is sufficiently liquid, legally effective, enforceable and regularly reassessed.
Before attaching value to collateral, business holding approved collateral must ensure that they are legally perfected devoid of any encumbrances. Security structures and legal covenants are subject to regular review, at least annually, to ensure that they remain fit for purpose and remain consistent with accepted local market practice.
The principal collateral types held by the Group for loans and advances are:
• Mortgages over residential properties; and
• Charges over business assets such as premises, inventory and accounts receivable; and
• Charges over financial instruments such as debt securities and equities.
Valuation of collateral taken will be within agreed parameters and will be conservative in value. The valuation is performed only on origination or in the course of enforcement actions. Within the corporate sectors, collateral for impaired loans including guarantees and insurance is reviewed regularly and at least annually to ensure that it is still enforceable and that the impairment allowance remains appropriate given the current valuation.
The Group will consider all relevant factors, including local market conditions and practices, before any collateral is realized
While collateral is an important mitigant to credit risk, the Group’s underwriting policy ensures that loans are strictly granted on a going concern basis with upfront adequate demonstration of repayment capacity. Other than exposures amounting to Shs 3,622,416,000 (2015: Shs 3,805,614,000) that are unsecured, all other facilities are secured by collateral in the form of charges over cash, land and buildings, marketable securities, plant and machinery, amongst others. The fair value of collateral held for impaired loans and advances is Shs 7,408,475,000 (2015: Shs 10,451,907,000).

103Annual Report & Financial Statements • 2016 I
BUILDING TRUST BYBUILDING PEOPLE
NOTES TO THE FINANCIAL STATEMENTS (Continued)FOR THE YEAR ENDED 31 DECEMBER 2016
4) Financial risk management objectives (Continued)
Group risk management framework and governance structures (Continued)
a) Credit and counterparty risk (Continued)
Collateral and other credit enhancements obtained (Continued)
The fair value of assets held by the Group as at 31 December as collateral was as follows:
Carrying amount
Bank Group
2016 2015 2016 2015
Shs `000 Shs `000 Shs `000 Shs`000
Nature of assets
7,238,448 9,776,326Charges over cash, land and buildings, marketable securities, plant and machinery 7,861,744 10,451,907
Collateral repossessed
It is the Group’s policy to dispose off repossessed properties on the open market, at fair market value. The proceeds are used to reduce or repay the outstanding claim. In general, the Group does not occupy or foreclose repossessed properties for its own business use.
The Group is confident that its credit policies and programs provide sufficient safeguards against the credit risk exposure shown in the tables overleaf:

104 I Annual Report & Financial Statements • 2016
BUILDING TRUST BYBUILDING PEOPLE
NOTES TO THE FINANCIAL STATEMENTS (Continued)FOR THE YEAR ENDED 31 DECEMBER 2016
4) Financial risk management objectives (Continued)
Group risk management framework and governance structures (Continued)
a) Credit and counterparty risk (Continued)
ii. Classification of loans & advances to customers
Group
Kenya Tanzania Uganda Total
At 31 December 2016 Shs `000 Shs `000 Shs `000 Shs `000
Gross loans and advances
Neither past due nor impaired 84,753,874 2,658,029 2,266,286 89,678,189
Past due but not impaired
Past due 30 to 90 days 14,351,404 1,630,173 211,591 16,193,168
Individually impaired 11,966,476 543,269 374,087 12,883,832
Total gross loans advanced 111,071,754 4,831,471 2,851,964 118,755,189
Impairment allowances
Neither past due nor impaired - - - -
Past due but not impaired
Past due 30 to 90 days (672,001) (20,233) (1) (692,235)
Individually impaired (4,728,028) (243,147) (50,916) (5,022,091)
Impairment allowances (5,400,029) (263,380) (50,917) (5,714,326)
Net loans and advances 105,671,725 4,568,091 2,801,047 113,040,863
Coverage ratio of the individually impaired 40% 45% 14% 39%
At 31 December 2015
Gross loans and advances
Neither past due nor impaired 92,411,193 3,683,340 3,054,707 99,149,240
Past due but not impaired
Past due 30 to 90 days 4,479,299 238,093 493,846 5,211,238
Individually impaired 12,165,065 764,446 299,023 13,228,534
Total gross loans advanced 109,055,557 4,685,879 3,847,576 117,589,012
Impairment allowances
Neither past due nor impaired - - - -
Past due but not impaired
Past due 30 to 90 days (150,766) - (3,974) (154,740)
Individually impaired (2,388,739) (387,480) (409) (2,776,628)
Impairment allowances (2,539,505) (387,480) (4,383) (2,931,368)
Net loans and advances 106,516,052 4,298,399 3,843,193 114,657,644
Coverage ratio of the individually impaired 20% 51% 0% 21%
105Annual Report & Financial Statements • 2016 I
BUILDING TRUST BYBUILDING PEOPLE
NOTES TO THE FINANCIAL STATEMENTS (Continued)FOR THE YEAR ENDED 31 DECEMBER 2016
4) Financial risk management objectives (Continued)
Group risk management framework and governance structures (Continued)
a) Credit and counterparty risk (Continued)
Credit quality of loans and advances
All loans and advances are categorised as neither past due nor impaired, past due but not impaired, or impaired. Impaired loans include restructured loans. For the purposes of these disclosures:
• A loan is considered past due when the borrower has failed to make a payment when due under the terms of the existing loan contract;
• The impairment allowance includes allowances both against financial assets that have been individually impaired and those subject to collective impairment;
• Loans neither past due nor impaired consist predominantly of corporate and retail loans that are performing. These loans, although unimpaired, may carry an unidentified impairment allowance; and
• Impaired loans that are collectively assessed for impairment consist predominantly of Retail loans that are 1 day or more past due for which a collective impairment allowance is raised.
Loans and advances that are neither past due nor impaired
The Group classifies loans and advances under this category if they are up to date and in line with their contractual agreements (within 0-30 days). Such loans would have demonstrated the meeting of their financial and non-financial conditions plus obligations and the borrowers would have proven forward looking capacity to repay the loans. These exposures will normally be maintained largely within approved facility programs and with no depiction of impairment or distress signs. These exposures are categorised as normal accounts (category 1) in line with internal guidelines and those issued by regulators where applicable. A collective provision on the total outstanding balances is made and appropriated from revenue reserves to statutory credit risk reserves.
Past due but not impaired
This category includes exposures that are between 31 – 90 days past due, where losses may have been incurred but have not been clearly identified. These exposures are graded as category 2 in line with our internal guidelines and those issued by banking regulators. A collective impairment allowance is made as described above to cover losses which have been incurred but have not yet been identified.
Individually impaired loans and advances
Impaired loans and advances are those which the Group determines that it is highly probable that it will be unable to collect all principal and interest due according to the contractual terms of the loan securities agreement(s). These loans are graded between categories 3 (91-180 days), 4(181 -360 days) and 5 (over 360 days) using the Group’s internal credit rating system. These clients, under guidelines issued by the Central Banks in the regions we operate in, are termed as non-performing loans. The Group establishes a specific allowance for impairment losses for each loan that represents the estimate of losses that will be incurred in its loan portfolio.
Concentrations of risk
The Group monitors concentration of risk exposures in its lending and other asset portfolios by individuals or groups of related borrowers and industry sector concentrations in line with Board of Directors’ approved limits. These limits are reviewed regularly using economic risk indicators identified in particular industrial sectors. An analysis of concentrations within the loans and advances to customers and off balance sheet items are as follows.
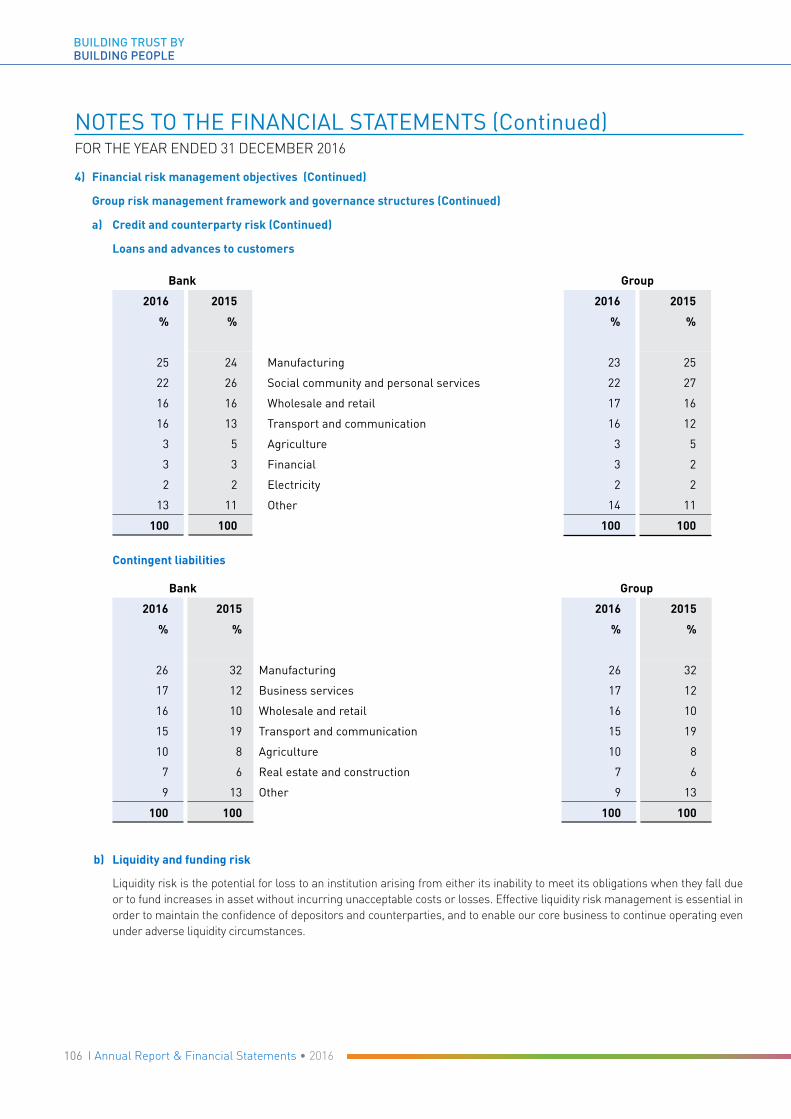
106 I Annual Report & Financial Statements • 2016
BUILDING TRUST BYBUILDING PEOPLE
NOTES TO THE FINANCIAL STATEMENTS (Continued)FOR THE YEAR ENDED 31 DECEMBER 2016
4) Financial risk management objectives (Continued)
Group risk management framework and governance structures (Continued)
a) Credit and counterparty risk (Continued)
Loans and advances to customers
Bank Group
2016 2015 2016 2015
% % % %
25 24 Manufacturing 23 25
22 26 Social community and personal services 22 27
16 16 Wholesale and retail 17 16
16 13 Transport and communication 16 12
3 5 Agriculture 3 5
3 3 Financial 3 2
2 2 Electricity 2 2
13 11 Other 14 11
100 100 100 100
Contingent liabilities
Bank Group
2016 2015 2016 2015
% % % %
26 32 Manufacturing 26 32
17 12 Business services 17 12
16 10 Wholesale and retail 16 10
15 19 Transport and communication 15 19
10 8 Agriculture 10 8
7 6 Real estate and construction 7 6
9 13 Other 9 13
100 100 100 100
b) Liquidity and funding risk
Liquidity risk is the potential for loss to an institution arising from either its inability to meet its obligations when they fall due or to fund increases in asset without incurring unacceptable costs or losses. Effective liquidity risk management is essential in order to maintain the confidence of depositors and counterparties, and to enable our core business to continue operating even under adverse liquidity circumstances.

107Annual Report & Financial Statements • 2016 I
BUILDING TRUST BYBUILDING PEOPLE
NOTES TO THE FINANCIAL STATEMENTS (Continued)FOR THE YEAR ENDED 31 DECEMBER 2016
4) Financial risk management objectives (Continued)
Group risk management framework and governance structures (Continued)
b) Liquidity and funding risk (Continued)
Who manages liquidity and funding risk
The Assets and Liabilities Committee (ALCO), a management committee, is tasked with the responsibility of ensuring that all foreseeable funding commitments and deposits withdrawals can be met as and when they fall due, and that the Group will not encounter difficulties in meeting its current and future financial obligations or financial liabilities as they fall due.
ALCO relies substantially on the Group’s Treasury Department to coordinate and ensure discipline across the Group and business units, certify sufficient liquidity under both normal and stressed conditions, without incurring unacceptable losses and/or risking damage to the Group’s reputation.
The Board Executive Committee has oversight over ALCOs activities through regular review of its minutes and significant reports outlining the Group’s current exposures against approved risk limits. These reports are also reviewed by the Board Risk Management Committee on a regular quarterly basis.
Liquidity policies / guidelines and limits are reviewed periodically, or as the need arises.
How liquidity and funding risk is managed
i. Liquidity and funding management
The Group’s liquidity and funding policies require that it:
• Enters into lending contracts subject to availability of funds.
• Projects cash flows by major currencies and consider the level of liquid assets necessary in relation thereto.
• Monitors liquidity ratios against internal and regulatory requirements and guidelines.
• Maintains an array of a diverse range of funding sources as contingency back–up facilities.
• Monitors depositor concentration to avoid undue reliance on large individual depositors and ensure a satisfactory funding mix is attained.
• Invests in short term liquid instruments, which can easily be sold in the market when the need arises.
• Ensure investments in large cash outlay projects e.g. property and equipment purchases are budgeted for and carried out only when the Group has sufficiently liquid cash flows.
• Maintains liquidity and funding contingency plans. These plans and key risk indicators clearly identify early stress conditions and describe actions to be taken in the event of difficulties arising from systemic or other crisis while minimising adverse long-term implications
ii Sources of funding
The Group’s major source of funding is customer deposits. To this end, the Group maintains a diversified and stable funding base comprising of the core retail and corporate customers and wholesale banking clientele. The Group places considerable importance on the stability of these deposits, which is achieved through the Group’s corporate, institutional and retail banking activities and by maintaining depositor confidence in the Group’s business strategies and financial strength. An analysis of concentrations within the customer deposits is as follows:
Customer deposits
Bank Group2016 2015 2016 2015
% % % %
90 89 Private enterprises 91 885 10 Non-profit institutions and individuals 5 115 1 Insurance companies 4 1
100 100 100 100

108 I Annual Report & Financial Statements • 2016
BUILDING TRUST BYBUILDING PEOPLE
NOTES TO THE FINANCIAL STATEMENTS (Continued)FOR THE YEAR ENDED 31 DECEMBER 2016
4) Financial risk management objectives (Continued)
Group risk management framework and governance structures (Continued)
b) Liquidity and funding risk (Continued)
How liquidity and funding risk is managed (Continued)
II. Sources of funding (Continued)
The Group also borrows from the inter-bank and wholesale markets such as pension funds and insurance companies to meet its short term liquidity and other investment objectives.
The Group does not maintain cash reserves to meet all its obligations as experience over time has shown that a minimum level of reinvestment of maturing customer funds can be predicted with a high level of certainty. Although the contractual repayments of many customer accounts are on demand or short notice, in practice from a behavioral perspective, short-term deposit balances remain stable as inflows and outflows broadly match.
III Exposure to liquidity risk
The key measures used by the Group for managing liquidity risk are;
• The ratio of net liquid assets to customers deposits (liquidity ratio). For this purpose, net liquid assets include cash and cash equivalents and investments in securities for which there is an active and liquid market less any deposits from banks, as well as other borrowings and commitments maturing within the next month. The banking regulators also require that the Group maintains a cash reserve ratio computed as percentage of eligible customer deposits.
The banking regulations require that the Group maintains a minimum liquidity ratio of 20%. The Group complied with the liquidity requirements during the year.
The average liquidity ratio for the year was 36% (2015: 31%).
• The maturity analysis of assets and liabilities report is presented in the next pages. The Group uses the maturity mismatch ladders to compare cash inflows and outflows each month and over a series of time-bands. The maturity mismatch ladder shows the net cash flows of the Group in various time bands. The Group net funding requirements are determined by analysing present and future cash flows of the entire statement of financial position at selected maturity dates, based on assumptions of the behaviour of assets, liabilities and off-balance sheet items. Calculations will include the cumulative net excess or shortfall over the time frame of the liquidity assessment.
The Group also monitors its liquidity exposures through an array of internally developed risk indicators such as several types of advances to deposit ratios, proportion of largest depositors to total deposits, liquidity gap analysis ratios, and interbank borrowings as a proportion of total deposits, amongst others. At the end of 2014, the Group begun to use the Basel Accord preferred Liquidity Coverage ratio and Net Stable Funding ratio to assess its short and long term liquidity stability. This enables the group to arrest any early warning signs and take timely corrective action.
As part of the ALCO function, Treasury receives information from business units regarding the liquidity profile of their financial assets and liabilities plus details of other projected cash flows arising from projected future business. Treasury then maintains a portfolio of short-term liquid assets, largely made up of short-term liquid investment grade securities, loans and advances to banks and other inter-bank facilities, to ensure that sufficient liquidity is maintained within the Group as a whole. The liquidity requirements of business units and subsidiaries are met through various funding options to cover any short-term fluctuations and longer term funding to address any structural liquidity requirements.
The table below presents the undiscounted cash flows receivable and payable by the Group and Bank under financial assets and liabilities by remaining contractual maturities at the reporting date.
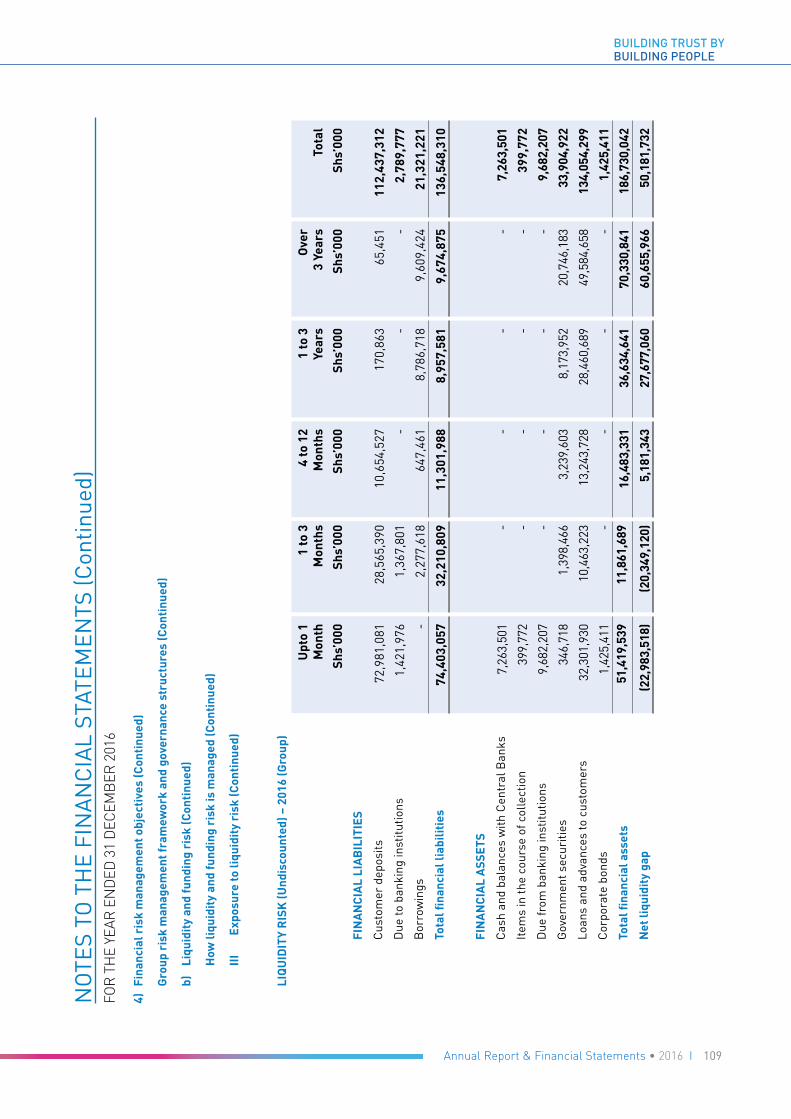
109Annual Report & Financial Statements • 2016 I
BUILDING TRUST BYBUILDING PEOPLE
NO
TES
TO T
HE
FIN
AN
CIA
L ST
ATEM
ENTS
(Con
tinue
d)FO
R T
HE
YEAR
EN
DED
31
DEC
EMB
ER 2
016
4) F
inan
cial
ris
k m
anag
emen
t obj
ecti
ves
(Con
tinu
ed)
G
roup
ris
k m
anag
emen
t fra
mew
ork
and
gove
rnan
ce s
truc
ture
s (C
onti
nued
)
b)
Li
quid
ity
and
fund
ing
risk
(Con
tinu
ed)
How
liqu
idit
y an
d fu
ndin
g ri
sk is
man
aged
(Con
tinu
ed)
III
E
xpos
ure
to li
quid
ity
risk
(Con
tinu
ed)
LI
QU
IDIT
Y R
ISK
(Und
isco
unte
d) –
201
6 (G
roup
)
Upt
o 1
Mon
th
1 to
3
Mon
ths
4 to
12
Mon
ths
1 to
3 Y
ears
Ove
r 3
Year
s To
tal
Shs
’000
S
hs’0
00
Shs’
000
Shs
’000
S
hs’0
00
Shs’
000
FIN
AN
CIA
L LI
AB
ILIT
IES
Cus
tom
er d
epos
its72
,981
,081
28
,565
,390
10
,654
,527
17
0,86
3 65
,451
11
2,43
7,31
2 D
ue to
ban
king
inst
itutio
ns1,
421,
976
1,36
7,80
1 -
- -
2,78
9,77
7 B
orro
win
gs-
2,27
7,61
864
7,46
18,
786,
718
9,60
9,42
421
,321
,221
Tota
l fina
ncia
l lia
bilit
ies
74,4
03,0
57
32,2
10,8
0911
,301
,988
8,95
7,58
19,
674,
875
136,
548,
310
FIN
AN
CIA
L A
SSET
S
Cas
h an
d ba
lanc
es w
ith C
entr
al B
anks
7,26
3,50
1 -
- -
- 7,
263,
501
Item
s in
the
cour
se o
f col
lect
ion
399,
772
- -
- -
399,
772
Due
from
ban
king
inst
itutio
ns9,
682,
207
- -
- -
9,68
2,20
7 G
over
nmen
t sec
uriti
es34
6,71
8 1,
398,
466
3,23
9,60
3 8,
173,
952
20,7
46,1
83
33,9
04,9
22
Loan
s an
d ad
vanc
es to
cus
tom
ers
32,3
01,9
30
10,4
63,2
23
13,2
43,7
28
28,4
60,6
89
49,5
84,6
58
134,
054,
299
Cor
pora
te b
onds
1,42
5,41
1-
--
-1,
425,
411
Tota
l fina
ncia
l ass
ets
51,4
19,5
3911
,861
,689
16
,483
,331
36
,634
,641
70
,330
,841
18
6,73
0,04
2
Net
liqu
idit
y ga
p(2
2,98
3,51
8)(2
0,34
9,12
0)5,
181,
343
27,6
77,0
6060
,655
,966
50,1
81,7
32

110 I Annual Report & Financial Statements • 2016
BUILDING TRUST BYBUILDING PEOPLE
NO
TES
TO T
HE
FIN
AN
CIA
L ST
ATEM
ENTS
(Con
tinue
d)FO
R T
HE
YEAR
EN
DED
31
DEC
EMB
ER 2
016
4) F
inan
cial
ris
k m
anag
emen
t obj
ecti
ves
(Con
tinu
ed)
G
roup
ris
k m
anag
emen
t fra
mew
ork
and
gove
rnan
ce s
truc
ture
s (C
onti
nued
)
b)
Li
quid
ity
and
fund
ing
risk
(Con
tinu
ed)
How
liqu
idit
y an
d fu
ndin
g ri
sk is
man
aged
(Con
tinu
ed)
III
Expo
sure
to li
quid
ity
risk
(Con
tinu
ed)
LI
QU
IDIT
Y R
ISK
(Und
isco
unte
d) –
201
5 (G
roup
)
Upt
o 1
Mon
th
1 to
3
Mon
ths
4 to
12
Mon
ths
1 to
3 Y
ears
Ove
r 3
Year
s To
tal
Shs
’000
S
hs’0
00
Shs’
000
Shs
’000
S
hs’0
00
Shs’
000
FIN
AN
CIA
L LI
AB
ILIT
IES
Cus
tom
er d
epos
its
76,
215,
364
2
9,77
7,11
0
8
,865
,564
7,2
58
6
,678
1
14,8
71,9
74
Due
to b
anki
ng in
stitu
tions
9,0
64,5
52
-
-
-
-
9
,064
,552
Bor
row
ings
-
3
67,0
04
2,7
44,2
59
2
,229
,310
13,4
88,4
21
18
,828
,994
Tota
l fina
ncia
l lia
bilit
ies
8
5,27
9,91
6
30,
144,
114
11,6
09,8
23
2
,236
,568
13,4
95,0
99
142
,765
,520
FIN
AN
CIA
L A
SSET
S
Cas
h an
d ba
lanc
es w
ith C
entr
al B
anks
8,9
40,0
56
-
-
-
-
8
,940
,056
Item
s in
the
cour
se o
f col
lect
ion
8
48,8
19
-
-
-
-
848
,819
Due
from
ban
king
inst
itutio
ns
6
,847
,221
-
-
-
-
6,8
47,2
21
Gov
ernm
ent s
ecur
ities
1
64,8
81
2,33
0,49
5
8
,001
,701
5,2
48,0
26
14
,317
,626
30,0
62,7
29
Loan
s an
d ad
vanc
es to
cus
tom
ers
4
2,83
2,14
5
6,
086,
589
11,8
40,0
34
32,
164,
024
47
,146
,926
1
40,0
69,7
18
Tota
l fina
ncia
l ass
et
59,
633,
122
8,41
7,08
4
19
,841
,735
3
7,41
2,05
0
61,4
64,5
52
186
,768
,543
Net
liqu
idit
y ga
p (2
5,64
6,79
4)(2
1,72
7,03
0)
8
,231
,912
3
5,17
5,48
2 4
7,96
9,45
3
44,
003,
023

111Annual Report & Financial Statements • 2016 I
BUILDING TRUST BYBUILDING PEOPLE
NO
TES
TO T
HE
FIN
AN
CIA
L ST
ATEM
ENTS
(Con
tinue
d)FO
R T
HE
YEAR
EN
DED
31
DEC
EMB
ER 2
016
4) F
inan
cial
ris
k m
anag
emen
t obj
ecti
ves
(Con
tinu
ed)
G
roup
ris
k m
anag
emen
t fra
mew
ork
and
gove
rnan
ce s
truc
ture
s (C
onti
nued
)
b)
Li
quid
ity
and
fund
ing
risk
(Con
tinu
ed)
How
liqu
idit
y an
d fu
ndin
g ri
sk is
man
aged
(Con
tinu
ed)
III
Expo
sure
to li
quid
ity
risk
(Con
tinu
ed)
LI
QU
IDIT
Y R
ISK
(Und
isco
unte
d) –
201
6 (B
ank)
Upt
o 1
Mon
th
1 to
3
Mon
ths
4 to
12
Mon
ths
1 to
3 Y
ears
Ove
r 3
Year
s To
tal
Shs
’000
S
hs’0
00
Shs’
000
Shs
’000
S
hs’0
00
Shs’
000
FIN
AN
CIA
L LI
AB
ILIT
IES
Cus
tom
er d
epos
its69
,691
,578
27
,015
,936
7,
972,
636
170,
863
65,4
51
104,
916,
464
Due
to b
anki
ng in
stitu
tions
1,27
3,61
5 1,
367,
801
- -
- 2,
641,
416
Bor
row
ings
- 1,
276,
565
647,
461
8,78
6,71
89,
609,
424
20,3
20,1
68
Tota
l fina
ncia
l lia
bilit
ies
70,9
65,1
93
29,6
60,3
018,
620,
097
8,95
7,58
19,
674,
875
127,
878,
048
FIN
AN
CIA
L A
SSET
S
Cas
h an
d ba
lanc
es w
ith C
entr
al B
anks
5,94
6,30
9 -
- -
- 5,
946,
309
Item
s in
the
cour
se o
f col
lect
ion
405,
412
- -
- -
405,
412
Due
from
ban
king
inst
itutio
ns9,
218,
836
- -
- -
9,21
8,83
6
Gov
ernm
ent s
ecur
ities
- 85
2,49
7 99
9,83
6 7,
950,
682
20,6
90,0
73
30,4
93,0
88
Loan
s an
d ad
vanc
es to
cus
tom
ers
30,4
01,3
42
9,37
3,44
2 10
,829
,893
26
,554
,454
48
,789
,045
12
5,94
8,17
6
Tota
l fina
ncia
l ass
ets
45,9
71,8
9910
,225
,939
11,8
29,7
2934
,505
,136
69,4
79,1
1817
2,01
1,82
1
Net
liqu
idit
y ga
p(2
4,99
3,29
4)(1
9,43
4,36
3)3,
209,
632
25,5
47,5
5559
,804
,243
44,1
33,7
73

112 I Annual Report & Financial Statements • 2016
BUILDING TRUST BYBUILDING PEOPLE
NO
TES
TO T
HE
FIN
AN
CIA
L ST
ATEM
ENTS
(Con
tinue
d)FO
R T
HE
YEAR
EN
DED
31
DEC
EMB
ER 2
016
4) F
inan
cial
ris
k m
anag
emen
t obj
ecti
ves
(Con
tinu
ed)
G
roup
ris
k m
anag
emen
t fra
mew
ork
and
gove
rnan
ce s
truc
ture
s (C
onti
nued
)
b)
Li
quid
ity
and
fund
ing
risk
(Con
tinu
ed)
How
liqu
idit
y an
d fu
ndin
g ri
sk is
man
aged
(Con
tinu
ed)
III
Expo
sure
to li
quid
ity
risk
(Con
tinu
ed)
LI
QU
IDIT
Y R
ISK
(Und
isco
unte
d) –
201
5 (B
ank)
Upt
o 1
Mon
th
1 to
3
Mon
ths
4 to
12
Mon
ths
1 to
3 Y
ears
Ove
r 3
Year
s To
tal
Shs
’000
S
hs’0
00
Shs’
000
Shs
’000
S
hs’0
00
Shs’
000
FIN
AN
CIA
L LI
AB
ILIT
IES
Cus
tom
er d
epos
its
7
2,14
9,06
3
28,2
02,1
04
7,0
89,0
64
7,
258
6,
678
107
,454
,167
Due
to b
anki
ng in
stitu
tions
7,
437,
170
-
-
-
-
7,4
37,1
70
Bor
row
ings
-
367
,004
620
,788
1,06
0,98
6 1
3,48
8,42
1
15,5
37,1
99
Tota
l fina
ncia
l lia
bilit
ies
79,
586,
233
28
,569
,108
7
,709
,852
1,06
8,24
4 1
3,49
5,09
9 1
30,4
28,5
36
FIN
AN
CIA
L A
SSET
S
Cas
h an
d ba
lanc
es w
ith C
entr
al B
anks
7,
291,
629
-
-
-
-
7,2
91,6
29
Item
s in
the
cour
se o
f col
lect
ion
8
04,8
82
-
-
-
-
8
04,8
82
Due
from
ban
king
inst
itutio
ns
5,46
9,90
3
-
-
-
-
5
,469
,903
Gov
ernm
ent s
ecur
ities
-
2
,008
,213
5
,924
,199
5,07
4,41
2 1
4,09
4,40
8
27,1
01,2
32
Loan
s an
d ad
vanc
es to
cus
tom
ers
41,
128,
447
4
,972
,440
9
,504
,913
2
9,06
2,32
3 4
7,04
0,09
5 1
31,7
08,2
18
Tota
l fina
ncia
l ass
ets
54,
694,
861
6
,980
,653
15
,429
,112
3
4,13
6,73
5 6
1,13
4,50
3 1
72,3
75,8
64
Net
liqu
idit
y ga
p
(2
4,89
1,81
5) (
21,5
88,4
55)
7,7
19,2
60
33,
068,
491
47,
639,
404
41
,947
,328

113Annual Report & Financial Statements • 2016 I
BUILDING TRUST BYBUILDING PEOPLE
NOTES TO THE FINANCIAL STATEMENTS (Continued)FOR THE YEAR ENDED 31 DECEMBER 2016
4) Financial risk management objectives (Continued)
Group risk management framework and governance structures (Continued)
c) Market risk
Market risk is the risk that the values of assets and liabilities or revenues will be adversely affected by changes in market conditions or market movements. Market risks in the Group arise from movements in market prices particularly changes in interest rates, foreign currency exchange rates, fixed rate securities and equity prices which we are exposed to. It is often propagated by other forms of financial risks such as credit and market liquidity risk events. The objective of market risk management programs is to manage and control market risk exposures in order to optimise return on risk taken while maintaining a good market profile as a provider of financial products and services.
Who manages market risk?
The Board Risk Management Committee reviews and approves market risk policies and limits periodically or as the need arises. The Treasury Department in consultation with the Risk Management Department are responsible for the development of detailed market risk management policies, subject to review and support by ALCO and approval by the Board Risk Management Committee.
The Board receives quarterly reports of market risk exposures or activities through relevant ALCO minutes, and Treasury reports outlining current risk exposures against approved risk limits or appetite.
How market risk is managedThe Group’s Asset & Liability Committee (ALCO) oversees the application of the framework set by the Board of Directors and monitors the Group’s market risk exposures as well as activities that give rise to these exposures. Overall responsibility for the management of market risks rests with ALCO which reviews market risk activity reports monthly. Treasury is responsible for the day to day implementation of those policies or programs and limits.
In view of the fact that our market risk operations are not very complex, we basically use interest rates variance analysis models (against budget and prior month), interest rate gap analysis, proportion of interest sensitive deposits to total deposits, amongst other methodologies and key performance indicators, appropriate for our Group’s operations. The management of market risk is supplemented by the monitoring of key market risk and economic performance variables.
The distinct market risk exposures faced by the Group are:
• Interest rate risk.
• Foreign exchange risk.
• Price risk.
I. Interest rate risk Interest rate risk represents exposures to instruments whose values vary with the level or volatility of interest rates. These instruments include, but are not limited to loans, debt securities, certain traded assets and liabilities, deposits, borrowings and derivative instruments. Generally, hedging instruments used by banks to mitigate such risks include related derivatives such as options and swaps.
The Group is exposed to the risk that the value of a financial instrument will fluctuate due to changes in market interest rates, as funds are sourced and invested at both fixed and floating rates. The maturities of assets and liabilities, plus the ability to replace interest bearing liabilities at an acceptable cost as they mature, are important factors in assessing the Group’s exposure to changes in interest rates. In addition to maintaining an appropriate mix between fixed and floating rates deposit base, interest rates on advances to customers and other risk assets are mainly pegged to the Kenya Bankers Reference Rate (KBRR) - for floating rate loans. On 30 January 2017, CBK decided to suspend the KBRR framework, in view of the adoption of the new law capping interest rates.

114 I Annual Report & Financial Statements • 2016
BUILDING TRUST BYBUILDING PEOPLE
NOTES TO THE FINANCIAL STATEMENTS (Continued)FOR THE YEAR ENDED 31 DECEMBER 2016
4) Financial risk management objectives (Continued)
Group risk management framework and governance structures (Continued)
c) Market risk (Continued)
I. Interest rate risk (Continued) Interest rates on customer deposits are negotiated between the Group and its customers, with the Group retaining the discretion to re-negotiate the rates at maturity in line with changes in market trends. The interest rates given or charged to clients therefore fluctuate depending on the movements in the market interest rates. The Group also invests in fixed interest rate instruments issued by the Government of Kenya, Tanzania and Uganda through their respective Central Banks. The interest rate risk assessment tables are found under pages 112 to 115.
The matching and controlled mismatching of the maturities and interest rates of assets and liabilities is fundamental to the management of the Group’s interest rate risk. It is unusual for a bank ever to completely be matched due to the nature of business terms and types of products offered.
Interest rate risk – stress testsThe Group monitors the impact of risks associated with the effects of fluctuations in prevailing interest rates. At 31 December 2016, the following table summarises the estimated impact of an immediate hypothetical increase or decrease in interest rates of 125 basis points on consolidated profit before income tax expense, and current interest rate risk profile.
Bank Group
2016 2015 2016 2015
Shs’000 Shs’000 Shs’000 Shs’000
30,520 10,875 125 basis points increases in interest rates 31,076 56,618
(30,520) (10,875) 125 basis points decrease in interest rates (31,076) (56,618)
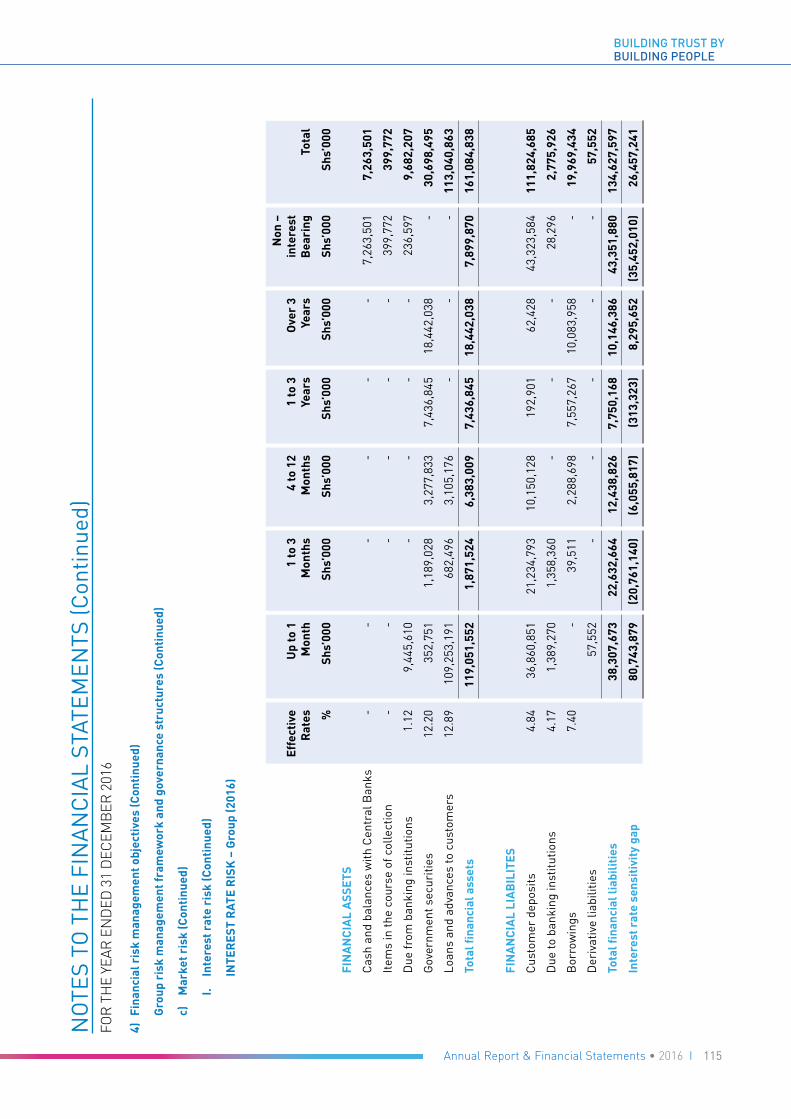
115Annual Report & Financial Statements • 2016 I
BUILDING TRUST BYBUILDING PEOPLE
NO
TES
TO T
HE
FIN
AN
CIA
L ST
ATEM
ENTS
(Con
tinue
d)FO
R T
HE
YEAR
EN
DED
31
DEC
EMB
ER 2
016
4) F
inan
cial
ris
k m
anag
emen
t obj
ecti
ves
(Con
tinu
ed)
G
roup
ris
k m
anag
emen
t fra
mew
ork
and
gove
rnan
ce s
truc
ture
s (C
onti
nued
)
c)
M
arke
t ris
k (C
onti
nued
)
I. In
tere
st r
ate
risk
(Con
tinu
ed)
IN
TER
EST
RAT
E R
ISK
– G
roup
(201
6)
Effe
ctiv
e R
ates
Up
to 1
M
onth
1 to
3
Mon
ths
4 to
12
Mon
ths
1 to
3Ye
ars
Ove
r 3
Year
s
Non
–in
tere
st
Bea
ring
To
tal
% S
hs’0
00
Shs
’000
Sh
s’00
0 S
hs’0
00
Shs
’000
S
hs’0
00
Shs’
000
FIN
AN
CIA
L A
SSET
S
Cas
h an
d ba
lanc
es w
ith C
entr
al B
anks
--
-
-
-
-
7,
263,
501
7,2
63,5
01
Item
s in
the
cour
se o
f col
lect
ion
--
-
-
-
-
39
9,77
2 3
99,7
72
Due
from
ban
king
inst
itutio
ns1.
12 9
,445
,610
-
-
-
-
2
36,5
97
9,6
82,2
07
Gov
ernm
ent s
ecur
ities
12.2
0 3
52,7
51
1,1
89,0
28
3,2
77,8
33
7,4
36,8
45
18,
442,
038
-
30,
698,
495
Loan
s an
d ad
vanc
es to
cus
tom
ers
12.8
9 1
09,2
53,1
91 6
82,4
96
3,1
05,1
76
--
-
113
,040
,863
Tota
l fina
ncia
l ass
ets
119
,051
,552
1
,871
,524
6
,383
,009
7
,436
,845
1
8,44
2,03
8 7
,899
,870
1
61,0
84,8
38
FIN
AN
CIA
L LI
AB
ILIT
ES
Cus
tom
er d
epos
its4.
84 3
6,86
0,85
1 2
1,23
4,79
3 1
0,15
0,12
8 1
92,9
01
62,
428
43,
323,
584
111
,824
,685
Due
to b
anki
ng in
stitu
tions
4.17
1,38
9,27
0 1,
358,
360
- -
- 28
,296
2,
775,
926
Bor
row
ings
7.
40-
39,5
11
2,28
8,69
8 7,
557,
267
10,0
83,9
58
- 19
,969
,434
Der
ivat
ive
liabi
litie
s57
,552
-
- -
- -
57,5
52
Tota
l fina
ncia
l lia
bilit
ies
38,3
07,6
73
22,6
32,6
64
12,4
38,8
26
7,75
0,16
8 10
,146
,386
43
,351
,880
13
4,62
7,59
7
Inte
rest
rat
e se
nsit
ivit
y ga
p80
,743
,879
(2
0,76
1,14
0)(6
,055
,817
)(3
13,3
23)
8,29
5,65
2 (3
5,45
2,01
0)26
,457
,241

116 I Annual Report & Financial Statements • 2016
BUILDING TRUST BYBUILDING PEOPLE
NO
TES
TO T
HE
FIN
AN
CIA
L ST
ATEM
ENTS
(Con
tinue
d)FO
R T
HE
YEAR
EN
DED
31
DEC
EMB
ER 2
016
4) F
inan
cial
ris
k m
anag
emen
t obj
ecti
ves
(Con
tinu
ed)
G
roup
ris
k m
anag
emen
t fra
mew
ork
and
gove
rnan
ce s
truc
ture
s (C
onti
nued
)
c)
M
arke
t ris
k (C
onti
nued
)
I. In
tere
st r
ate
risk
(Con
tinu
ed)
IN
TER
EST
RAT
E R
ISK
– G
roup
(201
5)
Effe
ctiv
e R
ates
Up
to 1
M
onth
1 to
3
Mon
ths
4 to
12
Mon
ths
1 to
3
Year
sO
ver
3 Ye
ars
Non
–in
tere
st
Bea
ring
To
tal
% S
hs’0
00
Shs
’000
Sh
s’00
0 S
hs’0
00
Shs
’000
S
hs’0
00
Shs’
000
FIN
AN
CIA
L A
SSET
S
Cas
h an
d ba
lanc
es w
ith C
entr
al B
anks
- -
-
-
-
-
8,
940,
056
8,94
0,05
6
Item
s in
the
cour
se o
f col
lect
ion
- -
-
-
-
-
84
8,81
984
8,81
9
Due
from
ban
king
inst
itutio
ns2.
571,
211,
520
-
-
-
-
5,46
4,12
06,
675,
640
Gov
ernm
ent s
ecur
ities
9.3
139,
881
2,25
9,96
47,
418,
467
3,99
5,85
914
,097
,736
-
27,9
11,9
07
Loan
s an
d ad
vanc
es to
cus
tom
ers
13.3
109,
884,
278
1,29
0,32
03,
483,
046
--
-
114,
657,
644
Tota
l fina
ncia
l ass
ets
111,
235,
679
3,55
0,28
410
,901
,513
3,99
5,85
914
,097
,736
15,2
52,9
9515
9,03
4,06
6
FIN
AN
CIA
L LI
AB
ILIT
ES
Cus
tom
er d
epos
its5.
1933
,453
,014
28,8
67,3
6510
,683
,849
-
-
39,3
60,4
0911
2,36
4,63
7
Due
to b
anki
ng in
stitu
tions
5.10
9,06
4,55
2 -
-
-
-
-
9,
064,
552
Bor
row
ings
7.
42 -
36
2,75
959
9,73
81,
679,
860
12,7
13,8
33 -
15
,356
,190
Der
ivat
ive
liabi
litie
s3.
3477
,389
-
-
-
-
-
77,3
89
Tota
l fina
ncia
l lia
bilit
ies
42,5
94,9
5529
,230
,124
11,2
83,5
871,
679,
860
12,7
13,8
3339
,360
,409
136,
862,
768
Inte
rest
rat
e se
nsit
ivit
y ga
p68
,640
,724
(25,
679,
840)
(382
,074
)2,
315,
999
1,38
3,90
3(2
4,10
7,41
4)22
,171
,298

117Annual Report & Financial Statements • 2016 I
BUILDING TRUST BYBUILDING PEOPLE
NO
TES
TO T
HE
FIN
AN
CIA
L ST
ATEM
ENTS
(Con
tinue
d)FO
R T
HE
YEAR
EN
DED
31
DEC
EMB
ER 2
016
4) F
inan
cial
ris
k m
anag
emen
t obj
ecti
ves
(Con
tinu
ed)
G
roup
ris
k m
anag
emen
t fra
mew
ork
and
gove
rnan
ce s
truc
ture
s (C
onti
nued
)
c)
M
arke
t ris
k (C
onti
nued
)
I. In
tere
st r
ate
risk
(Con
tinu
ed)
IN
TER
EST
RAT
E R
ISK
– B
ank
(201
6)
Effe
ctiv
e R
ates
Up
to 1
M
onth
1 to
3
Mon
ths
4 to
12
Mon
ths
1 to
3
Year
sO
ver
3 Ye
ars
Non
–in
tere
st
Bea
ring
To
tal
% S
hs’0
00
Shs
’000
Sh
s’00
0 S
hs’0
00
Shs
’000
S
hs’0
00
Shs’
000
FIN
AN
CIA
L A
SSET
S
Cas
h an
d ba
lanc
es w
ith C
entr
al B
anks
--
--
--
5,94
6,30
95,
946,
309
Item
s in
the
cour
se o
f col
lect
ion
--
--
--
405,
412
405,
412
Due
from
ban
king
inst
itutio
ns0.
539,
218,
836
--
--
-9,
218,
836
Gov
ernm
ent s
ecur
ities
12.2
0-
835,
508
924,
633
7,08
6,16
918
,440
,349
-27
,286
,659
Loan
s an
d ad
vanc
es to
cus
tom
ers
12.5
010
2,92
6,33
530
8,18
52,
437,
205
--
-10
5,67
1,72
5
Tota
l fina
ncia
l ass
ets
112,
145,
171
1,14
3,69
3 3,
361,
838
7,08
6,16
9 18
,440
,349
6,
351,
721
148,
528,
941
FIN
AN
CIA
L LI
AB
ILIT
ES
Cus
tom
er d
epos
its4.
8436
,024
,103
19
,678
,513
7,
722,
035
162,
975
62,4
28
40,5
10,1
46
104,
160,
200
Due
to b
anki
ng in
stitu
tions
4.17
1,26
9,20
5 1,
358,
360
- -
- -
2,62
7,56
5
Bor
row
ings
7.
58-
- 1,
260,
639
7,55
7,26
7 10
,159
,014
-
18,9
76,9
20
Der
ivat
ive
asse
ts57
,552
--
--
-57
,552
Tota
l fina
ncia
l lia
bilit
ies
37,3
50,8
60
21,0
36,8
73
8,98
2,67
4 7,
720,
242
10,2
21,4
4240
,510
,146
12
5,82
2,23
7
Inte
rest
rat
e se
nsit
ivit
y ga
p74
,794
,311
(1
9,89
3,18
0)
(5,6
20,8
36)
(634
,073
) 8,
218,
907
(34,
158,
425)
22
,706
,704

118 I Annual Report & Financial Statements • 2016
BUILDING TRUST BYBUILDING PEOPLE
NO
TES
TO T
HE
FIN
AN
CIA
L ST
ATEM
ENTS
(Con
tinue
d)FO
R T
HE
YEAR
EN
DED
31
DEC
EMB
ER 2
016
4) F
inan
cial
ris
k m
anag
emen
t obj
ecti
ves
( Con
tinu
ed)
G
roup
ris
k m
anag
emen
t fra
mew
ork
and
gove
rnan
ce s
truc
ture
s (C
onti
nued
)
c)
M
arke
t ris
k (C
onti
nued
)
I. In
tere
st r
ate
risk
(Con
tinu
ed)
IN
TER
EST
RAT
E R
ISK
– B
ank
(201
5)
Effe
ctiv
e R
ates
Up
to 1
M
onth
1 to
3
Mon
ths
4 to
12
Mon
ths
1 to
3
Year
sO
ver
3 Ye
ar
Non
–in
tere
st
Bea
ring
To
tal
% S
hs’0
00
Shs
’000
Sh
s’00
0 S
hs’0
00
Shs
’000
S
hs’0
00
Shs’
000
FIN
AN
CIA
L A
SSET
S
Cas
h an
d ba
lanc
es w
ith C
entr
al B
anks
- -
-
-
-
-
7
,291
,629
7
,291
,629
Item
s in
the
cour
se o
f col
lect
ion
- -
-
-
-
-
8
04,8
82
804
,882
Due
from
ban
king
inst
itutio
ns1.
99 -
-
-
-
-
5
,464
,120
5
,464
,120
Gov
ernm
ent s
ecur
ities
8.97
-
1,9
37,6
81
5,3
40,9
65
3,8
22,2
45
13,
912,
104
-
25,
012,
995
Loan
s an
d ad
vanc
es to
cus
tom
ers
11.3
810
5,19
1,95
6 17
6,17
1 1,
147,
925
- -
- 10
6,51
6,05
2
Tota
l fina
ncia
l ass
ets
105,
191,
956
2,11
3,85
2 6,
488,
890
3,82
2,24
5 13
,912
,104
13
,560
,631
14
5,08
9,67
8
FIN
AN
CIA
L LI
AB
ILIT
ES
Cus
tom
er d
epos
its5.
26 3
0,11
1,19
8 2
7,29
2,35
9 8
,879
,809
-
-
3
8,91
0,63
4 1
05,1
94,0
00
Due
to b
anki
ng in
stitu
tions
5.10
7,7
34,6
13
-
-
-
-
-
7,7
34,6
13
Bor
row
ings
7.80
-
362
,759
5
99,7
37
959
,908
1
2,20
8,60
3 -
1
4,13
1,00
7
Der
ivat
ive
liabi
litie
s3.
34 7
7,38
9 -
-
-
-
-
7
7,38
9
Tota
l fina
ncia
l lia
bilit
ies
37,
923,
200
27,
655,
118
9,4
79,5
46
959
,908
1
2,20
8,60
3 3
8,91
0,63
4 1
27,0
59,6
20
Inte
rest
rat
e se
nsit
ivit
y ga
p67
,268
,756
(2
5,54
1,26
6)
(2,9
90,6
56)
2,86
2,33
7 1,
703,
501
(25,
350,
003)
17
,952
,669

119Annual Report & Financial Statements • 2016 I
BUILDING TRUST BYBUILDING PEOPLE
NOTES TO THE FINANCIAL STATEMENTS (Continued)FOR THE YEAR ENDED 31 DECEMBER 2016
4) Financial risk management objectives (Continued)
Group risk management framework and governance structures (Continued)
c) Market Risk (Continued)
II. Foreign exchange risk
Foreign currency exchange risk refers to the potential changes in current and future earnings or capital arising from movements in foreign exchange market rates. The Group, through stringent intra-day and overnight exposure limits, ensures that the potential risk of loss arising from foreign exchange fluctuations to the Group’s earnings and capital is within prudential guidelines and internal policies. Any material overnight position is covered by stop loss orders with our international counter-parties.
The Group is exposed to the risk that the value of foreign currency denominated financial instruments it holds will fluctuate due to changes in market foreign exchange rates. The Board of Directors periodically approves policies and limits on the maximum level of exposures by currency and in total for both overnight and intra-day positions. Foreign currency risk is addressed through the following measures:
• On a daily basis, the overall foreign exchange risk exposure is measured using spot mid-rates and does not exceed 10% of the Group’s core capital.
• Any single currency exposure, irrespective of short or long positions does not exceed the limit of 10% of core capital.
• Intra-day and overnight foreign exchange positions are limited within strictly defined exposure and stop loss limits approved periodically by the Board Risk Management Committee.
The table on pages 117 to 120 summarise the Group’s and Bank’s exposure to foreign currency exchange rate risks.
At 31 December 2016, if the functional currencies in the economic environment in which the Group operates i.e. the Kenya Shilling had weakened or strengthened by 10% against the world’s major currencies, with all other variables held constant, consolidated profit before income tax expense would have been higher or lower as depicted in below table:
Bank Group
2016 2015 2016 2015
Shs’000 Shs’000 Shs’000 Shs’000
10% depreciation/appreciation
5,606 4,521 USD 6,261 4,602
89 72 GBP 1,605 76
211 155 EUR 1,288 202
39 36 Others 5,413 36
5,945 4,784 Total 14,567 4,916

120 I Annual Report & Financial Statements • 2016
BUILDING TRUST BYBUILDING PEOPLE
NO
TES
TO T
HE
FIN
AN
CIA
L ST
ATEM
ENTS
(Con
tinue
d)FO
R T
HE
YEAR
EN
DED
31
DEC
EMB
ER 2
016
4) F
inan
cial
ris
k m
anag
emen
t obj
ecti
ves
(Con
tinu
ed)
G
roup
ris
k m
anag
emen
t fra
mew
ork
and
gove
rnan
ce s
truc
ture
s (C
onti
nued
)
c)
M
arke
t Ris
k (C
onti
nued
)
II.
Fore
ign
exch
ange
ris
k (C
onti
nued
)
FO
REI
GN
EXC
HA
NG
E (C
UR
REN
CY) R
ISK
– G
roup
(201
6)
USD
GB
PEU
RO
Oth
ers
TOTA
L
Shs’
000
Shs’
000
Shs’
000
Shs’
000
Shs’
000
FIN
AN
CIA
L A
SSET
S
Cas
h an
d ba
lanc
es w
ith C
entr
al B
anks
6,
890,
914
1,9
74,3
54
2,4
18,1
31
436
,170
1
1,71
9,56
9
Due
from
ban
king
inst
itutio
ns
4,97
2,45
6 1
,909
,578
2
,317
,709
3
96,0
64
9,
595,
808
Loan
s an
d ad
vanc
es to
cus
tom
ers
45,
980,
176
7
28,6
67
1,5
54,4
23
3
,176
4
8,26
6,44
2
Oth
er a
sset
s
15
3,46
8
942
1
,441
8
15
5,85
9
Tota
l fina
ncia
l ass
ets
57,
997,
014
4,6
13,5
41
6,2
91,7
04
835
,418
69,
737,
678
FIN
AN
CIA
L LI
AB
ILIT
ES
Cus
tom
er d
epos
its 2
9,17
7,60
2 2
,374
,056
2
,875
,835
33,9
60
34,
461,
453
Due
to b
anki
ng in
stitu
tions
2,
528,
074
1
77
-
56,9
08
2,
585,
159
Oth
er li
abili
ties
1,
516,
798
-
-
-
1,51
6,79
8
Bor
row
ings
14,
991,
872
1,1
11
22,7
08
4
,688
1
5,02
0,37
9
Tota
l fina
ncia
l lia
bilit
ies
48,
214,
346
2,3
75,3
44
2,8
98,5
43
95
,556
53,
583,
789
Net
bal
ance
she
et p
osit
ion
9,
782,
668
2,2
38,1
97
3,3
93,1
61
739
,862
1
6,15
3,88
8
Off
bal
ance
she
et p
osit
ion
62,
607
(
16,0
49)
(
12,8
76)
54
,131
8
7,81
3

121Annual Report & Financial Statements • 2016 I
BUILDING TRUST BYBUILDING PEOPLE
NO
TES
TO T
HE
FIN
AN
CIA
L ST
ATEM
ENTS
(Con
tinue
d)FO
R T
HE
YEAR
EN
DED
31
DEC
EMB
ER 2
016
4) F
inan
cial
ris
k m
anag
emen
t obj
ecti
ves
(Con
tinu
ed)
G
roup
ris
k m
anag
emen
t fra
mew
ork
and
gove
rnan
ce s
truc
ture
s (C
onti
nued
)
c)
M
arke
t Ris
k (C
onti
nued
)
II.
Fore
ign
exch
ange
ris
k (C
onti
nued
)
FO
REI
GN
EXC
HA
NG
E (C
UR
REN
CY) R
ISK
– G
roup
(201
5)
USD
GB
PEU
RO
Oth
ers
TOTA
L
Shs’
000
Shs’
000
Shs’
000
Shs’
000
Shs’
000
FIN
AN
CIA
L A
SSET
S
Cas
h an
d ba
lanc
es w
ith C
entr
al B
anks
1,
655,
984
1
10,4
02
2
70,9
13
11
,626
2,04
8,92
5
Due
from
ban
king
inst
itutio
ns
4,04
3,39
0 1
,580
,622
986
,337
6
73,2
38
7,
283,
587
Loan
s an
d ad
vanc
es to
cus
tom
ers
48,
411,
217
7
28,6
67
1,5
54,4
23
3
,176
5
0,69
7,48
3
Oth
er a
sset
s
5,33
6,43
4
7
,102
8
,642
3,1
76
5,
355,
354
Tota
l fina
ncia
l ass
ets
59,
447,
025
2,4
26,7
93
2,8
20,3
15
691
,216
6
5,38
5,34
9
FIN
AN
CIA
L LI
AB
ILIT
ES
Cus
tom
er d
epos
its 3
2,79
7,45
7 2
,444
,184
2
,526
,616
64,6
11
37,
832,
868
Due
to b
anki
ng in
stitu
tions
6,
892,
262
82,8
20
30,0
96
213
,202
7,21
8,38
0
Oth
er li
abili
ties
2,
828,
090
5,4
65
7,5
17
9
,873
2,85
0,94
5
Bor
row
ings
9,
616,
737
-
-
-
9,61
6,73
7
Tota
l fina
ncia
l lia
bilit
ies
52,
134,
546
2,5
32,4
69
2,5
64,2
29
287
,686
5
7,51
8,93
0
Net
bal
ance
she
et p
osit
ion
7,
312,
479
(1
05,6
76)
2
56,0
86
403
,530
7,86
6,41
9
Off
bal
ance
she
et p
osit
ion
4,
742,
649
1
58,3
87
(3
12,4
48)
747
,598
5,33
6,18
6
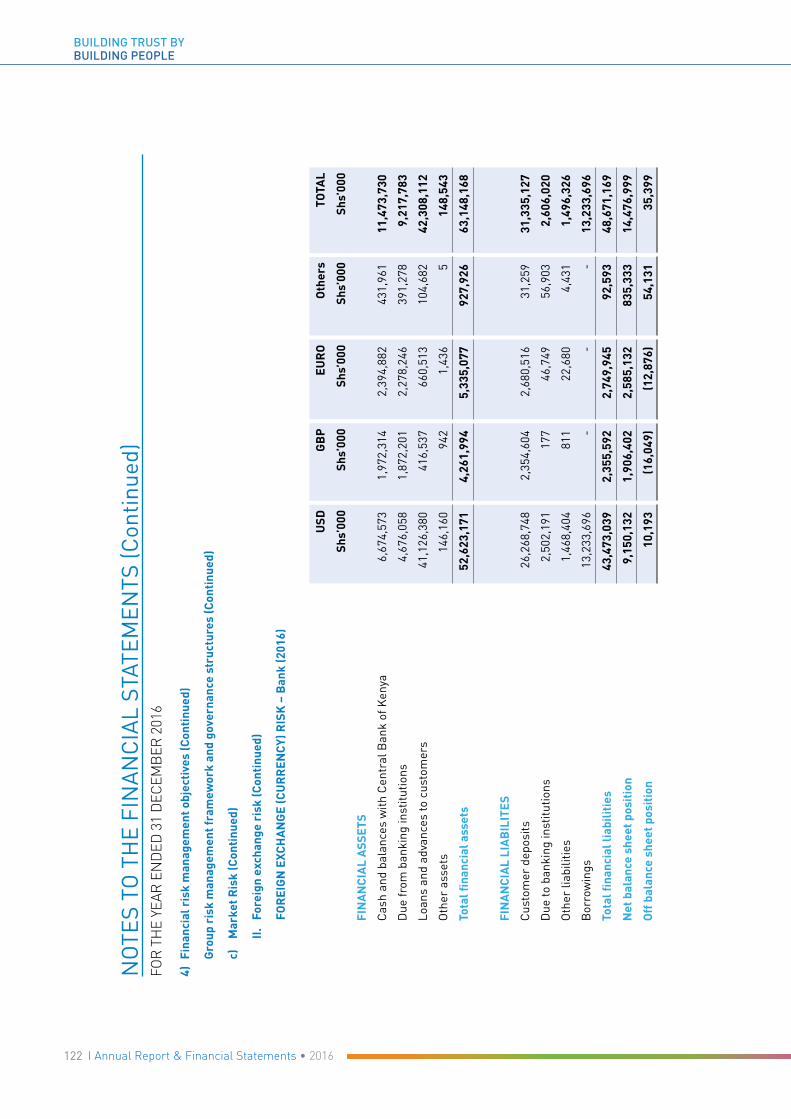
122 I Annual Report & Financial Statements • 2016
BUILDING TRUST BYBUILDING PEOPLE
NO
TES
TO T
HE
FIN
AN
CIA
L ST
ATEM
ENTS
(Con
tinue
d)FO
R T
HE
YEAR
EN
DED
31
DEC
EMB
ER 2
016
4) F
inan
cial
ris
k m
anag
emen
t obj
ecti
ves
(Con
tinu
ed)
G
roup
ris
k m
anag
emen
t fra
mew
ork
and
gove
rnan
ce s
truc
ture
s (C
onti
nued
)
c)
M
arke
t Ris
k (C
onti
nued
)
II.
Fore
ign
exch
ange
ris
k (C
onti
nued
)
FO
REI
GN
EXC
HA
NG
E (C
UR
REN
CY) R
ISK
– B
ank
(201
6)
USD
GB
PEU
RO
Oth
ers
TOTA
L
Shs’
000
Shs’
000
Shs’
000
Shs’
000
Shs’
000
FIN
AN
CIA
L A
SSET
S
Cas
h an
d ba
lanc
es w
ith C
entr
al B
ank
of K
enya
6,6
74,5
73
1
,972
,314
2
,394
,882
431
,961
1
1,47
3,73
0
Due
from
ban
king
inst
itutio
ns 4
,676
,058
1,8
72,2
01
2,2
78,2
46
3
91,2
78
9,
217,
783
Loan
s an
d ad
vanc
es to
cus
tom
ers
41,
126,
380
416
,537
660,
513
1
04,6
82
42,
308,
112
Oth
er a
sset
s14
6,16
0
9
42
1,4
36
5
148,
543
Tota
l fina
ncia
l ass
ets
52,
623,
171
4,2
61,9
94
5,33
5,07
7 9
27,9
26
63,
148,
168
FIN
AN
CIA
L LI
AB
ILIT
ES
Cus
tom
er d
epos
its 2
6,26
8,74
8
2,3
54,6
04
2,6
80,5
16
3
1,25
9 3
1,33
5,12
7
Due
to b
anki
ng in
stitu
tions
2,5
02,1
91
177
46
,749
56,
903
2
,606
,020
Oth
er li
abili
ties
1,46
8,40
4
8
11
22,6
80
4,4
31
1
,496
,326
Bor
row
ings
13,2
33,6
96
-
-
- 1
3,23
3,69
6
Tota
l fina
ncia
l lia
bilit
ies
43,
473,
039
2,3
55,5
92
2,7
49,9
45
9
2,59
3 4
8,67
1,16
9
Net
bal
ance
she
et p
osit
ion
9,1
50,1
32
1,9
06,4
02
2,5
85,1
32
835
,333
1
4,47
6,99
9
Off
bal
ance
she
et p
osit
ion
10,
193
(
16,0
49)
(1
2,87
6)
54,
131
35
,399
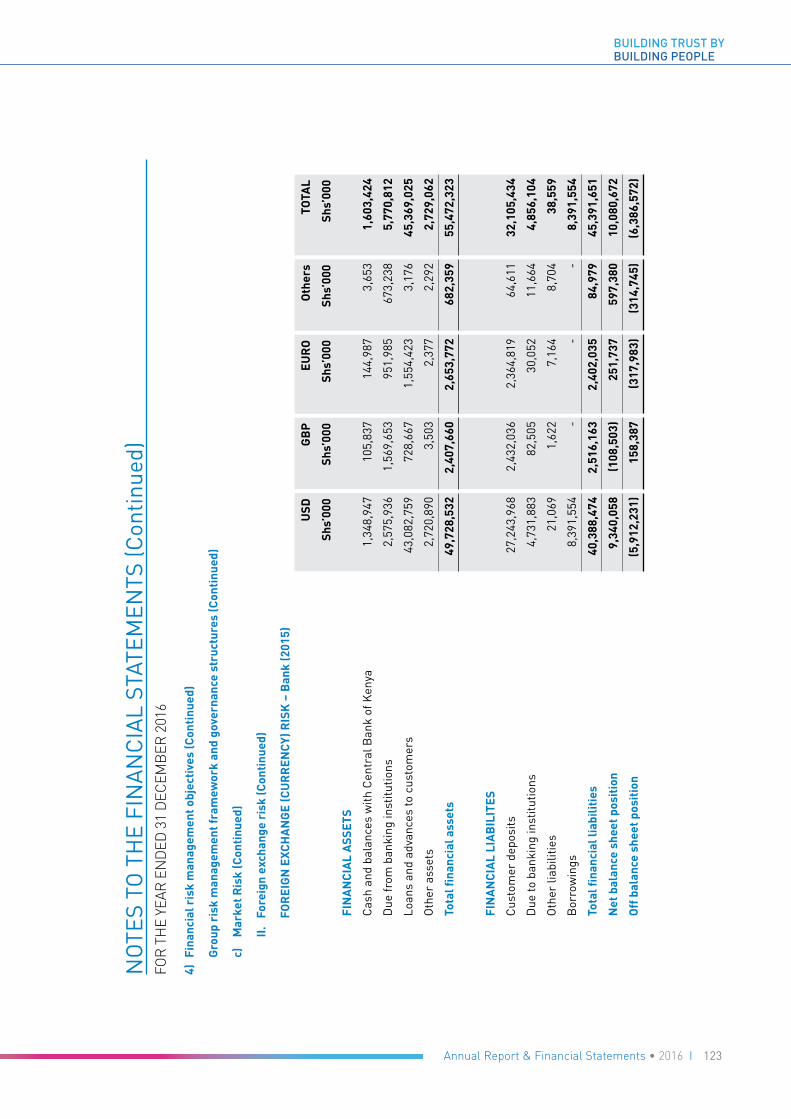
123Annual Report & Financial Statements • 2016 I
BUILDING TRUST BYBUILDING PEOPLE
NO
TES
TO T
HE
FIN
AN
CIA
L ST
ATEM
ENTS
(Con
tinue
d)FO
R T
HE
YEAR
EN
DED
31
DEC
EMB
ER 2
016
4) F
inan
cial
ris
k m
anag
emen
t obj
ecti
ves
(Con
tinu
ed)
G
roup
ris
k m
anag
emen
t fra
mew
ork
and
gove
rnan
ce s
truc
ture
s (C
onti
nued
)
c)
M
arke
t Ris
k (C
onti
nued
)
II.
Fore
ign
exch
ange
ris
k (C
onti
nued
)
FO
REI
GN
EXC
HA
NG
E (C
UR
REN
CY) R
ISK
– B
ank
(201
5)
USD
GB
PEU
RO
Oth
ers
TOTA
L
Shs’
000
Shs’
000
Shs’
000
Shs’
000
Shs’
000
FIN
AN
CIA
L A
SSET
S
Cas
h an
d ba
lanc
es w
ith C
entr
al B
ank
of K
enya
1,34
8,94
7
1
05,8
37
1
44,9
87
3,
653
1
,603
,424
Due
from
ban
king
inst
itutio
ns
2,
575,
936
1
,569
,653
951
,985
673
,238
5,7
70,8
12
Loan
s an
d ad
vanc
es to
cus
tom
ers
4
3,08
2,75
9
7
28,6
67
1,
554,
423
3,
176
45,
369,
025
Oth
er a
sset
s
2,
720,
890
3
,503
2,3
77
2,
292
2
,729
,062
Tota
l fina
ncia
l ass
ets
49,
728,
532
2,4
07,6
60
2,6
53,7
72
6
82,3
59
55,
472,
323
FIN
AN
CIA
L LI
AB
ILIT
ES
Cus
tom
er d
epos
its
27,
243,
968
2
,432
,036
2,36
4,81
9
6
4,61
1 3
2,10
5,43
4
Due
to b
anki
ng in
stitu
tions
4,73
1,88
3
8
2,50
5
3
0,05
2
1
1,66
4
4,8
56,1
04
Oth
er li
abili
ties
2
1,06
9
1,6
22
7
,164
8,70
4
38,5
59
Bor
row
ings
8,39
1,55
4
-
-
-
8,3
91,5
54
Tota
l fina
ncia
l lia
bilit
ies
40,
388,
474
2,5
16,1
63
2,4
02,0
35
84,9
79
45,
391,
651
Net
bal
ance
she
et p
osit
ion
9
,340
,058
(108
,503
)
251
,737
597
,380
1
0,08
0,67
2
Off
bal
ance
she
et p
osit
ion
(5,
912,
231)
1
58,3
87
(3
17,9
83)
(31
4,74
5) (
6,38
6,57
2)

124 I Annual Report & Financial Statements • 2016
BUILDING TRUST BYBUILDING PEOPLE
NOTES TO THE FINANCIAL STATEMENTS (Continued)FOR THE YEAR ENDED 31 DECEMBER 2016
4) Financial risk management objectives (Continued)
Group risk management framework and governance structures (Continued)
c) Market Risk (Continued)
III. Price risk
Shares quoted in the Nairobi Securities Exchange (“NSE”) i.e. “listed shares’’ are stated at their fair value on the last day of business in the year. These values are subject to frequent variations due to changes in their market prices.
At 31 December 2016, if the prices at the NSE had appreciated/depreciated by 5% with all other variables held constant, the impact on the statement of profit or loss, and shareholders’ equity would have been Shs 2,563,750 (2015: Shs 7,067,372) higher/lower.
The Group’s carries its unquoted equity investment in Tanzania Mortgage Refinance Company at fair value (Note 25). The fair value of the Group’s investment in Tanzania Mortgage Refinance Company is equal to the cost of shares purchased in the company. The variability in the range of reasonable fair value estimates for this investment is not significant.
d) Capital management
The Group’s objectives when managing capital are:
• To safeguard the Group’s ability to continue as a going concern in order to provide acceptable returns to the shareholders and benefits for other stakeholders while maintaining an optimal capital structure.
• To comply with capital requirements set by our regulators within the markets that the Group operates in.
• To maintain a strong capital base to support continued business development.
• To create an acceptable buffer catering for unexpected losses that the Group may incur in adverse market scenarios during the course of its business.
• To manage its capital structure and make adjustments to it according to changes in economic conditions and the risk characteristics of its activities. In order to maintain or adjust the capital structure, the Group may adjust the amount of dividend payment to shareholders, return capital to shareholders or issue capital securities.
The Group’s objectives when managing capital are broadly covered as follows:
I Banking
In line with our industry, the broader concept of capital and its adequacy is based on guidelines developed by the Basel Committee’s Accords and implemented for supervisory purposes by the central banks.
Central Bank of Kenya (CBK), Bank of Tanzania (BOT) and Bank of Uganda (BOU) largely segregate the total regulatory capital into two tiers;
• Tier 1 Capital (Core Capital), which includes ordinary share capital, share premium and retained earnings. The investment in subsidiaries or other financial institutions is deducted in arriving at tier 1 capital.
• Tier 2 Capital (Supplementary Capital) includes among others, 25% of property revaluation reserves (subject to regulatory approval) and collective impairment allowances
The risk weighted assets are measured by means of a hierarchy of four risk weights classified according to the nature of, and reflecting an estimate of, the credit risk associated with each asset and counterparty. A similar treatment is adopted for off-balance sheet exposure, with some adjustments to reflect the more contingent nature of the potential losses.
During the year, the banks within the Group had complied in full with all its externally imposed capital requirements.

125Annual Report & Financial Statements • 2016 I
BUILDING TRUST BYBUILDING PEOPLE
NOTES TO THE FINANCIAL STATEMENTS (Continued)FOR THE YEAR ENDED 31 DECEMBER 2016
4) Financial risk management objectives (Continued)
Group risk management framework and governance structures (Continued)
d) Capital management (Continued)
I Banking (Continued)
Bank Group
2016 2015 2016 2015
Shs’000 Shs’000 Shs’000 Shs’000
25,379,908 21,529,429 Tier 1 capital 28,942,838 23,427,721
6,503,528 8,827,078 Tier 2 capital 6,780,221 8,898,701
31,883,436 30,356,507 Tier 1 + Tier 2 capital 35,723,059 32,326,422
Risk–weighted assets
140,897,411 137,513,100 On-balance sheet 147,682,100 145,578,518
6,521,818 10,742,417 Off-balance sheet 7,362,771 11,439,315
147,419,229 148,255,517 Total risk-weighted assets 155,044,871 157,017,833
Minimum requirements
2016 2015Regulatory ratios 2016 2015
17.22% 14.52% Core capital/risk assets 10.50% 10.50%
24.36% 20.47% Core capital/deposits 8.00% 8.0%21.63% 20.48% Total capital/risk assets 14.50% 14.50%
II Investment banking & stock brokerage businesses
The Capital Markets Authority, which regulates the Group’s Investment Banking and Stock Brokerage businesses i.e. NIC Capital Limited and NIC Securities Limited respectively, prescribes minimum capitalisation requirements and a working capital of not below 20% of the prescribed minimum shareholders’ funds or three times the average monthly operating costs whichever is higher. The subsidiaries maintained their capital together with the other requirements well above the minimum requirements as outlined below;
NIC Capital NIC Securities
Shs’000 Shs 000
Minimum capital 250,000 50,000
Capital held as at;
31 December 2016 502,794 393,887
31 December 2015 518,275 391,914

126 I Annual Report & Financial Statements • 2016
BUILDING TRUST BYBUILDING PEOPLE
NOTES TO THE FINANCIAL STATEMENTS (Continued)FOR THE YEAR ENDED 31 DECEMBER 2016
4) Financial risk management objectives (Continued)
Group risk management framework and governance structures (Continued)
e) Fair value of financial assets and liabilities
IFRS 7 specifies a hierarchy of valuation techniques based on whether inputs used in the valuation techniques of financial instruments are observable or unobservable. Financial instruments are grouped into 3 levels based on the degree to which fair value data / input is observable.
i. Level 1 fair value measurements are those derived from quoted prices (unadjusted) in active trading markets for identical assets or liabilities. This level includes listed debt and equity instruments traded mainly on the Nairobi Securities Exchange (“NSE”).
ii. Level 2 fair value measurements are those derived from inputs other than quoted prices that are observable for the asset or liability, either directly (i.e. as a price) or indirectly (i.e. derived from prices). Input data for this category is sourced mainly from Reuters and the NSE. The external valuation of buildings has been performed using a sales comparison approach.
iii. Level 3 fair value measurements are those derived from valuation techniques that include inputs that are not based on observable market data (unobservable inputs). The fair value of the Group’s investment in Tanzania Mortgage Refinance Company is equal to the cost of shares purchased in the company. The variability in the range of reasonable fair value estimates for this investment is not significant.
The table below shows an analysis of financial instruments at fair value by level of the fair value hierarchy.
Bank Group
2016 2015 2016 2015
Shs’000 Shs’000 Note Shs’000 Shs’000
Level 1
23,795,496 19,703,042 Treasury bonds – available for sale 20 24,934,116 20,443,709
- - Quoted shares at fair value 25 1,448,941 142,348
23,795,496 19,703,042 26,383,057 20,586,057
Level 3
370,000 370,000 Buildings 27 370,000 370,000
- - Unquoted equity security in Tanzania Mortgage Refinance Company
25 - 23,650
370,000 370,000 370,000 393,650

127Annual Report & Financial Statements • 2016 I
BUILDING TRUST BYBUILDING PEOPLE
NOTES TO THE FINANCIAL STATEMENTS (Continued)FOR THE YEAR ENDED 31 DECEMBER 2016
4) Financial risk management objectives (Continued)
Group risk management framework and governance structures (Continued)
e) Fair value of financial assets and liabilities (Continued)
The table below shows an analysis of the fair value of financial instruments that are not carried at fair value by level of the fair value hierarchy;
Bank Note Group
2016 2015 2016 2015
Shs’000 Shs’000 Shs’000 Shs’000
Level 1
3,491,163 5,309,953 Government securities – held to maturity
20 5,764,379 7,468,197
Level 2
Financial assets
5,946,309 7,291,629 Cash and balances with central banks 17 7,263,501 8,940,056
405,412 804,882 Items in the course of collection 18 399,772 848,819
9,218,836 5,464,120 Due from banking institutions 19 9,682,207 6,675,640
105,671,725 106,516,052 Loans and advances to customers 22 113,040,863 114,657,644
1,383,185 2,436,739 Due from group companies 24 - -
1,425,411 1,351,658 Investments 25 1,507,847 1,517,656
124,050,878 123,865,080 131,894,190 132,639,815
Financial liabilities
104,160,200 105,194,000 Customer deposits 30 111,824,685 112,364,637
2,627,565 7,734,613 Due to banking institutions 31 2,775,926 9,064,552
18,976,920 14,131,007 Borrowings 32 19,965,484 15,356,190
1,847,305 1,059,017 Due to group companies 33 - -
127,611,990 128,118,637 134,566,095 136,785,379
There were no transfers between levels 1, 2 and 3 in the period and for level 3, there was no movement.
Level 1 – We have determined the fair value using quoted prices (unadjusted) from the Nairobi Securities Exchange.
Level 2 – The fair value of these balances is equal to their amortised cost.

128 I Annual Report & Financial Statements • 2016
BUILDING TRUST BYBUILDING PEOPLE
NOTES TO THE FINANCIAL STATEMENTS (Continued)FOR THE YEAR ENDED 31 DECEMBER 2016
5) Critical accounting estimates and judgments in applying the Group’s accounting policies
I Impairment losses on loans and advances
The Group reviews its loan portfolios to assess impairment regularly. In determining whether an impairment loss should be recorded in the income statement, the Group makes judgements as to whether there is any observable data indicating that there is a measurable decrease in the estimated future cash flows from a portfolio of loans, before a decrease can be identified with an individual loan in that portfolio. This evidence may include observable data indicating that there has been an adverse change in the payment status of borrowers in a Group, or national or local economic conditions that correlate with defaults on assets in the Group. Management uses estimates based on historical loss experience for assets with credit risk characteristics and objective evidence of impairment similar to those in the portfolio when scheduling its future cash flows. The methodology and assumptions used for estimating both the amount and timing of future cash flows are reviewed regularly to reduce any differences between loss estimates and actual loss experience.
II Held -to-maturity investments
The Group follows the guidance of IAS 39 on classifying non-derivative financial assets with fixed or determinable payments and fixed maturity as held-to-maturity. This classification requires significant judgement. In making this judgement, the Group evaluates its intention and ability to hold such investments to maturity. If the Group fails to keep these investments to maturity other than for the specific circumstances – for example, selling an insignificant amount close to maturity – it will be required to reclassify the entire class as available-for-sale. The investments would therefore be measured at fair value and not amortised cost.
III Goodwill impairment
The Group’s accounting policy for goodwill is described in Note 3& I. Goodwill is allocated to cash-generating units (‘CGU’) for the purpose of impairment testing. When the process of identifying and evaluating goodwill impairment demonstrates that the expected cash flows of a CGU have declined and/or that its cost of capital has increased, the effect is to reduce the CGU’s estimated fair value. If this results in an estimated recoverable amount that is lower than the carrying amount of the CGU, a charge for impairment of goodwill will be recorded, thereby reducing by a corresponding amount the Group’s profit for the year. Goodwill is stated at cost less accumulated impairment losses. Significant management judgement is involved in determining the cost of capital assigned to an individual CGU and in estimating its future cash flows.
IV Property and equipment
Critical estimates are made by the directors in determining depreciation rates for property and equipment.
V Fair value of trade receivables and payables
The carrying value less impairment provision of trade receivables and payables are assumed to approximate their fair values. The fair value of financial liabilities for disclosure purposes is estimated by discounting the future contractual cash flows at the current market interest rate that is available to the Group for similar financial instruments.
VI Taxes
The Group is subjected to numerous taxes and levies by various government and quasi- government regulatory bodies. As a rule of thumb, the Group recognises liabilities for the anticipated tax/levies payable with utmost care and diligence. However, significant judgment is usually required in the interpretation and applicability of those taxes/levies. Should it come to the attention of management, in one way or the other, that the initially recorded liability was erroneous, such differences will impact on the income and liabilities in the period in which such differences are determined.

129Annual Report & Financial Statements • 2016 I
BUILDING TRUST BYBUILDING PEOPLE
NOTES TO THE FINANCIAL STATEMENTS (Continued)FOR THE YEAR ENDED 31 DECEMBER 2016
5) Critical accounting estimates and judgments in applying the Group’s accounting policies ( Continued)
VII Valuation of financial instruments
The fair value of financial instruments where no active market exists or where quoted prices are not otherwise available are determined by using valuation techniques. In these cases, the fair values are estimated from observable data in respect of similar financial instruments or using models. Where market observable inputs are not available, they are estimated based on appropriate assumptions. Where valuation techniques (for example, models) are used to determine fair values, they are validated and periodically reviewed by qualified personnel independent of those that sourced them. The directors believe that the chosen valuation techniques and assumptions used in the valuation of its investments in NSE shares are appropriate in determining the fair value of financial instruments.
VIII Classification of leases of land and buildings as finance or operating leases
At the inception of each lease of land or building, the Group considers the substance rather than the form of the lease contract. Examples of situations that individually or in combination would normally lead to a lease being classified as a finance lease are:
• The lease transfers ownership of the asset to the lessee by the end of the lease term;
• The lessee has the option to purchase the asset at a price that is expected to be sufficiently lower than the fair value at the date the option becomes exercisable for it to be reasonably certain, at the inception of the lease, that the option will be exercised;
• The lease term is for the major part of the economic life of the asset even if title is not transferred;
• At the inception of the lease the present value of the minimum lease payments amounts to at least substantially all of the fair value of the leased asset; and
• The leased assets are of such a specialised nature that only the lessee can use them without major modifications.
The Group also considers indicators of situations that individually or in combination could also lead to a lease being classified as a finance lease. Examples of such indicators include:
• If the lessee can cancel the lease, the lessor’s losses associated with the cancellation are borne by the lessee;
• gains or losses from the fluctuation in the fair value of the residual accrue to the lessee (for example, in the form of a rent rebate equalling most of the sales proceeds at the end of the lease); and
• the lessee has the ability to continue the lease for a secondary period at a rent that is substantially lower than market rent.

130 I Annual Report & Financial Statements • 2016
BUILDING TRUST BYBUILDING PEOPLE
NOTES TO THE FINANCIAL STATEMENTS (Continued)FOR THE YEAR ENDED 31 DECEMBER 2016
6) Operating segments
a) Geographical segments The Group operations are within three geographical segments, Kenya, Tanzania and Uganda. The table below contains segmental information provided to the Chief Operating Decision Maker (the Group Executive Committee of management)
for the year ended 31 December 2016.
2016 Kenya Tanzania Uganda Total
Shs `000 Shs `000 Shs `000 Shs `000
Interest income 17,509,527 947,659 563,489 19,020,675
Interest expense (6,276,415) (392,747) (182,916) (6,852,078)
Net interest income 11,233,112 554,912 380,573 12,168,597
Credit impairment charges (3,711,702) 1,922 (39,750) (3,749,530)
Net interest income after credit impairment charges 7,521,410 556,834 340,823 8,419,067
Net fee, commission, trading and other income 3,670,937 145,230 102,982 3,919,149
Operating income 11,192,347 702,064 443,805 12,338,216
Depreciation and amortisation (398,618) (52,715) (48,509) (499,842)
Other operating expenses (4,770,068) (525,593) (375,764) (5,671,425)
Profit before income tax 6,023,661 123,756 19,532 6,166,949
Income tax expense (1,777,953) (55,745) (2,855) (1,836,553)
Profit after income tax 4,245,708 68,011 16,677 4,330,396
Loans and advances to customers 105,671,722 4,568,094 2,801,047 113,040,863
Customer deposits 104,160,200 5,510,320 2,154,165 111,824,685
Additions to non-current assets 40,098 (27,223) (33,263) (20,388)
Non-current assets 1,424,853 69,215 72,304 1,566,372
2015 Kenya Tanzania Uganda Total
Shs `000 Shs `000 Shs `000 Shs `000
Interest income 15,509,237 881,908 622,987 17,014,132
Interest expense (6,616,694) (400,012) (254,893) (7,271,599)
Net interest income 8,892,543 481,896 368,094 9,742,533
Credit impairment charges (1,539,452) (106,138) (6,885) (1,652,475)
Net interest income after credit impairment charges 7,353,091 375,758 361,209 8,090,058
Net fee, commission, trading and other income 3,588,289 282,906 84,439 3,955,634
Operating income 10,941,380 658,664 445,648 12,045,692
Depreciation and amortisation (383,689) (66,019) (42,748) (492,456)
Other operating expenses (4,307,593) (488,359) (360,009) (5,155,961)
Profit before income tax 6,250,098 104,286 42,891 6,397,275
Income tax expense (1,873,683) (31,286) (7,181) (1,912,150)
Profit after income tax 4,376,415 73,000 35,710 4,485,125
Loans and advances to customers 106,516,052 4,298,400 3,843,192 114,657,644
Customer deposits 105,194,000 5,322,620 1,848,017 112,364,637
Additions to non-current assets 495,810 (107,160) 35,417 424,067
Non-current assets 1,384,755 96,438 105,567 1,586,760

131Annual Report & Financial Statements • 2016 I
BUILDING TRUST BYBUILDING PEOPLE
NOTES TO THE FINANCIAL STATEMENTS (Continued)FOR THE YEAR ENDED 31 DECEMBER 2016
6) Operating segments (Continued)
b) Business segments The Group maintains the following business segments for allocation of resources and assessment of performance.
I. Corporate Commercial and Institutional Banking
Targets medium to large corporate clientele and institutions, with a focus on liability mobilization and asset growth.
II. Treasury dealing and brokerage Treasury dealing targets corporate clientele and institutions, with a focus on those with a foreign exchange component in their business, whereas the stock brokerage focuses on the execution of transactions at the Nairobi Securities Exchange on behalf of high net worth and institutional clients.
III. Retail banking ( SME & Personal Banking)Targets the mass affluent to high net worth and business banking clientele, with a focus on becoming the customers’ core deposit, transactional banker and financier. This also includes our asset finance product.
IV. Investment bankingTargets large and medium sized companies for research, advisory and capital restructuring requirements.
The segment information provided to the Executive Committee of management for the reported segments is contained on the next page. There were no changes in the reportable segments during the year.
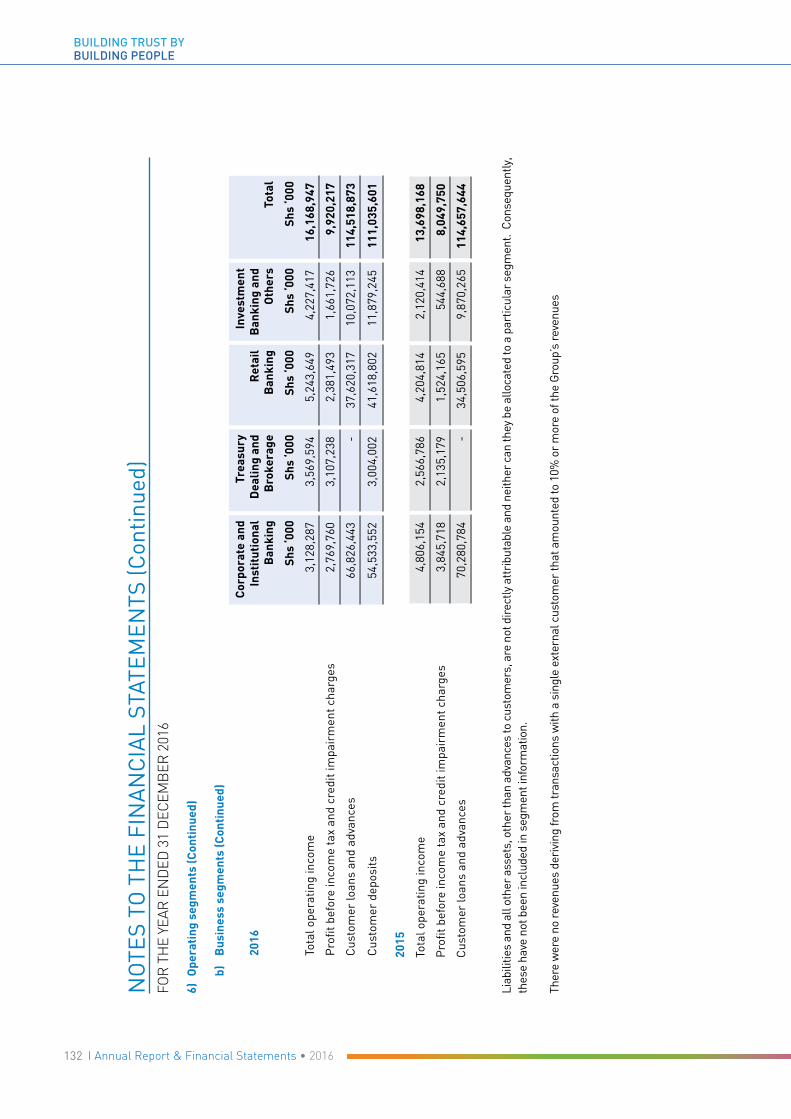
132 I Annual Report & Financial Statements • 2016
BUILDING TRUST BYBUILDING PEOPLE
NO
TES
TO T
HE
FIN
AN
CIA
L ST
ATEM
ENTS
(Con
tinue
d)FO
R T
HE
YEAR
EN
DED
31
DEC
EMB
ER 2
016
6) O
pera
ting
seg
men
ts (C
onti
nued
)
b)
B
usin
ess
segm
ents
(Con
tinu
ed)
2016
Cor
pora
te a
nd
Inst
itut
iona
l B
anki
ng
Trea
sury
D
ealin
g an
d B
roke
rage
Ret
ail
Ban
king
Inve
stm
ent
Ban
king
and
O
ther
s To
tal
Shs
‘000
Shs
‘000
Shs
‘000
Shs
‘000
Shs
‘000
Tota
l ope
ratin
g in
com
e 3
,128
,287
3,
569,
594
5,24
3,64
9 4,
227,
417
16,1
68,9
47
Pro
fit b
efor
e in
com
e ta
x an
d cr
edit
impa
irm
ent c
harg
es2,
769,
760
3,10
7,23
8 2,
381,
493
1,66
1,72
6 9,
920,
217
Cus
tom
er lo
ans
and
adva
nces
66
,826
,443
-
37,6
20,3
17
10,0
72,1
13
114,
518,
873
Cus
tom
er d
epos
its 5
4,53
3,55
2 3,
004,
002
41,6
18,8
02
11,8
79,2
45
111,
035,
601
2015
Tota
l ope
ratin
g in
com
e 4,
806,
154
2,56
6,78
6 4,
204,
814
2,1
20,4
14
13,6
98,1
68
Pro
fit b
efor
e in
com
e ta
x an
d cr
edit
impa
irm
ent c
harg
es3,
845,
718
2,1
35,1
79
1,52
4,16
5 54
4,68
8 8
,049
,750
Cus
tom
er lo
ans
and
adva
nces
70
,280
,784
- 3
4,50
6,59
5 9
,870
,265
11
4,65
7,64
4
Liab
ilitie
s an
d al
l oth
er a
sset
s, o
ther
than
adv
ance
s to
cus
tom
ers,
are
not
dire
ctly
att
ribu
tabl
e an
d ne
ither
can
they
be
allo
cate
d to
a p
artic
ular
seg
men
t. C
onse
quen
tly,
thes
e ha
ve n
ot b
een
incl
uded
in s
egm
ent i
nfor
mat
ion.
Ther
e w
ere
no re
venu
es d
eriv
ing
from
tran
sact
ions
with
a s
ingl
e ex
tern
al c
usto
mer
that
am
ount
ed to
10%
or
mor
e of
the
Gro
up’s
reve
nues

133Annual Report & Financial Statements • 2016 I
BUILDING TRUST BYBUILDING PEOPLE
NOTES TO THE FINANCIAL STATEMENTS (Continued)FOR THE YEAR ENDED 31 DECEMBER 2016
7) Interest income
Bank Group
2016 2015 2016 2015
Shs’000 Shs’000 Shs’000 Shs’000
Loan and advances to customers
10,247,702 9,502,577 Loans and advances 11,091,534 10,287,811
3,965,208 3,405,348 Finance leases 4,059,098 3,670,198
14,212,910 12,907,925 15,150,632 13,958,009
Government securities
2,272,279 1,896,697 Available-for-sale 2,708,584 2,021,338
941,950 443,155 Held to maturity 1,027,286 700,621
3,214,229 2,339,852 3,735,870 2,721,959
82,388 261,460 Due from banking institutions 134,173 334,164
17,509,527 15,509,237 19,020,675 17,014,132
Included within various captions under interest income for the year ended 31 December 2016 is a total of Shs 45,190,000 (2015: Shs 34,864,000) accrued on previously impaired financial assets.
8) Interest expense
Bank Group
2016 2015 2016 2015
Shs’000 Shs’000 Shs’000 Shs’000
4,986,572 5,406,341 Customer deposits 5,368,231 5,836,295
195,890 170,924 Due to banking institutions 246,731 238,466
1,147,440 1,083,900 Borrowings 1,237,116 1,196,838
6,329,902 6,661,165 6,852,078 7,271,599
9) Net fee and commission income
a) Fee and commission income
Bank Group
2016 2015 2016 2015
Shs’000 Shs’000 Shs’000 Shs’000
1,117,156 1,116,683 Credit related fees and commissions 1,215,324 1,202,807
710,909 554,093 Service / transaction fees 795,027 641,623
1,828,065 1,670,776 2,010,351 1,844,430

134 I Annual Report & Financial Statements • 2016
BUILDING TRUST BYBUILDING PEOPLE
NOTES TO THE FINANCIAL STATEMENTS (Continued)FOR THE YEAR ENDED 31 DECEMBER 2016
9) Net fee and commission income (Continued)
b) Fee and commission expense
Bank Group
2016 2015 2016 2015
Shs’000 Shs’000 Shs’000 Shs’000
36,478 25,713 Credit card related expenses 36,478 25,713
51,581 38,081 Transactional expenses 63,932 50,814
88,059 63,794 100,410 76,527
10) Net trading income
Bank Group
2016 2015 2016 2015
Shs’000 Shs’000 Shs’000 Shs’000
1,030,462 1,257,433 Foreign exchange income 1,105,147 1,431,231
201,616 134,481 Bond trading income 201,744 135,350
- - Fair value loss on investment in quoted shares (note 25 (a)) (2,748) (3,490)
1,232,078 1,391,914 1,304,143 1,563,091
11) Other operating income
The following items are included in other operating income;
Bank Group
2016 2015 2016 2015
Shs’000 Shs’000 Shs’000 Shs’000
9,004 6,171 Rental income - 3,155
4,161 (6)(Loss)/gain on disposal of motor vehicle and equipment (note 39 (c)) 24,778 991
38,005 10,077 Bad debt recoveries 67,399 38,507
123,525 116,178 Trust and other fiduciary fees 123,525 116,178
12) Credit impairment charges
a) Specific allowance for impairment
Bank Group
2016 2015 2016 2015
Shs’000 Shs’000 Shs’000 Shs’000
2,388,739 2,301,711 At start of year 2,776,628 2,680,360
- - Exchange difference on translation (131,334) (9,933)
3,190,467 1,450,843 Charge for the year 3,228,741 1,570,015
(851,178) (1,363,815) Write-offs (851,946) (1,463,814)
4,728,028 2,388,739 At end of year 5,022,089 2,776,628

135Annual Report & Financial Statements • 2016 I
BUILDING TRUST BYBUILDING PEOPLE
NOTES TO THE FINANCIAL STATEMENTS (Continued)FOR THE YEAR ENDED 31 DECEMBER 2016
12) Credit impairment charges (Continued)
b) Collective allowance for impairment
Bank Group
2016 2015 2016 2015
Shs’000 Shs’000 Shs’000 Shs’000
150,766 62,157 At start of year 154,740 65,094
- - Exchange difference on translation 16,708 7,186
521,235 88,609 Charge for the year 520,789 82,460
672,001 150,766 At end of year 692,237 154,740
c) Total allowance for impairment
Bank Group
2016 2015 2016 2015
Shs’000 Shs’000 Shs’000 Shs’000
2,539,505 2,363,868 At start of year 2,931,368 2,745,454
- - Exchange difference on translation (114,626) (2,747)
3,711,702 1,539,452 Charge for the year 3,749,530 1,652,475
(851,178) (1,363,815) Write-offs (851,946) (1,463,814)
5,400,029 2,539,505 At end of year 5,714,326 2,931,368
13) Employee benefits
The following items are included under employee benefits:
Bank Group
2016 2015 2016 2015
Shs’000 Shs’000 Shs’000 Shs’000
2,301,640 2,155,055 Salaries and wages 2,849,110 2,632,868
141,785 - Staff restructure cost 151,010 -
28,619 16,370 Directors’ emoluments – fees 35,160 35,008
124,446 151,749 – other 147,278 212,034
162,655 138,910 Pension costs – defined contribution 179,635 152,436
2,376 1,542 Pension costs - statutory contributions 32,034 29,033
2,904 2,530 Gratuity provision 2,904 2,530
2,764,425 2,466,156 3,397,131 3,063,909
The total number of employees as at 31 December 2016 for the Group was 1,095 (2015: 1,069).
14) (a) Depreciation and amortisation
Bank Group
2016 2015 2016 2015
Shs’000 Shs’000 Shs’000 Shs’000
191,548 199,332 Depreciation (note 27) 277,780 276,853
191,670 183,067 Amortisation of computer software (note 28 (a)) 221,937 215,477
125 125 Amortisation of operating lease (note 29) 125 125
383,343 382,524 499,842 492,455

136 I Annual Report & Financial Statements • 2016
BUILDING TRUST BYBUILDING PEOPLE
NOTES TO THE FINANCIAL STATEMENTS (Continued)FOR THE YEAR ENDED 31 DECEMBER 2016
14) (b) Other operating expenses
The following items are included in other operating expenses:
Bank Group2016 2015 2016 2015
Shs’000 Shs’000 Shs’000 Shs’000 221,239 189,908 Rental charges 341,120 311,404 120,246 95,740 Other premises costs 150,360 124,194 241,456 194,973 IT expenses 265,817 215,796 162,544 172,610 Publicity and advertising 174,141 180,874 146,227 130,130 Deposit protection fund 162,517 143,582
29,065 22,445 Share registration costs 29,065 22,445 11,404 10,500 Auditor’s remuneration 23,400 22,010
15) Income tax
(a) Income tax expense
Bank Group2016 2015 2016 2015
Shs’000 Shs’000 Current income tax Shs’000 Shs’0003,094,358 2,331,269 Current income year 3,156,052 2,378,402
67,083 - Prior year under provision 70,283 10,458 3,161,441 2,331,269 3,226,335 2,388,860
Deferred income tax (note 26)
(1,361,472) (329,657) Current year (1,307,586) (334,042)(16,606) (133,279) Prior year over provision (82,196) (142,668)
1,783,363 1,868,333 1,836,553 1,912,150
b) Reconciliation of tax expense to expected tax base based on accounting profit
The tax on the profit before income tax differs from the tax charge that would apply if all profit had been taxed using the statutory income tax rate:
Bank Group2016 2015 2016 2015
Shs’000 Shs’000 Shs’000 Shs’000 5,925,510 6,259,656 Profit before income tax 6,166,949 6,397,275 1,777,653 1,877,897 Income tax - at the statutory rate of 30 % (2015: 30%) 1,850,085 1,919,183 83,618 76,576 Tax effect of expenses not deductible for tax 144,427 139,934
(128,385) 47,139 Tax effect of revenues that are not taxable (146,046) (14,758)
Prior year under provision: 67,083 - - Current income tax 70,283 10,459
(16,606) (133,279) - Deferred income tax (82,196) (142,668) 1,783,363 1,868,333 1,836,553 1,912,150

137Annual Report & Financial Statements • 2016 I
BUILDING TRUST BYBUILDING PEOPLE
NOTES TO THE FINANCIAL STATEMENTS (Continued)FOR THE YEAR ENDED 31 DECEMBER 2016
15) Income tax (Continued)
c) Current income tax payable/(recoverable) movement
Bank Group
2016 2015 2016 2015
Shs’000 Shs’000 Shs’000 Shs’000
138,567 (56,570) At start of year 35,752 (172,572)
- - Exchange difference on translation (791) (33,400)
3,161,441 2,331,269 Current income tax expense – current year (note 15(a) 3,226,335 2,388,860
(2,853,243) (2,136,132) Income taxation paid (2,942,650) (2,147,137)
446,765 138,567 At end of year 318,646 35,751
Comprising:
- - Current income tax recoverable (137,003) (112,729)
446,765 138,567 Current income tax payable 455,649 148,480
446,765 138,567 At end of year 318,646 35,751
16) Earnings per share
Earnings per share is calculated by dividing the profit attributable to equity holders of the parent company by the weighted average number of ordinary shares outstanding during the year.
Bank Group
2016 2015 2016 2015
Shs’000 Shs’000 Shs’000 Shs’000
4,142,147 4,391,323Profit attributable to equity holders of the Bank (Shs'000) 4,309,885 4,477,355
Weighted average number of shares for purposes of basic and diluted earnings per share:
639,945,603 639,945,603 Issued ordinary shares at start and end of year 639,945,603 639,945,603
6.47 6.86 Earnings per share (Shs) 6.73 7.00
The calculation of basic and diluted earnings per share is based on continuing operations attributable to the ordinary equity holders of the Bank. There were no discontinued operations during the year.

138 I Annual Report & Financial Statements • 2016
BUILDING TRUST BYBUILDING PEOPLE
NOTES TO THE FINANCIAL STATEMENTS (Continued)FOR THE YEAR ENDED 31 DECEMBER 2016
17) Cash and balances with Central Banks
Bank Group
2016 2015 2016 2015
Shs’000 Shs’000 Shs’000 Shs’000
1,585,835 1,290,137 Cash on hand 1,919,377 1,662,734
Balances with central bank(s):
(1,032,573) 557,516 Other (available for use by the Bank/Group) (709,491) 1,160,263
553,262 1,847,653 Included in cash and cash equivalents (note 39 (b)) 1,209,886 2,822,997
5,393,047 5,443,976 Mandatory reserve deposits 6,053,615 6,117,059
5,946,309 7,291,629 7,263,501 8,940,056
The mandatory reserve deposits mainly represents regulatory cash ratio requirements based on the customer deposits with the Group. As at 31 December 2016, the cash ratio requirement was 5.25% (2015: 5.25%) in Kenya, 10.0% (2015 – 10.0%) in Tanzania and 8.5% (2015 – 8.5%) in Uganda of eligible deposits. These funds are not available for the day to day operations of the Group and are non interest earning.
Amounts included in cash and cash equivalents are current. Mandatory reserve deposits are non-current. Cash and balances with central banks are classified as ‘loans and receivables’.
18) Items in the course of collection
Items in the course of collection are current and are classified as ‘loans and receivables’.
Bank Group
2016 2015 2016 2015
Shs’000 Shs’000 Shs’000 Shs’000
405,412 804,882 Clearing account balances 399,772 848,819
19) Due from banking institutions
Balances dues from banking institutions are current and are classified as ‘loans and receivables’.
Bank Group
2016 2015 2016 2015
Shs’000 Shs’000 Shs’000 Shs’000
1,334,364 - Deposits due from banking institutions 1,797,735 1,211,520
7,884,472 5,464,120 Balances due from banking institutions 7,884,472 5,464,120
9,218,836 5,464,120 9,682,207 6,675,640
0.53% 1.99% Weighted average effective interest rate as at year end 1.12% 2.57%

139Annual Report & Financial Statements • 2016 I
BUILDING TRUST BYBUILDING PEOPLE
NOTES TO THE FINANCIAL STATEMENTS (Continued)FOR THE YEAR ENDED 31 DECEMBER 2016
20) Government securities
Securities held to maturity are stated at amortised cost while those classified as “Fair value through profit or loss” and “available-for-sale” are stated at fair value.
a) Government securities are categorised as follows:
Bank Group
2016 2015 2016 2015
Shs’000 Shs’000 Shs’000 Shs’000
23,795,496 19,703,042 Available for sale 24,934,116 20,443,710
3,491,163 5,309,953 Held to maturity 5,764,379 7,468,197
27,286,659 25,012,995 30,698,495 27,911,907
The table below summarises the weighted average effective interest rate for government securities.
Bank Group
2016 2015 2016 2015
% % % %
9.31 9.49 Available for sale 9.23 9.26
11.45 8.35 Held to maturity 11.26 9.38
b) The maturity profile of Government securities is a follows:
GroupAvailable
for saleHeld to
maturity Total Shs `000 Shs `000 Shs `000
At 31 December 2016
Included in cash and cash equivalents 96,050 - 96,050
Less than 1 year 1,525,157 3,197,849 4,723,006
1-5 years 8,096,315 2,566,530 10,662,845
Over 5 years 15,216,594 - 15,216,594
24,934,116 5,764,379 30,698,495
At 31 December 2015
Included in cash and cash equivalents 696,158 1,612,186 2,308,344
Less than 1 year 2,580,837 5,553,547 8,134,384
1-5 years 9,685,290 302,464 9,987,754
Over 5 years 7,481,425 - 7,481,425
20,443,710 7,468,197 27,911,907

140 I Annual Report & Financial Statements • 2016
BUILDING TRUST BYBUILDING PEOPLE
NOTES TO THE FINANCIAL STATEMENTS (Continued)FOR THE YEAR ENDED 31 DECEMBER 2016
20) Government securities (Continued)
b) The maturity profile of Government securities is a follows: (Continued)
Bank Available for sale
Held to maturity Total
At 31 December 2016 Shs `000 Shs `000 Shs `000
Included in cash and cash equivalents - - -
Less than 1 year 835,059 924,633 1,759,692
1-5 years 7,743,843 2,566,530 10,310,373
Over 5 years 15,216,594 - 15,216,59423,795,496 3,491,163 27,286,659
At 31 December 2015Included in cash and cash equivalents 329,884 1,612,186 1,942,070
Less than 1 year 2,424,489 3,395,303 5,819,792
1-5 years 9,534,674 302,464 9,837,138
Over 5 years 7,413,995 - 7,413,995 19,703,042 5,309,953 25,012,995
21) Derivative assets
The amount represents the fair value of forward foreign exchange contracts. These derivative assets and liabilities are measured at fair value through profit or loss. Notional principal amounts are the amounts underlying the contract at the reporting date.
Bank Group2016 2015 2016 2015
Shs’000 Shs’000 Shs’000 Shs’000
(57,552) (77,389) Fair value of forward contracts (57,552) (77,389) 14,043,849 21,346,126 Notional value of forward contracts 14,043,849 21,346,126
Derivative assets are current.
22) Loans and advances to customers
Bank Group
2016 2015 2016 2015
Shs’000 Shs’000 Shs’000 Shs’000
26,549,327 23,089,696 Finance lease receivables 26,867,659 23,631,076
77,041,555 74,798,585 Commercial loans 84,406,658 82,790,660
7,480,872 11,167,276 Bills discounted 7,480,872 11,167,276
111,071,754 109,055,557 Gross loans and advances to customers 118,755,189 117,589,012 Provisions for impairment
4,728,028 2,388,739 Specific allowance (Note 12) 5,022,089 2,776,627
672,001 150,766 Collective allowance (Note 12) 692,237 154,741
5,400,029 2,539,505 Total impairment 5,714,326 2,931,368
105,671,725 106,516,052 Net loans and advances to customers 113,040,863 114,657,644
7,238,448 9,776,326 Net non performing loans and advances to customers 7,861,744 10,451,907

141Annual Report & Financial Statements • 2016 I
BUILDING TRUST BYBUILDING PEOPLE
NOTES TO THE FINANCIAL STATEMENTS (Continued)FOR THE YEAR ENDED 31 DECEMBER 2016
22) Loans and advances to customers (Continued)
Finance lease receivables, may be analysed as follows:
Bank Group
2016 2015 2016 2015
Shs’000 Shs’000 Shs’000 Shs’000
4,839,200 3,161,107 Not later than 1 year 5,178,141
21,710,127 19,928,589 Later than 1 year and not later than 5 years 21,689,518 20,248,563
26,549,327 23,089,696 Present value of minimum lease payments receivable 26,867,659 23,631,076
733,164
912,647 Accumulated allowance for uncollectible minimum lease payments receivable 733,164 912,647
The Group and Bank enter into finance leasing arrangements for certain plant, equipment, motor vehicles and aircraft. The average term of finance leases entered into is 3 years. Unguaranteed residual values of assets leased under finance leases are estimated at nil (2015: nil).
There are no contingent rents recognised as income in 2015 and 2016.
The weighted average effective interest rates on loans and advances to customers at year end were as follows:
Bank Group
2016 2015 2016 2015
% % % %
15.32 14.55 Finance lease receivables 15.26 14.52
11.97 11.22 Commercial loans 12.24 11.55
10.92 9.10 Bills discounted 10.92 9.10
Loans and advances to customers are classified as current and non current as follows:
Bank Group
2016 2015 2016 2014
Shs’000 Shs’000 Shs’000 Shs’000
46,004,252 50,851,355 Current 50,917,165 56,937,469
59,667,473 55,664,697 Non-Current 62,123,698 57,720,175
105,671,725 106,516,052 113,040,863 114,657,644
23) Other assets
Bank Group
2016 2015 2016 2015
Shs’000 Shs’000 Shs’000 Shs’000
220,714 169,408 Prepayments 264,309 225,119
912,019 860,959 Other receivables 1,045,542 920,754
- - Trade receivables 28,762 47,121
1,132,733 1,030,367 1,338,613 1,192,994
Other assets are current. Other assets, excluding prepayments, are classified as ‘loans and receivables’.

142 I Annual Report & Financial Statements • 2016
BUILDING TRUST BYBUILDING PEOPLE
NOTES TO THE FINANCIAL STATEMENTS (Continued)FOR THE YEAR ENDED 31 DECEMBER 2016
24) Due from group companies
Group Bank
2016 2015 2016 2015
Shs’000 Shs’000 Shs’000 Shs’000
- 10,246 NIC Capital - -
- 13,778 NIC Securities - -
- 343 NIC Insurance - -
17 31 NIC Leasing LLP - -
7,980 2,769 Mercantile Finance - -
576,447 357,904 NIC Bank Tanzania - -
798,741 2,051,668 NC Bank Uganda - -
1,383,185 2,436,739 - -
The Company has related party transactions with certain of its subsidiaries. These transactions which are primarily short term in nature, include cash accounts, charges for operational support and the borrowing or lending of funds, and are entered into in the ordinary cause of business. These are on the same terms as comparable transactions with third parties.
25) Investments
Bank Group
2016 2015 2016 2015
Shs’000 Shs’000 Shs’000 Shs’000
5,357,701 4,357,701 Investment in subsidiaries 25(b) - -
1,425,411 1,351,658 Corporate bonds 1,425,411 1,351,658
- - Equity investment in Nairobi Securities Exchange (NSE) 52,275 130,938
- - Unquoted equity security in Tanzania Mortgage Refinance Company
23,530 23,650
- - Available for sale investments 6,631 11,410
6,783,112 5,709,359 1,507,847 1,517,656
Investment in subsidiaries is non-current. The other investments are current.

143Annual Report & Financial Statements • 2016 I
BUILDING TRUST BYBUILDING PEOPLE
NOTES TO THE FINANCIAL STATEMENTS (Continued)FOR THE YEAR ENDED 31 DECEMBER 2016
25) Investments (Continued)
a) The movement in investments is as follows:
Bank Group
2016 2015 2016 2015
Shs’000 Shs’000 Shs’000 Shs’000
5,709,359 5,398,306 At start of year 1,517,656 1,615,965
73,753 (115,147) Corporate bonds 73,753 (115,147)
- 376,200 Investment in NC Bank Uganda - -
1,000,000 - Investment in NIC Bank Kenya PLC - -
- - Changes in fair value - Equity investment in NSE (78,663) 22,313
- - Unquoted equity security in Tanzania Mortgage Refinance Company (120)
(1,730)
- - Available for sale investments (4,779) (3,745)
- 50,000 Investment in NIC Leasing LLP - -
6,783,112 5,709,359 At end of year 1,507,847 1,517,656
Investments, excluding investments in subsidiaries, are classified as ‘assets at fair value through profit and loss’. None of the financial assets are impaired.
b) Investment in subsidiaries (at cost)
BANK
Name Principal Holding 2016 2015
activity % Shs’000 Shs’000
NC Bank Uganda Banking 100 1,513,738 1,513,738
NIC Bank Tanzania Banking 69.84 1,692,462 1,692,462
NIC Bank Kenya PLC Banking 100 1,000,000 -
NIC Capital Financial advisory 100 500,000 500,000
NIC Insurance Agents Insurance agency 100 1,000 1,000
National Industrial Credit Trustees Dormant 100 500 500
Mercantile Finance Company Dormant 100 50,000 50,000
The African Mercantile Banking Company Dormant 100 1 1
NIC Properties Property 100 550,000 550,000
NIC Leasing LLP Leasing 100 50,000 50,000
5,357,701 4,357,701
NIC Capital Limited has a subsidiary, NIC Securities Limited whose results have been incorporated in these financial statements. Details of NIC Securities Limited at cost are as follows
Principal Holding 2016 2015
Name activity % Shs `000 Shs `000
NIC Securities Limited Brokerage services 100% 456,240 456,240

144 I Annual Report & Financial Statements • 2016
BUILDING TRUST BYBUILDING PEOPLE
NOTES TO THE FINANCIAL STATEMENTS (Continued)FOR THE YEAR ENDED 31 DECEMBER 2016
25) Investments (Continued)
b) Investment in subsidiaries (at cost) (Continued)
All the subsidiary companies have their financial year ended 31 December and are incorporated as limited liability companies a part from NIC Leasing, which is incorporated as a limited liability partnership. Except for NIC Bank Tanzania Limited and NC Bank Uganda Limited which are incorporated and domiciled in Tanzania and Uganda respectively, all other subsidiaries are incorporated and domiciled in Kenya.
NC Bank Uganda Limited was established in 2012 to offer banking services for our customers in Uganda. The audited financial statements for the year ended 31 December 2016 show that the company made a profit equivalent to Shs 16,677,000 (2015: a profit of Shs 35,710,000).
NIC Bank Limited acquired 51% of Savings & Finance Commercial Bank Limited now renamed NIC Bank Tanzania Ltd with effective control being passed on 1 May 2009. The audited financial statements for the year ended 31 December 2016 show that the company made a profit equivalent to Shs 68,011,000 (2015: a profit of Shs 73,000,000).
NIC Capital Limited was established in 2005 to offer investment banking services. The audited financial statements for the year ended 31 December 2016 show that the company made a loss of Shs 12,223,000 (2015: a loss of Shs 489,000).
NIC Capital Limited (NICCL) acquired NIC Securities Ltd (NICSL) with effective control being passed on 1 January 2008. Subsequently, substantially through rights issues, the shareholding of NICCL in NICSL has increased to 100%. NICSL offers brokerage services and is a registered broker with the Nairobi Securities Exchange. The audited financial statements for the year ended 31 December 2016 show that the company made a profit of Shs 79,905,000 (2015: Shs 20,371,000). The results of NIC Securities Limited are consolidated in these financial statements.
NIC Insurance Agents Limited was a 68% subsidiary of Mercantile Finance Company Limited (MFC). In 2010, NIC Bank Limited acquired the non-controlling interest and now directly owns 100% of the company. The company offers Bancassurance services. The audited financial statements for the year ended 31 December 2016 show that the company made a profit of Shs 40,645,000 (2015: Shs 21,176,000).
National Industrial Credit Trustees Limited functions in a trustee capacity. The audited financial statements show that the company made no profit or loss for the year (2015: Shs nil).
Mercantile Finance Company Limited did not trade during the year ended 31 December 2016. Its activities are limited to the recovery of its non performing debts. The audited financial statements show that the company made no profit or loss for the year (2015: Shs nil).
The African Mercantile Banking Company Limited did not trade during the year ended 31 December 2016. The audited financial statements show that the company made no profit or loss for the year (2015: Shs nil).
In April 2014, the Bank acquired a 100% shareholding in Codicote Limited for a consideration of Shs 550 million. The sole asset of Codicote Limited is Land LR NO. 209/13628 adjacent to the headquarters of the Bank in Upperhill, Nairobi. The Company name was subsequently changed to NIC Properties whose sole activity is the ownership of the Land. The audited financial statements for the year ended 31 December 2016 show that the company made no profit (2015: Shs nil).
NIC Leasing Limited Liability Partnership was formed during the year ended 31 December 2015 for leasing of motor vehicle and equipment. The audited financial statements for the year ended 31 December 2016 show that the company made a loss for the year Shs 4,766,000 (2015: a loss of Shs 12,471,000).
NIC Bank Kenya PLC was incorporated on 1 November 2016 as part of the re-organization to create a non-operating holding company (NIC Bank Limited) and transfer the banking business and net assets of NIC Bank Limited to NIC Bank Kenya PLC. The Central Bank of Kenya has approved NIC Bank Limited as a non-operating holding company and has licensed NIC Bank Kenya PLC. We await final regulatory approval to complete the reorganisation, at completion NIC Bank Limited will change its name to NIC Group PLC and will recognise incremental investment in NIC Bank Kenya PLC on alottment of new shares it receives from NIC Bank Kenya PLC as consideration for banking net assets transferred.
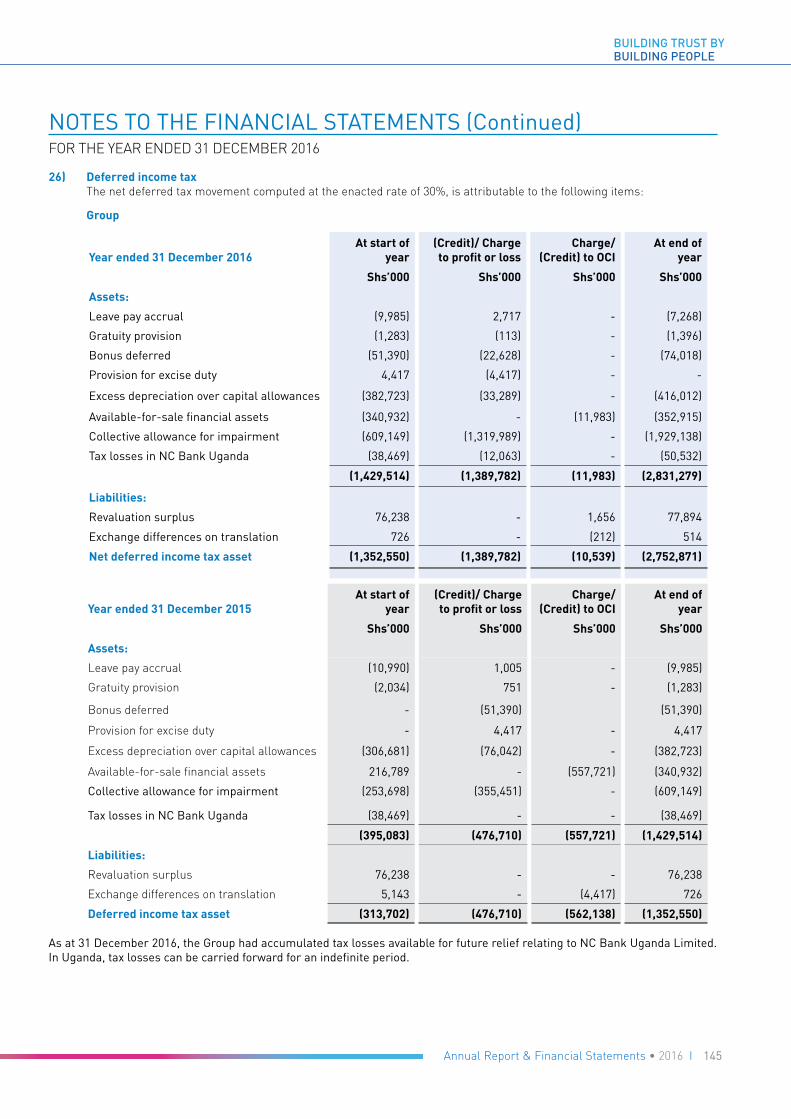
145Annual Report & Financial Statements • 2016 I
BUILDING TRUST BYBUILDING PEOPLE
NOTES TO THE FINANCIAL STATEMENTS (Continued)FOR THE YEAR ENDED 31 DECEMBER 2016
26) Deferred income tax The net deferred tax movement computed at the enacted rate of 30%, is attributable to the following items:
Group
Year ended 31 December 2016At start of
year(Credit)/ Charge to profit or loss
Charge/ (Credit) to OCI
At end of year
Shs’000 Shs’000 Shs’000 Shs’000
Assets:
Leave pay accrual (9,985) 2,717 - (7,268)
Gratuity provision (1,283) (113) - (1,396)
Bonus deferred (51,390) (22,628) - (74,018)
Provision for excise duty 4,417 (4,417) - -
Excess depreciation over capital allowances (382,723) (33,289) - (416,012)
Available-for-sale financial assets (340,932) - (11,983) (352,915)
Collective allowance for impairment (609,149) (1,319,989) - (1,929,138)
Tax losses in NC Bank Uganda (38,469) (12,063) - (50,532)
(1,429,514) (1,389,782) (11,983) (2,831,279)
Liabilities:
Revaluation surplus 76,238 - 1,656 77,894
Exchange differences on translation 726 - (212) 514
Net deferred income tax asset (1,352,550) (1,389,782) (10,539) (2,752,871)
Year ended 31 December 2015At start of
year(Credit)/ Charge to profit or loss
Charge/ (Credit) to OCI
At end of year
Shs’000 Shs’000 Shs’000 Shs’000
Assets:
Leave pay accrual (10,990) 1,005 - (9,985)
Gratuity provision (2,034) 751 - (1,283)
Bonus deferred - (51,390) (51,390)
Provision for excise duty - 4,417 - 4,417
Excess depreciation over capital allowances (306,681) (76,042) - (382,723)
Available-for-sale financial assets 216,789 - (557,721) (340,932)
Collective allowance for impairment (253,698) (355,451) - (609,149)
Tax losses in NC Bank Uganda (38,469) - - (38,469)
(395,083) (476,710) (557,721) (1,429,514)
Liabilities:
Revaluation surplus 76,238 - - 76,238
Exchange differences on translation 5,143 - (4,417) 726
Deferred income tax asset (313,702) (476,710) (562,138) (1,352,550) As at 31 December 2016, the Group had accumulated tax losses available for future relief relating to NC Bank Uganda Limited. In Uganda, tax losses can be carried forward for an indefinite period.

146 I Annual Report & Financial Statements • 2016
BUILDING TRUST BYBUILDING PEOPLE
NOTES TO THE FINANCIAL STATEMENTS (Continued)FOR THE YEAR ENDED 31 DECEMBER 2016
26) Deferred income tax (Continued)
Bank
At start of year
Charge/ (Credit) to profit or loss
(Credit)/ charge to OCI
At end of year
Year ended 31 December 2016 Shs’000 Shs’000 Shs’000 Shs’000
Assets:
Leave pay accrual (8,766) 2,959 - (5,807)
Gratuity provision (758) (113) - (871)
Bonus deferred (51,390) (22,628) - (74,018)
Excess depreciation over capital allowances (301,487) (39,909) - (341,396)
Available for sale financial assets (374,650) - - (374,650)
Collective allowance for impairment (506,773) (1,318,387) - (1,825,160)
(1,243,824) (1,378,078) - (2,621,902)
Liabilities:
Revaluation surplus 76,238 - - -
Net deferred income tax asset (1,167,586) (1,378,078) - (2,545,664)
Year ended 31 December 2015At start of
yearCharge/ (Credit) to profit or loss
Charge/ (Credit) to OCI
At end of year
Shs’000 Shs’000 Shs’000 Shs’000
Assets:
Leave pay accrual (9,938) 1,172 - (8,766)
Gratuity provision (1,509) 751 - (758)
Bonus deferred - (51,390) - (51,390)
Excess depreciation over capital allowances (225,480) (76,007) - (301,487)
Available for sale financial assets 220,889 - (595,539) (374,650)
Collective allowance for impairment (169,311) (337,462) - (506,773)
(185,349) (462,936) (595,539) (1,243,824)
Liabilities:
Revaluation surplus 76,238 - - 76,238
Net deferred income tax asset (109,111) (462,936) (595,539) (1,167,586)
As at 31 December 2016, the Group had accumulated tax losses available for future relief relating to NC Bank Uganda Limited. Under the Kenyan legislation, with effect from 2016, tax losses can be carried forward to a maximum of ten years. In Uganda, however, the tax losses can be carried forward for an indefinite period.

147Annual Report & Financial Statements • 2016 I
BUILDING TRUST BYBUILDING PEOPLE
NOTES TO THE FINANCIAL STATEMENTS (Continued)FOR THE YEAR ENDED 31 DECEMBER 2016
27) Property and equipment
GroupBuildings
Furniture, fittings &
equipment
Motor Vehicles
Work in progress Total
Shs `000 Shs `000 Shs `000 Shs `000 Shs `000
COST OR VALUATION
At 1 January 2015 370,000 2,006,488 82,783 66,590 2,525,861
Additions - 172,431 601 75,402 248,434
Transfers - WIP - 69,733 - (69,733) -
Disposals - (36,166) (12,151) - (48,317)
Prior year adjustment - 35,069 - 35,559 70,628
Translation adjustments - (736) (1,589) (6,799) (9,124)
At 31 December 2015 370,000 2,246,819 69,644 101,019 2,787,482
At 1 January 2016 370,000 2,246,819 69,644 101,019 2,787,482
Additions - 113,007 21,369 123,119 257,495
Transfers - WIP - 122,593 - (122,593) -
Disposals - (5,542) (11,949) - (17,491)
At 31 December 2016 370,000 2,476,877 79,064 101,545 3,027,486
Comprising:
Cost 144,617 2,476,877 79,064 101,545 2,802,103
Valuation - 2013 225,383 - - - 225,383
370,000 2,476,877 79,064 101,545 3,027,486
DEPRECIATION
At 1 January 2015 13,214 1,389,453 44,084 - 1,446,751
Charge for the year 13,215 251,133 12,504 - 276,852
Eliminated on disposals - (20,885) (3,645) - (24,530)
Prior year adjustment - 8,558 - - 8,558
Translation adjustments - 12,764 3,327 - 16,091
At 31 December 2015 26,429 1,641,023 56,270 - 1,723,722
At 1 January 2016 26,429 1,641,023 56,270 - 1,723,722
Charge for the year 13,214 253,430 11,136 - 277,780
Eliminated on disposals - (5,487) (11,355) - (16,842)
Translation adjustments - 4,539 (5,210) - (671)
At 31 December 2016 39,643 1,893,505 50,841 - 1,983,989
NET BOOK VALUE
At 31 December 2016 330,357 583,372 28,223 101,545 1,043,497
At 31 December 2015 343,571 605,796 13,374 101,019 1,063,760
Buildings were revalued at Shs 370 million as at 31 December 2013 by registered professional valuers, Knight Frank Valuers Limited, on an open market value basis by reference to market evidence of recent transactions for similar properties. Buildings are revalued every 3-5 years. At 31 December 2016, the net book value of buildings based on original cost was Shs 104,974,000 (2015: Shs 113,940,000). There were no capitalised borrowing costs related to the acquisition of property and equipment during the year (2015: Shs nil).
Included in motor vehicles and furniture, fittings and equipment are assets with a cost of Shs 1,535,642,127 (2015: Shs 1,348,520,756) which were fully depreciated. The notional depreciation charge on these assets would have been Shs 343,288,163 (2015: Shs 269,704,151). Computer equipment is included under furniture, fittings and equipment.

148 I Annual Report & Financial Statements • 2016
BUILDING TRUST BYBUILDING PEOPLE
NOTES TO THE FINANCIAL STATEMENTS (Continued)FOR THE YEAR ENDED 31 DECEMBER 2016
27) Property and equipment (Continued)
Bank Buildings
Furniture, fittings and equipment
Motor vehicles
Work In progress Total
Shs `000 Shs `000 Shs `000 Shs `000 Shs `000
COST OR VALUATION
At 1 January 2015 370,000 1,680,733 48,546 10,943 2,110,222
Additions - 105,051 - 68,612 173,663
Transfers - WIP - 69,733 - (69,733) -
Disposals - - (12,151) - (12,151)
At 31 December 2015 370,000 1,855,517 36,395 9,822 2,271,734
At 1 January 2016 370,000 1,855,517 36,395 9,822 2,271,734
Additions - 102,162 18,151 123,119 243,432
Transfers - 122,593 - (122,593) -
Disposals - (5,591) (7,671) - (13,262)
At 31 December 2016 370,000 2,074,681 46,875 10,348 2,501,904
Comprising:
Cost 144,617 2,074,681 46,875 10,348 2,276,521
Valuation - 2013 225,383 - - - 225,383
370,000 2,074,681 46,875 10,348 2,501,904
DEPRECIATION
At 1 January 2015 13,214 1,232,052 21,181 - 1,266,447
Charge for the year 13,215 179,240 6,877 - 199,332
Eliminated on disposals - - (3,645) - (3,645)
At 31 December 2015 26,429 1,411,292 24,413 - 1,462,134
At 1 January 2016 26,429 1,411,292 24,413 - 1,462,134
Charge for the year 13,214 172,075 6,259 - 191,548
Eliminated on disposals - (5,401) (7,671) - (13,072)
At 31 December 2016 39,643 1,577,966 23,001 - 1,640,610
NET BOOK VALUE
At 31 December 2016 330,357 496,715 23,874 10,348 861,294
At 31 December 2015 343,571 444,225 11,982 9,822 809,600
Buildings were revalued at Shs 370 million as at 31 December 2013 by registered, professional valuers, Knight Frank Valuers Limited, on an open market value basis by reference to market evidence of recent transactions for similar properties. At 31 December 2016, the net book value of buildings based on original cost was Shs 104,974,000 (2015: Shs 113,940,000).
Included in motor vehicles and furniture, fittings and equipment are assets with a cost of Shs 1,218,562,135 (2015: Shs 1,056,421,756) which were fully depreciated. The notional depreciation charge on these assets would have been Shs 276,845,293 (2015: Shs 241,613,780). Computers are included under furniture, fittings and equipment.

149Annual Report & Financial Statements • 2016 I
BUILDING TRUST BYBUILDING PEOPLE
NOTES TO THE FINANCIAL STATEMENTS (Continued)FOR THE YEAR ENDED 31 DECEMBER 2016
28) Intangible assets
Bank Group
2016 2015 2016 2015Shs’000 Shs’000 Note Shs’000 Shs’000
605,547 511,896 Computer software 28(a) 662,015 582,087 - - Goodwill 28(b) 409,426 409,426
605,547 511,896 1,071,441 991,513
Details of the intangible assets are as follows:
a) Computer software
Bank Group
CapitalisedWork-in
Progress Total CapitalisedWork-in
Progress Total Shs `000 Shs `000 Shs `000 Shs `000 Shs `000 Shs`000
COST 1,132,571 69,845 1,202,416 At 1 January 2015 1,310,627 69,845 1,380,472
- - - Translation adjustment (4,865) - (4,865)19,456 126,731 146,187 Addition 32,855 127,757 160,61247,192 (47,192) - Transfers 52,205 (52,205) -
1,199,219 149,384 1,348,603 At 31 December 2015 1,390,822 145,397 1,536,219
1,199,219 149,384 1,348,603 At 1 January 2016 1,390,822 145,397 1,536,219- - - Translation adjustment - - -
64,288 221,032 285,320 Addition 64,561 244,326 308,887
146,693 (146,693) - Transfers 155,546 (155,546) -
1,410,200 223,723 1,633,923 At 31 December 2016 1,610,929 234,177 1,845,106AMORTISATION
653,640 - 653,640 At 1 January 2015 744,339 - 744,339- - - Translation adjustments (5,684) - (5,684)
183,067 - 183,067 Charge for the year 215,477 - 215,477
836,707 - 836,707 At 31 December 2015 954,132 - 954,132
836,707 - 836,707 At 1 January 2016 954,132 - 954,132- - - Translation adjustments 7,022 - 7,022
191,670 - 191,670 Charge for the year 221,937 - 221,9371,028,377 - 1,028,377 At 31 December 2015 1,183,091 - 1,183,091
Net Book Value - - -381,823 223,723 605,546 At 31 December 2016 427,838 234,177 662,015362,512 149,384 511,896 At 31 December 2015 436,690 145,397 582,087
Assets of the Group with a gross value of Shs 302,176,319 (2015: Shs 285,293,859) are fully amortised but still in use. The notional amortisation charge on the assets would have been Shs 64,709,306 (2015: Shs 57,058,772).The weighted average remaining useful life of intangible assets 2.1 years (2015: 2.3 years).

150 I Annual Report & Financial Statements • 2016
BUILDING TRUST BYBUILDING PEOPLE
NOTES TO THE FINANCIAL STATEMENTS (Continued)FOR THE YEAR ENDED 31 DECEMBER 2016
28) Intangible assets (Continued)
b) Goodwill
The goodwill consists of equity interest held by the Group in;
2016 2015Ownership
%Amount Shs’000
Ownership%
Amount Shs’000
NIC Bank Tanzania 69.84 251,996 69.84 251,996NIC Securities 100 123,430 100 123,430NIC Properties 100 34,000 100 34,000
409,426 409,426
Goodwill arising on consolidation represents the growth potential of NIC Bank Tanzania, NIC Securities and NIC Properties.
Impairment tests for goodwill
Management reviews the business performance of the above subsidiaries. The subsidiaries are deemed Cash Generating Units (CGU) by the Group. The recoverable amount of all CGUs has been determined based on value-in-use calculations which are based on key assumptions about budgeted performance. The budget assumptions reflect current trends, anticipated growth driven by the Group’s strategy and management experience.
Based on the results of the impairment tests performed, management believes that there is no impairment of the carrying value of the goodwill in any CGU. In addition, no impairment of the Bank’s investments in subsidiary undertakings as referred to in note 25 was considered necessary.
29) Operating lease prepayments – Leasehold land
Bank Group2016 2015 2016 2015
Shs’000 Shs’000 Shs’000 Shs’000Cost
10,000 10,000 At start of year 526,000 526,000
- - Additions - - 10,000 10,000 At end of year 526,000 526,000
Amortisation 3,000 2,875 At start of year 3,000 2,875
125 125 Charge for the year 125 125 3,125 3,000 At end of year 3,125 3,000 6,875 7,000 Net book value 522,875 523,000

151Annual Report & Financial Statements • 2016 I
BUILDING TRUST BYBUILDING PEOPLE
NOTES TO THE FINANCIAL STATEMENTS (Continued)FOR THE YEAR ENDED 31 DECEMBER 2016
30) Customer deposits
Bank Group
2016 2015 2016 2015
Shs’000 Shs’000 Shs’000 Shs’000 42,755,284 38,905,864 Current 45,161,249 41,278,018
3,901,051 1,776,475 Savings 4,434,366 2,472,997 56,713,903 64,292,907 Term 61,432,466 68,375,136
789,962 218,754 Other 796,604 238,486
104,160,200 105,194,000 111,824,685 112,364,637 4.84% 5.60% Weighted average effective interest 4.78% 5.19%
Customer deposits are financial instruments classified as liabilities at amortised cost. Included in term deposits are deposits which are at fixed interest rates whereas all other deposits are at variable rates. Other deposits are those held as collateral for irrevocable commitments mainly under import letters of credit and performance bonds. Their fair value approximates the carrying amount.
31) Due to banking institutions
Bank Group2016 2015 2016 2015
Shs’000 Shs’000 Shs’000 Shs’000Maturing within 90 days:
2,627,565 7,734,613 Due to banking institutions 2,775,926 9,064,552 4.17% 5.10% Weighted average effective interest rate as at year end 4.17% 5.10%
Deposits due to banking institutions are financial instruments classified as liabilities at amortised cost.
Balances due to banking institutions are current.
32) Borrowings a) The Bank has unsecured revolving medium term lines of credit for onward lending with;
Bank Group2016 2015 2016 2015
Shs’000 Shs’000 Shs’000 Shs’000 5,657,726 5,630,659 The International Finance Corporation (IFC) 5,657,726 5,630,659 5,536,303 - European Investment Bank (EIB) 5,536,303 - 1,035,015 1,372,106 The Dutch Development Finance Institution, FMO 1,035,015 1,372,106
1,004,652 1,388,789 Societe de Promotion et de Participation pour la Cooperation Economique S.A (PROPARCO)
1,993,216 2,613,972
5,743,224 5,739,453 Medium term note 5,743,224 5,739,453 18,976,920 14,131,007 19,965,484 15,356,190
Maturity Profile:1,876,955 962,497 Payable within one year 2,865,519 843,429 8,167,613 959,908 Payable after one year and within three years 8,167,613 2,127,192
8,932,352 12,208,602 Payable after three years 8,932,352 11,387,859 18,976,920 14,131,007 19,965,484 14,358,480
7.58% 7.74% Weighted average effective interest 7.40% 7.42% Borrowings are financial instruments classified as a liability at amortised cost.

152 I Annual Report & Financial Statements • 2016
BUILDING TRUST BYBUILDING PEOPLE
NOTES TO THE FINANCIAL STATEMENTS (Continued)FOR THE YEAR ENDED 31 DECEMBER 2016
32) Borrowings (continued)
The terms of the borrowings are as follows:
NIC Bank Limited
i) Subordinated debts
NIC Bank Limited has two sets of long-term subordinated debts facilities obtained to enhance the Bank’s capital base:
• US$ 20 million unsecured facility raised from IFC in December 2014, with a tenure of 7 years. Outstanding principal balance at 31 December 2016 was US$ 20 million (2015: US$ 20 billion). This facility bears interest at rates referenced to the six months Libor; and
• Shs 5.5 billion raised from the Medium Term Note issued in September 2014 at an interest rate of 12.5%, with a tenure of 5 years. Outstanding principal balance at 31 December 2016 was Shs 5.5 billion (2015: Shs 5.5 billion).
ii) Other borrowings
NIC Bank Limited has two sets of long-term senior loans as below:
• US$ 35 million unsecured facility raised from IFC in December 2014, with a tenure of 5 years. Outstanding principal balance at 31 December 2016 was US$ 35m (2015: US$ 35 million);
• US$ 35 million unsecured facility raised from FMO in April 2014, with a tenure of 5 years. Outstanding principal balance at 31 December 2016 was US$ 10m (2015: US$ 13 million);
• US$ 21 million unsecured facility raised from PROPARCO April 2012, with a tenure of 7 years. Outstanding principal balance as at 31 December 2016 was US$ 10m (2015: US$ 14 million); and
• US $ 54 million unsecured facility raised from EIB in December 2016 with tenure of 7 years. Outstanding principal balance as at 31 December 2016 was US$ 54m.
These facilities bear interest at rates referenced to the six months Libor.
NIC Bank Tanzania Limited
In April 2015, NIC Bank Tanzania Limited received a US$ 7 million from PROPARCO. This debt facility was to enable the Bank extend long and medium term funding, mainly to Small Medium Enterprise (SME) portfolio, as well as assist the Bank with its expansion plans. The facility which has a tenure of 6 years matures in April 2021, and bears interest at rates referenced to the six months Libor.
NC Bank Uganda Limited
NC Bank Uganda Limited has a US$ 20 million revolving line of credit from NIC Bank Limited, with a tenure of 4 years and bearing interest at 4.5%. The purpose of this credit line is to enable the bank fund the growth of its foreign currency denominated loans. The outstanding principal balance at 31 December 2016 is US$ 7.5 million (2015: US$ 20.0 million). This facility matured in 2019.
In addition, the Bank has a loan of US$ 6 million from PROPARCO. The facility which has a tenure of 6 years tenure matures in 2019, and bears interest at rates referenced to the six months Libor. Outstanding principal balance at 31 December 2016 was US$ 3.8 million (2015: US$ 4.9 million).
b) Compliance with debt covenants
During the year, the Group met all its loan repayment obligations. The Group was in compliance with all financial covenants during the year except for the Open Credit Exposure Ratio covenant with the IFC, FMO and PROPARCO. This covenant measures the level of net non-performing loans and restructured assets, expressed as a percentage of core capital.
NIC Bank Limited obtained a waiver from IFC on the Open Credit Exposure Ratio covenant. Through the waiver letter dated 15 November 2016, IFC amended the Open Credit Exposure Ratio covenant for the period 30 June 2016 to 30 June 2017. The Bank was in compliance with the amended covenant at year-end.
NIC Bank Limited also obtained a waiver from FMO on the Open Credit Exposure Ratio covenant. The waiver was obtained on 19 October 2016 for the period up to 31 December 2016.
NIC Bank Tanzania and NC Bank Uganda were both in breach of PROPARCO’s Open Credit Exposure Ratio covenants at end of the year. The Group has commenced negotiations to obtain waivers for these breaches.

153Annual Report & Financial Statements • 2016 I
BUILDING TRUST BYBUILDING PEOPLE
NOTES TO THE FINANCIAL STATEMENTS (Continued)FOR THE YEAR ENDED 31 DECEMBER 2016
32) Borrowings (continued)
b) Compliance with debt covenants (continued)
As no waivers covering the period ending 31 December 2017 had been obtained prior to the balance sheet date, the following borrowings portfolio has been reclassified to current:
Company Lender 2016
Shs’000
NIC Bank Limited The Dutch Development Finance Institution, FMO 1,035,015
NIC Bank Tanzania Societe de Promotion et de Participation pour la Cooperation Economique S.A (PROPARCO)
593,097
NC Bank Uganda Societe de Promotion et de Participation pour la Cooperation Economique S.A (PROPARCO)
395,467
Total 2,023,579
33) Due to group companies
Bank
2016 2015
Shs `000 Shs `000
Amount payable to NIC Bank Kenya PLC 1,000,000 -
Deposits held - NIC Securities 399,559 336,191
- NIC Capital 182,123 220,587
- NIC Insurance Agents 170,924 136,167
- Mercantile Finance Company 43,892 28,641
Other payables - NC Bank Uganda 49,621 336,557
- NIC Bank Tanzania 1,186 874
1,847,305 1,059,017
Balances due to group companies are current.
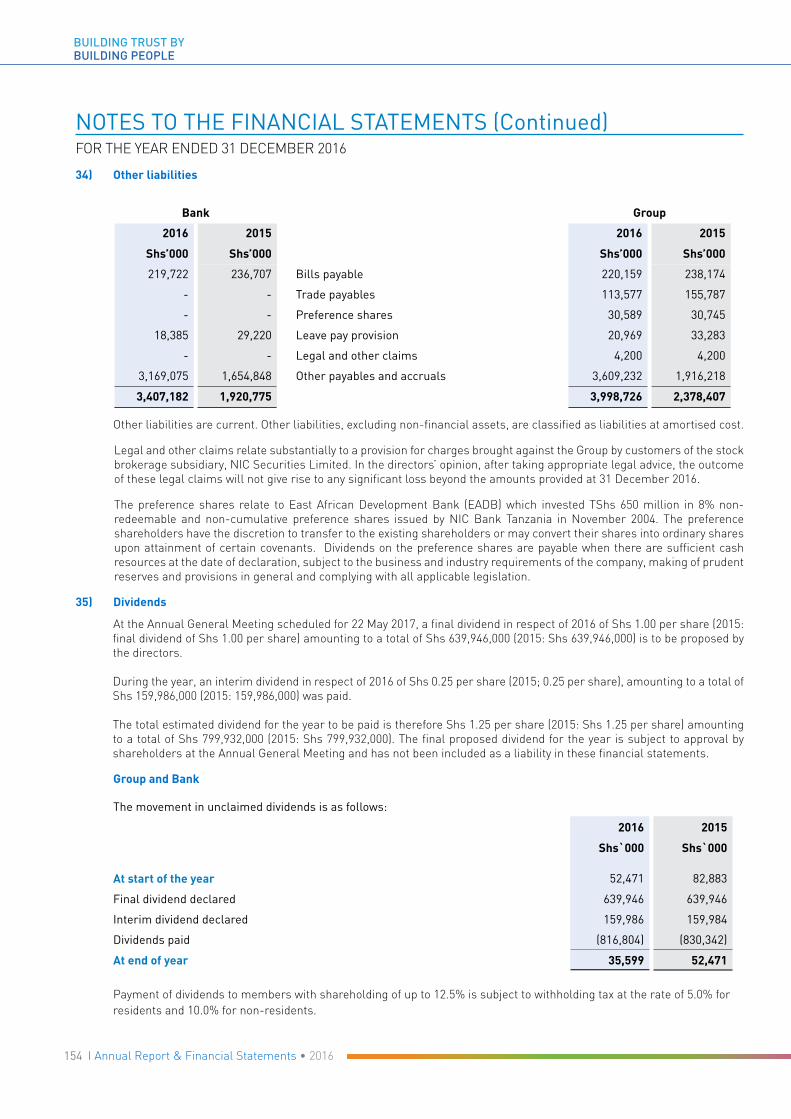
154 I Annual Report & Financial Statements • 2016
BUILDING TRUST BYBUILDING PEOPLE
NOTES TO THE FINANCIAL STATEMENTS (Continued)FOR THE YEAR ENDED 31 DECEMBER 2016
34) Other liabilities
Bank Group
2016 2015 2016 2015
Shs’000 Shs’000 Shs’000 Shs’000
219,722 236,707 Bills payable 220,159 238,174
- - Trade payables 113,577 155,787
- - Preference shares 30,589 30,745
18,385 29,220 Leave pay provision 20,969 33,283
- - Legal and other claims 4,200 4,200
3,169,075 1,654,848 Other payables and accruals 3,609,232 1,916,218
3,407,182 1,920,775 3,998,726 2,378,407
Other liabilities are current. Other liabilities, excluding non-financial assets, are classified as liabilities at amortised cost.
Legal and other claims relate substantially to a provision for charges brought against the Group by customers of the stock brokerage subsidiary, NIC Securities Limited. In the directors’ opinion, after taking appropriate legal advice, the outcome of these legal claims will not give rise to any significant loss beyond the amounts provided at 31 December 2016.
The preference shares relate to East African Development Bank (EADB) which invested TShs 650 million in 8% non-redeemable and non-cumulative preference shares issued by NIC Bank Tanzania in November 2004. The preference shareholders have the discretion to transfer to the existing shareholders or may convert their shares into ordinary shares upon attainment of certain covenants. Dividends on the preference shares are payable when there are sufficient cash resources at the date of declaration, subject to the business and industry requirements of the company, making of prudent reserves and provisions in general and complying with all applicable legislation.
35) Dividends
At the Annual General Meeting scheduled for 22 May 2017, a final dividend in respect of 2016 of Shs 1.00 per share (2015: final dividend of Shs 1.00 per share) amounting to a total of Shs 639,946,000 (2015: Shs 639,946,000) is to be proposed by the directors.
During the year, an interim dividend in respect of 2016 of Shs 0.25 per share (2015; 0.25 per share), amounting to a total of Shs 159,986,000 (2015: 159,986,000) was paid.
The total estimated dividend for the year to be paid is therefore Shs 1.25 per share (2015: Shs 1.25 per share) amounting to a total of Shs 799,932,000 (2015: Shs 799,932,000). The final proposed dividend for the year is subject to approval by shareholders at the Annual General Meeting and has not been included as a liability in these financial statements.
Group and Bank
The movement in unclaimed dividends is as follows:
2016 2015
Shs`000 Shs`000
At start of the year 52,471 82,883
Final dividend declared 639,946 639,946
Interim dividend declared 159,986 159,984
Dividends paid (816,804) (830,342)
At end of year 35,599 52,471
Payment of dividends to members with shareholding of up to 12.5% is subject to withholding tax at the rate of 5.0% for residents and 10.0% for non-residents.

155Annual Report & Financial Statements • 2016 I
BUILDING TRUST BYBUILDING PEOPLE
NOTES TO THE FINANCIAL STATEMENTS (Continued)FOR THE YEAR ENDED 31 DECEMBER 2016
36) Share capital and reserves
a) Share capital and share premium
Group and BankNumber of
sharesShare
capital Share
premium
1 January 2015, 1 January 2016 and 31 December 2016 639,945,603 3,199,728 2,700,017
As at 31 December 2016, the authorised share capital of the Bank comprised of 800,000,000 (2015: 800,000,000) ordinary shares with a par value of Shs 5. The issued shares as at 31 December 2016 are 639,945,603 (2015: 639,945,603) and are fully paid. Issued and fully paid ordinary shares, which have a par value of Shs 5, carry one vote per share and carry a right to dividend.
The holders of ordinary shares are entitled to receive dividends as declared from time to time and are entitled to one vote per share at General Meetings of the Bank.
Premiums from the issue of shares are reported as share premiums.
b) Revaluation surplus on property
Revaluation reserve is made up of the periodic adjustment arising from the valuation of buildings, net of the related deferred taxation. The reserve is not available for distribution to the shareholders.
Group and Bank
The movement in revaluation surplus on property is as follows:
2016 2015Shs`000 Shs`000
At start of the year 179,983 184,764Revaluation surplus on building net of deferred taxTransfer of excess depreciation (6,830) (6,830)Deferred tax on excess depreciation 2,049 2,049At end of year 175,202 179,983
c) Investments revaluation reserve
This represents the unrealized increase or decrease in the fair value of available-for-sale investments after deduction of deferred income taxes, excluding impairment losses. The reserve is not available for distribution to the shareholders.
d) Foreign currency translation reserve
The reserves represent exchange differences arising from translation of the net assets of the Group’s foreign operations which are NIC Bank Tanzania Limited and NC Bank Uganda Limited from their functional currency (Tanzania Shillings and Uganda Shillings respectively), to the Group’s presentation currency (Kenya Shillings). These differences are recognised directly through other comprehensive income and accumulated in the foreign currency translation reserve in equity. The reserve is not available for distribution to the shareholders.
e) Regulatory reserve(s)
Where impairment losses required by prudential guidelines issued by the banking regulators exceed those computed under the International Financial Reporting Standards (IFRS), the excess is recognised as a regulatory reserve and accounted for as an appropriation from retained earnings. The reserve is not available for distribution to the
shareholders.

156 I Annual Report & Financial Statements • 2016
BUILDING TRUST BYBUILDING PEOPLE
NOTES TO THE FINANCIAL STATEMENTS (Continued)FOR THE YEAR ENDED 31 DECEMBER 2016
36) Share capital and reserves (Continued)
f) Other reserves
The reserve relates to transactions with non-controlling interests that do not result in loss of control. It is the difference between fair value of any consideration paid and the relevant share acquired of the carrying value of net assets of the subsidiary. See the respective disclosures under notes 37 (a) and (b).
g) Retained earnings
This represents undistributed profits from current and previous years.
37) Non-controlling interests
This represents undistributed profits from current and previous years
a) NIC Bank Tanzania
On 1 May 2009, the Group acquired a 51% stake in one of Tanzania’s mid-sized commercial bank, Savings & Finance Commercial Bank Ltd, later renamed NIC Bank Tanzania Limited. NIC Bank Tanzania Ltd was founded as a non-bank financial institution in 1994, converted to a fully-fledged commercial bank in 2005 and has branches in Dar es Salaam (3), Mwanza (1) and Arusha (1). Through direct buy-outs and additional rights issues, NIC Bank Limited increased its shareholding from 51% to 68.97% in 2013. This was further increased in 2014 to 69.84% through the taking up of rights not exercised by minority shareholders.
2016 2015
Shs’000 Shs’000
At start of year 485,344 477,574
Share of profit for the year 20,511 7,770
At end of year 505,855 485,344
b) NIC Securities
On 31 December 2007, the Bank acquired 57.7% of NIC Securities Limited (formerly Solid Investment Securities Limited) through its wholly owned subsidiary NIC Capital Limited. Through combinations of direct buy-outs and additional rights issues, the Group increased its shareholding in the subsidiary to 91.34% in 2009, and further to 100%
in 2014.
38) Off balance sheet financial instruments, contingent liabilities and commitments
a) Contingent liabilities
Bank Group
2016 2015 2016 2015
Shs’000 Shs’000 Shs’000 Shs’000
4,851,664 2,405,342 Letters of credit 5,034,944 2,447,972
7,067,362 11,763,879 Letters of guarantee & performance bonds 11,898,326 11,988,684
11,919,026 14,169,221 16,933,270 14,436,656

157Annual Report & Financial Statements • 2016 I
BUILDING TRUST BYBUILDING PEOPLE
NOTES TO THE FINANCIAL STATEMENTS (Continued)FOR THE YEAR ENDED 31 DECEMBER 2016
38) Off balance sheet financial instruments, contingent liabilities and commitments (Continued)
a) Contingent liabilities (Continued)
In the ordinary course of business, the Group conducts business involving acceptances, letters of credit, guarantees, performance bonds and indemnities. The majority of these facilities are offset by corresponding obligations of third parties. In addition, there are other off balance sheet financial instruments including forward contracts for purchase and sale of foreign currencies, the nominal amounts of which are not reflected in the statement of financial position.
Letters of credit are commitments by the Group to make payments to third parties, on production of documents, on behalf of customers and are reimbursed by customers. Letters of guarantee and performance bonds are issued by the Group, on behalf of customers, to guarantee performance by customers to third parties. The Group will only be required to meet these obligations in the event of default by the customers.
b) Operating lease prepayments
i) The group as a lessor
At the end of the reporting period, the Group had contracted with tenants for the following future lease receivables:
Group and Bank
2016 2015
Shs’000 Shs’000
Within one year 11,602 10,445
In the second to fifth year inclusive 59,886 52,223
71,488 62,668
Leases are negotiated for an average term of 6 years and rentals are reviewed every two years. The leases are cancellable with a penalty when the tenants do not give three months’ notice to vacate the premises.
ii) The group as a lessee
At the end of the reporting period, the Group had non-cancellable operating leases which fall due as follows:
Bank Group
2016 2015 2016 2015
Shs’000 Shs’000 Shs’000 Shs’000
Premises
193,183 181,576 Within one year 267,100 257,714
533,352 436,551 In the second to fifth year inclusive 740,146 1,194,107
726,535 618,127 1,007,246 1,451,821
Office equipment
1,248 3,072 Within one year 1,248 3,072
1,248 256 In the second to fifth year inclusive 1,248 256
2,496 3,328 2,496 3,328
Operating lease payments represent rentals payable by the Group for its business premises and office equipment. Premises leases are negotiated for an average term of 6 years, while office equipment is for an average term of 3 years. For these contingent liabilities, no reimbursement is expected.

158 I Annual Report & Financial Statements • 2016
BUILDING TRUST BYBUILDING PEOPLE
NOTES TO THE FINANCIAL STATEMENTS (Continued)FOR THE YEAR ENDED 31 DECEMBER 2016
38) Off balance sheet financial instruments, contingent liabilities and commitments (Continued)
C) Capital commitments
Bank Group
2016 2015 2016 2015
Shs’000 Shs’000 Shs’000 Shs’000
63,498 49,000 Authorised and contracted for 63,498 49,000
497,544 764,625 Authorised but not contracted for 601,020 868,101
561,042 813,625 664,518 917,101
The capital commitments largely relate to branch expansion activities and software acquisition. The Group’s management is confident that future net revenues and funding will be sufficient to cover this commitment.
d) Legal proceedings
Besides the provision made (see note 34), various claims against the Group are considered without merit, and the Bank is defending them vigorously. It is not possible to estimate the Bank’s possible loss in relation to these matters, nor the effect that they might have upon operating results in any particular financial period. No contingent liability associated with legal actions has been disclosed as professional advice indicates that it is unlikely that any significant loss will arise.
e) Other credit commitments
Commitments to lend are agreements to lend to customers in future subject to certain conditions. Such commitments are normally made for fixed periods. The Group may withdraw from its contractual obligations to extend credit by giving reasonable notice to the customers.
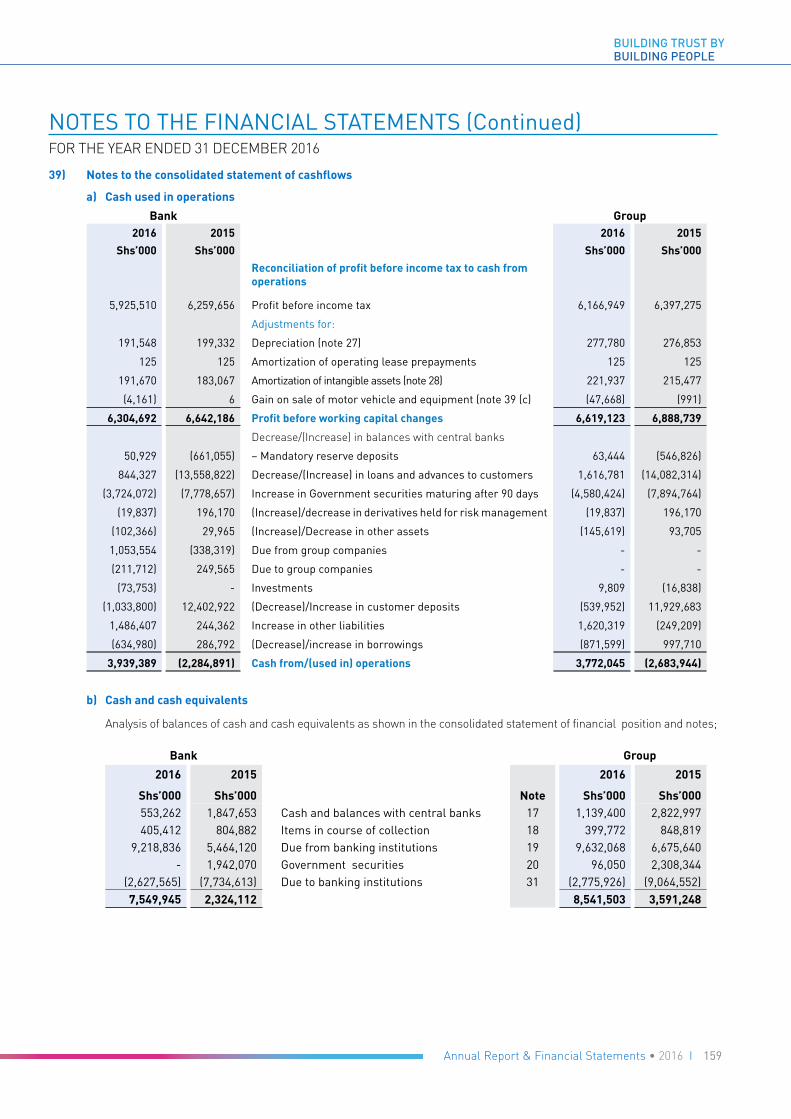
159Annual Report & Financial Statements • 2016 I
BUILDING TRUST BYBUILDING PEOPLE
NOTES TO THE FINANCIAL STATEMENTS (Continued)FOR THE YEAR ENDED 31 DECEMBER 2016
39) Notes to the consolidated statement of cashflows
a) Cash used in operations
Bank Group2016 2015 2016 2015
Shs’000 Shs’000 Shs’000 Shs’000
Reconciliation of profit before income tax to cash from operations
5,925,510 6,259,656 Profit before income tax 6,166,949 6,397,275
Adjustments for:
191,548 199,332 Depreciation (note 27) 277,780 276,853
125 125 Amortization of operating lease prepayments 125 125
191,670 183,067 Amortization of intangible assets (note 28) 221,937 215,477
(4,161) 6 Gain on sale of motor vehicle and equipment (note 39 (c) (47,668) (991)
6,304,692 6,642,186 Profit before working capital changes 6,619,123 6,888,739
Decrease/(Increase) in balances with central banks
50,929 (661,055) – Mandatory reserve deposits 63,444 (546,826)
844,327 (13,558,822) Decrease/(Increase) in loans and advances to customers 1,616,781 (14,082,314)
(3,724,072) (7,778,657) Increase in Government securities maturing after 90 days (4,580,424) (7,894,764)
(19,837) 196,170 (Increase)/decrease in derivatives held for risk management (19,837) 196,170
(102,366) 29,965 (Increase)/Decrease in other assets (145,619) 93,705
1,053,554 (338,319) Due from group companies - -
(211,712) 249,565 Due to group companies - -
(73,753) - Investments 9,809 (16,838)
(1,033,800) 12,402,922 (Decrease)/Increase in customer deposits (539,952) 11,929,683
1,486,407 244,362 Increase in other liabilities 1,620,319 (249,209)
(634,980) 286,792 (Decrease)/increase in borrowings (871,599) 997,710
3,939,389 (2,284,891) Cash from/(used in) operations 3,772,045 (2,683,944)
b) Cash and cash equivalents
Analysis of balances of cash and cash equivalents as shown in the consolidated statement of financial position and notes;
Bank Group
2016 2015 2016 2015
Shs’000 Shs’000 Note Shs’000 Shs’000 553,262 1,847,653 Cash and balances with central banks 17 1,139,400 2,822,997 405,412 804,882 Items in course of collection 18 399,772 848,819
9,218,836 5,464,120 Due from banking institutions 19 9,632,068 6,675,640 - 1,942,070 Government securities 20 96,050 2,308,344
(2,627,565) (7,734,613) Due to banking institutions 31 (2,775,926) (9,064,552) 7,549,945 2,324,112 8,541,503 3,591,248
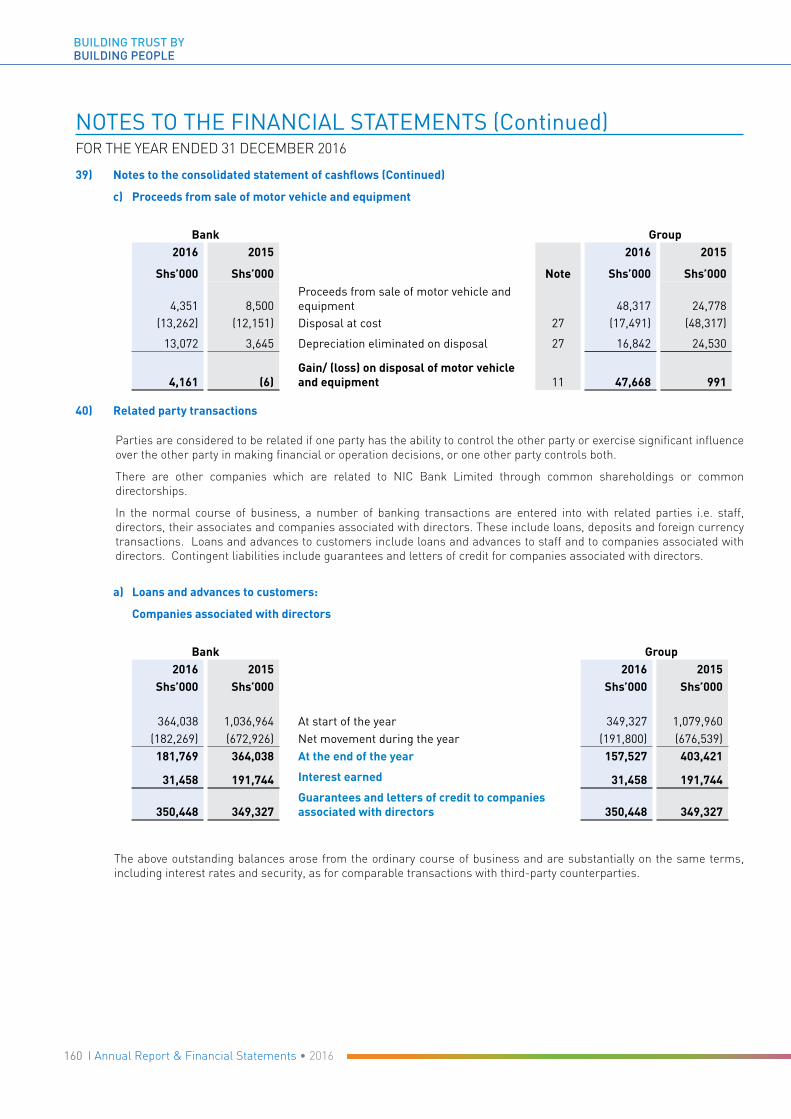
160 I Annual Report & Financial Statements • 2016
BUILDING TRUST BYBUILDING PEOPLE
NOTES TO THE FINANCIAL STATEMENTS (Continued)FOR THE YEAR ENDED 31 DECEMBER 2016
39) Notes to the consolidated statement of cashflows (Continued)
c) Proceeds from sale of motor vehicle and equipment
Bank Group2016 2015 2016 2015
Shs’000 Shs’000 Note Shs’000 Shs’000
4,351 8,500 Proceeds from sale of motor vehicle and equipment 48,317 24,778
(13,262) (12,151) Disposal at cost 27 (17,491) (48,317)
13,072 3,645 Depreciation eliminated on disposal 27 16,842 24,530
4,161 (6)Gain/ (loss) on disposal of motor vehicle and equipment 11 47,668 991
40) Related party transactions
Parties are considered to be related if one party has the ability to control the other party or exercise significant influence over the other party in making financial or operation decisions, or one other party controls both.
There are other companies which are related to NIC Bank Limited through common shareholdings or common directorships.
In the normal course of business, a number of banking transactions are entered into with related parties i.e. staff, directors, their associates and companies associated with directors. These include loans, deposits and foreign currency transactions. Loans and advances to customers include loans and advances to staff and to companies associated with directors. Contingent liabilities include guarantees and letters of credit for companies associated with directors.
a) Loans and advances to customers:
Companies associated with directors
Bank Group2016 2015 2016 2015
Shs’000 Shs’000 Shs’000 Shs’000
364,038 1,036,964 At start of the year 349,327 1,079,960 (182,269) (672,926) Net movement during the year (191,800) (676,539)
181,769 364,038 At the end of the year 157,527 403,421
31,458 191,744 Interest earned 31,458 191,744
350,448 349,327Guarantees and letters of credit to companies associated with directors 350,448 349,327
The above outstanding balances arose from the ordinary course of business and are substantially on the same terms, including interest rates and security, as for comparable transactions with third-party counterparties.

161Annual Report & Financial Statements • 2016 I
BUILDING TRUST BYBUILDING PEOPLE
NOTES TO THE FINANCIAL STATEMENTS (Continued)FOR THE YEAR ENDED 31 DECEMBER 2016
40) Related party transactions (Continued)
a) Loans and advances to customers (Continued)
Directors
Bank Group
2016 2015 2016 2015
Shs’000 Shs’000 Loans and advances to customers: Shs’000 Shs’000
62,911 68,234 At start of year 72,442 92,370
(3,583) (5,323) Net movement during the year (3,583) (19,928)
59,328 62,911 At end of year 68,859 72,442
3,047 3,511 Interest earned 3,199 3,663
These loans and advances are performing and are adequately secured.
b) Customer deposits
Companies associated with directors
Bank Group
2016 2015 2016 2015
Shs’000 Shs’000 Shs’000 Shs’000
5,982,804 4,207,322 At start of the year 5,997,600 4,216,109
370,503 1,775,482 Net movement during the year 542,524 1,781,491
6,353,307 5,982,804 At end of the year 6,540,124 5,997,600
274,156 368,165 Interest paid 274,156 368,165
The above outstanding balances arose from the ordinary course of business and are substantially on the same terms, including interest rates and security, as for comparable transactions with third-party counterparties.
Directors and key management personnel
Bank Group
2016 2015 2016 2015
Shs’000 Shs’000 Shs’000 Shs’000
26,288 5,008 At start of the year 34,749 27,028
273,916 21,280 Net movement during the year 283,845 7,721
300,204 26,288 At end of the year 318,594 34,749
11,683 1,248 Interest paid 11,683 1,248
Other amounts outstanding at the end of the reporting period are disclosed in notes 24 and 33.

162 I Annual Report & Financial Statements • 2016
BUILDING TRUST BYBUILDING PEOPLE
NOTES TO THE FINANCIAL STATEMENTS (Continued)FOR THE YEAR ENDED 31 DECEMBER 2016
40) Related party transactions (Continued)
c) Key management compensation
The remuneration of directors and other members of key management during the year was as follows:
Bank Group
2016 2015 2016 2015
Shs’000 Shs’000 Shs’000 Shs’000
368,408 330,121 Salaries and other benefits 454,237 420,563
Directors’ remuneration
28,619 16,370 Fees for services as directors 60,872 35,008 124,446 151,749 Other emoluments (included in key management
compensation above)
174,638 212,034
153,065 168,119 235,510 247,042
In line with policy, the above compensation is a consolidated salary package encompassing all employment benefits.
41) Assets pledged as security
As at 31 December 2016, there were no assets pledged by the Group to secure liabilities and there were no secured Group liabilities (2015: nil).
42) Fiduciary activities
The Group holds asset security documents on behalf of customers with a value of Shs 82,453,972,593 (2015: Shs 66,889,876,774). These securities are held by the custody services department and comprise deposits with financial institutions, government securities and quoted and unquoted securities, among others.
43) Events after the reporting period
a) Group reorganization
On 11 October 2016, the shareholders approved the creation of a new operating company, a new wholly owned subsidiary company of the Bank named ‘NIC Bank Kenya PLC’. Under the reorganization plan, the banking business and net assets of NIC Bank Limited will be transferred to NIC Bank Kenya PLC. The Central Bank of Kenya (CBK) approved the formation of the Non-Operating Holding Company on 15 February 2017 and subsequently licensed NIC Bank Kenya PLC, License dated 31 March 2017. Final regulatory approval are awaited, at completion NIC Bank Limited will change its name to ‘NIC Group PLC’ and will continue to operate as a Non-operating holding company under section 13(1) of the Banking Act. The Company will adopt a new Memorandum and Articles of Association to reflect the new objects of the Company and align them to the Kenyan Companies Act 2015.
b) Imperial Bank Limited (In Receivership)
In 2015 the Kenya Deposit Insurance Corporation (KDIC) was appointed by the Central Bank of Kenya (CBK) as receivers of Imperial Bank Limited (in Receivership) (IBLIR) for an initial period of twelve (12) months. This appointment was subsequently extended for a further period of six (6) months. KDIC assumed control of the assets, liabilities, business and affairs of the Bank. In May 2016, the CBK and NIC Bank Limited entered into discussions regarding the possibility of NIC Bank acquiring certain assets, deposits and liabilities of IBLIR. In June 2016 NIC Bank was appointed as the “Asset and Liability Consultant” for IBLIR. This entailed the following:
• Asset Analysis and Assessment: Assessing, negotiating, restructuring and collecting certain legitimate assets of IBLIR.
• Deposit Disbursement: Managing KDIC’s future deposit disbursements • System Activation: Testing of the Flexcube system
NIC Bank Limited has to date carried out two disbursement tranches to IBLIR depositors on behalf of KDIC. The first such tranche commenced on 11th July 2016 whilst the second tranche was effected as from 28th December 2016.
NIC Bank Limited appointment came to an end on 13 April 2017, following the end of the 18 month initial Receivership period. During this time, NIC Bank had fulfilled its mandate as advisors to KDIC providing them with a thorough review of the assets and how to maximize value for depositors and other stakeholders.

163Annual Report & Financial Statements • 2016 I
BUILDING TRUST BYBUILDING PEOPLE
NOTICE OF THE ANNUAL GENERAL MEETING
Notice is hereby given that the fifty seventh Annual General Meeting of the shareholders of NIC Bank Limited will be held at the Kenyatta International Convention Centre (KICC), Nairobi on Monday, 22nd May, 2017 at 11.00 am for the following purposes:-1. To read the Notice convening the Meeting.2. To receive, consider and if thought fit, adopt the Financial Statements for the year ended 31st December 2016 and the
Directors’ and Auditors’ Reports thereon.3. To confirm the payment of the interim dividend of Shs 0.25 per share paid on 17th October 2016 and to approve the
payment of a final dividend of Shs 1.00 per share (2015: final dividend of Shs 1.00 per share) on the paid up capital of Shs. 3,199,728,000.
4. To approve the payment of fees to the Directors for the year ended 31st December 2016 and to authorize the Board to fix the remuneration of the Directors.
5. To elect Directors:(a) In accordance with Articles 108, 109 and 110 of the Company’s Articles of Association, the following directors retire
by rotation and being eligible, offer themselves for re-election: i) ASM Ndegwa ii) K Thuo
(b) In accordance with Part I Article 7 of the Company’s Board Charter and Article 2.5 of the CMA Code of Corporate Governance Practices for Issuers of Securities to the Public, 2015, the following directors, having attained the age of 70 years retire and offer themselves for re-election:
i) F M Mbiru ii) F N Mwanzia
(c) In accordance with the provisions of section 769 of the Companies Act, 2015, the following directors, being members of the Board Audit Committee, be elected to continue to serve as members of the said Committee:
i) FN Mwanzia (Chairman) ii) I Ochola-Wilson iii) F M Mbiru iv) K Thuo6. To appoint PricewaterhouseCoopers as the Auditors of the Company until the end of the next Annual General Meeting
by virtue of section 721 (4) of the Companies Act, 2015, subject to Central Bank of Kenya approval in accordance with section 24(1) of the Banking Act (Cap.488) and to authorize the Directors to fix their remuneration.
7. To transact any other business of the Annual General Meeting of which due notice has been received.
BY ORDER OF THE BOARD Livingstone Murage Group Company Secretary Nairobi 25th April 2017
i. A Member entitled to attend and vote at the meeting and who is unable to attend is entitled to appoint a proxy to attend and vote on his, her or its behalf. A proxy need not be a Member of the Company. To be valid, a proxy form must be duly completed by the Member and lodged with the Group Company Secretary at the Company’s registered office situated at NIC Bank Limited, NIC House, Masaba Road, Nairobi, Kenya, before 11 am on Thursday, 18th May, 2017, failing which it will be invalid. In the case of a Member which is a corporate body then the proxy form must be given under its common seal.
ii. A copy of this notice, proxy form and full copy of the Group financial statements including explanatory notes are available from our website (www.nic-bank.com) or a printed copy may be obtained from the Company’s share registrars, Custody & Registrar Services Limited upon request. A printed copy will also be available at the venue on the day of the Annual General Meeting.

164 I Annual Report & Financial Statements • 2016
BUILDING TRUST BYBUILDING PEOPLE
TANGAZO LA MKUTANO MKUU WA MWAKA
Tangazo linatolewa kwamba Mkutano Mkuu wa Mwaka wa wenyehisa wa Benki ya NIC utafanyika katika jumba la Mikutano ya Kimataifa la Kenyatta (KICC), Nairobi siku ya Jumatano tarehe 22 Mei mwaka 2017, saa tano asubuhi ambapo ajenda zifuatazo zitaangaziwa:-
1. Kusoma ilani inayotangaza maandalizi ya Mkutano huo.2. Kupokea, kuzingatia na zikiidhinishwa kuwa sawa, kuzikubali Taarifa za Kifedha za mwaka uliokamilika Desemba
31, 2016 pamoja na Ripoti za Wakurugenzi Wakuu na Wakaguzi wa Mahesabu ya Fedha.3. Kuidhibitisha malipo ya mgao wa muda wa asilimia 5 (Shilingi 0.25 kwa kila hisa) yaliyotolewa mnamo Octoba 17,
2016 na kudhinisha malipo ya mgao wa mwisho wa Shilingi 1.00 (2015 mgao wa kwanza na wa mwisho wa Shilingi 1.0 kwa kila hisa) kwa mtaji uliolipiwa wa Shilingi 3,199,728,000.
4. Kuidhinisha malipo ya ada kwa Wakurugenzi Wakuu kwa mwaka ulioishia Desemba 31, 2016.5. Kuchagua Wakurugenzi Wakuu:
(a) Kulingana na Kifungu cha 108, 109 na 110 cha Sheria ya Ushirikiano wa Kampuni, Wakurugenzi wafuatao watastaafu kwa kufuatana na wanaweza kuchaguliwa ama kujitolea wenyewe kuchaguliwa tena;i.) A.S.M Ndegwaii.) K Thuo
(b) Kwa mujibu wa Sehemu ya I Ibara ya 7 ya Mkataba wa Bodi ya Kampuni hii na Ibara 2.5 ya CMA ya Kanuni za Uongozi Bora wa Shirika za Watoaji Hati za Dhamana kwa Umma, 2015, wakurugenzi wafuatao, baada ya kutimiza umri wa miaka 70 wanastaafu na wanajitokeza kuchaguliwa tena: i) F M Mbiruii) F N Mwanzia
(c) Kwa mujibu wa vigezo vya sehemu 769 ya Sheria zinazosimamia Mashirika, 2015, wakurugenzi wafuatao, wakiwa wanachama wa Kamati ya Bodi ya Ukaguzi, wachaguliwe kuendelea kutekekeza wajibu wao kama wanachama wa kamati hiyo:i) FN Mwanzia (Chairman)ii) I Ochola-Wilsoniii) F M Mbiruiv) K Thuo
6. Kukufahamisheni kwamba kampuni ya PricewaterhouseCoopers itaendelea kushikilia afisi ya Mkaguzi wa Mahesabu kulingana na Sehemu ya 159(2) ya Sheria za Kampuni (Kifungu cha 486) lakini baada ya kuidhinishwa na Benki Kuu ya Kenya (CBK) kwa mujibu wa sehemu ya 24(1) ya Sheria za Benki (Kifungu cha 488), na kuwaamrisha Wakurugenzi Wakuu kujipangia mishahara yao.
7. Kutekeleza shughuli nyingine zozote za Mkutano Mkuu wa Mwaka ambazo zimeelezwa kwenye ilani iliyopokelewa.
KWA AMRI YA BODILivingstone Murage Katibu Mkuu wa KampuniNairobiTarehe 25 April 2017
i. Mwanachama anayestahili kuhudhuria na kupiga kura katika mkutano huo na ambaye hawezi kuhudhuria anakubaliwa kuteua mwakilishi ili ahudhurie na kupiga kura kwa niaba yake. Si lazima mwakilishi huyo awe Mwanachama wa Kampuni. Na ili kufuzu lazima fomu ya uwakilishi ijazwe na Mwanachama anayehusika na kuwasilishwa kwa Katibu wa Kampuni hii kwenye afisi iliyosajiliwa ya Kampuni katika makao yake ya NIC Bank Limited, jumba la NIC House, barabara ya Masaba Road, Nairobi, Kenya kabla ya saa tano asubuhi Jumatatu tarehe 16 Mei mwaka 2016, na iwapo yeyote atakosa kufanya hivyo hataruhusiwa kushiriki. Na iwapo Mwanachama huyo ni shirika, lazima fomu ya uwakilishi iwasilishwe ikiwa na mhuri wake rasmi.”
ii. Nakala ya ilani hii, fomu ya uwakilishi pamoja na nakala kamili ya taarifa za kifedha za Kampuni hii zikijumuisha maelezo zinapatikana katika wavuti wetu wa (www.nic-bank.com) au nakala iliyopigwa chapa inaweza kupatikana katika afisi za hisa za Kampuni hii, Custody & Registrar Services Limited, baada ya kutuma maombi na pia zitapatikana kwenye ukumbi wa Mkutano Mkuu wa Mwaka siku ya mkutano huo.

165Annual Report & Financial Statements • 2016 I
BUILDING TRUST BYBUILDING PEOPLE
PROXY FORM
The Group Company Secretary,
NIC Bank Limited
NIC House
Masaba Road,
P. O. Box 44599,
00100,GPO Nairobi
I/We _____________________________________________________________________________________________
of ________________________________________________________________________________________________
being a member / members of NIC Bank Limited and entitled to ______________________________________________
votes hereby appoint ________________________________________________________________________________
of ________________________________________________________________________________________________
or failing him _______________________________________________________________________________________
of ____________________________________________________________________________________________________
as my / our Proxy to vote for me / us on my / our behalf at the Annual General meeting of the company to be held on
22 May 2017 and at any adjournment thereof.
As witness my / our hand this ________________________day of _____________ 2017
Signature (s) of _________________________________________________________________________________________
Complete the form provided and attach a copy of your National ID and a copy of the National ID of the proxy appointed.
Return the form (plus copies of the National ID’s) to the Company’s Registrar, Custody & Registrars, 6th Floor, Bruce House, Standard Street, P.O. Box 8484-00100, Nairobi or alternatively to the Registered Office of the Company so as to arrive not later than 11 a.m. on Thursday 18th May 2017.
Duly signed proxy forms and ID copies may also be emailed to [email protected] in PDF format
Note: In case of a Corporation, the Proxy must be made under its Common Seal.
166 I Annual Report & Financial Statements • 2016
BUILDING TRUST BYBUILDING PEOPLE
FOMU YA UWAKILISHI Katibu wa Kampuni,
NIC Bank Limited
NIC House
Masaba Road,
P. O. Box 44599,
00100,GPO Nairobi
Mimi / Sisi ________________________________________________________________________________________
wa anuani hii _______________________________________________________________________________________
nikiwa mwanachama / tukiwa wanachama wa NIC Bank Limited na
nikiwa /tukiwa na haki ya kura _________________________________________________________________________
namchagua / tunamchagua __________________________________________________________________________
wa sanduku la posta ________________________________________________________________________________
na akiwa hatapata nafasi nimechagua / tumechagua _______________________________________________________
wa sanduku la posta ____________________________________________________________________________________
akiwa mwakilishi wangu / wetu kunipigia / kutupigia kura kwa niaba yangu / yetu katika Mkutano wa Mwakawa Kampuni utakaofanyika tarehe 17 Mei 2017 au tarehe yoyote iwapo mkutano utahairishwa. Nashuhudia kwa mkono / mikono yangu / yetu siku hii ya
Tarehe ______________________________________mwezi wa _____________ 2017
Sahihi ____________________________________________________________________________________________
Jaza fomu uliyopewa na umbatanishe na nakala ya kitambulisho chako cha kitaifa na nakala ya kitambulisho cha kitaifa cha mwakilishi uliyemteua.
Rudisha fomu (pamoja nakala za vitambulisho vya kitaifa) ukitumia anwani hii; Company’s Registrar, Custody & Registrars, 6th Floor, Bruce House, Standard Street, P.O. Box 8484-00100, Nairobi, au kwa ofisi za kampuni zilizosajilisha ili zifike muda usiozidi saa 11:00 asubuhi, Alhamisi Mei 18, 2017.
Fomu za uwakilishi zilizojawa kulingana na maagizo pamoja na nakala za vitambulisho pia zinaweza kutumwa kupitia barua pepe kwa anwani hii; [email protected]. kwa muundo wa PDF.
Elewa: Mwakala akiwa anawakilisha kampuni yoyote au shirika nilazima atumie muhuri rasmi wa kampuni hiyo (common seal).

2005 2012Renamed NIC Bank Limited and developed into Regional“One Stop” Financial Services Shop
2009NIC Bank aquires a stake in Savings and Finance Commercial Bank - Tanzania
NIC Bank Started operation in Uganda, under the name NC Bank Uganda
