our strategies in motion - tcfbank.com · and efficiencies across the organization. with the...
TRANSCRIPT

Our Strategies in Motion
TCF Financial Corporation
2017 annual report

DIVERSIFICATIONFocus on national and footprint lending increases quality and diversification of portfolio
PROFITABLE GROWTHStrong loan and lease origination capabilities and high net interest margin drive balance sheet growth with an emphasis on profitability
OUR STRATEGIES IN MOTIONIntroduced in 2015, TCF’s four strategic pillars represent the basis for its business model and
strategic decision making processes. The pillars are built on a strong enterprise risk management
and credit culture. Execution against these four pillars is critical to ensure the creation of superior
and sustainable financial performance moving forward.
Diversification philosophy driving stable credit quality
2017 loans and leases up 7.1%
2017 total revenue up 4.5%
OPERATING LEVERAGEFocus on improving organizational efficiencies to drive positive operating leverage
2018 efficiency ratio target of 66% to 68%1
CORE FUNDINGMaintain sufficient funding sources to support loan and lease growth
1 Compared to previous 5-year approximate average of 70%
TABLE OF CONTENTS
Letter to Our Shareholders 1
FORM 10-K
Business 1
Risk Factors 8
Selected Financial Data 21
Management’s Discussion and Analysis 22
Consolidated Financial Statements 63
Notes to Consolidated Financial Statements 68
Other Financial Data 121
CORPORATE INFORMATION
Stockholder Information A-2
Executive Management Team A-4
Board of Directors A-5
Offices A-6
Mission, Vision and Values A-7
Successful launch of new digital banking platform

1
Throughout 2017, TCF continued to build on its “One TCF” culture that encourages collaboration
and efficiencies across the organization. With the execution of several key initiatives in 2017 and
strategies in motion for the future, TCF is building momentum as One TCF.
Dear Shareholders:
Throughout my first two years as CEO, I have spoken
extensively about focusing on our “One TCF” culture to
improve the returns to our shareholders. During these
two years, our team has worked very hard to deliver on
this goal. As a result, TCF continued to generate positive
momentum throughout 2017 that positions us to be
successful in 2018. I believe we will look back at 2017
as an inflection point for our organization that will result
in the superior and sustainable long-term results we are
focused on achieving.
In 2017, we continued to execute on our four strategic
pillars: 1) diversification, 2) profitable growth, 3) operating
leverage and 4) core funding. I remain committed to
these pillars as they are the foundation for all that
we do. The business philosophies we have in place,
coupled with several key actions throughout the year,
resulted in improved core earnings trends. We have also
continued to invest in talent and technology, both of
which are playing a key role in moving the organization
forward. I sense a more positive sentiment around the
organization, both internally and externally, which has
me excited about what lies ahead.
Building momentum in 2017TCF had a transformational year in 2017, with the most
significant action being the discontinuation of our auto
finance loan originations effective December 1, 2017.
While it had been a contributor to loan and lease growth
over the past several years, we determined that the
financial outlook of the auto finance business was less
favorable compared to alternative uses of capital. We
believe we can earn a higher return by investing in other
initiatives such as organic loan and lease growth, dividend
increases, stock repurchases, corporate development
and investments in our business. We recognized the auto
finance business was a key headwind for the stock and
believe the additional capital flexibility will be a benefit for
our shareholders moving forward.
We also received an estimated net tax benefit of $130.7
million from the Tax Cuts and Jobs Act (“Tax Reform”)
enacted in late 2017, resulting from the re-measurement
of our estimated net deferred tax liability, primarily
generated from accelerated tax depreciation on our leasing
portfolio. In addition, we expect Tax Reform to result in
a significantly lower effective tax rate of approximately
Building momentumas One TCF
Craig R. Dahl, Chairman and Chief Executive Officer

2
23 percent to 25 percent beginning in 2018. As a result of
these benefits, we were pleased to provide approximately
$4.6 million in one-time bonuses to eligible team
members. In addition, we donated $5.0 million to the TCF
Foundation that will increase the grants we provide to
nonprofit organizations in the communities we serve.
Optimizing our capital remains a key opportunity for us
to deliver value to our shareholders. We began doing
this through several actions in 2017. First, we completed
various portfolio purchases and acquired two businesses
that have supported our focus on profitable growth.
Second, we proactively refinanced our 7.50% Series A non-
cumulative perpetual preferred stock with 5.70% Series C
non-cumulative perpetual preferred stock, resulting in
annual savings of approximately $3.0 million beginning in
2018. Finally, as part of our discontinuation of auto finance
loan originations, we launched a new share repurchase
program of $150.0 million and began repurchasing
common stock in the fourth quarter.
We also took steps in 2017 to further reduce the risk
profile of our balance sheet as non-accrual loans and
leases decreased by 34.6 percent and other real estate
owned decreased by 61.1 percent from December 31, 2016.
The run-off of our auto finance portfolio will also have a
positive impact on our overall risk profile over time.
A key win for TCF in 2017 was the successful launch of
our new digital banking platform. We invested heavily in
this initiative to ensure our customers have the tools and
resources that meet their evolving financial needs. The
new digital platform includes mobile deposit, fingerprint
identification, enhanced planning tools and much more. In
addition, the new platform will allow us to more efficiently
add on new features in the future. Our ability to offer a
competitive digital product to our customers is critical for
the future of the organization.
As we executed on these initiatives, as well as our core
business strategies, we did so under the lens of our
four strategic pillars. This means we understand the
significance of a well-diversified balance sheet funded by a
low-cost, core deposit base. It also means we understand
the importance of growing the balance sheet in a way
that can optimize the profitability of the organization as a
whole. Finally, it means improving efficiencies within the
organization is a guiding factor in the decisions we make.
DiversificationMaintaining a well-diversified loan and lease portfolio
is one of our core business philosophies. Not only do
we have multiple asset classes within our loan and
lease portfolio, each asset class is further diversified by
geography, rate, average loan and lease size, estimated
weighted average life and collateral type. Importantly, we
are able to compete as experts within each segment in
which we participate.
Our strong diversification provides the flexibility to be
selective in where and how we grow based on changing
appetites or market factors. For example, we discontinued
auto finance loan originations as we felt there were better
places to invest our capital to improve our overall returns.
We were able to do this because of our diversified portfolio
and our opportunities for growth in other areas, including
our investment portfolio. From an earnings asset growth
standpoint, we can be thoughtful when considering how
to redeploy the run-off of the auto finance portfolio to
optimize our return on capital.
The value of our loan and lease diversification has also
been demonstrated through our stable credit quality in
2017 compared to 2016, with steady delinquencies and
net charge-offs and lower non-performing assets. While
we saw an increase in auto finance net charge-offs in
2017, this was more than offset by an improvement in
consumer real estate.
Profitable growthTCF grew loans and leases by 7.1 percent in 2017 driven by
strong growth in our wholesale businesses. While we were
pleased with this level of growth, our focus remains on
optimizing the level of profitability. We are not interested
in growth just for the sake of growth. In addition, we
took steps in 2017 to improve our earnings predictability
by reducing our reliance on gains on sales of loans and
increasing our net interest income.
A key factor in our profitability was our net interest
income which increased 9.1 percent in 2017. We continue
to have one of the highest net interest margins in the
industry, which has further benefited from the recent
interest rate hikes. Loan and lease yields in 2017
increased 33 basis points primarily due to increases in
short-term rates, our strategy of competing as experts in
niche segments and our pricing discipline, while deposit
costs remained well-managed with an increase of just
two basis points.

3
2017 WILLIAM A. COOPER INNOVATION AWARD A team of business and IT leaders was recognized with the 2017 William A. Cooper Innovation Award for their work in creating and successfully launching a new digital banking platform. This award recognizes significant advancement of products, processes, services, technologies, or ideas that enable TCF to enhance its ability to serve its customers.
In 2017, we completed a strategic leasing company
acquisition, a $445.5 million leasing and equipment finance
portfolio purchase and an acquisition of a residential
mortgage lending business, all of which support our pillar
of profitable growth. The leasing company acquisition
resulted in increased leasing and equipment finance non-
interest income while the portfolio purchase resulted in
loan and lease growth with strong yields. The mortgage
lending business acquisition provides a first mortgage
loan origination platform that will create incremental
gains on sales revenue and the potential for future loan
growth if we choose to hold the loans on our balance
sheet. Going forward, we expect to focus on organic growth
opportunities, but we will continue to pursue acquisition
opportunities that fit our risk-reward profile.
Our decision to discontinue auto finance originations further
demonstrates our commitment to profitable growth. By
making this decision, we chose profitability over growth.
Even with the potential for reduced loan and lease growth,
we expect to be more profitable in 2018 by putting funds
from the auto finance run-off to work in other capacities.
We are committed to generating profitable growth that
leads to higher returns on our capital.
Operating leverageI have made it a priority during my first two years as CEO
to focus on improving the efficiency of our organization by
increasing revenues more than expenses. We recognize a
bank’s efficiency ratio has a high correlation to valuation.
In 2017, our efficiency ratio was significantly impacted by
the strategic changes made to our auto finance business.
In addition, we continued making key investments in
technology across the organization. As a result of our
actions in 2017, I believe we are now in a position where we
can show meaningful improvement in our efficiency ratio.
At TCF, we have a business model that generates revenue
well in excess of our similarly sized peers. Our challenge is
to do this more efficiently. We expect to execute on this in
2018 as a result of various efficiency initiatives, including
the discontinuation of auto finance loan originations.
I believe improving the efficiency with which we operate
is a significant opportunity for us to improve the returns
to our shareholders. We have instilled a culture in our
organization that the decisions we make should be made
with an eye toward the long-term impact they will have
on our operating leverage. While balancing this culture
with continued investments in our businesses, we feel we
are in a good position to take meaningful steps toward
becoming a more efficient organization in 2018.
Core fundingThe primary funding source of our loans and leases is
our low-cost deposit base, which totaled $18.3 billion at
December 31, 2017, a 6.3 percent increase from December 31,
2016. This granular deposit base is a very valuable part
of our franchise. As short-term rates have increased, the
relative value of the deposit base has been evident in our
well-managed deposit costs. Deposit costs in 2017 were
0.38 percent, an increase of just two basis points compared
to 2016, despite the steady increase in interest rates and
growth in the deposit base.
Our ability to continue to grow core checking balances is
directly tied to the convenience we provide to our retail
customers. The definition of “convenience” has evolved
and now places more emphasis on 24/7 banking through
digital channels as opposed to the number of branches and
branch hours. Since the launch of our new digital banking
platform in 2017, we have been pleased with the significant
increases in usage by our customers. This tells us the
solutions we are providing are meeting their needs.

4
We believe the new platform will help retain existing
customers and attract new customers to TCF.
Looking ahead, we expect to continue to generate core
deposit growth while retaining our access to wholesale
funding sources, which can be used as needed based on
anticipated loan and lease growth. We also believe our
deposit composition will allow us to effectively manage
deposit costs moving forward, especially given the
additional funding generated by the run-off of our auto
finance portfolio. I view our deposit base as the strength
of our franchise.
Positioned for success in 2018As you can see, we demonstrated real momentum in 2017
that we believe has positioned us to be successful in 2018.
We have an auto finance run-off headwind we expect to
not only eliminate, but turn into a tailwind as we improve
our risk profile and redeploy the capital into higher return
initiatives. We are continuing to see opportunities for
growth in our wholesale loan and lease portfolios. As a
bank with an asset sensitive balance sheet, we expect to
continue to benefit from anticipated additional interest
rate hikes in 2018, both from disciplined loan and lease
pricing and a preferred deposit composition. In addition,
there are opportunities for us to start making meaningful
progress in lowering our efficiency ratio.
Perhaps what I am most encouraged by is our opportunity
to be more proactive in deploying excess capital that
has been generated by earnings accumulation and tax
reform. In fact, this has already begun. In early 2018
we announced a quarterly common stock dividend of
15 cents per share, an increase of 100 percent compared
to our previous quarterly cash dividend. In addition,
we announced we will be redeeming the Series B non-
cumulative perpetual preferred stock on March 1, 2018.
We expect this to result in an annual after-tax expense
savings of $6.5 million beginning in the second quarter of
2018. For the past two years, I have indicated that we have
been reviewing four potential uses of capital including
organic loan and lease growth, dividend increases, stock
repurchases, and corporate development. As of early
2018, we have now deployed capital into all of these
areas. Going forward, we will continue to evaluate these
channels, as well as investments in our business, for
additional deployment of excess capital. We understand
that deploying capital is important to our shareholders and
I believe we have positioned ourselves to do so effectively.
Although we continue to be subject to the Consumer
Financial Protection Bureau’s (CFPB) lawsuit regarding our
overdraft opt-in practices, we received a favorable ruling
from the court in September 2017 related to our motion
to dismiss. We remain confident that the way we provided
our overdraft program to our customers complied with
all applicable laws and regulations and we treated our
customers fairly. We believe the facts and the law will
support our legal position.
Another key driver of our success moving forward will be
our people. Our people are our most important resource.
We are investing heavily in the development and retention
of our team members. We are also focused on attracting
team members who demonstrate leadership and
expertise in areas that are important to our future success.
The hard work of all our team members, including our
board of directors and executive management team, has
been vital to our success over the past year. I thank them
all for their efforts.
I am very excited about the positive momentum we
have generated in 2017 and what it can mean for our
organization in 2018 and beyond. This momentum gives
us the opportunity to focus on making investments in our
future and improving returns for shareholders through
various channels. This is important to our shareholders
and it is important to the board of directors and executive
management team at TCF. We have strategies in motion
to generate the returns our shareholders expect. By
working together as “One TCF”, we can continue to build
momentum and deliver the results needed to achieve
our goals. We made many tough decisions in 2017 that
have set the stage for what is to come. The work is not
done, but I believe we have an organization that is built
for the future and a focus that aligns with the goals of
our shareholders.
Craig R. Dahl
Chairman and Chief Executive Officer

3
FORM 10-KFor the fiscal year ended December 31, 2017

UNITED STATESSECURITIES AND EXCHANGE COMMISSION
WASHINGTON, D.C. 20549
FORM 10-K
þ ANNUAL REPORT PURSUANT TO SECTION 13 OR 15(d) OF THE SECURITIES EXCHANGE ACT OF 1934For the fiscal year ended December 31, 2017
or
¨ Transition Report Pursuant to Section 13 or 15(d) of the Securities Exchange Act of 1934For the transition period from to Commission File No. 001-10253
TCF Financial Corporation(Exact name of registrant as specified in its charter)
Delaware 41-1591444(State or other jurisdiction of incorporation or organization) (I.R.S. Employer Identification No.)
200 Lake Street EastWayzata, Minnesota 55391-1693
(Address and Zip Code of principal executive offices)(952) 745-2760
(Registrant's telephone number, including area code)Securities registered pursuant to Section 12(b) of the Act:
(Title of each class) (Name of each exchange on which registered)
Common Stock (par value $.01 per share) New York Stock Exchange
6.45% Series B Non-Cumulative Perpetual Preferred Stock New York Stock Exchange
Depositary shares, each representing a 1/1000th interest in a share of 5.70% Series C Non-Cumulative Perpetual Preferred Stock New York Stock Exchange
Warrants (expiring November 14, 2018) New York Stock Exchange
Indicate by check mark if the registrant is a well-known seasoned issuer, as defined in Rule 405 of the Securities Act. Yes þ No ¨
Indicate by check mark if the registrant is not required to file reports pursuant to Section 13 or Section 15(d) of the Act. Yes ¨ No þ
Indicate by check mark whether the registrant (1) has filed all reports required to be filed by Section 13 or 15(d) of the Securities Exchange Act of1934 during the preceding 12 months (or for such shorter period that the registrant was required to file such reports), and (2) has been subject tosuch filing requirements for the past 90 days. Yes þ No ¨
Indicate by check mark whether the registrant has submitted electronically and posted on its corporate Web site, if any, every Interactive DataFile required to be submitted and posted pursuant to Rule 405 of Regulation S-T (§232.405 of this chapter) during the preceding 12 months (orfor such shorter period that the registrant was required to submit and post such files). Yes þ No ¨
Indicate by check mark if disclosure of delinquent filers pursuant to Item 405 of Regulation S-K (§229.405 of this chapter) is not contained herein,and will not be contained, to the best of registrant's knowledge, in definitive proxy or information statements incorporated by reference in Part III ofthis Form 10-K or any amendment to this Form 10-K. þ
Indicate by check mark whether the registrant is a large accelerated filer, an accelerated filer, a non-accelerated filer, a smaller reportingcompany, or an emerging growth company. See the definitions of "large accelerated filer," "accelerated filer," "smaller reporting company," and"emerging growth company" in Rule 12b-2 of the Exchange Act.
Large accelerated filer þ Accelerated filer ¨
Non-accelerated filer ¨ (Do not check if smaller reporting company) Smaller reporting company ¨ Emerging growth company ¨
If an emerging growth company, indicate by check mark if the registrant has elected not to use the extended transition period for complying withany new or revised financial accounting standards provided pursuant to Section 13(a) of the Exchange Act. ¨Indicate by check mark whether the registrant is a shell company (as defined in Rule 12b-2 of the Exchange Act). Yes ¨ No þ
The aggregate market value of the voting and non-voting common equity held by non-affiliates computed by reference to the average bid andasked price of such common equity, as of the last business day of the registrant's most recently completed second fiscal quarter as reported bythe New York Stock Exchange, was $2,502,765,920.
As of February 20, 2018, there were 170,962,451 shares outstanding of the registrant's common stock, par value $.01 per share, its onlyoutstanding class of common stock.
DOCUMENTS INCORPORATED BY REFERENCESpecific portions of the Registrant's definitive Proxy Statement for the 2018 Annual Meeting of Stockholders to be held on April 25, 2018 areincorporated by reference into Part III hereof.

TABLE OF CONTENTS
Description Page
Part IItem 1. Business 1Item 1A. Risk Factors 8Item 1B. Unresolved Staff Comments 16Item 2. Properties 16Item 3. Legal Proceedings 17Item 4. Mine Safety Disclosures 17
Part IIItem 5. Market for Registrant's Common Equity, Related Stockholder Matters and Issuer
Purchases of Equity Securities 18Item 6. Selected Financial Data 21Item 7. Management's Discussion and Analysis of Financial Condition and Results of
Operations 22Item 7A. Quantitative and Qualitative Disclosures About Market Risk 59Item 8. Financial Statements and Supplementary Data 62
Report of Independent Registered Public Accounting Firm 62Consolidated Financial Statements 63Notes to Consolidated Financial Statements 68Other Financial Data 121
Item 9. Changes in and Disagreements With Accountants on Accounting and FinancialDisclosure 122
Item 9A. Controls and Procedures 122Management's Report on Internal Control Over Financial Reporting 123Report of Independent Registered Public Accounting Firm 124
Item 9B. Other Information 125
Part IIIItem 10. Directors, Executive Officers and Corporate Governance 125Item 11. Executive Compensation 126Item 12. Security Ownership of Certain Beneficial Owners and Management and Related
Stockholder Matters 126Item 13. Certain Relationships and Related Transactions, and Director Independence 126Item 14. Principal Accountant Fees and Services 126
Part IVItem 15. Exhibits and Financial Statement Schedules 127Signatures 128Index to Exhibits 130

Part I
1
Item 1. Business
General
TCF Financial Corporation (together with its direct and indirect subsidiaries, "we," "us," "our," "TCF" or the "Company"),a Delaware corporation incorporated on April 28, 1987, is a national bank holding company based in Wayzata,Minnesota. References herein to "TCF Financial" or the "Holding Company" refer to TCF Financial Corporation on anunconsolidated basis. TCF's principal subsidiary, TCF National Bank ("TCF Bank"), is headquartered in Sioux Falls,South Dakota. TCF Bank operates bank branches in Illinois, Minnesota, Michigan, Colorado, Wisconsin, Arizona andSouth Dakota (TCF's primary banking markets). TCF delivers consumer banking services in 46 states and commercialbanking services in 34 states. TCF also conducts commercial leasing and equipment finance business in all 50 statesand, to a limited extent, in foreign countries and commercial inventory finance business in all 50 states and Canadaand, to a limited extent, in other foreign countries. Effective April 1, 2017, the Company executed its strategic shiftfrom an originate-to-sell and originate-to-hold model to an entirely originate-to-hold model for its auto finance businessand effective December 1, 2017, the Company discontinued auto finance loan originations. The determination wasbased on management's review of strategic alternatives and the financial outlook of the auto finance loan originationbusiness compared with alternative uses of capital. TCF's subsidiary, Gateway One Lending & Finance, LLC ("GatewayOne"), will continue to service existing auto loans on its balance sheet and those serviced for others. The decision todiscontinue auto finance loan originations resulted in a goodwill impairment charge of $73.0 million, an other intangibleassets impairment charge of $0.4 million and approximately $14.8 million of expenses related to severance, otherasset impairments and lease termination expenses in 2017.
TCF generated total revenue, defined as net interest income plus total non-interest income, of $1.4 billion, $1.3 billionand $1.2 billion in the United States in 2017, 2016 and 2015, respectively. International revenue, primarily from Canada,was $22.6 million, $25.6 million and $27.3 million in 2017, 2016 and 2015, respectively. TCF had total assets of$23.0 billion as of December 31, 2017 and was the 46th largest publicly traded bank holding company in the UnitedStates based on total assets at September 30, 2017.
TCF provides convenient financial services through multiple channels in its primary banking markets. TCF hasdeveloped products and services designed to meet the specific needs of the largest consumer segments in the market.The Company focuses on attracting and retaining customers through service and convenience, including selectlocations open seven days a week with extended hours and on most holidays, full-service supermarket branches,access to automated teller machine ("ATM") networks and digital banking channels. TCF's philosophy is to generateinterest income, fees and other revenue growth through business lines that emphasize higher yielding assets and lowinterest cost deposits. TCF's growth strategies include organic growth in existing businesses, development of newproducts and services, new customer acquisition and acquisitions of portfolios or businesses. New products andservices are designed to build on existing businesses and expand into complementary products and services throughstrategic initiatives. Funded generally through retail deposit generation, TCF continues to focus on profitable assetgrowth.
The Company's reportable segments are Consumer Banking, Wholesale Banking and Enterprise Services. See "Item7. Management's Discussion and Analysis of Financial Condition and Results of Operations ("Management'sDiscussion and Analysis") - Results of Operations - Reportable Segment Results" and Note 24. Business Segmentsof Notes to Consolidated Financial Statements for information regarding net income (loss), assets and revenues foreach of TCF's reportable segments.

Consumer Banking
Consumer Banking is comprised of all of the Company's consumer-facing businesses and includes retail banking,consumer real estate and auto finance. TCF's consumer banking strategy is primarily to originate high credit qualitysecured consumer real estate loans for investment and for sale and to generate deposits. Effective April 1, 2017, theCompany executed its strategic shift from an originate-to-sell and originate-to-hold model to an entirely originate-to-hold model for its auto finance business and effective December 1, 2017, the Company discontinued auto finance loanoriginations. Deposits are generated from consumers and small businesses to provide a source of low cost funds, witha focus on building and maintaining quality customer relationships. The Consumer Banking reportable segmentgenerates a significant portion of the Company's net interest income and non-interest income from fees and servicecharges, card revenue, ATM revenue, gains on sales of loans and servicing fee income, and incurs a significant portionof the Company's provision for credit losses and non-interest expense.
Retail Banking TCF offers an array of solutions for consumers and small businesses through its physical and digitaldistribution channels. TCF offers a broad selection of deposit and lending services including (i) checking and savingsaccounts, (ii) credit, debit and prepaid cards, (iii) check cashing and remittance services and (iv) residential, consumerand small business lending.
Deposits are a primary source of TCF's funds for use in lending and for other general business purposes. Depositinflows and outflows are significantly influenced by general interest rates, market and competitive conditions and othereconomic factors. Deposits are acquired from within TCF's primary banking markets through (i) checking, savings andmoney market accounts, (ii) certificates of deposit and (iii) individual retirement accounts. Such deposit accountsprovide fee income, including banking fees and service charges. Checking, savings and certain money market accountsare a source of low cost or no cost funds.
At December 31, 2017, TCF had 320 branches, consisting of 189 traditional branches, 128 supermarket branchesand three campus branches. TCF operates 123 branches in Illinois, 88 in Minnesota, 50 in Michigan, 33 in Colorado,17 in Wisconsin, seven in Arizona and two in South Dakota. TCF currently plans to close five supermarket branchesin early 2018, of which three are in Illinois and two are in Minnesota. TCF also offers 836 ATMs across TCF's primarybanking markets. See "Item 1A. Risk Factors" for further information regarding the risks related to TCF's supermarketbranch relationships.
Non-interest income is a significant source of revenue for TCF and an important component of TCF's results ofoperations. Providing a wide range of retail banking services is an integral component of TCF's business philosophy.Primary drivers of bank fees and service charges include the number of customers we attract, the customers' level ofengagement and the frequency with which the customer uses our solutions. TCF's business philosophy is to offer ourcustomers an "easy-to-bank-with" experience, with multiple solutions that benefit the customer and are consistent withTCF's business philosophy. Customers have convenient access to their funds through their credit, debit and prepaidcards, as well as by utilizing TCF's enhanced digital channels. TCF's card programs are supported by interchangefees paid by retailers.
Consumer Real Estate TCF originates consumer loans for personal, family or household purposes, such as homepurchases, debt consolidation and financing of home improvements. TCF's retail lending origination activity primarilyconsists of consumer real estate secured lending. It also includes originating loans secured by personal property and,to a very limited extent, unsecured personal loans. Consumer loans are originated for investment and for sale, eitheron a fixed-term basis or as a revolving line of credit. TCF has two consumer real estate loan sale programs: one thatsells nationally originated consumer real estate junior lien loans and the other that originates first mortgage lien loansin its primary banking markets and sells the loans through correspondent relationships. TCF does not have anyconsumer real estate subprime lending programs. TCF continues to expand its junior lien lending business through anational lending platform focused on junior lien loans to high credit quality customers.
Auto Finance Gateway One, headquartered in Anaheim, California, services loans on new and used autos. EffectiveApril 1, 2017, the Company executed its strategic shift for auto finance from an originate-to-sell and originate-to-holdmodel to an entirely originate-to-hold model and effective December 1, 2017, the Company discontinued auto financeloan originations. Prior to April 1, 2017, loans were originated for investment and for sale. Gateway One will continueto service existing auto loans on its balance sheet and those serviced for others.
2

Wholesale Banking
Wholesale Banking is comprised of commercial lending, leasing and equipment finance and inventory finance. TCF'swholesale banking strategy is primarily to originate high credit quality secured loans and leases for investment.
Commercial With an emphasis on secured lending, essentially all of TCF's commercial loans were secured eitherby properties or other business assets at December 31, 2017 and 2016.
Commercial real estate loans originated by TCF are secured by commercial real estate, including multi-family housing,office buildings, warehouse and industrial buildings, health care facilities, self-storage buildings, retail services buildingsand hotel and motel buildings. The commercial real estate portfolio represented 77.3% and 80.2% of TCF's totalcommercial portfolio at December 31, 2017 and 2016, respectively.
Commercial business loans originated by TCF are secured by various types of business assets including inventory,receivables, equipment or financial instruments. Commercial business loans are used for a variety of purposes,including working capital and financing the purchase of equipment.
Leasing and Equipment Finance TCF provides a broad range of comprehensive lease and equipment financeproducts addressing the diverse financing needs of small to large companies in a growing number of select marketsegments including specialty vehicles, construction equipment, manufacturing equipment, golf cart and turf equipment,trucks and trailers, medical equipment, furniture and fixtures, technology and data processing equipment, andagricultural equipment. TCF's leasing and equipment finance businesses, TCF Equipment Finance, a division of TCFBank, and Winthrop Resources Corporation ("Winthrop"), finance equipment in all 50 states and, to a limited extent,in foreign countries. TCF Equipment Finance delivers equipment finance solutions primarily to small and mid-sizecompanies in various industries with significant diversity in the types of underlying equipment. Winthrop focuses onproviding customized lease financing to meet the special needs of mid-size and large companies and health carefacilities that procure high-tech essential business equipment such as computers, servers, telecommunicationequipment, medical equipment and other technology equipment.
Inventory Finance TCF Inventory Finance, Inc. ("TCF Inventory Finance") originates commercial, primarily variable-rate loans which are secured by the underlying floorplan equipment and supported by repurchase agreements fromoriginal equipment manufacturers. The operation focuses on establishing relationships with distributors, dealer buyinggroups and manufacturers, giving TCF access to thousands of independent retailers primarily in the areas ofpowersports and lawn and garden. TCF Inventory Finance operates in all 50 states and Canada and, to a limitedextent, in other foreign countries. TCF Inventory Finance's portfolio balances are impacted by seasonal shipmentsand sales activities as dealers receive inventory shipments in anticipation of the upcoming selling season while carryingcurrent season product. In 2009, TCF Inventory Finance formed a joint venture with The Toro Company ("Toro") calledRed Iron Acceptance, LLC ("Red Iron"). Red Iron provides U.S. distributors and dealers and select Canadian distributorsof the Toro® and Exmark® brands with reliable, cost-effective sources of financing. TCF maintains a 55% ownershipinterest in Red Iron, with Toro owning the other 45%.
Enterprise Services
Enterprise Services is comprised of (i) corporate treasury, which includes the Company's investment and borrowingportfolios and management of capital, debt and market risks, (ii) corporate functions, such as information technology,risk and credit management, bank operations, finance, investor relations, corporate development, legal and humancapital management, that provide services to the operating segments, (iii) the Holding Company and (iv) eliminations.The Company's investment portfolio accounts for the earning assets within this segment. Borrowings may be used tooffset reductions in deposits or to support lending activities. This segment also includes residual revenues and expensesrepresenting the difference between actual amounts incurred by Enterprise Services and amounts allocated to theoperating segments, including interest rate risk residuals such as funds transfer pricing mismatches.
3
Corporate Treasury Corporate Treasury's primary responsibility is management of liquidity, capital, interest rate risk,and investment and borrowing portfolios. Corporate Treasury has authority to invest in various types of liquid assetsincluding, but not limited to, U.S. Department of the Treasury obligations and securities of various federal agenciesand U.S. Government sponsored enterprises, obligations of states and political subdivisions, deposits of insured banks,bankers' acceptances and federal funds. Corporate Treasury also has the authority to enter into wholesale borrowingtransactions which may be used to compensate for reductions in deposit inflows or net deposit outflows, or to supportlending, leasing and other expansion activities. These borrowings may include Federal Home Loan Bank ("FHLB")advances, brokered deposits, repurchase agreements, federal funds and other permitted borrowings from creditworthycounterparties.
Information concerning TCF's FHLB advances, repurchase agreements, federal funds and other borrowings is setforth in "Item 7. Management's Discussion and Analysis - Consolidated Financial Condition Analysis - Borrowings" andin Note 12. Short-term Borrowings and Note 13. Long-term Borrowings of Notes to Consolidated Financial Statements.
Other Information
Activities of Subsidiaries of TCF TCF's business operations include those conducted by direct and indirectsubsidiaries of TCF Financial, all of which are consolidated for purposes of preparing TCF's consolidated financialstatements. TCF Bank's subsidiaries principally engage in leasing, inventory finance and auto finance activities. See"Consumer Banking" and "Wholesale Banking" above for further information.
Competition TCF competes with a number of depository institutions and financial service providers primarily basedon price and service and faces significant competition in attracting and retaining deposits and in lending activities.Direct competition for deposits comes primarily from banks, savings institutions, credit unions and investment banks.Additional significant competition for deposits comes from institutions selling money market mutual funds and corporateand government securities. TCF competes for the origination of loans with banks, mortgage bankers, mortgage brokers,consumer and commercial finance companies, credit unions, insurance companies and savings institutions. TCF alsocompetes nationwide with other companies and banks in the financing of equipment, inventory and automobiles(through December 1, 2017), leasing of equipment and origination of consumer real estate junior lien loans. Theexpanded use of the internet and the growth of financial technology companies partnering with financial servicesproviders has increased competition for loan, lease and deposit products.
Employees As of December 31, 2017, TCF had 6,116 employees, including 778 part-time employees. TCF providesits employees with comprehensive benefits, some of which are provided on a contributory basis, including medicaland dental plans, a 401(k) savings plan with a company matching contribution, life insurance and short- and long-termdisability coverage.
Regulation
TCF Financial, as a publicly held bank holding company, and TCF Bank, which has deposits insured by the FederalDeposit Insurance Corporation ("FDIC"), are subject to extensive regulation. Among other things, TCF Financial andTCF Bank are subject to minimum capital requirements, lending and deposit restrictions and numerous otherrequirements. TCF Financial's primary regulator is the Federal Reserve and TCF Bank's primary regulator is the Officeof the Comptroller of the Currency ("OCC"). TCF's consumer products are also regulated by the Consumer FinancialProtection Bureau ("CFPB").
4

Regulatory Capital Requirements TCF Financial and TCF Bank are subject to various minimum regulatory capitalrequirements administered by the Federal Reserve and the OCC. These requirements include quantitative measuresthat assign risk weightings to assets and off-balance sheet items, as well as define and set minimum regulatory capitalrequirements. Failure to meet minimum capital requirements can initiate certain mandatory, and possible additionaldiscretionary, actions by the federal banking regulators that, if undertaken, could have a material adverse effect onTCF's financial condition and results of operations. These federal banking regulators are required by law to take promptaction when institutions are viewed as engaging in unsafe or unsound practices or do not meet certain minimum capitalrequirements. In addition to other potential actions, failure to meet these requirements would result in limitations oncapital distributions as well as executive bonuses. The Basel III capital standard phases in through 2019. Institutionsnot subject to the advanced approaches requirements were allowed to opt out of including components of accumulatedother comprehensive income (loss) in common equity Tier 1 capital. TCF and TCF Bank made the one-time permanentelection to not include accumulated other comprehensive income (loss) in regulatory capital. TCF and TCF Bank aresubject to a capital conservation buffer. When fully phased-in on January 1, 2019, the Basel III capital standard willrequire TCF and TCF Bank to maintain a 2.5% capital conservation buffer, designed to absorb losses during periodsof economic stress, composed entirely of common equity Tier 1 capital, on top of the minimum risk-weighted assetratios, effectively resulting in minimum ratios for TCF Bank of (i) a common equity Tier 1 capital ratio of at least 7.0%,(ii) a Tier 1 risk-based capital ratio of at least 8.5% and (iii) a total risk-based capital ratio of at least 10.5%. TCF andTCF Bank exceeded the fully phased-in Basel III capital standard as of December 31, 2017. See Note 16. RegulatoryCapital Requirements of Notes to Consolidated Financial Statements for further information.
Restrictions on Distributions TCF Financial's ability to pay dividends is subject to limitations imposed by the FederalReserve. In general, Federal Reserve regulatory guidelines require the board of directors of a bank holding companyto consider a number of factors in determining the payment of dividends, including the quality and level of current andfuture earnings. Restricted retained earnings represents earnings legally appropriated to thrift bad debt reserves anddeducted for federal income tax purposes in prior years and is generally not available for payment of cash dividendsor other distributions to stockholders. See Note 15. Equity of Notes to Consolidated Financial Statements for furtherinformation on restricted retained earnings. Dividends or other capital distributions from TCF Bank to TCF Financial are an important source of funds to enableTCF Financial to pay dividends on its preferred and common stock, to pay TCF Financial's obligations or to meet othercash needs. The ability of TCF Financial and TCF Bank to pay dividends depends on regulatory policies and regulatorycapital requirements and may be subject to regulatory approval. In general, TCF Bank may not declare or pay a dividend to TCF Financial in excess of 100% of its net retained earningsfor the current year combined with its net retained earnings for the preceding two calendar years without prior approvalof the OCC. The OCC also has the authority to prohibit the payment of dividends by a national bank when it determinessuch payments would constitute an unsafe and unsound banking practice. TCF Bank's ability to make capitaldistributions in the future may require regulatory approval and may be restricted by its federal banking regulators. TCFBank's ability to make any such distributions will also depend on its earnings and ability to meet minimum regulatorycapital requirements in effect during future periods. In the future, these capital adequacy standards may be higherthan existing minimum regulatory capital requirements. See Note 16. Regulatory Capital Requirements of Notes toConsolidated Financial Statements for further information.
In addition, income tax considerations may limit the ability of TCF Bank to make dividend payments in excess of itscurrent and accumulated tax earnings. Annual dividend distributions in excess of earnings could result in a tax liabilitybased on the amount of excess earnings distributed and current tax rates.
Regulation of TCF and Affiliates and Insider Transactions TCF Financial is subject to Federal Reserve regulations,examinations and reporting requirements applicable to bank holding companies. Subsidiaries of bank holdingcompanies, like TCF Bank, are subject to certain restrictions in their dealings with holding company affiliates. A holding company must serve as a source of strength for its subsidiary banks and the Federal Reserve may requirea holding company to contribute additional capital to an undercapitalized subsidiary bank. In addition, the OCC mayassess TCF Financial if it believes the capital of TCF Bank has become impaired. If TCF Financial were to fail to paysuch an assessment within three months, the Board of Directors would be required to cause the sale of TCF Bank'sstock to cover a deficiency in the capital. In the event of a bank holding company's bankruptcy, any commitment bythe bank holding company to a federal banking regulator to maintain the capital of a subsidiary bank would be assumedby the bankruptcy trustee and may be entitled to priority over other creditors.
5

Under the Bank Holding Company Act of 1956 ("BHCA"), Federal Reserve approval is required before acquiring morethan 5% control, or substantially all of the assets, of another bank, or bank holding company, or merging or consolidatingwith such a bank or bank holding company. The BHCA also generally prohibits a bank holding company, with certainexceptions, from acquiring direct or indirect ownership or control of more than 5% of the voting shares of any companywhich is not a bank or bank holding company, or from engaging directly or indirectly in activities other than those ofbanking, managing or controlling banks, providing services for its subsidiaries, or conducting activities permitted bythe Federal Reserve as being closely related to the business of banking. Further restrictions or limitations on acquisitionsor establishing financial subsidiaries may also be imposed by TCF's regulators or examiners.
Restrictions on Acquisitions and Changes in Control Under federal and state law, merger and branch acquisitiontransactions may be subject to certain restrictions, including certain nationwide and statewide insured deposit maximumconcentration levels or other limitations. In addition, federal and state laws and regulations contain a number ofprovisions which impose restrictions on changes in control of financial institutions such as TCF Bank and which requireregulatory approval prior to any such changes in control.
Insurance of Accounts TCF Bank is a member of the FDIC, which maintains the Deposit Insurance Fund ("DIF").The FDIC insures deposits up to prescribed limits for each depositor through the DIF, which is funded throughassessments on member institutions. To maintain the DIF, member institutions are assessed an insurance premiumbased on an assessment base and an assessment rate.
The Dodd-Frank Wall Street Reform and Consumer Protection Act of 2010 (the "Dodd-Frank Act") gave the FDIC muchgreater discretion to manage the DIF and also changed the assessment base from domestic deposits to average totalassets less tangible equity. Additionally, the Dodd-Frank Act raised the minimum designated reserve ratio ("DRR") to1.35% of estimated insured deposits from 1.15% and required this new minimum be reached by September 30, 2020.On July 1, 2016 an additional surcharge of 4.5 cents for each $100 of an institution's assessment base in excess of$10.0 billion went into effect to ensure the DRR reaches this new minimum by the required date. The DIF ratio calculatedby the FDIC using estimated insured deposits as of September 30, 2017 was 1.28%.
In 2017, insurance premiums on bank deposits insured by the FDIC for banks with at least $10.0 billion in total assetsranged from 1.5 cents to 40 cents per $100 of the institution's assessment base. TCF's FDIC insurance expense was$16.0 million, $15.9 million and $20.3 million in 2017, 2016 and 2015, respectively.
In addition to deposit insurance premium assessments from the FDIC, additional assessments may be imposed bythe Financing Corporation, a separate U.S. government agency affiliated with the FDIC, to pay for the interest cost ofFinancing Corporation bonds. As of December 31, 2017, the Financing Corporation assessment rate was 46 cents foreach $10,000 of the institution's assessment base.
Examinations and Regulatory Sanctions TCF is subject to periodic examination by the Federal Reserve, the OCC,the CFPB and the FDIC. Federal banking regulators may impose a number of restrictions or new requirements oninstitutions, including, but not limited to, growth limitations, dividend restrictions, increased regulatory capitalrequirements, increased loan and lease loss reserve requirements, increased supervisory assessments, activitylimitations or other restrictions that could have an adverse effect on such institutions, their holding companies or holdersof their debt and equity securities. Various enforcement remedies, including civil money penalties, may be assessedagainst an institution or an institution's directors, officers, employees, agents or independent contractors. Certainenforcement actions may not be publicly disclosed by TCF or its federal banking regulators. Subsidiaries of TCF Bankare also subject to state and/or self-regulatory organization licensing, regulation and examination requirements inconnection with certain activities. See "Item 1A. Risk Factors."
National Bank Investment Limitations Permissible investments by national banks are limited by the National BankAct of 1864, as amended, and by rules of the OCC. Non-traditional bank activities permitted by the Gramm-Leach-Bliley Act of 1999 will subject a bank to additional regulatory limitations or requirements, including a required regulatorycapital deduction and application of transactions with affiliates limitations in connection with such activities.
6

Taxation
Federal Taxation TCF's federal income tax returns are open and subject to examination for 2014 and later tax returnyears. The Tax Cuts and Jobs Act ("Tax Reform") was enacted on December 22, 2017, which resulted in the re-measurement of deferred tax assets and deferred tax liabilities to account for the future impact of lower corporate taxrates on these deferred amounts. As a result of Tax Reform, TCF recorded a reasonable estimate of a net tax benefitof $130.7 million in 2017, primarily resulting from the re-measurement of the Company's estimated net deferred taxliability. State Taxation TCF and/or its subsidiaries currently file tax returns in all state and local taxing jurisdictions whichimpose corporate income, franchise or other taxes. TCF's various state income tax returns are generally open for 2013and later tax return years based on individual state statutes of limitation. The methods of filing and the methods forcalculating taxable and apportionable income vary depending on the laws of each taxing jurisdiction.
Foreign Taxation TCF and/or its subsidiaries currently file tax returns in Canada and certain Canadian provinceswhich impose corporate income taxes. TCF's various foreign income tax returns are open and subject to examinationfor 2013 and later tax return years. The methods of filing and the methods for calculating taxable and apportionableincome vary depending on the laws of each taxing jurisdiction. See "Item 7. Management's Discussion and Analysis - Consolidated Income Statement Analysis - Income Taxes", Note2. Summary of Significant Accounting Policies and Note 14. Income Taxes of Notes to Consolidated FinancialStatements for further information regarding TCF's income taxes.
Available Information TCF's website, www.tcfbank.com, includes free access to Company news releases, investor presentations, conferencecalls to discuss published financial results, TCF's Annual Report and periodic filings required by the U.S. Securitiesand Exchange Commission ("SEC"), including annual reports on Form 10-K, quarterly reports on Form 10-Q, currentreports on Form 8-K, proxy statements, and amendments to those reports, as soon as reasonably practicable afterelectronic filing of such material with, or furnishing it to, the SEC. TCF's Compensation, Nominating, and CorporateGovernance Committee and Audit Committee charters, Corporate Governance Guidelines, Codes of Ethics andinformation on all of TCF's securities are also available on this website. Stockholders may request these documentsin print free of charge by contacting the Corporate Secretary at TCF Financial Corporation, 200 Lake Street East, MailCode EX0-01-G, Wayzata, MN 55391-1693.
7

Item 1A. Risk Factors An investment in securities issued by TCF, including an investment in TCF's common and preferred stock, involvescertain risks that should be considered carefully. The most significant risks that management believes affect TCF aredescribed below. Any of the risks described below may have a material impact on TCF's financial condition, results ofoperations or reputation. To the extent that any of the information contained in this Annual Report on Form 10-K isforward-looking, the risk factors set forth below also are cautionary statements identifying important factors that couldcause TCF's actual results to differ materially from those expressed in any forward-looking statements.
TCF's financial results are significantly affected by general economic and political conditions.
TCF's operations and profitability are impacted by both business and economic conditions generally, as well as thosein the local markets in which TCF operates. Economic conditions have a significant impact on the demand for TCF'sproducts and services, as well as the ability of its customers to repay loans and leases, the value of the collateralsecuring loans and leases, the ability of TCF to sell loans, the stability of its deposit funding sources and sales revenueat the end of contractual lease terms. A significant decline in general economic conditions caused by inflation, recession,unemployment, changes in securities markets, changes in housing market prices or other factors could impact economicconditions and, in turn, could have a material adverse effect on TCF's financial condition and results of operations.
Additionally, adverse economic conditions may result in a decline in demand for equipment that TCF leases or finances,which could result in a decline in the amount of new equipment being placed in service, as well as declines in thevalues of collateral already in service. Adverse economic conditions may also hinder TCF from expanding the inventoryfinance business by limiting its ability to attract and retain manufacturers and dealers as expected. Any such difficultiesin TCF's leasing and equipment and inventory finance businesses could have a material adverse effect on its financialcondition and results of operations.
TCF's financial results are subject to interest rate risk. TCF's earnings and cash flows largely depend upon its net interest income. Interest rates are highly sensitive to manyfactors that are beyond TCF's control, including general economic conditions and policies of various governmentaland regulatory agencies, including the Federal Reserve. Changes in monetary policy, including changes in interestrates, could influence not only the interest TCF receives on loans, leases and other investments and the amount ofinterest TCF pays on deposits and other borrowings, but such changes could also affect: (i) TCF's ability to originateloans and leases and attract or retain deposits; (ii) the fair value of TCF's financial assets and liabilities and (iii) theaverage duration of TCF's interest-earning assets. If the interest rates paid on deposits and other borrowings increaseat a faster rate than the interest rates received on loans, leases and other investments, then TCF's net interest incomeand earnings could be adversely affected. Earnings could also be adversely affected if the interest rates received onloans, leases and other investments fall more quickly than the interest rates paid on deposits and other borrowings.Although management believes it has implemented effective asset and liability management strategies, any substantial,unexpected or prolonged change in market interest rates could have a material adverse effect on its financial conditionand results of operations. An inability to obtain needed liquidity could have a material adverse effect on TCF's financial condition and results ofoperations. TCF's liquidity could be limited by an inability to access the capital markets or unforeseen outflows of cash, whichcould arise due to circumstances outside of its control, such as a general market disruption or an operational problemthat affects TCF or third parties. TCF's credit rating is important to its liquidity. A reduction or anticipated reduction inTCF's credit ratings could adversely affect the ability of TCF Bank and its subsidiaries to lend and adversely affect itsliquidity and competitive position, increase its borrowing costs, limit its access to the capital markets or triggerunfavorable contractual obligations. An inability to meet its funding needs on a timely basis could have a materialadverse effect on TCF's financial condition and results of operations.
8

TCF Financial relies on dividends from TCF Bank for most of its liquidity.
TCF Financial is a separate and distinct legal entity from TCF Bank. TCF Financial's liquidity comes principally fromdividends from TCF Bank. These dividends, which are limited by various federal and state regulations, are the principalsource of funds TCF Financial uses to pay dividends on its preferred and common stock and to meet its other cashneeds. In the event TCF Bank is unable to pay dividends to TCF Financial, it may not be able to pay dividends or otherobligations, which could have a material adverse effect on TCF's financial condition and results of operations.
Competition for growth in deposits and evolving payment system developments could increase TCF's funding costs.
TCF relies on bank deposits to be a low cost and stable source of funding. TCF competes with banks and other financialinstitutions for deposits and it is expected that competition for deposits will continue to increase. If TCF's competitorsraise the rates they pay on deposits, TCF may experience either a loss of deposits or an increase in rates paid by TCFto avoid losing deposits. Industry developments involving payment system changes could also impose additional costs.Losses of deposits may require TCF to address its liquidity needs in ways that increase its funding costs. Increasedfunding costs could reduce TCF's net interest margin and net interest income, which could have a material adverseeffect on TCF's financial condition and results of operations.
The soundness of other financial institutions could adversely affect TCF's financial results.
TCF's ability to engage in routine funding transactions could be adversely affected by the actions and commercialsoundness of other financial institutions. TCF routinely executes transactions with counterparties in the financialindustry, including brokers and dealers, commercial banks and other institutional clients. As a result, defaults by, oreven speculation regarding the soundness of, any financial institution, or the financial services industry generally, couldlead to losses by, or other adverse consequences to, TCF or a counterparty. Many of these transactions expose TCFto credit risk in the event of default of the counterparty or client. In addition, TCF's credit risk may be exacerbated ifthe collateral held by TCF cannot be realized or is liquidated at prices not sufficient to recover the full amount of thefinancial exposure. Any such losses could have a material adverse effect on TCF's financial condition and results ofoperations.
TCF relies on its systems and counterparties, including reliance on other companies for the provision of key componentsof its business infrastructure, and any failures could have a material adverse effect on its financial condition and resultsof operations. TCF, through systems and counterparties, settles funds on behalf of financial institutions, other businesses andconsumers and receives funds from payment networks, consumers and other paying agents. TCF's businesses dependon their ability to process, record and monitor a large number of complex transactions and process large amounts ofinformation, including employee and financial information. Any disruptions to these systems may result in significantcosts and other adverse developments. Although we have plans, policies and procedures designed to prevent or limitthe negative effect of these disruptions, there can be no assurance that these will be successful. Our failure to effectivelymitigate or promptly remediate any disruptions could result in an inability to perform necessary business functions,damage our reputation, result in a loss of customer business or confidence, subject us to regulatory scrutiny or exposeus to litigation or other financial liability, any of which could materially affect us, including our results of operations. Third party vendors provide key components of TCF's business infrastructure, such as internet connections, networkaccess and transaction and other processing services. While TCF has selected these third party vendors carefully, itdoes not control their actions. Any problems experienced or caused by these third parties, including inadequate orinterrupted service, could adversely affect TCF's ability to process, record or monitor transactions, or to deliver productsand services to its customers and to conduct its business. Replacing these third party vendors could also entailsignificant delay and expense.
TCF also may be subject to disruptions of its operating systems arising from events that are wholly or partially beyondits control, which may include, for example, computer viruses, electrical or telecommunications outages, naturaldisasters, terrorist acts or other damage to property or physical assets. Such disruptions may give rise to loss ofservices to customers and loss or liability to TCF. Any system failure could have a material adverse effect on TCF'sfinancial condition and results of operations. If any of TCF's financial, accounting or other data processing systemsfail or if personal information of TCF's customers or clients were mishandled or misused (whether by employees orcounterparties), TCF could suffer regulatory consequences, reputational damage and financial losses, any of whichcould have a material adverse effect on its financial condition and results of operations.
9

TCF faces cyber-security and other external risks, including "denial of service," "hacking," "ransomware" and "identitytheft," that could adversely affect TCF's reputation and could have a material adverse effect on TCF's financial conditionand results of operations. TCF's computer systems and network infrastructure present security risks and could be susceptible to cyber-attacks,such as denial of service attacks, hacking, terrorist activities or identity theft. Hacking and identity theft risks, in particular,could cause serious financial and reputational harm. Cyber threats are rapidly evolving and TCF may not be able toanticipate or prevent all such attacks. While TCF does not believe it has experienced a material cyber-security breach,TCF experiences periodic threats to its data and systems, including malware and computer virus attacks, attemptedunauthorized access of accounts and attempts to disrupt its systems. TCF may incur increasing costs in an effort tominimize these risks, could be held liable for and could suffer reputational damage as a result of any security breachor loss. In addition, there have been increasingly sophisticated and large-scale efforts on the part of third parties to breachdata security with respect to financial transactions, including by intercepting account information at locations wherecustomers make purchases or withdraw money, as well as through the use of social engineering schemes such as"phishing." For example, many retailers have reported data breaches resulting in the loss of customer information andmany financial institutions have experienced losses as account information has been stolen through the use of skimmersplaced on ATMs and point of sale terminals. In the event that third parties are able to misappropriate financial informationof TCF's customers, even if such breaches take place due to weaknesses in other parties' security protections, TCFcould suffer reputational damage or financial losses which could have a material adverse effect on its financial conditionand results of operations.
The success of TCF's supermarket branches depends on the continued long-term success and viability of TCF'ssupermarket partners, TCF's ability to maintain licenses or lease agreements for its supermarket locations and customerpreferences. A significant financial decline or change in ownership involving one of TCF's supermarket partners, including Jewel-Osco or SUPERVALU Inc., could result in the loss of supermarket branches or could increase costs to operate thesupermarket branches. At December 31, 2017, TCF had 128 supermarket branches. Supermarket banking continuesto play an important role in TCF's deposit account strategy. TCF is subject to the risk, among others, that its licenseor lease for a location or locations will terminate upon the sale or closure of that location or locations by the supermarketpartner or that we may not be able to renew branch leases with our supermarket partners on favorable terms, or atall.
Also, difficult economic conditions, financial or labor difficulties in the supermarket industry, or a decrease in customerutilization of traditional bank branches may reduce activity in TCF's supermarket branches. Although utilization of thesebranches may decrease, the nature of these leases with our supermarket partners generally do not allow us to terminatesignificant numbers of individual branches. Because these leases are generally all renewed together, in the event ofa decrease in customer utilization there may be limited opportunities to terminate unprofitable branch leases. Any ofthe above risks could have a material adverse effect on TCF's financial condition and results of operations.
New lines of business or new products and services may subject TCF to additional risk.
From time to time, TCF may implement new lines of business or offer new products and services within existing linesof business. There are substantial risks and uncertainties associated with these efforts, particularly in instances wherethe markets are not fully developed. In developing and marketing new lines of business and new products or services,TCF may invest significant time and resources. Initial timetables for the introduction and development of new lines ofbusiness and new products or services may not be achieved and price and profitability targets may not prove feasible.External factors, such as compliance with regulations, competitive alternatives and shifting market preferences mayalso impact the successful implementation of a new line of business or a new product or service. Furthermore, anynew line of business or new product or service could have a significant impact on the effectiveness of TCF's systemof internal controls. Failure to successfully manage these risks in the development and implementation of new linesof business and new products or services could have a material adverse effect on TCF's financial condition and resultsof operations.
10
Increased competition in the already highly competitive financial services industry could have a material adverse effecton TCF's financial condition and results of operations. The financial services industry is highly competitive and could become even more competitive as a result of legislative,regulatory and technological changes, as well as continued industry consolidation, which may increase in connectionwith current economic and market conditions. TCF competes with other commercial banks, savings and loanassociations, mutual savings banks, finance companies, mortgage banking companies, credit unions and investmentcompanies. In addition, technology has lowered barriers to entry and made it possible for non-banks to offer productsand services traditionally only provided by banks, such as providing loans through peer-to-peer lending. Some of TCF'scompetitors have fewer regulatory constraints or lower cost structures. Also, the potential need to adapt to industrychanges in information technology systems, on which TCF and the financial services industry generally highly depend,could present operational issues and require considerable capital spending. Further, decreased underwriting standardsof competitors may result in lower interest rates on loans originated by TCF or lower loan volumes originated by TCF.As a result, any increased competition in the already highly competitive financial services industry could have a materialadverse effect on TCF's financial condition and results of operations.
The allowance for loan and lease losses maintained by TCF may not be sufficient to cover actual losses experiencedby TCF and losses in excess of TCF's allowance could have a material adverse effect on TCF's financial conditionand results of operations. TCF maintains an allowance for loan and lease losses, which is a reserve established through a provision for loan andlease losses charged to expense, which represents management's best estimate of probable credit losses incurredwithin the existing portfolio of loans and leases. The level of the allowance for loan and lease losses reflectsmanagement's continuing evaluation of industry concentrations, specific credit risks, loan and lease loss experience,current loan and lease portfolio quality, present economic, political and regulatory conditions and unidentified lossesin the current loan and lease portfolio. The determination of the appropriate level of the allowance for loan and leaselosses involves a high degree of subjectivity and requires management to make significant estimates of current creditrisks using qualitative and quantitative factors, each of which is subject to significant change. Changes in economicconditions affecting customers, new information regarding existing loans and leases, identification of additional problemloans and leases, lower than expected recoveries in the case of default and other factors may require an increase inthe allowance for loan and lease losses. In addition, federal banking regulators periodically review TCF's allowancefor loan and lease losses and may require an increase in the provision for loan and lease losses or the recognition ofadditional loan and lease charge-offs, based on judgments different than those of management. An increase in theallowance for loan and lease losses would result in a decrease in net income, and possibly risk-based capital, andcould have a material adverse effect on TCF's financial condition and results of operations.
TCF is subject to extensive government regulation and supervision, and changes in applicable laws and regulations,or their enforcement, could have a material adverse effect on TCF's financial results.
TCF Financial, its subsidiary TCF Bank and certain indirect subsidiaries are subject to extensive federal and stateregulation and supervision. Banking regulations are primarily intended to protect bank customers, depositors' funds,federal deposit insurance funds and the banking system as a whole, not stockholders. These regulations affect TCF'srevenues, lending practices, capital structure, investment practices, dividend policy and growth, among other things.Congress and federal regulators continually review banking laws, regulations and policies for possible changes. Manynew banking rules are issued with limited interpretive guidance.
11

Future changes in regulations, regulatory policies, interpretation and enforcement of statutes, regulations or policiescould result in reduced revenues, increased compliance burdens, additional costs, limits on the types of financialservices and products we may offer or increased competition from non-banks offering competing financial servicesand products, among other things. Future legislative and regulatory initiatives cannot be fully or accurately predicted.Such proposals may impose more stringent standards than currently applicable or anticipated with respect to capitaland liquidity requirements for depository institutions. For example, the CFPB has examination and enforcementauthority over TCF Bank and its subsidiaries, and broad rulemaking authority to administer and carry out the purposesand objectives of the federal consumer financial laws with respect to all financial institutions that offer financial productsand services to consumers. The CFPB is authorized to make rules identifying and prohibiting acts or practices thatare unfair, deceptive or abusive in connection with any transaction with a consumer for a consumer financial productor service, or the offering of a consumer financial product or service. Uncertainties remain concerning how the term"abusive" will be enforced. In recent years there has been an increase in the frequency of enforcement actions broughtby federal banking regulators, such as the CFPB, dealing with matters such as indirect auto lending, fair lending,account fees, loan servicing and other products and services provided to customers.
For example, on January 19, 2017, the CFPB filed a civil lawsuit against TCF Bank in the United States District Courtfor the District of Minnesota (the "Court"), captioned Consumer Financial Protection Bureau v. TCF National Bank,alleging violations of the Consumer Financial Protection Act ("CFPA") and Regulation E §1005.17, in connection withTCF Bank's practices administering checking account overdraft program "opt-in" requirements from 2010 to early2014. In its complaint, the CFPB seeks, among other relief, redress for consumers, injunctive relief and unspecifiedpenalties. On September 8, 2017, the Court issued a ruling on the motion made by TCF Bank to dismiss the complaintof the CFPB. In its ruling, the Court granted TCF Bank's motion to dismiss the CFPB's Regulation E claims and alsodismissed the CFPB's unfair, deceptive and abusive conduct claims under the CFPA for periods prior to July 21, 2011.The Court did not grant TCF Bank's motion to dismiss CFPA claims for periods on or after July 21, 2011. TCF Bankrejects the claims made by the CFPB in its complaint and intends to continue to vigorously defend against the CFPB'sallegations. However, the ultimate resolution of this lawsuit and any other proceeding, action or matter arising fromthe same or similar facts or practices is uncertain, and this lawsuit and any other such proceedings, actions or mattersmay result in costs, losses, fines, penalties, restitution, injunctive relief, changes to our business practices and regulatoryscrutiny, enforcement or restrictions which, individually or in the aggregate, could have a material adverse effect onour reputation, results of operations, cash flows, financial position, ability to offer certain products and business andprospects generally.
While TCF has policies and procedures designed to prevent violations of laws, regulations and regulatory policies,and to ensure compliance with new or changed laws, regulations and regulatory policies, there can be no assurancethat violations will not occur and failure to comply could result in reputational damage, remediation, disgorgement,penalties, other monetary relief, injunctive relief or changes to TCF's business practices or operations, any of whichcould have a material adverse effect on its financial condition and results of operations.
TCF's earnings are significantly affected by the fiscal and monetary policies of the federal government and its agencies,as well as other legal changes affecting businesses and consumers. The policies of the Federal Reserve impact TCF significantly. The Federal Reserve regulates the supply of money andcredit in the U.S. Its policies directly and indirectly influence the rate of interest earned on loans and leases and paidon borrowings and interest-bearing deposits, and also affect the value of financial instruments that TCF holds. Thosepolicies determine, to a significant extent, the cost of funds for lending and investing. Changes in those policies arebeyond TCF's control and are difficult to predict. Federal Reserve policies can also affect TCF's borrowers, potentiallyincreasing the risk that they may fail to repay their loans or leases. For example, a tightening of the money supply bythe Federal Reserve could increase unemployment or reduce the demand for a borrower's products and services.This could adversely affect the borrower's earnings and ability to repay its loan or lease. As a result, changes to thefiscal and monetary policies by the Federal Reserve could have a material adverse effect on TCF's financial conditionand results of operations.
In addition, legal changes affecting consumers and businesses, including the deductibility or other tax attributesassociated with certain products, may significantly decrease the demand for certain products that we offer. For example,Tax Reform limits the tax deductibility of interest paid on home equity loans to those loans used to purchase orsubstantially improve qualified residences, which may decrease consumer demand for such loan products.
12

TCF's framework for managing risks may not be effective in mitigating risk and any resulting loss.
TCF's risk management framework seeks to mitigate risk and any resulting loss. TCF has established processesintended to identify, measure, monitor, report and analyze the types of risk to which TCF is subject, including legal andcompliance, operational, reputational, strategic and market risk such as interest rate, credit, liquidity and foreigncurrency risk. However, as with any risk management framework, there are inherent limitations to TCF's riskmanagement strategies. There may exist, or develop in the future, risks that TCF has not appropriately anticipated oridentified. Any future breakdowns in TCF's risk management framework could have a material adverse effect on itsfinancial condition and results of operations.
Damage to TCF's reputation could have a material adverse effect on TCF’s financial results.
Reputational risk, or the risk to earnings and capital from negative public opinion, is inherent in TCF's business. Negativepublic opinion could adversely affect TCF's ability to keep and attract employees and customers and expose it toadverse legal and regulatory consequences. Negative public opinion could result from TCF's actual or alleged conductin any number of activities, including lending practices, corporate governance, regulatory compliance, mergers andacquisitions, disclosure, sharing or inadequate protection of customer information or from actions taken by governmentregulators and community organizations in response to such conduct, and could be exacerbated by negative publicity.Because TCF conducts most of its businesses under the "TCF" brand, negative public opinion about one businesscould affect all of TCF's businesses.
Failure to keep pace with technological change could adversely affect TCF's business. The financial services industry is continually undergoing rapid technological change with frequent introductions of newtechnology-driven products and services. TCF's future success depends, in part, upon its ability to address the needsof its customers by using technology to provide products and services that will satisfy customer demands, as well asto create additional efficiencies in its operations. Many of TCF's competitors have substantially greater resources toinvest in technological improvements. TCF may not be able to effectively implement new technology-driven productsand services or be successful in marketing these products and services to its customers. Failure to successfully keeppace with technological change affecting the financial services industry could have a material adverse effect on TCF'sfinancial condition and results of operations.
The Company is subject to certain risks related to originating and selling loans that could have a material adverseeffect on TCF's financial condition and results of operations.
TCF relies on the sale of loans to generate earnings and manage its liquidity and capital levels, as well as geographicaland product diversity in its loan portfolio. Disruptions in the financial markets, decrease in demand for loans which wesell, changes to laws or regulations that reduce the attractiveness of such loans to purchasers of the loans or a decreasein the willingness of purchasers to purchase loans from TCF, or in general, could require TCF to decrease its lendingactivities or retain a greater portion of the loans it originates. Selling fewer loans would result in a decrease in the gainsrecognized on the sale of loans, would decrease TCF's capital ratios as a result of the increase of risk weighted assets,could result in decreased liquidity and could result in increased credit risk as TCF's loan portfolio increased in size,any of which could have a material adverse effect on TCF's financial condition and results of operations. The structure of certain loan sales may result in the retention of credit risk. TCF may receive interest-only strips inconnection with certain of its loan sales. The interest-only strip is recorded at fair value, which represents the presentvalue of future cash flows expected to be received by TCF. The value of these interest-only strips may be affected byfactors such as changes in the behavior patterns of customers (including defaults and prepayments), changes in thestrength of the economy and developments in the interest rate markets; therefore, actual performance may differ fromTCF's expectations. The impact of such factors could have a material adverse effect on the value of these interest-only strips and on TCF's financial condition and results of operations.
13

When loans are sold or securitized, it is customary to make representations, warranties and covenants to the purchaseror investors about the loans, including the manner in which they were originated and will be serviced. These agreementsgenerally require the repurchase of loans or indemnification in the event TCF breaches these representations,warranties or covenants and such breaches are not cured. In addition, some agreements contain a requirement torepurchase loans as a result of early payoffs by the borrower, early payment default of the borrower or the failure toobtain valid title. TCF has not made significant repurchases of sold loans. A material increase in the amount of loansrepurchased could have a material adverse effect on TCF's financial condition and results of operations.
Financial institutions depend on the accuracy and completeness of information about customers and counterparties. In deciding whether to extend credit or enter into other transactions, TCF may rely on information furnished by or onbehalf of customers and counterparties, including financial statements, credit reports and other financial information.TCF may also rely on representations of those customers, counterparties or other third parties, such as independentauditors, as to the accuracy and completeness of that information. Reliance on inaccurate or misleading financialstatements, credit reports or other financial information could cause TCF to enter into unfavorable transactions whichcould have a material adverse effect on TCF's financial condition and results of operations.
The failure to attract and retain key personnel could have a material adverse effect on TCF's financial condition andresults of operations. TCF's success depends to a large extent upon its key personnel, including its ability to attract and retain such personnel.The loss of key personnel could have a material adverse impact on TCF's business because of their skills, marketknowledge, industry experience and the difficulty of promptly finding qualified replacements. Additionally, portions ofTCF's business are relationship driven and many of TCF's key personnel have extensive customer relationships. Lossof key personnel to a competitor could result in the loss of some of TCF's customers. As a result, a failure to attractand retain key personnel could have a material adverse effect on TCF's financial condition and results of operations.
Acquisitions may disrupt TCF's business and dilute stockholder value.
TCF regularly evaluates merger and acquisition opportunities and conducts due diligence activities related to possibletransactions with banks or other financial institutions. As a result, negotiations may take place and future mergers oracquisitions involving cash, debt or equity securities may occur at any time. Acquiring other banks, businesses orbranches involves various risks, such as: difficulty in estimating the value of the target company; payment of a premiumover book and market values that may dilute TCF's tangible book value and earnings per share in the short- and long-term; potential exposure to unknown or contingent liabilities of the target company; exposure to potential asset qualityissues of the target company; volatility in reported income as goodwill impairment losses could occur irregularly andin varying amounts; difficulty and expense of integrating the operations and personnel of the target company; inabilityto realize the expected revenue increases, cost savings, increases in geographic or product presence or other projectedbenefits; potential disruption to TCF's business; potential diversion of TCF management's time and attention; potentialloss of key employees and customers of TCF or the target company; and potential changes in banking or tax laws orregulations that may affect the target company, any of which could have a material adverse effect on TCF's financialcondition and results of operations.
Consumers may decide not to use banks to complete their financial transactions.
Technology and other changes are allowing consumers to complete financial transactions through alternative methodsthat historically have involved banks. For example, consumers can now maintain funds that would have previouslybeen held as traditional bank deposits in brokerage accounts, online bank accounts, mutual funds or general-purposereloadable prepaid cards. Consumers can also complete transactions such as paying bills, transferring funds andobtaining loans directly without the assistance of banks. The process of eliminating banks as intermediaries couldresult in the loss of fee income, as well as the loss of customer deposits and the related income generated from thosedeposits. The loss of these revenue streams and the loss of lower-cost deposits as a source of funds could have amaterial adverse effect on TCF's financial condition and results of operations.
14
Changes in accounting policies or in accounting standards could materially affect how TCF reports its financial conditionand results of operations. TCF's accounting policies are fundamental to the understanding of its financial condition and results of operations.Some of these policies require the use of estimates and assumptions that may affect the value of TCF's assets orliabilities and results of operations. Some of TCF's accounting policies are critical because they require managementto make difficult, subjective and complex judgments about matters that are inherently uncertain and because materiallydifferent amounts would be reported if different estimates or assumptions were used. If such estimates or assumptionsunderlying the financial statements are incorrect, TCF could experience material losses. From time to time the FinancialAccounting Standards Board and the SEC change the financial accounting and reporting standards or the interpretationof those standards that govern the preparation of TCF's financial statements. These changes are beyond TCF's control,can be difficult to predict and could materially impact how TCF reports its financial condition and results of operations.Additionally, TCF could be required to apply a new or revised standard retrospectively, resulting in it restating priorperiod financial statements in material amounts.
TCF is subject to examinations and challenges by tax authorities that could adversely affect TCF's results of operationsand financial condition.
TCF is subject to federal, state and foreign income tax regulations, which often require interpretation due to theircomplexity. Changes in income tax regulations, including those resulting from the enactment of Tax Reform, or in howthe regulations are interpreted could have a material adverse effect on TCF's results of operations. In the normalcourse of business, TCF is routinely subject to examinations and challenges from taxing authorities regarding its taxpositions. Taxing authorities have been aggressive in challenging tax positions taken by financial institutions. Thesetax positions may relate to tax compliance, sales and use, franchise, gross receipts, payroll, property and income taxissues, including tax base, apportionment and tax credit planning. These challenges may result in adjustments to thetiming or amount of taxable income or deductions, or the allocation of income among tax jurisdictions. If any suchchallenges are made and are not resolved in TCF's favor, they could have a material adverse effect on TCF's financialcondition and results of operations.
Significant legal actions could subject TCF to substantial uninsured liabilities. TCF can be subject to claims and legal actions related to its operations. These claims and legal actions, includingsupervisory or enforcement actions by TCF's regulators and other government authorities or private litigation, couldresult in large monetary awards or penalties, as well as significant defense costs. While TCF maintains insurancecoverage in amounts and with deductibles that it believes are appropriate for its operations, such insurance does notcover all types of liability, including regulatory fines or penalties, and may not continue to be available to TCF at areasonable cost, or at all. As a result, TCF may be exposed to substantial uninsured liabilities, which could have amaterial adverse effect on TCF's financial condition and results of operations.
In addition, customers may make claims and take legal action pertaining to TCF's deposit products and sale or servicingof its loan and lease products. Whether or not such claims and legal action have merit, they may result in significantfinancial liability and could adversely affect the market perception of TCF and its products and services, as well asimpact customer demand for those products and services. Any financial liability or reputational damage could have amaterial adverse effect on TCF's financial condition and results of operations.
In particular, the financial services industry has increasingly been targeted by lawsuits alleging infringement of patentrights, often from patent holding companies seeking to monetize patents they have purchased or otherwise obtained.Regardless of the scope or validity of such patents or other intellectual property rights, or the merits of any claims bypotential or actual litigants, the Company may have to engage in protracted and costly litigation which may be timeconsuming and disruptive to TCF's operations and management. If the Company is found to infringe on one or morepatents or other intellectual property rights, it may be required to pay substantial damages or royalties to a third-party,or it may be subject to a temporary or permanent injunction prohibiting the Company from utilizing certain technologies.
15

TCF's internal controls may be ineffective.
Management regularly reviews and updates TCF's internal controls, disclosure controls and procedures and corporategovernance policies and procedures. Any system of controls, however well designed and operated, is based in parton certain assumptions and can provide only reasonable, not absolute, assurances that the objectives of the systemare met. Any failure or circumvention of TCF's controls and procedures or failure to comply with regulations related tocontrols and procedures could have a material adverse effect on its financial condition and results of operations.
TCF is subject to environmental liability and risks related to natural disasters that are associated with lending activities.
A significant portion of TCF's loan portfolio is secured by real property. In the ordinary course of business, TCF mayforeclose on and take title to properties securing certain loans. In doing so, there is a risk that hazardous or toxicsubstances could be found on these properties. If hazardous or toxic substances are found, TCF may be liable forremediation costs, as well as for personal injury and property damage. Environmental laws may require TCF to incursubstantial expenses and may materially reduce the affected property's value or limit TCF's ability to use or sell theaffected property. In addition, future laws or more stringent interpretations or enforcement policies with respect toexisting laws may increase TCF's exposure to environmental liability. The remediation costs and any other financialliabilities associated with an environmental hazard could have a material adverse effect on TCF's financial conditionand results of operations.
In addition, severe weather, earthquakes, other natural disasters, pandemics, acts of war or terrorism and other adverseexternal events could have a significant impact on our lending business. Such events could impair the ability of borrowersto repay outstanding loans, impair the value of collateral securing loans, cause significant property damage and/orcause us to incur additional expenses. Because our lending businesses are geographically diverse, those businessesare likely to be impacted more often by natural disasters, including hurricanes, flooding, fires and earthquakes, whichhave caused extensive damage in various parts of the United States in which they conduct business. The occurrenceof any such events could have a material adverse effect on our financial condition and results of operations.
16
Item 1B. Unresolved Staff Comments
None.
Item 2. Properties
Offices TCF owns its headquarters office in Wayzata, Minnesota. Other operations facilities, located in Minnesota,Illinois, California and South Dakota, are either owned or leased. These facilities are predominantly utilized by theConsumer Banking and Wholesale Banking reportable segments. Several facilities in Minnesota are also utilized bythe Enterprise Services reportable segment. At December 31, 2017, TCF owned the buildings and land for 144 of itsbank branch offices, owned the buildings and leased the land for 26 of its bank branch offices and leased or licensedthe remaining 150 bank branch offices, all of which are functional and appropriately maintained and are utilized byboth the Consumer Banking and Wholesale Banking reportable segments. These branch offices are located in Illinois,Minnesota, Michigan, Colorado, Wisconsin, Arizona and South Dakota. For further information on premises andequipment, see Note 8. Premises and Equipment, Net of Notes to Consolidated Financial Statements.

Item 3. Legal Proceedings
From time to time, TCF is a party to legal proceedings arising out of its lending, leasing and deposit operations, includingforeclosure proceedings and other collection actions as part of its lending and leasing collections activities. TCF mayalso be subject to regulatory examinations and enforcement actions brought by federal regulators, including the SEC,the Federal Reserve, the OCC and the CFPB, and TCF's federal regulators may impose sanctions on TCF for failuresrelated to regulatory compliance. From time to time, borrowers and other customers, and employees and formeremployees, have also brought actions against TCF, in some cases claiming substantial damages. TCF and otherfinancial services companies are subject to the risk of class action litigation. Litigation is often unpredictable and theactual results of litigation cannot be determined, and therefore the ultimate resolution of a matter and the possiblerange of loss associated with certain potential outcomes cannot be established. Except as discussed below, basedon our current understanding of TCF's pending legal proceedings, management does not believe that judgments orsettlements arising from pending or threatened legal matters, individually or in the aggregate, would have a materialadverse effect on the consolidated financial position, operating results or cash flows of TCF. On January 19, 2017, the CFPB filed a civil lawsuit against TCF Bank in the United States District Court for the Districtof Minnesota (the "Court"), captioned Consumer Financial Protection Bureau v. TCF National Bank, alleging violationsof the Consumer Financial Protection Act ("CFPA") and Regulation E, §1005.17 in connection with TCF Bank's practicesadministering checking account overdraft program "opt-in" requirements from 2010 to early 2014. In its complaint, theCFPB seeks, among other relief, redress for consumers, injunctive relief and unspecified penalties. On September 8,2017, the Court issued a ruling on the motion made by TCF Bank to dismiss the complaint of the CFPB. In its ruling,the Court granted TCF Bank's motion to dismiss the CFPB's Regulation E claims and also dismissed the CFPB's unfair,deceptive and abusive conduct claims under the CFPA for periods prior to July 21, 2011. The Court did not grant TCFBank's motion to dismiss CFPA claims for periods on or after July 21, 2011. TCF Bank rejects the claims made by theCFPB in its complaint and intends to continue to vigorously defend against the CFPB's allegations. However, theultimate resolution of this lawsuit and any other proceeding, action or matter arising from the same or similar facts orpractices is uncertain, and this lawsuit and any other such proceedings, actions or matters may result in costs, losses,fines, penalties, restitution, injunctive relief, changes to our business practices and regulatory scrutiny, enforcementor restrictions which, individually or in the aggregate, could have a material adverse effect on our reputation, resultsof operations, cash flows, financial position, ability to offer certain products and business and prospects generally.
17
Item 4. Mine Safety Disclosures Not applicable.

Part II
18
Item 5. Market for Registrant's Common Equity, Related Stockholder Matters and Issuer Purchases of EquitySecurities
TCF's common stock trades on the New York Stock Exchange under the symbol "TCF." As of February 20, 2018, therewere 5,438 holders of record of TCF's common stock. The high and low prices and the dividends declared for TCF'scommon stock were as follows:
High LowDividends Declared
2017:Fourth Quarter $ 21.29 $ 16.71 $ 0.075Third Quarter 17.20 14.58 0.075Second Quarter 17.47 14.89 0.075First Quarter 20.03 15.33 0.075
2016:Fourth Quarter $ 19.97 $ 13.73 $ 0.075Third Quarter 14.78 11.72 0.075Second Quarter 14.48 11.62 0.075First Quarter 13.97 10.37 0.075
The Board of Directors of TCF Financial and TCF Bank have each adopted a Capital Adequacy and Dividend Policy.The policies define how enterprise risk related to capital will be managed, how the adequacy of capital will be measuredand the process by which capital strategy, capital management and preferred and common stock dividendrecommendations will be presented to TCF's Board of Directors. TCF management is charged with ensuring thatcapital strategy actions, including the declaration of preferred and common stock dividends, are prudent, efficient andprovide value to TCF's stockholders, while ensuring that past and prospective earnings retention is consistent withTCF's capital needs, asset quality, risk profile and overall financial condition. The Board of Directors intends to continueits practice of paying quarterly cash dividends on TCF's common stock as justified by the financial condition of TCF.The declaration and amount of future dividends will depend on circumstances existing at the time, including TCF'searnings, level of internally generated common capital excluding earnings, financial condition and capital requirements,the cash available to pay such dividends (derived mainly from dividends and distributions from TCF Bank), as well asregulatory and contractual limitations and such other factors as the Board of Directors may deem relevant. Dividendsfor the current dividend period on all outstanding shares of preferred stock must be declared and paid or declared anda sum sufficient for the payment thereof must be set aside before any dividend may be declared or paid on TCF'scommon stock. In general, TCF Bank may not declare or pay a dividend to TCF Financial in excess of 100% of its netretained earnings for the current year combined with its net retained earnings for the preceding two calendar yearswithout prior approval of the OCC. Restrictions on the ability of TCF Bank to pay cash dividends or possible diminishedearnings of TCF may limit the ability of TCF Financial to pay dividends in the future to holders of its preferred andcommon stock. In addition, the ability of TCF Financial and TCF Bank to pay dividends depends on regulatory policiesand capital requirements and may be subject to regulatory approval. See "Item 1. Business - Regulation - RegulatoryCapital Requirements", "Item 1. Business - Regulation - Restrictions on Distributions", Note 16. Regulatory CapitalRequirements and Note 25. Parent Company Financial Information of Notes to Consolidated Financial Statements.

Total Return Performance
The following chart compares the cumulative total stockholder return on TCF common stock over the last five fiscalyears with the cumulative total return of the Standard and Poor's ("S&P") 500 Index and the KBW NASDAQ RegionalBanking Index (assuming the investment of $100 in each index on December 31, 2012 and reinvestment of alldividends).
TCF Total Stock Return Performance Chart
250
200
150
100
50
Inde
xVa
lue
12/31/2012 12/31/2013 12/31/2014 12/31/2015 12/31/2016 12/31/2017
u TCF Financial Corporation p S&P 500 Index l KBW NASDAQ Regional Banking Index
Year Ended December 31,Index 2012 2013 2014 2015 2016 2017TCF Financial Corporation $ 100.00 $ 135.58 $ 134.27 $ 121.03 $ 171.78 $ 183.13S&P 500 Index 100.00 132.39 150.51 152.59 170.84 208.14KBW NASDAQ Regional Banking Index 100.00 146.85 150.41 159.31 221.46 225.34Source: S&P Global Market Intelligence.
19

Repurchases of TCF Stock
Share repurchase activity for the quarter ended December 31, 2017 was as follows:
Period
Total Numberof SharesPurchased
AveragePrice PaidPer Share
Total Number of SharesPurchased as Part of
Publicly Announced Plan
Approximate Dollar Value (orMaximum Number) of
Shares that May Yet BePurchased Under the Plan
October 1 to October 31, 2017Share repurchase program(1) — $ — — 5,384,130Employee transactions(2) 1,405 $ 17.08 N.A. N.A.
November 1 to November 30, 2017Share repurchase program(3) — $ — — $ 150,000,000Employee transactions(2) — $ — N.A. N.A.
December 1 to December 31, 2017Share repurchase program(3) 446,464 $ 20.51 446,464 $ 140,843,494Employee transactions(2) — $ — N.A. N.A.
TotalShare repurchase program(3) 446,464 $ 20.51 446,464 $ 140,843,494Employee transactions(2) 1,405 $ 17.08 N.A. N.A.
N.A. Not Applicable(1) Prior to November 27, 2017, the share repurchase authorization was approved by the Board of Directors on April 14, 2007 and was announced in a press release
dated April 16, 2007. The authorization was for a repurchase of up to an additional 5% of TCF's common stock outstanding at the time of the authorization, or 6.5million shares. This plan has been replaced by the current share repurchase authorization approved and announced on November 27, 2017.
(2) Represents restricted stock withheld pursuant to the terms of awards granted under either the TCF Financial Incentive Stock Program or the TCF Financial 2015Omnibus Incentive Plan to offset tax withholding obligations that occur upon vesting and release of restricted stock. Both plans provide that the value of shareswithheld shall be the average of the high and low prices of common stock of TCF Financial Corporation on the date the relevant transaction occurs.
(3) The current share repurchase authorization was approved by the Board of Directors and announced in a press release on November 27, 2017. The authorizationwas for a repurchase of up to $150.0 million in aggregate value of shares of TCF's common stock. Future repurchases will be based on market conditions, thetrading price of TCF shares and other factors. The ability to repurchase shares in the future may be adversely affected by new legislation or regulations or bychanges in regulatory policies. This authorization may be commenced or suspended at any time or from time to time.
20

Item 6. Selected Financial Data
The selected five-year financial summary presented below should be read in conjunction with the Consolidated FinancialStatements and related notes. Historical data is not necessarily indicative of TCF's future results of operations orfinancial condition. See "Item 1A. Risk Factors."
Five-Year Financial Summary
At or For the Year Ended December 31,(Dollars in thousands, except per-share data) 2017 2016 2015 2014 2013Consolidated Income:
Net interest income $ 925,238 $ 848,106 $ 820,388 $ 815,629 $ 802,624Non-interest income 448,299 465,900 441,998 433,267 404,058
Total revenue 1,373,537 1,314,006 1,262,386 1,248,896 1,206,682Provision for credit losses 68,443 65,874 52,944 95,737 118,368Non-interest expense 1,059,934 909,887 894,747 871,777 845,269
Income before income tax expense (benefit) 245,160 338,245 314,695 281,382 243,045Income tax expense (benefit) (33,624) 116,528 108,872 99,766 84,345Income attributable to non-controlling interest 10,147 9,593 8,700 7,429 7,032
Net income attributable to TCF FinancialCorporation 268,637 212,124 197,123 174,187 151,668
Preferred stock dividends 19,904 19,388 19,388 19,388 19,065Impact of preferred stock redemption 5,779 — — — —
Net income available to common stockholders $ 242,954 $ 192,736 $ 177,735 $ 154,799 $ 132,603Earnings per common share:
Basic $ 1.44 $ 1.15 $ 1.07 $ 0.95 $ 0.82Diluted $ 1.44 $ 1.15 $ 1.07 $ 0.94 $ 0.82
Dividends declared $ 0.30 $ 0.30 $ 0.225 $ 0.20 $ 0.20Consolidated Financial Condition:
Loans and leases $ 19,104,460 $ 17,843,827 $ 17,435,999 $ 16,401,646 $ 15,846,939Total assets 23,002,159 21,441,326 20,689,609 19,393,656 18,378,769Deposits 18,335,002 17,242,522 16,719,989 15,449,882 14,432,776Borrowings 1,249,449 1,077,572 1,039,938 1,235,535 1,487,172Total equity 2,680,584 2,444,645 2,306,917 2,135,364 1,964,759Book value per common share 13.96 12.66 11.94 11.10 10.23
Financial Ratios:Return on average assets 1.26% 1.05% 1.03% 0.96% 0.87%Return on average common equity 10.80 9.13 9.19 8.71 8.12Net interest margin(1) 4.54 4.34 4.42 4.61 4.68Average total equity to average assets 11.50 11.36 11.15 10.89 10.46Dividend payout ratio 20.83 26.09 21.03 21.28 24.30
Credit Quality Ratios:Non-accrual loans and leases as a percentage of total
loans and leases 0.62% 1.02% 1.15% 1.32% 1.75%Non-accrual loans and leases and other real estate
owned as a percentage of total loans and leasesand other real estate owned 0.72 1.28 1.43 1.71 2.17
Allowance for loan and lease losses as a percentageof total loans and leases 0.90 0.90 0.90 1.00 1.59
Net charge-offs as a percentage of average loans andleases 0.24 0.26 0.30 0.49 0.81
(1) Net interest income on a fully tax-equivalent basis divided by average interest-earning assets.
21
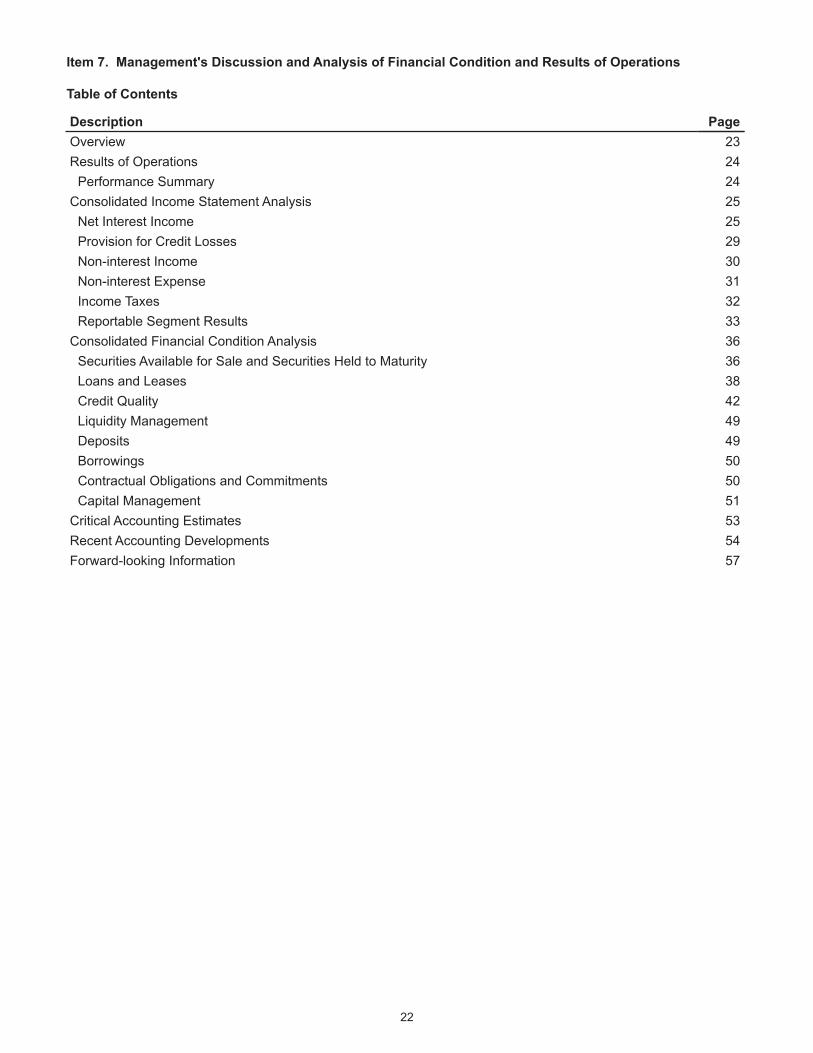
Item 7. Management's Discussion and Analysis of Financial Condition and Results of Operations
Table of Contents
Description PageOverview 23Results of Operations 24
Performance Summary 24Consolidated Income Statement Analysis 25
Net Interest Income 25Provision for Credit Losses 29Non-interest Income 30Non-interest Expense 31Income Taxes 32Reportable Segment Results 33
Consolidated Financial Condition Analysis 36Securities Available for Sale and Securities Held to Maturity 36Loans and Leases 38Credit Quality 42Liquidity Management 49Deposits 49Borrowings 50Contractual Obligations and Commitments 50Capital Management 51
Critical Accounting Estimates 53Recent Accounting Developments 54Forward-looking Information 57
22

Management's discussion and analysis of the consolidated financial condition and results of operations of TCF FinancialCorporation should be read in conjunction with "Part I, Item 1A. Risk Factors," "Item 6. Selected Financial Data" and"Item 8. Consolidated Financial Statements."
Overview
TCF Financial Corporation (together with its direct and indirect subsidiaries, "we," "us," "our," "TCF" or the "Company"),a Delaware corporation, is a national bank holding company based in Wayzata, Minnesota. References herein to "TCFFinancial" or the "Holding Company" refer to TCF Financial Corporation on an unconsolidated basis. Its principalsubsidiary, TCF National Bank ("TCF Bank"), is headquartered in Sioux Falls, South Dakota. At December 31, 2017,TCF had 320 bank branches in Illinois, Minnesota, Michigan, Colorado, Wisconsin, Arizona and South Dakota (TCF'sprimary banking markets).
TCF provides convenient financial services through multiple channels in its primary banking markets. TCF hasdeveloped products and services designed to meet the specific needs of the largest consumer segments in the market.The Company focuses on attracting and retaining customers through service and convenience, including selectlocations open seven days a week with extended hours and on most holidays, full-service supermarket branches,access to automated teller machine ("ATM") networks and digital banking channels. TCF's philosophy is to generateinterest income, fees and other revenue growth through business lines that emphasize higher yielding assets and lowinterest cost deposits. TCF's growth strategies include organic growth in existing businesses, development of newproducts and services, new customer acquisition and acquisitions of portfolios or businesses. New products andservices are designed to build on existing businesses and expand into complementary products and services throughstrategic initiatives. Funded generally through retail deposit generation, TCF continues to focus on profitable assetgrowth.
Net interest income, the difference between interest income earned on loans and leases, securities, investments andother interest-earning assets (interest income) and interest paid on deposits and borrowings (interest expense),represented 67.4% of TCF's total revenue for 2017, compared with 64.5% and 65.0% for 2016 and 2015, respectively.Net interest income can change significantly from period to period based on interest rates, customer prepaymentpatterns, the volume and mix of interest-earning assets and the volume and mix of interest-bearing and non-interestbearing deposits and interest-bearing borrowings. TCF manages the risk of changes in interest rates on its net interestincome through a management Asset & Liability Committee and through related interest rate risk monitoring andmanagement policies. See "Part I, Item 1A. Risk Factors" and "Part II, Item 7A. Quantitative and Qualitative Disclosuresabout Market Risk" for further discussion.
Non-interest income is a significant source of revenue for TCF and an important component of TCF's results ofoperations. The significant components of non-interest income are from leasing and equipment finance and fees andservice charges. The leasing and equipment finance business generates non-interest income primarily from operatingleases and sales-type leases. Providing a wide range of consumer banking services is an integral component of TCF'sbusiness philosophy. Primary drivers of bank fees and service charges include the number of customers we attract,the customers' level of engagement and the frequency with which the customer uses our solutions.
As an effort to diversify TCF's non-interest income sources and manage credit concentration risk, TCF sells loans,primarily in consumer real estate, which result in gains on sales, as well as servicing fee income. Primary drivers ofgains on sales include TCF's ability to originate loans held for sale, identify loan buyers and execute loan sales. TCFimplemented changes to its auto finance business strategy in 2017, transitioning from a partial reliance on gains onsales of loans to an entirely originate-to-hold model effective April 1, 2017 and discontinued auto finance loanoriginations effective December 1, 2017. Over time, this shift may decrease capital and operational risk and will impactnet interest income, provision for credit losses, gains on sales of auto loans and servicing fee income.
The following portions of this Management's Discussion and Analysis of Financial Condition and Results of Operations("Management's Discussion and Analysis") focus in more detail on the results of operations for 2017, 2016 and 2015and on information about TCF's financial condition, loan and lease portfolio, liquidity, funding resources, capital andother matters.
23

Results of Operations
24
Performance Summary TCF reported diluted earnings per common share of $1.44 for 2017, compared with $1.15and $1.07 for 2016 and 2015, respectively. TCF reported net income of $268.6 million for 2017, compared with$212.1 million and $197.1 million for 2016 and 2015, respectively. Net income increased $56.5 million, or 26.6%, in2017 and increased $15.0 million, or 7.6%, in 2016. The increase in net income in 2017 was primarily due to theenactment of the Tax Cuts and Jobs Act ("Tax Reform") on December 22, 2017, partially offset by charges related tothe changes implemented to auto finance's business strategy in 2017. As a result of the enactment of Tax Reform, anestimated net tax benefit of $130.7 million, or 77 cents per common share, was recorded for 2017 resulting primarilyfrom the re-measurement of the Company's estimated net deferred tax liability. Effective April 1, 2017, the Companyexecuted its strategic shift from an originate-to-sell and originate-to-hold model to an entirely originate-to-hold modelfor its auto finance business and effective December 1, 2017, the Company discontinued auto finance loan originations.The determination was based on management's review of strategic alternatives and the financial outlook of the autofinance loan origination business compared with alternative uses of capital. TCF's subsidiary, Gateway One Lending& Finance, LLC, will continue to service existing auto loans on its balance sheet and those serviced for others. Thedecision to discontinue auto finance loan originations resulted in a goodwill impairment charge of $73.0 million, another intangible assets impairment charge of $0.4 million and approximately $14.8 million of expenses related toseverance, other asset impairments and lease termination expenses in 2017. These auto finance items reduced dilutedearnings per common share by 49 cents for 2017. The increase in net income in 2016 was primarily due to revenuegrowth outpacing expenses.
Return on average assets on a fully tax-equivalent basis was 1.26% for 2017, compared with 1.05% and 1.03% for2016 and 2015, respectively. The return on average assets on a fully tax-equivalent basis increased in 2017 and 2016primarily due to increases in net income. Total average assets were $22.1 billion for 2017, compared with $21.1 billionand $19.9 billion for 2016 and 2015, respectively. Total average assets increased $976.6 million, or 4.6%, in 2017 andincreased $1.2 billion, or 6.0%, in 2016. Return on average common equity was 10.80% for 2017, compared with9.13% and 9.19% for 2016 and 2015, respectively. The return on average common equity ratio increased in 2017primarily due to an increase in net income available to common stockholders. The return on average common equityratio decreased in 2016 primarily due to higher average total common equity. Total average common equity was$2.2 billion for 2017, compared with $2.1 billion and $1.9 billion for 2016 and 2015, respectively. Total average commonequity increased $139.0 million, or 6.6%, in 2017 and increased $175.5 million, or 9.1%, in 2016.

Consolidated Income Statement Analysis
25
Net Interest Income Net interest income represented 67.4% of TCF's total revenue for 2017, compared with 64.5%and 65.0% for 2016 and 2015, respectively. Net interest income was $925.2 million for 2017, compared with$848.1 million and $820.4 million for 2016 and 2015, respectively. Net interest income increased $77.1 million, or9.1%, in 2017 and $27.7 million, or 3.4%, in 2016. The average yield on interest-earning assets on a fully tax-equivalentbasis was 5.00%, 4.76% and 4.80% for 2017, 2016 and 2015, respectively. Average interest-earning assets increased$898.2 million, or 4.5%, in 2017 and $1.1 billion, or 6.0%, in 2016. The average rate on interest-bearing liabilities was0.61%, 0.56% and 0.51% for 2017, 2016 and 2015, respectively. Average interest-bearing liabilities increased$564.2 million, or 3.8%, in 2017 and $667.7 million, or 4.7%, in 2016.
The increase in net interest income in 2017 was primarily due to an increase in interest income on loans and leases,partially offset by a decrease in interest income on loans held for sale and an increase in total interest expense. Totalinterest income was $1.0 billion for 2017, compared with $930.7 million for 2016. Total interest income increased$88.3 million, or 9.5%, in 2017 primarily due to higher average balances and increased average yields on commercialloans, increased average yields on auto finance loans, higher average balances and increased average yields oninventory finance loans and higher average balances of leasing and equipment finance loans and leases. Theseincreases were partially offset by lower average balances of consumer real estate loans. Total interest expense was$93.8 million for 2017, compared with $82.6 million for 2016. Total interest expense increased $11.2 million, or 13.5%,in 2017 primarily due to higher average balances of long-term borrowings and increased average rates and higheraverage balances of certificates of deposit, partially offset by lower average rates on money market accounts.
The increase in net interest income in 2016 was primarily due to an increase in interest income on loans and leases,securities available for sale and loans held for sale, partially offset by an increase in interest expense on deposits.Total interest income was $930.7 million for 2016, compared with $891.9 million for 2015. Total interest incomeincreased $38.8 million, or 4.4%, in 2016 primarily due to higher average balances of loans and leases and securitiesavailable for sale, partially offset by a lower average yield on interest-earning assets. Total interest expense was$82.6 million for 2016, compared with $71.5 million for 2015. Total interest expense increased $11.1 million, or 15.5%,in 2016 primarily due to higher interest expense on certificates of deposit due to growth and higher rates paid as aresult of special campaigns to fund interest-earning asset growth.
Net interest income on a fully tax-equivalent basis divided by average interest-earning assets is referred to as the netinterest margin, expressed as a percentage. Net interest income and net interest margin are affected by (i) changesin prevailing short- and long-term interest rates, (ii) loan and deposit pricing strategies and competitive conditions, (iii)the volume and mix of interest-earning assets, non-interest bearing deposits and interest-bearing liabilities, (iv) thelevel of non-accrual loans and leases and other real estate owned and (v) the impact of modified loans and leases. Net interest margin was 4.54% for 2017, compared with 4.34% and 4.42% for 2016 and 2015, respectively. Net interestmargin increased 20 basis points in 2017 and decreased 8 basis points in 2016. The increase in 2017 was primarilydue to overall margin expansion on loans and leases, primarily impacted by interest rate increases, partially offset byhigher average rates on higher average balances of certificates of deposit. The decrease in 2016 was primarily dueto margin compression resulting from the competitive, low interest rate environment and higher rates on certificatesof deposit.

TCF's average balances, interest, and yields and rates on major categories of TCF's interest-earning assets andinterest-bearing liabilities on a fully tax-equivalent basis were as follows:
Year Ended December 31,2017 2016 Change
(Dollars in thousands)AverageBalance Interest(1)
Yieldsand
Rates(1)AverageBalance Interest(1)
Yieldsand
Rates(1)AverageBalance Interest
Yieldsand
Rates(bps)
Assets:Investments and other $ 282,507 $ 10,491 3.71% $ 319,582 $ 9,314 2.91% $ (37,075) $ 1,177 80Securities held to maturity 170,006 4,436 2.61 190,863 4,649 2.44 (20,857) (213) 17Securities available for sale:(2)
Taxable 823,526 18,382 2.23 719,743 16,238 2.26 103,783 2,144 (3)Tax-exempt(3) 712,530 22,916 3.22 495,708 15,900 3.21 216,822 7,016 1
Loans and leases held for sale 208,678 16,606 7.96 479,401 39,648 8.27 (270,723) (23,042) (31)Loans and leases:(4)
Consumer real estate:Fixed-rate 1,934,395 109,185 5.64 2,285,647 130,753 5.72 (351,252) (21,568) (8)Variable- and adjustable-rate 2,961,449 171,671 5.80 2,948,482 156,919 5.32 12,967 14,752 48
Total consumer real estate 4,895,844 280,856 5.74 5,234,129 287,672 5.50 (338,285) (6,816) 24Commercial:
Fixed-rate 977,698 47,587 4.87 972,107 47,445 4.88 5,591 142 (1)Variable- and adjustable-rate 2,455,578 111,886 4.56 2,154,774 85,996 3.99 300,804 25,890 57
Total commercial 3,433,276 159,473 4.64 3,126,881 133,441 4.27 306,395 26,032 37Leasing and equipment finance 4,399,138 202,508 4.60 4,106,718 183,029 4.46 292,420 19,479 14Inventory finance 2,646,500 164,386 6.21 2,414,684 140,453 5.82 231,816 23,933 39Auto finance 3,105,326 152,974 4.93 2,693,041 110,651 4.11 412,285 42,323 82Other 11,149 571 5.11 9,538 548 5.74 1,611 23 (63)
Total loans and leases 18,491,233 960,768 5.20 17,584,991 855,794 4.87 906,242 104,974 33Total interest-earning assets 20,688,480 1,033,599 5.00 19,790,288 941,543 4.76 898,192 92,056 24
Other assets(5) 1,363,487 1,285,127 78,360Total assets $22,051,967 $21,075,415 $ 976,552
Liabilities and Equity:Non-interest bearing deposits:
Retail $ 1,931,856 $ 1,778,707 $ 153,149Small business 925,890 884,192 41,698Commercial and custodial 634,487 585,611 48,876
Total non-interest bearing deposits 3,492,233 3,248,510 243,723Interest-bearing deposits:
Checking 2,541,407 379 0.01 2,452,206 346 0.01 89,201 33 —Savings 4,888,280 4,255 0.09 4,677,517 1,510 0.03 210,763 2,745 6Money market 2,140,553 10,139 0.47 2,488,977 15,114 0.61 (348,424) (4,975) (14)Certificates of deposit 4,495,062 51,239 1.14 4,229,247 44,818 1.06 265,815 6,421 8
Total interest-bearing deposits 14,065,302 66,012 0.47 13,847,947 61,788 0.45 217,355 4,224 2Total deposits 17,557,535 66,012 0.38 17,096,457 61,788 0.36 461,078 4,224 2
Borrowings:Short-term borrowings 5,267 58 1.10 7,051 51 0.73 (1,784) 7 37Long-term borrowings 1,239,433 27,749 2.24 890,846 20,785 2.33 348,587 6,964 (9)
Total borrowings 1,244,700 27,807 2.23 897,897 20,836 2.32 346,803 6,971 (9)Total interest-bearing liabilities 15,310,002 93,819 0.61 14,745,844 82,624 0.56 564,158 11,195 5
Total deposits and borrowings 18,802,235 93,819 0.50 17,994,354 82,624 0.46 807,881 11,195 4Accrued expenses and other liabilities 713,794 686,360 27,434
Total liabilities 19,516,029 18,680,714 835,315Total TCF Financial Corp. stockholders'
equity 2,513,424 2,373,176 140,248Non-controlling interest in subsidiaries 22,514 21,525 989
Total equity 2,535,938 2,394,701 141,237Total liabilities and equity $22,051,967 $21,075,415 $ 976,552
Net interest income and margin $ 939,780 4.54 $ 858,919 4.34 $ 80,861 20(1) Interest and yields are presented on a fully tax-equivalent basis.(2) Average balances and yields of securities available for sale are based on historical amortized cost and exclude equity securities.(3) The yield on tax-exempt securities available for sale is computed on a tax-equivalent basis using a statutory federal income tax rate of 35% for all periods presented.(4) Average balances of loans and leases include non-accrual loans and leases and are presented net of unearned income.(5) Includes leased equipment and related initial direct costs under operating leases of $224.7 million and $140.3 million for 2017 and 2016, respectively.
26

Year Ended December 31,2016 2015 Change
(Dollars in thousands)AverageBalance Interest(1)
Yieldsand
Rates(1)AverageBalance Interest(1)
Yieldsand
Rates(1)AverageBalance Interest
Yieldsand
Rates(bps)
Assets:Investments and other $ 319,582 $ 9,314 2.91% $ 520,577 $ 12,294 2.36% $ (200,995) $ (2,980) 55Securities held to maturity 190,863 4,649 2.44 207,140 5,486 2.65 (16,277) (837) (21)Securities available for sale:(2)
Taxable 719,743 16,238 2.26 564,205 13,930 2.47 155,538 2,308 (21)Tax-exempt(3) 495,708 15,900 3.21 80,894 2,643 3.27 414,814 13,257 (6)
Loans and leases held for sale 479,401 39,648 8.27 286,295 25,766 9.00 193,106 13,882 (73)Loans and leases:(4)
Consumer real estate:Fixed-rate 2,285,647 130,753 5.72 2,710,512 157,428 5.81 (424,865) (26,675) (9)Variable- and adjustable-rate 2,948,482 156,919 5.32 2,911,689 149,770 5.14 36,793 7,149 18
Total consumer real estate 5,234,129 287,672 5.50 5,622,201 307,198 5.46 (388,072) (19,526) 4Commercial:
Fixed-rate 972,107 47,445 4.88 1,173,039 59,037 5.03 (200,932) (11,592) (15)Variable- and adjustable-rate 2,154,774 85,996 3.99 1,961,389 76,677 3.91 193,385 9,319 8
Total commercial 3,126,881 133,441 4.27 3,134,428 135,714 4.33 (7,547) (2,273) (6)Leasing and equipment finance 4,106,718 183,029 4.46 3,804,015 175,565 4.62 302,703 7,464 (16)Inventory finance 2,414,684 140,453 5.82 2,154,357 122,799 5.70 260,327 17,654 12Auto finance 2,693,041 110,651 4.11 2,278,617 94,463 4.15 414,424 16,188 (4)Other 9,538 548 5.74 10,303 712 6.91 (765) (164) (117)
Total loans and leases 17,584,991 855,794 4.87 17,003,921 836,451 4.92 581,070 19,343 (5)Total interest-earning assets 19,790,288 941,543 4.76 18,663,032 896,570 4.80 1,127,256 44,973 (4)
Other assets(5) 1,285,127 1,226,645 58,482Total assets $21,075,415 $19,889,677 $ 1,185,738
Liabilities and Equity:Non-interest bearing deposits:
Retail $ 1,778,707 $ 1,658,951 $ 119,756Small business 884,192 838,758 45,434Commercial and custodial 585,611 507,446 78,165
Total non-interest bearing deposits 3,248,510 3,005,155 243,355Interest-bearing deposits:
Checking 2,452,206 346 0.01 2,396,334 547 0.02 55,872 (201) (1)Savings 4,677,517 1,510 0.03 4,938,303 3,005 0.06 (260,786) (1,495) (3)Money market 2,488,977 15,114 0.61 2,265,121 14,237 0.63 223,856 877 (2)Certificates of deposit 4,229,247 44,818 1.06 3,340,341 30,437 0.91 888,906 14,381 15
Total interest-bearing deposits 13,847,947 61,788 0.45 12,940,099 48,226 0.37 907,848 13,562 8Total deposits 17,096,457 61,788 0.36 15,945,254 48,226 0.30 1,151,203 13,562 6
Borrowings:Short-term borrowings 7,051 51 0.73 18,822 53 0.28 (11,771) (2) 45Long-term borrowings 890,846 20,785 2.33 1,119,175 23,263 2.08 (228,329) (2,478) 25
Total borrowings 897,897 20,836 2.32 1,137,997 23,316 2.05 (240,100) (2,480) 27Total interest-bearing liabilities 14,745,844 82,624 0.56 14,078,096 71,542 0.51 667,748 11,082 5
Total deposits and borrowings 17,994,354 82,624 0.46 17,083,251 71,542 0.42 911,103 11,082 4Accrued expenses and other liabilities 686,360 589,222 97,138
Total liabilities 18,680,714 17,672,473 1,008,241Total TCF Financial Corp. stockholders'
equity 2,373,176 2,197,690 175,486Non-controlling interest in subsidiaries 21,525 19,514 2,011
Total equity 2,394,701 2,217,204 177,497Total liabilities and equity $21,075,415 $19,889,677 $ 1,185,738
Net interest income and margin $858,919 4.34 $825,028 4.42 $ 33,891 (8)(1) Interest and yields are presented on a fully tax-equivalent basis.(2) Average balances and yields of securities available for sale are based on historical amortized cost and exclude equity securities.(3) The yield on tax-exempt securities available for sale is computed on a tax-equivalent basis using a statutory federal income tax rate of 35% for all periods presented.(4) Average balances of loans and leases include non-accrual loans and leases and are presented net of unearned income.(5) Includes leased equipment and related initial direct costs under operating leases of $140.3 million and $104.1 million for 2016 and 2015, respectively.
27

The components of the changes in net interest income on a fully tax-equivalent basis by volume and rate were asfollows:
Year EndedDecember 31, 2017 December 31, 2016
Versus December 31, 2016 Versus December 31, 2015Increase (Decrease) Due to Increase (Decrease) Due to
(In thousands) Volume(1) Rate(1) Total Volume(1) Rate(1) TotalInterest income:
Investments and other $ (1,166) $ 2,343 $ 1,177 $ (5,442) $ 2,462 $ (2,980)Securities held to maturity (530) 317 (213) (415) (422) (837)Securities available for sale:
Taxable 2,318 (174) 2,144 3,588 (1,280) 2,308Tax-exempt 6,974 42 7,016 13,306 (49) 13,257
Loans and leases held for sale (21,553) (1,489) (23,042) 16,026 (2,144) 13,882Loans and leases:
Consumer real estate:Fixed-rate (19,589) (1,979) (21,568) (24,650) (2,025) (26,675)Variable- and adjustable-rate 715 14,037 14,752 1,795 5,354 7,149
Total consumer real estate (18,630) 11,814 (6,816) (22,030) 2,504 (19,526)Commercial:
Fixed-rate 360 (218) 142 (9,963) (1,629) (11,592)Variable- and adjustable-rate 13,001 12,889 25,890 7,496 1,823 9,319
Total commercial 13,913 12,119 26,032 (378) (1,895) (2,273)Leasing and equipment finance 13,326 6,153 19,479 13,635 (6,171) 7,464Inventory finance 14,284 9,649 23,933 14,769 2,885 17,654Auto finance 18,588 23,735 42,323 16,747 (559) 16,188Other 88 (65) 23 (50) (114) (164)
Total loans and leases 46,284 58,690 104,974 26,962 (7,619) 19,343Total interest income 44,754 47,302 92,056 52,032 (7,059) 44,973
Interest expense:Deposits:
Checking 14 19 33 12 (213) (201)Savings 72 2,673 2,745 (152) (1,343) (1,495)Money market (1,924) (3,051) (4,975) 1,342 (465) 877Certificates of deposit 2,979 3,442 6,421 8,843 5,538 14,381
Total deposits 1,768 2,456 4,224 3,620 9,942 13,562Borrowings:
Short-term borrowings (15) 22 7 (48) 46 (2)Long-term borrowings 7,862 (898) 6,964 (5,116) 2,638 (2,478)
Total borrowings 7,801 (830) 6,971 (5,327) 2,847 (2,480)Total interest expense 3,310 7,885 11,195 3,447 7,635 11,082
Net interest income $ 40,815 $ 40,046 $ 80,861 $ 47,783 $ (13,892) $ 33,891(1) Changes attributable to the combined impact of volume and rate have been allocated proportionately to the change due to volume and the change due to rate.
Changes due to volume and rate are calculated independently for each line item presented.
28

Provision for Credit Losses The provision for credit losses is calculated as part of the determination of the allowancefor loan and lease losses, which is a critical accounting estimate. TCF's evaluation of incurred losses is based uponhistorical loss rates multiplied by the respective portfolio's loss emergence period. Factors utilized in the determinationand allocation of the allowance for loan and lease losses and the related provision for credit losses include historicaltrends in loss rates, a portfolio's overall risk characteristics, changes in its character or size, risk rating migration,delinquencies, collateral values, economic outlook and prevailing economic conditions.
The composition of TCF's provision for credit losses was as follows:
Year Ended December 31, Change(Dollars in thousands) 2017 2016 2015 2017 / 2016 2016 / 2015Consumer real estate $(12,318) (18.0)% $ 9,304 14.1% $ 12,697 24.0% $(21,622) N.M. $ (3,393) (26.7)%Commercial 9,098 13.3 2,890 4.4 298 0.6 6,208 N.M. 2,592 N.M.Leasing and equipment
finance 10,067 14.7 7,706 11.7 5,411 10.2 2,361 30.6% 2,295 42.4Inventory finance 1,367 2.0 4,540 6.9 3,036 5.7 (3,173) (69.9) 1,504 49.5Auto finance 56,712 82.9 39,149 59.4 28,943 54.7 17,563 44.9 10,206 35.3Other 3,517 5.1 2,285 3.5 2,559 4.8 1,232 53.9 (274) (10.7)
Total $ 68,443 100.0 % $ 65,874 100.0% $ 52,944 100.0% $ 2,569 3.9 $ 12,930 24.4N.M. Not Meaningful.
TCF's provision for credit losses was $68.4 million for 2017, compared with $65.9 million and $52.9 million for 2016and 2015, respectively. The provision for credit losses increased $2.6 million, or 3.9%, in 2017 and $12.9 million, or24.4%, in 2016. The increase in the provision for credit losses in 2017 was primarily due to increased provision forcredit losses related to the auto finance, commercial and leasing and equipment finance portfolios, partially offset bya decrease in provision for credit losses related to the consumer real estate portfolio. The increase in the provision forcredit losses related to the auto finance portfolio was primarily due to increased net charge-offs and growth as a resultof the reclassification of loans from held for sale to held for investment. The increase in the provision for credit lossesrelated to the commercial and leasing and equipment finance portfolios was primarily due to increased net charge-offs. The decrease in the provision for credit losses related to the consumer real estate portfolio was primarily due tothe recovery of $13.3 million on previous charge-offs related to the non-accrual loans that were sold in the first andthird quarters of 2017 and improving credit quality. The increase in the provision for credit losses in 2016 was primarilydue to the benefit from reduced reserves in 2015 (the allowance as a percent of total loans and leases was 0.90%and 1.00% at December 31, 2015 and 2014, respectively) and growth in the overall loan and lease portfolio, partiallyoffset by decreased net charge-offs.
For further information, see "Consolidated Financial Condition Analysis — Credit Quality" in this Management'sDiscussion and Analysis and Note 7. Allowance for Loan and Lease Losses and Credit Quality Information of Notesto Consolidated Financial Statements.
29
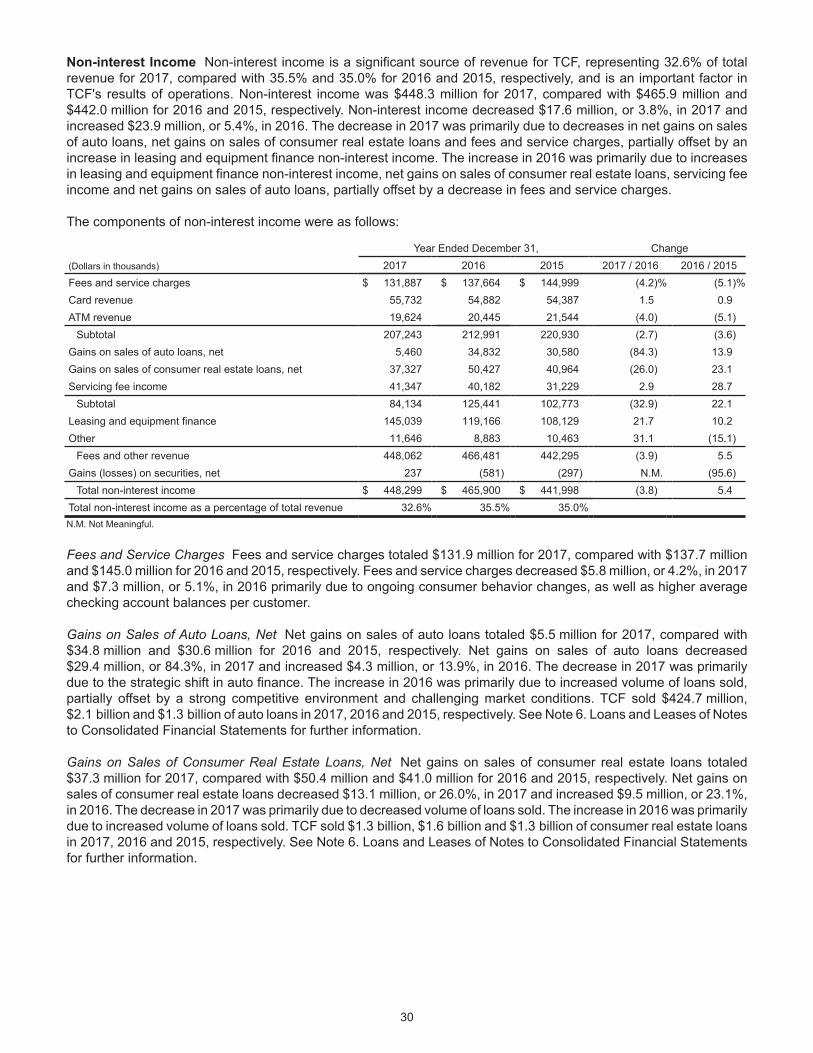
Non-interest Income Non-interest income is a significant source of revenue for TCF, representing 32.6% of totalrevenue for 2017, compared with 35.5% and 35.0% for 2016 and 2015, respectively, and is an important factor inTCF's results of operations. Non-interest income was $448.3 million for 2017, compared with $465.9 million and$442.0 million for 2016 and 2015, respectively. Non-interest income decreased $17.6 million, or 3.8%, in 2017 andincreased $23.9 million, or 5.4%, in 2016. The decrease in 2017 was primarily due to decreases in net gains on salesof auto loans, net gains on sales of consumer real estate loans and fees and service charges, partially offset by anincrease in leasing and equipment finance non-interest income. The increase in 2016 was primarily due to increasesin leasing and equipment finance non-interest income, net gains on sales of consumer real estate loans, servicing feeincome and net gains on sales of auto loans, partially offset by a decrease in fees and service charges.
The components of non-interest income were as follows:
Year Ended December 31, Change(Dollars in thousands) 2017 2016 2015 2017 / 2016 2016 / 2015Fees and service charges $ 131,887 $ 137,664 $ 144,999 (4.2)% (5.1)%Card revenue 55,732 54,882 54,387 1.5 0.9ATM revenue 19,624 20,445 21,544 (4.0) (5.1)
Subtotal 207,243 212,991 220,930 (2.7) (3.6)Gains on sales of auto loans, net 5,460 34,832 30,580 (84.3) 13.9Gains on sales of consumer real estate loans, net 37,327 50,427 40,964 (26.0) 23.1Servicing fee income 41,347 40,182 31,229 2.9 28.7
Subtotal 84,134 125,441 102,773 (32.9) 22.1Leasing and equipment finance 145,039 119,166 108,129 21.7 10.2Other 11,646 8,883 10,463 31.1 (15.1)
Fees and other revenue 448,062 466,481 442,295 (3.9) 5.5Gains (losses) on securities, net 237 (581) (297) N.M. (95.6)
Total non-interest income $ 448,299 $ 465,900 $ 441,998 (3.8) 5.4Total non-interest income as a percentage of total revenue 32.6% 35.5% 35.0%N.M. Not Meaningful.
Fees and Service Charges Fees and service charges totaled $131.9 million for 2017, compared with $137.7 millionand $145.0 million for 2016 and 2015, respectively. Fees and service charges decreased $5.8 million, or 4.2%, in 2017and $7.3 million, or 5.1%, in 2016 primarily due to ongoing consumer behavior changes, as well as higher averagechecking account balances per customer.
Gains on Sales of Auto Loans, Net Net gains on sales of auto loans totaled $5.5 million for 2017, compared with$34.8 million and $30.6 million for 2016 and 2015, respectively. Net gains on sales of auto loans decreased$29.4 million, or 84.3%, in 2017 and increased $4.3 million, or 13.9%, in 2016. The decrease in 2017 was primarilydue to the strategic shift in auto finance. The increase in 2016 was primarily due to increased volume of loans sold,partially offset by a strong competitive environment and challenging market conditions. TCF sold $424.7 million,$2.1 billion and $1.3 billion of auto loans in 2017, 2016 and 2015, respectively. See Note 6. Loans and Leases of Notesto Consolidated Financial Statements for further information.
Gains on Sales of Consumer Real Estate Loans, Net Net gains on sales of consumer real estate loans totaled$37.3 million for 2017, compared with $50.4 million and $41.0 million for 2016 and 2015, respectively. Net gains onsales of consumer real estate loans decreased $13.1 million, or 26.0%, in 2017 and increased $9.5 million, or 23.1%,in 2016. The decrease in 2017 was primarily due to decreased volume of loans sold. The increase in 2016 was primarilydue to increased volume of loans sold. TCF sold $1.3 billion, $1.6 billion and $1.3 billion of consumer real estate loansin 2017, 2016 and 2015, respectively. See Note 6. Loans and Leases of Notes to Consolidated Financial Statementsfor further information.
30

Servicing Fee Income Servicing fee income totaled $41.3 million for 2017, compared with $40.2 million and $31.2 millionfor 2016 and 2015, respectively. Of this amount, $33.6 million relates to auto finance loans serviced for others for 2017,compared with $33.1 million and $24.1 million for 2016 and 2015, respectively, and $6.4 million relates to consumerreal estate loans serviced for others for 2017, compared with $5.4 million and $5.0 million for 2016 and 2015,respectively. Servicing fee income increased $9.0 million, or 28.7%, in 2016 primarily due to the cumulative effect ofthe increases in the portfolios of auto finance and consumer real estate loans sold with servicing retained by TCF.Average auto finance loans serviced for others were $2.5 billion for 2017, compared with $2.6 billion and $2.0 billionfor 2016 and 2015, respectively. Average consumer real estate loans serviced for others were $2.4 billion for 2017,compared with $2.0 billion and $1.6 billion for 2016 and 2015, respectively.
Leasing and Equipment Finance Leasing and equipment finance non-interest income totaled $145.0 million for 2017,compared with $119.2 million and $108.1 million for 2016 and 2015, respectively. Leasing and equipment finance non-interest income increased $25.9 million, or 21.7%, in 2017 and $11.0 million, or 10.2%, in 2016. The increase in 2017was primarily due to an increase in operating lease revenue, mainly driven by the acquisition of Equipment Financing& Leasing Corporation ("EFLC") in the second quarter of 2017 and portfolio growth. The increase in 2016 was primarilydue to higher operating lease and sales-type lease revenue.
31
Non-interest Expense Non-interest expense totaled $1.1 billion for 2017, compared with $909.9 million and$894.7 million for 2016 and 2015, respectively. Non-interest expense increased $150.0 million, or 16.5%, in 2017 and$15.1 million, or 1.7%, in 2016. The increase in 2017 was primarily due to increases in other non-interest expense,operating lease depreciation, compensation and employee benefits expense, occupancy and equipment expense andnet foreclosed real estate and repossessed assets expense. The increase in 2016 was primarily due to increases incompensation and employee benefits expense, occupancy and equipment expense and other non-interest expense,partially offset by a decrease in net foreclosed real estate and repossessed assets expense.
The components of non-interest expense were as follows:
Year Ended December 31, Change(Dollars in thousands) 2017 2016 2015 2017 / 2016 2016 / 2015Compensation and employee benefits $ 483,235 $ 474,722 $ 457,743 1.8% 3.7%Occupancy and equipment 156,909 149,980 144,962 4.6 3.5Other 345,456 231,420 229,255 49.3 0.9
Subtotal 985,600 856,122 831,960 15.1 2.9Operating lease depreciation 55,901 40,359 39,409 38.5 2.4Foreclosed real estate and repossessed assets, net 17,756 13,187 23,193 34.6 (43.1)Other credit costs, net 677 219 185 N.M. 18.4
Total non-interest expense $ 1,059,934 $ 909,887 $ 894,747 16.5 1.7N.M. Not Meaningful.
Compensation and Employee Benefits Compensation and employee benefits expense totaled $483.2 million for 2017,compared with $474.7 million and $457.7 million for 2016 and 2015, respectively. Compensation and employee benefitsexpense increased $8.5 million, or 1.8%, in 2017 and $17.0 million, or 3.7%, in 2016. The increase in 2017 was primarilydue to higher enterprise services contract labor utilization, higher incentive compensation and one-time employeebonuses, partially offset by reduced headcount in auto finance resulting in lower salaries and commissions. The increasein 2016 was primarily due to higher commissions and incentives, partially offset by the annual pension plan valuationadjustment.
Occupancy and Equipment Occupancy and equipment expense totaled $156.9 million for 2017, compared with$150.0 million and $145.0 million for 2016 and 2015, respectively. Occupancy and equipment expense increased$6.9 million, or 4.6%, in 2017 and $5.0 million, or 3.5%, in 2016. The increase in 2017 was primarily due to increasedsoftware maintenance expense and ATM expenses, partially offset by lower repairs and maintenance. The increasein 2016 was primarily due to increased depreciation and amortization expense and higher software maintenanceexpense. Depreciation and amortization expense related to premises and equipment was $45.9 million, $44.9 millionand $40.8 million in 2017, 2016 and 2015, respectively.

Other Non-interest Expense Other non-interest expense totaled $345.5 million for 2017, compared with $231.4 millionand $229.3 million for 2016 and 2015, respectively. Other non-interest expense increased $114.0 million, or 49.3%,in 2017 and $2.2 million, or 0.9%, in 2016. The increase in 2017 was primarily due to charges related to thediscontinuation of auto finance loan originations, including goodwill and other intangible assets impairment chargesof $73.4 million and severance, asset impairment and lease termination expenses of $14.8 million, increasedprofessional fees of $13.7 million driven by strategic investments in technology capabilities, a $6.3 million increase incharitable contributions related to the additional donation to TCF Foundation of $5.0 million, a $5.2 million increase inoutside processing expense, a $4.7 million increase in advertising and marketing expense and a $2.5 million increasein card processing expense, partially offset by a $4.0 million decrease in loan and lease processing expense and a$3.0 million decrease in branch realignment expense. The increase in 2016 was primarily due to $3.9 million of branchrealignment expense related to the closure of two traditional branches and 50 supermarket branches, a $1.6 millionincrease in loan and lease processing expense due to increases in loan and lease originations and a $1.0 millionincrease in outside processing expense, partially offset by a $4.4 million decrease in Federal Deposit InsuranceCorporation ("FDIC") insurance expense due to a lower assessment rate. See Note 23. Other Non-interest Expenseof Notes to Consolidated Financial Statements for further information.
Operating Lease Depreciation Operating lease depreciation totaled $55.9 million for 2017, compared with $40.4 millionand $39.4 million for 2016 and 2015, respectively. Operating lease depreciation increased $15.5 million, or 38.5%, in2017 primarily due to more transactions resulting in part from the acquisition of EFLC.
Foreclosed Real Estate and Repossessed Assets, Net Net foreclosed real estate and repossessed assets expensetotaled $17.8 million for 2017, compared with $13.2 million and $23.2 million for 2016 and 2015, respectively. Netforeclosed real estate and repossessed assets expense increased $4.6 million, or 34.6%, in 2017 and decreased$10.0 million, or 43.1%, in 2016. The increase in 2017 was due to higher repossessed assets expense primarilyattributable to auto finance and lower gains on sales of commercial properties, partially offset by lower operating costsassociated with maintaining fewer consumer properties. The decrease in 2016 was primarily due to lower operatingcosts associated with maintaining fewer properties, lower write-downs on existing foreclosed commercial and consumerproperties and higher gains on sales of commercial and consumer properties, partially offset by higher repossessedassets expense.
32
Income Taxes Income tax benefit was $33.6 million for 2017, compared with income tax expense of $116.5 millionand $108.9 million for 2016 and 2015, respectively. The income tax benefit for 2017 was impacted by an estimatednet tax benefit of $130.7 million primarily resulting from the re-measurement of the Company's estimated net deferredtax liability as a result of the enactment of Tax Reform. See Note 2. Summary of Significant Accounting Policies andNote 14. Income Taxes of Notes to Consolidated Financial Statements for further information.

Reportable Segment Results
The Company's reportable segments are Consumer Banking, Wholesale Banking and Enterprise Services. See Note24. Business Segments of Notes to Consolidated Financial Statements for further information regarding net income(loss), assets and revenues for each of TCF's reportable segments.
Consumer Banking
Consumer Banking is comprised of all of the Company's consumer-facing businesses and includes retail banking,consumer real estate and auto finance. TCF's consumer banking strategy is primarily to originate high credit qualitysecured consumer real estate loans for investment and for sale and to generate deposits. Effective April 1, 2017, theCompany executed its strategic shift from an originate-to-sell and originate-to-hold model to an entirely originate-to-hold model for its auto finance business and effective December 1, 2017, the Company discontinued auto finance loanoriginations. TCF will continue to service existing auto loans on its balance sheet and those serviced for others. Depositsare generated from consumers and small businesses to provide a source of low cost funds, with a focus on buildingand maintaining quality customer relationships. The Consumer Banking reportable segment generates a significantportion of the Company's net interest income and non-interest income from fees and service charges, card revenue,ATM revenue, gains on sales of loans and servicing fee income, and incurs a significant portion of the Company'sprovision for credit losses and non-interest expense.
Consumer Banking generated net income available to common stockholders of $23.1 million for 2017, compared with$124.0 million and $105.5 million for 2016 and 2015, respectively. Consumer Banking net income available to commonstockholders decreased $100.9 million, or 81.3%, in 2017 and increased $18.6 million, or 17.6%, in 2016.
Consumer Banking net interest income totaled $574.6 million for 2017, compared with $559.9 million and $536.7 millionfor 2016 and 2015, respectively. Net interest income increased $14.8 million, or 2.6%, in 2017 and $23.1 million, or4.3%, in 2016. The increase in 2017 was primarily due to an increase in interest income on loans and an increase infunds transfer pricing credits, partially offset by a decrease in interest income on loans held for sale and an increasein total interest expense. The increase in 2016 was primarily due to an increase in interest income related to fundstransfer pricing credits and an increase in interest income on loans held for sale, partially offset by an increase in totalinterest expense.
Total interest income attributable to the Consumer Banking segment was $823.5 million for 2017, compared with$796.1 million and $755.3 million for 2016 and 2015, respectively. Total interest income increased $27.4 million, or3.4%, in 2017 and $40.7 million, or 5.4%, in 2016. The increase in total interest income in 2017 was primarily due tohigher average yields on auto finance loans and an increase in funds transfer pricing credits driven by deposits, partiallyoffset by lower average balances of consumer real estate loans. The increase in total interest income in 2016 wasprimarily due to an increase in funds transfer pricing credits driven by an increase in deposits and higher averagebalances of auto finance loans, partially offset by a decrease in interest income from consumer real estate first mortgagelien loan balances due to run-off.
Total interest expense attributable to the Consumer Banking segment was $248.9 million for 2017, compared with$236.2 million and $218.6 million for 2016 and 2015, respectively. Total interest expense increased $12.7 million, or5.4%, in 2017 and $17.6 million, or 8.1%, in 2016. The increase in total interest expense in 2017 was primarily due toan increase in interest expense on inter-company borrowings and an increase in funds transfer pricing charges.Theincrease in total interest expense in 2016 was primarily due to higher interest expense on certificates of deposits dueto growth and higher rates paid as a result of special campaigns to fund loan growth.
Consumer Banking provision for credit losses totaled $48.2 million for 2017, compared with $50.8 million and$44.3 million for 2016 and 2015, respectively. The provision for credit losses decreased $2.6 million, or 5.1%, in 2017and increased $6.5 million, or 14.6%, in 2016. The decrease in the provision for credit losses in 2017 was primarilydue to a decreased provision for credit losses related to the consumer real estate portfolio, partially offset by anincreased provision for credit losses related to the auto finance portfolio. The decrease in the provision for credit lossesrelated to the consumer real estate portfolio was primarily due to the recovery of $13.3 million on previous charge-offsrelated to the non-accrual loans that were sold in the first and third quarters of 2017 and improving credit quality. Theincrease in the provision for credit losses related to the auto finance portfolio was primarily due to increased net charge-offs and growth as a result of the reclassification of loans from held for sale to held for investment. The increase in theprovision for credit losses in 2016 was primarily due to the benefit from reduced reserve requirements in 2015 for theconsumer real estate portfolio (the allowance for credit losses as a percent of consumer banking loans was 1.19%and 1.18% at December 31, 2016 and 2015, respectively), partially offset by decreased net charge-offs.
33

Consumer Banking non-interest income totaled $290.0 million for 2017, compared with $337.0 million and$320.4 million for 2016 and 2015, respectively. Non-interest income decreased $47.0 million, or 13.9%, in 2017 andincreased $16.6 million, or 5.2%, in 2016. The decrease in 2017 was primarily due to decreases in net gains on salesof auto loans, net gains on sales of consumer real estate loans and fees and service charges. The increase in 2016was primarily due to increases in net gains on sales of consumer real estate loans, net gains on sales of auto loansand servicing fee income, partially offset by a decrease in fees and service charges.
Fees and service charges attributable to the Consumer Banking segment totaled $121.7 million for 2017, comparedwith $130.5 million and $138.7 million for 2016 and 2015, respectively. Fees and service charges decreased $8.8 million,or 6.8%, in 2017 and $8.1 million, or 5.9%, in 2016, primarily due to ongoing consumer behavior changes, as well ashigher average checking account balances per customer.
Net gains on sales of auto loans totaled $5.5 million for 2017, compared with $34.8 million and $30.6 million for 2016and 2015, respectively. Net gains on sales of auto loans decreased $29.4 million, or 84.3%, in 2017 and increased$4.3 million, or 13.9%, in 2016. The decrease in 2017 was due to the strategic shift in auto finance. The increase in2016 was primarily due to increased volume of loans sold, partially offset by a strong competitive environment andchallenging market conditions.
Net gains on sales of consumer real estate loans totaled $37.3 million for 2017, compared with $50.4 million and$41.0 million for 2016 and 2015, respectively. Net gains on sales of consumer real estate loans decreased $13.0 million,or 25.9%, in 2017 and increased $9.4 million, or 23.0%, in 2016. The decrease in 2017 was primarily due to decreasedvolume of loans sold. The increase in 2016 was primarily due to increased volume of loans sold.
Servicing fee income attributable to the Consumer Banking segment totaled $40.0 million for 2017, compared with$38.6 million and $29.0 million for 2016 and 2015, respectively. Of this amount, $33.6 million relates to auto financeloans serviced for others for 2017, compared with $33.1 million and $24.1 million for 2016 and 2015, respectively, and$6.4 million relates to consumer real estate loans serviced for others for 2017, compared with $5.4 million and$5.0 million for 2016 and 2015, respectively. Servicing fee income increased $9.5 million, or 32.9%, in 2016 due tothe cumulative effect of the increases in the portfolios of auto finance and consumer real estate loans sold with servicingretained by TCF. Average auto finance loans serviced for others were $2.5 billion for 2017, compared with $2.6 billionand $2.0 billion for 2016 and 2015, respectively. Average consumer real estate loans serviced for others were $2.4 billionfor 2017, compared with $2.0 billion and $1.6 billion for 2016 and 2015, respectively.
Consumer Banking non-interest expense totaled $743.7 million for 2017, compared with $652.5 million and$645.9 million for 2016 and 2015, respectively. Non-interest expense increased $91.3 million, or 14.0%, in 2017 and$6.5 million, or 1.0%, in 2016. The increase in 2017 was primarily due to charges related to the discontinuation of autofinance loan originations, including goodwill and other intangible asset impairment charges and severance, assetimpairment and lease termination expenses, as well as increases in occupancy and equipment expense, allocationexpense from Enterprise Services, advertising and marketing expense, net foreclosed real estate and repossessedassets expense and card processing expense. These increases were partially offset by a decrease in compensationand employee benefits expense attributable to reduced headcount in auto finance resulting in lower salaries andcommissions, a decrease in branch realignment expense and a decrease in loan processing expense. The increasein 2016 was primarily due to higher occupancy and equipment expense and branch realignment expense of $3.9 millionrelated to the closure of two traditional branches and 50 supermarket branches. These increases were partially offsetby a decrease in net foreclosed real estate and repossessed assets expense due to lower operating costs associatedwith maintaining fewer consumer properties, higher gains on sales of consumer properties and lower write-downs onexisting foreclosed consumer properties, as well as a decrease in FDIC insurance expense due to a lower assessmentrate.
34
Wholesale Banking
Wholesale Banking is comprised of commercial lending, leasing and equipment finance and inventory finance. TCF'swholesale banking strategy is primarily to originate high credit quality secured loans and leases for investment.
Wholesale Banking generated net income available to common stockholders of $278.4 million for 2017, comparedwith $130.0 million and $127.3 million for 2016 and 2015, respectively. Wholesale Banking net income available tocommon stockholders increased $148.4 million, or 114.2%, in 2017 and $2.6 million, or 2.1%, in 2016.
Wholesale Banking net interest income totaled $359.3 million for 2017, compared with $343.7 million and $339.9 millionfor 2016 and 2015, respectively. Net interest income increased $15.6 million, or 4.5%, in 2017 and $3.7 million, or1.1%, in 2016. The increases in both periods were primarily due to increases in interest income on loans and leases,partially offset by increases in total interest expense.
Total interest income attributable to the Wholesale Banking segment was $552.8 million for 2017, compared with$479.6 million and $452.8 million for 2016 and 2015, respectively. Total interest income increased $73.2 million, or15.3%, in 2017 and $26.8 million, or 5.9%, in 2016. The increase in total interest income in 2017 was primarily due tohigher average balances and increased average yields on commercial and inventory finance loans and higher averagebalances of leasing and equipment finance loans and leases. The increase in total interest income in 2016 was primarilydue to higher average loan and lease balances in the leasing and equipment finance and inventory finance portfolios.
Total interest expense attributable to the Wholesale Banking segment was $193.5 million for 2017, compared with$135.9 million and $112.9 million for 2016 and 2015, respectively. Total interest expense increased $57.6 million, or42.4%, in 2017 and $23.1 million, or 20.4%, in 2016. The increase in total interest expense in 2017 was primarily dueto higher funds transfer pricing charges driven by an increase in loans and leases and an increase in interest expenseon inter-company borrowings. The increase in total interest expense in 2016 was primarily due to higher funds transferpricing charges driven by a combination of higher average loan and lease balances and an increase in funds transferpricing rates.
Wholesale Banking provision for credit losses totaled $20.2 million for 2017, compared with $15.1 million and$8.6 million for 2016 and 2015, respectively. The provision for credit losses increased $5.2 million, or 34.3%, in 2017and $6.4 million, or 74.7%, in 2016. The increase in 2017 was primarily due to increased net charge-offs in thecommercial and leasing and equipment finance portfolios, partially offset by lower reserve requirements in the inventoryfinance portfolio. The increase in 2016 was primarily due to increased reserve requirements related to overall growthin the Wholesale Banking loan and lease portfolio.
Wholesale Banking non-interest income totaled $158.0 million for 2017, compared with $128.9 million and$119.8 million for 2016 and 2015, respectively. Non-interest income increased $29.1 million, or 22.6%, in 2017 and$9.1 million, or 7.6%, in 2016. The increase in 2017 was primarily due to an increase in leasing and equipment financenon-interest income due to an increase in operating lease revenue, mainly driven by the acquisition of EFLC in thesecond quarter of 2017 and portfolio growth. The increase in 2016 was primarily due to an increase in leasing andequipment finance non-interest income due to higher operating lease and sales-type lease revenue.
Wholesale Banking non-interest expense totaled $277.4 million for 2017, compared with $247.1 million and$244.9 million for 2016 and 2015, respectively. Non-interest expense increased $30.3 million, or 12.3%, in 2017 and$2.2 million, or 0.9%, in 2016. The increase in 2017 was primarily due to an increase in operating lease depreciationprimarily attributable to more transactions resulting in part from the acquisition of EFLC and an increase in occupancyand equipment expense. The increase in 2016 was primarily due to an increase in allocated costs due to the furtherbuild-out of risk management and credit, partially offset by a decrease in compensation and benefits expense, adecrease in net foreclosed real estate and repossessed assets expense due to lower write-downs on existing foreclosedcommercial properties and lower operating costs associated with maintaining fewer commercial properties and adecrease in occupancy and equipment expense.
35

Enterprise Services
Enterprise Services is comprised of (i) corporate treasury, which includes the Company's investment and borrowingportfolios and management of capital, debt and market risks, (ii) corporate functions, such as information technology,risk and credit management, bank operations, finance, investor relations, corporate development, legal and humancapital management, that provide services to the operating segments, (iii) the Holding Company and (iv) eliminations.The Company's investment portfolio accounts for the earning assets within this segment. Borrowings may be used tooffset reductions in deposits or to support lending activities. This segment also includes residual revenues and expensesrepresenting the difference between actual amounts incurred by Enterprise Services and amounts allocated to theoperating segments, including interest rate risk residuals such as funds transfer pricing mismatches.
Enterprise Services generated a net loss available to common stockholders of $58.5 million for 2017, compared with$61.3 million and $55.1 million for 2016 and 2015, respectively. Enterprise Services net loss available to commonstockholders decreased $2.7 million, or 4.5%, in 2017 and increased $6.2 million, or 11.2%, in 2016.
Enterprise Services net interest expense totaled $8.7 million for 2017, compared with $55.4 million and $56.3 millionfor 2016 and 2015, respectively. Net interest expense decreased $46.7 million, or 84.4%, in 2017 and $0.9 million, or1.5%, in 2016. The decrease in 2017 was primarily driven by a decrease in funds transfer pricing mismatches as aresult of rising interest rates and an increase in interest income attributable to higher average balances of securitiesavailable for sale, partially offset by an increase in interest expense primarily due to higher average balances of long-term borrowings and higher interest expense on deposits. The decrease in 2016 was primarily driven by an increasein interest income attributable to higher average balances of securities available for sale and a decrease in borrowingexpense, partially offset by an increase in funds transfer pricing mismatches.
Enterprise Services non-interest income totaled $0.3 million for 2017, compared with $28.0 thousand and $1.8 millionfor 2016 and 2015, respectively. Non-interest income decreased $1.8 million, or 98.5%, in 2016 primarily due to a gainof $1.7 million related to appreciation of an investment that was donated to TCF Foundation in the first quarter of 2015.
Enterprise Services non-interest expense totaled $38.8 million for 2017, compared with $10.3 million and $3.9 millionfor 2016 and 2015, respectively. Non-interest expense increased $28.5 million, or 276.0%, in 2017 and $6.4 million,or 165.3%, in 2016. The increase in 2017 was primarily due to higher compensation and employee benefits expensedue to higher contract labor utilization, higher incentive compensation and one-time employee bonuses, as well ashigher professional fees related to strategic investments in technology capabilities and higher contribution expenserelated to the additional donation to TCF Foundation of $5.0 million. These increases were partially offset by a decreasein occupancy and equipment expense. The increase in 2016 was primarily due to an increase in compensation andbenefits expense, partially offset by an increase in recoveries of allocated expenses, a decrease in occupancy andequipment expense and the annual pension plan valuation adjustment.
36
Consolidated Financial Condition Analysis
Securities Available for Sale and Securities Held to Maturity Total securities available for sale were $1.7 billionat December 31, 2017, an increase of $285.6 million, or 20.1%, from $1.4 billion at December 31, 2016. TCF's securitiesavailable for sale portfolio consists primarily of fixed-rate mortgage-backed securities issued by the Federal NationalMortgage Association ("Fannie Mae") and obligations of states and political subdivisions. The increase in securitiesavailable for sale was primarily due to purchases of obligations of states and political subdivisions and fixed-ratemortgage-backed securities, partially offset by proceeds from maturities and principal collected on fixed-rate mortgage-backed securities. TCF may, from time to time, sell securities available for sale and utilize the proceeds to reduceborrowings, fund growth in loans and leases or for other corporate purposes. There were no sales of securities availablefor sale during 2017 or 2016. In 2015, TCF sold $0.2 million of securities available for sale.
Total securities held to maturity were $161.6 million at December 31, 2017, a decrease of $19.7 million, or 10.9%,from $181.3 million at December 31, 2016. TCF's securities held to maturity portfolio consists primarily of fixed-ratemortgage-backed securities issued by Fannie Mae. The decrease in securities held to maturity was primarily due toproceeds from maturities and principal collected on fixed-rate mortgage-backed securities.

The amortized cost, fair value and fully tax-equivalent yield of securities available for sale and securities held to maturityby final contractual maturity were as follows. The remaining contractual principal maturities do not consider possibleprepayments. Remaining expected maturities will differ from contractual maturities because borrowers may have theright to prepay.
At December 31,2017 2016 2015
(Dollars in thousands)Amortized
Cost Fair Value
Tax-equivalent
YieldAmortized
Cost Fair Value
Tax-equivalent
YieldAmortized
Cost Fair Value
Tax-equivalent
YieldSecurities available
for sale:Mortgage-backedsecurities:
Due in one yearor less $ 6 $ 6 1.98% $ 1 $ 1 8.02% $ 1 $ 1 9.00%
Due in 1-5 years — — — 18 18 2.28 38 38 2.65Due in 5-10 years 82,842 82,046 2.04 54,202 54,429 1.93 70,338 70,350 1.93Due after 10
years 825,347 812,639 2.32 773,519 756,461 2.25 557,178 551,575 2.46Obligations of
states and politicalsubdivisions:Due in 1-5 years 15,178 15,312 2.97 — — — — — —Due in 5-10 years 431,494 435,821 3.14 277,228 274,576 3.13 198,300 202,161 3.19Due after 10
years 363,487 363,194 3.29 351,744 337,950 3.20 63,889 64,760 3.40Total securities
available forsale $1,718,354 $1,709,018 2.72 $1,456,712 $1,423,435 2.63 $ 889,744 $ 888,885 2.65
Securities held tomaturity:Mortgage-backed
securities:Due after 10
years $ 158,776 $ 162,826 2.55% $ 178,514 $ 181,146 2.54% $ 198,520 $ 203,553 2.64%Other securities:
Due in one yearor less 1,000 1,000 3.00 — — — 100 100 2.00
Due in 1-5 years 1,400 1,400 3.21 1,400 1,400 2.86 1,900 1,900 2.63Due in 5-10 years 400 400 3.00 1,400 1,400 3.36 1,400 1,400 3.36
Total securitiesheld tomaturity $ 161,576 $ 165,626 2.56 $ 181,314 $ 183,946 2.55 $ 201,920 $ 206,953 2.64
See Note 5. Securities Available for Sale and Securities Held to Maturity of Notes to Consolidated Financial Statementsfor further information regarding TCF's securities available for sale and securities held to maturity.
37

Loans and Leases Information about loans and leases held in TCF's portfolio was as follows:
Compound AnnualAt December 31, Growth Rate
1-Year 5-Year(Dollars in thousands) 2017 2016 2015 2014 2013 2017 / 2016 2017 / 2012Consumer real estate:
First mortgage lien $ 1,959,387 $ 2,292,596 $ 2,624,956 $ 3,139,152 $ 3,766,421 (14.5)% (14.3)%Junior lien 2,860,309 2,791,756 2,839,316 2,543,212 2,572,905 2.5 3.3
Total consumer real estate 4,819,696 5,084,352 5,464,272 5,682,364 6,339,326 (5.2) (6.3)Commercial:
Commercial real estate 2,751,285 2,634,191 2,593,429 2,624,255 2,743,697 4.4 (2.2)Commercial business 809,908 652,287 552,403 533,410 404,655 24.2 20.1
Total commercial 3,561,193 3,286,478 3,145,832 3,157,665 3,148,352 8.4 0.9Leasing and equipment finance 4,761,661 4,336,310 4,012,248 3,745,322 3,428,755 9.8 8.3Inventory finance 2,739,754 2,470,175 2,146,754 1,877,090 1,664,377 10.9 11.8Auto finance 3,199,639 2,647,741 2,647,596 1,915,061 1,239,386 20.8 42.1Other 22,517 18,771 19,297 24,144 26,743 20.0 (4.2)
Total loans and leases $ 19,104,460 $ 17,843,827 $ 17,435,999 $ 16,401,646 $ 15,846,939 7.1 4.4
At December 31, 2017
(In thousands)Consumer
Real Estate Commercial
Leasing andEquipment
FinanceInventoryFinance
AutoFinance Other Total
Geographic Distribution:California $ 1,027,903 $ 192,526 $ 647,979 $ 107,390 $ 517,942 $ 11 $ 2,493,751Minnesota 977,861 814,106 111,025 98,586 46,848 4,936 2,053,362Illinois 1,061,955 479,728 199,038 64,778 117,631 6,519 1,929,649Michigan 405,219 548,340 157,767 111,062 51,657 5,659 1,279,704Texas — 95,858 442,212 165,785 296,243 10 1,000,108Florida 171,210 162,622 245,290 147,762 196,250 38 923,172Wisconsin 196,433 375,955 68,515 93,329 24,655 1,019 759,906New York 39,188 34,174 266,155 87,339 179,782 43 606,681Colorado 219,665 207,784 85,513 37,288 49,852 3,655 603,757Georgia 46,427 82,174 134,510 75,845 111,349 1 450,306Ohio 8,058 63,397 170,093 100,003 99,023 — 440,574Canada — — 1,256 438,603 — — 439,859Pennsylvania 40,710 23,709 166,981 87,410 111,508 68 430,386Arizona 99,854 34,556 141,965 34,244 94,163 379 405,161North Carolina 8,514 21,157 159,858 77,729 118,039 1 385,298New Jersey 52,304 14,106 164,719 28,644 101,964 2 361,739Washington 118,695 16,736 90,319 39,779 31,023 4 296,556Massachusetts 41,336 28,543 119,480 18,974 70,649 1 278,983Indiana 17,177 56,698 96,042 61,879 40,458 11 272,265Oregon 86,528 47,996 56,510 43,051 22,679 — 256,764Virginia 22,673 2,258 96,180 38,571 86,302 — 245,984Missouri 7,427 68,141 67,572 57,857 36,785 — 237,782Tennessee 3,458 16,017 87,652 55,209 67,913 — 230,249Other 167,101 174,612 985,030 668,637 726,924 160 2,722,464
Total $ 4,819,696 $ 3,561,193 $ 4,761,661 $ 2,739,754 $ 3,199,639 $ 22,517 $ 19,104,460
38

The contractual maturities of loans and leases outstanding were as follows:
At December 31, 2017(1)
(In thousands)Consumer
Real Estate Commercial
Leasing andEquipment
FinanceInventoryFinance
AutoFinance Other Total
Amounts due:Within 1 year $ 108,468 $ 645,608 $ 1,591,494 $ 2,739,754 $ 770,968 $ 10,681 $ 5,866,9731 to 5 years 424,792 2,427,694 3,050,354 — 2,336,493 5,213 8,244,546Over 5 years 4,286,436 487,891 119,813 — 92,178 6,623 4,992,941
Total $ 4,819,696 $ 3,561,193 $ 4,761,661 $ 2,739,754 $ 3,199,639 $ 22,517 $ 19,104,460Amounts due after 1 year:
Fixed-rate loans and leases $ 1,738,321 $ 731,804 $ 3,160,076 $ — $ 2,428,671 $ 11,683 $ 8,070,555Variable- and adjustable-rate
loans and leases 2,972,907 2,183,781 10,091 — — 153 5,166,932Total after 1 year $ 4,711,228 $ 2,915,585 $ 3,170,167 $ — $ 2,428,671 $ 11,836 $ 13,237,487
(1) This table does not include the effect of prepayments, which is an important consideration in management's interest-rate risk analysis. Company experienceindicates that loans and leases remain outstanding for significantly shorter periods than their contractual terms.
Consumer Real Estate TCF's consumer real estate portfolio represented 25.2% and 28.5% of TCF's total loan andlease portfolio at December 31, 2017 and 2016, respectively. The consumer real estate portfolio is secured bymortgages on residential real estate and consisted of $2.0 billion of first mortgage lien loans and $2.9 billion of juniorlien loans, with a decrease of $333.2 million, or 14.5%, in the first mortgage lien portfolio and an increase of $68.6 million,or 2.5%, in the junior lien portfolio, from $2.3 billion and $2.8 billion at December 31, 2016, respectively. The decreasein the consumer real estate first mortgage lien portfolio was primarily due to run-off and the non-accrual loan sales of$71.2 million during the first and third quarters of 2017. The increase in the junior lien portfolio was primarily due tothe purchase of a loan portfolio of $175.4 million on September 27, 2017. The average loan size was $99 thousandfor first mortgage lien loans and $48 thousand for junior lien loans at December 31, 2017, compared with $100 thousandand $47 thousand at December 31, 2016, respectively. Loans are originated for investment and for sale. Total consumerreal estate originations were $2.3 billion in 2017, a decrease of $299.0 million, or 11.6%, from $2.6 billion in 2016. TCFsold $1.3 billion and $1.6 billion of consumer real estate loans in 2017 and 2016, respectively. At December 31, 2017and 2016, 61.5% and 68.1%, respectively, of the consumer real estate portfolio were in TCF's primary banking markets.At December 31, 2017 and 2016, 62.2% and 58.0%, respectively, of the consumer real estate portfolio carried a variableor adjustable rate generally tied to the prime rate. At December 31, 2017 and 2016, 42.2% and 47.3%, respectively,of TCF's consumer real estate loans consisted of closed-end loans. TCF's closed-end consumer real estate loansrequire payments of principal and interest over a fixed term.
The average Fair Isaac Corporation ("FICO®") credit score at loan origination for the consumer real estate portfoliowas 738 and 735 at December 31, 2017 and 2016, respectively. As part of TCF's credit risk monitoring, TCF obtainsupdated FICO score information quarterly. The average updated FICO score for the consumer real estate portfoliowas 736 and 733 at December 31, 2017 and 2016, respectively.
TCF's consumer real estate underwriting standards are intended to produce adequately secured loans to customerswith good credit scores at the origination date. Beginning in 2008, TCF generally has not made new loans in excessof 90% loan-to-value at origination. TCF also has not originated consumer real estate loans with multiple paymentoptions or loans with "teaser" interest rates. At December 31, 2017, 68.3% of the consumer real estate portfolio hadbeen originated since January 1, 2009 with net recoveries of 0.01% in 2017. TCF's consumer real estate portfolio issubject to the risk of falling home values and to the general economic environment, particularly unemployment.
The consumer real estate junior lien portfolio was comprised of $2.7 billion of home equity lines of credit ("HELOCs")and $206.2 million of amortizing consumer real estate junior lien mortgage loans at December 31, 2017, comparedwith $2.5 billion and $272.9 million at December 31, 2016, respectively. At December 31, 2017 and 2016, $2.3 billionand $2.0 billion, respectively, of the consumer real estate junior lien HELOCs had a 10-year interest-only draw periodand a 20-year amortization repayment period and all were within the 10-year interest-only draw period and will notconvert to amortizing loans until 2021 or later. At December 31, 2017 and 2016, $400.4 million and $525.4 million,respectively, of the consumer real estate junior lien HELOCs were interest-only revolving draw loans with no definedamortization period and original draw periods of five to 40 years. As of December 31, 2017, 16.2% of these loansmature prior to 2021. Outstanding balances on consumer real estate lines of credit were 66.9% of total lines of creditat December 31, 2017, compared with 67.1% at December 31, 2016.
39

Commercial TCF's commercial portfolio represented 18.6% and 18.4% of TCF's total loan and lease portfolio atDecember 31, 2017 and 2016, respectively. The commercial portfolio consisted of $2.8 billion of commercial real estateloans and $809.9 million of commercial business loans at December 31, 2017, with increases of $117.1 million, or4.4%, and $157.6 million, or 24.2%, respectively, from $2.6 billion and $652.3 million, respectively, atDecember 31, 2016. The increase in the commercial portfolio was primarily due to originations outpacing lowerprepayments and pay-offs. Total commercial originations were $2.1 billion in 2017, an increase of $183.2 million, or9.7%, from $1.9 billion in 2016. At December 31, 2017 and 2016, 74.7% and 77.8%, respectively, of TCF's commercialreal estate loans outstanding were secured by properties located in TCF's primary banking markets. While commercialreal estate collateral is generally located in TCF's primary banking markets, commercial real estate lending follows itsstrong, proven sponsors into other markets. With an emphasis on secured lending, essentially all of TCF's commercialloans were secured either by properties or other business assets at December 31, 2017 and 2016. AtDecember 31, 2017 and 2016, variable- and adjustable-rate loans represented 73.5% and 69.0%, respectively, of totalcommercial loans outstanding.
TCF's commercial real estate loan portfolio by property and loan type was as follows:
At December 31,2017 2016
(In thousands) Permanent
Constructionand
Development Total Permanent
Constructionand
Development TotalMulti-family housing $ 791,201 $ 178,517 $ 969,718 $ 718,562 $ 152,693 $ 871,255Office buildings 305,853 56,177 362,030 321,970 22,058 344,028Warehouse/industrial buildings 309,804 4,795 314,599 362,092 3,156 365,248Health care facilities 262,889 34,632 297,521 326,536 37,372 363,908Self-storage 246,369 44,676 291,045 184,543 29,771 214,314Retail services(1) 251,903 5,052 256,955 292,036 3,662 295,698Hotels and motels 199,336 41,176 240,512 117,312 25,739 143,051Other 18,397 508 18,905 33,236 3,453 36,689
Total $ 2,385,752 $ 365,533 $ 2,751,285 $ 2,356,287 $ 277,904 $ 2,634,191(1) Primarily retail strip shopping centers and malls, convenience stores, supermarkets, restaurants and automobile related businesses.
Leasing and Equipment Finance TCF's leasing and equipment finance portfolio represented 24.9% and 24.3% ofTCF's total loan and lease portfolio at December 31, 2017 and 2016, respectively. The leasing and equipment financeportfolio consisted of $2.5 billion of leases and $2.3 billion of loans at December 31, 2017, with increases of$141.6 million, or 6.1%, and $283.8 million, or 14.1%, respectively, from $2.3 billion of leases and $2.0 billion of loansat December 31, 2016. The increase in the leasing and equipment finance portfolio was primarily due to a loan andlease portfolio purchase of $445.5 million on September 29, 2017. Leasing and equipment finance originations(excluding loan and lease purchases) were $2.0 billion in 2017, a decrease of $177.8 million, or 8.3%, from $2.1 billionin 2016. Leasing and equipment finance originations include operating lease originations. The uninstalled backlog ofapproved transactions was $506.4 million and $453.6 million at December 31, 2017 and 2016, respectively. Theaverage loan and lease size was $77 thousand at both December 31, 2017 and 2016. See Note 2. Summary ofSignificant Accounting Policies of Notes to Consolidated Financial Statements for further information on leaseaccounting.
At December 31, 2017 and 2016, $119.5 million and $140.1 million, respectively, of TCF's lease portfolio wasdiscounted with third-party financial institutions on a non-recourse basis, which is recorded in long-term borrowings.The leasing and equipment finance portfolio table below includes lease residuals, including those related to non-recourse debt. Lease residuals represent the estimated fair value of the leased equipment at the expiration of the initialterm of the transaction and are reviewed on an ongoing basis. Any downward revisions in estimated fair value arerecorded to expense in the periods in which they become known. At December 31, 2017, lease residuals totaled$139.9 million, or 9.7% of original equipment value, including $6.2 million related to non-recourse sales, comparedwith $123.4 million, or 10.0% of original equipment value, including $7.5 million related to non-recourse sales atDecember 31, 2016.
40

TCF's leasing and equipment finance portfolio by equipment type was as follows:
At December 31,2017 2016
(Dollars in thousands) BalancePercentof Total Balance
Percentof Total
Specialty vehicles $ 1,403,142 29.5% $ 1,252,951 28.9%Construction equipment 548,575 11.5 483,231 11.1Manufacturing equipment 472,902 9.9 300,368 6.9Golf cart and turf equipment 431,888 9.1 429,382 9.9Trucks and trailers 367,206 7.7 271,870 6.3Medical equipment 335,636 7.1 336,566 7.8Furniture and fixtures 334,732 7.0 384,975 8.9Technology and data processing equipment 290,999 6.1 321,562 7.4Agricultural equipment 148,269 3.1 149,192 3.4Other 428,312 9.0 406,213 9.4
Total $ 4,761,661 100.0% $ 4,336,310 100.0%
Inventory Finance TCF's inventory finance portfolio represented 14.3% and 13.8% of TCF's total loan and leaseportfolio at December 31, 2017 and 2016, respectively. The inventory finance portfolio totaled $2.7 billion atDecember 31, 2017, an increase of $269.6 million, or 10.9%, from $2.5 billion at December 31, 2016. The increasewas primarily due to strong originations and the expansion in the number of active dealers. Inventory finance originationswere $7.4 billion in 2017, an increase of $721.2 million, or 10.8%, from $6.7 billion in 2016. Origination levels areimpacted by the velocity of fundings and repayments with dealers. TCF's inventory finance customers included morethan 10,900 and 10,800 active dealers at December 31, 2017 and 2016, respectively.
TCF's inventory finance portfolio by marketing segment was as follows:
At December 31,2017 2016
(Dollars in thousands) BalancePercentof Total Balance
Percentof Total
Powersports $ 1,187,049 43.3% $ 1,143,226 46.3%Lawn and garden 606,173 22.1 567,452 23.0Other 946,532 34.6 759,497 30.7
Total $ 2,739,754 100.0% $ 2,470,175 100.0%
Auto Finance TCF's auto finance portfolio represented 16.7% and 14.8% of TCF's total loan and lease portfolio atDecember 31, 2017 and 2016, respectively. The auto finance portfolio totaled $3.2 billion at December 31, 2017, anincrease of $551.9 million, or 20.8%, from $2.6 billion at December 31, 2016. The increase was primarily due to thestrategic shift from an originate-to-sell and originate-to-hold model to an entirely originate-to-hold model effective April1, 2017 resulting in the reclassification of approximately $345 million of loans from held for sale to held for investmentduring the second quarter of 2017. Prior to April 1, 2017, loans were originated for investment and for sale. Total autofinance originations were $2.2 billion in 2017, a decrease of $1.4 billion, or 38.3%, from $3.6 billion in 2016 primarilydue to the strategic shift in auto finance and the discontinuation of auto finance loan originations effective December1, 2017. TCF sold $424.7 million and $2.1 billion of auto finance loans in 2017 and 2016, respectively. The auto financeportfolio consisted of 19.9% new auto loans and 80.1% used auto loans at December 31, 2017, compared with 23.3%and 76.7%, respectively, at December 31, 2016. The average original FICO score for the auto finance held forinvestment portfolio was 715 and 733 at December 31, 2017 and 2016, respectively. The decrease in the averageoriginal FICO score was primarily due to the implementation of the strategic shift.
41

Credit Quality The following summarizes TCF's loan and lease portfolio based on the credit quality factors that TCFbelieves are the most important and should be considered to understand the overall condition of the portfolio. Thefollowing items should be considered throughout this section:
• Loans and leases that are over 60-days delinquent have a higher potential to become non-accrual and generallyare a leading indicator for future charge-off trends.
• Troubled debt restructuring ("TDR") loans are loans to financially troubled borrowers that have been modifiedsuch that TCF has granted a concession in terms to improve the likelihood of collection of all principal andmodified interest owed.
• Non-accrual loans and leases have been charged down to the estimated fair value of the collateral less estimatedselling costs, or reserved for expected loss upon workout.
• Within the performing loans and leases, TCF classifies customers within regulatory classification guidelines.Loans and leases that are "classified" are loans or leases that management has concerns regarding the abilityof the borrowers to meet existing loan or lease terms and conditions, but may never become non-accrual orresult in a loss.
Included in Note 2. Summary of Significant Accounting Policies and in Note 7. Allowance for Loan and Lease Lossesand Credit Quality Information of Notes to Consolidated Financial Statements are disclosures of loans considered tobe "impaired" for accounting purposes. Impairment is generally based on the present value of the expected futurecash flows discounted at the loan's initial effective interest rate or for collateral dependent loans at the fair value ofcollateral less estimated selling costs; however, if payment or satisfaction of the loan is dependent on the operation,rather than the sale of the collateral, the impairment does not include estimated selling costs. Impaired loans includenon-accrual commercial, equipment finance and inventory finance loans, as well as all TDR loans. Impaired loanaccounting policies prescribe specific methodologies for determining a portion of the allowance for loan and leaselosses.
Past Due Loans and Leases Over 60-day delinquent loans and leases by type, excluding non-accrual loans andleases, were as follows. Delinquent balances are determined based on the contractual terms of the loan or lease. SeeNote 7. Allowance for Loan and Lease Losses and Credit Quality Information of Notes to Consolidated FinancialStatements for further information.
60 Days or More Delinquent and Accruing Percentage of Period-end Loans and Leases(1)
At December 31, At December 31,(Dollars in thousands) 2017 2016 2015 2014 2013 2017 2016 2015 2014 2013Consumer real estate:
First mortgage lien $ 4,666 $ 8,725 $ 11,565 $ 13,370 $ 20,894 0.25% 0.40% 0.46% 0.49% 0.58%Junior lien 1,268 1,404 1,519 2,091 3,532 0.04 0.05 0.05 0.08 0.14
Total consumer real estate 5,934 10,129 13,084 15,461 24,426 0.13 0.21 0.25 0.30 0.40Commercial 1 — 1 — 1,430 — — — — 0.05Leasing and equipment finance 6,389 4,523 2,292 2,549 2,401 0.14 0.10 0.06 0.07 0.07Inventory finance 208 55 118 75 50 0.01 — 0.01 — —Auto finance 9,077 6,102 3,573 4,263 1,877 0.28 0.23 0.14 0.22 0.15Other 9 20 20 — 10 0.04 0.10 0.10 — 0.04
Subtotal 21,618 20,829 19,088 22,348 30,194 0.11 0.12 0.11 0.14 0.19Portfolios acquired with
deteriorated credit quality 1,561 — 1 88 458 13.18 — 0.43 0.03 1.64Total $ 23,179 $ 20,829 $ 19,089 $ 22,436 $ 30,652 0.12 0.12 0.11 0.14 0.20
(1) Excludes non-accrual loans and leases.
42

Loan Modifications TDR loans were as follows:
At December 31,(Dollars in thousands) 2017 2016 2015 2014 2013Accruing TDR Loans:
Consumer real estate $ 88,092 $ 98,606 $ 106,787 $ 111,933 $ 506,640Commercial 12,249 20,304 24,731 80,375 120,871Leasing and equipment finance 10,263 4,802 2,904 924 1,021Inventory finance — — 51 527 4,212Auto finance 3,464 2,323 799 — —Other 3 6 11 89 93
Total $ 114,071 $ 126,041 $ 135,283 $ 193,848 $ 632,837Non-accrual TDR Loans:
Consumer real estate $ 34,282 $ 71,961 $ 79,055 $ 87,685 $ 134,487Commercial 83 2,170 7,016 11,265 26,209Leasing and equipment finance 1,413 1,350 641 1,953 2,447Inventory finance 476 357 172 37 —Auto finance 5,351 5,504 8,440 3,676 470Other 1 — — — 1
Total $ 41,606 $ 81,342 $ 95,324 $ 104,616 $ 163,614Total TDR loans:
Consumer real estate $ 122,374 $ 170,567 $ 185,842 $ 199,618 $ 641,127Commercial 12,332 22,474 31,747 91,640 147,080Leasing and equipment finance 11,676 6,152 3,545 2,877 3,468Inventory finance 476 357 223 564 4,212Auto finance 8,815 7,827 9,239 3,676 470Other 4 6 11 89 94Total $ 155,677 $ 207,383 $ 230,607 $ 298,464 $ 796,451
Over 60-day delinquent accruing TDR loans as a percentage of totalaccruing TDR loans 0.36% 1.19% 1.54% 1.39% 1.28%
Total TDR loans were $155.7 million at December 31, 2017, a decrease of $51.7 million, or 24.9%, from $207.4 millionat December 31, 2016. Accruing TDR loans were $114.1 million at December 31, 2017, a decrease of $12.0 million,or 9.5%, from $126.0 million at December 31, 2016. The decrease in accruing TDR loans was primarily due to a$10.5 million decrease in consumer real estate accruing TDR loans driven by payoffs and the transfer of loans to non-accrual status and an $8.1 million decrease in commercial accruing TDR loans driven by the transfer of loans to non-accrual status and payoffs. These decreases were partially offset by a $5.5 million increase in leasing and equipmentfinance accruing TDR loans. Non-accrual TDR loans were $41.6 million at December 31, 2017, a decrease of$39.7 million, or 48.9%, from $81.3 million at December 31, 2016. The decrease was primarily due to a $37.7 milliondecrease in consumer real estate non-accrual TDR loans driven by the non-accrual loan sales in the first and thirdquarters of 2017.
TCF modifies loans through reductions in interest rates, extension of payment dates, term extensions or term extensionswith a reduction of contractual payments, but generally not through reductions of principal.
Loan modifications to borrowers who have not been granted concessions are not included in the table above. Loanmodifications to troubled borrowers are not reported as TDR loans in the calendar years after modification if the loanswere modified to an interest rate equal to or greater than the yields of new loan originations with comparable risk atthe time of restructuring and if the loan is performing based on the restructured terms; however, these loans are stillconsidered impaired and follow TCF's impaired loan reserve policies.
43

TCF typically reduces a consumer real estate customer's contractual payments by reducing the interest rate by anamount appropriate for the borrower's financial condition. Loans discharged in Chapter 7 bankruptcy where the borrowerdid not reaffirm the debt are reported as non-accrual TDR loans upon discharge as a result of the removal of theborrower's personal liability on the loan. These loans may return to accrual status when TCF expects full repaymentof the remaining pre-discharged contractual principal and interest. At December 31, 2017, 72.0% of total consumerreal estate TDR loans were accruing and TCF recognized more than 62% of the original contractual interest due onaccruing consumer real estate TDR loans in 2017, yielding 4.2%, by modifying the loans to qualified customers insteadof foreclosing on the property. At December 31, 2017, collection of principal and interest under the modified terms wasreasonably assured on all accruing consumer real estate TDR loans. TDR loans for the remaining classes of financingreceivables were not material at December 31, 2017.
See Note 7. Allowance for Loan and Lease Losses and Credit Quality Information of Notes to Consolidated FinancialStatements for further information regarding TCF's loan modifications.
Non-performing Assets TCF's non-accrual loans and leases and other real estate owned were as follows:
At December 31,(Dollars in thousands) 2017 2016 2015 2014 2013Consumer real estate:
First mortgage lien $ 61,950 $ 106,125 $ 124,156 $ 137,790 $ 180,811Junior lien 21,274 46,346 44,113 35,481 38,222
Total consumer real estate 83,224 152,471 168,269 173,271 219,033Commercial:
Commercial real estate 6,785 5,564 6,737 24,554 36,178Commercial business — 355 3,588 481 4,361
Total commercial 6,785 5,919 10,325 25,035 40,539Leasing and equipment finance 17,089 10,880 11,262 12,670 14,041Inventory finance 4,116 5,134 1,098 2,082 2,529Auto finance 7,366 7,038 9,509 3,676 470Other 2 3 3 — 410
Total non-accrual loans and leases 118,582 181,445 200,466 216,734 277,022Other real estate owned:
Consumer real estate 17,907 34,070 42,912 44,932 47,637Commercial real estate 318 12,727 7,070 20,718 21,237
Total other real estate owned 18,225 46,797 49,982 65,650 68,874Total non-accrual loans and leases and other real estate owned $ 136,807 $ 228,242 $ 250,448 $ 282,384 $ 345,896
Non-accrual loans and leases as a percentage of total loans andleases 0.62% 1.02% 1.15% 1.32% 1.75%
Non-accrual loans and leases and other real estate owned as apercentage of total loans and leases and other real estate owned 0.72 1.28 1.43 1.71 2.17
Allowance for loan and lease losses as a percentage of non-accrualloans and leases 144.24 88.33 77.85 75.75 91.05
Non-accrual loans and leases were $118.6 million at December 31, 2017, a decrease of $62.9 million, or 34.6%, from$181.4 million at December 31, 2016. The decrease was primarily due to the consumer real estate non-accrual loansales of $71.2 million in the first and third quarters of 2017, partially offset by an increase in leasing and equipmentfinance non-accrual loans and leases. Other real estate owned was $18.2 million at December 31, 2017, a decreaseof $28.6 million, or 61.1%, from $46.8 million at December 31, 2016. The decrease was primarily due to the sales ofconsumer real estate properties outpacing additions and sales of commercial real estate properties. See Note 2.Summary of Significant Accounting Policies and Note 7. Allowance for Loan and Lease Losses and Credit QualityInformation of Notes to Consolidated Financial Statements for further information.
44

Loans and leases are generally placed on non-accrual status when the collection of interest or principal is 90 days ormore past due unless, in the case of commercial loans, they are well secured and in process of collection. Delinquentconsumer real estate junior lien loans are also placed on non-accrual status when there is evidence that the relatedthird-party first lien mortgage may be 90 days or more past due, or foreclosure, charge-off or collection action hasbeen initiated. TDR loans are placed on non-accrual status prior to the past due thresholds outlined above if repaymentunder the modified terms is not likely after performing a well-documented credit analysis. Loans on non-accrual statusare generally reported as non-accrual loans until there is sustained repayment performance for six consecutive months,with the exception of loans not reaffirmed upon discharge under Chapter 7 bankruptcy, which remain on non-accrualstatus until a well-documented credit analysis indicates full repayment of the remaining pre-discharged contractualprincipal and interest is likely. For purposes of this disclosure, purchased credit impaired loans have been excluded.Most of TCF's non-accrual loans and past due loans are secured by real estate. Given the nature of these assets andthe related mortgage foreclosure, property sale and, if applicable, mortgage insurance claims processes, it can take18 months or longer for a loan to migrate from initial delinquency to final disposition. This resolution process generallytakes much longer for loans secured by real estate than for unsecured loans or loans secured by other property primarilydue to state real estate foreclosure laws.
Changes in the amount of non-accrual loans and leases were as follows:
At or For the Year Ended December 31, 2017
(In thousands)Consumer
Real Estate Commercial
Leasing andEquipment
FinanceInventoryFinance
AutoFinance Other Total
Balance, beginning of period $ 152,471 $ 5,919 $ 10,880 $ 5,134 $ 7,038 $ 3 $ 181,445Additions 64,540 16,726 28,779 9,950 9,730 81 129,806(Charge-offs) recoveries (7,313) (5,428) (8,175) (1,588) (2,281) 2 (24,783)Transfers to other assets (26,830) (100) (5,951) (1,858) (1,776) — (36,515)Return to accrual status (8,111) — (292) (3,011) — — (11,414)Payments received (20,576) (6,088) (8,152) (4,539) (5,345) (84) (44,784)Sales (72,448) (4,284) — — — — (76,732)Other, net 1,491 40 — 28 — — 1,559
Balance, end of period $ 83,224 $ 6,785 $ 17,089 $ 4,116 $ 7,366 $ 2 $ 118,582
At or For the Year Ended December 31, 2016
(In thousands)Consumer
Real Estate Commercial
Leasing andEquipment
FinanceInventoryFinance
AutoFinance Other Total
Balance, beginning of period $ 168,269 $ 10,325 $ 11,262 $ 1,098 $ 9,509 $ 3 $ 200,466Additions 89,484 5,325 20,714 12,963 5,762 156 134,404(Charge-offs) recoveries (12,674) (727) (5,074) (1,498) (2,675) (91) (22,739)Transfers to other assets (43,965) — (4,541) (1,496) (1,455) — (51,457)Return to accrual status (19,522) — (3,614) (1,242) — — (24,378)Payments received (28,949) (15,812) (7,867) (4,784) (4,044) (65) (61,521)Sales — (3,664) — — — — (3,664)Other, net (172) 10,472 — 93 (59) — 10,334
Balance, end of period $ 152,471 $ 5,919 $ 10,880 $ 5,134 $ 7,038 $ 3 $ 181,445
Loan and Lease Credit Classifications TCF assesses the risk of its loan and lease portfolio utilizing numerous riskcharacteristics as outlined in the previous sections. Loan and lease credit classifications are an additional characteristicmonitored in the overall credit risk process. Loan and lease credit classifications are derived from standard regulatoryrating definitions, which include: non-classified (pass and special mention) and classified (substandard and doubtful).Classified loans and leases have well-defined weaknesses, but may never result in a loss.
45
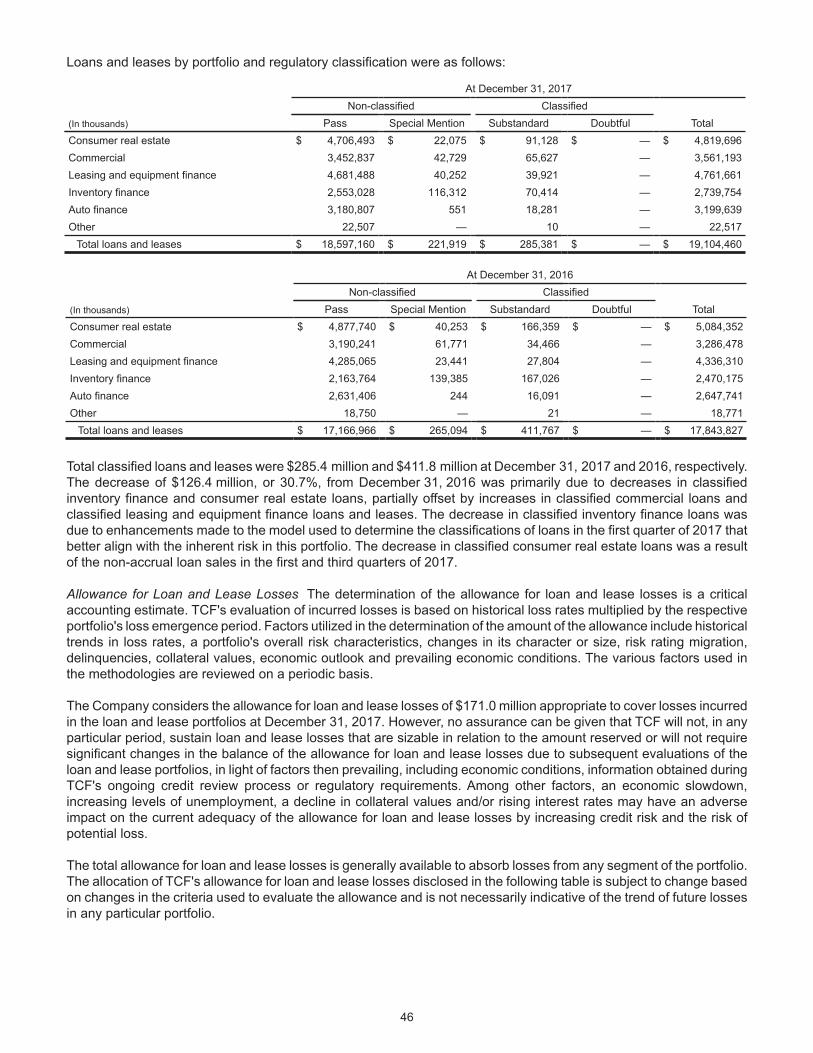
Loans and leases by portfolio and regulatory classification were as follows:
At December 31, 2017Non-classified Classified
Total(In thousands) Pass Special Mention Substandard DoubtfulConsumer real estate $ 4,706,493 $ 22,075 $ 91,128 $ — $ 4,819,696Commercial 3,452,837 42,729 65,627 — 3,561,193Leasing and equipment finance 4,681,488 40,252 39,921 — 4,761,661Inventory finance 2,553,028 116,312 70,414 — 2,739,754Auto finance 3,180,807 551 18,281 — 3,199,639Other 22,507 — 10 — 22,517
Total loans and leases $ 18,597,160 $ 221,919 $ 285,381 $ — $ 19,104,460
At December 31, 2016Non-classified Classified
Total(In thousands) Pass Special Mention Substandard DoubtfulConsumer real estate $ 4,877,740 $ 40,253 $ 166,359 $ — $ 5,084,352Commercial 3,190,241 61,771 34,466 — 3,286,478Leasing and equipment finance 4,285,065 23,441 27,804 — 4,336,310Inventory finance 2,163,764 139,385 167,026 — 2,470,175Auto finance 2,631,406 244 16,091 — 2,647,741Other 18,750 — 21 — 18,771
Total loans and leases $ 17,166,966 $ 265,094 $ 411,767 $ — $ 17,843,827
Total classified loans and leases were $285.4 million and $411.8 million at December 31, 2017 and 2016, respectively.The decrease of $126.4 million, or 30.7%, from December 31, 2016 was primarily due to decreases in classifiedinventory finance and consumer real estate loans, partially offset by increases in classified commercial loans andclassified leasing and equipment finance loans and leases. The decrease in classified inventory finance loans wasdue to enhancements made to the model used to determine the classifications of loans in the first quarter of 2017 thatbetter align with the inherent risk in this portfolio. The decrease in classified consumer real estate loans was a resultof the non-accrual loan sales in the first and third quarters of 2017.
Allowance for Loan and Lease Losses The determination of the allowance for loan and lease losses is a criticalaccounting estimate. TCF's evaluation of incurred losses is based on historical loss rates multiplied by the respectiveportfolio's loss emergence period. Factors utilized in the determination of the amount of the allowance include historicaltrends in loss rates, a portfolio's overall risk characteristics, changes in its character or size, risk rating migration,delinquencies, collateral values, economic outlook and prevailing economic conditions. The various factors used inthe methodologies are reviewed on a periodic basis. The Company considers the allowance for loan and lease losses of $171.0 million appropriate to cover losses incurredin the loan and lease portfolios at December 31, 2017. However, no assurance can be given that TCF will not, in anyparticular period, sustain loan and lease losses that are sizable in relation to the amount reserved or will not requiresignificant changes in the balance of the allowance for loan and lease losses due to subsequent evaluations of theloan and lease portfolios, in light of factors then prevailing, including economic conditions, information obtained duringTCF's ongoing credit review process or regulatory requirements. Among other factors, an economic slowdown,increasing levels of unemployment, a decline in collateral values and/or rising interest rates may have an adverseimpact on the current adequacy of the allowance for loan and lease losses by increasing credit risk and the risk ofpotential loss.
The total allowance for loan and lease losses is generally available to absorb losses from any segment of the portfolio.The allocation of TCF's allowance for loan and lease losses disclosed in the following table is subject to change basedon changes in the criteria used to evaluate the allowance and is not necessarily indicative of the trend of future lossesin any particular portfolio.
46

In conjunction with Note 7. Allowance for Loan and Lease Losses and Credit Quality Information of Notes to ConsolidatedFinancial Statements, detailed information regarding TCF's allowance for loan and lease losses was as follows:
Credit Loss ReservesCredit Loss Reserves as a Percentage of
PortfolioAt December 31, At December 31,
(Dollars in thousands) 2017 2016 2015 2014 2013 2017 2016 2015 2014 2013Consumer real estate:
First mortgage lien $ 26,698 $ 33,828 $ 36,888 $ 55,319 $133,009 1.36% 1.48% 1.41% 1.76% 3.53%Junior lien 20,470 25,620 31,104 30,042 43,021 0.72 0.92 1.10 1.18 1.67
Consumer real estate 47,168 59,448 67,992 85,361 176,030 0.98 1.17 1.24 1.50 2.78Commercial:
Commercial real estate 24,842 22,785 22,215 24,616 32,405 0.90 0.86 0.86 0.94 1.18Commercial business 12,353 9,910 7,970 6,751 5,062 1.53 1.52 1.44 1.27 1.25
Total commercial 37,195 32,695 30,185 31,367 37,467 1.04 0.99 0.96 0.99 1.19Leasing and equipment
finance 22,528 21,350 19,018 18,446 18,733 0.47 0.49 0.47 0.49 0.55Inventory finance 13,233 13,932 11,128 10,020 8,592 0.48 0.56 0.52 0.53 0.52Auto finance 50,225 32,310 26,486 18,230 10,623 1.57 1.22 1.00 0.95 0.86Other 692 534 1,245 745 785 3.07 2.84 6.45 3.09 2.94
Total allowance for loanand lease losses 171,041 160,269 156,054 164,169 252,230 0.90 0.90 0.90 1.00 1.59
Other credit loss reserves:Reserves for unfunded
commitments 1,479 1,115 1,044 943 980 N.A. N.A. N.A. N.A. N.A.Total credit loss
reserves $172,520 $161,384 $157,098 $165,112 $253,210 0.90 0.90 0.90 1.01 1.60N.A. Not Applicable.
47

Reconciliations of changes in the allowance for loan and lease losses were as follows:
Year Ended December 31,(Dollars in thousands) 2017 2016 2015 2014 2013Balance, beginning of period $ 160,269 $ 156,054 $ 164,169 $ 252,230 $ 267,128Charge-offs:
Consumer real estate:First mortgage lien (6,077) (10,413) (19,448) (43,632) (60,363)Junior lien (5,784) (8,211) (14,239) (19,494) (37,145)
Total consumer real estate (11,861) (18,624) (33,687) (63,126) (97,508)Commercial:
Commercial real estate (3,608) (752) (5,225) (8,646) (28,287)Commercial business (1,823) (1) (24) (11) (657)
Total commercial (5,431) (753) (5,249) (8,657) (28,944)Leasing and equipment finance (10,816) (7,738) (7,631) (7,316) (7,277)Inventory finance (3,014) (2,623) (2,501) (1,653) (1,141)Auto finance (41,101) (26,994) (18,386) (11,856) (5,305)Other (6,869) (7,353) (7,093) (8,359) (9,115)
Total charge-offs (79,092) (64,085) (74,547) (100,967) (149,290)Recoveries:
Consumer real estate:First mortgage lien 6,231 1,206 1,578 1,513 2,055Junior lien 14,550 5,859 5,850 5,354 6,589
Total consumer real estate 20,781 7,065 7,428 6,867 8,644Commercial:
Commercial real estate 776 308 2,032 754 2,667Commercial business 57 65 1,737 2,133 103
Total commercial 833 373 3,769 2,887 2,770Leasing and equipment finance 2,065 2,386 2,792 3,705 3,968Inventory finance 838 816 1,019 826 373Auto finance 6,625 3,853 2,971 1,491 607Other 3,510 4,357 5,034 5,860 6,518
Total recoveries 34,652 18,850 23,013 21,636 22,880Net charge-offs (44,440) (45,235) (51,534) (79,331) (126,410)
Provision for credit losses 68,443 65,874 52,944 95,737 118,368Other(1) (13,231) (16,424) (9,525) (104,467) (6,856)Balance, end of period $ 171,041 $ 160,269 $ 156,054 $ 164,169 $ 252,230Net charge-offs as a percentage of average loans and
leases 0.24% 0.26% 0.30% 0.49% 0.81%(1) Primarily includes the transfer of the allowance for loan and lease losses to held for sale.
Net charge-offs for 2017 were $44.4 million, or 0.24% of average loans and leases, compared with $45.2 million, or0.26% of average loans and leases for 2016 and $51.5 million, or 0.30% of average loans and leases for 2015. Netcharge-offs decreased $0.8 million in 2017 primarily due to the recovery of $13.3 million on previous charge-offs relatedto the consumer real estate non-accrual loans that were sold in the first and third quarters of 2017, partially offset byincreased net charge-offs in the auto finance, commercial and leasing and equipment finance portfolios. The increasein auto finance charge-offs was primarily due to the strategic shift from an originate-to-sell and originate-to-hold modelto an entirely originate-to-hold model, maturation of the portfolio and lower recoveries. The increase in commercialcharge-offs was primarily due to the charge-off of two loans during 2017. The increase in leasing and equipment financecharge-offs was primarily due to the charge-off of one loan in the fourth quarter of 2017. Net charge-offs decreased$6.3 million in 2016 primarily due to a decrease in consumer real estate net charge-offs, partially offset by an increasein auto finance net charge-offs. The decrease in net charge-offs in the consumer real estate portfolio was primarilydue to improved credit quality and increased home values. The increase in net charge-offs in the auto finance portfoliowas primarily due to the maturation of the portfolio and an industry decline in used auto values.
48
Liquidity Management TCF manages its liquidity to ensure that its funding needs are met both promptly and in acost-effective manner. Asset liquidity arises from liquid assets that can be sold or pledged as collateral, amortization,prepayment or maturity of assets and from the ability of TCF to sell loans. Liability liquidity results from the ability ofTCF to maintain a diverse set of funding sources to promptly meet funding requirements.
TCF's Asset & Liability Committee ("ALCO") and the Finance Committee of TCF Financial's Board of Directors haveadopted a Liquidity Management Policy for TCF Bank to direct management of the Company's liquidity risk. See "Item7A. Quantitative and Qualitative Disclosures about Market Risk" for further information.
TCF Bank had $242.6 million and $256.6 million of net liquidity qualifying interest-bearing deposits at the FederalReserve Bank at December 31, 2017 and 2016, respectively. Interest-bearing deposits held at the Federal ReserveBank and unencumbered U.S. Government sponsored enterprises and federal agencies mortgage-backed securitieswere $1.2 billion at both December 31, 2017 and 2016. In addition, TCF held unencumbered obligations of states andpolitical subdivisions totaling $814.3 million and $612.5 million at December 31, 2017 and 2016, respectively.
ALCO and the Finance Committee of TCF Financial's Board of Directors have adopted a Holding Company Investmentand Liquidity Management Policy, which establishes a minimum target amount of cash or liquid investments TCFFinancial will hold. See "Item 7A. Quantitative and Qualitative Disclosures about Market Risk" for further information.TCF Financial had cash and due from banks of $80.5 million and $69.7 million at December 31, 2017 and 2016,respectively.
Deposits are the primary source of TCF's funds for use in lending and for other general business purposes. In additionto deposits, TCF receives funds from loan and lease repayments, loan sales and borrowings. Lending activities, suchas loan originations and purchases and equipment purchases for lease financing, are the primary uses of TCF's funds.Deposit inflows and outflows are significantly influenced by general interest rates, money market conditions, competitionfor funds, customer service and other factors. TCF's deposit inflows and outflows have been and will continue to beaffected by these factors. Borrowings may be used to compensate for reductions in normal sources of funds, such asdeposit inflows at less than projected levels, net deposit outflows or to fund balance sheet growth. Historically, TCFhas borrowed primarily from the Federal Home Loan Bank ("FHLB") of Des Moines, institutional sources underrepurchase agreements and other sources. TCF had $1.6 billion of additional borrowing capacity at the FHLB of DesMoines at December 31, 2017, as well as access to the Federal Reserve Discount Window. In addition, TCF maintainsa diversified set of unsecured and uncommitted funding sources, including access to overnight federal funds purchasedlines, brokered deposits and capital markets.
The primary source of funding for TCF Commercial Finance Canada, Inc. ("TCFCFC") is a line of credit with TCF Bank.TCFCFC also maintains a $20.0 million Canadian dollar-denominated line of credit facility with a counterparty, whichis guaranteed by TCF Bank. TCFCFC had no outstanding borrowings at December 31, 2017 and $2.2 million (USD)outstanding under the line of credit with the counterparty at December 31, 2016.
49
Deposits Deposits totaled $18.3 billion at December 31, 2017, an increase of $1.1 billion, or 6.3%, from $17.2 billionat December 31, 2016. The increase was primarily due to growth in certificates of deposit, savings and checkingbalances, partially offset by a decrease in money market balances.
Non-interest bearing checking accounts represented 20.0% of total deposits at both December 31, 2017 and 2016.TCF's weighted-average interest rate for deposits, including non-interest bearing deposits, was 0.38% and 0.36% atDecember 31, 2017 and 2016, respectively. The increase was primarily due to increased average interest rates resultingfrom promotions for certificates of deposit and savings accounts, partially offset by decreased average interest rateson money market balances.
Checking, savings and certain money market deposits are an important source of low cost or no cost funds for TCF.The average balance of these types of deposits was $10.8 billion and $10.6 billion for 2017 and 2016, respectively.These deposits comprised approximately 61% and 62% of total average deposits for 2017 and 2016, respectively.

Certificates of deposit totaled $5.0 billion and $4.1 billion at December 31, 2017 and 2016, respectively. The maturitiesof certificates of deposit with denominations equal to or greater than $100,000 were as follows:
(In thousands)
Denominations $100Thousand or Greater
at December 31, 2017Maturity:
Three months or less $ 216,861Over three through six months 320,214Over six through 12 months 957,052Over 12 months 949,329 Total $ 2,443,456
50
Borrowings Borrowings totaled $1.2 billion and $1.1 billion at December 31, 2017 and 2016, respectively. Historically,TCF has borrowed primarily from the FHLB of Des Moines, institutional sources under repurchase agreements andother sources.
See Note 12. Short-term Borrowings and Note 13. Long-term Borrowings of Notes to Consolidated Financial Statementsfor further information regarding TCF's borrowings.
Contractual Obligations and Commitments As discussed further in Note 8. Premises and Equipment, Net; Note10. Investments in Affordable Housing Limited Liability Entities; Note 11. Deposits; Note 13. Long-term Borrowingsand Note 19. Financial Instruments with Off-Balance Sheet Risk of Notes to Consolidated Financial Statements, TCFhas certain obligations and commitments to make future payments under contracts.
At December 31, 2017, the aggregate contractual obligations and commitments were as follows:
Payments Due by Period
(In thousands) TotalLess than
1 year1-3
years3-5
yearsMore than
5 yearsContractual Obligations:
Certificates of deposit $ 4,982,271 $ 3,251,222 $ 1,700,057 $ 17,225 $ 13,767Long-term borrowings 1,251,606 52,347 929,714 121,293 148,252Annual rental commitments under non-cancelable
operating leases 158,639 29,892 55,228 29,090 44,429Contractual interest payments(1) 187,237 88,204 59,469 24,415 15,149Campus marketing agreement 26,065 2,745 5,490 5,490 12,340Investments in affordable housing limited liability entities 51,398 10,792 22,202 18,404 —Construction contracts and land purchase
commitments for future branch sites 21,568 21,568 — — —Liabilities related to acquisition and portfolio purchase 7,683 500 6,012 1,171 —
Total $ 6,686,467 $ 3,457,270 $ 2,778,172 $ 217,088 $ 233,937(1) Includes accrued interest and future contractual interest obligations on borrowings and time deposits.
Amount of Commitment - Expiration by Period
(In thousands) TotalLess than
1 year1-3
years3-5
yearsMore than
5 yearsCommitments:
Commitments to extend credit:Consumer real estate and other $ 1,484,065 $ 47,601 $ 65,531 $ 13,018 $ 1,357,915Commercial 1,033,973 159,509 631,636 220,540 22,288Leasing and equipment finance 126,249 126,249 — — —
Total commitments to extend credit 2,644,287 333,359 697,167 233,558 1,380,203Standby letters of credit and guarantees on industrial
revenue bonds 12,992 11,859 539 594 —Total $ 2,657,279 $ 345,218 $ 697,706 $ 234,152 $ 1,380,203

Unrecognized tax benefits, projected benefit obligations, demand deposits with indeterminate maturities anddiscretionary credit facilities that do not obligate the Company to lend have been excluded from the contractualobligations table above.
TCF's campus marketing agreement consists of fixed and minimum obligations for exclusive marketing rights andnaming rights with one university. TCF is obligated to make annual payments for the exclusive marketing rights through2023, with a renewal option to extend the terms through 2029. TCF is obligated to make annual payments for theexclusive naming rights through 2030 and TCF has the option to extend the terms through 2040 upon making a renewaloption payment.
Liabilities related to acquisition and portfolio purchase consist of a liability of $5.9 million to be paid within three yearsrelated to TCF's acquisition of EFLC, as well as liabilities related to the leasing and equipment finance loan and leaseportfolio purchase. See Note 9. Goodwill and Other Intangible Assets for further information.
Commitments to extend credit are agreements to lend to a customer provided there is no violation of any condition inthe contract. These commitments generally have fixed expiration dates or other termination clauses and may requirepayment of a fee. Since certain of the commitments are expected to expire without being drawn upon, the totalcommitment amounts do not necessarily represent future cash requirements. Collateral to secure any funding of thesecommitments predominantly consists of residential and commercial real estate. Standby letters of credit and guarantees on industrial revenue bonds are conditional commitments issued by TCFguaranteeing the performance of a customer to a third party. These conditional commitments expire in various yearsthrough 2021. Collateral held consists primarily of commercial real estate mortgages. Since the conditions under whichTCF is required to fund these commitments may not materialize, the cash requirements are expected to be less thanthe total outstanding commitments.
51
Capital Management TCF is committed to managing capital to maintain protection for stockholders, depositors andcreditors. TCF employs a variety of capital management tools to achieve its capital goals, including, but not limited to,dividends, public offerings of preferred and common stock, common stock repurchases, redemption of preferred stockand the issuance or redemption of subordinated debt and other capital instruments. TCF maintains a Capital Planningand Dividend Policy which applies to TCF Financial and incorporates TCF Bank's Capital Planning and Dividend Policy.These policies ensure that capital strategy actions, including the addition of new capital, if needed, common stockrepurchases, redemption of preferred stock or the declaration of preferred stock, common stock and bank dividendsare prudent, efficient and provide value to TCF's stockholders, while ensuring that past and prospective earningsretention is consistent with TCF's capital needs, asset quality and overall financial condition. TCF and TCF Bankmanage their capital levels to exceed all regulatory capital requirements, which were achieved at December 31, 2017and 2016. See Note 16. Regulatory Capital Requirements of Notes to Consolidated Financial Statements for furtherinformation. Equity Total equity at December 31, 2017 was $2.7 billion, or 11.7% of total assets, compared with $2.4 billion, or11.4% of total assets, at December 31, 2016.
Preferred Stock Preferred stock was $265.8 million at December 31, 2017, an increase of $2.6 million, or 1.0%, from$263.2 million at December 31, 2016. The increase was primarily due to the issuance of the Series C non-cumulativeperpetual preferred stock, partially offset by the redemption of the Series A non-cumulative perpetual preferred stock.
At December 31, 2017 and 2016, there were 4,000,000 shares outstanding of the 6.45% Series B non-cumulativeperpetual preferred stock of TCF Financial Corporation, par value $0.01 per share, with a liquidation preference of$25 per share (the "Series B Preferred Stock"). Dividends are payable on the Series B Preferred Stock if, as and whendeclared by TCF's Board of Directors on a non-cumulative basis on March 1, June 1, September 1 and December 1of each year at a per annum rate of 6.45%. The Series B Preferred Stock may be redeemed at TCF's option in wholeor in part at any time. On January 30, 2018, TCF's Board of Directors approved the redemption of all outstandingshares of the Series B Preferred Stock on March 1, 2018.

At December 31, 2017, there were 7,000,000 depositary shares outstanding, each representing a 1/1000th ownershipinterest in a share of the 5.70% Series C non-cumulative perpetual preferred stock of TCF Financial Corporation, parvalue $0.01 per share, with a liquidation preference of $25,000 per share (equivalent to $25 per depositary share) (the"Series C Preferred Stock"). Dividends are payable on the Series C Preferred Stock if, as and when declared by TCF'sBoard of Directors on a non-cumulative basis on March 1, June 1, September 1 and December 1 of each year at aper annum rate of 5.70%. The Series C Preferred Stock may be redeemed at TCF's option in whole or in part onDecember 1, 2022 or on any dividend payment date thereafter.
The Series C Preferred Stock was issued on September 14, 2017 for an aggregate public offering price of $175.0 million.Net proceeds of the offering to TCF, after deducting deferred stock issuance costs of $5.7 million, were $169.3 million.
On October 16, 2017, TCF redeemed the 6,900,000 depositary shares, each representing a 1/1000th ownership interestin a share of the 7.50% Series A non-cumulative perpetual preferred stock of TCF Financial Corporation, par value$0.01 per share, with a liquidation preference of $25,000 per share (equivalent to $25 per depositary share) (the "SeriesA Preferred Stock") for $172.5 million using the net proceeds from the offering of its Series C depositary shares andadditional cash on hand. Dividends were payable on the Series A Preferred Stock if, as and when declared by TCF'sBoard of Directors on a non-cumulative basis on March 1, June 1, September 1 and December 1 of each year at aper annum rate of 7.50%.
Common Stock TCF repurchased 446,464 shares of its common stock during the fourth quarter of 2017 at an averagecost of $20.51 per share under its share repurchase program. At December 31, 2017, TCF had the ability to purchaseup to $140.8 million in aggregate value of shares of TCF's common stock in its stock repurchase program authorizedby its Board of Directors on November 27, 2017. Future repurchases will be based on market conditions, the tradingprice of TCF shares and other factors. The ability to repurchase shares in the future may be adversely affected by newlegislation or regulations or by changes in regulatory policies. This authorization may be commenced or suspendedat any time or from time to time.
Dividends to common stockholders on a per share basis totaled 7.5 cents for each quarter of the years endedDecember 31, 2017 and 2016, respectively. TCF's common dividend payout ratio for the quarters endedDecember 31, 2017 and 2016 was 13.2% and 27.8%, respectively. On January 30, 2018, TCF's Board of Directorsdeclared a regular quarterly cash dividend of 15.0 cents per common share, an increase of 100.0 percent, payableon March 1, 2018 to stockholders of record at the close of business on February 15, 2018. TCF Financial's primaryfunding sources for dividends are earnings and dividends received from TCF Bank.
Total common stockholders' equity at December 31, 2017 was $2.4 billion, or 10.42% of total assets, compared with$2.2 billion, or 10.09% of total assets, at December 31, 2016. Tangible common equity at December 31, 2017 was$2.2 billion, or 9.72% of total tangible assets, compared with $1.9 billion, or 9.13% of total tangible assets, atDecember 31, 2016. Tangible common equity and tangible assets are not financial measures recognized undergenerally accepted accounting principles in the United States ("GAAP") (i.e., non-GAAP). Tangible common equityrepresents total equity less non-controlling interest in subsidiaries, preferred stock, goodwill and other intangible assets.Tangible assets represent total assets less goodwill and other intangible assets. When evaluating capital adequacyand utilization, management considers financial measures such as tangible common equity to tangible assets. Thisnon-GAAP financial measure is viewed by management as a useful indicator of capital levels available to withstandunexpected market or economic conditions and also provide investors, regulators and other users with information tobe viewed in relation to other banking institutions.
52
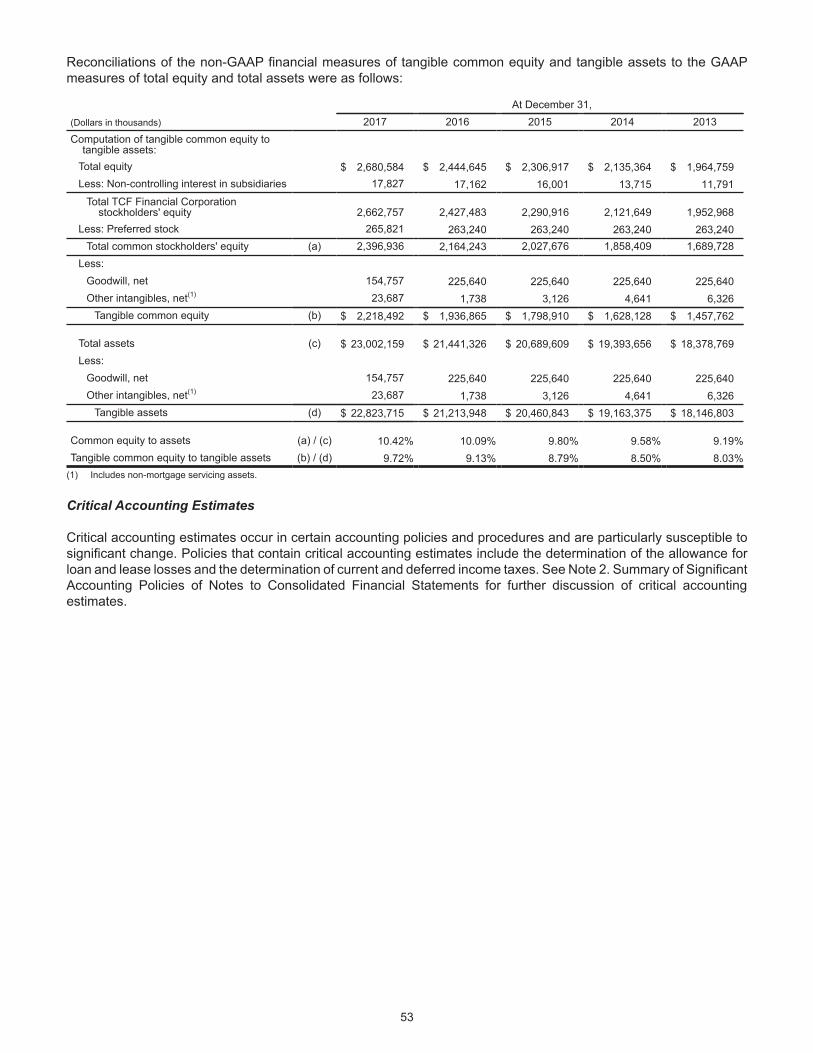
Reconciliations of the non-GAAP financial measures of tangible common equity and tangible assets to the GAAPmeasures of total equity and total assets were as follows:
At December 31,(Dollars in thousands) 2017 2016 2015 2014 2013Computation of tangible common equity to
tangible assets:Total equity $ 2,680,584 $ 2,444,645 $ 2,306,917 $ 2,135,364 $ 1,964,759Less: Non-controlling interest in subsidiaries 17,827 17,162 16,001 13,715 11,791
Total TCF Financial Corporationstockholders' equity 2,662,757 2,427,483 2,290,916 2,121,649 1,952,968
Less: Preferred stock 265,821 263,240 263,240 263,240 263,240Total common stockholders' equity (a) 2,396,936 2,164,243 2,027,676 1,858,409 1,689,728
Less:Goodwill, net 154,757 225,640 225,640 225,640 225,640Other intangibles, net(1) 23,687 1,738 3,126 4,641 6,326
Tangible common equity (b) $ 2,218,492 $ 1,936,865 $ 1,798,910 $ 1,628,128 $ 1,457,762
Total assets (c) $ 23,002,159 $ 21,441,326 $ 20,689,609 $ 19,393,656 $ 18,378,769Less:
Goodwill, net 154,757 225,640 225,640 225,640 225,640Other intangibles, net(1) 23,687 1,738 3,126 4,641 6,326
Tangible assets (d) $ 22,823,715 $ 21,213,948 $ 20,460,843 $ 19,163,375 $ 18,146,803
Common equity to assets (a) / (c) 10.42% 10.09% 9.80% 9.58% 9.19%Tangible common equity to tangible assets (b) / (d) 9.72% 9.13% 8.79% 8.50% 8.03%
(1) Includes non-mortgage servicing assets.
53
Critical Accounting Estimates
Critical accounting estimates occur in certain accounting policies and procedures and are particularly susceptible tosignificant change. Policies that contain critical accounting estimates include the determination of the allowance forloan and lease losses and the determination of current and deferred income taxes. See Note 2. Summary of SignificantAccounting Policies of Notes to Consolidated Financial Statements for further discussion of critical accountingestimates.
Recent Accounting Developments
In August 2017, the Financial Accounting Standards Board ("FASB") issued Accounting Standards Update ("ASU")No. 2017-12: Derivatives and Hedging (Topic 815): Targeted Improvements to Accounting for Hedging Activities, whichexpands hedge accounting for nonfinancial and financial risk components and amends measurement methodologiesto more closely align hedge accounting with a company's risk management activities. The ASU decreases the complexityof preparing and understanding hedge results through measurement and reporting of hedge ineffectiveness. In addition,disclosures will be enhanced and the presentation of hedged results changed to align the effects of the hedginginstrument and the hedged item. The adoption of this ASU will be required on a modified retrospective basis beginningwith TCF's Quarterly Report on Form 10-Q for the quarter ending March 31, 2019; however early adoption is allowed.TCF adopted this ASU effective January 1, 2018. The adoption of this guidance will not have a material impact on ourconsolidated financial statements.
In May 2017, the FASB issued ASU No. 2017-09: Compensation - Stock Compensation (Topic 718): Scope ofModification Accounting, which provides guidance about which changes to the terms and conditions of a share-basedpayment award requires an entity to apply modification accounting in Topic 718. The adoption of this ASU will berequired on a prospective basis to an award modified beginning with TCF's Quarterly Report on Form 10-Q for thequarter ending March 31, 2018. Early adoption is allowed. The adoption of this guidance will not have a material impacton our consolidated financial statements.
In March 2017, the FASB issued ASU No. 2017-07: Compensation - Retirement Benefits (Topic 715): Improving thePresentation of Net Periodic Pension Cost and Net Periodic Postretirement Benefit Cost, which will change howemployers that sponsor defined benefit pension and/or other postretirement benefit plans present the net periodicbenefit cost in the income statement. Under the new guidance, employers will present the service cost component ofthe net periodic benefit cost in the same income statement line item as other employee compensation costs arisingfrom services rendered during the period. Only the service cost component will be eligible for capitalization in assets.The other components of net periodic benefit cost will be presented separately from the line item that includes servicecost and outside of any subtotal of operating income. In addition, disclosure of the line items used to present the othercomponents of net periodic benefit cost is required if the components are not presented separately in the incomestatement. The adoption of this ASU will be required on either a full or modified retrospective basis beginning withTCF's Quarterly Report on Form 10-Q for the quarter ending March 31, 2018. Early adoption is allowed. The adoptionof this guidance will not have a material impact on our consolidated financial statements.
In February 2017, the FASB issued ASU No. 2017-05: Other Income - Gains and Losses from the Derecognition ofNonfinancial Assets (Subtopic 610-20), which provides guidance for recognizing gains and losses from the transfer ofnonfinancial assets in contracts with non-customers. The ASU also clarifies that Accounting Standards Codification("ASC") 610-20 applies to the derecognition of nonfinancial assets and in substance nonfinancial assets unless otherspecific guidance applies or the sale is to a customer. The new guidance does not apply to the derecognition ofbusinesses, nonprofit activities, financial assets, including equity method investments, or to revenue contracts withcustomers. The adoption of this ASU will be required on either a full or modified retrospective basis beginning withTCF's Quarterly Report on Form 10-Q for the quarter ending March 31, 2018. Early adoption is allowed. The adoptionof this guidance will not have a material impact on our consolidated financial statements.
In January 2017, the FASB issued ASU No. 2017-01, Business Combinations (Topic 805): Clarifying the Definition ofa Business, which clarifies the definition of a business with the objective of adding guidance to assist companies withevaluating whether transactions should be accounted for as acquisitions (or disposals) of assets or businesses. TheASU provides a more robust framework to use in determining when a set of assets and activities is a business. Theadoption of this ASU will be required on a prospective basis beginning with TCF's Quarterly Report on Form 10-Q forthe quarter ending March 31, 2018. Upon adoption, TCF will evaluate future transactions to determine if they shouldbe accounted for as acquisitions (or disposals) of assets or businesses.
In November 2016, the FASB issued ASU No. 2016-18, Statement of Cash Flows (Topic 230): Restricted Cash, whichrequires entities to show changes in the total of cash, cash equivalents, restricted cash and restricted cash equivalentsin the statement of cash flows. As a result, entities will no longer present transfers between cash and cash equivalents,restricted cash and restricted cash equivalents in the statement of cash flows. The adoption of this ASU will be requiredon a retrospective basis beginning with TCF's Quarterly Report on Form 10-Q for the quarter ending March 31, 2018.The adoption of this guidance will not have a material impact on our consolidated financial statements.
54

In August 2016, the FASB issued ASU No. 2016-15, Statement of Cash Flows (Topic 230): Classification of CertainCash Receipts and Cash Payments, which addresses eight specific cash flow issues with the objective of reducingthe existing diversity in practice in how certain types of cash receipts and cash payments are presented in the statementof cash flows. The adoption of this ASU will be required on a retrospective basis beginning with TCF's Quarterly Reporton Form 10-Q for the quarter ending March 31, 2018. Early adoption is allowed. The adoption of this guidance will nothave a material impact on our consolidated financial statements.
In June 2016, the FASB issued ASU No. 2016-13, Financial Instruments - Credit Losses (Topic 326): Measurementof Credit Losses on Financial Instruments, which changes the impairment model for most financial assets, includingtrade and other receivables, held to maturity debt securities, loans and purchased financial assets with creditdeterioration. The ASU requires the use of a current expected credit loss ("CECL") approach to determine the allowancefor credit losses for loans and held to maturity securities. CECL requires loss estimates for the remaining estimatedlife of the asset using historical loss data as well as reasonable and supportable forecasts based on current economicconditions. The adoption of this ASU will be required on a modified retrospective basis with a cumulative-effectadjustment required beginning with TCF's Quarterly Report on Form 10-Q for the quarter ending March 31, 2020. Earlyadoption is allowed. Management is currently evaluating the potential impact of this guidance on our consolidatedfinancial statements. CECL represents a significant change in GAAP and may result in a material impact on ourconsolidated financial statements. The impact of the ASU will depend on the composition of TCF's portfolios andgeneral economic conditions at the date of adoption. Additionally, there are several implementation questions whichcould affect the adoption impact once resolved. TCF has established a governance structure to implement the ASUand is in the process of assessing its current processes and determining future methodologies to be used upon adoption.
In March 2016, the FASB issued ASU No. 2016-04, Liabilities - Extinguishment of Liabilities (Subtopic 405-20):Recognition of Breakage for Certain Prepaid Stored-Value Products, which requires issuers of prepaid stored-valueproducts redeemable for goods, services or cash at third-party merchants to derecognize liabilities related to thoseproducts for breakage. The adoption of this ASU will be required on a retrospective or modified retrospective basisbeginning with TCF's Quarterly Report on Form 10-Q for the quarter ending March 31, 2018. Early adoption is allowed.The adoption of this guidance will not have a material impact on our consolidated financial statements.
In February 2016, the FASB issued ASU No. 2016-02, Leases (Topic 842), which, along with other amendments,requires lessees to recognize most leases on their balance sheet. Lessor accounting is largely unchanged. The ASUrequires both quantitative and qualitative disclosure regarding key information about leasing arrangements from bothlessees and lessors. In September 2017, the FASB issued ASU No. 2017-13, Revenue Recognition (Topic 605),Revenue from Contracts with Customers (Topic 606), Leases (Topic 840) and Leases (Topic 842): Amendments toSEC Paragraphs, which rescinds certain SEC Observer comments and staff announcements from the lease guidanceand incorporates SEC staff announcements on the effect of a change in tax law on leverage leases from ASC 840 intoASC 842. The adoption of these ASUs will be required on a modified retrospective basis beginning with TCF's QuarterlyReport on Form 10-Q for the quarter ending March 31, 2019. Early adoption is allowed. Management has started toimplement this ASU which has included an initial evaluation of TCF's leasing contracts and activities. Managementhas evaluated and plans to elect the practical expedients, which would allow for existing leases to be accounted forconsistent with current guidance, with the exception of the balance sheet recognition for lessees. The adoption of thisguidance is not expected to result in a material change to lessee expense recognition. While there are limited changesto lessor accounting, there are certain implementation questions whose resolution may result in changes in recognitionand measurement from current practice. Management will continue to evaluate the impact of this guidance on ourconsolidated financial statements.
55

In May 2014, the FASB issued ASU No. 2014-09, Revenue from Contracts with Customers (Topic 606), which requiresrevenue recognition to depict the transfer of promised goods or services to customers in an amount that reflects theconsideration to which the entity expects to be entitled in exchange for those goods or services. In August 2015, theFASB issued ASU No. 2015-14, Revenue from Contracts with Customers (Topic 606): Deferral of the Effective Date,which delays the effective date of the new revenue recognition requirements in ASU No. 2014-09 by one year. In March2016, the FASB issued ASU No. 2016-08, Revenue from Contracts with Customers (Topic 606): Principal versus AgentConsiderations (Reporting Revenue Gross versus Net), which clarifies how an entity should identify the unit ofaccounting for the principal versus agent evaluation and how it should apply the control principle to certain types ofarrangements by explaining what a principal controls before the specified good or service is transferred to the customer.In April 2016, the FASB issued ASU No. 2016-10, Revenue from Contracts with Customers (Topic 606): IdentifyingPerformance Obligations and Licensing, which amends the guidance for identifying performance obligations andaccounting for a license which grants the right to use intellectual property. In May 2016, the FASB issued ASU No.2016-12, Revenue from Contracts with Customers (Topic 606): Narrow-Scope Improvements and Practical Expedients,which provides narrow-scope improvements to transition, collectability, noncash consideration and the presentationof sales and other similar taxes. In December 2016, the FASB issued ASU No. 2016-20, Technical Corrections andImprovements to Topic 606, Revenue from Contracts with Customers, which provides guidance that affects narrowaspects of the guidance issued in ASU No. 2014-09. In September 2017, the FASB issued ASU 2017-13, RevenueRecognition (Topic 605), Revenue from Contracts with Customers (Topic 606), Leases (Topic 840) and Leases (Topic842): Amendments to SEC Paragraphs, which rescinds certain SEC Observer comments on accounting formanagement fees based on a formula that is codified in ASC 605. In November 2017, the FASB issued ASU 2017-14,Income Statement - Reporting Comprehensive Income (Topic 220), Revenue Recognition (Topic 605) and Revenuefrom Contracts with Customers (Topic 606), which amends certain paragraphs in ASC 605 by superseding theparagraphs with a link to ASC 606.The adoption of these ASUs will be required using one of two retrospective applicationmethods beginning with TCF's Quarterly Report on Form 10-Q for the quarter ending March 31, 2018. TCF plans toapply the modified retrospective method with a cumulative-effect adjustment to opening retained earnings.
TCF derives a majority of its revenue from loans and leases, as well as any related servicing fee revenue, which arenot within the scope of these ASUs. These ASUs are applicable to most of the fees and service charges, card andATM revenue earned by TCF, as well as the gains on sales of certain non-financial assets. However, the recognitionof these revenue streams does not change in a significant manner as a result of the adoption of these ASUs. Themajority of this revenue is both charged to the customer and earned either at a point in time or on a transactional basis.As a result, the revenue expected to be recognized in any future year related to remaining performance obligations,contracts where revenue is recognized when invoiced and contracts with variable consideration related to undeliveredperformance obligations are not material. In addition, receivables related to fees and service charges and the relatedbad debt expense are not material. There are no material contract assets, contract liabilities or deferred contract costsrecorded in the Company's Consolidated Statements of Financial Condition. As a significant majority of the Company'srevenue streams are not included in the scope of these ASUs and the recognition of revenue for the revenue streamswithin the scope of these ASUs are not significantly changed, the adoption of this guidance will not have a materialimpact on the Company's consolidated financial statements.
56

Forward-looking Information Any statements contained in this Annual Report on Form 10-K regarding the outlook for the Company's businessesand their respective markets, such as projections of future performance, targets, guidance, statements of the Company'splans and objectives, forecasts of market trends and other matters, are forward-looking statements based on theCompany's assumptions and beliefs. Such statements may be identified by such words or phrases as "will likely result,""are expected to," "will continue," "outlook," "will benefit," "is anticipated," "estimate," "project," "management believes"or similar expressions. These forward-looking statements are subject to certain risks and uncertainties that could causeactual results to differ materially from those discussed in such statements and no assurance can be given that theresults in any forward-looking statement will be achieved. For these statements, TCF claims the protection of the safeharbor for forward-looking statements contained in the Private Securities Litigation Reform Act of 1995. Any forward-looking statement speaks only as of the date on which it is made and we disclaim any obligation to subsequently reviseany forward-looking statement to reflect events or circumstances after such date or to reflect the occurrence ofanticipated or unanticipated events. Certain factors could cause the Company's future results to differ materially from those expressed or implied in anyforward-looking statements contained herein. These factors include the factors discussed in Part I, Item 1A. of thisAnnual Report on Form 10-K under the heading "Risk Factors," the factors discussed below and any other cautionarystatements, written or oral, which may be made or referred to in connection with any such forward-looking statements.Since it is not possible to foresee all such factors, these factors should not be considered as complete or exhaustive. Adverse Economic or Business Conditions; Competitive Conditions; Credit and Other Risks. Deterioration ingeneral economic and banking industry conditions, including those arising from government shutdowns, defaults,anticipated defaults or rating agency downgrades of sovereign debt (including debt of the U.S.), or increases inunemployment; adverse economic, business and competitive developments such as shrinking interest margins,reduced demand for financial services and loan and lease products, deposit outflows, increased deposit costs due tocompetition for deposit growth and evolving payment system developments, deposit account attrition or an inability toincrease the number of deposit accounts; customers completing financial transactions without using a bank; adversechanges in credit quality and other risks posed by TCF's loan, lease, investment, securities held to maturity andsecurities available for sale portfolios, including declines in commercial or residential real estate values, changes inthe allowance for loan and lease losses dictated by new market conditions or regulatory requirements, or the inabilityof home equity line borrowers to make increased payments caused by increased interest rates or amortization ofprincipal; deviations from estimates of prepayment rates and fluctuations in interest rates that result in decreases inthe value of assets such as interest-only strips that arise in connection with TCF's loan sales activity; interest rate risksresulting from fluctuations in prevailing interest rates or other factors that result in a mismatch between yields earnedon TCF's interest-earning assets and the rates paid on its deposits and borrowings; foreign currency exchange risks;counterparty risk, including the risk of defaults by our counterparties or diminished availability of counterparties whosatisfy our credit quality requirements; decreases in demand for the types of equipment that TCF leases or finances;the effect of any negative publicity; the effects of man-made and natural disasters, including fires, floods, tornadoes,hurricanes, acts of terrorism, civil disturbances and environmental damage, which may negatively affect our operationsand/or our customers.
Legislative and Regulatory Requirements. New consumer protection and supervisory requirements and regulations,including those resulting from action by the Consumer Financial Protection Bureau ("CFPB") and changes in the scopeof Federal preemption of state laws that could be applied to national banks and their subsidiaries; the imposition ofrequirements that adversely impact TCF's deposit, lending, loan collection and other business activities such asmortgage foreclosure moratorium laws, further regulation of financial institution campus banking programs, restrictionson arbitration or new restrictions on loan and lease products; changes affecting customer account charges and feeincome, including changes to interchange rates; regulatory actions or changes in customer opt-in preferences withrespect to overdrafts, which may have an adverse impact on TCF; governmental regulations or judicial actions affectingthe security interests of creditors; deficiencies in TCF's compliance programs, including under the Bank Secrecy Actin past or future periods, which may result in regulatory enforcement action including monetary penalties; increasedhealth care costs including those resulting from health care reform; regulatory criticism and resulting enforcementactions or other adverse consequences such as increased capital requirements, higher deposit insurance assessmentsor monetary damages or penalties; heightened regulatory practices, requirements or expectations, including, but notlimited to, requirements related to enterprise risk management, the Bank Secrecy Act and anti-money launderingcompliance activity.
57

Earnings/Capital Risks and Constraints, Liquidity Risks. Limitations on TCF's ability to carry out its sharerepurchase program, pay dividends or increase dividends because of financial performance deterioration, regulatoryrestrictions or limitations; increased deposit insurance premiums, special assessments or other costs related to adverseconditions in the banking industry; the impact on banks of regulatory reform, including additional capital, leverage,liquidity and risk management requirements or changes in the composition of qualifying regulatory capital; adversechanges in securities markets directly or indirectly affecting TCF's ability to sell assets or to fund its operations;diminished unsecured borrowing capacity resulting from TCF credit rating downgrades or unfavorable conditions inthe credit markets that restrict or limit various funding sources; costs associated with new regulatory requirements orinterpretive guidance including those relating to liquidity; uncertainties relating to future retail deposit account changes,including limitations on TCF's ability to predict customer behavior and the impact on TCF's fee revenues.
Branching Risk; Growth Risks. Adverse developments affecting TCF's supermarket banking relationships or eitherof the primary supermarket chains in which TCF maintains supermarket branches; costs related to closingunderperforming branches; inability to timely close underperforming branches due to long-term lease obligations;slower than anticipated growth in existing or acquired businesses; inability to successfully execute on TCF's growthstrategy through acquisitions or expanding existing business relationships; failure to expand or diversify TCF's balancesheet through new or expanded programs or opportunities; failure to effectuate, and risks of claims related to, salesof loans; risks related to new product additions and addition of distribution channels (or entry into new markets) forexisting products.
Technological and Operational Matters. Technological or operational difficulties, loss or theft of information, cyber-attacks and other security breaches, counterparty failures and the possibility that deposit account losses (fraudulentchecks, etc.) may increase; failure to keep pace with technological change, such as by failing to develop and maintaintechnology necessary to satisfy customer demands, costs and possible disruptions related to upgrading systems; thefailure to attract and retain key employees.
Litigation Risks. Results of litigation or government enforcement actions such as TCF's pending litigation with theCFPB and related matters, including class action litigation or enforcement actions concerning TCF's lending or depositactivities, including account opening/origination, servicing practices, fees or charges, employment practices or checkingaccount overdraft program "opt in" requirements; possible increases in indemnification obligations for certain litigationagainst Visa U.S.A.
Accounting, Audit, Tax and Insurance Matters. Changes in accounting standards or interpretations of existingstandards; federal or state monetary, fiscal or tax policies, including the impact of the Tax Cuts and Jobs Act tax reformlegislation and adoption of federal or state legislation that would increase federal or state taxes; ineffective internalcontrols; adverse federal, state or foreign tax assessments or findings in tax audits; lack of or inadequate insurancecoverage for claims against TCF; potential for claims and legal action related to TCF's fiduciary responsibilities.
58

Item 7A. Quantitative and Qualitative Disclosures About Market Risk
TCF's results of operations depend, to a large degree, on its net interest income and its ability to manage interest raterisk. Although TCF manages other risks in the normal course of business, such as credit risk, liquidity risk and foreigncurrency risk, the Company considers interest rate risk to be one of its more significant market risks.
Interest Rate Risk
TCF's ALCO and the Finance Committee of TCF Financial's Board of Directors have adopted interest rate risk policylimits which are incorporated into the Company's investment policy. Interest rate risk is defined as the exposure of netinterest income and fair value of financial instruments (interest-earning assets, deposits and borrowings) to movementsin interest rates. Since TCF does not hold a trading portfolio, the Company is not exposed to market risk from tradingactivities. As such, the major sources of the Company's interest rate risk are timing differences in the maturity andrepricing characteristics of assets and liabilities, changes in the shape of the yield curve, changes in consumer behaviorand changes in relationships between rate indices (basis risk). Management measures these risks and their impactin various ways, including through the use of simulation and valuation analyses. The interest rate scenarios may includegradual or rapid changes in interest rates, spread narrowing and widening, yield curve twists and changes inassumptions about consumer behavior in various interest rate scenarios. A mismatch between maturities, interest ratesensitivities and prepayment characteristics of assets and liabilities results in interest rate risk. TCF, like most financialinstitutions, has material interest rate risk exposure to changes in both short- and long-term interest rates, as well asvariable interest rate indices (e.g., the prime rate or the London InterBank Offered Rate). TCF's ALCO is responsible for reviewing the Company's interest rate sensitivity position and establishing policies tomonitor and limit exposure to interest rate risk. ALCO manages TCF's interest rate risk based on interest rateexpectations and other factors. The principal objective of TCF in managing its assets and liabilities is to providemaximum levels of net interest income and facilitate the funding needs of the Company, while maintaining acceptablelevels of interest rate risk and liquidity risk. ALCO primarily uses two interest rate risk tools with policy limits to evaluate TCF's interest rate risk: net interest incomesimulation and economic value of equity ("EVE") analysis. In addition, the interest rate gap is reviewed periodically tomonitor asset and liability repricing over various time periods.
Management utilizes net interest income simulation models to estimate the near-term effects of changing interest rateson its net interest income. Net interest income simulation involves forecasting net interest income under a variety ofscenarios, including the level of interest rates, the shape of the yield curve and the spreads between market interestrates. Management exercises its best judgment in making assumptions regarding events that management caninfluence, such as non-contractual deposit repricings and events outside management's control, including consumerbehavior on loan and deposit activity and the effect that competition has on both loan and deposit pricing. Theseassumptions are subjective and, as a result, net interest income simulation results will differ from actual results dueto the timing, magnitude and frequency of interest rate changes and changes in market conditions, consumer behaviorand management strategies, among other factors. TCF performs various sensitivity analyses on assumptions of newloan spreads, prepayment rates, basis risk, deposit attrition and deposit repricing.
The following table presents changes in TCF's net interest income over a twelve month period if short- and long-terminterest rates were to sustain an immediate increase of 100 basis points and 200 basis points. The impact of plannedchanges to interest-earning assets and new business activities is factored into the simulation model.
Impact on Net Interest IncomeDecember 31,
(Dollars in millions) 2017 2016Immediate Change in Interest Rates:
+200 basis points $ 97.5 10.1% $ 97.2 10.9%+100 basis points 53.1 5.5 52.1 5.9
59

As of December 31, 2017, approximately 61% of TCF's loan and lease balances were expected to reprice, amortizeor prepay in the next 12 months and approximately 61% of TCF's deposit balances were low cost or no cost deposits.TCF believes that the mix of assets repricing compared with low cost or no cost deposits positions TCF well for risinginterest rates.
Management also uses EVE and interest rate gap analyses to measure risk in the balance sheet that might not betaken into account in the net interest income simulation analysis. Net interest income simulation highlights exposureover a relatively short time period, while EVE analysis incorporates all cash flows over the estimated remaining life ofall balance sheet positions. The valuation of the balance sheet, at a point in time, is defined as the discounted presentvalue of asset cash flows minus the discounted present value of liability cash flows. EVE analysis addresses only thecurrent balance sheet and does not incorporate the planned changes to interest-earning assets that are used in thenet interest income simulation model. As with the net interest income simulation model, EVE analysis is based on keyassumptions about the timing and variability of balance sheet cash flows and does not take into account any potentialresponses by management to anticipated changes in interest rates.
Interest rate gap is primarily the difference between interest-earning assets and interest-bearing liabilities repricingwithin a given period and represents the net asset or liability sensitivity at a point in time. An interest rate gap measurecould be significantly affected by external factors such as loan prepayments, early withdrawals of deposits, changesin the correlation of various interest-bearing instruments, competition, or a rise or decline in interest rates.
Credit Risk
Credit risk is defined as the risk to earnings or capital if an obligor fails to meet the terms of any contract with theCompany or otherwise fails to perform as agreed, such as the failure of customers and counterparties to meet theircontractual obligations, as well as contingent exposures from unfunded loan commitments and letters of credit.
TCF's Enterprise Risk Management Committee meets at least quarterly and is responsible for monitoring the loan andlease portfolio composition and risk tolerance within the various segments of the portfolio. The Enterprise RiskManagement Committee and the Board of Directors have adopted a Risk Appetite Statement to manage the Company'scredit risk by setting (i) a desired balance between asset classes, (ii) concentration limits based on loan type, businessline and geographic region and (iii) maximum tolerances for credit performance. To manage credit risk arising fromlending and leasing activities, management has adopted and maintains underwriting policies and procedures andperiodically reviews the appropriateness of these policies and procedures. Customers and guarantors or recourseproviders are evaluated as part of initial underwriting processes and through periodic reviews. For consumer loans,credit scoring models are used to help determine eligibility for credit and terms of credit. These models are periodicallyreviewed to verify that they are predictive of borrower performance. Limits are established on the exposure to a singlecustomer (including affiliates) and on concentrations for certain categories of customers. Loan and lease credit approvallevels are established so that larger credit exposures receive managerial review at the appropriate level through thecredit committees.
Management continuously monitors asset quality in order to manage the Company's credit risk and to determine theappropriateness of valuation allowances, including, in the case of commercial loans, inventory finance loans andequipment finance loans and leases, a risk rating methodology under which a rating of one through nine is assignedto each loan or lease. The rating reflects management's assessment of the potential impact on repayment of thecustomer's financial and operational condition. Asset quality is monitored separately based on the type or category ofloan or lease. The rating process allows management to better define the Company's loan and lease portfolio riskprofile. Management also uses various risk models to estimate probable impact on payment performance under variousscenarios, both expected and unexpected.
The Company also has credit risk in its securities portfolio related to obligations of states and political subdivisions.The Company maintains a restrictive set of underwriting criteria and regularly monitors credit performance under thedirection and supervision of the TCF Bank Credit Committee to manage this risk. Credit risk in the remainder of thesecurities portfolio is minimal. The remainder of the securities available for sale and securities held to maturity portfoliosas of December 31, 2017 consist primarily of fixed-rate mortgage-backed securities issued and guaranteed by FannieMae. All investment related counterparties and transaction limits are reviewed and approved annually by both ALCOand the TCF Bank Credit Committee.
60

Liquidity Risk
Liquidity risk is defined as the risk to earnings or capital arising from the Company's inability to meet its obligationswhen they come due without incurring unacceptable losses.
ALCO and the Finance Committee of TCF Financial's Board of Directors have adopted a Holding Company Investmentand Liquidity Management Policy, which establishes a minimum target amount of cash or liquid investments TCFFinancial will hold. TCF Financial's primary source of cash flow is capital distributions from TCF Bank. TCF Bank maybe required to receive regulatory approval prior to making any such distributions in the future and such distributionsmay be restricted by its federal banking regulators. TCF Bank's ability to make any such distributions will also dependon its earnings and ability to meet minimum regulatory capital requirements in effect during future periods. See "Item1. Business - Regulation - Restrictions on Distributions", Note 16. Regulatory Capital Requirements and Note 25.Parent Company Financial Information of Notes to Consolidated Financial Statements for further information.
ALCO and the Finance Committee of TCF Financial's Board of Directors have adopted a Liquidity Management Policyfor TCF Bank to direct management of the Company's liquidity risk. The objective of the Liquidity Management Policyis to ensure that TCF meets its cash and collateral obligations promptly, in a cost-effective manner and with the highestdegree of reliability. The maintenance of adequate levels of asset and liability liquidity will provide TCF with the abilityto meet both expected and unexpected cash flows and collateral needs. Key liquidity ratios, asset liquidity levels andthe amount available from funding sources are reported to ALCO on a monthly basis. TCF's Liquidity ManagementPolicy defines liquidity stress scenarios and establishes asset liquidity target ranges based on those stress scenariosthat are deemed appropriate for its risk profile.
TCF's asset liquidity may be held in the form of on-balance sheet cash invested with the Federal Reserve Bank orother highly liquid marketable securities that are not pledged and can be sold or pledged to various counterpartiesunder established agreements. Interest-bearing deposits held at the Federal Reserve Bank and unencumbered U.S.Government sponsored enterprises and federal agencies mortgage-backed securities were $1.2 billion atDecember 31, 2017. In addition, TCF held unencumbered obligations of states and political subdivisions totaling$814.3 million at December 31, 2017.
Deposits are TCF's primary source of funding. TCF also maintains secured sources of funding, which primarily include$1.6 billion of additional borrowing capacity at the FHLB of Des Moines at December 31, 2017, as well as access tothe Federal Reserve Discount Window. Collateral pledged by TCF to the FHLB and the Federal Reserve Bank mayconsist of consumer and commercial real estate loans and mortgage-backed securities. The FHLB relies on its owninternal credit analysis of TCF when determining TCF's secured borrowing capacity. In addition to the above, TCFmaintains a diversified set of unsecured and uncommitted funding sources, including access to overnight federal fundspurchased lines, brokered deposits and capital markets. TCF has developed and maintains a contingency fundingplan should certain liquidity needs arise.
Foreign Currency Risk
The Company is also exposed to foreign currency risk as changes in the exchange rate of the Canadian dollar mayimpact the Company's investment in TCFCFC. TCF enters into forward foreign exchange contracts in order to minimizethe risk of changes in foreign exchange rates on its investment in and loans to TCFCFC. The values of forward foreignexchange contracts vary over their contractual lives as the related currency exchange rates fluctuate. TCF may alsoexperience realized and unrealized gains or losses on forward foreign exchange contracts as a result of changes inforeign exchange rates. See Note 2. Summary of Significant Accounting Policies and Note 20. Derivative Instrumentsof Notes to Consolidated Financial Statements for further information.
61

Item 8. Financial Statements and Supplementary Data
62
Report of Independent Registered Public Accounting Firm
To the Stockholders and Board of Directors TCF Financial Corporation:
Opinion on the Consolidated Financial Statements
We have audited the accompanying consolidated statements of financial condition of TCF Financial Corporationand subsidiaries (the "Company") as of December 31, 2017 and 2016, and the related consolidated statements ofincome, comprehensive income, equity, and cash flows for each of the years in the three-year period endedDecember 31, 2017, and the related notes (collectively, the "consolidated financial statements"). In our opinion, theconsolidated financial statements present fairly, in all material respects, the financial position of the Company as ofDecember 31, 2017 and 2016, and the results of its operations and its cash flows for each of the years in the three-year period ended December 31, 2017, in conformity with U.S. generally accepted accounting principles.
We also have audited, in accordance with the standards of the Public Company Accounting Oversight Board (UnitedStates) ("PCAOB"), the Company’s internal control over financial reporting as of December 31, 2017, based on criteriaestablished in Internal Control - Integrated Framework (2013) issued by the Committee of Sponsoring Organizationsof the Treadway Commission, and our report dated February 23, 2018 expressed an unqualified opinion on theeffectiveness of the Company’s internal control over financial reporting.
Basis for Opinion
These consolidated financial statements are the responsibility of the Company’s management. Our responsibility isto express an opinion on these consolidated financial statements based on our audits. We are a public accountingfirm registered with the PCAOB and are required to be independent with respect to the Company in accordance withthe U.S. federal securities laws and the applicable rules and regulations of the Securities and Exchange Commissionand the PCAOB.
We conducted our audits in accordance with the standards of the PCAOB. Those standards require that we plan andperform the audit to obtain reasonable assurance about whether the consolidated financial statements are free ofmaterial misstatement, whether due to error or fraud. Our audits included performing procedures to assess the risksof material misstatement of the consolidated financial statements, whether due to error or fraud, and performingprocedures that respond to those risks. Such procedures included examining, on a test basis, evidence regarding theamounts and disclosures in the consolidated financial statements. Our audits also included evaluating the accountingprinciples used and significant estimates made by management, as well as evaluating the overall presentation of theconsolidated financial statements. We believe that our audits provide a reasonable basis for our opinion.
We have served as the Company's auditor since 1991.
Minneapolis, MinnesotaFebruary 23, 2018
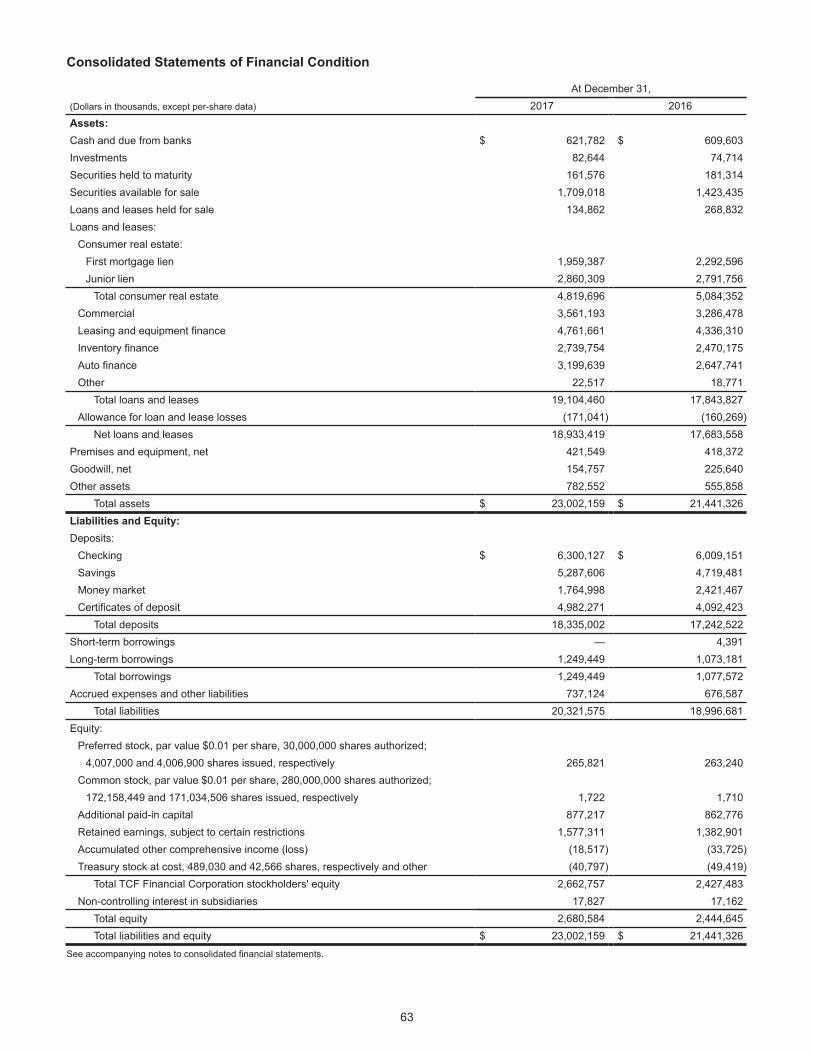
Consolidated Statements of Financial Condition
At December 31,(Dollars in thousands, except per-share data) 2017 2016Assets:Cash and due from banks $ 621,782 $ 609,603Investments 82,644 74,714Securities held to maturity 161,576 181,314Securities available for sale 1,709,018 1,423,435Loans and leases held for sale 134,862 268,832Loans and leases:
Consumer real estate:First mortgage lien 1,959,387 2,292,596Junior lien 2,860,309 2,791,756
Total consumer real estate 4,819,696 5,084,352Commercial 3,561,193 3,286,478Leasing and equipment finance 4,761,661 4,336,310Inventory finance 2,739,754 2,470,175Auto finance 3,199,639 2,647,741Other 22,517 18,771
Total loans and leases 19,104,460 17,843,827Allowance for loan and lease losses (171,041) (160,269)
Net loans and leases 18,933,419 17,683,558Premises and equipment, net 421,549 418,372Goodwill, net 154,757 225,640Other assets 782,552 555,858
Total assets $ 23,002,159 $ 21,441,326Liabilities and Equity:Deposits:
Checking $ 6,300,127 $ 6,009,151Savings 5,287,606 4,719,481Money market 1,764,998 2,421,467Certificates of deposit 4,982,271 4,092,423
Total deposits 18,335,002 17,242,522Short-term borrowings — 4,391Long-term borrowings 1,249,449 1,073,181
Total borrowings 1,249,449 1,077,572Accrued expenses and other liabilities 737,124 676,587
Total liabilities 20,321,575 18,996,681Equity:
Preferred stock, par value $0.01 per share, 30,000,000 shares authorized;4,007,000 and 4,006,900 shares issued, respectively 265,821 263,240
Common stock, par value $0.01 per share, 280,000,000 shares authorized;172,158,449 and 171,034,506 shares issued, respectively 1,722 1,710
Additional paid-in capital 877,217 862,776Retained earnings, subject to certain restrictions 1,577,311 1,382,901Accumulated other comprehensive income (loss) (18,517) (33,725)Treasury stock at cost, 489,030 and 42,566 shares, respectively and other (40,797) (49,419)
Total TCF Financial Corporation stockholders' equity 2,662,757 2,427,483Non-controlling interest in subsidiaries 17,827 17,162
Total equity 2,680,584 2,444,645Total liabilities and equity $ 23,002,159 $ 21,441,326
See accompanying notes to consolidated financial statements.
63

Consolidated Statements of Income
Year Ended December 31,(In thousands, except per-share data) 2017 2016 2015Interest income:
Loans and leases $ 954,246 $ 850,546 $ 832,736Securities available for sale 33,278 26,573 15,648Securities held to maturity 4,436 4,649 5,486Loans held for sale and other 27,097 48,962 38,060
Total interest income 1,019,057 930,730 891,930Interest expense:
Deposits 66,012 61,788 48,226Borrowings 27,807 20,836 23,316
Total interest expense 93,819 82,624 71,542Net interest income 925,238 848,106 820,388
Provision for credit losses 68,443 65,874 52,944Net interest income after provision for credit losses 856,795 782,232 767,444
Non-interest income:Fees and service charges 131,887 137,664 144,999Card revenue 55,732 54,882 54,387ATM revenue 19,624 20,445 21,544
Subtotal 207,243 212,991 220,930Gains on sales of auto loans, net 5,460 34,832 30,580Gains on sales of consumer real estate loans, net 37,327 50,427 40,964Servicing fee income 41,347 40,182 31,229
Subtotal 84,134 125,441 102,773Leasing and equipment finance 145,039 119,166 108,129Other 11,646 8,883 10,463
Fees and other revenue 448,062 466,481 442,295Gains (losses) on securities, net 237 (581) (297)
Total non-interest income 448,299 465,900 441,998Non-interest expense:
Compensation and employee benefits 483,235 474,722 457,743Occupancy and equipment 156,909 149,980 144,962Other 345,456 231,420 229,255
Subtotal 985,600 856,122 831,960Operating lease depreciation 55,901 40,359 39,409Foreclosed real estate and repossessed assets, net 17,756 13,187 23,193Other credit costs, net 677 219 185
Total non-interest expense 1,059,934 909,887 894,747Income before income tax expense (benefit) 245,160 338,245 314,695
Income tax expense (benefit) (33,624) 116,528 108,872Income after income tax expense (benefit) 278,784 221,717 205,823
Income attributable to non-controlling interest 10,147 9,593 8,700Net income attributable to TCF Financial Corporation 268,637 212,124 197,123
Preferred stock dividends 19,904 19,388 19,388Impact of preferred stock redemption 5,779 — —Net income available to common stockholders $ 242,954 $ 192,736 $ 177,735Earnings per common share:
Basic $ 1.44 $ 1.15 $ 1.07Diluted $ 1.44 $ 1.15 $ 1.07
See accompanying notes to consolidated financial statements.
64

Consolidated Statements of Comprehensive Income
Year Ended December 31,(In thousands) 2017 2016 2015Net income attributable to TCF Financial Corporation $ 268,637 $ 212,124 $ 197,123Other comprehensive income (loss), net of tax:
Net unrealized gains (losses) on securities available for saleand interest-only strips 16,454 (18,894) (816)
Net unrealized gains (losses) on net investment hedges (2,746) (756) 4,713Foreign currency translation adjustment 4,921 1,300 (8,304)Recognized postretirement prior service cost (29) (29) (29)
Total other comprehensive income (loss), net of tax 18,600 (18,379) (4,436)Comprehensive income $ 287,237 $ 193,745 $ 192,687
See accompanying notes to consolidated financial statements.
65

Consolidated Statements of Equity
TCF Financial Corporation
Number ofShares Issued
Preferred Stock
Common Stock
AdditionalPaid-in Capital
Retained Earnings
Accumulated Other
Comprehensive Income (Loss)
TreasuryStock
and Other Total
Non-controlling
InterestTotal
Equity(Dollars in thousands) Preferred Common
Balance, December 31,2014 4,006,900 167,503,568 $ 263,240 $ 1,675 $ 817,130 $1,099,914 $ (10,910) $ (49,400) $2,121,649 $ 13,715 $ 2,135,364
Net income — — — — — 197,123 — — 197,123 8,700 205,823
Other comprehensiveincome (loss), net of tax — — — — — — (4,436) — (4,436) — (4,436)
Net investment by(distribution to) non-controlling interest — — — — — — — — — (6,414) (6,414)
Dividends on preferredstock — — — — — (19,388) — — (19,388) — (19,388)
Dividends on commonstock — — — — — (37,302) — — (37,302) — (37,302)
Common sharespurchased by TCFemployee benefit plans — 1,588,111 — 16 24,819 — — — 24,835 — 24,835
Stock compensation plans,net of tax — 795,351 — 8 8,427 — — — 8,435 — 8,435
Change in shares held intrust for deferredcompensation plans, atcost — — — — 1,460 — — (1,460) — — —
Balance, December 31,2015 4,006,900 169,887,030 263,240 1,699 851,836 1,240,347 (15,346) (50,860) 2,290,916 16,001 2,306,917
Net income — — — — — 212,124 — — 212,124 9,593 221,717
Other comprehensiveincome (loss), net of tax — — — — — — (18,379) — (18,379) — (18,379)
Net investment by(distribution to) non-controlling interest — — — — — — — — — (8,432) (8,432)
Dividends on preferredstock — — — — — (19,388) — — (19,388) — (19,388)
Dividends on commonstock — — — — — (50,182) — — (50,182) — (50,182)
Common sharespurchased by TCFemployee benefit plans — 511,420 — 5 5,833 — — — 5,838 — 5,838
Stock compensation plans,net of tax — 636,056 — 6 6,548 — — — 6,554 — 6,554
Change in shares held intrust for deferredcompensation plans, atcost — — — — (1,441) — — 1,441 — — —
Balance,December 31, 2016 4,006,900 171,034,506 263,240 1,710 862,776 1,382,901 (33,725) (49,419) 2,427,483 17,162 2,444,645
Change in accountingprinciples — — — — 1,319 2,073 (3,392) — — — —
Net income — — — — — 268,637 — — 268,637 10,147 278,784
Other comprehensiveincome (loss), net of tax — — — — — — 18,600 — 18,600 — 18,600
Net investment by(distribution to) non-controlling interest — — — — — — — — — (9,482) (9,482)
Public offering of Series CPreferred Stock 7,000 — 169,302 — — — — — 169,302 — 169,302
Redemption of Series APreferred Stock (6,900) — (166,721) — — (5,779) — — (172,500) — (172,500)
Repurchase of 446,464shares of common stock — — — — — — — (9,163) (9,163) — (9,163)
Dividends on preferredstock — — — — — (19,904) — — (19,904) — (19,904)
Dividends on commonstock — — — — — (50,617) — — (50,617) — (50,617)
Common sharespurchased by TCFemployee benefit plans — 1,381,448 — 14 23,240 — — — 23,254 — 23,254
Stock compensation plans,net of tax — (257,505) — (2) 7,667 — — — 7,665 — 7,665
Change in shares held intrust for deferredcompensation plans, atcost — — — — (17,785) — — 17,785 — — —
Balance,December 31, 2017 4,007,000 172,158,449 $ 265,821 $ 1,722 $ 877,217 $1,577,311 $ (18,517) $ (40,797) $2,662,757 $ 17,827 $ 2,680,584
See accompanying notes to consolidated financial statements.
66

Consolidated Statements of Cash Flows
Year Ended December 31,(In thousands) 2017 2016 2015Cash flows from operating activities:
Net income $ 278,784 $ 221,717 $ 205,823Adjustments to reconcile net income to net cash provided by (used in) operating activities:
Provision for credit losses 68,443 65,874 52,944Depreciation and amortization 206,567 182,226 157,287Impairment of goodwill and other intangible assets 73,409 — —Provision (benefit) for deferred income taxes (53,729) 32,966 20,786Proceeds from sales of loans and leases held for sale 280,640 1,044,282 970,467Originations of loans and leases held for sale, net of repayments (430,121) (1,207,227) (965,712)Gains on sales of assets, net (51,965) (97,383) (80,471)Net change in other assets and accrued expenses and other liabilities (96,380) 71,495 31,975Other, net (36,196) (24,667) (29,439)
Net cash provided by (used in) operating activities 239,452 289,283 363,660Cash flows from investing activities:
Proceeds from sales of securities — — 177Proceeds from maturities of and principal collected on securities 137,544 145,782 94,250Purchases of securities (354,608) (692,996) (510,675)Redemption of Federal Home Loan Bank stock 246,002 156,967 153,005Purchases of Federal Home Loan Bank stock (254,000) (161,080) (138,000)Proceeds from sales of loans and leases 1,618,791 2,830,807 1,795,602Loan and lease originations and purchases, net of principal collected on loans and leases (1,808,603) (2,200,776) (1,968,134)Acquisition of Equipment Financing & Leasing Corporation, net of cash acquired (8,120) — —Proceeds from sales of lease equipment 10,188 11,650 10,041Purchases of lease equipment (1,038,208) (1,197,281) (1,087,438)Proceeds from sales of real estate owned 53,687 65,235 71,709Purchases of premises and equipment (48,428) (34,513) (53,594)Other, net 26,103 23,002 16,416
Net cash provided by (used in) investing activities (1,419,652) (1,053,203) (1,616,641)Cash flows from financing activities:
Net change in deposits 1,094,612 518,468 1,256,646Net change in short-term borrowings (4,747) (1,192) 1,072Proceeds from long-term borrowings 9,990,967 5,582,983 4,471,086Payments on long-term borrowings (9,816,286) (5,542,831) (4,666,595)Payments on liabilities related to acquisition and portfolio purchase (3,000) — —Net proceeds from public offering of Series C preferred stock 169,302 — —Redemption of Series A preferred stock (172,500) — —Repurchases of common stock (9,163) — —Common shares sold to TCF employee benefit plans 23,254 5,838 24,835Dividends paid on preferred stock (19,904) (19,388) (19,388)Dividends paid on common stock (50,617) (50,182) (37,302)Stock compensation tax (expense) benefit — (377) 558Exercise of stock options (57) (701) 2,570Net investment by (distribution to) non-controlling interest (9,482) (8,432) (6,414)
Net cash provided by (used in) financing activities 1,192,379 484,186 1,027,068Net change in cash and due from banks 12,179 (279,734) (225,913)Cash and due from banks at beginning of period 609,603 889,337 1,115,250Cash and due from banks at end of period $ 621,782 $ 609,603 $ 889,337Supplemental disclosures of cash flow information:
Cash paid (received) for:Interest on deposits and borrowings $ 86,411 $ 78,930 $ 64,855Income taxes, net 62,115 23,064 79,687
Transfer of loans and leases to other assets 100,608 107,768 107,403Transfer of loans and leases from held for investment to held for sale, net 1,320,210 2,739,126 1,752,587
See accompanying notes to consolidated financial statements.
67
Notes to Consolidated Financial Statements
68
Note 1. Basis of Presentation
TCF Financial Corporation (together with its direct and indirect subsidiaries, "we," "us," "our," "TCF" or the "Company"),a Delaware corporation, is a national bank holding company based in Wayzata, Minnesota. References herein to "TCFFinancial" or the "Holding Company" refer to TCF Financial Corporation on an unconsolidated basis. TCF's principalsubsidiary, TCF National Bank ("TCF Bank"), is headquartered in Sioux Falls, South Dakota. TCF Bank operates bankbranches in Illinois, Minnesota, Michigan, Colorado, Wisconsin, Arizona and South Dakota (TCF's primary bankingmarkets), providing convenient financial services, including select locations open seven days a week with extendedhours and on most holidays, full-service supermarket branches, access to automated teller machine ("ATM") networksand digital banking channels. Through its direct subsidiaries, TCF Bank also provides a full range of consumer facingand commercial services, including providing consumer banking services in 46 states, commercial banking servicesin 34 states, commercial leasing and equipment financing in all 50 states and, to a limited extent, in foreign countriesand commercial inventory financing in all 50 states and Canada and, to a limited extent, in other foreign countries.
The accompanying consolidated financial statements are prepared in conformity with U.S. generally acceptedaccounting principles ("GAAP"). The preparation of financial statements in conformity with GAAP requires managementto make estimates and assumptions that affect the reported amounts of assets and liabilities, disclosure of contingentassets and liabilities at the date of the financial statements and the reported amount of revenues and expenses duringthe reporting period. These estimates are based on information available to management at the time the estimatesare made. Actual results could differ from those estimates. All significant intercompany accounts and transactions havebeen eliminated in consolidation. Certain reclassifications have been made to prior period financial statements toconform to the current period presentation.
Effective April 1, 2017, the Company executed its strategic shift from an originate-to-sell and originate-to-hold modelto an entirely originate-to-hold model for its auto finance business and effective December 1, 2017, the Companydiscontinued auto finance loan originations. The determination was based on management's review of strategicalternatives and the financial outlook of the auto finance loan origination business compared with alternative uses ofcapital. TCF's subsidiary, Gateway One Lending & Finance, LLC ("Gateway One"), will continue to service existingauto loans on its balance sheet and those serviced for others. The decision to discontinue auto finance loan originationsresulted in a goodwill impairment charge of $73.0 million, an other intangible assets impairment charge of $0.4 millionand approximately $14.8 million of expenses related to severance, other asset impairments and lease terminationexpenses in 2017.
Note 2. Summary of Significant Accounting Policies Critical Accounting Estimates
Critical accounting estimates occur in certain accounting policies and procedures and are particularly susceptible tosignificant change. Policies that contain critical accounting estimates include the determination of the allowance forloan and lease losses and the determination of current and deferred income taxes.
Allowance for Loan and Lease Losses The allowance for loan and lease losses is maintained at a level believedto be appropriate to provide for probable loan and lease losses incurred in the portfolio as of the balance sheet date,including known or anticipated problem loans and leases, as well as for loans and leases which are not currentlyknown to require specific allowances. Loans classified as troubled debt restructuring ("TDR") loans are consideredimpaired loans, along with non-accrual commercial, equipment finance and inventory finance loans. TCF individuallyevaluates impairment on all impaired loans and all non-accrual leases and other consumer real estate, commercialand auto finance loans specifically identified for evaluation. All other loans and leases are evaluated collectively forimpairment.
Loan impairment on consumer real estate TDR loans is a key component of the allowance for loan and lease losses.Impairment is generally based on the present value of the expected future cash flows discounted at the loan's initialeffective interest rate, unless the loans are collateral dependent, in which case loan impairment is based on the fairvalue of the collateral less estimated selling costs.

Impairment on commercial loans, inventory finance loans and leasing and equipment finance loans and leases isgenerally based on the present value of the expected future cash flows discounted at the initial effective interest rateof the loan or lease, unless the loan or lease is collateral dependent, in which case impairment is based on the fairvalue of collateral less estimated selling costs; however, if payment or satisfaction of the loan or lease is dependenton the operation, rather than the sale of the collateral, the impairment does not include estimated selling costs.
Impairment on auto finance loans is generally based on the fair value of collateral less estimated selling costs. Theimpairment for all other loans and leases is evaluated collectively by various characteristics. The collective evaluationof incurred losses in these portfolios is based on their historical loss rates multiplied by the respective loss emergenceperiod. Factors utilized in the determination of the amount of the allowance include historical trends in loss rates, aportfolio's overall risk characteristics, changes in its character or size, risk rating migration, delinquencies, collateralvalues, economic outlook and prevailing economic conditions. The various factors used in the methodologies arereviewed on a periodic basis.
Loans and leases are charged off to the extent they are deemed to be uncollectible. Charge-offs related to losses areutilized in the historical data in calculating the allowance for loan and lease losses. Consumer real estate loans arecharged off to the estimated fair value of the underlying collateral, less estimated selling costs, no later than 150 dayspast due. Additional review of the fair value, less estimated costs to sell, compared with the recorded value occursupon foreclosure and additional charge-offs are recorded if necessary. Commercial loans, leasing and equipmentfinance loans and leases and inventory finance loans that are considered collateral dependent are charged off toestimated fair value, less estimated selling costs when it becomes probable, based on current information and events,that all principal and interest amounts will not be collectible in accordance with their contractual terms. Auto financeloans will be charged off in full no later than 120 days past due, unless repossession is reasonably assured and inprocess, in which case the loan would be charged off to the fair value of the collateral, less estimated selling costs.Consumer real estate and auto finance loans in bankruptcy status may be charged down to the fair value of thecollateral, less estimated selling costs, within 60 days past due based on specific criteria. Deposit account overdraftsare reported in other loans. Net losses on uncollectible overdrafts are reported as net charge-offs in the allowancefor loan and lease losses within 60 days from the date of overdraft. Loans that are not collateral dependent are chargedoff when deemed uncollectible based on specific facts and circumstances.
The amount of the allowance for loan and lease losses significantly depends on management's estimates of variablesaffecting valuation, appraisals of collateral, evaluations of performance and status and the amounts and timing offuture cash flows expected to be received. Such estimates, appraisals, evaluations and cash flows may be subjectto frequent adjustments due to changing economic prospects of borrowers, lessees or properties. These estimatesare reviewed periodically and adjustments, if necessary, are recorded in the provision for credit losses in the periodsin which they become known. See Note 7. Allowance for Loan and Lease Losses and Credit Quality Information forfurther information on the allowance for loan and lease losses.
Income Taxes Income taxes are accounted for using the asset and liability method. Under this method, deferred taxassets and liabilities are recognized for the future tax consequences attributable to differences between the financialstatement carrying amounts of existing assets and liabilities and their respective tax basis carrying amounts. Deferredtax assets and liabilities are measured using enacted tax rates expected to apply to taxable income in the years inwhich those temporary differences are expected to be recovered or settled. The effect on deferred tax assets andliabilities of a change in tax rates is recorded in income tax expense in the Consolidated Statements of Income in theperiod in which the enactment date occurs. If current period income tax rates change, the impact on the annualeffective income tax rate is applied year to date in the period of enactment.
The determination of current and deferred income taxes is a critical accounting estimate that is based on complexanalyses of many factors, including interpretation of income tax laws, the evaluation of uncertain tax positions,differences between the tax and financial reporting bases of assets and liabilities (temporary differences), estimatesof amounts due or owed, the timing of reversals of temporary differences and current financial accounting standards.Additionally, there can be no assurance that estimates and interpretations used in determining income tax assets orliabilities will not be challenged by taxing authorities. Actual results could differ significantly from the estimates andtax law interpretations used in determining the current and deferred income tax assets and liabilities.
69
In the preparation of income tax returns, tax positions are taken based on interpretation of income tax laws for whichthe outcome is uncertain. Management periodically reviews and evaluates the status of uncertain tax positions andmakes estimates of amounts ultimately due or owed. The benefits of tax positions are recorded in income tax expensein the Consolidated Statements of Income net of the estimates of ultimate amounts due or owed, including anyapplicable interest and penalties. Changes in the estimated amounts due or owed may result from closing of thestatute of limitations on tax returns, new legislation, clarification of existing legislation through governmentpronouncements, judicial action and through the examination process. TCF's policy is to report interest and penalties,if any, related to unrecognized tax benefits in income tax expense in the Consolidated Statements of Income. SeeNote 14. Income Taxes for further information on income taxes.
Other Significant Accounting Policies
Securities Held to Maturity Securities held to maturity are carried at cost and adjusted for amortization of premiumsor accretion of discounts using a level yield method; however, transfers of securities available for sale to securitiesheld to maturity are made at fair value at the date of transfer. The unrealized holding gain or loss at the date of eachtransfer is retained in accumulated other comprehensive income (loss) and in the carrying value of the held to maturityinvestment security. Such amounts are then amortized over the remaining life of the transferred security as anadjustment of the yield on those securities. TCF periodically evaluates securities held to maturity for other thantemporary impairment. Declines in value considered other than temporary, if any, would be recorded in non-interestincome within gains (losses) on securities, net. See Note 5. Securities Available for Sale and Securities Held to Maturityfor further information on securities held to maturity.
Securities Available for Sale Securities available for sale are carried at fair value with the unrealized gains or lossesnet of related deferred income taxes reported within accumulated other comprehensive income (loss). The cost ofsecurities sold is determined on a specific identification basis and gains or losses on sales of securities available forsale are recognized on trade dates. Discounts and premiums on securities available for sale are amortized using alevel yield method over the expected life of the security, or to the earliest call date for premiums on securities with callfeatures. TCF evaluates securities available for sale for other than temporary impairment on a quarterly basis. Declinesin the value of securities available for sale that are considered other than temporary are recorded in non-interest incomewithin gains (losses) on securities, net. See Note 5. Securities Available for Sale and Securities Held to Maturity forfurther information on securities available for sale. Loans and Leases Held for Sale Loans and leases designated as held for sale are generally carried at the lowerof cost or fair value. Any amount by which cost exceeds fair value is initially recorded as a valuation allowance andsubsequently reflected in the gain or loss on sale when sold. Certain other loans held for sale are recorded at fairvalue under the elected fair value option. From time to time, management identifies and designates, primarily consumerreal estate, loans held in the loan portfolios for sale. These loans are transferred to loans and leases held for sale atthe lower of cost or fair value at the time of transfer net of any associated allowance for loan and lease losses.
Loans and Leases Loans and leases are reported at historical cost including net direct fees and costs associatedwith originating and acquiring loans and leases. The net direct fees and costs for sales-type leases are offset againstrevenues recorded at the commencement of sales-type leases. Discounts and premiums on acquired loans, net directfees and costs, unearned discounts and finance charges, and unearned lease income are amortized to interest incomeusing methods that approximate a level yield over the estimated remaining lives of the loans and leases. Net directfees and costs on all lines of credit are amortized on a straight line basis over the contractual life of the line of creditand adjusted for payoffs. Net deferred fees and costs on consumer real estate lines of credit are amortized to feesand service charges. See Note 6. Loans and Leases for further information on loans and leases.
70

TCF acquires loans and leases through business combinations and purchases of loan and lease portfolios. Theseloans and leases are recorded at fair value at acquisition and the fair value discount or premium is recognized as anadjustment to yield over the remaining life of each loan or lease. Loans are considered purchased credit impaired("PCI") loans if it is probable at acquisition that all contractually required payments will not be collected. Upon acquisition,the acquired PCI loans are recorded at fair value without a corresponding allowance for loan losses as the non-accretable discount is adequate to absorb expected remaining credit losses. The excess of expected cash flows to becollected over the initial fair value of the acquired portfolios is referred to as the accretable yield and is accreted intointerest income over the estimated life of the acquired portfolios using the effective yield method. The accretable yieldis affected by changes in interest rate indices for variable-rate acquired portfolios, changes in prepayment assumptionsand changes in the expected principal and interest payments over the estimated life of the loan. These acquired loansare classified as accruing and interest income continues to be recognized unless expected credit losses exceed thenon-accretable discount.
Non-accrual Loans and Leases Loans and leases are generally placed on non-accrual status when the collectionof interest or principal is 90 days or more past due, unless, in the case of commercial loans, they are well securedand in the process of collection. Delinquent consumer real estate junior lien loans are placed on non-accrual statuswhen there is evidence that the related third-party first lien mortgage may be 90 days or more past due, or foreclosure,charge-off or collection action has been initiated. TDR loans are placed on non-accrual status prior to the past duethresholds outlined above if repayment under the modified terms is not likely after performing a well-documentedcredit analysis.
Loans on non-accrual status are generally reported as non-accrual loans until there is sustained repaymentperformance for six consecutive months, with the exception of loans not reaffirmed upon discharge under Chapter 7bankruptcy, which remain on non-accrual status until a well-documented credit analysis indicates full repayment ofthe remaining pre-discharged contractual principal and interest is likely. Income on these loans is recognized on acash basis when there is sustained repayment performance for nine or 12 consecutive months based on the creditevaluation and the loan is not more than 60 days delinquent.
Generally, when a loan or lease is placed on non-accrual status, uncollected interest accrued in prior years is chargedoff against the allowance for loan and lease losses and interest accrued in the current year is reversed against interestincome. For non-accrual leases that have been discounted with third-party financial institutions on a non-recoursebasis, the related liability is also placed on non-accrual status. Interest payments received on loans and leases innon-accrual status are generally applied to principal unless the remaining principal balance has been determined tobe fully collectible, in which case interest income is recognized on a cash basis. See Note 7. Allowance for Loan andLease Losses and Credit Quality Information for further information on non-accrual loans and leases.
Lease Financing TCF provides various types of commercial lease financing that are classified for accounting purposesas direct financing, sales-type or operating leases. Leases that transfer substantially all of the benefits and risks ofownership to the lessee are classified as direct financing or sales-type leases and are included in loans and leases.Direct financing and sales-type leases are carried at the combined present value of future minimum lease paymentsand lease residual values. The determination of lease classification requires various judgments and estimates bymanagement including the fair value of the equipment at lease inception, useful life of the equipment under lease,estimate of the lease residual value and collectability of minimum lease payments.
Sales-type leases generate dealer profit, which is recognized at lease inception by recording lease revenue net oflease cost. Lease revenue consists of the present value of the future minimum lease payments. Lease cost consistsof the leased equipment's book value, less the present value of its residual. Interest income on direct financing andsales-type leases is recognized using methods that approximate a level yield over the fixed, non-cancelable term ofthe lease. TCF receives pro rata rent payments for the interim period until the lease contract commences and thefixed, non-cancelable lease term begins. TCF recognizes these interim payments in the month they are earned andrecords the income in interest income. Management has policies and procedures in place for the determination oflease classification and review of the related judgments and estimates for all lease financings.
71

Some lease financings include a residual value component, which represents the estimated fair value of the leasedequipment at the expiration of the initial term of the transaction. The estimation of residual values involves judgmentregarding product and technology changes, customer behavior, shifts in supply and demand and other economicassumptions. TCF reviews residual assumptions in the portfolio at least annually and records impairment, if necessary,which is charged to non-interest expense in the periods in which it becomes known. TCF may sell minimum leasepayments primarily as a credit risk reduction tool to third-party financial institutions at fixed rates on a non-recoursebasis with its underlying equipment as collateral. For those transactions that achieve sale treatment, the related leasecash flow stream and the non-recourse financing are derecognized. For those transactions that do not achieve saletreatment, the underlying lease remains on TCF's Consolidated Statements of Financial Condition and non-recoursedebt is recorded in the amount of the proceeds received. TCF retains servicing of these leases and bills, collects andremits funds to the third-party financial institution. Upon default by the lessee, the third-party financial institutions maytake control of the underlying collateral which TCF would otherwise retain as residual value.
Leases that do not transfer substantially all benefits and risks of ownership to the lessee are classified as operatingleases. Such leased equipment and related initial direct costs are included in other assets on the ConsolidatedStatements of Financial Condition and depreciated on a straight-line basis over the term of the lease to its estimatedsalvage value. Depreciation expense is recorded as operating lease expense and included in non-interest expense.Operating lease rental income is recognized when it is due and is reflected as a component of non-interest income.An allowance for lease losses is not provided on operating leases.
Premises and Equipment Premises and equipment, including leasehold improvements, are carried at cost and aredepreciated or amortized on a straight-line basis over estimated useful lives of owned assets and for leaseholdimprovements over the estimated useful life of the related asset or the lease term, whichever is shorter. Maintenanceand repairs are charged to expense as incurred. Rent expense for leased land with facilities is recognized in occupancyand equipment expense. Rent expense for leases with free rent periods or scheduled rent increases is recognizedon a straight-line basis over the lease term. See Note 8. Premises and Equipment, Net for further information onpremises and equipment.
Other Real Estate Owned and Repossessed and Returned Assets Assets acquired through foreclosure,repossession or returned to TCF are initially recorded at the lower of the loan or lease carrying amount or fair valueof the collateral less estimated selling costs at the time of transfer to real estate owned or repossessed and returnedassets. The fair value of other real estate owned is based on independent appraisals, real estate brokers' price opinionsor automated valuation methods, less estimated selling costs. The fair value of repossessed and returned assets isbased on available pricing guides, auction results or price opinions, less estimated selling costs. Any carrying amountin excess of the fair value less estimated selling costs is charged off to the allowance for loan and lease losses upontransfer. Subsequently, if the fair value of an asset, less the estimated costs to sell, declines to less than the carryingamount of the asset, the shortfall is recognized in the period in which it becomes known and is included in foreclosedreal estate and repossessed assets, net expense. Operating expenses of properties and recoveries on sales of otherreal estate owned are also recorded in non-interest expense within foreclosed real estate and repossessed assets,net expense. Operating revenue from foreclosed property is included in other non-interest income. See Note 7.Allowance for Loan and Lease Losses and Credit Quality Information for further information on other real estate ownedand repossessed and returned assets.
Investments in Affordable Housing Limited Liability Entities TCF has investments in affordable housing limitedliability entities that either operate qualified affordable housing projects or invest in other limited liability entities formedto operate affordable housing projects, which TCF generally accounts for under the proportional amortization method.However, depending on circumstances, the effective yield, equity or cost methods may be utilized. The amount of theinvestments, along with any unfunded equity contributions that are unconditional and legally binding, are recorded inother assets. A liability for the unfunded equity contributions is recorded in accrued expenses and other liabilities. Thetax credits and amortization of the investments are reflected in the Consolidated Statements of Income as a componentof income tax expense. See Note 10. Investments in Affordable Housing Limited Liability Entities for further informationon investments in affordable housing limited liability entities.
72

Interest-only Strips TCF sells fixed- or variable-rate consumer real estate and auto finance loans with or withoutinterest-only strips to third party financial institutions. For those transactions that achieve sale treatment, the underlyingloans are removed from TCF's Consolidated Statements of Financial Condition. The Company may receive as part ofthe sale consideration an interest in the future cash flows of borrower loan payments, known as an interest-only strip.The interest-only strip is recorded at fair value in other assets with the unrealized gains or losses net of deferred incometaxes reported within accumulated other comprehensive income (loss). The fair value of the interest-only striprepresents the present value of future cash flows expected to be received by TCF. After initial recording of the interest-only strip, the accretable yield is measured as the difference between the initial investment, or fair value, and the cashflows expected to be collected. The accretable yield is amortized into interest income over the life of the interest-onlystrip using the effective yield method. The expected cash flows are evaluated quarterly to determine if they havechanged from previous projections. Declines in the value of interest-only strips that are considered other than temporaryare recorded in other non-interest expense. See Note 6. Loans and Leases for further information on interest-onlystrips.
Goodwill and Other Intangible Assets All assets and liabilities acquired in purchase acquisitions, including otherintangibles, are initially recorded at fair value. Goodwill is recorded when the purchase price of an acquisition is greaterthan the fair value of net assets, including identifiable intangible assets. Goodwill is not amortized, but assessed forimpairment on at least an annual basis at the reporting unit level. Interim impairment analysis may be required if eventsoccur or circumstances change that would more likely than not reduce a reporting unit's fair value below its carryingamount. Other intangible assets are amortized on a straight-line basis or accelerated method over their estimateduseful lives and are subject to impairment if events or circumstances indicate a possible inability to realize their carryingamounts.
When testing for goodwill impairment, TCF has the option to perform a qualitative assessment of goodwill. TCF mayalso elect to perform a quantitative test without first performing a qualitative analysis. If the qualitative assessment isperformed and TCF concludes it is more likely than not that a reporting unit's fair value is less than its carrying amount,a quantitative analysis is performed. Quantitative valuation methodologies primarily include a discounted cash flowanalysis in determining the fair value of reporting units. If the fair value is less than the carrying amount, additionalanalysis is required to measure the amount of impairment. Impairment losses, if any, are recorded as a charge tonon-interest expense and an adjustment to the carrying value of goodwill.
Other intangible assets are reviewed for impairment whenever events or changes in circumstances indicate theircarrying amount may not be recoverable. Impairment is indicated if the sum of the undiscounted estimated future netcash flows is less than the carrying value of the intangible asset. Impairment losses, if any, permanently reduce thecarrying value of the other intangible assets. See Note 9. Goodwill and Other Intangible Assets for further informationon intangible assets.
Derivative Instruments All derivative instruments are recognized at fair value within other assets or accrued expensesand other liabilities on the Consolidated Statements of Financial Condition. The Company's derivative instrumentsmay be subject to master netting arrangements and collateral arrangements and qualify for offset in the ConsolidatedStatements of Financial Condition. A master netting arrangement with a counterparty creates a right of offset foramounts due to and from that same counterparty that is enforceable in the event of a default or bankruptcy. TheCompany's policy is to recognize amounts subject to master netting arrangements and collateral arrangements on anet basis in the Consolidated Statements of Financial Condition. The value of derivative instruments will vary overtheir contractual terms as the related underlying rates fluctuate. The accounting for changes in the fair value of aderivative instrument depends on whether or not the contract has been designated and qualifies as a hedge. To qualifyas a hedge, a contract must be highly effective at reducing the risk associated with the exposure being hedged. Inaddition, for a contract to be designated as a hedge, the risk management objective and strategy must be documentedat inception. Hedge documentation must also identify the hedging instrument, the asset or liability and type of risk tobe hedged and how the effectiveness of the contract is assessed prospectively and retrospectively. To assesseffectiveness, TCF uses statistical methods such as regression analysis. A contract that has been, and is expectedto continue to be effective at offsetting changes in fair values or the net investment, must be assessed and documentedat least quarterly. If it is determined that a contract is not highly effective at hedging the designated exposure, hedgeaccounting is discontinued.
Upon origination of a derivative instrument, the contract is designated either as a hedge of the exposure to changesin the fair value of an asset or liability due to changes in market risk ("fair value hedge"), a hedge of the volatility of aninvestment in foreign operations driven by changes in foreign currency exchange rates ("net investment hedge") or isnot designated as a hedge.
73

Fair Value Hedges TCF Bank entered into an interest rate swap agreement related to its contemporaneously issuedsubordinated debt, which settles through a central clearing house. The swap was designated as a fair value hedgeand effectively converts the fixed interest rate to a floating rate based on the three-month London InterBank OfferedRate plus a fixed number of basis points on the $150.0 million notional amount through February 27, 2025, the maturitydate of the subordinated debt. In exchange, TCF Bank will receive 4.60% fixed-rate interest on the $150.0 millionnotional amount from the swap counterparty.
The interest rate swap substantially offsets the change in fair value of the hedged underlying debt that is attributableto the changes in market risk. The gains and losses related to changes in the fair value of the interest rate swap, aswell as the offsetting changes in fair value of the hedged debt, are reflected in other non-interest income.
Net Investment Hedges Forward foreign exchange contracts, which generally settle within 35 days, are used to managethe foreign exchange risk associated with the Company's net investment in TCF Commercial Finance Canada, Inc.,a wholly-owned indirect Canadian subsidiary of TCF Bank. Changes in net investment hedges recorded within othercomprehensive income (loss) are subsequently reclassified to non-interest expense during the period in which theforeign investment is substantially liquidated or when other elements of the currency translation adjustment arereclassified to income.
Derivatives Not Designated as Hedges Certain of TCF's forward foreign exchange contracts are not designated ashedges and are generally settled within 35 days. Changes in the fair value of these forward foreign exchange contractsare reflected in other non-interest expense.
TCF executes interest rate contracts with commercial banking customers to facilitate their respective risk managementstrategies. Those interest rate contracts are simultaneously hedged with offsetting interest rate contracts that TCFexecutes with a third party and generally settles through a central clearing house, minimizing TCF's net risk exposure.As the interest rate contracts do not meet hedge accounting requirements, changes in the fair value of both the customercontracts and the offsetting contracts are reflected in other non-interest income. These contracts have original fixedmaturity dates ranging from three to 10 years.
TCF enters into interest rate lock commitments in conjunction with the sale of certain consumer real estate loans.These interest rate lock commitments are agreements to extend credit under certain specified terms and conditionsat fixed rates and have original lock expirations of up to 60 days. They are not designated as hedges and accordingly,changes in the valuation of these commitments are reflected in gains on sales of consumer real estate loans, net.
During the second quarter of 2012, TCF sold its Visa® Class B stock. In conjunction with the sale, TCF and the purchaserentered into a derivative transaction whereby TCF may receive or be required to make cash payments whenever theconversion ratio of the Visa Class B stock into Visa Class A stock is adjusted. The fair value of this derivative has beendetermined using estimated future cash flows using probability weighted scenarios for multiple estimates of Visa'saggregate exposure to covered litigation matters, which include consideration of amounts funded by Visa into its escrowaccount for the covered litigation matters. Changes, if any, in the valuation of this swap agreement, which has nodeterminable maturity date, are reflected in other non-interest expense. See Note 20. Derivative Instruments for furtherinformation on derivative instruments.
Stock-based Compensation The fair value of restricted stock, stock options and restricted stock units is determinedon the date of grant and amortized to compensation expense, with a corresponding increase to additional paid-incapital, over the longer of the service period or performance period, but in no event beyond an employee's retirementdate or date of employment termination. For performance-based restricted stock or stock units, TCF estimates thedegree to which performance conditions will be met to determine the number of shares or units that will vest and therelated compensation expense. Compensation expense is adjusted in the period such estimates change. Non-forfeitable dividends, if any, paid on shares of restricted stock are recorded to retained earnings for shares that areexpected to vest and to compensation expense for shares that are not expected to vest.
Income tax benefits (detriments) related to stock compensation, where the fair value on vesting or exercise of theaward is greater than (less than) the grant date value less any proceeds on exercise, are recognized in income taxexpense. See Note 17. Stock Compensation for further information on stock-based compensation.
Earnings Per Common Share TCF's restricted stock awards that pay non-forfeitable common stock dividends meetthe criteria of a participating security. Accordingly, earnings per share is calculated using the two-class method underwhich earnings are allocated to both common shares and participating securities.
74
All shares of restricted stock are deducted from weighted-average shares outstanding for the computation of basicearnings per common share. Shares of performance-based restricted stock and restricted stock units are included inthe calculation of diluted earnings per common share using the treasury stock method at the beginning of the quarterin which the performance goals have been achieved. All other shares of restricted stock, which vest over specifiedtime periods, stock options and warrants are included in the calculation of diluted earnings per common share usingthe treasury stock method. See Note 22. Earnings Per Common Share for further information on earnings per share.
New Accounting Pronouncements Adopted
During the fourth quarter of 2017, the Company adopted Accounting Standards Update ("ASU") No. 2018-02: IncomeStatement - Reporting Comprehensive Income (Topic 220): Reclassification of Certain Tax Effects from AccumulatedOther Comprehensive Income, which allows reclassification of certain stranded income tax effects in accumulatedother comprehensive income to retained earnings resulting from the Tax Cuts and Jobs Act of 2017 ("Tax Reform").As a result of the adoption, the Company recorded a reclassification from accumulated other comprehensive income(loss) to retained earnings of $3.4 million.
During the second quarter of 2017, the Company adopted ASU No. 2017-08: Receivables - Nonrefundable Fees andOther Costs (Subtopic 310-20): Premium Amortization on Purchased Callable Debt Securities, which clarifies thepremium amortization period on purchased callable debt securities should be to the earliest call date, rather than thecontractual maturity date. The adoption of this ASU was on a modified retrospective basis and required any adjustmentsas a result of the adoption during an interim period to be reflected as of January 1, 2017. The adoption of this ASU didnot have an impact on our consolidated financial statements.
Effective January 1, 2017, the Company adopted ASU No. 2016-09, Compensation - Stock Compensation (Topic 718):Improvements to Employee Share-Based Payment Accounting, which simplified several aspects of the accounting forshare-based payment transactions, including income tax consequences, classification of awards as either equity orliabilities and classification on the statement of cash flows. As a result of the adoption, the Company recorded acumulative effect reduction to the opening balance of retained earnings of $1.3 million and a corresponding increaseto additional paid-in capital. This cumulative effect adjustment to retained earnings was related to a policy election toaccount for forfeitures as they occur, thereby eliminating the need for an estimated forfeiture reserve against futurecancellations. The adoption of this ASU on a prospective basis requires that tax benefits related to stock compensationbe recorded to income tax expense, instead of to additional paid-in capital. The Company elected the prospectivebasis regarding the presentation of stock compensation tax (expense) benefit in the Consolidated Statement of CashFlows as an operating activity and as a result prior periods were not adjusted.
Effective January 1, 2017, the Company adopted ASU Nos. 2016-05, Derivatives and Hedging (Topic 815): Effects ofDerivative Contract Novations on Existing Hedge Accounting Relationships, 2016-06, Derivatives and Hedging (Topic815): Contingent Put and Call Options in Debt Instruments and 2016-07, Investments - Equity Method and JointVentures (Topic 323): Simplifying the Transition to the Equity Method of Accounting. The adoption of these ASUs didnot have an impact on our consolidated financial statements.
75
Note 3. Cash and Due from Banks At December 31, 2017 and 2016, TCF Bank was required by Federal Reserve regulations to maintain reserves of$107.0 million and $103.7 million, respectively, in cash on hand or at the Federal Reserve Bank. TCF maintains cash balances that are restricted as to their use in accordance with certain contractual agreementsprimarily related to the servicing of auto finance loans. Cash payments received on loans serviced for third parties aregenerally held in separate accounts until remitted. TCF may also retain cash balances for collateral on certainborrowings, forward foreign exchange contracts, interest rate contracts and other contracts. TCF maintained restrictedcash totaling $36.5 million and $51.3 million at December 31, 2017 and 2016, respectively.
TCF had cash held in interest-bearing accounts of $324.2 million and $326.5 million at December 31, 2017 and 2016,respectively.

Note 4. Investments
Investments were as follows:
At December 31,(In thousands) 2017 2016Federal Home Loan Bank stock, at cost $ 45,021 $ 37,022Federal Reserve Bank stock, at cost 37,623 37,692
Total investments $ 82,644 $ 74,714
The investments in Federal Home Loan Bank ("FHLB") stock are required investments related to TCF's membershipin and current borrowings from the FHLB of Des Moines. TCF's investments in the FHLB of Des Moines could beadversely impacted by the financial operations of the Federal Home Loan Banks and actions of their regulator, theFederal Housing Finance Agency. The amount of Federal Reserve Bank stock that TCF Bank is required to hold isbased on TCF Bank's capital structure. TCF periodically evaluates investments for other than temporary impairment.There was no impairment of these investments in 2017, 2016 or 2015. The yield on these investments, which have no stated contractual maturity, was 2.96% and 2.59% at December 31, 2017and 2016, respectively.
76
Note 5. Securities Available for Sale and Securities Held to Maturity Securities were as follows:
At December 31,2017 2016
(In thousands)Amortized
Cost
GrossUnrealized
Gains
GrossUnrealized
Losses Fair ValueAmortized
Cost
GrossUnrealized
Gains
GrossUnrealized
Losses Fair ValueSecurities available for sale:
Mortgage-backed securities:U.S. Government
sponsored enterprisesand federal agencies $ 908,189 $ 308 $ 13,812 $ 894,685 $ 827,722 $ 423 $ 17,254 $ 810,891
Other 6 — — 6 18 — — 18Obligations of states and
political subdivisions 810,159 7,967 3,799 814,327 628,972 394 16,840 612,526Total securities available
for sale $1,718,354 $ 8,275 $ 17,611 $ 1,709,018 $1,456,712 $ 817 $ 34,094 $1,423,435Securities held to maturity:
Mortgage-backed securities:U.S. Government
sponsored enterprisesand federal agencies $ 158,776 $ 4,462 $ 412 $ 162,826 $ 178,514 $ 3,072 $ 440 $ 181,146
Other securities 2,800 — — 2,800 2,800 — — 2,800Total securities held to
maturity $ 161,576 $ 4,462 $ 412 $ 165,626 $ 181,314 $ 3,072 $ 440 $ 183,946
At December 31, 2017 and 2016, mortgage-backed securities with a carrying value of $0.9 million and $7.5 million,respectively, were pledged as collateral to secure certain deposits and borrowings. We have assessed each securitywith unrealized losses included in the table above for credit impairment. As part of that assessment, we evaluated andconcluded that we do not intend to sell any of the securities and that it is more likely than not that we will not be requiredto sell prior to recovery of the amortized cost. Unrealized losses on securities available for sale and securities held tomaturity were primarily due to changes in interest rates.

Gains (losses) on securities, net was $0.2 million for 2017, compared with $(0.6) million and $(0.3) million for 2016and 2015, respectively. There were no sales of securities available for sale during 2017 or 2016. In 2015, TCF sold$0.2 million of securities available for sale and received cash proceeds of $0.2 million. There were no impairmentcharges recognized on securities available for sale in 2017, 2016 or 2015.TCF received $0.2 million in recoveries onpreviously impaired securities held to maturity for 2017, compared with impairment charges of $0.7 million and$0.3 million for 2016 and 2015, respectively.
Gross unrealized losses and fair value of securities available for sale and securities held to maturity aggregated byinvestment category and the length of time the securities were in a continuous loss position were as follows:
At December 31, 2017Less than 12 months 12 months or more Total
(In thousands) Fair ValueUnrealized
Losses Fair ValueUnrealized
Losses Fair ValueUnrealized
LossesSecurities available for sale:
Mortgage-backed securities:U.S. Government sponsored
enterprises and federal agencies $ 406,298 $ 2,686 $ 428,585 $ 11,126 $ 834,883 $ 13,812Obligations of states and political
subdivisions 103,759 486 207,516 3,313 311,275 3,799Total securities available for sale $ 510,057 $ 3,172 $ 636,101 $ 14,439 $ 1,146,158 $ 17,611
Securities held to maturity:Mortgage-backed securities:
U.S. Government sponsoredenterprises and federal agencies $ 13,309 $ 132 $ 11,470 $ 280 $ 24,779 $ 412
Total securities held to maturity $ 13,309 $ 132 $ 11,470 $ 280 $ 24,779 $ 412
At December 31, 2016Less than 12 months 12 months or more Total
(In thousands) Fair ValueUnrealized
Losses Fair ValueUnrealized
Losses Fair ValueUnrealized
LossesSecurities available for sale:
Mortgage-backed securities:U.S. Government sponsored
enterprises and federal agencies $ 732,724 $ 17,254 $ — $ — $ 732,724 $ 17,254Obligations of states and political
subdivisions 501,620 16,840 — — 501,620 16,840Total securities available for sale $ 1,234,344 $ 34,094 $ — $ — $ 1,234,344 $ 34,094
Securities held to maturity:Mortgage-backed securities:
U.S. Government sponsoredenterprises and federal agencies $ 27,090 $ 440 $ — $ — $ 27,090 $ 440
Total securities held to maturity $ 27,090 $ 440 $ — $ — $ 27,090 $ 440
77

The amortized cost and fair value of securities available for sale and securities held to maturity by final contractualmaturity were as follows. The remaining contractual principal maturities do not consider possible prepayments.Remaining expected maturities will differ from contractual maturities because borrowers may have the right to prepay.
At December 31,2017 2016
(In thousands)Amortized
Cost Fair ValueAmortized
Cost Fair ValueSecurities available for sale:
Due in one year or less $ 6 $ 6 $ 1 $ 1Due in 1-5 years 15,178 15,312 18 18Due in 5-10 years 514,336 517,867 331,430 329,005Due after 10 years 1,188,834 1,175,833 1,125,263 1,094,411
Total securities available for sale $ 1,718,354 $ 1,709,018 $ 1,456,712 $ 1,423,435
Securities held to maturity:Due in one year or less $ 1,000 $ 1,000 $ — $ —Due in 1-5 years 1,400 1,400 1,400 1,400Due in 5-10 years 400 400 1,400 1,400Due after 10 years 158,776 162,826 178,514 181,146
Total securities held to maturity $ 161,576 $ 165,626 $ 181,314 $ 183,946
Interest income attributable to securities available for sale was as follows:
Year Ended December 31,(In thousands) 2017 2016 2015Taxable interest income $ 18,382 $ 16,238 $ 13,930Tax-exempt interest income 14,896 10,335 1,718
Total interest income $ 33,278 $ 26,573 $ 15,648
78
Note 6. Loans and Leases
Loans and leases were as follows:
At December 31,(In thousands) 2017 2016Consumer real estate:
First mortgage lien $ 1,959,387 $ 2,292,596Junior lien 2,860,309 2,791,756
Total consumer real estate 4,819,696 5,084,352Commercial:
Commercial real estate:Permanent 2,385,752 2,356,287Construction and development 365,533 277,904
Total commercial real estate 2,751,285 2,634,191Commercial business 809,908 652,287
Total commercial 3,561,193 3,286,478Leasing and equipment finance 4,761,661 4,336,310Inventory finance 2,739,754 2,470,175Auto finance 3,199,639 2,647,741Other 22,517 18,771
Total loans and leases(1) $ 19,104,460 $ 17,843,827(1) Loans and leases are reported at historical cost including net direct fees and costs associated with originating and acquiring loans and leases, lease residuals,
unearned income and unamortized purchase premiums and discounts. The aggregate amount of these loan and lease adjustments was $33.3 million and$54.1 million at December 31, 2017 and 2016, respectively.
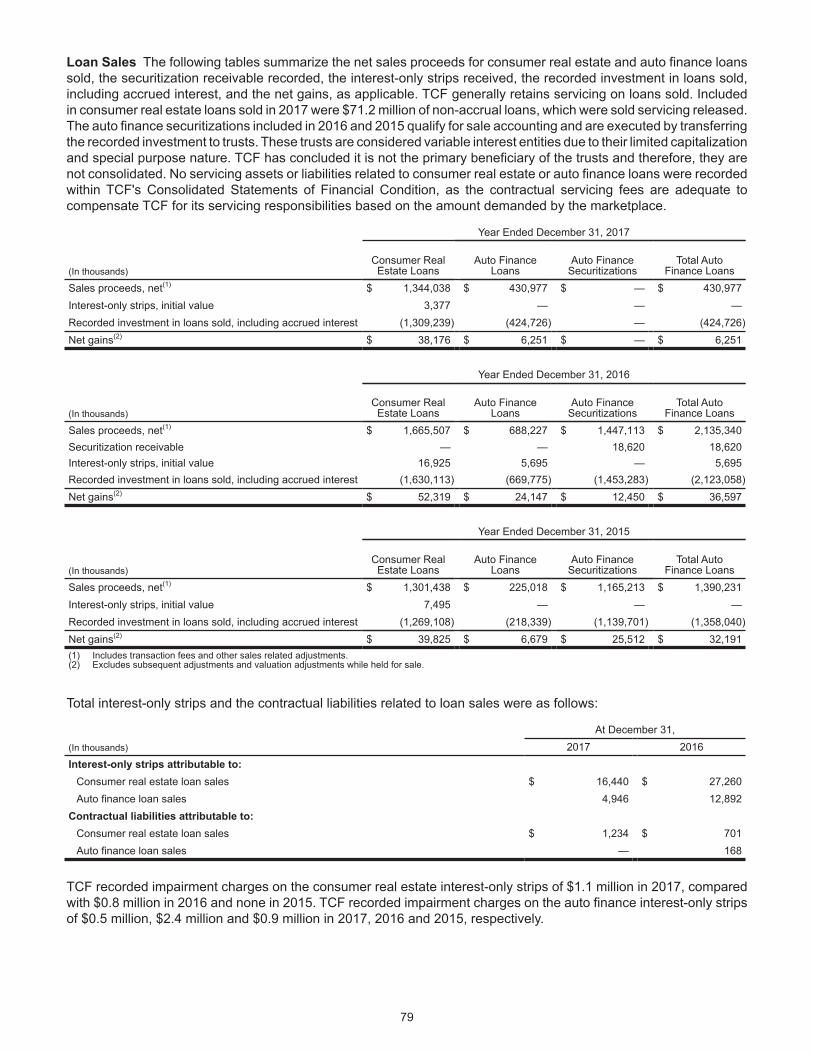
Loan Sales The following tables summarize the net sales proceeds for consumer real estate and auto finance loanssold, the securitization receivable recorded, the interest-only strips received, the recorded investment in loans sold,including accrued interest, and the net gains, as applicable. TCF generally retains servicing on loans sold. Includedin consumer real estate loans sold in 2017 were $71.2 million of non-accrual loans, which were sold servicing released.The auto finance securitizations included in 2016 and 2015 qualify for sale accounting and are executed by transferringthe recorded investment to trusts. These trusts are considered variable interest entities due to their limited capitalizationand special purpose nature. TCF has concluded it is not the primary beneficiary of the trusts and therefore, they arenot consolidated. No servicing assets or liabilities related to consumer real estate or auto finance loans were recordedwithin TCF's Consolidated Statements of Financial Condition, as the contractual servicing fees are adequate tocompensate TCF for its servicing responsibilities based on the amount demanded by the marketplace.
Year Ended December 31, 2017
(In thousands)Consumer RealEstate Loans
Auto FinanceLoans
Auto FinanceSecuritizations
Total AutoFinance Loans
Sales proceeds, net(1) $ 1,344,038 $ 430,977 $ — $ 430,977Interest-only strips, initial value 3,377 — — —Recorded investment in loans sold, including accrued interest (1,309,239) (424,726) — (424,726)Net gains(2) $ 38,176 $ 6,251 $ — $ 6,251
Year Ended December 31, 2016
(In thousands)Consumer RealEstate Loans
Auto FinanceLoans
Auto FinanceSecuritizations
Total AutoFinance Loans
Sales proceeds, net(1) $ 1,665,507 $ 688,227 $ 1,447,113 $ 2,135,340Securitization receivable — — 18,620 18,620Interest-only strips, initial value 16,925 5,695 — 5,695Recorded investment in loans sold, including accrued interest (1,630,113) (669,775) (1,453,283) (2,123,058)Net gains(2) $ 52,319 $ 24,147 $ 12,450 $ 36,597
Year Ended December 31, 2015
(In thousands)Consumer RealEstate Loans
Auto FinanceLoans
Auto FinanceSecuritizations
Total AutoFinance Loans
Sales proceeds, net(1) $ 1,301,438 $ 225,018 $ 1,165,213 $ 1,390,231Interest-only strips, initial value 7,495 — — —Recorded investment in loans sold, including accrued interest (1,269,108) (218,339) (1,139,701) (1,358,040)Net gains(2) $ 39,825 $ 6,679 $ 25,512 $ 32,191(1) Includes transaction fees and other sales related adjustments.(2) Excludes subsequent adjustments and valuation adjustments while held for sale.
Total interest-only strips and the contractual liabilities related to loan sales were as follows:
At December 31,(In thousands) 2017 2016Interest-only strips attributable to:
Consumer real estate loan sales $ 16,440 $ 27,260Auto finance loan sales 4,946 12,892
Contractual liabilities attributable to:Consumer real estate loan sales $ 1,234 $ 701Auto finance loan sales — 168
TCF recorded impairment charges on the consumer real estate interest-only strips of $1.1 million in 2017, comparedwith $0.8 million in 2016 and none in 2015. TCF recorded impairment charges on the auto finance interest-only stripsof $0.5 million, $2.4 million and $0.9 million in 2017, 2016 and 2015, respectively.
79

TCF's agreements to sell auto and consumer real estate loans typically contain certain representations, warrantiesand covenants regarding the loans sold or securitized. These representations, warranties and covenants generallyrelate to, among other things, the ownership of the loan, the validity, priority and perfection of the lien securing theloan, accuracy of information supplied to the buyer or investor, the loan's compliance with the criteria set forth in theagreement, the manner in which the loans will be serviced, payment delinquency and compliance with applicable lawsand regulations. These agreements generally require the repurchase of loans or indemnification in the event TCFbreaches these representations, warranties or covenants and such breaches are not cured. In addition, someagreements contain a requirement to repurchase loans as a result of early payoffs by the borrower, early paymentdefault of the borrower, or the failure to obtain valid title. During 2017, 2016 and 2015, losses related to repurchasespursuant to such representations, warranties and covenants were immaterial. The majority of such repurchases wereof auto finance loans where TCF typically has contractual agreements with the automobile dealerships that originatedthe loans requiring the dealers to reimburse TCF for the cost of such repurchases.
Leasing and Equipment Finance Portfolio The leasing and equipment finance portfolio consisted of $2.5 billion ofleases and $2.3 billion of loans at December 31, 2017, compared with $2.3 billion of leases and $2.0 billion of loansat December 31, 2016.
Future minimum lease payments receivable for direct financing, sales-type and operating leases as ofDecember 31, 2017 were as follows:
(In thousands)
2018 $ 951,1642019 721,3922020 509,6442021 308,6792022 139,613Thereafter 54,039
Total $ 2,684,531
Acquired Loans and Leases TCF acquires loans and leases through business combinations and purchases of loanand lease portfolios. TCF purchased loans and leases at fair value of $771.3 million and $193.6 million during 2017and 2016, respectively. Included in loans and leases acquired during 2017 were $14.0 million of leasing and equipmentfinance PCI loans that TCF acquired on September 29, 2017. On the acquisition date, the leasing and equipmentfinance PCI loans had contractually required payments receivable of $24.0 million, expected cash flows of $16.6 millionand a fair value (initial carrying amount) of $14.0 million. The $7.4 million difference between the contractually requiredpayments receivable and the expected cash flows represents the non-accretable difference. The $2.6 million differencebetween the expected cash flows and fair value represented the initial accretable yield. At December 31, 2017, theoutstanding balance of these PCI loans was $16.4 million.
The changes in accretable yield and carrying value of all PCI loans were as follows:
At or For the Year Ended December 31, 2017(In thousands) Accretable Yield Carrying AmountBalance, beginning of period $ — $ 17
Additions due to acquisitions of loans 2,635 13,951Accretion (25) 25Reclassifications from non-accretable difference 312 —Payments received (1,871) (2,149)
Balance, end of period $ 1,051 $ 11,844
80

Note 7. Allowance for Loan and Lease Losses and Credit Quality Information The rollforwards of the allowance for loan and lease losses were as follows:
At or For the Year Ended December 31, 2017
(In thousands)Consumer
Real Estate Commercial
Leasing andEquipment Finance
Inventory Finance
Auto Finance Other Total
Balance, beginning of period $ 59,448 $ 32,695 $ 21,350 $ 13,932 $ 32,310 $ 534 $ 160,269Charge-offs (11,861) (5,431) (10,816) (3,014) (41,101) (6,869) (79,092)Recoveries 20,781 833 2,065 838 6,625 3,510 34,652
Net (charge-offs) recoveries 8,920 (4,598) (8,751) (2,176) (34,476) (3,359) (44,440)Provision for credit losses (12,318) 9,098 10,067 1,367 56,712 3,517 68,443Other(1) (8,882) — (138) 110 (4,321) — (13,231)
Balance, end of period $ 47,168 $ 37,195 $ 22,528 $ 13,233 $ 50,225 $ 692 $ 171,041
At or For the Year Ended December 31, 2016
(In thousands)Consumer
Real Estate Commercial
Leasing andEquipment Finance
Inventory Finance
Auto Finance Other Total
Balance, beginning of period $ 67,992 $ 30,185 $ 19,018 $ 11,128 $ 26,486 $ 1,245 $ 156,054Charge-offs (18,624) (753) (7,738) (2,623) (26,994) (7,353) (64,085)Recoveries 7,065 373 2,386 816 3,853 4,357 18,850
Net (charge-offs) recoveries (11,559) (380) (5,352) (1,807) (23,141) (2,996) (45,235)Provision for credit losses 9,304 2,890 7,706 4,540 39,149 2,285 65,874Other(1) (6,289) — (22) 71 (10,184) — (16,424)
Balance, end of period $ 59,448 $ 32,695 $ 21,350 $ 13,932 $ 32,310 $ 534 $ 160,269
At or For the Year Ended December 31, 2015
(In thousands)Consumer
Real Estate Commercial
Leasing andEquipment Finance
Inventory Finance
Auto Finance Other Total
Balance, beginning of period $ 85,361 $ 31,367 $ 18,446 $ 10,020 $ 18,230 $ 745 $ 164,169Charge-offs (33,687) (5,249) (7,631) (2,501) (18,386) (7,093) (74,547)Recoveries 7,428 3,769 2,792 1,019 2,971 5,034 23,013
Net (charge-offs) recoveries (26,259) (1,480) (4,839) (1,482) (15,415) (2,059) (51,534)Provision for credit losses 12,697 298 5,411 3,036 28,943 2,559 52,944Other(1) (3,807) — — (446) (5,272) — (9,525)
Balance, end of period $ 67,992 $ 30,185 $ 19,018 $ 11,128 $ 26,486 $ 1,245 $ 156,054(1) Primarily includes the transfer of the allowance for loan and lease losses to held for sale.
81

The allowance for loan and lease losses and loans and leases outstanding by type of allowance methodology wereas follows:
At December 31, 2017
(In thousands)Consumer
Real Estate Commercial
Leasing andEquipment
FinanceInventory Finance
Auto Finance Other Total
Allowance for loan and lease losses:Collectively evaluated for impairment $ 28,851 $ 35,635 $ 19,083 $ 12,945 $ 49,900 $ 691 $ 147,105Individually evaluated for impairment 18,317 1,560 3,445 288 325 1 23,936
Total $ 47,168 $ 37,195 $ 22,528 $ 13,233 $ 50,225 $ 692 $ 171,041Loans and leases outstanding:
Collectively evaluated for impairment $ 4,675,626 $ 3,524,864 $ 4,721,905 $ 2,735,638 $ 3,188,810 $ 22,513 $18,869,356Individually evaluated for impairment 144,070 36,329 27,912 4,116 10,829 4 223,260Loans acquired with deteriorated
credit quality — — 11,844 — — — 11,844Total $ 4,819,696 $ 3,561,193 $ 4,761,661 $ 2,739,754 $ 3,199,639 $ 22,517 $19,104,460
At December 31, 2016
(In thousands)Consumer
Real Estate Commercial
Leasing andEquipment Finance
Inventory Finance
Auto Finance Other Total
Allowance for loan and lease losses:Collectively evaluated for impairment $ 36,103 $ 31,430 $ 19,093 $ 13,304 $ 31,106 $ 533 $ 131,569Individually evaluated for impairment 23,345 1,265 2,257 628 1,204 1 28,700
Total $ 59,448 $ 32,695 $ 21,350 $ 13,932 $ 32,310 $ 534 $ 160,269Loans and leases outstanding:
Collectively evaluated for impairment $ 4,884,653 $ 3,242,389 $ 4,320,129 $ 2,465,041 $ 2,638,380 $ 18,765 $17,569,357Individually evaluated for impairment 199,699 44,089 16,165 5,134 9,360 6 274,453Loans acquired with deteriorated
credit quality — — 16 — 1 — 17Total $ 5,084,352 $ 3,286,478 $ 4,336,310 $ 2,470,175 $ 2,647,741 $ 18,771 $17,843,827
82
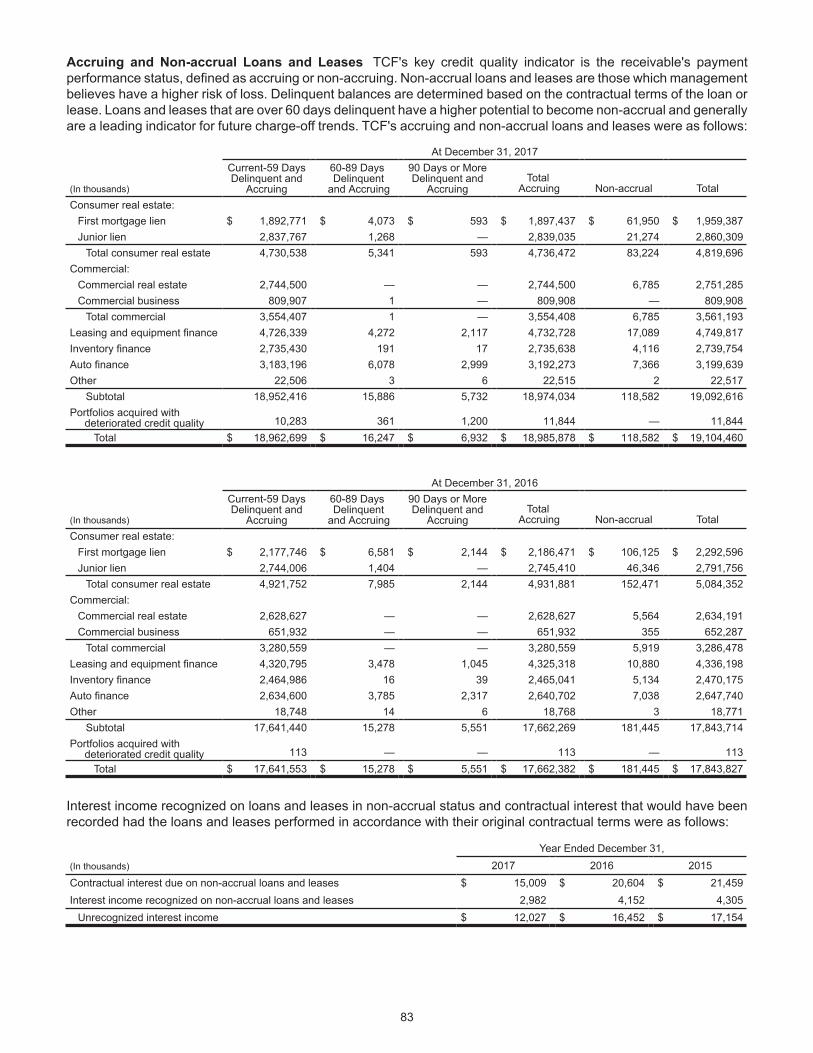
Accruing and Non-accrual Loans and Leases TCF's key credit quality indicator is the receivable's paymentperformance status, defined as accruing or non-accruing. Non-accrual loans and leases are those which managementbelieves have a higher risk of loss. Delinquent balances are determined based on the contractual terms of the loan orlease. Loans and leases that are over 60 days delinquent have a higher potential to become non-accrual and generallyare a leading indicator for future charge-off trends. TCF's accruing and non-accrual loans and leases were as follows:
At December 31, 2017
(In thousands)
Current-59 DaysDelinquent and
Accruing
60-89 Days Delinquent
and Accruing
90 Days or MoreDelinquent and
AccruingTotal
Accruing Non-accrual TotalConsumer real estate:
First mortgage lien $ 1,892,771 $ 4,073 $ 593 $ 1,897,437 $ 61,950 $ 1,959,387Junior lien 2,837,767 1,268 — 2,839,035 21,274 2,860,309
Total consumer real estate 4,730,538 5,341 593 4,736,472 83,224 4,819,696Commercial:
Commercial real estate 2,744,500 — — 2,744,500 6,785 2,751,285Commercial business 809,907 1 — 809,908 — 809,908
Total commercial 3,554,407 1 — 3,554,408 6,785 3,561,193Leasing and equipment finance 4,726,339 4,272 2,117 4,732,728 17,089 4,749,817Inventory finance 2,735,430 191 17 2,735,638 4,116 2,739,754Auto finance 3,183,196 6,078 2,999 3,192,273 7,366 3,199,639Other 22,506 3 6 22,515 2 22,517
Subtotal 18,952,416 15,886 5,732 18,974,034 118,582 19,092,616Portfolios acquired with deteriorated credit quality 10,283 361 1,200 11,844 — 11,844
Total $ 18,962,699 $ 16,247 $ 6,932 $ 18,985,878 $ 118,582 $ 19,104,460
At December 31, 2016
(In thousands)
Current-59 DaysDelinquent and
Accruing
60-89 Days Delinquent
and Accruing
90 Days or MoreDelinquent and
AccruingTotal
Accruing Non-accrual TotalConsumer real estate:
First mortgage lien $ 2,177,746 $ 6,581 $ 2,144 $ 2,186,471 $ 106,125 $ 2,292,596Junior lien 2,744,006 1,404 — 2,745,410 46,346 2,791,756
Total consumer real estate 4,921,752 7,985 2,144 4,931,881 152,471 5,084,352Commercial:
Commercial real estate 2,628,627 — — 2,628,627 5,564 2,634,191Commercial business 651,932 — — 651,932 355 652,287
Total commercial 3,280,559 — — 3,280,559 5,919 3,286,478Leasing and equipment finance 4,320,795 3,478 1,045 4,325,318 10,880 4,336,198Inventory finance 2,464,986 16 39 2,465,041 5,134 2,470,175Auto finance 2,634,600 3,785 2,317 2,640,702 7,038 2,647,740Other 18,748 14 6 18,768 3 18,771
Subtotal 17,641,440 15,278 5,551 17,662,269 181,445 17,843,714Portfolios acquired with deteriorated credit quality 113 — — 113 — 113
Total $ 17,641,553 $ 15,278 $ 5,551 $ 17,662,382 $ 181,445 $ 17,843,827
Interest income recognized on loans and leases in non-accrual status and contractual interest that would have beenrecorded had the loans and leases performed in accordance with their original contractual terms were as follows:
Year Ended December 31,(In thousands) 2017 2016 2015Contractual interest due on non-accrual loans and leases $ 15,009 $ 20,604 $ 21,459Interest income recognized on non-accrual loans and leases 2,982 4,152 4,305
Unrecognized interest income $ 12,027 $ 16,452 $ 17,154
83
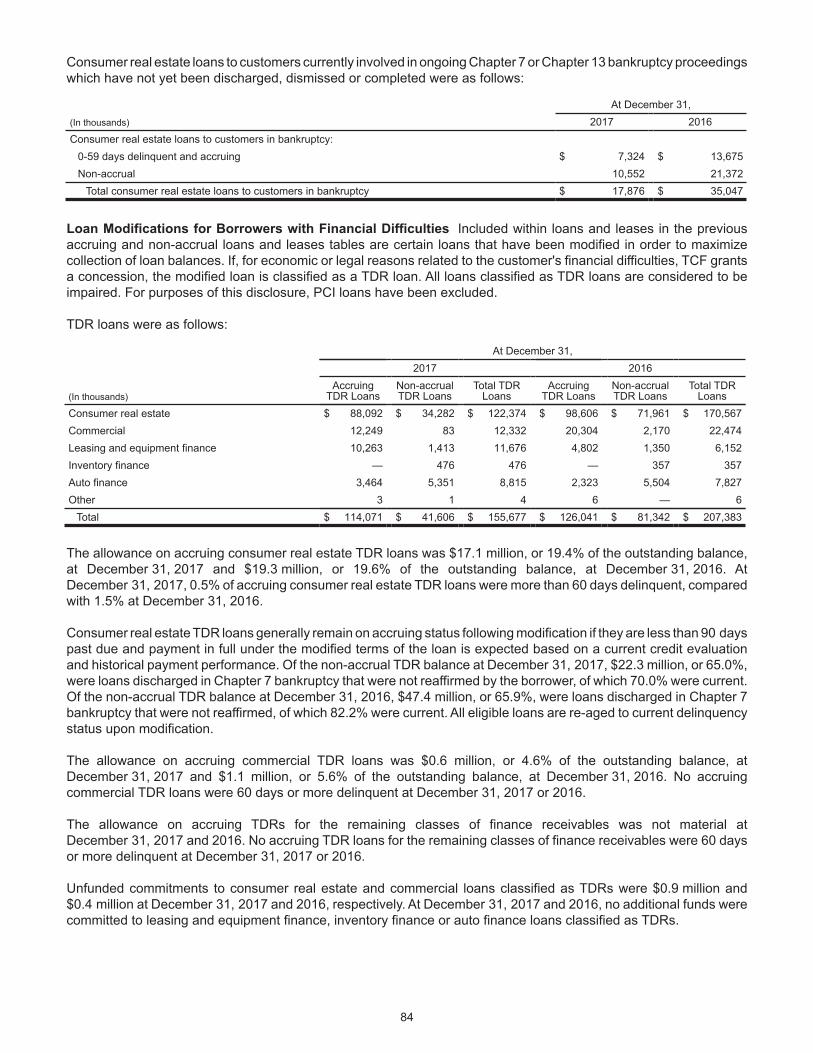
Consumer real estate loans to customers currently involved in ongoing Chapter 7 or Chapter 13 bankruptcy proceedingswhich have not yet been discharged, dismissed or completed were as follows:
At December 31,(In thousands) 2017 2016Consumer real estate loans to customers in bankruptcy:
0-59 days delinquent and accruing $ 7,324 $ 13,675Non-accrual 10,552 21,372
Total consumer real estate loans to customers in bankruptcy $ 17,876 $ 35,047
Loan Modifications for Borrowers with Financial Difficulties Included within loans and leases in the previousaccruing and non-accrual loans and leases tables are certain loans that have been modified in order to maximizecollection of loan balances. If, for economic or legal reasons related to the customer's financial difficulties, TCF grantsa concession, the modified loan is classified as a TDR loan. All loans classified as TDR loans are considered to beimpaired. For purposes of this disclosure, PCI loans have been excluded.
TDR loans were as follows:
At December 31,2017 2016
(In thousands)Accruing
TDR LoansNon-accrualTDR Loans
Total TDRLoans
AccruingTDR Loans
Non-accrualTDR Loans
Total TDRLoans
Consumer real estate $ 88,092 $ 34,282 $ 122,374 $ 98,606 $ 71,961 $ 170,567Commercial 12,249 83 12,332 20,304 2,170 22,474Leasing and equipment finance 10,263 1,413 11,676 4,802 1,350 6,152Inventory finance — 476 476 — 357 357Auto finance 3,464 5,351 8,815 2,323 5,504 7,827Other 3 1 4 6 — 6
Total $ 114,071 $ 41,606 $ 155,677 $ 126,041 $ 81,342 $ 207,383
The allowance on accruing consumer real estate TDR loans was $17.1 million, or 19.4% of the outstanding balance,at December 31, 2017 and $19.3 million, or 19.6% of the outstanding balance, at December 31, 2016. AtDecember 31, 2017, 0.5% of accruing consumer real estate TDR loans were more than 60 days delinquent, comparedwith 1.5% at December 31, 2016.
Consumer real estate TDR loans generally remain on accruing status following modification if they are less than 90 dayspast due and payment in full under the modified terms of the loan is expected based on a current credit evaluationand historical payment performance. Of the non-accrual TDR balance at December 31, 2017, $22.3 million, or 65.0%,were loans discharged in Chapter 7 bankruptcy that were not reaffirmed by the borrower, of which 70.0% were current.Of the non-accrual TDR balance at December 31, 2016, $47.4 million, or 65.9%, were loans discharged in Chapter 7bankruptcy that were not reaffirmed, of which 82.2% were current. All eligible loans are re-aged to current delinquencystatus upon modification.
The allowance on accruing commercial TDR loans was $0.6 million, or 4.6% of the outstanding balance, atDecember 31, 2017 and $1.1 million, or 5.6% of the outstanding balance, at December 31, 2016. No accruingcommercial TDR loans were 60 days or more delinquent at December 31, 2017 or 2016.
The allowance on accruing TDRs for the remaining classes of finance receivables was not material atDecember 31, 2017 and 2016. No accruing TDR loans for the remaining classes of finance receivables were 60 daysor more delinquent at December 31, 2017 or 2016.
Unfunded commitments to consumer real estate and commercial loans classified as TDRs were $0.9 million and$0.4 million at December 31, 2017 and 2016, respectively. At December 31, 2017 and 2016, no additional funds werecommitted to leasing and equipment finance, inventory finance or auto finance loans classified as TDRs.
84

When a loan is modified as a TDR, principal balances are generally not forgiven. Loan modifications to troubledborrowers are not reported as TDR loans in the calendar years after modification if the loans were modified to aninterest rate equal to or greater than the yields of new loan originations with comparable risk at the time of restructuringand if the loan is performing based on the restructured terms; however, these loans are still considered impaired andfollow TCF's impaired loan reserve policies.
Interest income on TDR loans is recognized based on the restructured terms. Unrecognized interest represents thedifference between interest income recognized on accruing TDR loans and the contractual interest that would havebeen recorded under the original contractual terms. In 2017, unrecognized interest income for consumer real estatefirst mortgage lien accruing TDR loans and consumer real estate junior lien accruing TDR loans was $1.8 million and$0.6 million, respectively. In 2016, unrecognized interest income for consumer real estate first mortgage lien accruingTDR loans and consumer real estate junior lien accruing TDR loans was $2.0 million and $0.7 million, respectively.The average yield on consumer real estate accruing TDR loans for 2017 and 2016 was 4.2%, which compares to theoriginal contractual average rate for the same periods of 6.7%. In 2015, unrecognized interest income for consumerreal estate first mortgage lien accruing TDR loans and consumer real estate junior lien accruing TDR loans was$2.2 million and $0.8 million, respectively. The average yield for the same period on consumer real estate accruingTDR loans was 4.1%, which compares to the original contractual average rate of 6.7%.The unrecognized interestincome for the remaining classes of finance receivables was not material for 2017, 2016 and 2015.
TCF considers a loan to have defaulted when under the modified terms it becomes 90 or more days delinquent, hasbeen transferred to non-accrual status, has been charged down or has been transferred to other real estate ownedor repossessed and returned assets. The following table summarizes the TDR loans that defaulted during 2017, 2016and 2015, that were modified during the respective reporting period or within one year of the beginning of the respectivereporting period.
Year Ended December 31,(In thousands) 2017 2016 2015Defaulted TDR loan balances modified during the applicable period:(1)
Consumer real estate:First mortgage lien $ 3,081 $ 8,193 $ 1,674Junior lien 579 1,630 821
Total consumer real estate 3,660 9,823 2,495Leasing and equipment finance 555 — 45Auto finance 1,169 1,693 1,039
Defaulted TDR loans modified during the applicable period $ 5,384 $ 11,516 $ 3,579
(1) The loan balances presented are not materially different than the pre-modification loan balances as TCF's loan modifications generally do not forgive principalamounts.
85

Impaired Loans TCF considers impaired loans to include non-accrual commercial loans, non-accrual equipmentfinance loans and non-accrual inventory finance loans, as well as all TDR loans. For purposes of this disclosure, PCIloans have been excluded. Non-accrual impaired loans, including non-accrual TDR loans, are included in non-accrualloans and leases within the previous tables. Accruing TDR loans have been disclosed by delinquency status withinthe previous tables of accruing and non-accrual loans and leases. In the following table, the loan balance of impairedloans represents the amount recorded within loans and leases on the Consolidated Statements of Financial Condition,whereas the unpaid contractual balance represents the balances legally owed by the borrowers.
Information on impaired loans was as follows:
At December 31,2017 2016
(In thousands)
UnpaidContractual
BalanceLoan
Balance
RelatedAllowanceRecorded
UnpaidContractual
BalanceLoan
Balance
RelatedAllowanceRecorded
Impaired loans with an allowance recorded:Consumer real estate:
First mortgage lien $ 91,624 $ 80,802 $ 13,792 $ 122,704 $ 104,601 $ 16,835Junior lien 32,327 29,544 4,165 62,481 51,410 5,829
Total consumer real estate 123,951 110,346 17,957 185,185 156,011 22,664Commercial:
Commercial real estate 6,810 6,702 1,000 10,083 10,075 1,262Commercial business 7,841 7,841 560 14 14 3
Total commercial 14,651 14,543 1,560 10,097 10,089 1,265Leasing and equipment finance 17,105 17,105 1,345 9,900 9,900 1,044Inventory finance 1,296 1,298 288 4,357 4,365 628Auto finance 1,333 1,016 243 5,801 5,419 1,126Other 3 4 1 6 6 1
Total impaired loans with an allowance recorded 158,339 144,312 21,394 215,346 185,790 26,728Impaired loans without an allowance recorded:
Consumer real estate:First mortgage lien 12,898 10,445 — 18,539 12,674 —Junior lien 17,697 1,583 — 26,915 1,882 —
Total consumer real estate 30,595 12,028 — 45,454 14,556 —Commercial:
Commercial real estate 4,552 4,491 — 21,601 15,780 —Commercial business — — — 354 354 —
Total commercial 4,552 4,491 — 21,955 16,134 —Inventory finance 2,810 2,818 — 767 769 —Auto finance 10,566 7,799 — 3,919 2,408 —Other 331 — — 85 — —
Total impaired loans without an allowance recorded 48,854 27,136 — 72,180 33,867 —Total impaired loans $ 207,193 $ 171,448 $ 21,394 $ 287,526 $ 219,657 $ 26,728
86

The average loan balance of impaired loans and interest income recognized on impaired loans were as follows:
Year Ended December 31,2017 2016 2015
(In thousands)
AverageLoan
Balance
InterestIncome
Recognized
AverageLoan
Balance
InterestIncome
Recognized
AverageLoan
Balance
InterestIncome
RecognizedImpaired loans with an allowance recorded:
Consumer real estate:First mortgage lien $ 92,702 $ 2,748 $ 114,164 $ 3,597 $ 112,698 $ 5,438Junior lien 40,477 1,488 54,888 2,606 56,885 3,353
Total consumer real estate 133,179 4,236 169,052 6,203 169,583 8,791Commercial:
Commercial real estate 8,388 16 5,186 353 27,355 852Commercial business 3,927 97 15 — 17 —
Total commercial 12,315 113 5,201 353 27,372 852Leasing and equipment finance 13,502 58 8,579 40 7,758 18Inventory finance 2,831 192 2,619 56 1,315 76Auto finance 3,218 — 6,741 112 5,495 22Other 5 — 9 — 50 2
Total impaired loans with an allowancerecorded 165,050 4,599 192,201 6,764 211,573 9,761
Impaired loans without an allowance recorded:Consumer real estate:
First mortgage lien 11,560 921 7,951 449 19,188 1,045Junior lien 1,733 438 1,201 672 3,959 1,817
Total consumer real estate 13,293 1,359 9,152 1,121 23,147 2,862Commercial:
Commercial real estate 10,136 709 23,468 743 40,828 1,957Commercial business 177 4 1,970 — 2,033 5
Total commercial 10,313 713 25,438 743 42,861 1,962Inventory finance 1,794 196 523 95 564 114Auto finance 5,102 209 1,792 — 962 —
Total impaired loans without an allowancerecorded 30,502 2,477 36,905 1,959 67,534 4,938Total impaired loans $ 195,552 $ 7,076 $ 229,106 $ 8,723 $ 279,107 $ 14,699
Other Real Estate Owned and Repossessed and Returned Assets
Other real estate owned and repossessed and returned assets were as follows:
At December 31,(In thousands) 2017 2016Other real estate owned $ 18,225 $ 46,797Repossessed and returned assets 12,630 9,969Consumer real estate loans in process of foreclosure 22,622 32,133
Other real estate owned and repossessed and returned assets were written down $6.2 million, $8.3 million and$12.8 million, which were included in foreclosed real estate and repossessed assets, net expense for 2017, 2016 and2015, respectively.
87

Note 8. Premises and Equipment, Net
Premises and equipment, net were as follows:
At December 31,(In thousands) 2017 2016Land $ 146,688 $ 144,221Office buildings 272,428 271,597Leasehold improvements 48,543 50,796Furniture and equipment 363,445 341,621
Subtotal 831,104 808,235Less: Accumulated depreciation and amortization 409,555 389,863
Premises and equipment, net $ 421,549 $ 418,372
Depreciation and amortization expense related to premises and equipment was $45.9 million, $44.9 million and$40.8 million in 2017, 2016 and 2015, respectively. TCF leases certain premises and equipment under operatingleases. Lease expense was $36.4 million, $36.5 million and $36.1 million in 2017, 2016 and 2015, respectively. Subleaseincome was $1.0 million in 2017, 2016 and 2015, respectively.
At December 31, 2017, the total future minimum rental payments for operating leases of premises and equipmentwere as follows:
(In thousands)
2018 $ 29,8922019 29,9152020 25,3132021 16,8852022 12,205Thereafter 44,429
Total $ 158,639
88
Note 9. Goodwill and Other Intangible Assets
Goodwill, net was as follows:
At December 31,2017 2016
(In thousands)Gross
Amount
AccumulatedImpairment
Loss Net AmountGross
Amount
AccumulatedImpairment
Loss Net AmountGoodwill related to consumer banking segment $ 214,286 $ 73,041 $ 141,245 $ 214,286 $ — $ 214,286Goodwill related to wholesale banking segment 13,512 — 13,512 11,354 — 11,354
Total $ 227,798 $ 73,041 $ 154,757 $ 225,640 $ — $ 225,640
Effective April 1, 2017, the Company executed its strategic shift from an originate-to-sell and originate-to-hold modelto an entirely originate-to-hold model for its auto finance business and effective December 1, 2017, the Companydiscontinued auto finance loan originations. The decision to discontinue auto finance loan originations resulted in agoodwill impairment charge of $73.0 million related to the acquisition of Gateway One and an impairment charge of$0.4 million related to the customer base intangible asset attributable to Gateway One. The Gateway One goodwilland customer base intangible asset were fully impaired at December 31, 2017. There was no impairment of goodwillor the other intangible assets in 2016 or 2015.
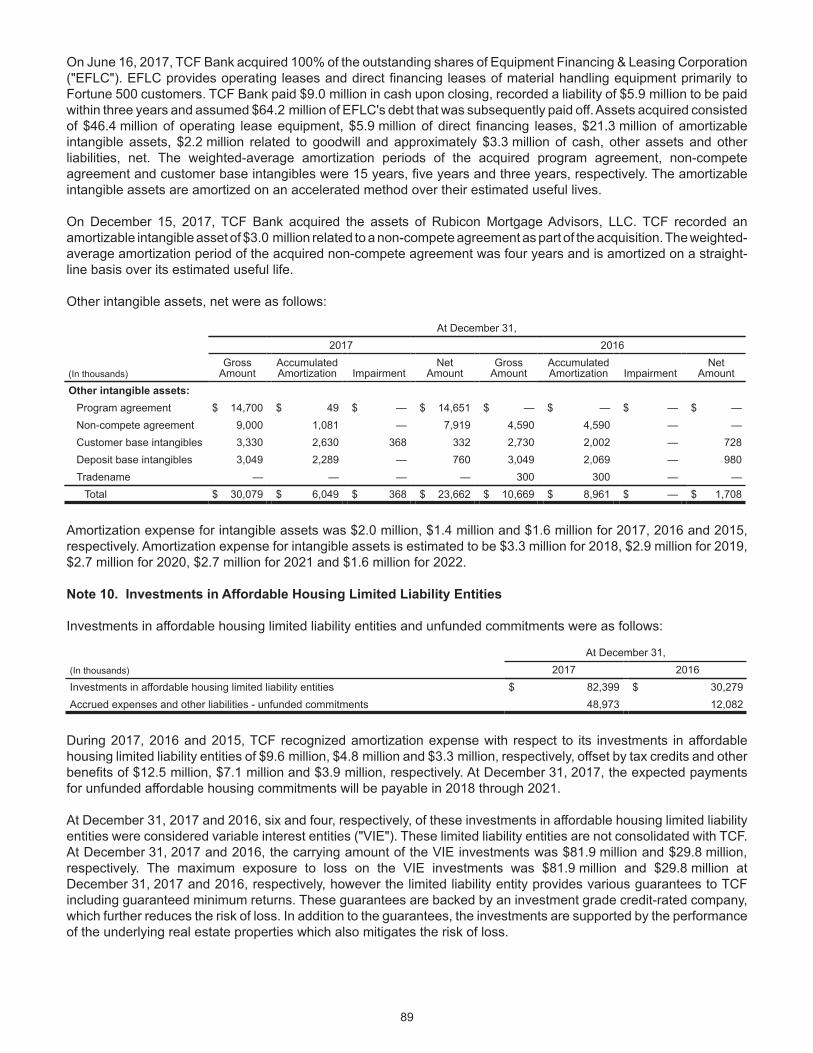
On June 16, 2017, TCF Bank acquired 100% of the outstanding shares of Equipment Financing & Leasing Corporation("EFLC"). EFLC provides operating leases and direct financing leases of material handling equipment primarily toFortune 500 customers. TCF Bank paid $9.0 million in cash upon closing, recorded a liability of $5.9 million to be paidwithin three years and assumed $64.2 million of EFLC's debt that was subsequently paid off. Assets acquired consistedof $46.4 million of operating lease equipment, $5.9 million of direct financing leases, $21.3 million of amortizableintangible assets, $2.2 million related to goodwill and approximately $3.3 million of cash, other assets and otherliabilities, net. The weighted-average amortization periods of the acquired program agreement, non-competeagreement and customer base intangibles were 15 years, five years and three years, respectively. The amortizableintangible assets are amortized on an accelerated method over their estimated useful lives.
On December 15, 2017, TCF Bank acquired the assets of Rubicon Mortgage Advisors, LLC. TCF recorded anamortizable intangible asset of $3.0 million related to a non-compete agreement as part of the acquisition. The weighted-average amortization period of the acquired non-compete agreement was four years and is amortized on a straight-line basis over its estimated useful life.
Other intangible assets, net were as follows:
At December 31,2017 2016
(In thousands)Gross
AmountAccumulatedAmortization Impairment
NetAmount
GrossAmount
AccumulatedAmortization Impairment
NetAmount
Other intangible assets:Program agreement $ 14,700 $ 49 $ — $ 14,651 $ — $ — $ — $ —Non-compete agreement 9,000 1,081 — 7,919 4,590 4,590 — —Customer base intangibles 3,330 2,630 368 332 2,730 2,002 — 728Deposit base intangibles 3,049 2,289 — 760 3,049 2,069 — 980Tradename — — — — 300 300 — —
Total $ 30,079 $ 6,049 $ 368 $ 23,662 $ 10,669 $ 8,961 $ — $ 1,708
Amortization expense for intangible assets was $2.0 million, $1.4 million and $1.6 million for 2017, 2016 and 2015,respectively. Amortization expense for intangible assets is estimated to be $3.3 million for 2018, $2.9 million for 2019,$2.7 million for 2020, $2.7 million for 2021 and $1.6 million for 2022.
89
Note 10. Investments in Affordable Housing Limited Liability Entities
Investments in affordable housing limited liability entities and unfunded commitments were as follows:
At December 31,(In thousands) 2017 2016Investments in affordable housing limited liability entities $ 82,399 $ 30,279Accrued expenses and other liabilities - unfunded commitments 48,973 12,082
During 2017, 2016 and 2015, TCF recognized amortization expense with respect to its investments in affordablehousing limited liability entities of $9.6 million, $4.8 million and $3.3 million, respectively, offset by tax credits and otherbenefits of $12.5 million, $7.1 million and $3.9 million, respectively. At December 31, 2017, the expected paymentsfor unfunded affordable housing commitments will be payable in 2018 through 2021.
At December 31, 2017 and 2016, six and four, respectively, of these investments in affordable housing limited liabilityentities were considered variable interest entities ("VIE"). These limited liability entities are not consolidated with TCF.At December 31, 2017 and 2016, the carrying amount of the VIE investments was $81.9 million and $29.8 million,respectively. The maximum exposure to loss on the VIE investments was $81.9 million and $29.8 million atDecember 31, 2017 and 2016, respectively, however the limited liability entity provides various guarantees to TCFincluding guaranteed minimum returns. These guarantees are backed by an investment grade credit-rated company,which further reduces the risk of loss. In addition to the guarantees, the investments are supported by the performanceof the underlying real estate properties which also mitigates the risk of loss.
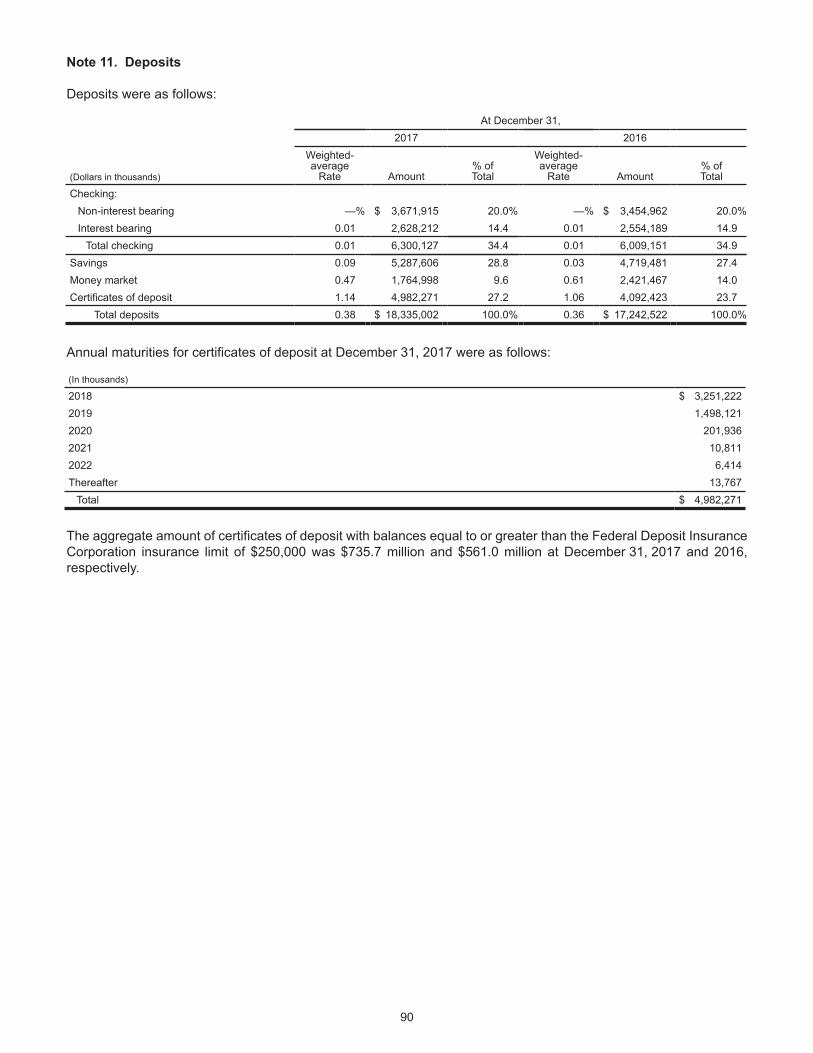
Note 11. Deposits
Deposits were as follows:
At December 31,2017 2016
(Dollars in thousands)
Weighted-average
Rate Amount% of Total
Weighted-average
Rate Amount% of Total
Checking:Non-interest bearing —% $ 3,671,915 20.0% —% $ 3,454,962 20.0%Interest bearing 0.01 2,628,212 14.4 0.01 2,554,189 14.9
Total checking 0.01 6,300,127 34.4 0.01 6,009,151 34.9Savings 0.09 5,287,606 28.8 0.03 4,719,481 27.4Money market 0.47 1,764,998 9.6 0.61 2,421,467 14.0Certificates of deposit 1.14 4,982,271 27.2 1.06 4,092,423 23.7
Total deposits 0.38 $ 18,335,002 100.0% 0.36 $ 17,242,522 100.0%
Annual maturities for certificates of deposit at December 31, 2017 were as follows:
(In thousands)
2018 $ 3,251,2222019 1,498,1212020 201,9362021 10,8112022 6,414Thereafter 13,767
Total $ 4,982,271
The aggregate amount of certificates of deposit with balances equal to or greater than the Federal Deposit InsuranceCorporation insurance limit of $250,000 was $735.7 million and $561.0 million at December 31, 2017 and 2016,respectively.
90

Note 12. Short-term Borrowings Selected information for short-term borrowings (borrowings with an original maturity of less than one year) was asfollows:
At December 31,2017 2016 2015
(Dollars in thousands) Amount Rate Amount Rate Amount RatePeriod end balance:
Securities sold under repurchase agreements $ — —% $ 2,159 0.10% $ 5,381 0.03%Line of Credit - TCF Commercial Finance Canada, Inc. — — 2,232 1.75 — —
Total $ — — $ 4,391 0.94 $ 5,381 0.03Average daily balances for the period ended:
Federal funds purchased $ 142 1.30% $ 156 0.71% $ 225 0.45%Securities sold under repurchase agreements 3,730 0.78 5,235 0.41 16,431 0.06Line of Credit - TCF Commercial Finance Canada, Inc. 1,395 1.92 1,660 1.75 2,166 1.96
Total $ 5,267 1.10 $ 7,051 0.73 $ 18,822 0.28Maximum month-end balances for the period ended:
Securities sold under repurchase agreements $ 2,868 N.A. $ 3,391 N.A. $ 62,995 N.A.Line of Credit - TCF Commercial Finance Canada, Inc. 6,171 N.A. 5,907 N.A. 5,519 N.A.
N.A. Not Applicable.
Securities sold under short-term repurchase agreements are related to TCF Bank's Repurchase Investment SweepAgreement product and are collateralized by mortgage-backed securities.
91
Note 13. Long-term Borrowings Long-term borrowings were as follows:
At December 31,2017 2016
(Dollars in thousands)Stated
Maturity Amount Stated Rate Amount Stated RateFederal Home Loan Bank advances 2018 $ — —% $ 375,000 0.72% - 0.81%
2019 600,000 1.40% - 1.75 300,000 0.78 - 0.812020 275,000 1.76 - 1.78 — —
Subtotal 875,000 675,000Subordinated bank notes 2022 108,867 6.25 108,654 6.25
2025 148,252 4.60 148,052 4.60Hedge-related basis adjustment(1) (2,157) (1,349)
Subtotal 254,962 255,357Discounted lease rentals 2017 — — 57,081 2.45 - 7.88
2018 52,347 2.55 - 7.95 42,132 2.55 - 7.952019 34,978 2.53 - 6.00 24,671 2.53 - 6.002020 19,736 2.64 - 6.50 11,753 2.64 - 6.902021 10,077 2.88 - 5.00 4,423 2.88 - 4.572022 2,349 3.04 - 5.43 — —
Subtotal 119,487 140,060Other long-term borrowings 2017 — — 2,764 1.36
Total long-term borrowings $ 1,249,449 $ 1,073,181(1) Related to subordinated bank notes with a stated maturity of 2025 at December 31, 2017.
At December 31, 2017, TCF Bank had pledged loans secured by consumer and commercial real estate and FHLBstock with an aggregate carrying value of $4.4 billion as collateral for FHLB advances. At December 31, 2017,$875.0 million of the FHLB advances outstanding were prepayable at TCF's option.

Note 14. Income Taxes
Tax Reform was enacted on December 22, 2017, resulting in changes in U.S. corporate tax rates, business-relatedexclusions, deductions and credits. Enactment of Tax Reform requires TCF to reflect the changes associated with thelaw's provisions in its consolidated financial statements as of and for the year ended December 31, 2017. The law iscomplex and has extensive implications for TCF's federal, state and foreign current and deferred income taxes.
As a result of Tax Reform, TCF has recorded a reasonable estimate of a net tax benefit of $130.7 million in itsconsolidated financial statements for the year ended December 31, 2017, primarily resulting from the re-measurementof the Company's estimated net deferred tax liability. Certain of these amounts are provisional in nature, as all theinformation necessary to record more precise amounts is not yet available, prepared or analyzed. Examples includeinformation associated with TCF’s deemed repatriation tax; like-kind-exchange program; the timing of paymentsassociated with certain liabilities; reports, tax forms and forecasts from various partnership investments; grantor lettersand tax forms from various trusts; and the results of detailed analyses of information associated with several deferredtax items. TCF will obtain, prepare and analyze this information during the measurement period, up to and includingthe period in which it files its 2017 consolidated federal income tax return. TCF may adjust these provisional amountsduring the measurement period as it obtains, prepares or analyzes this additional information. Applicable income taxes in the Consolidated Statements of Income were as follows:
(In thousands) Current Deferred TotalYear ended December 31, 2017:
Federal $ 14,384 $ (62,913) $ (48,529)State 237 9,340 9,577Foreign 5,484 (156) 5,328
Total $ 20,105 $ (53,729) $ (33,624)Year ended December 31, 2016:
Federal $ 66,810 $ 28,629 $ 95,439State 11,402 4,425 15,827Foreign 5,350 (88) 5,262
Total $ 83,562 $ 32,966 $ 116,528Year ended December 31, 2015:
Federal $ 73,579 $ 16,141 $ 89,720State 9,255 4,637 13,892Foreign 5,252 8 5,260
Total $ 88,086 $ 20,786 $ 108,872
Reconciliations to TCF's effective income tax rate from the statutory federal income tax rate of 35.00% were as follows:
Year Ended December 31,2017 2016 2015
Federal income tax rate 35.00 % 35.00% 35.00%Increase (decrease) resulting from:
Tax Reform effects, net (53.29) — — —Nondeductible goodwill impairment effect 10.43 — —State income tax, net of federal tax 3.92 3.04 2.87Tax-exempt income (3.86) (2.07) (0.93)Non-controlling interest tax effect (1.45) (0.99) (0.97)State tax settlements, net of federal tax (1.38) 0.19 (0.12)Stock compensation (1.15) — —Investments in affordable housing limited liability entities (0.89) (0.24) (0.18)Foreign tax effects (0.67) (0.50) (0.53)Other, net (0.38) 0.02 (0.54)
Effective income tax rate (13.72)% 34.45% 34.60%
92

TCF considers its undistributed foreign earnings to be reinvested indefinitely. This position is based on management'sdetermination that cash held in TCF's foreign jurisdictions is not needed to fund its U.S. operations and that it eitherhas reinvested or has intentions to reinvest these earnings. While management currently intends to indefinitely reinvestall of TCF's foreign earnings, should circumstances or tax laws change, TCF may need to record additional incometax expense in the period in which such determination or tax law change occurs.
As a result of Tax Reform, TCF recognized a $2.0 million charge related to U.S. federal income tax on the deemedrepatriation of undistributed foreign earnings as of December 31, 2017. Due to the shift to a worldwide territorial taxregime as part of Tax Reform, future repatriations of foreign earnings will no longer be subject to U.S. federal incometax. However, these foreign earnings may be subject to foreign withholding taxes should they be distributed in the formof dividends. As of December 31, 2017, the estimated withholding taxes that could be due on these earnings was$3.6 million.
Reconciliations of the changes in unrecognized tax benefits were as follows:
At or For the Year Ended December 31,(In thousands) 2017 2016 2015Balance, beginning of period $ 4,690 $ 4,249 $ 4,649
Increases for tax positions related to the current year 200 546 323Increases for tax positions related to prior years 86 627 —Decreases for tax positions related to prior years (331) (84) (157)Settlements with taxing authorities — (525) (425)Decreases related to lapses of applicable statutes of limitation — (123) (141)
Balance, end of period $ 4,645 $ 4,690 $ 4,249
The total amount of unrecognized tax benefits that, if recognized, would affect the effective tax rate was $2.2 millionand $1.6 million at December 31, 2017 and 2016, respectively. TCF recognizes increases and decreases for interestand penalties related to unrecognized tax benefits, where applicable, in income tax expense. TCF recognizedapproximately $0.6 million of tax benefit, $0.9 million of tax expense and $0.2 million of tax benefit in 2017, 2016 and2015, respectively, related to interest and penalties. Interest and penalties of approximately $0.6 million and $1.2 millionwere accrued at December 31, 2017 and 2016, respectively.
TCF's federal income tax returns are open and subject to examination for 2014 and later tax return years. TCF's variousstate income tax returns are generally open for 2013 and later tax return years based on individual state statutes oflimitation. TCF's various foreign income tax returns are open and subject to examination for 2013 and later tax returnyears. Changes in the amount of unrecognized tax benefits within the next 12 months from normal expirations ofstatutes of limitation are not expected to be material.
93

TCF's deferred tax assets and deferred tax liabilities were as follows:
At December 31,(In thousands) 2017 2016Deferred tax assets:
Allowance for loan and lease losses $ 41,339 $ 75,976Stock compensation and deferred compensation plans 21,150 41,105Net operating losses 16,452 11,924Securities available for sale 5,345 17,606Accrued expense 2,507 3,730Other 3,603 5,548
Deferred tax assets 90,396 155,889Valuation allowance (14,267) (10,377)
Total deferred tax assets, net of valuation allowance 76,129 145,512Deferred tax liabilities:
Lease financing 246,221 348,933Premises and equipment 30,109 32,430Loan fees and discounts 12,489 17,017Prepaid expenses 8,047 11,245Goodwill and other intangibles 2,475 3,870Other 4,715 7,375
Total deferred tax liabilities 304,056 420,870Net deferred tax liabilities $ 227,927 $ 275,358
The net operating losses at December 31, 2017 consisted of state net operating losses that expire in 2018 through2037. The valuation allowance at December 31, 2017 and 2016 principally applies to net operating losses that, in theopinion of management, are more likely than not to expire unutilized. However, to the extent that tax benefits relatedto these carryforwards are realized in the future, the reduction in the valuation allowance will reduce income taxexpense.
94
Note 15. Equity
Preferred Stock
Preferred stock was as follows:
At December 31,(In thousands) 2017 20167.50% Series A non-cumulative perpetual preferred stock $ — $ 166,7216.45% Series B non-cumulative perpetual preferred stock 96,519 96,5195.70% Series C non-cumulative perpetual preferred stock 169,302 —
Total preferred stock $ 265,821 $ 263,240
At December 31, 2017 and 2016, there were 4,000,000 shares outstanding of the 6.45% Series B non-cumulativeperpetual preferred stock of TCF Financial Corporation, par value $0.01 per share, with a liquidation preference of$25 per share (the "Series B Preferred Stock"). Dividends are payable on the Series B Preferred Stock if, as and whendeclared by TCF's Board of Directors on a non-cumulative basis on March 1, June 1, September 1 and December 1of each year at a per annum rate of 6.45%. TCF paid cash dividends to holders of the Series B Preferred Stock of$6.5 million in 2017, 2016 and 2015. The Series B Preferred Stock may be redeemed at TCF's option in whole or inpart at any time. On January 30, 2018, TCF's Board of Directors approved the redemption of all outstanding sharesof the Series B Preferred Stock on March 1, 2018.

At December 31, 2017, there were 7,000,000 depositary shares outstanding, each representing a 1/1000th ownershipinterest in a share of the 5.70% Series C non-cumulative perpetual preferred stock of TCF Financial Corporation, parvalue $0.01 per share, with a liquidation preference of $25,000 per share (equivalent to $25 per depositary share) (the"Series C Preferred Stock"). Dividends are payable on the Series C Preferred Stock if, as and when declared by TCF'sBoard of Directors on a non-cumulative basis on March 1, June 1, September 1 and December 1 of each year, whichcommenced on December 1, 2017, at a per annum rate of 5.70%. TCF paid cash dividends to holders of the SeriesC Preferred Stock of $2.1 million in 2017. The Series C Preferred Stock may be redeemed at TCF's option in wholeor in part on December 1, 2022 or on any dividend payment date thereafter.
The Series C Preferred Stock was issued on September 14, 2017 for an aggregate public offering price of $175.0 million.Net proceeds of the offering to TCF, after deducting deferred stock issuance costs of $5.7 million, were $169.3 million.
On October 16, 2017, TCF redeemed the 6,900,000 depositary shares, each representing a 1/1000th ownership interestin a share of the 7.50% Series A non-cumulative perpetual preferred stock of TCF Financial Corporation, par value$0.01 per share, with a liquidation preference of $25,000 per share (equivalent to $25 per depositary share) (the "SeriesA Preferred Stock") for $172.5 million using the net proceeds from the offering of its Series C depositary shares andadditional cash on hand. Deferred stock issuance costs of $5.8 million originally recorded as a reduction to preferredstock upon the issuance of the Series A Preferred Stock were reclassified to retained earnings and resulted in a non-cash, one-time reduction to net income available to common stockholders utilized in the computation of earnings percommon share and diluted earnings per common share for 2017. Dividends were payable on the Series A PreferredStock if, as and when declared by TCF's Board of Directors on a non-cumulative basis on March 1, June 1, September 1and December 1 of each year at a per annum rate of 7.50%. TCF paid cash dividends to holders of the Series APreferred Stock of $11.3 million in 2017 and $12.9 million in both 2016 and 2015.
Restricted Retained Earnings Retained earnings at TCF Bank at December 31, 2017 included approximately$134.4 million for which no provision for federal income taxes has been made. This amount represents earnings legallyappropriated to thrift bad debt reserves and deducted for federal income tax purposes in prior years and is generallynot available for payment of cash dividends or other distributions to stockholders. Future payments or distributions ofthese appropriated earnings could create a tax liability for TCF based on the amount of the distributions and the taxrates in effect at that time.
Treasury Stock and Other
Treasury stock and other were as follows:
At December 31,(In thousands) 2017 2016Treasury stock, at cost $ 10,265 $ 1,102Shares held in trust for deferred compensation plans, at cost 30,532 48,317
Total $ 40,797 $ 49,419
TCF repurchased 446,464 shares of its common stock in 2017 at an average cost of $20.51 per share under its sharerepurchase program. These shares are recorded as treasury stock. No repurchases of common stock were made in2016 or 2015. At December 31, 2017, TCF had approximately $140.8 million in aggregate value of shares remainingin its stock repurchase program authorized by TCF's Board of Directors.
The cost of TCF common stock held in trust for TCF's deferred compensation plans, including the Executive, SeniorOfficer, Winthrop and Directors Deferred Compensation Plans, TCF Employees Deferred Stock Compensation Planand the TCF 401K Supplemental Plan, is reported in a manner similar to treasury stock (that is, changes in fair valueare not recognized) with a corresponding deferred compensation obligation reflected in additional paid-in capital. Uponresignation, death, disability or termination of a deferred compensation plan participant or based on other contractualrequirements, the shares held in trust are distributed to the respective plan's participant or beneficiary, as applicable.See Note 17. Stock Compensation and Note 18. Employee Benefit Plans for further information on deferredcompensation plans.
95

Non-controlling Interest in Subsidiaries TCF has a joint venture with The Toro Company ("Toro") called Red IronAcceptance, LLC ("Red Iron"). Red Iron provides U.S. distributors and dealers and select Canadian distributors of theToro® and Exmark® branded products with sources of financing. TCF and Toro maintain a 55% and 45% ownershipinterest, respectively, in Red Iron. As TCF has a controlling financial interest in Red Iron, its financial results areconsolidated in TCF's financial statements. Toro's interest is reported as a non-controlling interest within equity.
Warrants At December 31, 2017, TCF had 3,199,988 warrants outstanding with an exercise price of $16.93 per share,which expire on November 14, 2018. Upon the completion of the U.S. Department of the Treasury ("U.S. Treasury")'ssecondary public offering of the warrants issued under the Capital Purchase Program ("CPP") in December 2009, thewarrants became publicly traded on the New York Stock Exchange and now trade under the symbol "TCFWS". As aresult, TCF has no further obligation to the federal government in connection with the CPP.
96
Note 16. Regulatory Capital Requirements
TCF and TCF Bank are subject to minimum capital requirements administered by the federal banking regulators. Failureto meet minimum capital requirements can initiate certain mandatory, and possible additional discretionary, actions bythe federal banking regulators that could have a material adverse effect on TCF. In general, TCF Bank may not declareor pay a dividend to TCF Financial in excess of 100% of its net retained earnings for the current year combined withits net retained earnings for the preceding two calendar years, which was $529.8 million at December 31, 2017, withoutprior approval of the Office of the Comptroller of the Currency ("OCC"). The OCC also has the authority to prohibit thepayment of dividends by a national bank when it determines such payments would constitute an unsafe and unsoundbanking practice. TCF Bank's ability to make capital distributions in the future may require regulatory approval andmay be restricted by its federal banking regulators. TCF Bank's ability to make any such distributions will also dependon its earnings and ability to meet minimum regulatory capital requirements in effect during future periods. In the future,these capital adequacy standards may be higher than existing minimum regulatory capital requirements.
The Basel III capital standard phases in through 2019. Institutions not subject to the advanced approaches requirementswere allowed to opt out of including components of accumulated other comprehensive income (loss) in common equityTier 1 capital. TCF and TCF Bank made the one-time permanent election to not include accumulated othercomprehensive income (loss) in regulatory capital. TCF and TCF Bank are subject to a capital conservation buffer.When fully phased-in on January 1, 2019, the Basel III capital standard will require TCF and TCF Bank to maintain a2.5% capital conservation buffer, designed to absorb losses during periods of economic stress, composed entirely ofcommon equity Tier 1 capital, on top of the minimum risk-weighted asset ratios, effectively resulting in minimum ratiosfor TCF Bank of (i) a common equity Tier 1 capital ratio of at least 7.0%, (ii) a Tier 1 risk-based capital ratio of at least8.5% and (iii) a total risk-based capital ratio of at least 10.5%.
Regulatory capital information for TCF and TCF Bank was as follows:
TCF TCF BankAt December 31, At December 31,
(Dollars in thousands) 2017 2016 2017 2016Well-capitalized
Standard
MinimumCapital
Requirement(1)
Regulatory Capital:Common equity Tier 1 capital $ 2,242,410 $ 1,970,323 $ 2,409,027 $ 2,144,966Tier 1 capital 2,522,178 2,248,221 2,426,854 2,162,128Total capital 2,889,323 2,635,925 2,837,374 2,583,512
Regulatory Capital Ratios:Common equity Tier 1 capital ratio 10.79% 10.24% 11.59% 11.14% 6.50% 4.50%Tier 1 risk-based capital ratio 12.14 11.68 11.68 11.23 8.00 6.00Total risk-based capital ratio 13.90 13.69 13.65 13.42 10.00 8.00Tier 1 leverage ratio 11.12 10.73 10.70 10.32 5.00 4.00
(1) Excludes capital conservation buffer of 1.25% and 0.625% as of December 31, 2017 and 2016.

Note 17. Stock Compensation
TCF maintains four stock compensation plans: (i) The TCF Financial 2015 Omnibus Incentive Plan ("Omnibus IncentivePlan"), (ii) the TCF Financial Incentive Stock Program ("Incentive Stock Program"), (iii) the Executive, Senior Officer,Winthrop and Directors Deferred Compensation Plans and (iv) the TCF Employees Deferred Stock CompensationPlan.
Omnibus Incentive Plan and Incentive Stock Program The Omnibus Incentive Plan and the Incentive Stock Programwere adopted to enable TCF to attract and retain key personnel. In April 2015, TCF stockholders approved the OmnibusIncentive Plan, which replaced the Incentive Stock Program. At December 31, 2017, there were 1,446,047 and 366,000shares reserved for issuance under the Omnibus Incentive Plan and Incentive Stock Program, respectively.
At December 31, 2017, there were 350,000 shares of performance-based restricted stock awards outstanding thatwill vest only if certain performance goals and service conditions are achieved. Failure to achieve the performancegoals and service conditions will result in all or a portion of the shares being forfeited. Service-based restricted stockawards under either the Omnibus Incentive Plan or the Incentive Stock Program vest over periods from one to fiveyears.
Information about restricted stock awards was as follows:
At or For the Year Ended December 31,(Dollars in thousands) 2017 2016 2015
Unrecognized stock compensation expense $ 17,944 $ 24,925 $ 25,919
Weighted-average amortization (years) 1.6 1.6 2.1
At December 31, 2017, there were 360,988 performance-based restricted stock units granted under the OmnibusIncentive Plan that will vest only if certain performance goals are achieved. The performance-based restricted stockunits are subject to TCF’s relative total stockholder return for a three-year measurement period, based on award date,as measured against TCF's peer group, which includes publicly-traded banks and thrift institutions with assets between$10 billion and $50 billion as selected by TCF's Compensation Committee. The number of restricted stock units grantedwas at target and the actual restricted stock units granted will depend on actual performance with a maximum totalpayout of 150% of target. Failure to achieve the performance goals will result in all or a portion of the restricted stockunits being forfeited. None of the performance-based restricted stock units had vested as of December 31, 2017. Theremaining weighted-average performance period of the restricted stock units was 1.7 years at December 31, 2017.
Compensation expense for restricted stock awards and restricted stock units was as follows:
Year Ended December 31,
(In thousands) 2017 2016 2015
Compensation expense $ 12,687 $ 8,715 $ 5,931
Tax benefit recognized for stock compensation expense 5,661 3,103 2,127
In 2008, TCF granted stock options under the Incentive Stock Program. These options generally become exercisableover a period of one to 10 years from the date of the grant and expire after 10 years. All outstanding options have afixed exercise price equal to the market price of TCF common stock on the date of grant. No stock options havesubsequently been granted under the Incentive Stock Program. TCF also has the ability to grant stock options underthe Omnibus Incentive Plan. As of December 31, 2017, no stock options had been granted under the Omnibus IncentivePlan.
The valuation assumptions for stock options granted in 2008 under the Incentive Stock Program were as follows:
Expected volatility 28.5 %Weighted-average volatility 28.5 %Expected dividend yield 3.5 %Expected term (years) 6.25 - 6.75Risk-free interest rate 2.58 % - 2.91 %
97

TCF's restricted stock award and stock option transactions since December 31, 2014 under the Omnibus IncentivePlan and the Incentive Stock Program were as follows:
Restricted Stock Awards Stock Options
Shares Grant Date Fair
Value Range
Weighted-average
Grant DateFair Value Shares
Weighted-average
RemainingContractualLife in Years
Weighted-averageExercise
PriceOutstanding at December 31, 2014 2,858,494 $ 6.16 - $ 16.02 $ 12.73 1,579,000 2.98 $ 13.91
Granted 786,933 12.86 - 16.28 14.45 — — —Exercised — — - — — (200,000) — 12.85Forfeited/canceled (156,332) 6.80 - 15.96 13.20 — — —Vested (216,009) 9.65 - 15.96 13.16 — — —
Outstanding at December 31, 2015 3,273,086 6.16 - 16.28 13.09 1,379,000 2.17 14.07Granted 899,000 9.48 - 13.24 12.13 — — —Exercised — — - — — (857,000) — 13.04Forfeited/canceled (230,486) 6.16 - 15.96 13.59 (118,000) — 15.75Vested (405,425) 9.65 - 15.96 13.10 — — —
Outstanding at December 31, 2016 3,536,175 7.73 - 16.28 12.81 404,000 1.06 15.75Granted 583,388 13.96 - 19.42 16.47 — — —Exercised — — - — — (38,000) — 15.75Forfeited/canceled (577,020) 7.73 - 15.87 11.38 — — —Vested (902,880) 9.36 - 16.02 13.65 — — —
Outstanding at December 31, 2017 2,639,663 7.73 - 19.42 13.65 366,000 0.06 15.75Exercisable at December 31, 2017 N.A. N.A. 366,000 15.75
N.A. Not Applicable.
Executive, Senior Officer, Winthrop and Directors Deferred Compensation Plans TCF maintains theaforementioned deferred compensation plans, which previously allowed both eligible employees and non-employeedirectors to defer a portion of certain payments, and, in some cases, grants of restricted stock. In October 2008, TCFterminated the employee plans and only the Directors plan remains active, which allows non-employee directors todefer up to 100% of their director fees and restricted stock awards. The amounts deferred under these plans areinvested in TCF common stock or other publicly traded stocks, bonds or mutual funds. At December 31, 2017, the fairvalue of the assets in these plans totaled $15.7 million and included $12.0 million invested in TCF common stock,compared with a total fair value of $14.0 million, including $10.5 million invested in TCF common stock atDecember 31, 2016. The plans' assets invested in TCF common stock are held in trust and are included in treasurystock and other. See Note 15. Equity for further information on treasury stock and other.
TCF Employees Deferred Stock Compensation Plan The TCF Employees Deferred Stock Compensation Plan iscomprised of restricted stock awards issued to certain executives. The assets of this plan are solely held in TCFcommon stock with a fair value of $9.6 million and $35.6 million at December 31, 2017 and 2016, respectively. Theplan's assets invested in TCF common stock are held in trust and are included in treasury stock and other. See Note15. Equity for further information on treasury stock and other.
Upon resignation, death, disability or termination of a deferred compensation plan participant or based on othercontractual requirements, the plan participant's assets are distributed.
98

Note 18. Employee Benefit Plans
TCF maintains four employee benefit plans: (i) the TCF 401K Plan (the "401K"), (ii) the TCF 401K Supplemental Plan(the "SERP"), (iii) the TCF Cash Balance Pension Plan (the "Pension Plan") and (iv) the Postretirement Plan.
TCF 401K Plan The 401K, a qualified 401(k) and employee stock ownership plan, allows participants to makecontributions of up to 50% of their covered compensation on a tax-deferred basis, subject to the annual coveredcompensation limitation imposed by the Internal Revenue Service ("IRS"). Effective January 1, 2018, participants couldmake contributions of up to 50% of their covered compensation on a tax-deferred and/or after-tax basis, subject to theannual covered compensation limitation imposed by the IRS. TCF matches the contributions of all participants withTCF common stock at the rate of $1 per dollar for employees with one or more years of service up to a maximumcompany contribution of 5.0% of the employee's covered compensation subject to the annual covered compensationlimitation imposed by the IRS. Employee contributions and matching contributions vest immediately.
Prior to January 1, 2016 TCF matched the contributions of all participants with TCF common stock at the rate of50 cents per dollar for employees with one through four years of service up to a maximum company contribution of3.0% of the employee's covered compensation, 75 cents per dollar for employees with five through nine years ofservice up to a maximum company contribution of 4.5% of the employee's covered compensation and $1 per dollarfor employees with 10 or more years of service up to a maximum company contribution of 6.0% of the employee'scovered compensation, subject to the annual covered compensation limitation imposed by the IRS. Employeecontributions vested immediately while the Company's matching contributions made prior to January 1, 2016 aresubject to a graduated vesting schedule based on an employee's years of service with full vesting after five years.
Employees have the opportunity to diversify and invest their account balance, including matching contributions, invarious mutual funds or TCF common stock. At December 31, 2017, the fair value of the assets in the 401K totaled$346.8 million and included $164.9 million invested in TCF common stock. Dividends on TCF common shares held inthe 401K reduce retained earnings and the shares are considered outstanding for computing earnings per share. TheCompany's matching contributions are expensed when earned. TCF's contributions to the 401K were $12.3 million,$12.6 million and $10.6 million in 2017, 2016 and 2015, respectively.
TCF 401K Supplemental Plan The SERP, a non-qualified plan, allows certain employees to contribute up to 50% oftheir salary and bonus. TCF matching contributions to this plan totaled $1.2 million, $1.7 million and $1.0 million in2017, 2016 and 2015, respectively. The Company made no other contributions to this plan, other than payment ofadministrative expenses. The amounts deferred under this plan are invested in TCF common stock or mutual funds.At December 31, 2017, the fair value of the assets in the plan totaled $52.7 million and included $26.0 million investedin TCF common stock, compared with a total fair value of $48.2 million, including $27.9 million invested in TCF commonstock at December 31, 2016. The plan's assets invested in TCF common stock are held in trust and included in treasurystock and other. See Note 15. Equity for further information on treasury stock and other.
TCF Cash Balance Pension Plan The Pension Plan is a qualified defined benefit plan covering eligible employeeswho are at least 21 years old and have completed a year of eligible service with TCF. Employees hired after June 30,2004 are not eligible to participate in the Pension Plan. Effective March 31, 2006, TCF amended the Pension Plan todiscontinue compensation credits for all participants. Interest credits will continue to be paid until participants' accountsare distributed from the Pension Plan. Each month TCF credits participants' accounts with interest on their accountbalance based on the five-year U.S. Treasury rate plus 25 basis points rounded to the nearest quarter point determinedat the beginning of each year. All participant accounts are vested.
The measurement of the projected benefit obligation, prepaid pension asset, pension liability and annual pensionexpense involves complex actuarial valuation methods and the use of actuarial and economic assumptions. Due tothe long-term nature of the Pension Plan obligation, actual results may differ significantly from the actuarial-basedestimates. Differences between estimates and actual experience are recorded in the year they arise. TCF closelymonitors all assumptions and updates them annually. The Company does not consolidate the assets and liabilitiesassociated with the Pension Plan.
99

Postretirement Plan TCF provides health care benefits for eligible retired employees. Effective January 1, 2000,TCF modified the Postretirement Plan for employees not yet eligible for benefits under the Postretirement Plan byeliminating the Company subsidy. The Postretirement Plan provisions for full-time and retired employees then eligiblefor these benefits were not changed. Employees retiring after December 31, 2009 are no longer eligible to participatein the Postretirement Plan. The Postretirement Plan is not funded.
The information set forth in the following tables is based on current actuarial reports using the measurement date ofDecember 31 for TCF's Pension Plan and Postretirement Plan.
The funded statuses of the Pension Plan and the Postretirement Plan were as follows:
Pension Plan Postretirement PlanYear Ended December 31,
(In thousands) 2017 2016 2017 2016Change in projected benefit obligation:
Benefit obligation, beginning of period $ 33,174 $ 35,953 $ 4,164 $ 4,570Interest cost on projected benefit obligation 1,138 1,281 133 151Actuarial (gain) loss 765 (625) (248) (211)Benefits paid (3,688) (3,435) (332) (346)
Projected benefit obligation, end of period 31,389 33,174 3,717 4,164Change in fair value of plan assets:
Fair value of plan assets, beginning of period 39,377 40,914 — —Actual gain (loss) on plan assets 1,174 1,898 — —Benefits paid (3,688) (3,435) (332) (346)TCF contributions — — 332 346
Fair value of plan assets, end of period 36,863 39,377 — —Funded status of plans, end of period $ 5,474 $ 6,203 $ (3,717) $ (4,164)Amounts recognized in the Consolidated Statements of Financial Condition:
Prepaid (accrued) benefit cost, end of period $ 5,474 $ 6,203 $ (3,717) $ (4,164)Prior service cost included in accumulated other comprehensive income (loss) — — (193) (239)
Total recognized asset (liability) $ 5,474 $ 6,203 $ (3,910) $ (4,403)
The accumulated benefit obligation for the Pension Plan was $31.4 million and $33.2 million at December 31, 2017and 2016, respectively.
TCF's Pension Plan investment policy permits investments in cash, money market mutual funds, direct fixed incomesecurities to include U.S. Treasury securities, U.S. Government-sponsored enterprises and indirect fixed incomeinvestment securities made in fund form (mutual fund or institutional fund) where the fund invests in fixed incomesecurities in investment grade corporate credits, non-investment grade floating-rate bank loans and non-investmentgrade bonds. The fair value of Level 1 assets are based on prices obtained from independent pricing sources for thesame assets traded in active markets. The fair value of the mortgage-backed securities categorized as Level 2 assetsare based on prices obtained from independent pricing sources that are based on observable transactions of similarinstruments, but not quoted markets. There were no assets that are valued on a recurring basis as Level 3 assets.
100

The balances of TCF's Pension Plan investments measured at fair value on a recurring basis were as follows:
Pension PlanYear Ended December 31,
(In thousands) 2017 2016Level 1:
Fixed income mutual funds $ 26,473 $ 26,121Money market mutual funds 705 2,430Cash 63 65
Level 2:Mortgage-backed securities 4,613 5,766
Pension plan investments not classified in fair value hierarchy:Collective investment fund 4,995 4,989
Total Pension Plan assets held in trust $ 36,849 $ 39,371
The changes recognized in accumulated other comprehensive income (loss) attributable to the Postretirement Planwere as follows:
Postretirement PlanYear Ended December 31,
(In thousands) 2017 2016 2015Accumulated other comprehensive income (loss) before tax, beginning of period $ (239) $ (285) $ (331)Amortization of prior service credit (recognized in net periodic benefit cost) 46 46 46
Accumulated other comprehensive income (loss) before tax, end of period $ (193) $ (239) $ (285)
The Pension Plan does not have any accumulated other comprehensive income (loss).
The net periodic benefit plan (income) cost included in compensation and employee benefits expense for the PensionPlan and the Postretirement Plan were as follows:
Pension PlanYear Ended December 31,
(In thousands) 2017 2016 2015Interest cost $ 1,138 $ 1,281 $ 1,216Return on plan assets (1,174) (1,898) 447Recognized actuarial (gain) loss 765 (625) (1,436)
Net periodic benefit plan (income) cost $ 729 $ (1,242) $ 227
Postretirement PlanYear Ended December 31,
(In thousands) 2017 2016 2015Interest cost $ 133 $ 151 $ 154Recognized actuarial (gain) loss (248) (211) (173)Amortization of prior service cost (46) (46) (46)
Net periodic benefit plan (income) cost $ (161) $ (106) $ (65)
Pension Plan actual return on plan assets, net of administrative expenses was 3.2% and 4.9% in 2017 and 2016,respectively, and a loss of 1.0% in 2015.
101

The assumptions used to determine the estimated net benefit plan costs for the Pension Plan and Postretirement Planwere as follows:
Pension Plan Postretirement PlanYear Ended December 31, Year Ended December 31,
2017 2016 2015 2017 2016 2015Discount rate 3.60% 3.75% 3.25% 3.40% 3.50% 3.25%Expected long-term rate of return on plan assets 1.50 1.50 1.50 N.A. N.A. N.A.
N.A. Not Applicable.
Prior service credits of TCF's Postretirement Plan of $46 thousand were included within accumulated othercomprehensive income (loss) at December 31, 2017 and are expected to be recognized as components of net periodicbenefit cost during 2018.
The actuarial assumptions used in the Pension Plan valuation are reviewed annually. The expected long-term rate ofreturn on plan assets is determined by reference to historical market returns and future expectations. The 10-yearexpected average return of the index consistent with the Pension Plan's current investment strategy was 2.0%, net ofadministrative expenses. A 1.0% difference in the expected return on plan assets would result in a $0.4 million changein net periodic pension expense.
The assumptions used to determine the estimated benefit plan obligation for the Pension Plan and PostretirementPlan were as follows:
Pension Plan Postretirement PlanYear Ended December 31, Year Ended December 31,
2017 2016 2017 2016Discount rate 3.30% 3.60% 3.15% 3.40%Health care cost trend rate assumed for next year N.A. N.A. 5.7 5.8Final health care cost trend rate N.A. N.A. 4.5 4.5Year that final health care trend rate is reached N.A. N.A. 2038 2038N.A. Not Applicable.
The discount rates used to determine the estimated benefit plan obligation were determined by matching estimatedbenefit cash flows to a yield curve derived from corporate bonds rated AA by either Moody's or Standard and Poor's.Bonds containing call or put provisions were excluded. The average estimated duration of benefit cash flows for TCF'sPension Plan and Postretirement Plan varied between 6.5 and 6.9 years.
Assumed health care cost trend rates have an effect on the amounts reported for the Postretirement Plan. A 1.0%change in assumed health care cost trend rates would have the following effect:
1-Percentage-Point(In thousands) Increase DecreaseEffect on total service and interest cost components $ 5 $ (5)Effect on postretirement benefit obligations 119 (161)
For 2017, TCF is eligible to contribute up to $11.0 million to the Pension Plan until the 2017 federal income tax returnextended due date under various IRS funding methods. During 2017, 2016 and 2015, TCF made no cash contributionsto the Pension Plan. TCF does not expect to be required to contribute to the Pension Plan in 2018. TCF contributed$0.3 million, $0.3 million and $0.4 million to the Postretirement Plan in 2017, 2016 and 2015, respectively. TCF expectsto contribute $0.5 million to the Postretirement Plan in 2018. TCF currently has no plans to pre-fund the PostretirementPlan in 2018.
102

The expected future benefit payments used to determine projected benefit obligations were as follows:
(In thousands) Pension Plan Postretirement Plan2018 $ 3,200 $ 4542019 3,342 4282020 2,842 4022021 2,405 3762022 2,377 3512023 - 2027 9,844 1,387
103
Note 19. Financial Instruments with Off-Balance Sheet Risk
TCF is a party to financial instruments with off-balance sheet risk, primarily to meet the financing needs of its customers.These financial instruments, which are issued or held for purposes other than trading, involve elements of credit andinterest-rate risk in excess of the amounts recognized in the Consolidated Statements of Financial Condition.
TCF's exposure to credit loss, in the event of non-performance by the counterparty to the financial instrument, forcommitments to extend credit and standby letters of credit is represented by the contractual amount of the commitments.TCF uses the same credit policies in making these commitments as it does for making direct loans. TCF evaluateseach customer's creditworthiness on a case-by-case basis. The amount of collateral obtained is based on a creditevaluation of the customer.
Financial instruments with off-balance sheet risk were as follows:
At December 31,(In thousands) 2017 2016Commitments to extend credit:
Consumer real estate and other $ 1,484,065 $ 1,425,585Commercial 1,033,973 898,809Leasing and equipment finance 126,249 125,648
Total commitments to extend credit 2,644,287 2,450,042Standby letters of credit and guarantees on industrial revenue bonds 12,992 8,782
Total $ 2,657,279 $ 2,458,824
Commitments to Extend Credit Commitments to extend credit are agreements to lend provided there is no violationof any condition in the contract. These commitments generally have fixed expiration dates or other termination clausesand may require payment of a fee. Since a certain amount of the commitments are expected to expire without beingdrawn upon, the total commitment amounts do not necessarily represent future cash requirements. Collateral to secureany funding of these commitments predominantly consists of residential and commercial real estate mortgages.
Standby Letters of Credit and Guarantees on Industrial Revenue Bonds Standby letters of credit and guaranteeson industrial revenue bonds are conditional commitments issued by TCF guaranteeing the performance of a customerto a third party. These conditional commitments expire in various years through 2021. Collateral held consists primarilyof commercial real estate mortgages. Since the conditions under which TCF is required to fund these commitmentsmay not materialize, the cash requirements are expected to be less than the total outstanding commitments.

Note 20. Derivative Instruments Derivative instruments were as follows:
At December 31, 2017
(In thousands)NotionalAmount
Gross AmountsRecognized
Gross AmountsOffset
Net AmountPresented
Derivative Assets:Derivatives designated as hedges:
Interest rate contracts $ 150,000 $ 405 $ (405) $ —Derivatives not designated as hedges:
Interest rate contracts 169,377 1,392 (52) 1,340Interest rate lock commitments 17,974 223 — 223
Total derivative assets $ 2,020 $ (457) $ 1,563Derivative Liabilities:
Derivatives designated as hedges:Forward foreign exchange contracts $ 77,879 $ 1,744 $ (1,744) $ —
Derivatives not designated as hedges:Forward foreign exchange contracts 330,928 4,619 (4,282) 337Interest rate contracts 423,006 1,688 (457) 1,231Other contracts 13,804 615 (615) —Interest rate lock commitments 41 — — —
Total derivative liabilities $ 8,666 $ (7,098) $ 1,568
At December 31, 2016
(In thousands)NotionalAmount
Gross AmountsRecognized
Gross AmountsOffset
Net AmountPresented
Derivative Assets:Derivatives designated as hedges:
Forward foreign exchange contracts $ 61,760 $ 1,082 $ — $ 1,082Derivatives not designated as hedges:
Forward foreign exchange contracts 250,018 2,995 (1,439) 1,556Interest rate contracts 149,499 1,925 (633) 1,292Interest rate lock commitments 27,954 318 — 318
Total derivative assets $ 6,320 $ (2,072) $ 4,248Derivative Liabilities:
Derivatives designated as hedges:Interest rate contracts $ 150,000 $ 1,320 $ (1,320) $ —
Derivatives not designated as hedges:Forward foreign exchange contracts 115,336 469 (445) 24Interest rate contracts 149,499 1,936 (1,332) 604Other contracts 13,804 619 (619) —Interest rate lock commitments 2,947 21 — 21
Total derivative liabilities $ 4,365 $ (3,716) $ 649
104

The pre-tax impact of derivative activity within the Consolidated Statements of Income and the Consolidated Statementsof Comprehensive Income was as follows:
Year Ended December 31,(In thousands) Income Statement Location 2017 2016 2015Consolidated Statements of Income
Fair value hedges:Interest rate contracts Other non-interest income $ (609) $ (1,178) $ (142)Non-derivative hedged items Other non-interest income 808 1,140 209
Not designated as hedges:Forward foreign exchange contracts Other non-interest expense (15,748) (13,689) 74,292
Interest rate lock commitmentsGains on sales of consumer
real estate loans, net (73) (419) 431Interest rate contracts Other non-interest income (268) 71 4Other contracts Other non-interest expense (311) (629) —
Net gain (loss) recognized $ (16,201) $ (14,704) $ 74,794Consolidated Statements of Comprehensive Income
Net investment hedges:
Forward foreign exchange contracts Other comprehensive income
(loss) $ (4,430) $ (1,213) $ 7,613Net unrealized gain (loss) $ (4,430) $ (1,213) $ 7,613
TCF executes all of its forward foreign exchange contracts in the over-the-counter market with large financial institutionspursuant to International Swaps and Derivatives Association, Inc. agreements. These agreements include credit risk-related features that enhance the creditworthiness of these instruments as compared with other obligations of therespective counterparty with whom TCF has transacted by requiring that additional collateral be posted under certaincircumstances. The amount of collateral required depends on the contract and is determined daily based on marketand currency exchange rate conditions.
At December 31, 2017 and 2016, credit risk-related contingent features existed on forward foreign exchange contractswith a notional value of $39.8 million and $78.1 million, respectively. In the event TCF is rated less than BB- by Standardand Poor's, the contracts could be terminated or TCF may be required to provide approximately $0.8 million and$1.6 million in additional collateral at December 31, 2017 and 2016, respectively. There were $0.4 million of forwardforeign exchange contracts containing credit risk-related features in a net liability position at December 31, 2017 andnone at December 31, 2016.
At December 31, 2017, TCF had posted $7.6 million, $7.5 million and $1.4 million of cash collateral related to its interestrate contracts, forward foreign exchange contracts and other contracts, respectively.
105
Note 21. Fair Value Disclosures
TCF uses fair value measurements to record fair value adjustments to certain assets and liabilities and to determinefair value disclosures. The Company's fair values are based on the price that would be received upon the sale of anasset or paid to transfer a liability in an orderly transaction between market participants at the measurementdate. Securities available for sale, certain loans held for sale, interest-only strips, forward foreign exchange contracts,interest rate contracts, interest rate lock commitments, forward loan sales commitments, assets and liabilities held intrust for deferred compensation plans and other contracts are recorded at fair value on a recurring basis. From timeto time we may be required to record at fair value other assets on a non-recurring basis, such as certain securitiesheld to maturity, loans, goodwill, other intangible assets, other real estate owned, repossessed and returned assetsand the securitization receivable. These non-recurring fair value adjustments typically involve application of lower ofcost or fair value accounting or write-downs of individual assets.
TCF groups its assets and liabilities measured at fair value in three levels, based on the markets in which the assetsand liabilities are traded and the degree and reliability of estimates and assumptions used to determine fair value asfollows: Level 1, which includes valuations that are based on prices obtained from independent pricing sources for thesame instruments traded in active markets; Level 2, which includes valuations that are based on prices obtained fromindependent pricing sources that are based on observable transactions of similar instruments, but not quoted markets;and Level 3, for which valuations are generated from Company model-based techniques that use significantunobservable inputs. Such unobservable inputs reflect estimates of assumptions that market participants would usein pricing the asset or liability.
The following is a discussion of the valuation methodologies used to record assets and liabilities at fair value on arecurring or non-recurring basis and for estimating fair value of financial instruments not recorded at fair value.
Investments The carrying value of investments in FHLB stock and Federal Reserve Bank stock, categorized asLevel 2, approximates fair value based on redemption at par value.
Securities Held to Maturity Securities held to maturity consist primarily of securities of U.S. Government sponsoredenterprises and federal agencies. The fair value of securities of U.S. Government sponsored enterprises and federalagencies, categorized as Level 2, is estimated using prices obtained from independent asset pricing services that arebased on observable transactions, but not quoted markets. Management reviews the prices obtained from independentasset pricing services for unusual fluctuations and comparisons to current market trading activity. The fair value ofother securities, categorized as Level 3, is estimated using probability of loss based on risk rating definitions. Thereis no observable secondary market for these securities.
Securities Available for Sale Securities available for sale consist primarily of securities of U.S. Government sponsoredenterprises and federal agencies, and obligations of states and political subdivisions. The fair value of these securities,categorized as Level 2, is recorded using prices obtained from independent asset pricing services that are based onobservable transactions, but not quoted markets. Management reviews the prices obtained from independent assetpricing services for unusual fluctuations and comparisons to current market trading activity.
Loans Held for Sale Loans held for sale are generally carried at the lower of cost or fair value. Estimated fair valuesare based on recent loan sale transactions and any available price quotes on loans with similar coupons, maturitiesand credit quality. Certain other loans held for sale are recorded at fair value under the elected fair value option. TCFrelies on internal valuation models which utilize quoted investor prices to estimate the fair value of these loans. Loansheld for sale are categorized as Level 3.
Loans The fair value of loans, categorized as Level 3, is estimated based on discounted expected cash flows andrecent sales of similar loans. The discounted cash flows include assumptions for prepayment estimates over eachloan's remaining life, consideration of the current interest rate environment compared with the weighted-average rateof each portfolio, a credit risk component based on the historical and expected performance of each portfolio and aliquidity adjustment related to the current market environment. TCF also uses pricing data from recent sales of loanswith similar risk characteristics as data points to validate the assumptions used in estimating the fair value of certainloans.
106

Loans for which repayment is expected to be provided solely by the value of the underlying collateral, categorized asLevel 3 and recorded at fair value on a non-recurring basis, are valued based on the fair value of that collateral lessestimated selling costs. Such loans include non-accrual impaired loans as well as certain delinquent non-accrualconsumer real estate and auto finance loans. The fair value of the collateral is determined based on internal estimatesand assessments provided by third-party appraisers.
Interest-only Strips The fair value of interest-only strips, categorized as Level 3, represents the present value offuture cash flows expected to be received by TCF on certain assets. TCF uses available market data, along with itsown empirical data and discounted cash flow models, to arrive at the estimated fair value of its interest-only strips.The present value of the estimated expected future cash flows to be received is determined by using discount, lossand prepayment rates that TCF believes are commensurate with the risks associated with the cash flows and what amarket participant would use. These assumptions are inherently subject to volatility and uncertainty and, as a result,the estimated fair value of the interest-only strips may fluctuate significantly from period to period.
Derivative Instruments
Forward Foreign Exchange Contracts TCF's forward foreign exchange contracts are currency contracts executedin over-the-counter markets and are recorded at fair value using a cash flow model that includes key inputs such asforeign exchange rates and an assessment of the risk of counterparty non-performance. The risk of counterparty non-performance is based on external assessments of credit risk. The fair value of these contracts, categorized as Level 2,is based on observable transactions, but not quoted markets.
Interest Rate Contracts TCF executes interest rate contracts with commercial banking customers to facilitate theirrespective risk management strategies. Certain of these interest rate contracts are simultaneously hedged by offsettinginterest rate contracts TCF executes with a third party, minimizing TCF's net interest rate risk exposure resulting fromsuch transactions. TCF also has an interest rate swap agreement to convert its $150.0 million of fixed-rate subordinatednotes to floating rate debt. These derivative instruments are recorded at fair value. The fair value of these interest ratecontracts, categorized as Level 2, is determined using a cash flow model which considers the forward curve, thediscount curve and credit valuation adjustments related to counterparty and/or borrower non-performance risk.
Interest Rate Lock Commitments TCF's interest rate lock commitments are derivative instruments that are recordedat fair value using an internal valuation model that utilizes estimated rates of successful loan closings and quotedinvestor prices. While this model uses both Level 2 and 3 inputs, TCF has determined that the inputs significant in thevaluation of these commitments fall within Level 3 and therefore they are categorized as Level 3.
Other Contracts TCF has a swap agreement related to the sale of TCF's Visa Class B stock, categorized as Level3. The fair value of the swap agreement is based on TCF's estimated exposure related to the Visa covered litigationthrough a probability analysis of the funding and estimated settlement amounts.
Forward Loan Sales Commitments TCF enters into forward loan sales commitments to sell certain consumer realestate loans. The resulting loans held for sale are also recorded at fair value under the elected fair value option. TCFrelies on internal valuation models to estimate the fair value of these instruments. The valuation models utilize estimatedrates of successful loan closings and quoted investor prices. While these models use both Level 2 and 3 inputs, TCFhas determined that the inputs significant in the valuation of these commitments fall within Level 3 and therefore theyare categorized as Level 3.
Other Real Estate Owned and Repossessed and Returned Assets The fair value of other real estate owned,categorized as Level 3, is based on independent appraisals, real estate brokers' price opinions or automated valuationmethods, less estimated selling costs. Certain properties require assumptions that are not observable in an activemarket in the determination of fair value. The fair value of repossessed and returned assets is based on availablepricing guides, auction results or price opinions, less estimated selling costs. Assets acquired through foreclosure,repossession or returned to TCF are initially recorded at the lower of the loan or lease carrying amount or fair valueless estimated selling costs at the time of transfer to other real estate owned or repossessed and returned assets.
Securitization Receivable TCF executed an auto finance loan securitization during the second quarter of 2016 witha related receivable representing a cash reserve account posted at the inception of the securitization. The fair valueof the securitization receivable, categorized as Level 3, is estimated based on discounted cash flows using interestrates for borrowings of similar remaining maturities plus a spread based on management's judgment.
107
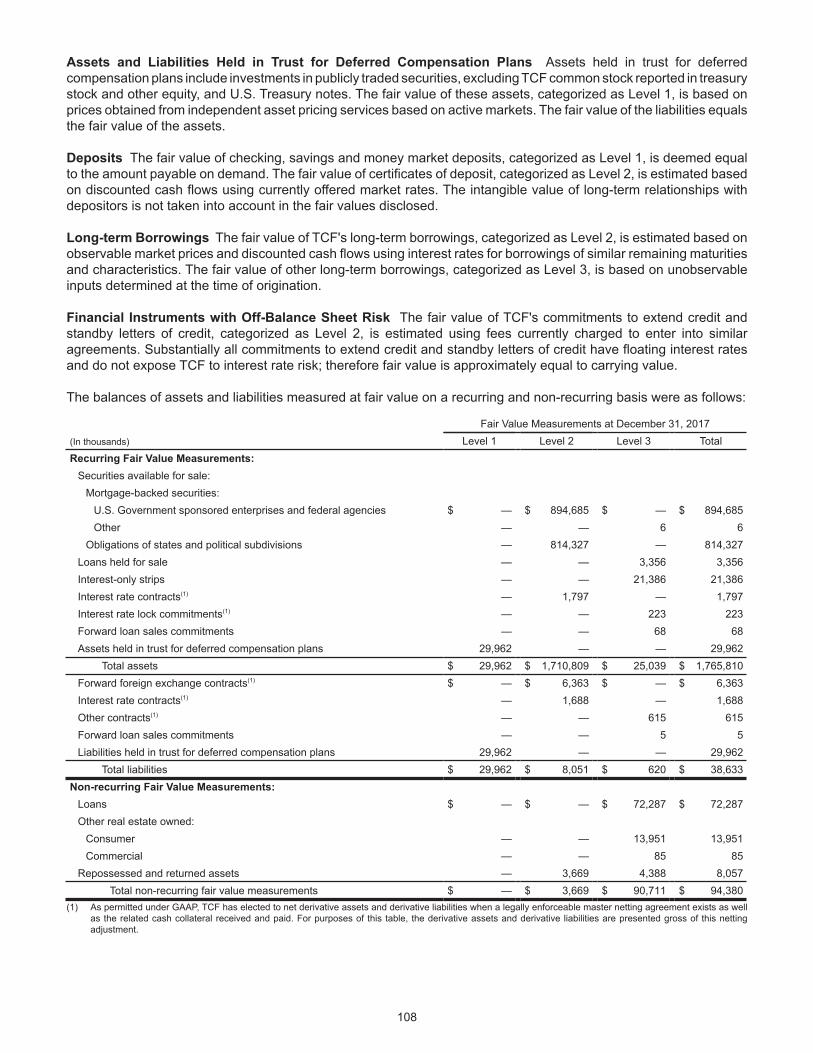
Assets and Liabilities Held in Trust for Deferred Compensation Plans Assets held in trust for deferredcompensation plans include investments in publicly traded securities, excluding TCF common stock reported in treasurystock and other equity, and U.S. Treasury notes. The fair value of these assets, categorized as Level 1, is based onprices obtained from independent asset pricing services based on active markets. The fair value of the liabilities equalsthe fair value of the assets.
Deposits The fair value of checking, savings and money market deposits, categorized as Level 1, is deemed equalto the amount payable on demand. The fair value of certificates of deposit, categorized as Level 2, is estimated basedon discounted cash flows using currently offered market rates. The intangible value of long-term relationships withdepositors is not taken into account in the fair values disclosed.
Long-term Borrowings The fair value of TCF's long-term borrowings, categorized as Level 2, is estimated based onobservable market prices and discounted cash flows using interest rates for borrowings of similar remaining maturitiesand characteristics. The fair value of other long-term borrowings, categorized as Level 3, is based on unobservableinputs determined at the time of origination.
Financial Instruments with Off-Balance Sheet Risk The fair value of TCF's commitments to extend credit andstandby letters of credit, categorized as Level 2, is estimated using fees currently charged to enter into similaragreements. Substantially all commitments to extend credit and standby letters of credit have floating interest ratesand do not expose TCF to interest rate risk; therefore fair value is approximately equal to carrying value.
The balances of assets and liabilities measured at fair value on a recurring and non-recurring basis were as follows:
Fair Value Measurements at December 31, 2017(In thousands) Level 1 Level 2 Level 3 TotalRecurring Fair Value Measurements:
Securities available for sale:Mortgage-backed securities:
U.S. Government sponsored enterprises and federal agencies $ — $ 894,685 $ — $ 894,685Other — — 6 6
Obligations of states and political subdivisions — 814,327 — 814,327Loans held for sale — — 3,356 3,356Interest-only strips — — 21,386 21,386Interest rate contracts(1) — 1,797 — 1,797Interest rate lock commitments(1) — — 223 223Forward loan sales commitments — — 68 68Assets held in trust for deferred compensation plans 29,962 — — 29,962
Total assets $ 29,962 $ 1,710,809 $ 25,039 $ 1,765,810Forward foreign exchange contracts(1) $ — $ 6,363 $ — $ 6,363Interest rate contracts(1) — 1,688 — 1,688Other contracts(1) — — 615 615Forward loan sales commitments — — 5 5Liabilities held in trust for deferred compensation plans 29,962 — — 29,962
Total liabilities $ 29,962 $ 8,051 $ 620 $ 38,633Non-recurring Fair Value Measurements:
Loans $ — $ — $ 72,287 $ 72,287Other real estate owned:
Consumer — — 13,951 13,951Commercial — — 85 85
Repossessed and returned assets — 3,669 4,388 8,057Total non-recurring fair value measurements $ — $ 3,669 $ 90,711 $ 94,380
(1) As permitted under GAAP, TCF has elected to net derivative assets and derivative liabilities when a legally enforceable master netting agreement exists as wellas the related cash collateral received and paid. For purposes of this table, the derivative assets and derivative liabilities are presented gross of this nettingadjustment.
108
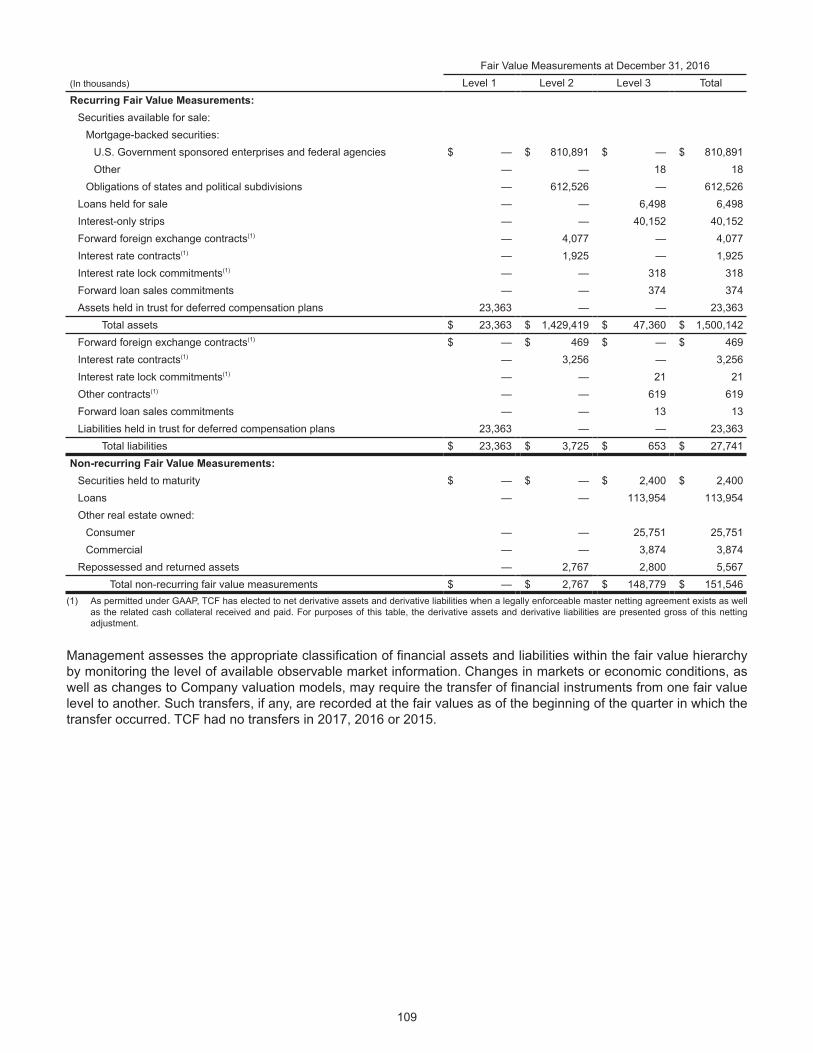
Fair Value Measurements at December 31, 2016(In thousands) Level 1 Level 2 Level 3 TotalRecurring Fair Value Measurements:
Securities available for sale:Mortgage-backed securities:
U.S. Government sponsored enterprises and federal agencies $ — $ 810,891 $ — $ 810,891Other — — 18 18
Obligations of states and political subdivisions — 612,526 — 612,526Loans held for sale — — 6,498 6,498Interest-only strips — — 40,152 40,152Forward foreign exchange contracts(1) — 4,077 — 4,077Interest rate contracts(1) — 1,925 — 1,925Interest rate lock commitments(1) — — 318 318Forward loan sales commitments — — 374 374Assets held in trust for deferred compensation plans 23,363 — — 23,363
Total assets $ 23,363 $ 1,429,419 $ 47,360 $ 1,500,142Forward foreign exchange contracts(1) $ — $ 469 $ — $ 469Interest rate contracts(1) — 3,256 — 3,256Interest rate lock commitments(1) — — 21 21Other contracts(1) — — 619 619Forward loan sales commitments — — 13 13Liabilities held in trust for deferred compensation plans 23,363 — — 23,363
Total liabilities $ 23,363 $ 3,725 $ 653 $ 27,741Non-recurring Fair Value Measurements:
Securities held to maturity $ — $ — $ 2,400 $ 2,400Loans — — 113,954 113,954Other real estate owned:
Consumer — — 25,751 25,751Commercial — — 3,874 3,874
Repossessed and returned assets — 2,767 2,800 5,567Total non-recurring fair value measurements $ — $ 2,767 $ 148,779 $ 151,546
(1) As permitted under GAAP, TCF has elected to net derivative assets and derivative liabilities when a legally enforceable master netting agreement exists as wellas the related cash collateral received and paid. For purposes of this table, the derivative assets and derivative liabilities are presented gross of this nettingadjustment.
Management assesses the appropriate classification of financial assets and liabilities within the fair value hierarchyby monitoring the level of available observable market information. Changes in markets or economic conditions, aswell as changes to Company valuation models, may require the transfer of financial instruments from one fair valuelevel to another. Such transfers, if any, are recorded at the fair values as of the beginning of the quarter in which thetransfer occurred. TCF had no transfers in 2017, 2016 or 2015.
109

The changes in Level 3 assets and liabilities measured at fair value on a recurring basis were as follows:
(In thousands)
SecuritiesAvailablefor Sale
LoansHeld for Sale
Interest-onlyStrips
InterestRate Lock
CommitmentsOther
Contracts
ForwardLoan Sales
CommitmentsAsset (liability) balance, December 31, 2014 $ 55 $ 3,308 $ 69,789 $ 285 $ (621) $ (23)
Total net gains (losses) included in:Net income — (68) 6,960 431 — 288
Sales — (289,751) — — — —Originations — 297,079 7,495 — — —Principal paydowns / settlements (21) — (39,912) — 316 —
Asset (liability) balance, December 31, 2015 34 10,568 44,332 716 (305) 265Total net gains (losses) included in:
Net income — (48) 2,980 (419) (629) 96Other comprehensive income (loss) — — 159 — — —
Sales — (343,949) — — — —Originations — 339,930 22,620 — — —Principal paydowns / settlements (16) (3) (29,939) — 315 —
Asset (liability) balance, December 31, 2016 18 6,498 40,152 297 (619) 361Total net gains (losses) included in:
Net income — 129 3,939 (74) (310) (298)Other comprehensive income (loss) — — (452) — — —
Sales — (215,381) — — — —Originations — 212,509 3,377 — — —Principal paydowns / settlements (12) (399) (25,630) — 314 —
Asset (liability) balance, December 31, 2017 $ 6 $ 3,356 $ 21,386 $ 223 $ (615) $ 63
Fair Value Option
TCF Bank originates first mortgage lien loans in its primary banking markets and sells the loans through a correspondentrelationship. TCF elected the fair value option for these loans. This election facilitates the offsetting of changes in fairvalues of the loans held for sale and the derivative financial instruments used to economically hedge them. Thedifference between the aggregate fair value and aggregate unpaid principal balance of these loans held for sale wasas follows:
At December 31,(In thousands) 2017 2016Fair value carrying amount $ 3,356 $ 6,498Aggregate unpaid principal amount 3,268 6,563
Fair value carrying amount less aggregate unpaid principal $ 88 $ (65)
Differences between the fair value carrying amount and the aggregate unpaid principal balance include changes infair value recorded at and subsequent to funding and gains and losses on the related loan commitment prior to funding.No loans recorded under the fair value option were delinquent or on non-accrual status at December 31, 2017 or 2016.The net gain from initial measurement of the correspondent lending loans held for sale, any subsequent changes infair value while the loans are outstanding and any actual adjustment to the gains realized upon sales of the loanstotaled $4.9 million, $7.6 million and $6.3 million for 2017, 2016 and 2015, respectively, and are included in gains onsales of consumer real estate loans, net. This amount excludes the impact from the interest rate lock commitmentsand forward loan sales commitments which are also included in gains on sales of consumer real estate loans, net.
110

Disclosures About Fair Value of Financial Instruments
Management discloses the estimated fair value of financial instruments, both assets and liabilities on and off thebalance sheet, for which it is practicable to estimate fair value. These fair value estimates were made atDecember 31, 2017 and 2016, based on relevant market information and information about the financial instruments.Fair value estimates are intended to represent the price at which an asset could be sold or a liability could be settled.However, given there is no active market or observable market transactions for many of the Company's financialinstruments, the estimates of fair values are subjective in nature, involve uncertainties and include matters of significantjudgment. Changes in assumptions could significantly affect the estimated values.
The carrying amounts and estimated fair values of the Company's financial instruments, excluding short-term financialassets and liabilities as their carrying amounts approximate fair value, and excluding financial instruments recordedat fair value on a recurring basis, were as follows. This information represents only a portion of TCF's balance sheetand not the estimated value of the Company as a whole. Non-financial instruments such as the intangible value ofTCF's branches and core deposits, leasing operations, goodwill, premises and equipment, and the future revenuesfrom TCF's customers are not reflected in this disclosure. Therefore, this information is of limited use in assessing thevalue of TCF.
CarryingAmount
Estimated Fair Value at December 31, 2017(In thousands) Level 1 Level 2 Level 3 TotalFinancial instrument assets:
Investments $ 82,644 $ — $ 82,644 $ — $ 82,644Securities held to maturity 161,576 — 162,826 2,800 165,626Loans held for sale 134,752 — — 139,458 139,458Loans:
Consumer real estate 4,819,696 — — 4,916,475 4,916,475Commercial real estate 2,751,285 — — 2,710,237 2,710,237Commercial business 809,908 — — 776,989 776,989Equipment finance 2,300,479 — — 2,260,692 2,260,692Inventory finance 2,739,754 — — 2,723,045 2,723,045Auto finance 3,199,639 — — 3,197,794 3,197,794Other 22,517 — — 21,129 21,129
Allowance for loan losses(1) (171,041) — — — —Securitization receivable(2) 19,179 — — 18,595 18,595
Total financial instrument assets $ 16,870,388 $ — $ 245,470 $ 16,767,214 $ 17,012,684Financial instrument liabilities:
Deposits $ 18,335,002 $ 13,352,731 $ 5,023,526 $ — $ 18,376,257Long-term borrowings 1,249,449 — 1,255,333 — 1,255,333
Total financial instrument liabilities $ 19,584,451 $ 13,352,731 $ 6,278,859 $ — $ 19,631,590Financial instruments with off-balance sheet risk:(3)
Commitments to extend credit $ 19,423 $ — $ 19,423 $ — $ 19,423Standby letters of credit (83) — (83) — (83)
Total financial instruments with off-balance sheet risk $ 19,340 $ — $ 19,340 $ — $ 19,340(1) Expected credit losses are included in the estimated fair values.(2) Carrying amounts are included in other assets.(3) Positive amounts represent assets, negative amounts represent liabilities.
111

CarryingAmount
Estimated Fair Value at December 31, 2016(In thousands) Level 1 Level 2 Level 3 TotalFinancial instrument assets:
Investments $ 74,714 $ — $ 74,714 $ — $ 74,714Securities held to maturity 181,314 — 181,146 2,800 183,946Loans held for sale 268,832 — — 282,786 282,786Loans:
Consumer real estate 5,084,352 — — 5,165,062 5,165,062Commercial real estate 2,634,191 — — 2,583,775 2,583,775Commercial business 652,287 — — 631,215 631,215Equipment finance 2,016,732 — — 1,983,237 1,983,237Inventory finance 2,470,175 — — 2,453,184 2,453,184Auto finance 2,647,741 — — 2,656,266 2,656,266Other 18,771 — — 17,780 17,780
Allowance for loan losses(1) (160,269) — — — —Securitization receivable(2) 18,835 — — 18,835 18,835
Total financial instrument assets $ 15,907,675 $ — $ 255,860 $ 15,794,940 $ 16,050,800Financial instrument liabilities:
Deposits $ 17,242,522 $ 13,150,099 $ 4,112,685 $ — $ 17,262,784Long-term borrowings 1,073,181 — 1,073,875 2,764 1,076,639
Total financial instrument liabilities $ 18,315,703 $ 13,150,099 $ 5,186,560 $ 2,764 $ 18,339,423Financial instruments with off-balance sheet risk:(3)
Commitments to extend credit $ 21,681 $ — $ 21,681 $ — $ 21,681Standby letters of credit (29) — (29) — (29)
Total financial instruments with off-balance sheet risk $ 21,652 $ — $ 21,652 $ — $ 21,652(1) Expected credit losses are included in the estimated fair values.(2) Carrying amounts are included in other assets.(3) Positive amounts represent assets, negative amounts represent liabilities.
112

Note 22. Earnings Per Common Share
The computations of basic and diluted earnings per common share were as follows:
Year Ended December 31,(Dollars in thousands, except per-share data) 2017 2016 2015Basic Earnings Per Common Share:
Net income attributable to TCF Financial Corporation $ 268,637 $ 212,124 $ 197,123Preferred stock dividends 19,904 19,388 19,388Impact of preferred stock redemption(1) 5,779 — —Net income available to common stockholders 242,954 192,736 177,735Earnings allocated to participating securities 42 49 45
Earnings allocated to common stock $ 242,912 $ 192,687 $ 177,690Weighted-average common shares outstanding for basic earnings per
common share 168,679,501 167,219,964 165,696,678Basic earnings per common share $ 1.44 $ 1.15 $ 1.07
Diluted Earnings Per Common Share:Earnings allocated to common stock $ 242,912 $ 192,687 $ 177,690Weighted-average common shares outstanding used in basic earnings per
common share calculation 168,679,501 167,219,964 165,696,678Net dilutive effect of:
Non-participating restricted stock 353,610 505,162 335,193Stock options 28,625 82,325 210,049Warrants 27,508 — —Weighted-average common shares outstanding for diluted earnings per
common share 169,089,244 167,807,451 166,241,920Diluted earnings per common share $ 1.44 $ 1.15 $ 1.07
(1) Represents the amount of deferred stock issuance costs originally recorded in preferred stock upon the issuance of the Series A Preferred Stock that werereclassified to retained earnings during 2017 as the Company redeemed all outstanding Series A Preferred Stock.
For 2017, there were 0.8 million of outstanding shares related to non-participating restricted stock that were not includedin the computation of diluted earnings per common share because they were anti-dilutive. For 2016 and 2015, therewere 4.7 million and 4.5 million, respectively, of outstanding shares related to warrants and non-participating restrictedstock that were not included in the computation of diluted earnings per common share because they were anti-dilutive.
113

Note 23. Other Non-interest Expense
Other non-interest expense was as follows:
Year Ended December 31,(In thousands) 2017 2016 2015Goodwill impairment $ 73,041 $ — $ —Professional fees 33,070 19,335 19,615Advertising and marketing 26,927 22,264 22,782Severance 22,299 5,280 4,942Loan and lease processing 22,149 26,193 24,641Outside processing 20,473 15,313 14,332Card processing and issuance costs 18,325 15,856 16,591FDIC insurance 16,049 15,912 20,262Other 113,123 111,267 106,090
Total other non-interest expense $ 345,456 $ 231,420 $ 229,255
114
Note 24. Business Segments The Company's reportable segments are Consumer Banking, Wholesale Banking and Enterprise Services. ConsumerBanking is comprised of all of the Company's consumer-facing businesses and includes retail banking, consumer realestate and auto finance. Wholesale Banking is comprised of commercial lending, leasing and equipment finance, andinventory finance. Enterprise Services is comprised of (i) corporate treasury, which includes TCF's investment andborrowing portfolios and management of capital, debt and market risks; (ii) corporate functions, such as informationtechnology, risk and credit management, bank operations, finance, investor relations, corporate development, legaland human capital management, that provide services to the operating segments; (iii) the Holding Company and (iv)eliminations. TCF evaluates performance and allocates resources based on each reportable segment's net income or loss. Thereportable business segments follow GAAP as described in Note 1. Basis of Presentation, except for the accountingfor intercompany interest income and interest expense, which are eliminated in consolidation, and presenting netinterest income on a fully tax-equivalent basis. TCF generally accounts for inter-segment sales and transfers at cost.

Certain information for each of TCF's reportable segments, including reconciliations of TCF's consolidated totals, wasas follows:
(In thousands)ConsumerBanking
WholesaleBanking
EnterpriseServices Consolidated
At or For the Year Ended December 31, 2017:Net interest income (expense) $ 574,610 $ 359,281 $ (8,653) $ 925,238Provision for credit losses 48,227 20,216 — 68,443Non-interest income 289,995 157,985 319 448,299Non-interest expense 743,729 277,431 38,774 1,059,934Income tax expense (benefit) 49,513 (68,883) (14,254) (33,624)
Income (loss) after income tax expense (benefit) 23,136 288,502 (32,854) 278,784Income attributable to non-controlling interest — 10,147 — 10,147Preferred stock dividends — — 19,904 19,904Impact of preferred stock redemption — — 5,779 5,779
Net income (loss) available to common stockholders $ 23,136 $ 278,355 $ (58,537) $ 242,954Total assets $ 8,894,798 $ 11,571,587 $ 2,535,774 $ 23,002,159Revenues from external customers:
Interest income $ 456,325 $ 520,801 $ 41,931 $ 1,019,057Non-interest income 289,995 157,985 319 448,299
Total $ 746,320 $ 678,786 $ 42,250 $ 1,467,356At or For the Year Ended December 31, 2016:
Net interest income (expense) $ 559,851 $ 343,653 $ (55,398) $ 848,106Provision for credit losses 50,819 15,055 — 65,874Non-interest income 336,991 128,881 28 465,900Non-interest expense 652,460 247,115 10,312 909,887Income tax expense (benefit) 69,523 70,805 (23,800) 116,528
Income (loss) after income tax expense (benefit) 124,040 139,559 (41,882) 221,717Income attributable to non-controlling interest — 9,593 — 9,593Preferred stock dividends — — 19,388 19,388
Net income (loss) available to common stockholders $ 124,040 $ 129,966 $ (61,270) $ 192,736Total assets $ 8,885,412 $ 10,391,305 $ 2,164,609 $ 21,441,326Revenues from external customers:
Interest income $ 443,959 $ 452,882 $ 33,889 $ 930,730Non-interest income 336,991 128,881 28 465,900
Total $ 780,950 $ 581,763 $ 33,917 $ 1,396,630At or For the Year Ended December 31, 2015:
Net interest income (expense) $ 536,714 $ 339,934 $ (56,260) $ 820,388Provision for credit losses 44,328 8,616 — 52,944Non-interest income 320,399 119,779 1,820 441,998Non-interest expense 645,939 244,921 3,887 894,747Income tax expense (benefit) 61,384 70,127 (22,639) 108,872
Income (loss) after income tax expense (benefit) 105,462 136,049 (35,688) 205,823Income attributable to non-controlling interest — 8,700 — 8,700Preferred stock dividends — — 19,388 19,388
Net income (loss) available to common stockholders $ 105,462 $ 127,349 $ (55,076) $ 177,735Total assets $ 9,169,093 $ 9,569,760 $ 1,950,756 $ 20,689,609Revenues from external customers:
Interest income $ 434,674 $ 431,764 $ 25,492 $ 891,930Non-interest income 320,399 119,779 1,820 441,998
Total $ 755,073 $ 551,543 $ 27,312 $ 1,333,928
115

Note 25. Parent Company Financial Information
TCF Financial's (parent company only) condensed statements of financial condition, income and cash flows were asfollows:
Condensed Statements of Financial Condition
At December 31,(In thousands) 2017 2016Assets:
Cash and due from banks $ 80,471 $ 69,711Investment in bank subsidiary 2,563,552 2,338,885Accounts receivable from bank subsidiary 22,015 19,967Other assets 5,739 9,476
Total assets $ 2,671,777 $ 2,438,039Liabilities and Equity:
Accrued expenses and other liabilities $ 9,020 $ 10,556Total liabilities 9,020 10,556
Equity 2,662,757 2,427,483Total liabilities and equity $ 2,671,777 $ 2,438,039
Condensed Statements of Income
Year Ended December 31,(In thousands) 2017 2016 2015Interest income $ 183 $ 155 $ 306Non-interest income:
Dividends from TCF Bank 65,000 63,000 25,000Affiliate service fees 15,660 17,657 17,281Other 13 5 1,733
Total non-interest income 80,673 80,662 44,014Non-interest expense:
Compensation and employee benefits 17,801 17,578 13,905Occupancy and equipment 275 370 342Other 1,785 3,545 5,344
Total non-interest expense 19,861 21,493 19,591Income before income tax benefit and equity in undistributed earnings of bank
subsidiary 60,995 59,324 24,729Income tax benefit 1,575 1,010 435
Income before equity in undistributed earnings of bank subsidiary 62,570 60,334 25,164Equity in undistributed earnings of bank subsidiary 206,067 151,790 171,959
Net income 268,637 212,124 197,123Preferred stock dividends 19,904 19,388 19,388Impact of preferred stock redemption 5,779 — —Net income available to common stockholders $ 242,954 $ 192,736 $ 177,735
116

Condensed Statements of Cash Flows
Year Ended December 31,(In thousands) 2017 2016 2015Cash flows from operating activities:
Net income $ 268,637 $ 212,124 $ 197,123Adjustments to reconcile net income to net cash provided by (used in)
operating activities:Equity in undistributed earnings of bank subsidiary (206,067) (151,790) (171,959) Depreciation and amortization 9,110 4,734 2,147 Provision (benefit) for deferred income taxes 4,690 (592) 1,595Gains on sales of assets, net — — (50)Net change in accounts receivable from bank subsidiary, other assets andaccrued expenses and other liabilities (5,902) 589 (2,434)Net cash provided by (used in) operating activities 70,468 65,065 26,422
Cash flows from investing activities:Purchases of premises and equipment (23) (69) (65)Proceeds from sales of premises and equipment — 22 92
Net cash provided by (used in) investing activities (23) (47) 27Cash flows from financing activities:
Net proceeds from public offering of Series C preferred stock 169,302 — —Redemption of Series A preferred stock (172,500) — —Repurchases of common stock (9,163) — —Common shares sold to TCF employee benefit plans 23,254 5,838 24,835Dividends paid on preferred stock (19,904) (19,388) (19,388)Dividends paid on common stock (50,617) (50,182) (37,302)Stock compensation tax (expense) benefit — (377) 558Exercise of stock options (57) (701) 2,570
Net cash provided by (used in) financing activities (59,685) (64,810) (28,727)Net change in cash and due from banks 10,760 208 (2,278)Cash and due from banks at beginning of period 69,711 69,503 71,781Cash and due from banks at end of period $ 80,471 $ 69,711 $ 69,503
TCF Financial's operations are conducted through its banking subsidiary, TCF Bank. As a result, TCF Financial's cashflow and ability to make dividend payments to its preferred and common stockholders depend on the earnings of TCFBank. The ability of TCF Bank to pay dividends or make other payments to TCF Financial is limited by its obligationto maintain sufficient capital and by other regulatory restrictions on dividends. At December 31, 2017, TCF Bank couldpay a total of approximately $529.8 million in dividends to TCF Financial without prior regulatory approval.
117

Note 26. Litigation Contingencies
From time to time TCF is a party to legal proceedings arising out of its lending, leasing and deposit operations, includingforeclosure proceedings and other collection actions as part of its lending and leasing collections activities. TCF mayalso be subject to regulatory examinations and enforcement actions brought by federal regulators, including theSecurities and Exchange Commission, the Federal Reserve, the OCC and the Consumer Financial Protection Bureau("CFPB") and TCF's federal regulators may impose sanctions on TCF for failures related to regulatory compliance.From time to time borrowers and other customers, and employees and former employees have also brought actionsagainst TCF, in some cases claiming substantial damages. TCF and other financial services companies are subjectto the risk of class action litigation. Litigation is often unpredictable and the actual results of litigation cannot bedetermined and therefore the ultimate resolution of a matter and the possible range of loss associated with certainpotential outcomes cannot be established. Except as discussed below, based on our current understanding of TCF'spending legal proceedings, management does not believe that judgments or settlements arising from pending orthreatened legal matters, individually or in the aggregate, would have a material adverse effect on the consolidatedfinancial position, operating results or cash flows of TCF.
On January 19, 2017, the CFPB filed a civil lawsuit against TCF Bank in the United States District Court for the Districtof Minnesota (the "Court"), captioned Consumer Financial Protection Bureau v. TCF National Bank, alleging violationsof the Consumer Financial Protection Act ("CFPA") and Regulation E, §1005.17 in connection with TCF Bank's practicesadministering checking account overdraft program "opt-in" requirements from 2010 to early 2014. In its complaint, theCFPB seeks, among other relief, redress for consumers, injunctive relief and unspecified penalties. On September 8,2017, the Court issued a ruling on the motion made by TCF Bank to dismiss the complaint of the CFPB. In its ruling,the Court granted TCF Bank's motion to dismiss the CFPB's Regulation E claims and also dismissed the CFPB's unfair,deceptive and abusive conduct claims under the CFPA for periods prior to July 21, 2011. The Court did not grant TCFBank's motion to dismiss CFPA claims for periods on or after July 21, 2011. TCF Bank rejects the claims made by theCFPB in its complaint and intends to continue to vigorously defend against the CFPB's allegations. TCF has not accruedany amounts with respect to this matter because (i) TCF does not believe a loss is probable, (ii) TCF believes theCompany has meritorious defenses to the claims made and (iii) the damages sought are unspecified and uncertain.Therefore, TCF is currently unable to reasonably estimate a range of potential loss, if any, relating to this matter. Thereis no assurance that the ultimate resolution of this lawsuit will not have a material adverse effect on the consolidatedfinancial position, operating results or cash flows of TCF.
118

Note 27. Accumulated Other Comprehensive Income (Loss) The components of other comprehensive income (loss) and the related tax effects were as follows:
(In thousands) Before Tax Tax Effect Net of TaxYear Ended December 31, 2017:Net unrealized gains (losses) on securities available for sale and interest-only
strips:Unrealized gains (losses) arising during the period $ 24,244 $ (8,857) $ 15,387Reclassification of net (gains) losses from accumulated other comprehensive
income (loss) 208 859 1,067Net unrealized gains (losses) 24,452 (7,998) 16,454
Net unrealized gains (losses) on net investment hedges (4,430) 1,684 (2,746)Foreign currency translation adjustment(1) 4,921 — 4,921Recognized postretirement prior service cost:
Reclassification of net (gains) losses from accumulated other comprehensiveincome (loss) (46) 17 (29)Total other comprehensive income (loss) $ 24,897 $ (6,297) $ 18,600
Year Ended December 31, 2016:Net unrealized gains (losses) on securities available for sale and interest-only
strips:Unrealized gains (losses) arising during the period $ (32,408) $ 12,323 $ (20,085)
Reclassification of net (gains) losses from accumulated other comprehensiveincome (loss) 1,913 (722) 1,191
Net unrealized gains (losses) (30,495) 11,601 (18,894)Net unrealized gains (losses) on net investment hedges (1,213) 457 (756)Foreign currency translation adjustment(1) 1,300 — 1,300Recognized postretirement prior service cost:
Reclassification of net (gains) losses from accumulated other comprehensiveincome (loss) (46) 17 (29)Total other comprehensive income (loss) $ (30,454) $ 12,075 $ (18,379)
Year Ended December 31, 2015:Net unrealized gains (losses) on securities available for sale and interest-only
strips:Unrealized gains (losses) arising during the period $ (2,523) $ 955 $ (1,568)
Reclassification of net (gains) losses from accumulated other comprehensiveincome (loss) 1,159 (407) 752
Net unrealized gains (losses) (1,364) 548 (816)Net unrealized gains (losses) on net investment hedges 7,613 (2,900) 4,713Foreign currency translation adjustment(1) (8,304) — (8,304)Recognized postretirement prior service cost:
Reclassification of net (gains) losses from accumulated other comprehensiveincome (loss) (46) 17 (29)Total other comprehensive income (loss) $ (2,101) $ (2,335) $ (4,436)
(1) Foreign investments are deemed to be permanent in nature and therefore TCF does not provide for taxes on foreign currency translation adjustments.
Reclassifications of net (gains) losses to net income for securities available for sale and interest-only strips wererecorded in the Consolidated Statements of Income in interest income for those securities that were previouslytransferred to held to maturity, in gains (losses) on securities, net for sales of securities and in other non-interestexpense for interest-only strips. These reclassifications to net income are included in the table above in the line calledReclassification of net (gains) losses from accumulated other comprehensive income (loss). During 2014, TCFtransferred $191.7 million of available for sale mortgage-backed securities to held to maturity. At December 31, 2017and 2016, the unrealized holding loss on the transferred securities retained in accumulated other comprehensiveincome (loss) totaled $12.1 million and $13.0 million, respectively. These amounts are amortized over the remaininglives of the transferred securities. See Note 18. Employee Benefit Plans, for further information regarding TCF'srecognized postretirement prior service cost. The tax effect of these reclassifications was recorded in income taxexpense in the Consolidated Statements of Income.
119

The components of accumulated other comprehensive income (loss) were as follows:
(In thousands)
SecuritiesAvailable for
Sale andInterest-only
Strips
Net Investment
Hedges
ForeignCurrency
TranslationAdjustment
RecognizedPostretirement
PriorService Cost Total
At or For the Year Ended December 31, 2017:Balance, beginning of period $ (28,601) $ 6,493 $ (11,764) $ 147 $ (33,725)
Other comprehensive income (loss) 15,387 (2,746) 4,921 — 17,562Amounts reclassified from accumulated other
comprehensive income (loss) 1,067 — — (29) 1,038Net other comprehensive income (loss) 16,454 (2,746) 4,921 (29) 18,600
Adoption impact of ASU 2018-02 (4,206) 789 — 25 (3,392)Balance, end of period $ (16,353) $ 4,536 $ (6,843) $ 143 $ (18,517)
At or For the Year Ended December 31, 2016:Balance, beginning of period $ (9,707) $ 7,249 $ (13,064) $ 176 $ (15,346)
Other comprehensive income (loss) (20,085) (756) 1,300 — (19,541)Amounts reclassified from accumulated other
comprehensive income (loss) 1,191 — — (29) 1,162Net other comprehensive income (loss) (18,894) (756) 1,300 (29) (18,379)
Balance, end of period $ (28,601) $ 6,493 $ (11,764) $ 147 $ (33,725)At or For the Year Ended December 31, 2015:
Balance, beginning of period $ (8,891) $ 2,536 $ (4,760) $ 205 $ (10,910)Other comprehensive income (loss) (1,568) 4,713 (8,304) — (5,159)Amounts reclassified from accumulated other
comprehensive income (loss) 752 — — (29) 723Net other comprehensive income (loss) (816) 4,713 (8,304) (29) (4,436)
Balance, end of period $ (9,707) $ 7,249 $ (13,064) $ 176 $ (15,346)
120

Other Financial Data
The selected quarterly financial data presented below should be read in conjunction with the Consolidated FinancialStatements and related notes.
SELECTED QUARTERLY FINANCIAL DATA (Unaudited)
Quarter Ended
(In thousands, except per-share data)Dec. 31,
2017Sep. 30,
2017Jun. 30,
2017Mar. 31,
2017Dec. 31,
2016Sep. 30,
2016Jun. 30,
2016Mar. 31,
2016Net interest income $ 241,860 $ 234,103 $ 227,161 $ 222,114 $ 211,446 $ 212,018 $ 212,984 $ 211,658Provision for credit losses 22,259 14,545 19,446 12,193 19,888 13,894 13,250 18,842
Net interest income after provision forcredit losses 219,601 219,558 207,715 209,921 191,558 198,124 199,734 192,816
Non-interest income 120,892 109,230 114,663 103,514 115,668 119,674 117,956 112,602Non-interest expense 347,806 235,035 233,087 244,006 225,359 228,878 227,316 228,334
Income (loss) before income taxexpense (benefit) (7,313) 93,753 89,291 69,429 81,867 88,920 90,374 77,084
Income tax expense (benefit) (110,965) 30,704 25,794 20,843 29,762 30,257 29,706 26,803Income after income tax expense
(benefit) 103,652 63,049 63,497 48,586 52,105 58,663 60,668 50,281Income attributable to non-controlling
interest 2,253 2,521 3,065 2,308 2,013 2,371 2,974 2,235Net income attributable to TCF Financial
Corporation 101,399 60,528 60,432 46,278 50,092 56,292 57,694 48,046Preferred stock dividends 3,746 6,464 4,847 4,847 4,847 4,847 4,847 4,847Impact of preferred stock redemption — 5,779 — — — — — —Net income available to common
stockholders $ 97,653 $ 48,285 $ 55,585 $ 41,431 $ 45,245 $ 51,445 $ 52,847 $ 43,199Earnings per common share:
Basic $ 0.58 $ 0.29 $ 0.33 $ 0.25 $ 0.27 $ 0.31 $ 0.32 $ 0.26Diluted $ 0.57 $ 0.29 $ 0.33 $ 0.25 $ 0.27 $ 0.31 $ 0.31 $ 0.26
121

Item 9. Changes in and Disagreements With Accountants on Accounting and Financial Disclosure
None.
122
Item 9A. Controls and Procedures Disclosure Controls and Procedures The Company carried out an evaluation, under the supervision and with theparticipation of the Company's management, including the Company's Chief Executive Officer (Principal ExecutiveOfficer), Chief Financial Officer (Principal Financial Officer) and Chief Accounting Officer (Principal Accounting Officer),of the effectiveness of the design and operation of the Company's disclosure controls and procedures pursuant toRules 13a-15 and 15d-15 of the Securities Exchange Act of 1934, as amended (the "Exchange Act"). Based on thatevaluation, management concluded that the Company's disclosure controls and procedures were effective as ofDecember 31, 2017.
Disclosure controls and procedures are designed to ensure that information required to be disclosed by TCF in reportsfiled or submitted under the Exchange Act is recorded, processed, summarized and reported within the time periodsspecified in the Securities and Exchange Commission's rules and forms. Disclosure controls are also designed withthe objective of ensuring that such information is accumulated and communicated to the Company's management,including the Chief Executive Officer (Principal Executive Officer), Chief Financial Officer (Principal Financial Officer)and Chief Accounting Officer (Principal Accounting Officer), as appropriate, to allow for timely decisions regardingrequired disclosure. TCF's disclosure controls also include internal controls that are designed to provide reasonableassurance that transactions are properly authorized, assets are safeguarded against unauthorized or improper useand that transactions are properly recorded and reported. Changes in Internal Control Over Financial Reporting There were no changes to TCF's internal control overfinancial reporting (as defined in Rule 13a-15(f) of the Exchange Act) during the quarter ended December 31, 2017,that materially affected, or are reasonably likely to materially affect, TCF's internal control over financial reporting.

Management's Report on Internal Control Over Financial Reporting
Management is responsible for establishing and maintaining adequate internal control over financial reporting for TCFFinancial Corporation (the "Company"). Internal control over financial reporting is a process designed to providereasonable assurance regarding the reliability of financial reporting and the preparation of financial statements forexternal purposes in accordance with generally accepted accounting principles.
Internal control over financial reporting includes those policies and procedures that pertain to the maintenance ofrecords that in reasonable detail accurately and fairly reflect the transactions and dispositions of the assets of theCompany; provide reasonable assurance that transactions are recorded as necessary to permit preparation of financialstatements in accordance with generally accepted accounting principles and that receipts and expenditures of theCompany are only being made in accordance with authorizations of management and directors of the Company; andprovide reasonable assurance regarding prevention or timely detection of unauthorized acquisition, use, or dispositionof the Company's assets that could have a material effect on the financial statements.
Management, with the participation of the Chief Executive Officer (Principal Executive Officer) and Chief FinancialOfficer (Principal Financial Officer), completed an assessment of TCF's internal control over financial reporting as ofDecember 31, 2017. This assessment was based on criteria for evaluating internal control over financial reportingestablished in Internal Control - Integrated Framework issued by the Committee of Sponsoring Organizations of theTreadway Commission in May 2013. Based on this assessment, management concluded that TCF's internal controlover financial reporting was effective as of December 31, 2017.
KPMG LLP, the Company's independent registered public accounting firm that audited the consolidated financialstatements included in this annual report, has issued an unqualified attestation report on the effectiveness of theCompany's internal control over financial reporting as of December 31, 2017.
Any control system, no matter how well conceived and operated, can provide only reasonable, not absolute, assurancethat the objectives of the control system are met. The design of a control system inherently has limitations and thebenefits of controls must be weighed against their costs. Additionally, controls can be circumvented by the individualacts of some persons, by collusion of two or more people or by management override of the controls. Therefore, noassessment of a cost-effective system of internal controls can provide absolute assurance that all control issues andinstances of fraud, if any, will be detected.
123

Opinion on Internal Control Over Financial Reporting
We have audited TCF Financial Corporation's and subsidiaries’ (the "Company") internal control over financial reportingas of December 31, 2017, based on criteria established in Internal Control - Integrated Framework (2013) issued bythe Committee of Sponsoring Organizations of the Treadway Commission. In our opinion, the Company maintained,in all material respects, effective internal control over financial reporting as of December 31, 2017, based on criteriaestablished in Internal Control - Integrated Framework (2013) issued by the Committee of Sponsoring Organizationsof the Treadway Commission.
We also have audited, in accordance with the standards of the Public Company Accounting Oversight Board (UnitedStates) ("PCAOB"), the consolidated statements of financial condition of the Company as of December 31, 2017 and2016, the related consolidated statements of income, comprehensive income, equity, and cash flows for each of theyears in the three-year period ended December 31, 2017, and the related notes (collectively, the "consolidated financialstatements"), and our report dated February 23, 2018 expressed an unqualified opinion on those consolidated financialstatements.
Basis for Opinion
The Company's management is responsible for maintaining effective internal control over financial reporting and forits assessment of the effectiveness of internal control over financial reporting, included in the accompanyingManagement's Report on Internal Control Over Financial Reporting. Our responsibility is to express an opinion on theCompany's internal control over financial reporting based on our audit. We are a public accounting firm registered withthe PCAOB and are required to be independent with respect to the Company in accordance with the U.S. federalsecurities laws and the applicable rules and regulations of the Securities and Exchange Commission and the PCAOB.
We conducted our audit in accordance with the standards of the PCAOB. Those standards require that we plan andperform the audit to obtain reasonable assurance about whether effective internal control over financial reporting wasmaintained in all material respects. Our audit of internal control over financial reporting included obtaining anunderstanding of internal control over financial reporting, assessing the risk that a material weakness exists, and testingand evaluating the design and operating effectiveness of internal control based on the assessed risk. Our audit alsoincluded performing such other procedures as we considered necessary in the circumstances. We believe that ouraudit provides a reasonable basis for our opinion.
Definition and Limitations of Internal Control Over Financial Reporting
A company's internal control over financial reporting is a process designed to provide reasonable assurance regardingthe reliability of financial reporting and the preparation of financial statements for external purposes in accordance withgenerally accepted accounting principles. A company's internal control over financial reporting includes those policiesand procedures that (1) pertain to the maintenance of records that, in reasonable detail, accurately and fairly reflectthe transactions and dispositions of the assets of the company; (2) provide reasonable assurance that transactionsare recorded as necessary to permit preparation of financial statements in accordance with generally acceptedaccounting principles, and that receipts and expenditures of the company are being made only in accordance withauthorizations of management and directors of the company; and (3) provide reasonable assurance regardingprevention or timely detection of unauthorized acquisition, use, or disposition of the company's assets that could havea material effect on the financial statements.
Because of its inherent limitations, internal control over financial reporting may not prevent or detect misstatements.Also, projections of any evaluation of effectiveness to future periods are subject to the risk that controls may becomeinadequate because of changes in conditions, or that the degree of compliance with the policies or procedures maydeteriorate.
Minneapolis, MinnesotaFebruary 23, 2018
124
Report of Independent Registered Public Accounting Firm
To the Stockholders and Board of Directors TCF Financial Corporation:

Item 9B. Other Information None.
125
Part III
Item 10. Directors, Executive Officers and Corporate Governance
Information regarding directors and executive officers of TCF is set forth in the following sections of TCF's definitiveProxy Statement for the 2018 Annual Meeting of Stockholders to be held on April 25, 2018 (the "2018 Proxy") and isincorporated herein by reference: Election of Directors; Background of Executive Officers Who Are Not Directors; andSection 16(a) Beneficial Ownership Reporting Compliance.
Information regarding procedures for nominations of directors is set forth in the following sections of TCF's 2018 Proxyand is incorporated herein by reference: Corporate Governance - Director Nominations; and Additional Information.
Audit Committee and Financial Expert
Information regarding TCF's Audit Committee, its members and financial experts is set forth in the following sectionsof TCF's 2018 Proxy and is incorporated herein by reference: Election of Directors - Background of the Nominees;Corporate Governance - Board Committees, Committee Memberships, and Meetings in 2017; and CorporateGovernance - Audit Committee.
TCF's Board of Directors is required to determine whether it has at least one Audit Committee Financial Expert andthat the expert is independent. An Audit Committee Financial Expert is a committee member who has an understandingof generally accepted accounting principles and financial statements and has the ability to assess the general applicationof these principles in connection with the accounting for estimates, accruals and reserves. Additionally, this individualshould have experience preparing, auditing, analyzing or evaluating financial statements that present the breadth andlevel of complexity of accounting issues that are generally comparable to the breadth and complexity of issues thatcan reasonably be expected to be raised by TCF's financial statements, or experience actively supervising one ormore persons engaged in such activities. The member should also have an understanding of internal control overfinancial reporting as well as an understanding of audit committee functions.
The Board has determined that all members of the Audit Committee, including Karen L. Grandstrand, George G.Johnson, Richard H. King, Vance K. Opperman, Roger J. Sit, Julie H. Sullivan and Richard A. Zona, are independentand that Directors Johnson, Opperman, Sit, Sullivan and Zona each meet the requirements of audit committee financialexperts. Additional information regarding Ms. Grandstrand, Mr. Johnson, Mr. King, Mr. Opperman, Mr. Sit, Dr. Sullivanand Mr. Zona and the other directors is set forth in the section Election of Directors - Background of the Nominees inTCF's 2018 Proxy and is incorporated herein by reference.
Code of Ethics for Senior Financial Management
TCF has adopted a code of ethics applicable to the Principal Executive Officer ("PEO"), Principal Financial Officer("PFO") and Principal Accounting Officer ("PAO") (the "Senior Financial Management Code of Ethics") as well as acode of ethics generally applicable to all employees (including the PEO, PFO and PAO) and directors of TCF (the"Code of Ethics"). The Code of Ethics and Senior Financial Management Code of Ethics are both available for reviewat TCF's website at www.tcfbank.com by clicking on "About TCF" and then "Learn More" under the heading "CorporateGovernance" and then either "Code of Ethics Policy" or "Code of Ethics for Senior Financial Management". Any changesto either code will be posted on the website and any waivers granted to or violations by the PEO, PFO, PAO or anydirector of TCF will also be posted on TCF's website. To date, there have been no waivers granted to or violations bythe PEO, PFO, PAO or any director of TCF.

Item 11. Executive Compensation
Information regarding compensation of directors and executive officers of TCF is set forth in the following sections ofTCF's 2018 Proxy and is incorporated herein by reference: Corporate Governance - Compensation, Nominating, andCorporate Governance Committee - Compensation Committee Interlocks and Insider Participation; DirectorCompensation; Compensation Discussion and Analysis; Compensation Committee Report; and ExecutiveCompensation.
126
Item 12. Security Ownership of Certain Beneficial Owners and Management and Related Stockholder Matters
Information regarding ownership of TCF's common stock by TCF's directors, executive officers and certain otherstockholders and shares authorized under equity compensation plans is set forth in the following sections of TCF's2018 Proxy and is incorporated herein by reference: Equity Compensation Plans Approved by Stockholders; andOwnership of TCF Stock.
Item 13. Certain Relationships and Related Transactions, and Director Independence
Information regarding director independence and certain relationships and transactions between TCF and certainrelated persons is set forth in the section entitled Corporate Governance - Director Independence and Related PersonTransactions of TCF's 2018 Proxy and is incorporated herein by reference.
Item 14. Principal Accountant Fees and Services
Information regarding principal accountant fees and services and the Audit Committee's pre-approval policies andprocedures relating to audit and non-audit services provided by the Company's independent registered publicaccounting firm is set forth in the section entitled Independent Registered Public Accountants in TCF's 2018 Proxyand is incorporated herein by reference.
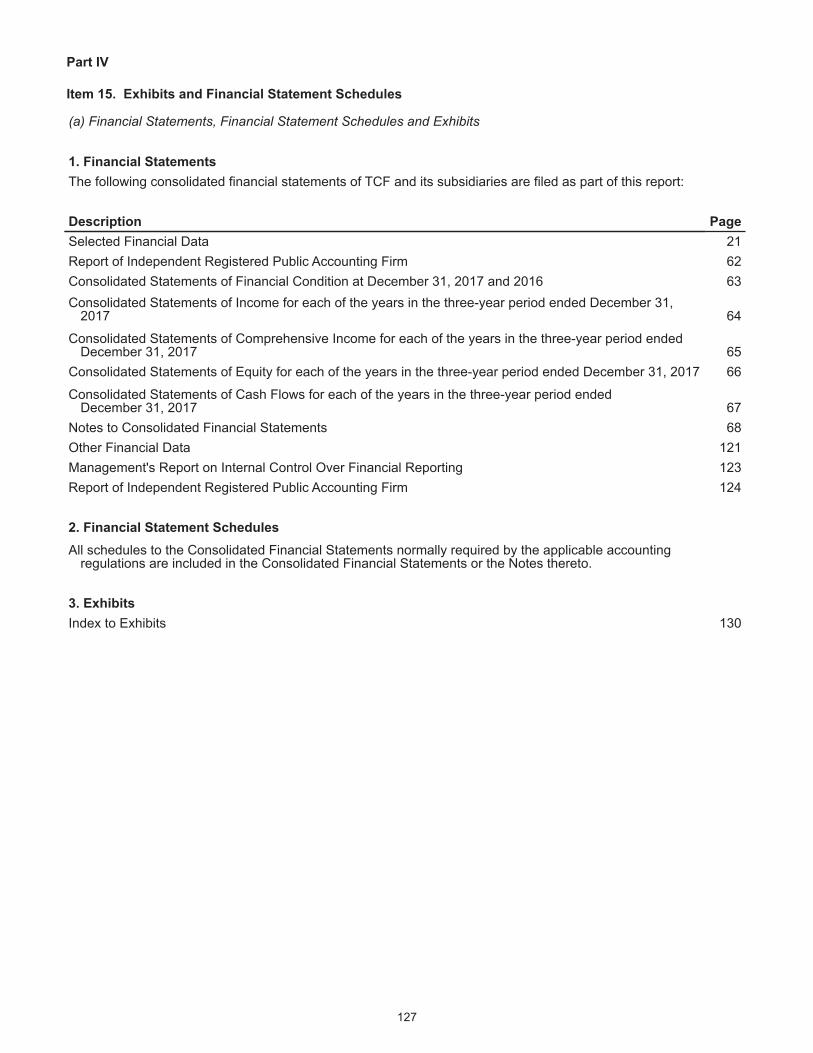
Part IV
127
Item 15. Exhibits and Financial Statement Schedules
(a) Financial Statements, Financial Statement Schedules and Exhibits
1. Financial StatementsThe following consolidated financial statements of TCF and its subsidiaries are filed as part of this report:
Description PageSelected Financial Data 21Report of Independent Registered Public Accounting Firm 62Consolidated Statements of Financial Condition at December 31, 2017 and 2016 63Consolidated Statements of Income for each of the years in the three-year period ended December 31,
2017 64
Consolidated Statements of Comprehensive Income for each of the years in the three-year period endedDecember 31, 2017 65
Consolidated Statements of Equity for each of the years in the three-year period ended December 31, 2017 66
Consolidated Statements of Cash Flows for each of the years in the three-year period endedDecember 31, 2017 67
Notes to Consolidated Financial Statements 68Other Financial Data 121Management's Report on Internal Control Over Financial Reporting 123Report of Independent Registered Public Accounting Firm 124
2. Financial Statement SchedulesAll schedules to the Consolidated Financial Statements normally required by the applicable accounting
regulations are included in the Consolidated Financial Statements or the Notes thereto.
3. ExhibitsIndex to Exhibits 130

SIGNATURES
Pursuant to the requirements of Section 13 or Section 15(d) of the Securities Exchange Act of 1934, the registrant hasduly caused this report to be signed on its behalf by the undersigned thereunto duly authorized.
TCF FINANCIAL CORPORATION
/s/ Craig R. DahlCraig R. Dahl,
Chairman, President and Chief Executive Officer(Principal Executive Officer)
Dated: February 23, 2018
128

Pursuant to the requirements of the Securities Exchange Act of 1934, this report has been signed below by thefollowing persons on behalf of the registrant and in the capacities and on the dates indicated.
Name Title Date
/s/ Craig R. Dahl February 23, 2018Craig R. Dahl Chairman, President and Chief Executive Officer (Principal
Executive Officer)
/s/ Brian W. Maass February 23, 2018Brian W. Maass Executive Vice President and Chief Financial Officer
(Principal Financial Officer)
/s/ Susan D. Bode February 23, 2018Susan D. Bode Senior Vice President and Chief Accounting Officer (Principal
Accounting Officer)
/s/ Peter Bell February 23, 2018Peter Bell Director
/s/ William F. Bieber February 23, 2018William F. Bieber Director
/s/ Theodore J. Bigos February 23, 2018Theodore J. Bigos Director
/s/ Karen L. Grandstand February 23, 2018Karen L. Grandstrand Director
/s/ Thomas F. Jasper February 23, 2018Thomas F. Jasper Director, Vice Chairman and Chief Operating Officer
/s/ George G. Johnson February 23, 2018George G. Johnson Director
/s/ Richard H. King February 23, 2018Richard H. King Director
/s/ Vance K. Opperman February 23, 2018Vance K. Opperman Lead Director
/s/ James M. Ramstad February 23, 2018James M. Ramstad Director
/s/ Roger J. Sit February 23, 2018Roger J. Sit Director
/s/ Julie H. Sullivan February 23, 2018Julie H. Sullivan Director
/s/ Barry N. Winslow February 23, 2018Barry N. Winslow Director
/s/ Richard A. Zona February 23, 2018Richard A. Zona Director
129

INDEX TO EXHIBITS
ExhibitNumber Description
3(a) Amended and Restated Certificate of Incorporation of TCF Financial Corporation [incorporated by reference to Exhibit 3.1 to TCFFinancial Corporation’s Current Report on Form 8-K filed November 6, 2017 (No. 171178634)]
3(b) Amended and Restated Bylaws of TCF Financial Corporation [incorporated by reference to Exhibit 3.1 to TCF FinancialCorporation’s Current Report on Form 8-K filed July 26, 2016 (No. 161784576)]
4(a) Warrant Agreement dated December 15, 2009 by and among TCF Financial Corporation, Computershare, Inc. and ComputershareTrust Company, N.A. [incorporated by reference to Exhibit 4.1 to TCF Financial Corporation’s Form 8-A filed December 16, 2009(No. 091243195)]
4(b) Specimen Warrant to Purchase Shares of Common Stock of TCF Financial Corporation [incorporated by reference to Exhibit 4.2to TCF Financial Corporation’s Form 8-A filed December 16, 2009 (No. 091243195)]
4(c) Specimen Common Stock Certificate of TCF Financial Corporation [incorporated by reference to Exhibit 4.3 to TCF FinancialCorporation’s Registration Statement on Form S-3ASR filed May 29, 2012 (No. 12874917)]
4(d) Form of Certificate for 6.45% Series B Non-Cumulative Perpetual Preferred Stock [incorporated by reference to Exhibit 4.1 to TCFFinancial Corporation’s Current Report on Form 8-K filed December 18, 2012 (No. 121271334)]
4(e) Form of Stock Certificate representing the Series C Non-Cumulative Perpetual Preferred Stock [incorporated by reference toExhibit 4.1 to TCF Financial Corporation’s Current Report on Form 8-K filed September 14, 2017 (No. 171084863)]
4(f) Deposit Agreement dated September 14, 2017 by and among TCF Financial Corporation, Computershare Trust Company, N.A.and Computershare Inc. and the holders from time to time of the Depositary Receipts described therein [incorporated by referenceto Exhibit 4.2 to TCF Financial Corporation’s Current Report on Form 8-K filed September 14, 2017 (No. 171084863)]
4(g) Form of Depositary Receipt [included as part of Exhibit 4.2 to TCF Financial Corporation’s Current Report on Form 8-K filedSeptember 14, 2017 (No. 171084863)]
4(h) Copies of instruments with respect to long-term debt will be furnished to the Securities and Exchange Commission upon request.10(a)* TCF Financial 2015 Omnibus Incentive Plan, as amended effective December 29, 2016 [incorporated by reference to Exhibit 10
(a) to TCF Financial Corporation's Annual Report on Form 10-K for the fiscal year ended December 31, 2016 (No. 17624401)]10(a)-1 Form of Restricted Stock Award Agreement under the TCF Financial 2015 Omnibus Incentive Plan [incorporated by reference to
Exhibit 10(a)-1 to TCF Financial Corporation's Annual Report on Form 10-K for the fiscal year ended December 31, 2016 (No.17624401)]
10(a)-2* Form of Performance-Based Restricted Stock Award Agreement under the TCF Financial 2015 Omnibus Incentive Plan[incorporated by reference to Exhibit 10.3 to TCF Financial Corporation’s Current Report on Form 8-K filed April 28, 2015 (No.15798862)]
10(a)-3* Form of Restricted Stock Unit Agreement under the TCF Financial 2015 Omnibus Incentive Plan [incorporated by reference toExhibit 10.4 to TCF Financial Corporation’s Current Report on Form 8-K filed April 28, 2015 (No. 15798862)]
10(a)-4* Form of Performance-Based Restricted Stock Unit Agreement under the TCF Financial 2015 Omnibus Incentive Plan [incorporatedby reference to Exhibit 10.5 to TCF Financial Corporation’s Current Report on Form 8-K filed April 28, 2015 (No. 15798862)]
10(a)-5* 2015 Performance-Based Restricted Stock Unit Agreement under the TCF Financial 2015 Omnibus Incentive Plan entered intoby certain executives [incorporated by reference to Exhibit 10.6 to TCF Financial Corporation’s Current Report on Form 8-K filedApril 28, 2015 (No. 15798862)]
10(a)-6* Form of 2016 Management Incentive Plan - Executive, as executed by certain executives [incorporated by reference to Exhibit 10(a)-6 to TCF Financial Corporation's Annual Report on Form 10-K for the fiscal year ended December 31, 2015 (No. 161465956)]
10(a)-7* Form of Amended and Restated 2017 Management Incentive Plan - Executive Award as executed by certain executives of TCF[incorporated by reference to Exhibit 10.1 to TCF Financial Corporation’s Current Report on Form 8-K filed July 21, 2017 (No.17976977)]
10(a)-8*# Form of TCF Financial Corporation Management Incentive Plan - Executive Award10(b)* TCF Financial Incentive Stock Program, as amended and restated April 24, 2013 [incorporated by reference to Exhibit 10.1 to TCF
Financial Corporation’s Current Report on Form 8-K filed April 30, 2013 (No. 13797581)]10(b)-1* Form of Nonqualified Stock Option Award Agreement as executed by certain executives [incorporated by reference to Exhibit 10
(b)-10 to TCF Financial Corporation’s Current Report on Form 8-K filed January 25, 2008 (No. 08551203)]10(b)-2* Form of Deferred Restricted Stock Award Agreement as executed by certain executives [incorporated by reference to Exhibit 10
(b)-16 to TCF Financial Corporation’s Current Report on Form 8-K filed February 18, 2011 (No. 11625311)]10(b)-3* Form of Performance-Based Restricted Stock Award Agreement as executed by certain executives [incorporated by reference to
Exhibit 10.3 to TCF Financial Corporation’s Current Report on Form 8-K filed January 20, 2012 (No. 12537269)]10(c) TCF Performance-Based Compensation Policy for Covered Executive Officers, as approved effective January 1, 2013 [incorporated
by reference to Exhibit 10.2 to TCF Financial Corporation’s Current Report on Form 8-K filed April 30, 2013 (No. 13797581)]10(d)* Employment Agreement with Craig R. Dahl effective as of January 1, 2016 [incorporated by reference to Exhibit 10.1 to TCF
Financial Corporation’s Current Report on Form 8-K filed October 30, 2015 (No. 151184773)]10(e)* TCF Financial Corporation Supplemental Employee Retirement Plan - ESPP Plan as amended and restated through January 24,
2005 [incorporated by reference to Exhibit 10(j) to TCF Financial Corporation’s Current Report on Form 8-K filed January 27, 2005(No. 05552640)]
10(e)-1* TCF 401K Supplemental Plan, as amended effective October 18, 2016 [incorporated by reference to Exhibit 10(e)-1 to TCFFinancial Corporation's Annual Report on Form 10-K for the fiscal year ended December 31, 2016 (No. 17624401)]
10(f)*# Trust Agreement for TCF 401K Plan Supplemental Plan effective November 1, 2017, by and between TCF Financial Corporationand Reliance Trust Company
10(g)* TCF Financial Corporation Executive Deferred Compensation Plan as amended and restated through January 24, 2005[incorporated by reference to Exhibit 10(c) to TCF Financial Corporation’s Current Report on Form 8-K filed January 27, 2005 (No.05552640)]
130
*Executive Contract# Filed herein
10(h)* Restated Trust Agreement as executed with First National Bank in Sioux Falls as trustee effective as of October 1, 2000 [incorporatedby reference to Exhibit 10(d) to TCF Financial Corporation’s Annual Report on Form 10-K for the fiscal year ended December 31,2000 (No. 1584625)]; as amended by amendment adopted April 30, 2001 [incorporated by reference to Exhibit 10(d) to TCFFinancial Corporation’s Quarterly Report on Form 10-Q for the quarter ended June 30, 2001 (No. 1706058)]; and as amended byamendments adopted May 3, 2002 [incorporated by reference to Exhibit 10(d) to TCF Financial Corporation’s Quarterly Reporton Form 10-Q for the quarter ended June 30, 2002 (No. 02730799)]; and as amended by Third Amendment of Trust Agreementfor TCF Executive Deferred Compensation Plan effective as of June 30, 2003 [incorporated by reference to Exhibit 10(d) to TCFFinancial Corporation’s Quarterly Report on Form 10-Q for the quarter ended June 30, 2003 (No. 03830138)]
10(i)* TCF Financial Corporation Senior Officer Deferred Compensation Plan as amended and restated through January 24, 2005[incorporated by reference to Exhibit 10(l) to TCF Financial Corporation’s Current Report on Form 8-K filed January 27, 2005 (No.05552640)]
10(j)* Trust Agreement for TCF Financial Senior Officer Deferred Compensation Plan as executed with First National Bank in Sioux Fallsas trustee effective as of October 1, 2000 [incorporated by reference to Exhibit 10(m) to TCF Financial Corporation’s Annual Reporton Form 10-K for the fiscal year ended December 31, 2000 (No. 1584625)]; as amended by amendment adopted April 30, 2001[incorporated by reference to Exhibit 10(m) to TCF Financial Corporation’s Quarterly Report on Form 10-Q for the quarter endedJune 30, 2001 (No. 1706058)]; and as amended by Second Amendment of Trust Agreement for TCF Financial Senior OfficersDeferred Compensation Plan effective as of June 30, 2003 [incorporated by reference to Exhibit 10(m) to TCF Financial Corporation’sQuarterly Report on Form 10-Q for the quarter ended June 30, 2003 (No. 03830138)]
10(k)* Directors Stock Grant Program, as amended and restated April 25, 2012 [incorporated by reference to Exhibit 10(j) to TCF FinancialCorporation’s Quarterly Report on Form 10-Q for the quarter ended June 30, 2012 (No. 12986667)]
10(k)-1* Form of Director’s Restricted Stock Agreement dated January 24, 2012 [incorporated by reference to Exhibit 10(j)-1 to TCF FinancialCorporation’s Quarterly Report on Form 10-Q for the quarter ended June 30, 2012 (No. 12986667)]
10(k)-2* Form of Deferred Director’s Restricted Stock Agreement dated January 24, 2012 [incorporated by reference to Exhibit 10(j)-2 toTCF Financial Corporation’s Quarterly Report on Form 10-Q for the quarter ended June 30, 2012 (No. 12986667)]
10(l)* TCF Financial Corporation TCF Directors Deferred Compensation Plan as amended and restated through January 24, 2005[incorporated by reference to Exhibit 10(r) to TCF Financial Corporation’s Current Report on Form 8-K filed January 27, 2005 (No.05552640)]
10(l)-1* TCF Financial Corporation TCF Directors 2005 Deferred Compensation Plan, adopted effective as of January 6, 2005, as amendedand restated through January 24, 2005 [incorporated by reference to Exhibit 10(r)-1 to TCF Financial Corporation’s Current Reporton Form 8-K filed January 27, 2005 (No. 05552640)]; and as amended by Amendment of Directors 2005 Deferred CompensationPlan effective July 19, 2010 [incorporated by reference to Exhibit 10(r)-1 to TCF Financial Corporation’s Quarterly Report on Form10-Q for the quarter ended September 30, 2010 (No. 101147679)]
10(m)* Trust Agreement for TCF Directors Deferred Compensation Plan [incorporated by reference to Exhibit 10(d) to TCF FinancialCorporation’s Annual Report on Form 10-K for the fiscal year ended December 31, 2000 (No. 1584625)]; as amended by amendmentadopted April 30, 2001 [incorporated by reference to Exhibit 10(s) to TCF Financial Corporation’s Quarterly Report on Form 10-Qfor the quarter ended June 30, 2001 (No. 1706058)]; as amended by amendment adopted October 10, 2001 [incorporated byreference to Exhibit 10(s) to TCF Financial Corporation’s Annual Report on Form 10-K for the year ended December 31, 2001 (No.02568362)]; and as amended by amendments adopted May 3, 2002 [incorporated by reference to Exhibit 10(s) to TCF FinancialCorporation’s Quarterly Report on Form 10-Q for the quarter ended June 30, 2002 (No. 02730799)]; and as amended by ThirdAmendment of TCF Directors Deferred Compensation Trust effective as of June 30, 2003 [incorporated by reference to Exhibit 10(s) to TCF Financial Corporation’s Quarterly Report on Form 10-Q for the quarter ended June 30, 2003 (No. 03830138)]
10(n)*# Summary of Non-Employee Director Compensation10(o)* TCF Employees Deferred Stock Compensation Plan, effective January 1, 2011 [incorporated by reference to Exhibit 10(u) to TCF
Financial Corporation’s Current Report on Form 8-K filed February 18, 2011 (No. 11625311)]10(p)* Form of Rabbi Trust Agreement for the TCF Employees Deferred Stock Compensation Plan [incorporated by reference to Exhibit
10(v) to TCF Financial Corporation’s Current Report on Form 8-K filed February 18, 2011 (No. 11625311)]12(a)# Consolidated Ratios of Earnings to Fixed Charges for years ended December 31, 2017, 2016, 2015, 2014 and 201312(b)# Consolidated Ratios of Earnings to Fixed Charges and Preferred Stock Dividends for years ended December 31, 2017, 2016,
2015, 2014 and 2013 21# Subsidiaries of TCF Financial Corporation (as of December 31, 2017)23# Consent of KPMG LLP dated February 23, 2018
31.1# Certification of the Chief Executive Officer Pursuant to Section 302 of the Sarbanes-Oxley Act of 200231.2# Certification of the Chief Financial Officer Pursuant to Section 302 of the Sarbanes-Oxley Act of 200232.1# Certification of the Chief Executive Officer Pursuant to Section 906 of the Sarbanes-Oxley Act of 200232.2# Certification of the Chief Financial Officer Pursuant to Section 906 of the Sarbanes-Oxley Act of 2002101# Financial statements from the Annual Report on Form 10-K of the Company for the year ended December 31, 2017, formatted in
XBRL: (i) the Consolidated Statements of Financial Condition, (ii) the Consolidated Statements of Income, (iii) the ConsolidatedStatements of Comprehensive Income, (iv) the Consolidated Statements of Equity, (v) the Consolidated Statements of Cash Flowsand (vi) the Notes to Consolidated Financial Statements
131

3
CORPORATE INFORMATION

STOCKHOLDER INFORMATION
TRADING OF COMMON STOCKThe common stock of TCF Financial Corporation is listed
on the New York Stock Exchange under the symbol TCF.
At December 31, 2017, TCF had approximately 171.7 million
shares of common stock outstanding.
ANNUAL MEETINGThe Annual Meeting of Stockholders of TCF will be held
on Wednesday, April 25, 2018, 4:00 p.m. (local time) at the
Marriott Minneapolis West, 9960 Wayzata Boulevard,
St. Louis Park, Minnesota.
TRANSFER AGENT AND REGISTRARComputershare Trust Company, N.A.
PO Box 505000
Louisville, KY 40233
(800) 443-6852
www.computershare.com/investor
DIRECT STOCK PURCHASE AND DIVIDEND REINVESTMENT PLANTCF Financial Corporation offers the Computershare
Investment Plan, a direct stock purchase and dividend
reinvestment plan for TCF Financial Corporation common
stock. This stockholder-paid program provides a low-
cost alternative to traditional retail brokerage methods of
purchasing, holding and selling TCF common stock. The
Plan is sponsored and administered by our Transfer Agent,
Computershare, Inc. Information is available from:
Computershare Trust Company, N.A.
PO Box 505000
Louisville, KY 40233
(800) 443-6852
www.computershare.com/investor
INVESTOR/ANALYST CONTACTJason Korstange
Senior Vice President
Investor Relations
(952) 745-2755
Justin Horstman
Vice President
Investor Relations
(952) 745-2756
MEDIA CONTACTMark Goldman
Senior Vice President
Corporate Communications
(952) 475-7050
AVAILABLE INFORMATIONPlease visit our website at http://ir.tcfbank.com for free
access to TCF investor information, news releases, investor
presentations, quarterly conference calls, annual reports,
and SEC filings. Information may also be obtained, free of
charge, from:
TCF Financial Corporation
Investor Relations
200 Lake Street East
Mail Code: EX0-02-C
Wayzata, MN 55391-1693
(952) 745-2760
A-2

Dividends*Stock Price*
$1.50
1.25
1.00
0.75
0.50
0.25
$35
30
25
20
15
10
5
STOCK PRICE PERFORMANCE (Dollars)
*Stock split adjusted For more historical information on TCF’s stock price and dividend, visit http://ir.tcfbank.com.
Stock Split 11/30/95
Stock Split 11/28/97
Stock Split 9/3/04
12-876-86 12-89 12-91 12-9512-93 12-97 12-99 12-0312-01 12-05 12-07 12-1112-09 12-13 12-15 12-17
A-3
CREDIT RATINGS
Last Review Standard & Poor’s October 2017
Outlook Stable
TCF Financial Corporation:
Long-term Counterparty BBB-
Short-term Counterparty A-3
TCF National Bank:
Long-term Counterparty BBB
Short-term Counterparty A-2
Preferred Stock BB-
Subordinated Debt BBB-
Last ReviewMoody’s January 2018
Outlook Stable
TCF National Bank:
Long-term Issuer Baa2
Long-term Deposits A2
Short-term Deposits Prime-1
Preferred Stock Ba1
Subordinated Debt Baa2

TCF FINANCIAL CORPORATION
Chairman, President and Chief Executive Officer Craig R. Dahl
Vice Chairman and Chief Operating Officer Thomas F. Jasper
Executive Vice President, Chief Financial Officer Brian W. Maass
Executive Vice President, Consumer BankingMichael S. Jones
Executive Vice President, Wholesale BankingWilliam S. Henak
Executive Vice President, Chief Information OfficerThomas J. Butterfield
Chief Risk Officer and Chief Credit OfficerJames M. Costa
Chief Audit Executive OfficerAndrew J. Jackson
Senior Vice President, Chief Accounting OfficerSusan D. Bode
Senior Vice President, General Counsel and SecretaryJoseph T. Green
Senior Vice President, Director of Investor RelationsJason E. Korstange
Senior Vice President, TreasurerJason S. Sasanfar
Senior Vice President, Enterprise Operations OfficerTamara K. Schuette
TCF NATIONAL BANK
Consumer Banking
Executive Vice President, Retail BankingKevin Miller
Executive Vice President, Consumer LendingRichard J. Chenitz
Executive Vice President, OperationsMichael Shea
Executive Vice President, Risk and ComplianceClaire M. Graupmann
Chief Operating Officer, Auto FinanceAndrew B. Sturm
Wholesale Banking
TCF Equipment Finance President and Chief Executive OfficerGary A. Peterson
Winthrop Resources CorporationPresident and Chief Executive OfficerPaul L. Gendler
TCF Inventory Finance, Inc.President and Chief Executive OfficerRosario A. Perrelli
Commercial BankingPresident R. Patricia Kelly
President, TCF Capital FundingJoseph P. Gaffigan
A-4
EXECUTIVE MANAGEMENT TEAM

BOARD OF DIRECTORS
George G. Johnson 2,3,6,7
CPA/Chairman, George Johnson & Company and George Johnson Consultants
Director since 1998
Julie H. Sullivan 2,6,7,8
President, University of St. Thomas
Director since 2016
Richard H. King 2,6,7,8
Executive Vice President, Operations, Thomson Reuters
Director since 2014
Barry N. Winslow 3,6,7
Retired Vice Chairman, TCF Financial Corporation
Director since 2008
William F. Bieber 1,3,4,5,6,7
Chairman, ATEK Companies, Inc.
Director since 1997
Karen L. Grandstrand 1,2,4,5,6,7
Shareholder, Fredrikson & Byron, P.A.
Director since 2010
Richard A. Zona 2,5,6,7
Retired Vice Chairman, U.S. Bancorp
Director since 2011
Theodore J. Bigos 1,4,6,7
Owner, Bigos Management, Inc.
Director since 2008
Thomas F. JasperVice Chairman and Chief Operating Officer
Director since 2012
James M. Ramstad 3,6,7
Former U.S. Congressman
Director since 2011
1 Advisory Committee – TCF 401K Plan2 Audit Committee3 BSA and Compliance Committee4 Compensation, Nominating and Corporate Governance Committee5 Executive Committee6 Finance Committee7 Risk Committee8 Technology Committee
Peter Bell 3,4,6,7
Former Chair, Metropolitan Council
Director since 2009
Roger J. Sit 1,2,4,6,7
Chief Executive Officer, Global Chief Investment Officer and Director, Sit Investment Associates
Director since 2015
A-5
Craig R. Dahl 5,8
Chairman and Chief Executive Officer
Director since 2012
Vance K. Opperman 1,2,4,5,6,7,8
President and Chief Executive Officer, Key Investment, Inc.
Director since 2009

A-6
OFFICES (as of December 31, 2017)
EXECUTIVE OFFICES
TCF Financial Corporation200 Lake Street EastWayzata, MN 55391-1693(952) 745-2760
TCF NATIONAL BANK
Headquarters2508 South Louise AvenueSioux Falls, SD 57106
MINNESOTA/SOUTH DAKOTA
Regional OfficePlymouth Corporate Center 1405 Xenium Lane Plymouth, MN 55441
Traditional BranchesMinneapolis/St. Paul Area (43)Greater Minnesota (2)South Dakota (2)
Supermarket BranchesMinneapolis/St. Paul Area (38)Greater Minnesota (2)
Campus BranchesMinneapolis/St. Paul Area (2)Greater Minnesota (1)
ILLINOIS/WISCONSIN
Regional Office800 Burr Ridge Parkway Burr Ridge, IL 60527
Traditional BranchesChicagoland (37)Milwaukee Area (11)Kenosha/Racine Area (6)
Supermarket BranchesChicagoland (86)
MICHIGAN
Regional Office17440 College Parkway Livonia, MI 48152
Traditional BranchesMetro Detroit Area (49)
Supermarket BranchesMetro Detroit Area ( 1 )
COLORADO/ARIZONA
Regional Office8085 South Chester StreetSuite 201 Centennial, CO 80112
Traditional BranchesMetro Denver Area (24)Colorado Springs (8)Metro Phoenix Area (7)
Supermarket BranchesMetro Denver Area ( 1 )
WINTHROP RESOURCES CORPORATION
Headquarters11100 Wayzata BoulevardSuite 800Minnetonka, MN 55305(952) 936-0226
TCF INVENTORY FINANCE, INC.
Headquarters1475 East Woodfield RoadSuite 1100Schaumburg, IL 60173(877) 872-8234
GATEWAY ONE LENDING & FINANCE, LLC
Headquarters160 North Riverview Drive Suite 100Anaheim, CA 92808(888) 810-8860

OUR VALUES
Lead with integrity
Be nimble
Build relationships
Be prudent
Create opportunities
Win as a passionate team
OUR MISSION
TCF strives to consistently deliver superior performance by
providing the essential means to enhance the rhythm of
customers’ lives and help them achieve their goals. Unified
by the passion to act as an ally of our customers, we lend
prudently in diverse, niche segments and fund these assets
through core deposits, both generated through a great
customer experience within our communities.
OUR VISION
We will be a sound,
well-capitalized, principled
bank that gathers core
deposits and lends under
the fundamental concept of
diversification that enables
us to consistently achieve
superior returns for our
employees, customers
and shareholders.
A-7

TCF Financial Corporation200 Lake Street EastWayzata, MN 55391-1693
tcfbank.com
TCFIR9368 E Printed on recycled paper. Please recycle.