oti udigisoperations used in a gis - ida.liu.se746a27/literature/using idrisi.pdf · oti...
TRANSCRIPT
O ti U d i GISOperations Used in a GIS
EnvironmentFileDisplayDisplayAnalysisReformatData EntryData Entry
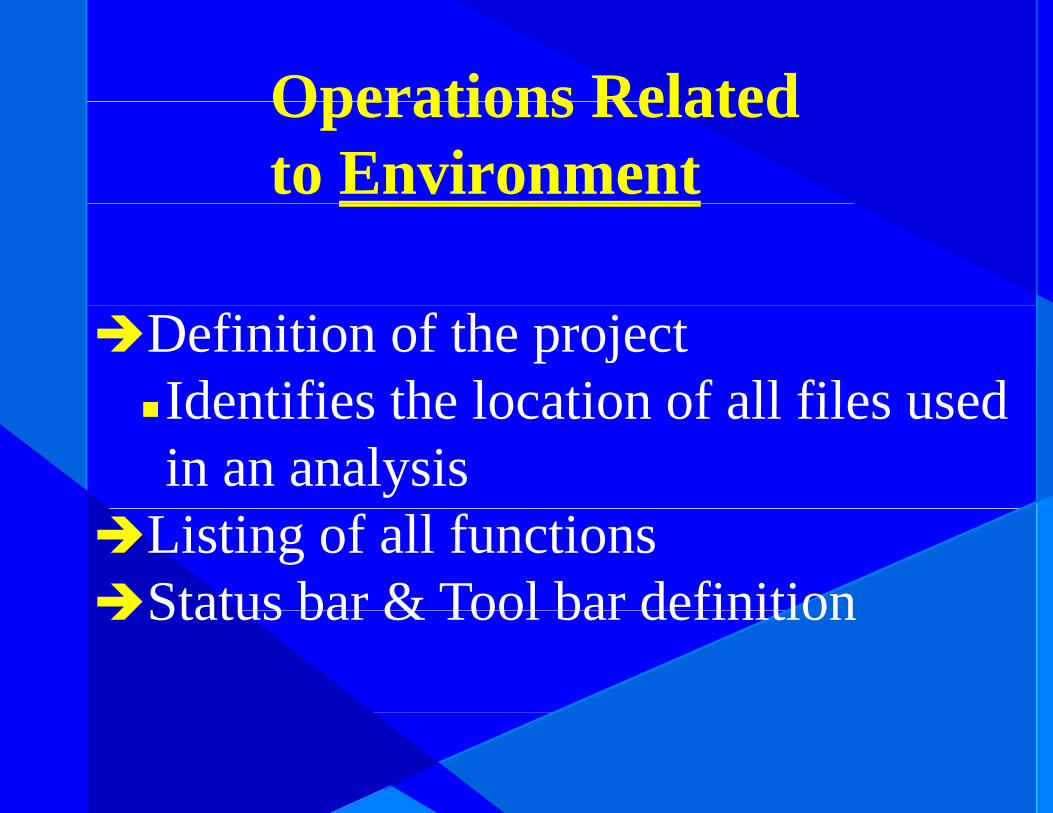
Operations RelatedOperations Related to Environment
Definition of the projectIdentifies the location of all files usedIdentifies the location of all files used in an analysis
Listing of all functionsStatus bar & Tool bar definitionStatus bar & Tool bar definition

O ti l t d t FilOperations related to File
File descriptionFile descriptionFile maintenanced ldelete, copy, rename, etc
Import/Exportp p

Operations related to DisplayOperations related to Display
LauncherOrthographicOrthographic IlluminateHiHistogramStretchSymbol WorkshopPalette WorkshopPalette Workshop
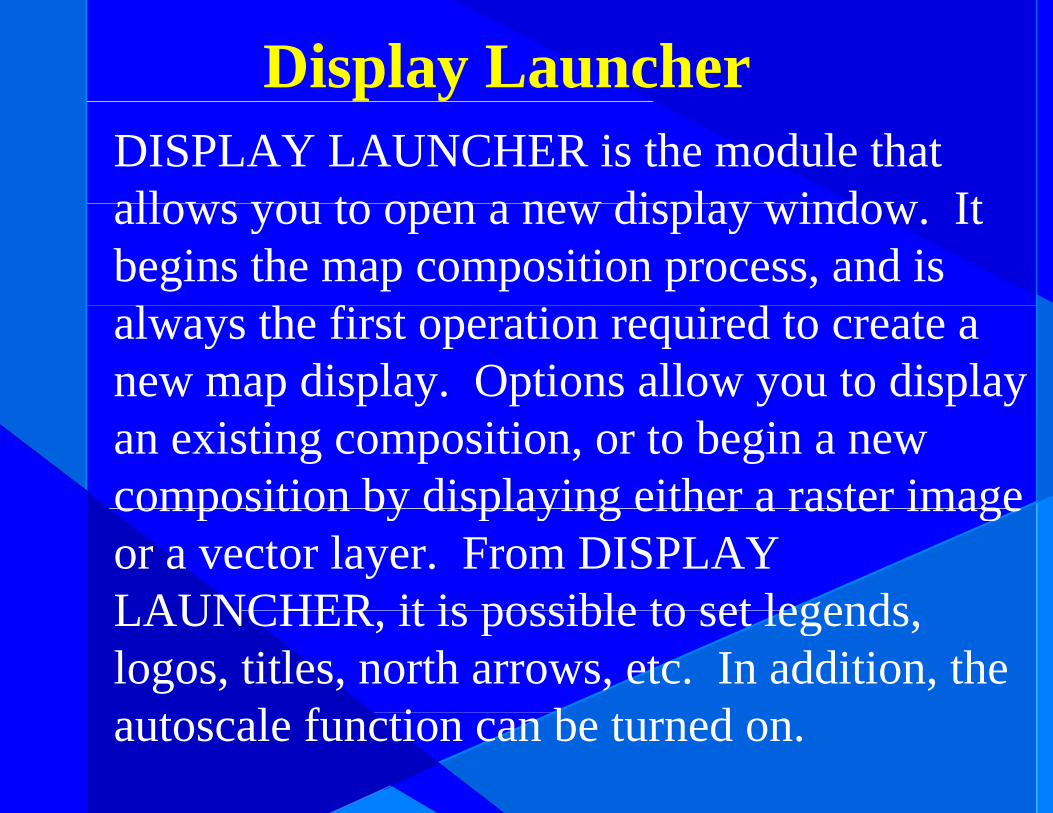
Display LauncherDISPLAY LAUNCHER is the module that allows you to open a new display window Itallows you to open a new display window. It begins the map composition process, and is always the first operation required to create a new map display. Options allow you to display an existing composition, or to begin a new composition by displaying either a raster imagecomposition by displaying either a raster image or a vector layer. From DISPLAY LAUNCHER it is possible to set legendsLAUNCHER, it is possible to set legends, logos, titles, north arrows, etc. In addition, the
l f i b dautoscale function can be turned on.

O th hi Ill t tiOrthographic Illustration
ORTHO displays and prints 3-D ortho-graphic perspective displays of IDRISIgraphic perspective displays of IDRISI for Windows images. Normally the images displayed are surfaces, although any IDRISI for Windows image may be viewedIDRISI for Windows image may be viewed with this routine. A second image may also b d d f h f di l dbe draped on top of the surface displayed.

O th hi Ill t tiOrthographic Illustration

Orthographic Perspective Displayg p p p y

Orthographic Perspective with DrapeOrthographic Perspective with Drape

IlluminateILLUMINATE separates the color scheme of
Illuminatep
an image into its blue/green/red components, transforms these into hue/lightness/saturationtransforms these into hue/lightness/saturation bands, and reassembles them, replacing the lightness image with either a hillshade model or any other panchromatic image. This y p gtypically produces quite visually dramatic results in which a single image containsresults in which a single image contains two different pieces of information.

An Illuminated DEMAn Illuminated DEM

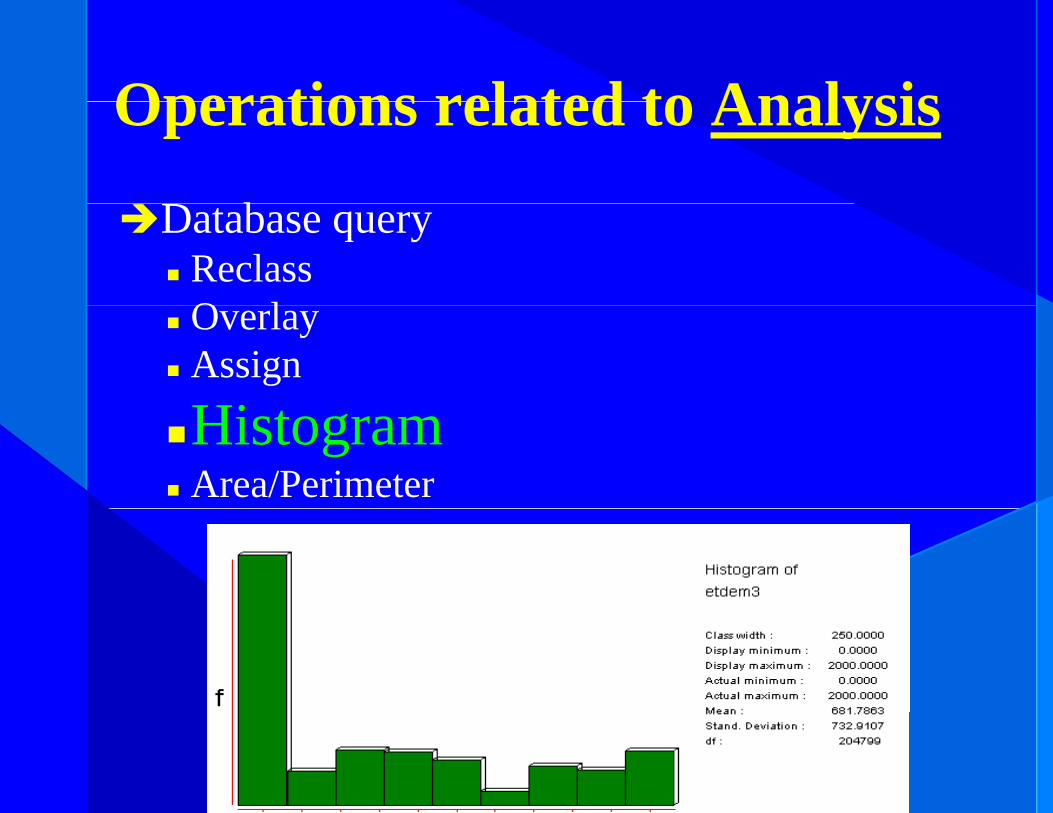
Histogram
HISTO d f hi t f
Histogram
HISTO produces a frequency histogram of cell values in an IDRISI for Windows image. HISTO creates histograms by dividing the data range into classes of a user specifieddata range into classes of a user specified width. The frequency within each class is
b l d B h hi d itabulated. Both graphic and numeric output options are available. HISTO also outputs p pbasic statistics about the file.
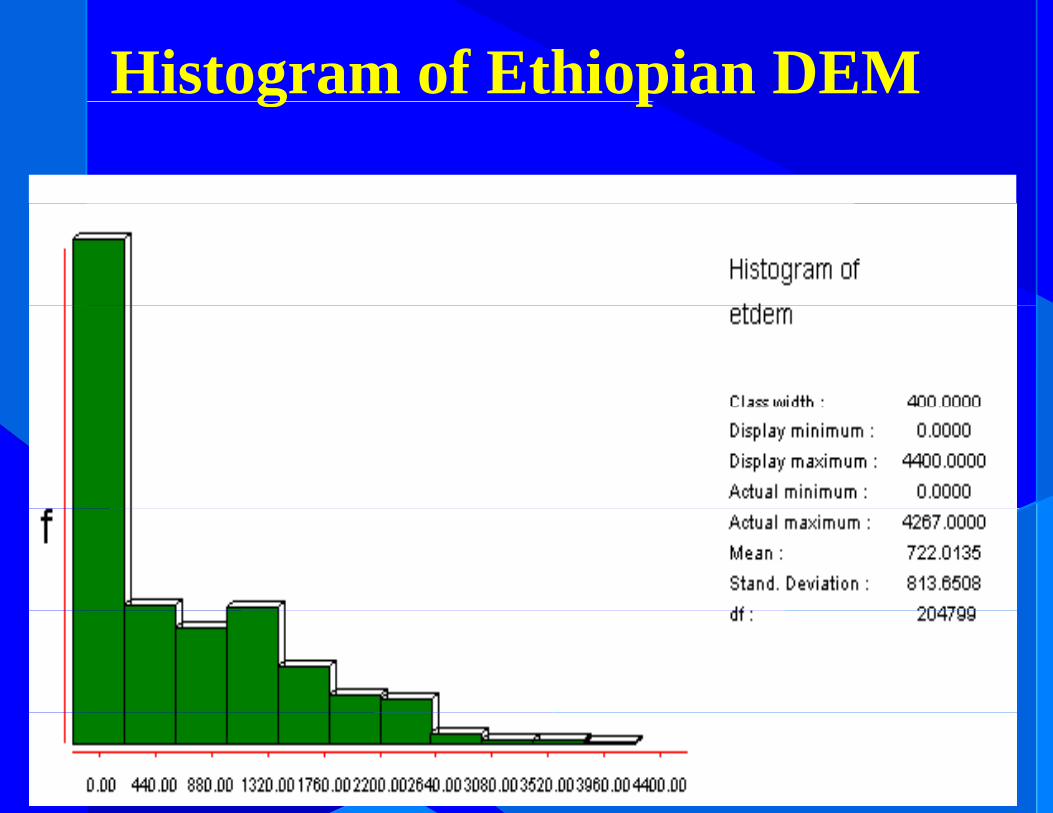
Histogram of Ethiopian DEMg p
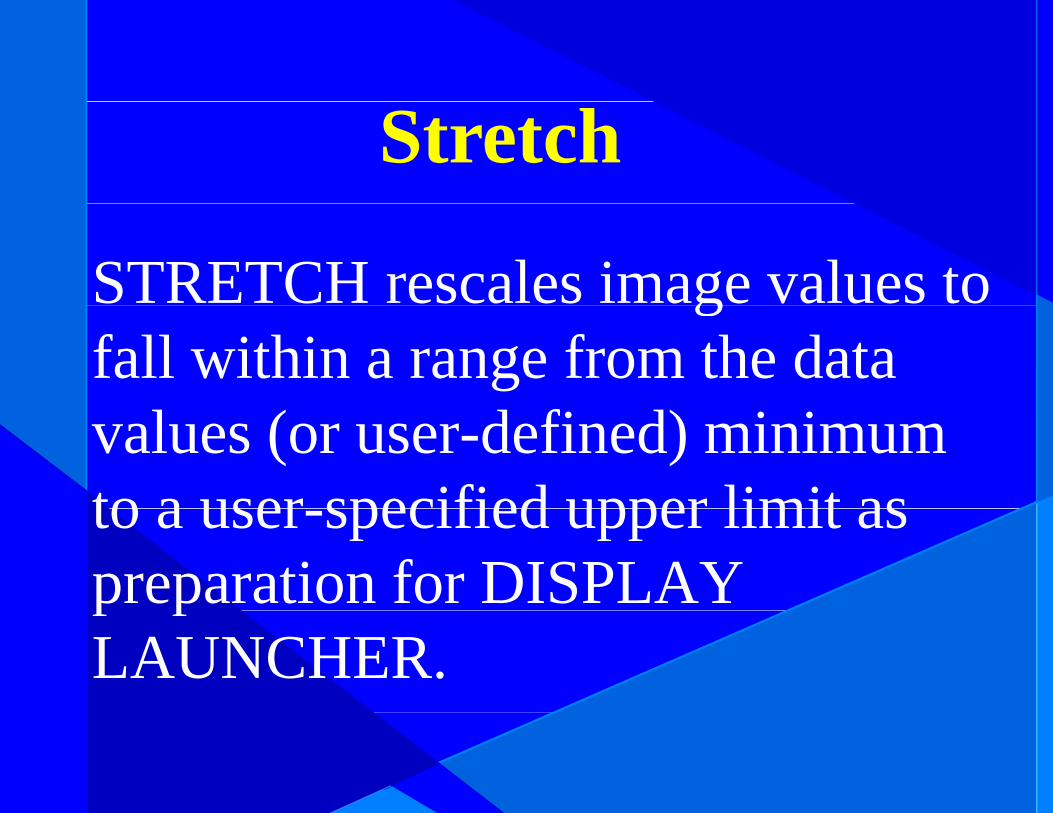
Stretch
STRETCH rescales image values to gfall within a range from the data values (or user-defined) minimum to a user specified upper limit asto a user-specified upper limit as preparation for DISPLAY p pLAUNCHER.
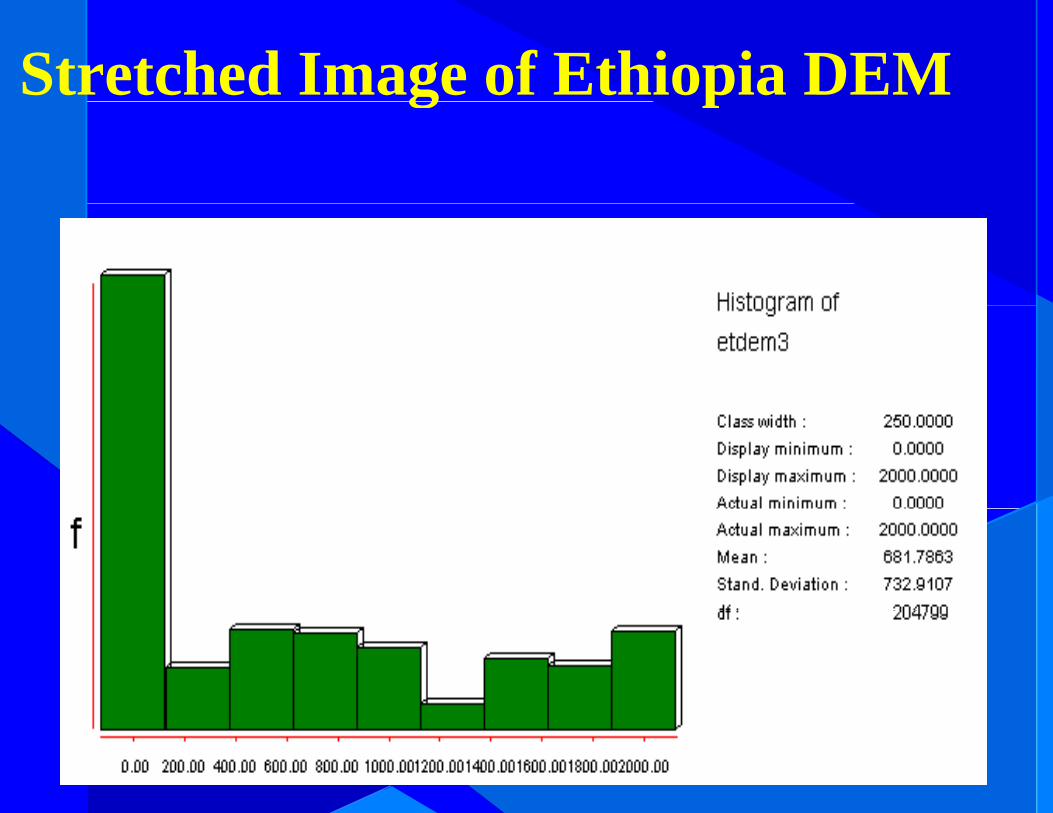
Stretched Image of Ethiopia DEMg p
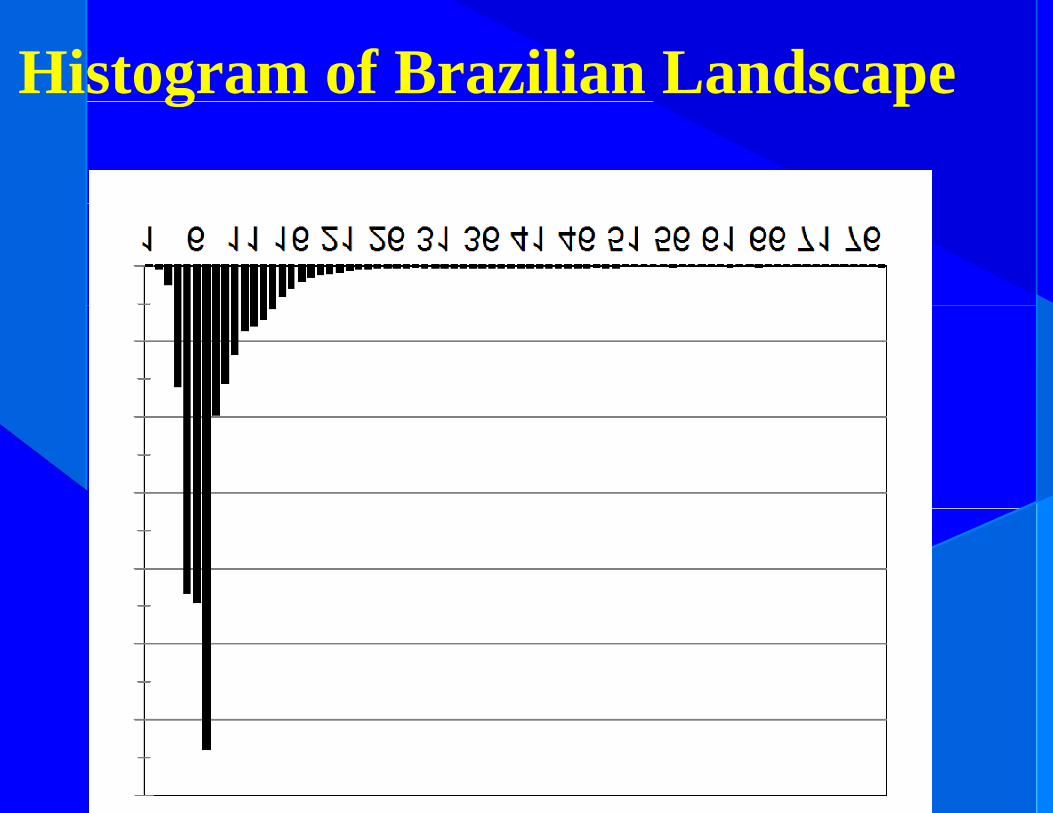
Histogram of Brazilian Landscapeg p

Image of a Brazilian Landscape in G 256 P l ttGrey256 Palette

Histogram of Stretched B ili L dBrazilian Landscape

Stretched Image of a Brazilian L d i G 256 P l ttLandscape in Grey256 Palette


St t h f th Ethi i DEMStretch of the Ethiopian DEM
Figure on the left has an elevation range of (0-4300)Figure on the right has an elevation range of (0 2000)Figure on the right has an elevation range of (0-2000)
Symbol WorkshopSYMBOL WORKSHOP is used for the creation and
Sy bo Wo s op
editing of IDRISI symbol files. There are four different types of symbol files supported by IDRISI: point, line, yp y pp y p , ,polygon and text symbol files. Internally these are identified by files with ".sm0", ".sm1", ".sm2", and y , , ,".smt" extensions respectively.
S b l b d id ifSymbols can be made to identify:PointsLinesPolygonsPolygonsText
Palette WorkshopPALETTE WORKSHOP facilitates the creation and
p
modification of color palettes. In IDRISI for Windows, palette files are considered to be a special , p pform of symbol file, in that they define how each of a set of 256 possible colors is defined. Each color pcarries an index that can range from 0 to 255, and is defined in terms of the mixture of red, green, and bluedefined in terms of the mixture of red, green, and blue (RGB) additive primaries that is required to produce that color In IDRISI for Windows palette files arethat color. In IDRISI for Windows, palette files are stored in a binary format using an ".smp" file extensionextension.

Operations related to Displayp p y
LauncherOrthographicOrthographic IlluminateHi tHistogramStretchSymbol WorkshopPalette WorkshopPalette Workshop

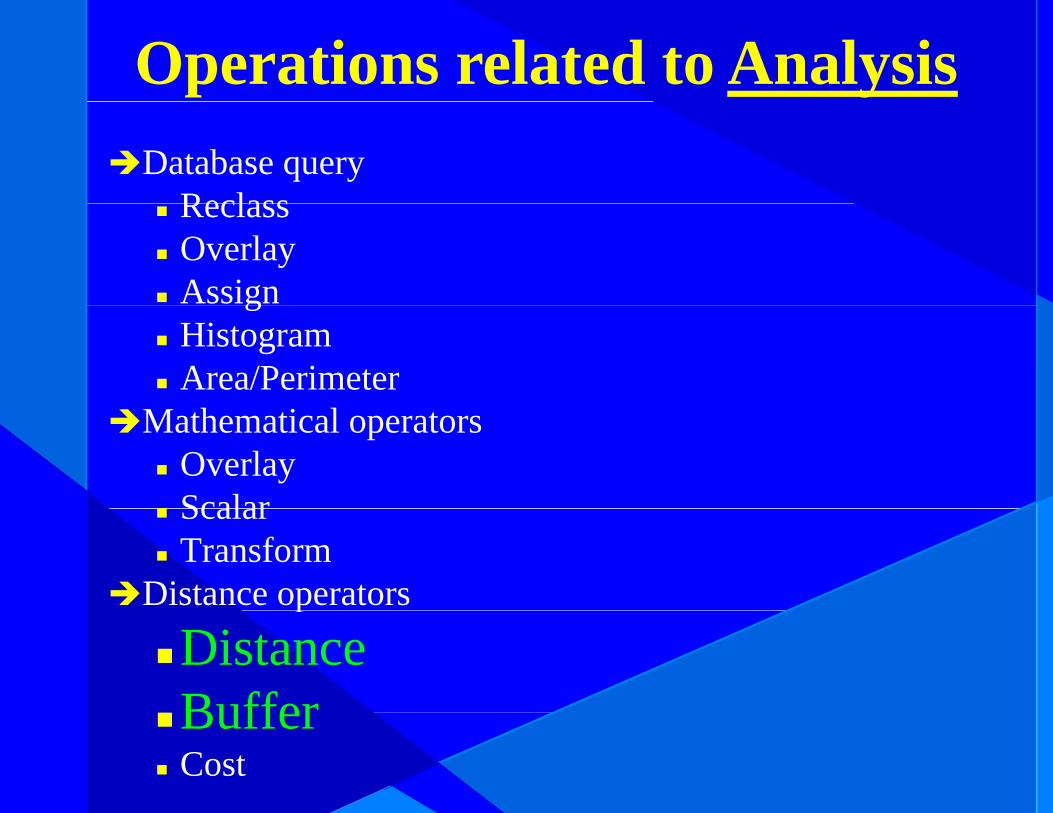
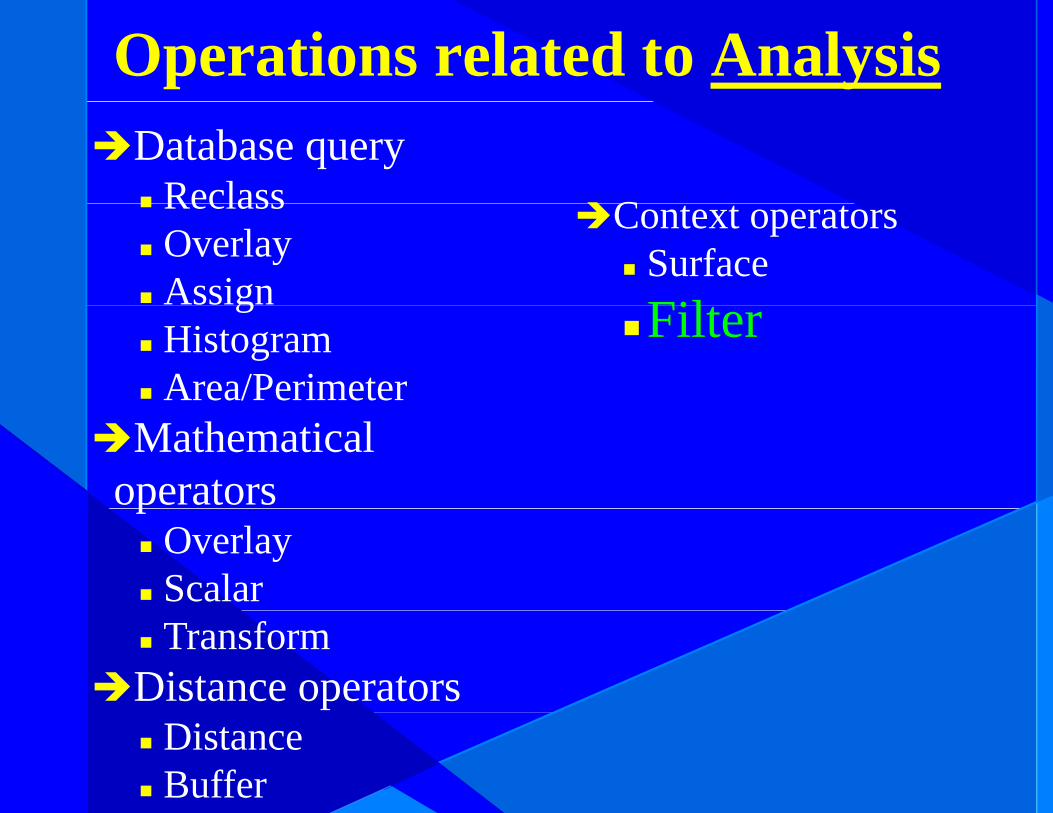
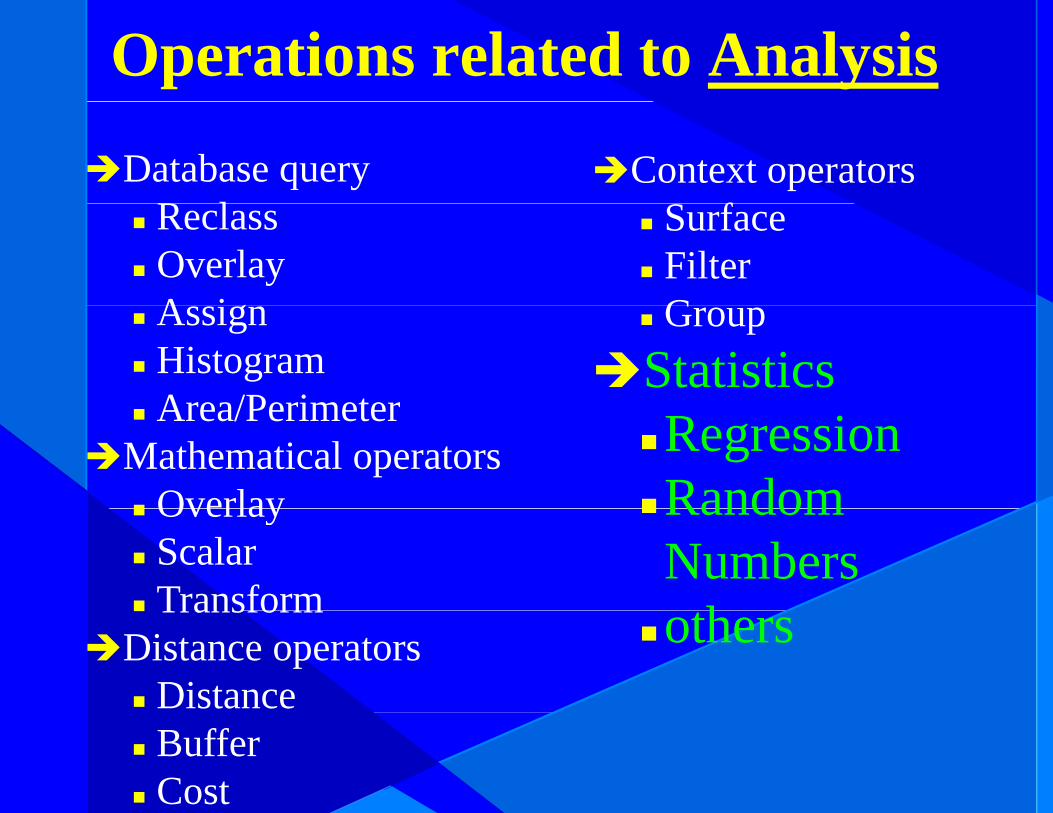
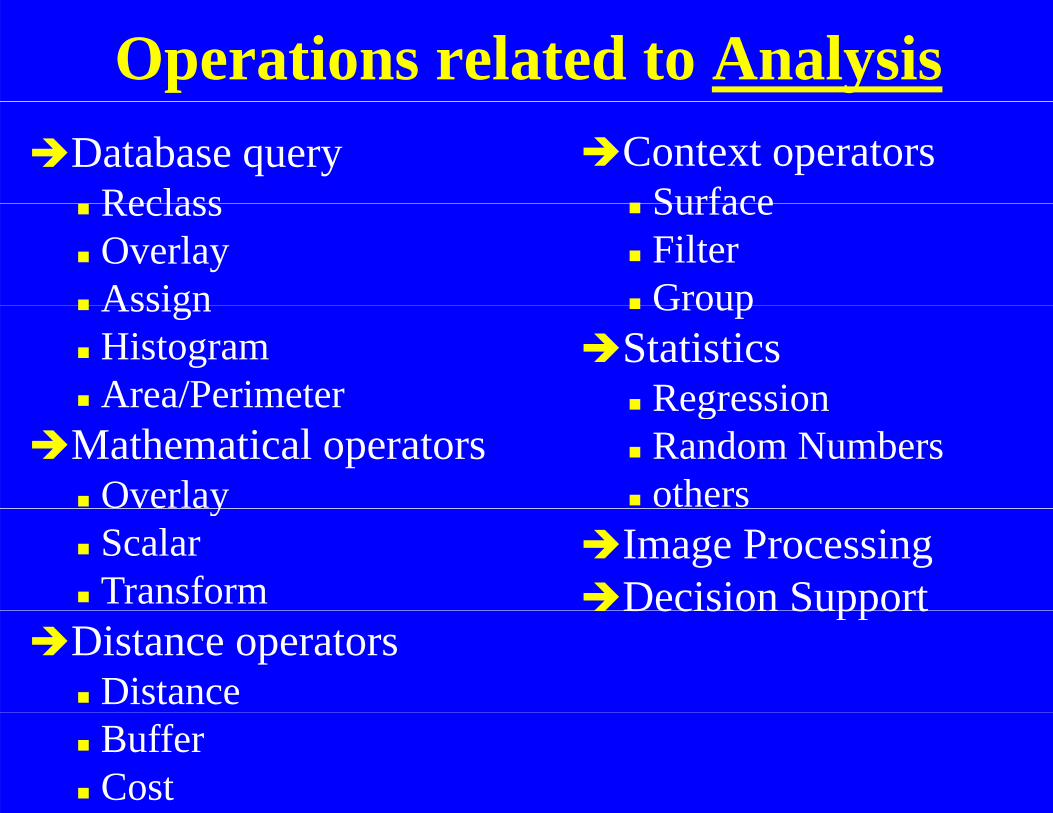
Operations related to Analysisp yDatabase query Context operators
ReclassOverlay
i
SurfaceFilterGAssign
HistogramA /P i t
GroupStatistics
R iArea/PerimeterMathematical operators
O l
RegressionRandom NumbersthOverlay
ScalarTransform
othersImage ProcessingD i i S tTransform
Distance operatorsDistance
Decision Support
DistanceBufferCost

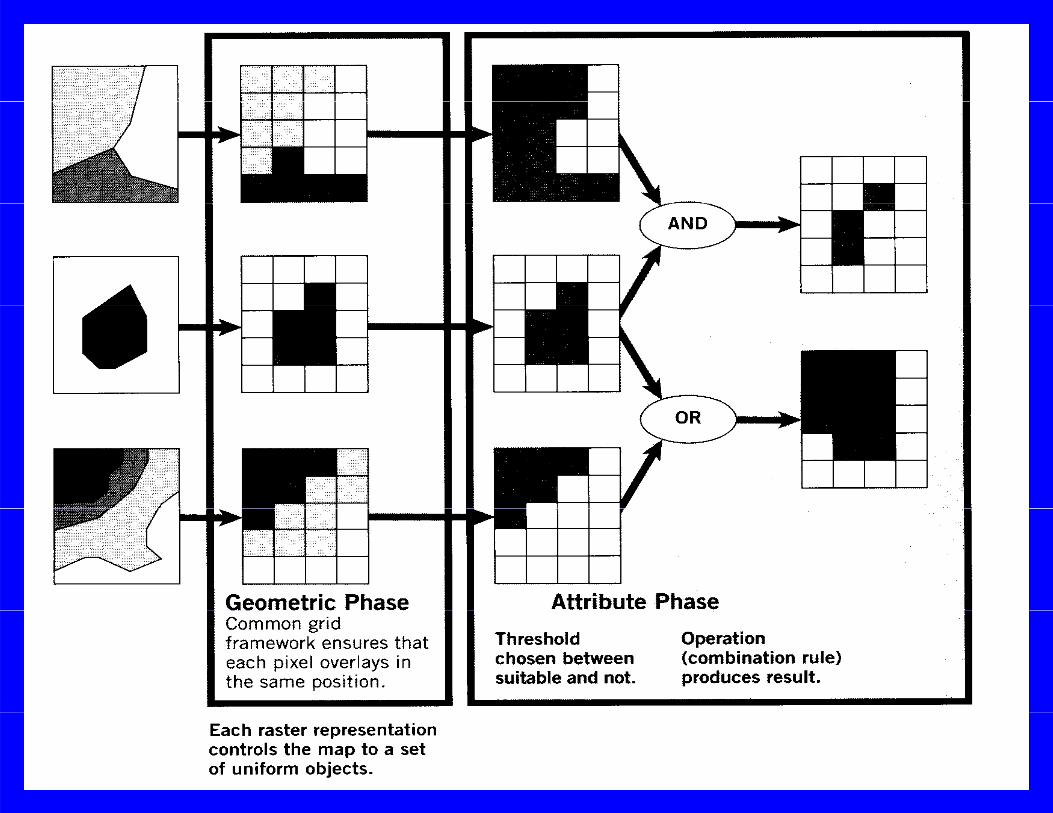
Database Query ComponentDatabase Query Component of Analysis Operationy p
Database queryReclassReclassOverlay
iAssignHistogramgArea/Perimeter
Questions answered by Database Query?Q y Q y
What is at this location?query by location
What are all locations that have a certainWhat are all locations that have a certain attribute?
b ibquery by attributeTell me about this map?!p
One of the key activities of database query ispattern seeking. Typically we are looking for spatial patterns in the data that may lead us to p p yhypothesize about relationships between variables.
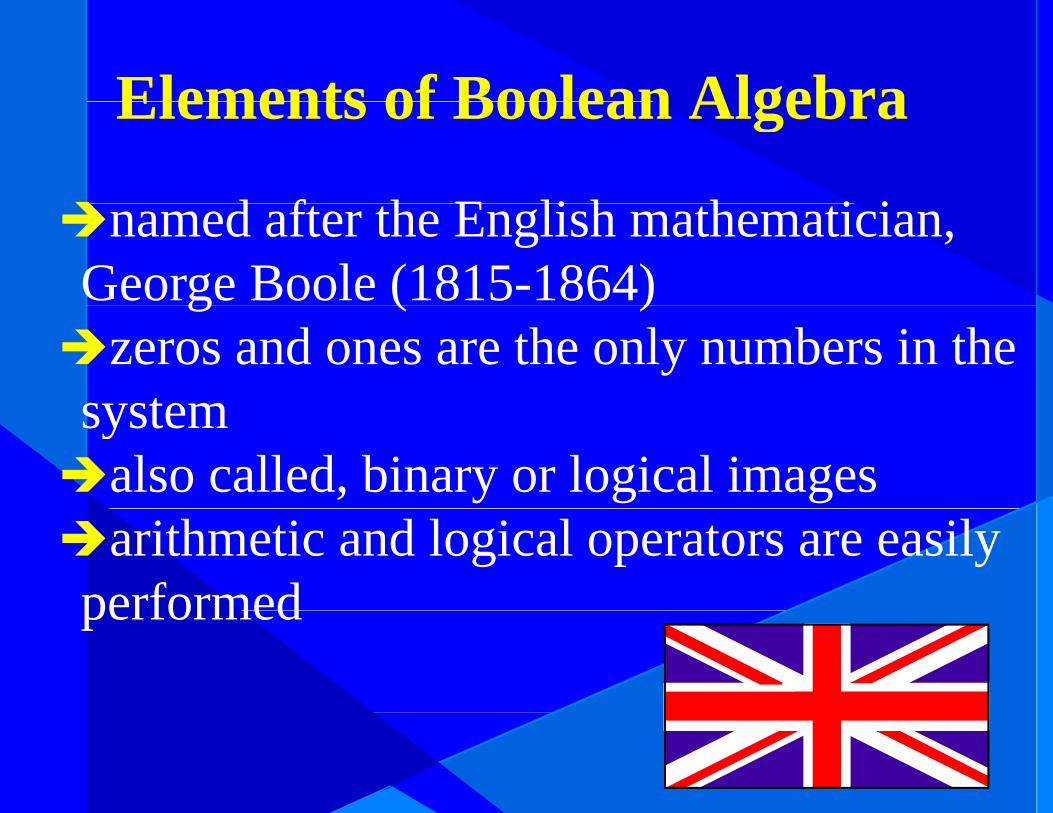
Elements of Boolean AlgebraElements of Boolean Algebra
d f h E li h h i inamed after the English mathematician, George Boole (1815-1864)g ( )
zeros and ones are the only numbers in the systemsystem
also called, binary or logical imagesarithmetic and logical operators are easily
performedperformed
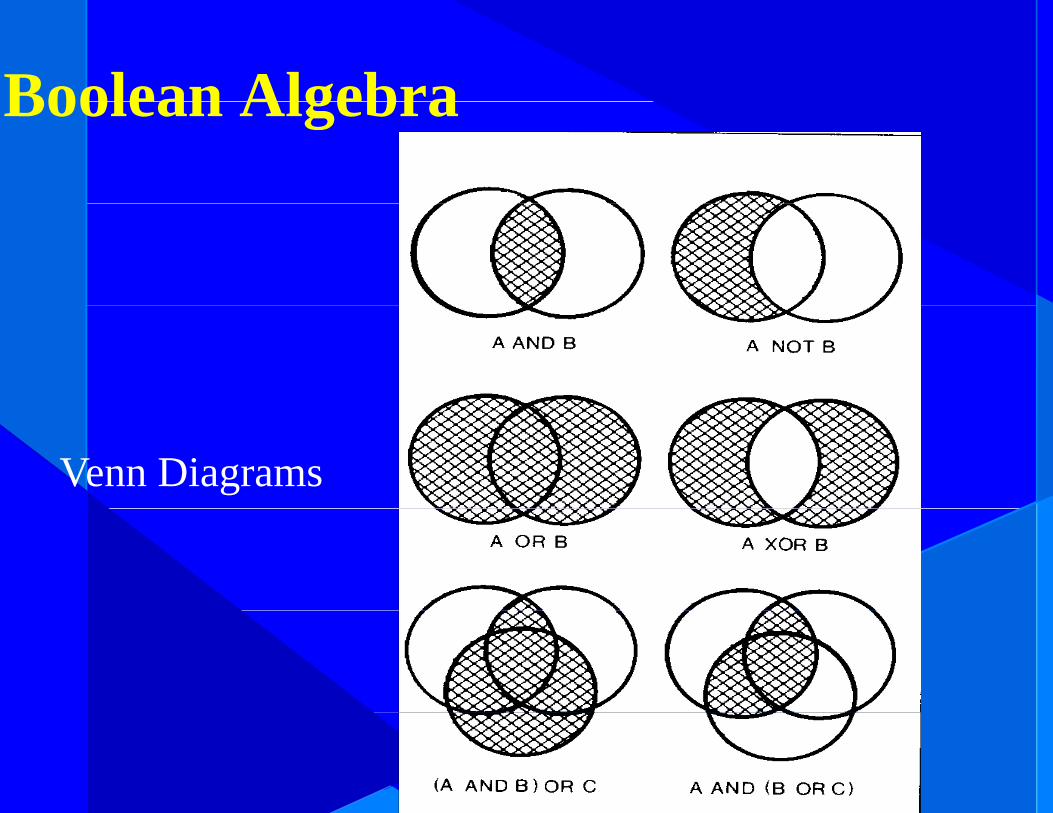
Boolean AlgebraBoolean Algebra
Venn Diagrams
Operations related to Analysisp y
Database queryDatabase queryReclass
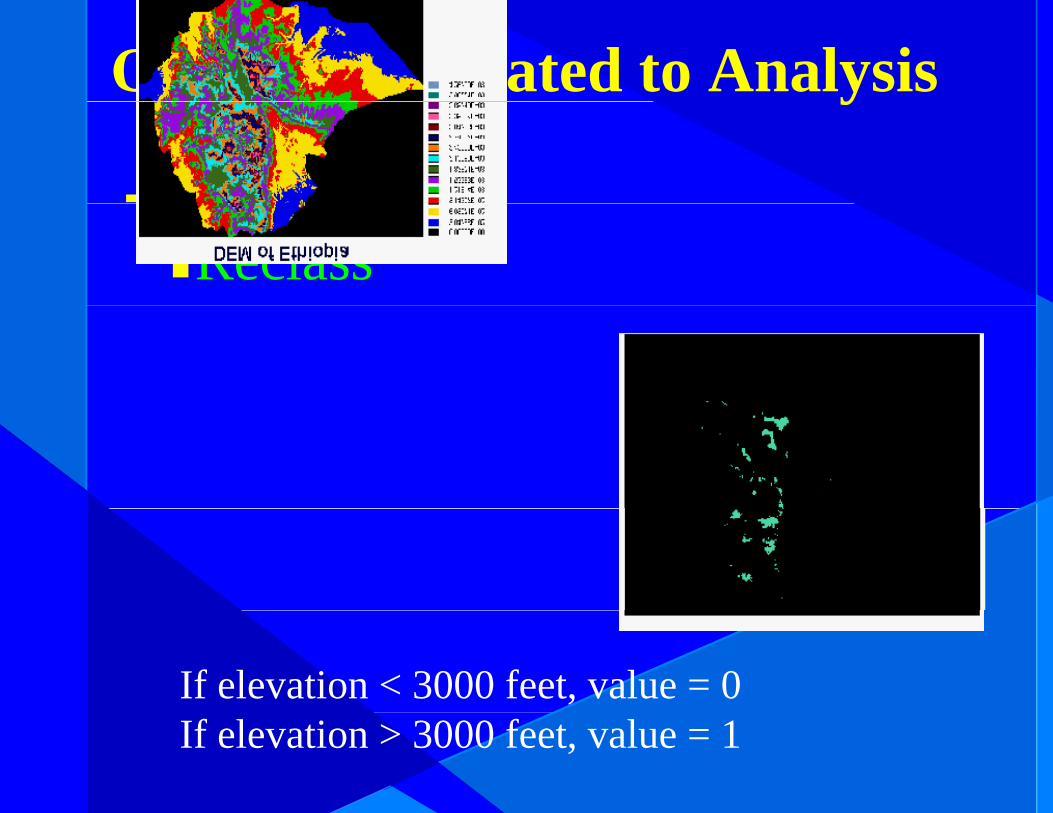
If elevation < 3000 feet, value = 0If elevation > 3000 feet, value = 1

O ti l t d t A l iOperations related to Analysis
Database queryReclass
Overlayyadditionsubtractionsubtractionmultiplicationdivisiondivisioncoverminimization/maximizationminimization/maximization
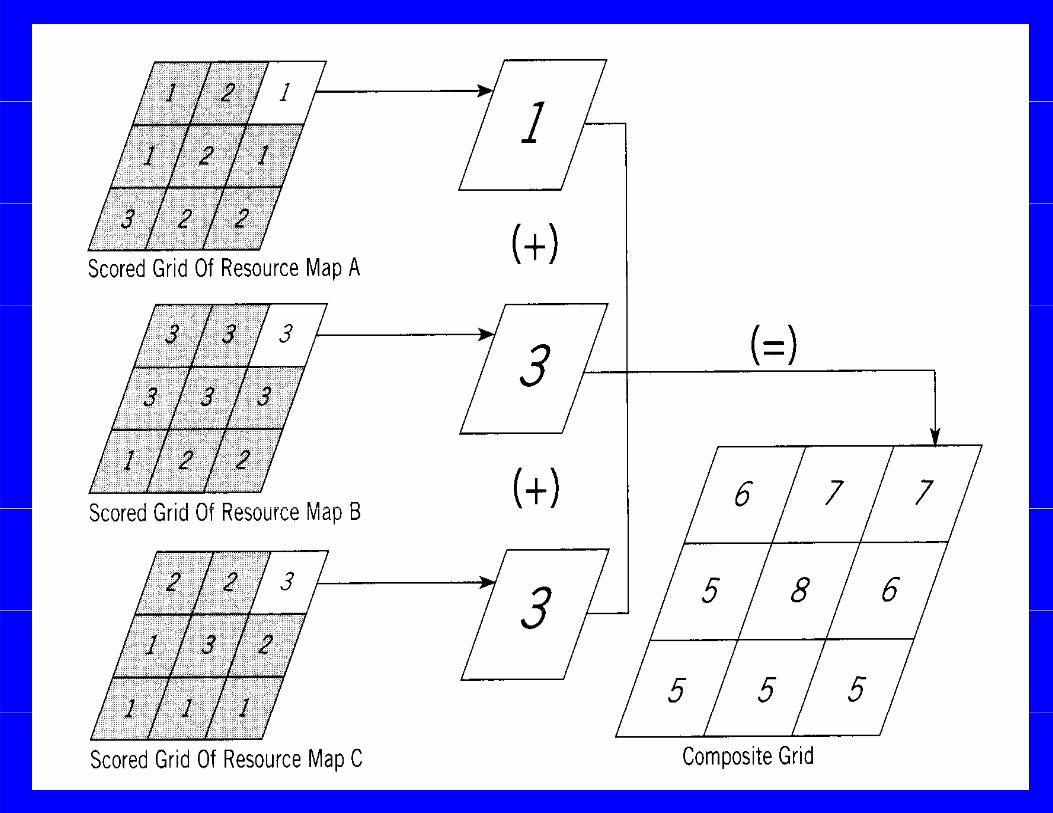
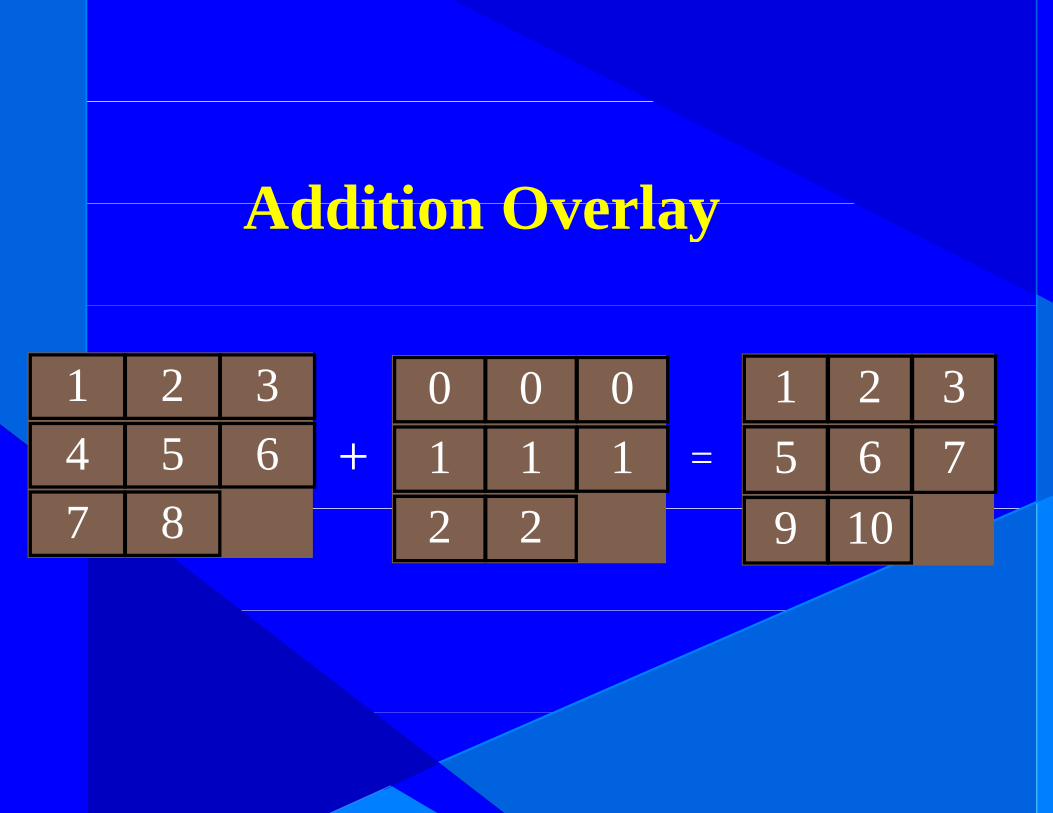
Addition OverlayAddition Overlay
1 2 3 0 0 0 1 2 34 5 67 8
1 1 1+ 5 6 7=7 8 2 2 9 10

Subtraction OverlaySubtraction Overlay
1 2 3 0 0 0 1 2 34 5 67 8
1 1 12 2
- 3 4 55 6
=7 8 2 2 5 6

Multiplication Overlay
1 2 3 0 0 0 0 0 04 5 6
0 0 01 1 1x
0 0 04 5 6=
7 8 2 2 14 16
This is not like the matrix dot product (which results in a scalar quantity) or the matrix crossresults in a scalar quantity) or the matrix cross product (which results in an orthogonal matrix). Both of these are matrix multiplicationBoth of these are matrix multiplication.
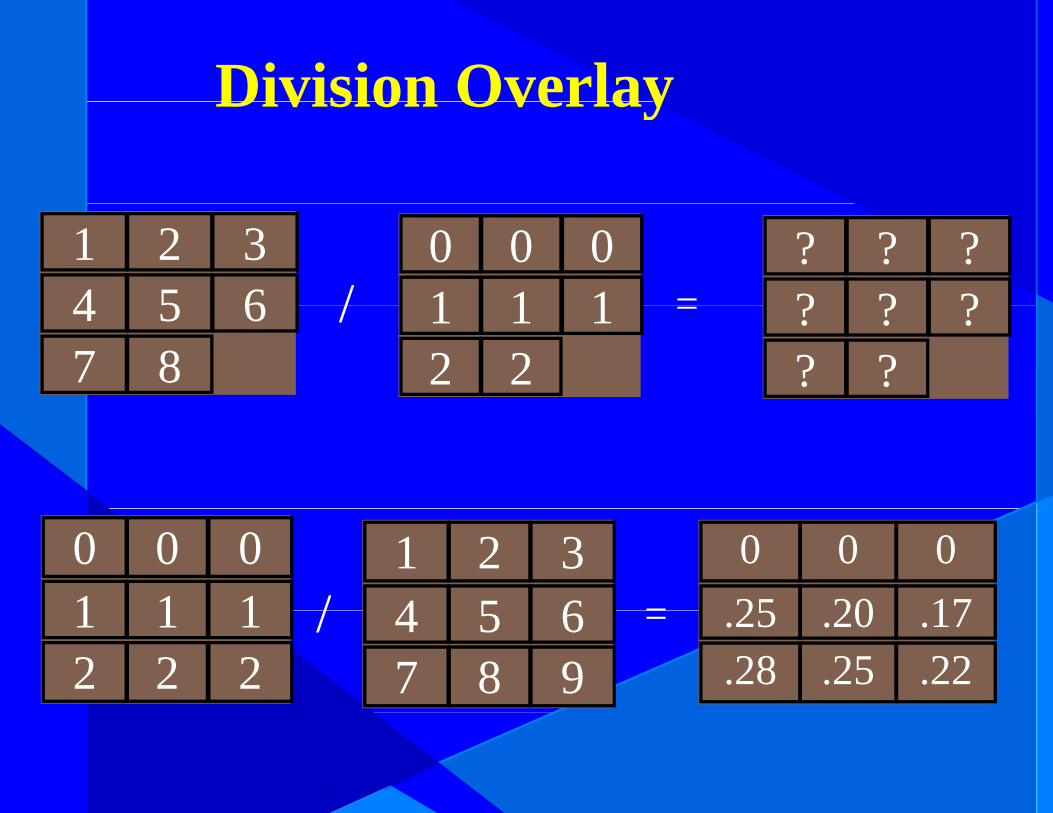
Division OverlayDivision Overlay
1 2 34 5 6
0 0 01 1 1/
? ? ?? ? ?=4 5 6
7 81 1 12 2
/ ? ? ?? ?
=
0 0 01 1 1 /
1 2 34 5 6 =
0 0 025 20 171 1 1
2 2 2/ 4 5 6
7 8 9= .25 .20 .17
.28 .25 .22
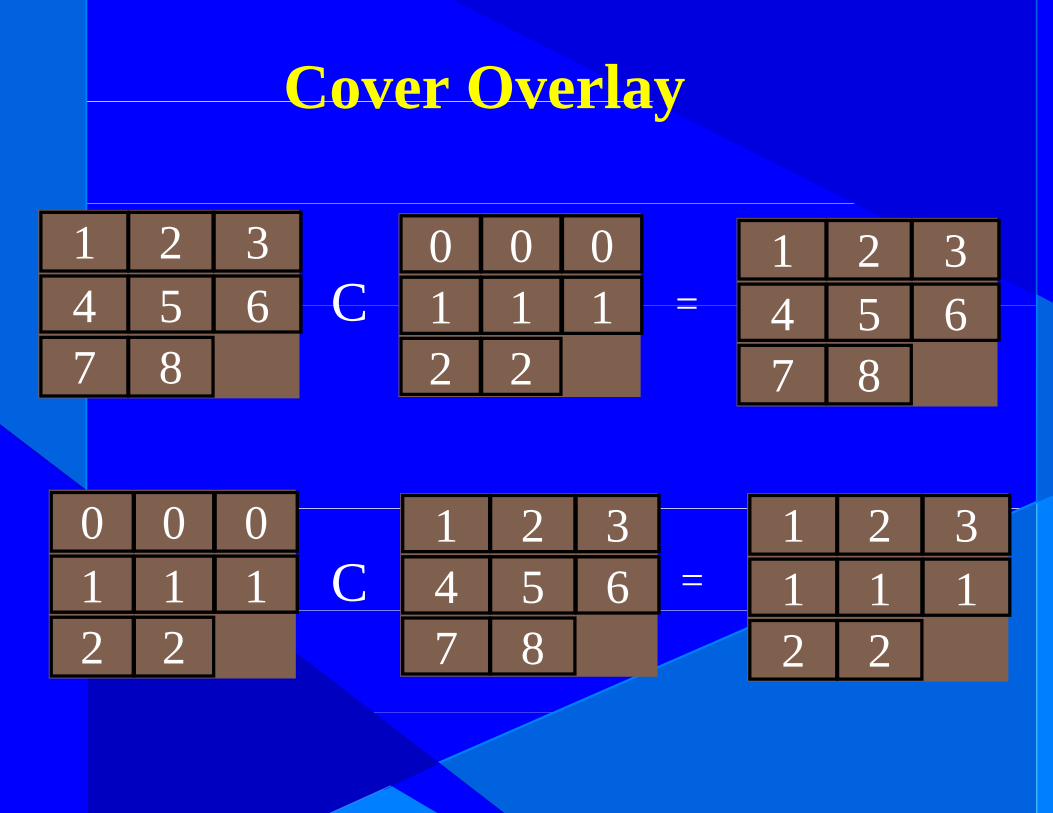
Cover OverlayCover Overlay
1 2 34 5 6
0 0 01 1 1C =
1 2 34 5 64 5 6
7 81 1 12 2
C = 4 5 67 8
0 0 00 0 01 1 1 C
1 2 34 5 6 =
1 2 31 1 1
2 2 7 8 2 2

Maximization/Minimization OverlayMaximization/Minimization Overlay
1 2 34 5 6
9 8 76 5 4MX =
9 8 76 5 64 5 6
7 86 5 41 2
MX = 6 5 67 8 9
9 8 71 2 3MN =
1 2 34 5 4
9 8 76 5 4
1 2 34 5 6
1 2 31 2 37 8 9

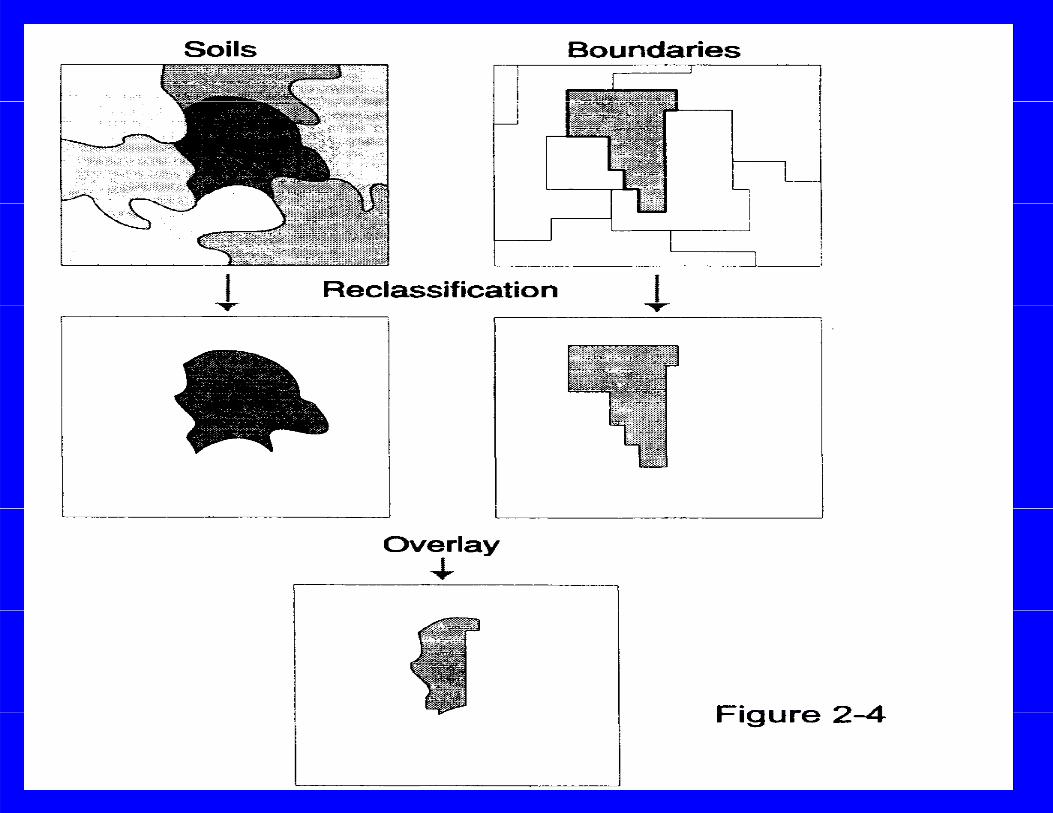
Map Overlayp y

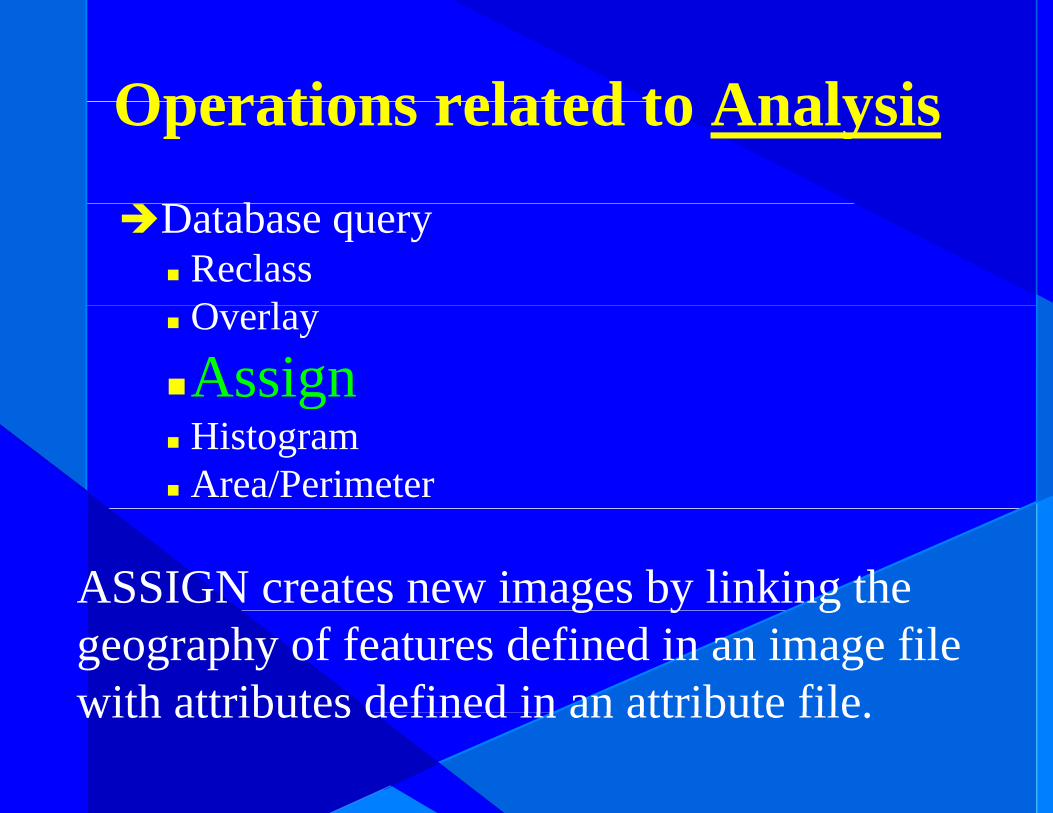
Operations related to AnalysisOperations related to Analysis
bDatabase queryReclassO lOverlay
AssigngHistogramArea/Perimeter
ASSIGN creates new images by linking theg y ggeography of features defined in an image filewith attributes defined in an attribute filewith attributes defined in an attribute file.
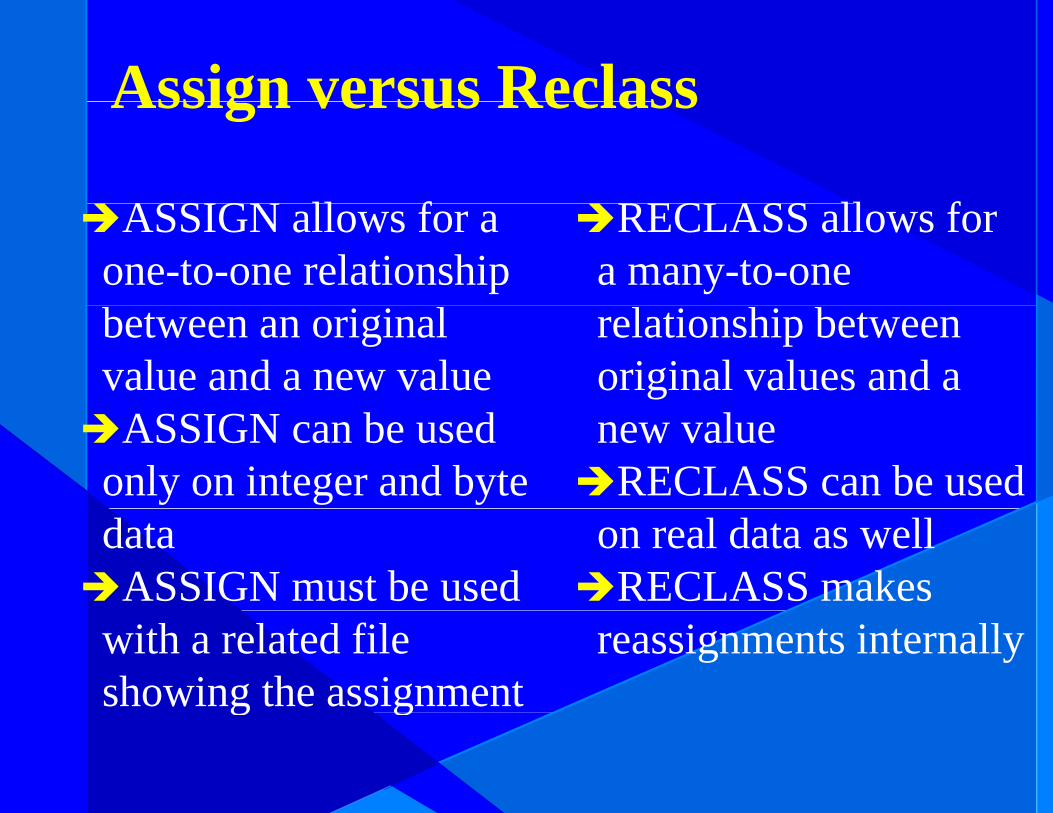
Assign versus ReclassAssign versus Reclass
ASSIGN ll f RECLASS ll fASSIGN allows for a one-to-one relationship
RECLASS allows for a many-to-one
between an original value and a new value
relationship between original values and a
ASSIGN can be used only on integer and byte
new valueRECLASS can be used
dataASSIGN must be used
on real data as wellRECLASS makes
with a related file showing the assignment
reassignments internallyg g
Operations related to AnalysisOperations related to Analysis
bDatabase queryReclassO lOverlayAssign
HiHistogramArea/Perimeter

Operations related to Analysis
b
Operations related to Analysis
Database queryReclassO lOverlayAssignHistogramHistogram
Area/Perimeter
Calculates the area and/or perimeter ofCalculates the area and/or perimeter of a map that contains a certain attribute
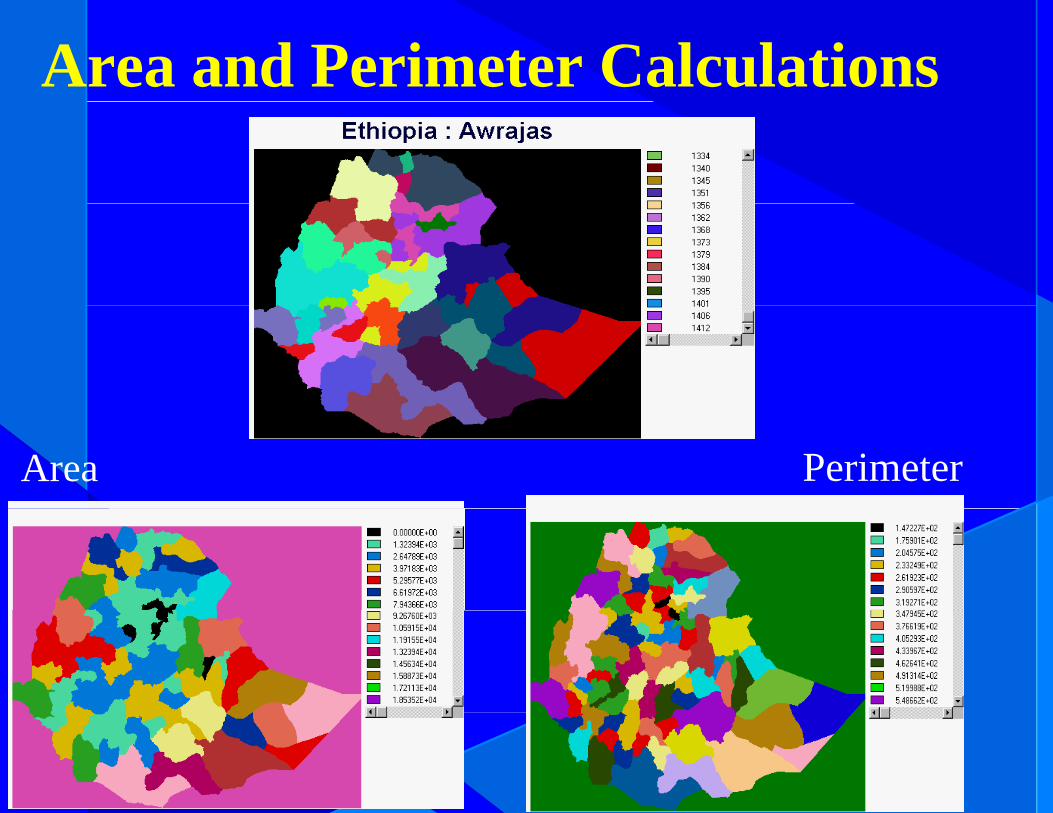
Area and Perimeter Calculations
Area Perimeter

How is Perimeter Calculated?

How is Area Calculated?
Operations related to AnalysisDatabase query
Operations related to AnalysisDatabase query
ReclassOverlayOverlayAssignHistogramHistogramArea/Perimeter
Mathematical operatorsMathematical operatorsOverlay
ScalarScalaraddition, subtraction, multiplication, division, & exponentiation& exponentiation
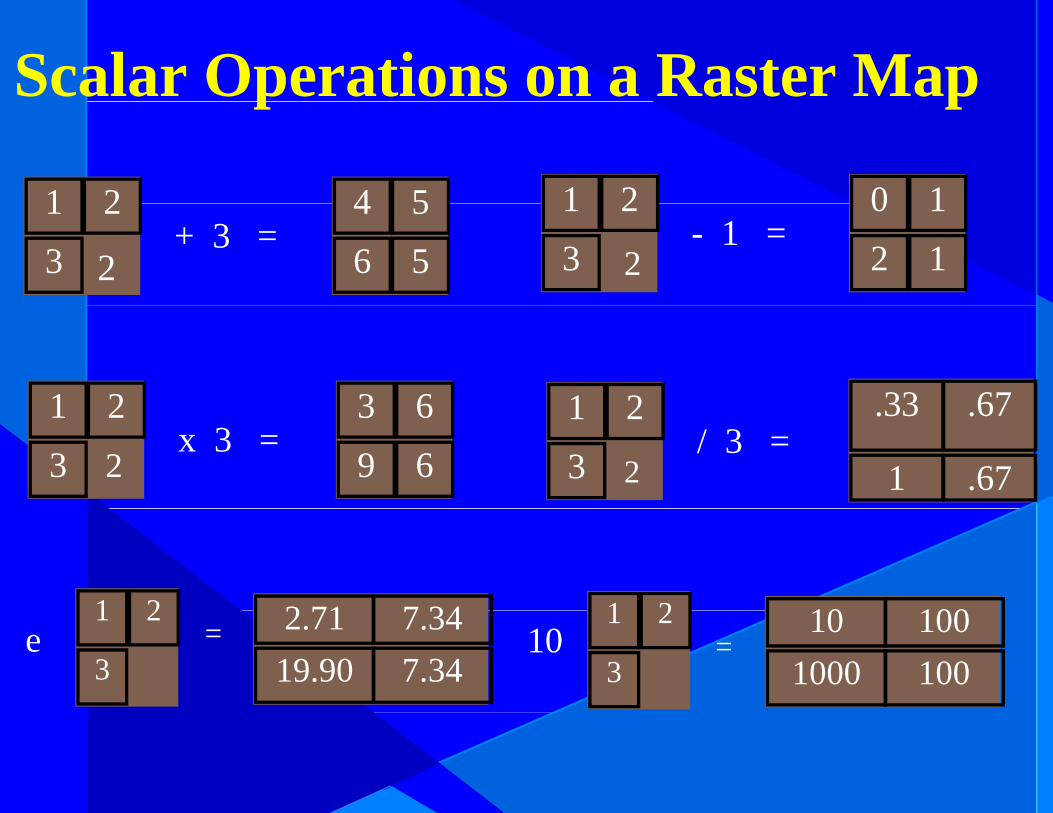
Scalar Operations on a Raster Mapp p
1 2 4 5 1 2 0 11 2
3+ 3 =
4 5
6 5
1 2
3- 1 =
0 1
2 12 2
1 2 3 6 1 2 33 671 2
3x 3 =
3 6
9 61 2
3/ 3 =
.33 .67
1 .672 2
1 2 2 71 7 34 1 2 10 1001 2
3=e 2.71 7.34
19.90 7.34
1 2
3=10 10 100
1000 100

O ti l t d t A l iOperations related to AnalysisDatabase query
Reclass Transform allows the userh d lOverlay
Assigni
to convert the data valuesin an image into transformed
l h i lHistogramArea/Perimeter
M th ti l t
values, such as: reciprocal, natural logarithm, square
t i diMathematical operatorsOverlayS l
root, cos, arcsin, radians, degrees, absolute value.
Scalar
Transform
Operations related to AnalysisDatabase query
ReclassReclassOverlayAssigngHistogramArea/Perimeter
Mathematical operatorsOverlayScalarScalarTransform
Distance operatorsp
DistanceBufferBufferCost

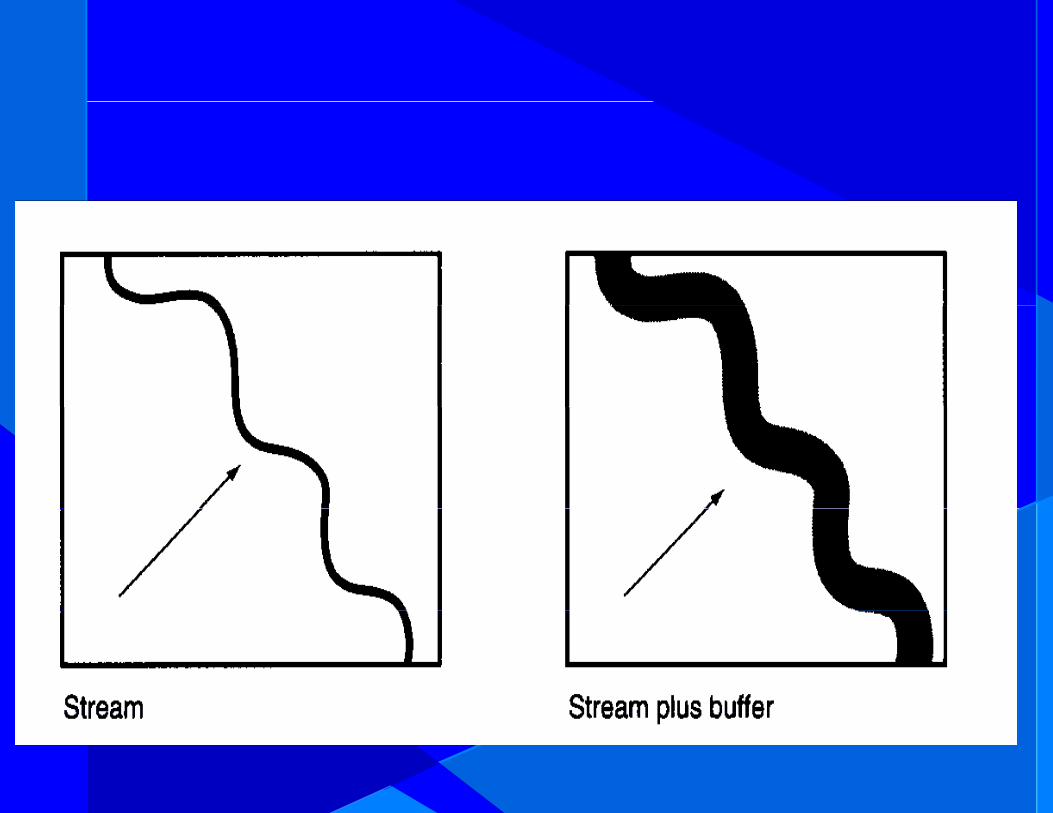
Distance & Buffer OperatorsDistance & Buffer Operators
distance is a Euclidean functionevery pixel is assigned a valueevery pixel is assigned a value
representing its distance from the nearest f tfeature
most often used in suitability mapping
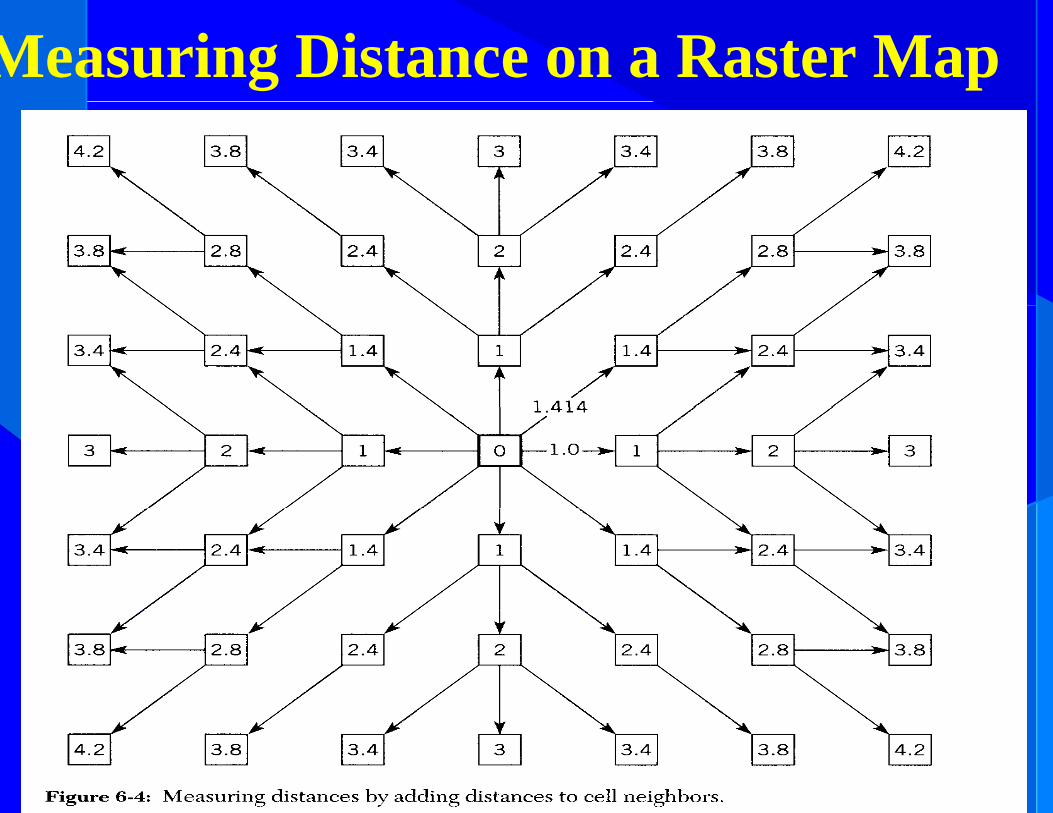
Measuring Distance on a Raster Map
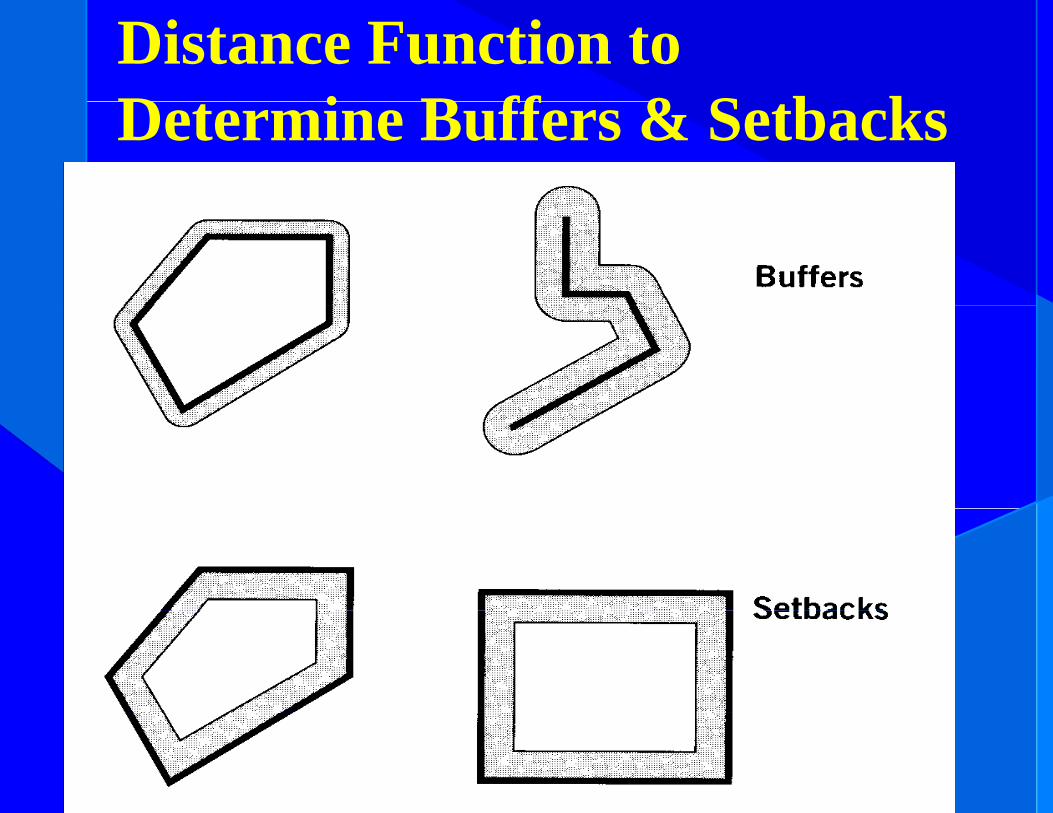
Distance Function to D t i B ff & S tb kDetermine Buffers & Setbacks


Operations related to AnalysisDatabase query
ReclassReclassOverlayAssigngHistogramArea/Perimeter
Mathematical operatorsOverlayScalarScalarTransform
Distance operatorspDistanceBuffer
Cost
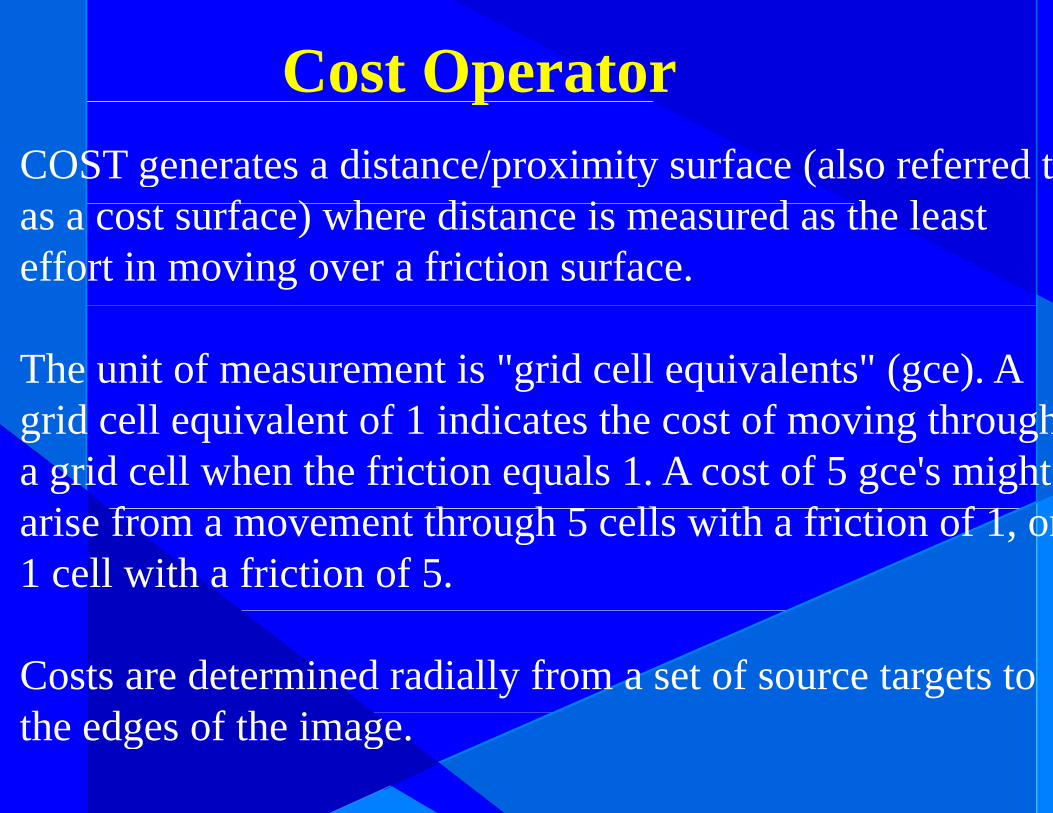
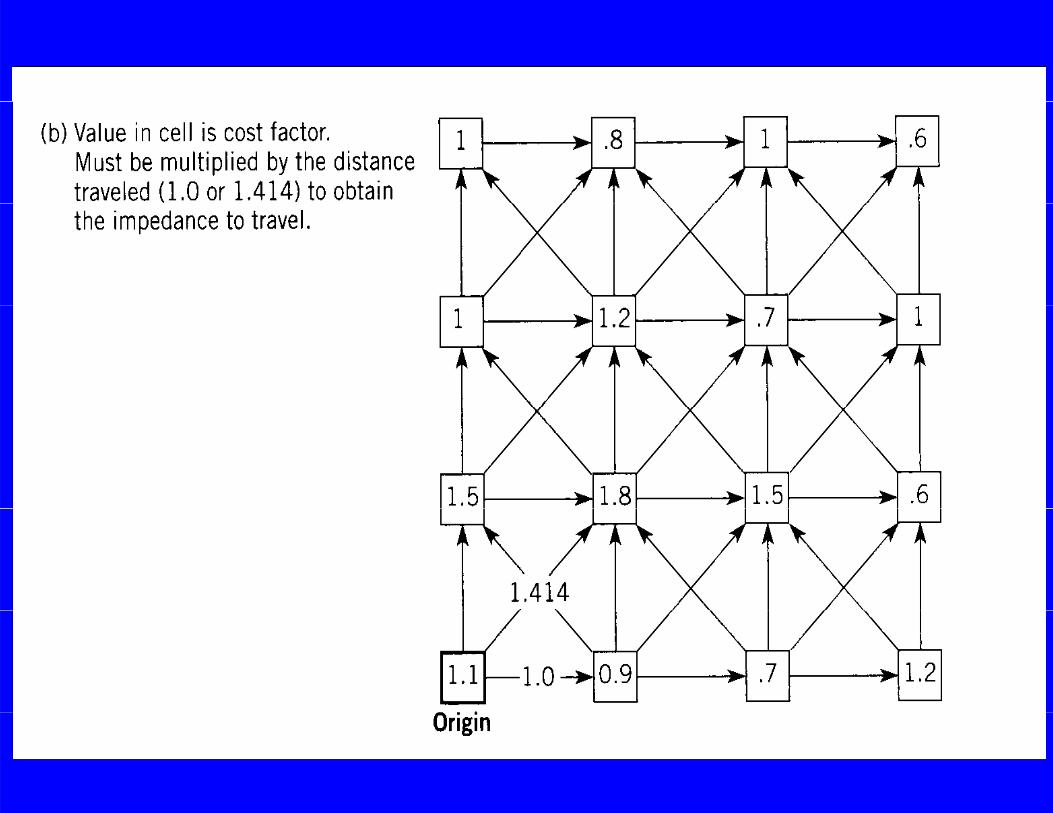
Cost OperatorpCOST generates a distance/proximity surface (also referred t
f ) h di i d h las a cost surface) where distance is measured as the least effort in moving over a friction surface.
The unit of measurement is "grid cell equivalents" (gce). A id ll i l f 1 i di h f i h hgrid cell equivalent of 1 indicates the cost of moving through
a grid cell when the friction equals 1. A cost of 5 gce's might i f h h 5 ll i h f i i f 1arise from a movement through 5 cells with a friction of 1, or
1 cell with a friction of 5.
Costs are determined radially from a set of source targets to h d f h ithe edges of the image.

Cost Operation - Cost Push AlgorithmFor the Cost Push algorithm, input the name of the source i Thi i th i th t i di t th ll f hi himage. This is the image that indicates the cells from which costs should be determined. The source image must be i t ith f t ll i di t d b l Yinteger, with feature cells indicated by non-zero values. Youare then required to input the name of the friction surface i Th f i ti f i t t i l limage. The friction surface image must contain real values, with frictions relative to 1.0. Thus a friction of 2.0 indicates t i th b t t th h th t ll Lik itwice the base cost to move through that cell. Likewise, a friction of 0.5 indicates half the base cost. Barriers should b d l hi h l i f i i ibe entered as extremely high relative frictions in your friction surface image. Finally input a name and title for the
ioutput image.
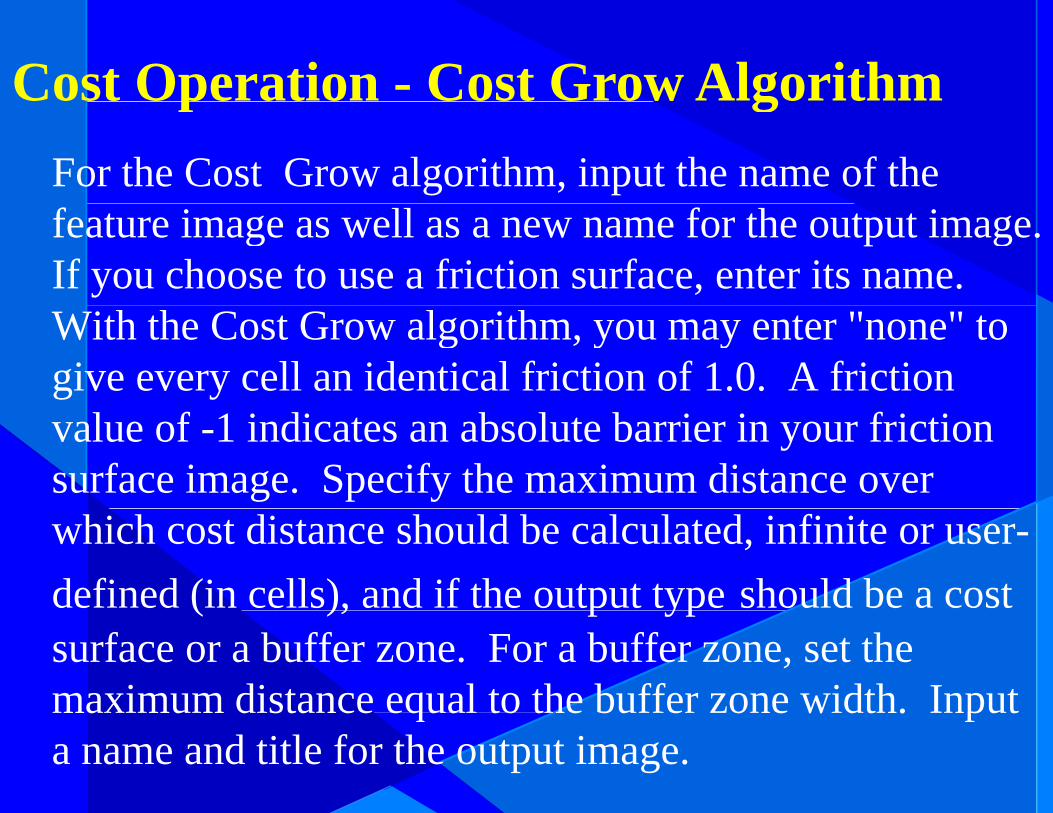
Cost Operation - Cost Grow AlgorithmFor the Cost Grow algorithm, input the name of the
p g
feature image as well as a new name for the output image. If you choose to use a friction surface, enter its name. With the Cost Grow algorithm, you may enter "none" to give every cell an identical friction of 1.0. A friction value of -1 indicates an absolute barrier in your friction surface image. Specify the maximum distance over which cost distance should be calculated, infinite or user-defined (in cells), and if the output type should be a cost ( ), p ypsurface or a buffer zone. For a buffer zone, set the maximum distance equal to the buffer zone width. Inputmaximum distance equal to the buffer zone width. Input a name and title for the output image.
Operations related to Analysisp yDatabase query Context operators
ReclassOverlayA i
SurfaceAssignHistogramArea/PerimeterArea/Perimeter
Mathematical operatorsOverlayyScalarTransform
Distance operatorsDistanceBufferBufferCost
Surface - Analysis Operator
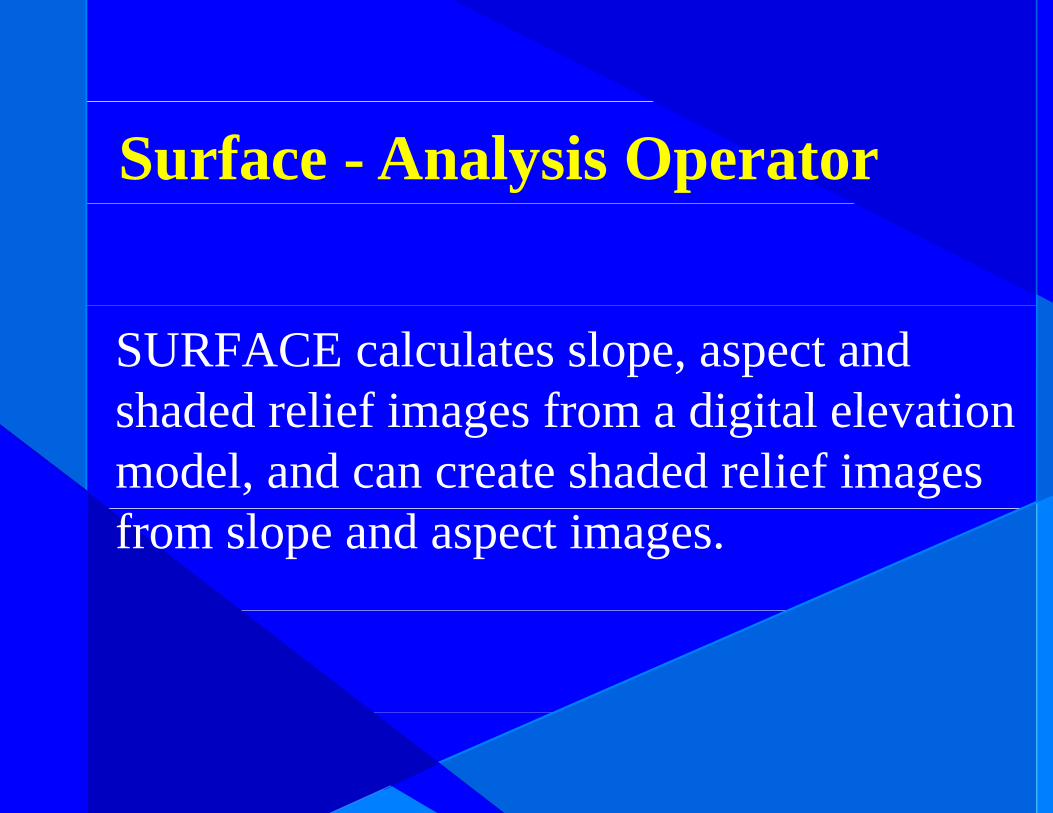
SURFACE calculates slope, aspect and shaded relief images from a digital elevationshaded relief images from a digital elevation model, and can create shaded relief images from slope and aspect images.
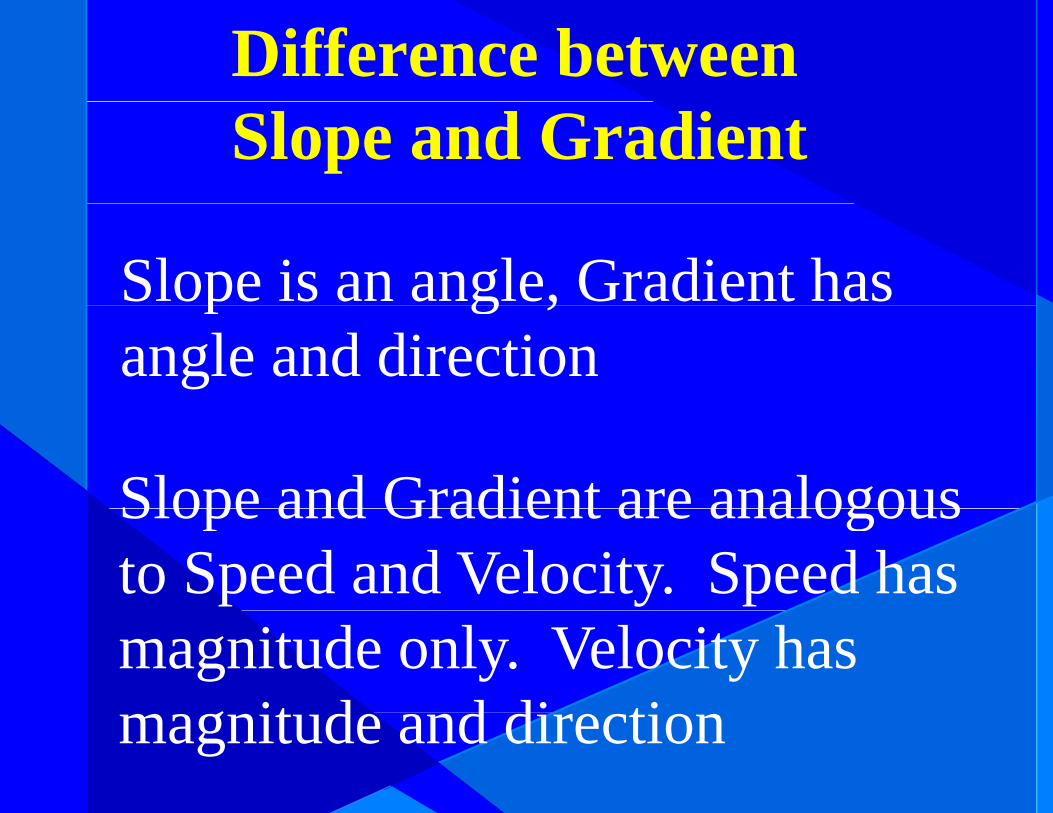
Difference between Slope and Gradient
Slope is an angle, Gradient has p g ,angle and direction
Slope and Gradient are analogousSlope and Gradient are analogous to Speed and Velocity. Speed has magnitude only. Velocity has
it d d di timagnitude and direction
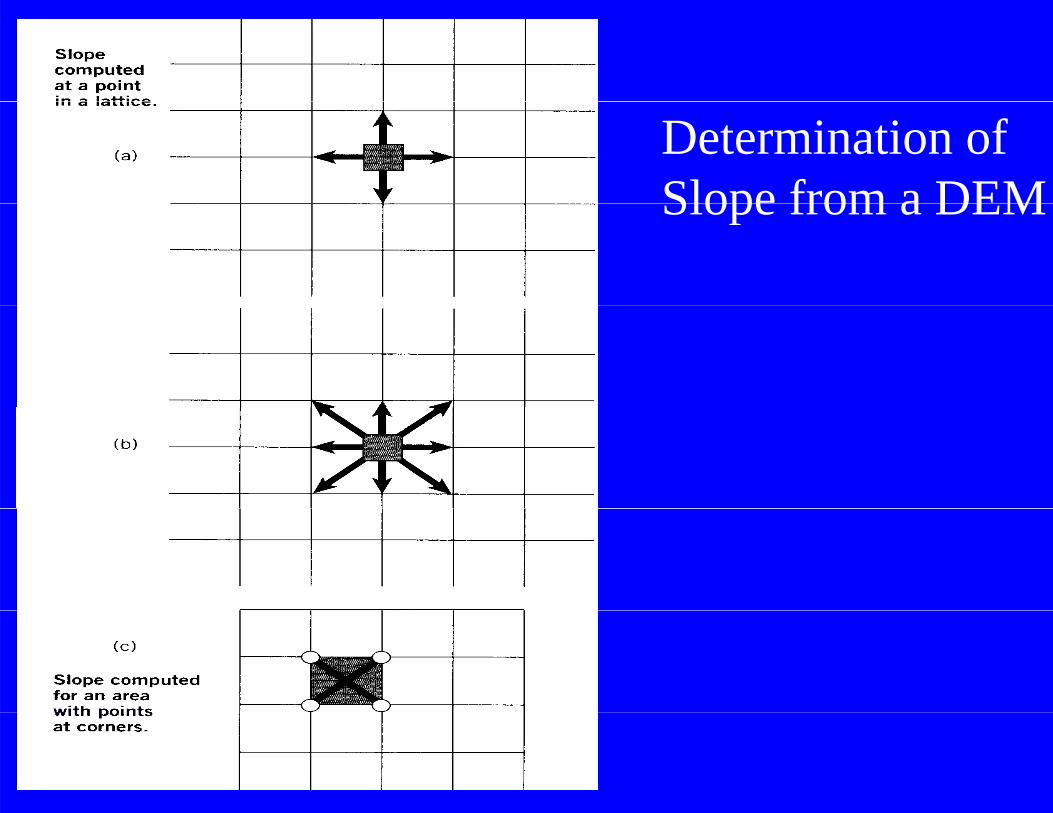
Determination of Slope from a DEMSlope from a DEM
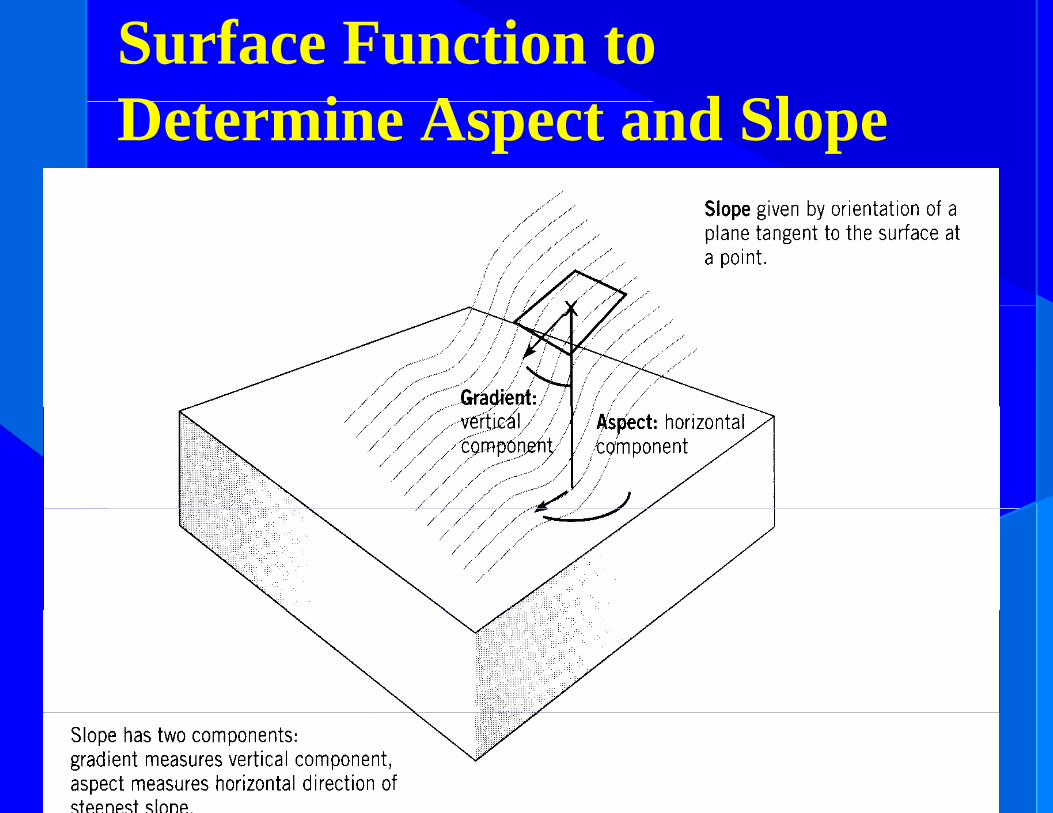
Surface Function to D t i A t d SlDetermine Aspect and Slope
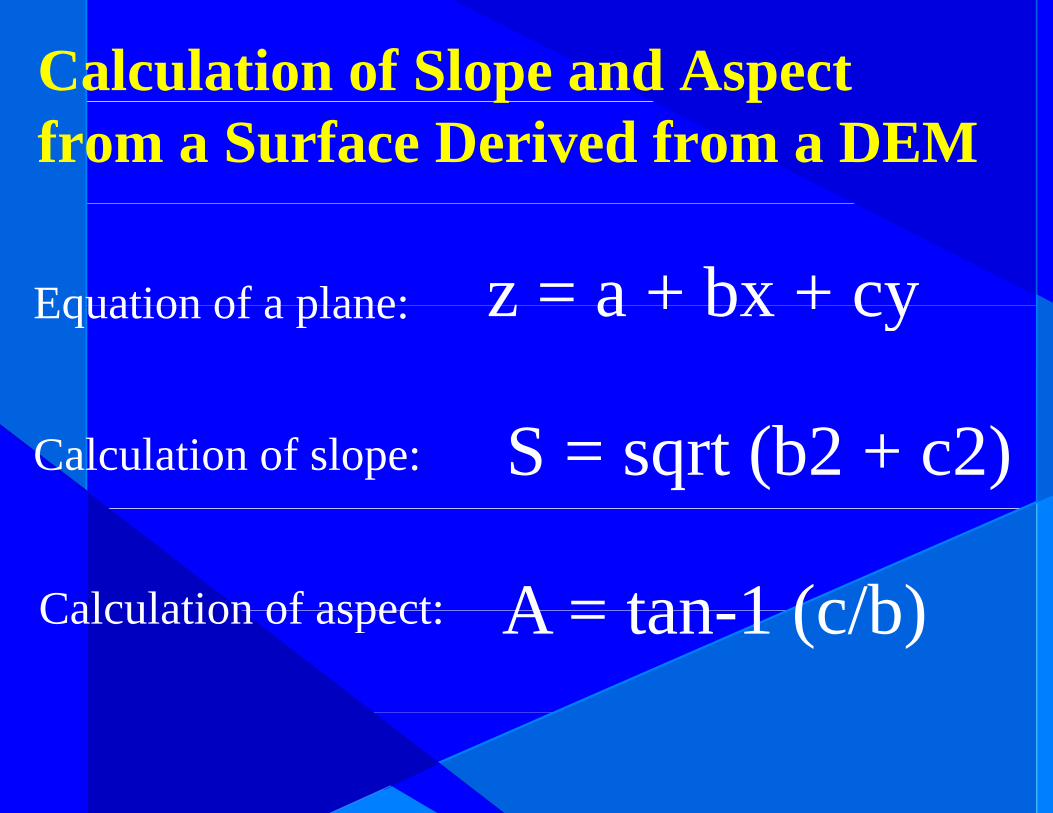
Calculation of Slope and Aspect p pfrom a Surface Derived from a DEM
Equation of a plane: z = a + bx + cyEquation of a plane: z a + bx + cy
Calculation of slope: S = sqrt (b2 + c2)
Calculation of aspect: A = tan 1 (c/b)Calculation of aspect: A = tan-1 (c/b)
Operations related to AnalysisDatabase query
Reclass CReclassOverlayAssign
Context operatorsSurfaceFiltg
HistogramArea/Perimeter
Filter
Mathematical operatorsp
OverlayScalarTransform
Distance operatorsDistanceBuffer

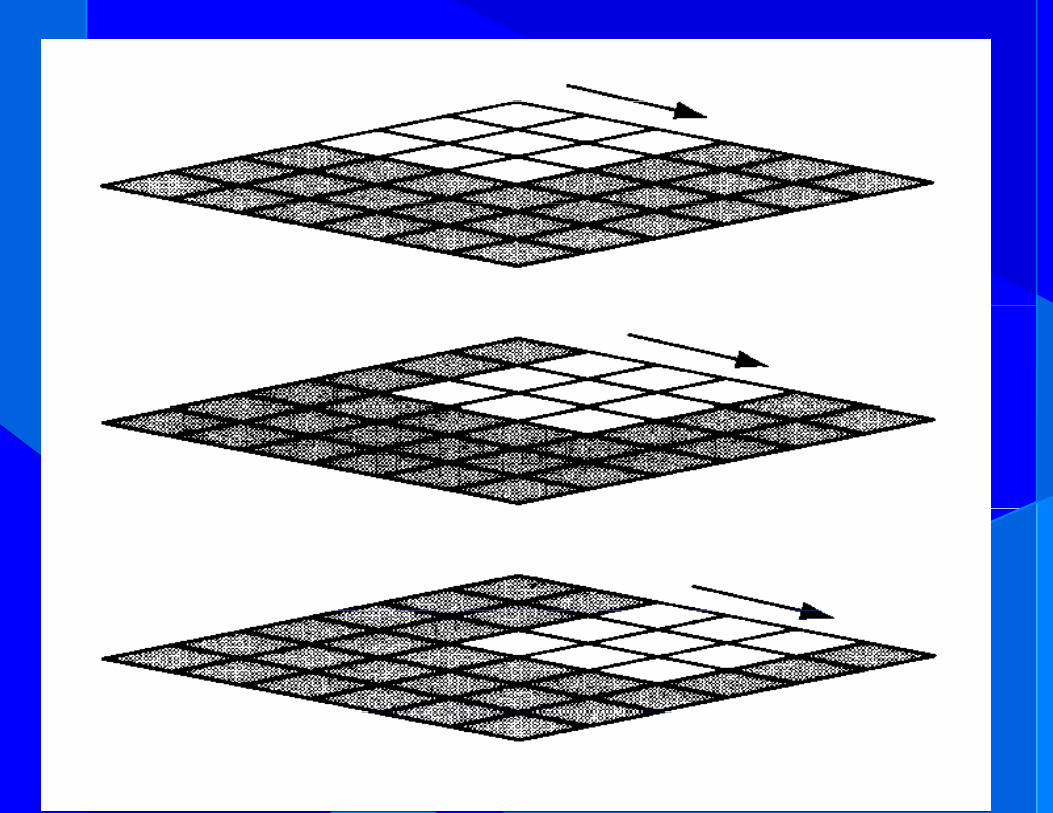
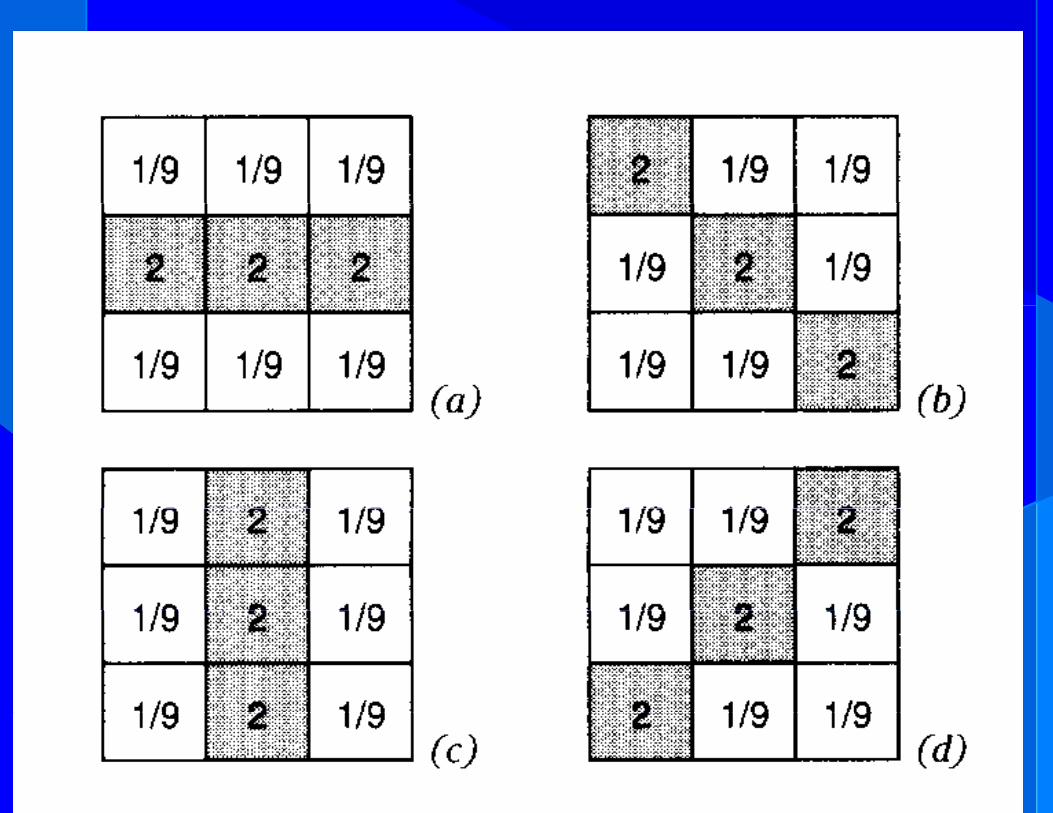
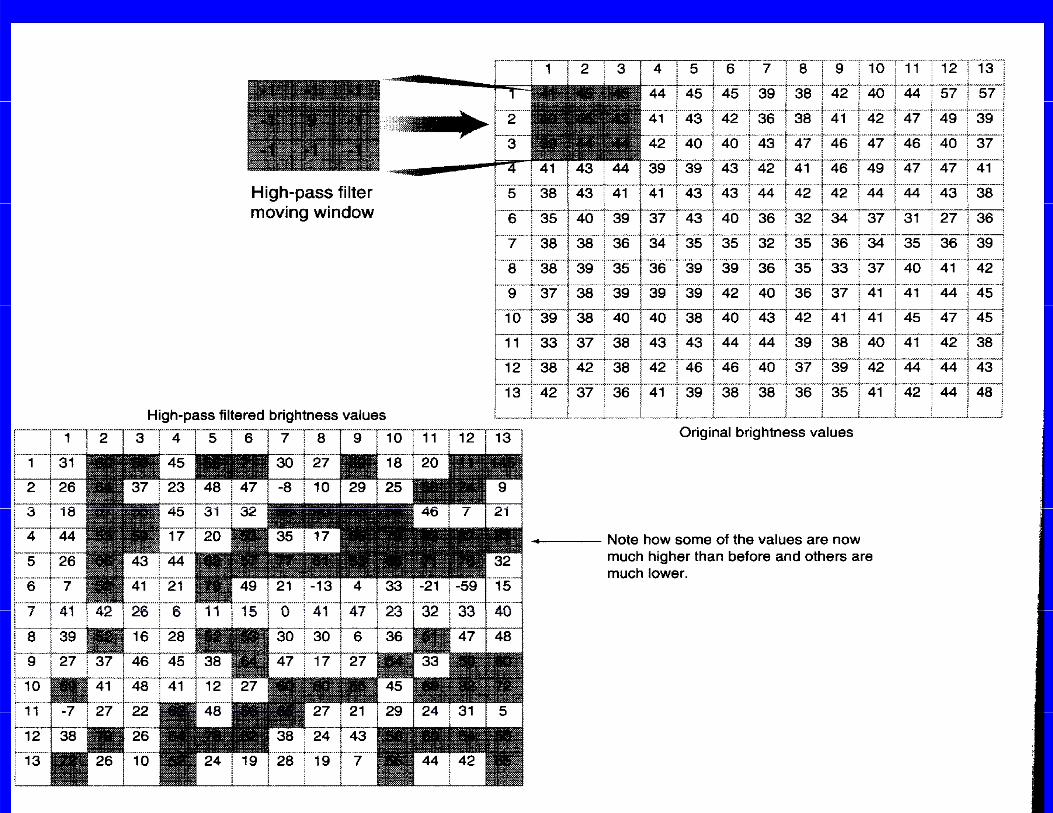
Filter OperationFilter - OperationFILTER t i i hi hFILTER creates a new image in which each pixel's value is based on its value pand those of its immediate neighbors in
i t i Th t f thian input image. The nature of this operation is determined by the values p ystored in a 3 x 3, 5 x 5, 7 x 7 or variable-i d t l t th t i t d hsized template that is centered over each
pixel as it is processed. p p

FILTER includes options for the following p gfilters for the given kernel sizes:
Mean (low pass) Filter : 3 x 3, 5 x 5, 7 x 7Gaussian Filter : 5 x 5, 7 x 7Median Filter : 3 x 3, 5 x 5Adaptive Box Filter : 3 x 3, 5 x 5, 7 x 7Mode Filter : 3 x 3, 5 x 5, 7 x 7Laplacian Edge Enhancement Filter : 3 x 3, 5 x 5, 7 x 7High Pass Filter : 3 x 3Sobel Edge Detector : 3 x 3U D fi d 3 3User-Defined : 3 x 3User-Defined Filter File : size up to 255 x 255

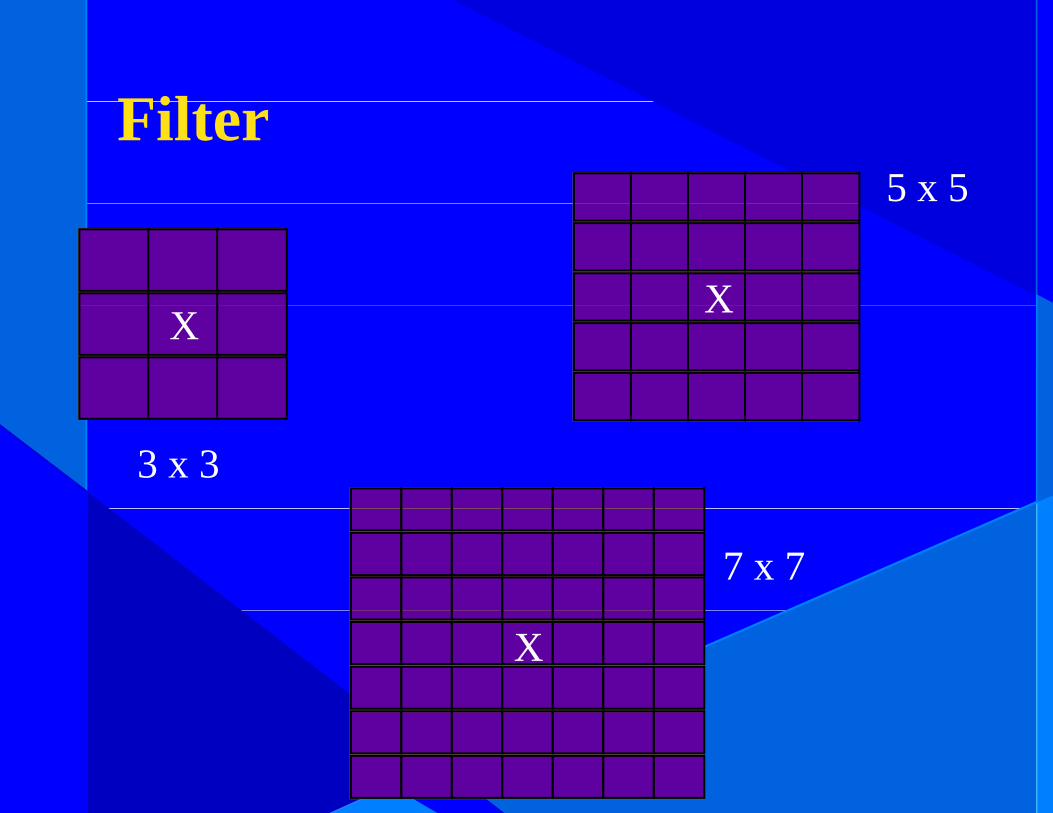
FiltFilter5 x 5
XX X
3 x 3
7 x 7
X
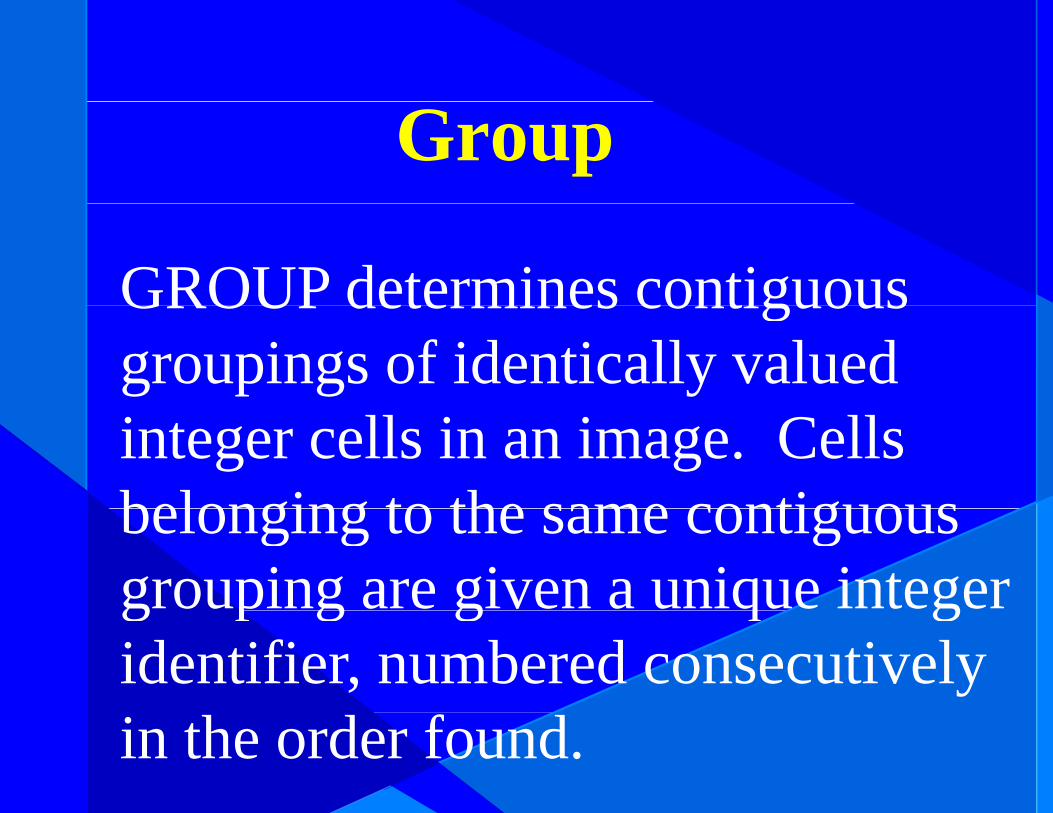
Group
GROUP determines contiguousGROUP determines contiguous groupings of identically valued integer cells in an image. Cells belonging to the same contiguousbelonging to the same contiguous grouping are given a unique integer g p g g q gidentifier, numbered consecutively in the order found.

G iGrouping EthiopianEthiopian DEM
Operations related to Analysis
Database queryR l
Context operatorsfReclass
OverlayA i
SurfaceFilterGAssign
HistogramArea/Perimeter
GroupStatistics
Area/PerimeterMathematical operators
Overlay
RegressionRandomOverlay
ScalarTransform
Random Numbers
hTransformDistance operators
Distance
others
BufferCost
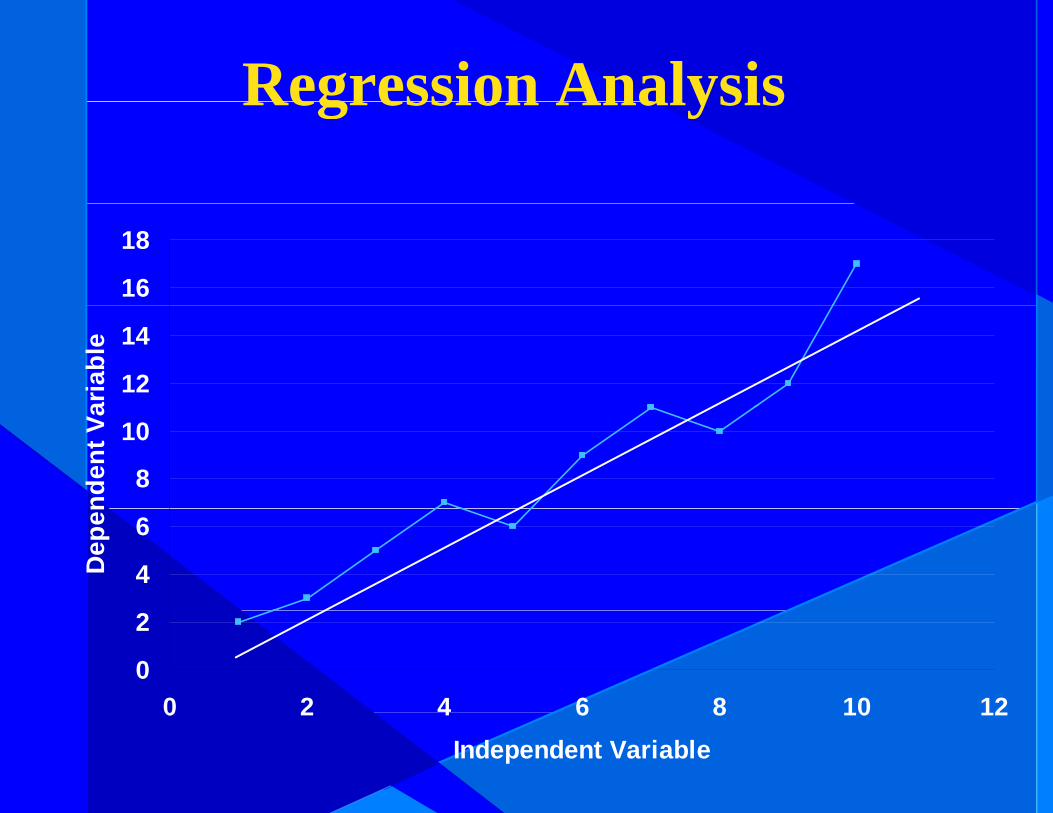
Regression AnalysisRegression Analysis
16
18
12
14
aria
ble
8
10
nden
t Va
4
6
Dep
en
0
2
0 2 4 6 8 10 120 2 4 6 8 10 12Independent Variable

Random Number Generationdo Nu be Ge e oRANDOM creates images with random values gaccording to a rectilinear, normal, or lognormal distribution It is used primarily in simulationdistribution. It is used primarily in simulation work, particularly Monte Carlo simulation.

Operations related to AnalysisDatabase query Context operators
p y
ReclassOverlay
i
SurfaceFilterGAssign
HistogramA /P i t
GroupStatistics
R iArea/PerimeterMathematical operators
O l
RegressionRandom NumbersthOverlay
ScalarTransform
othersImage Processing
TransformDistance operators
DistanceDistanceBufferCost

Digital Image ProcessingDue to solid state multispectral scanners and other
raster devices there exist digital raster images ofraster devices, there exist digital raster images of spectral reflectance data.
I R t ti ti d lib ti fImage Restoration - correction and calibration of images in order to achieve as faithful a
i f h h iblrepresentation of the earth as possible.Image Enhancement - optimize visual appearance.Image Classification - computer-assisted interpretation of images.Image Transformation - derivation of new imagery as a result of some mathematical g ytreatment of the raw bands.
Operations related to AnalysisDatabase query
ReclassContext operators
SurfaceReclassOverlayAssign
SurfaceFilterGroupAssign
HistogramArea/Perimeter
GroupStatistics
RegressionArea/PerimeterMathematical operators
Overlay
RegressionRandom Numbersothersy
ScalarTransform
Image ProcessingDecision Support
Distance operatorsDistance
Decision Support
BufferCost
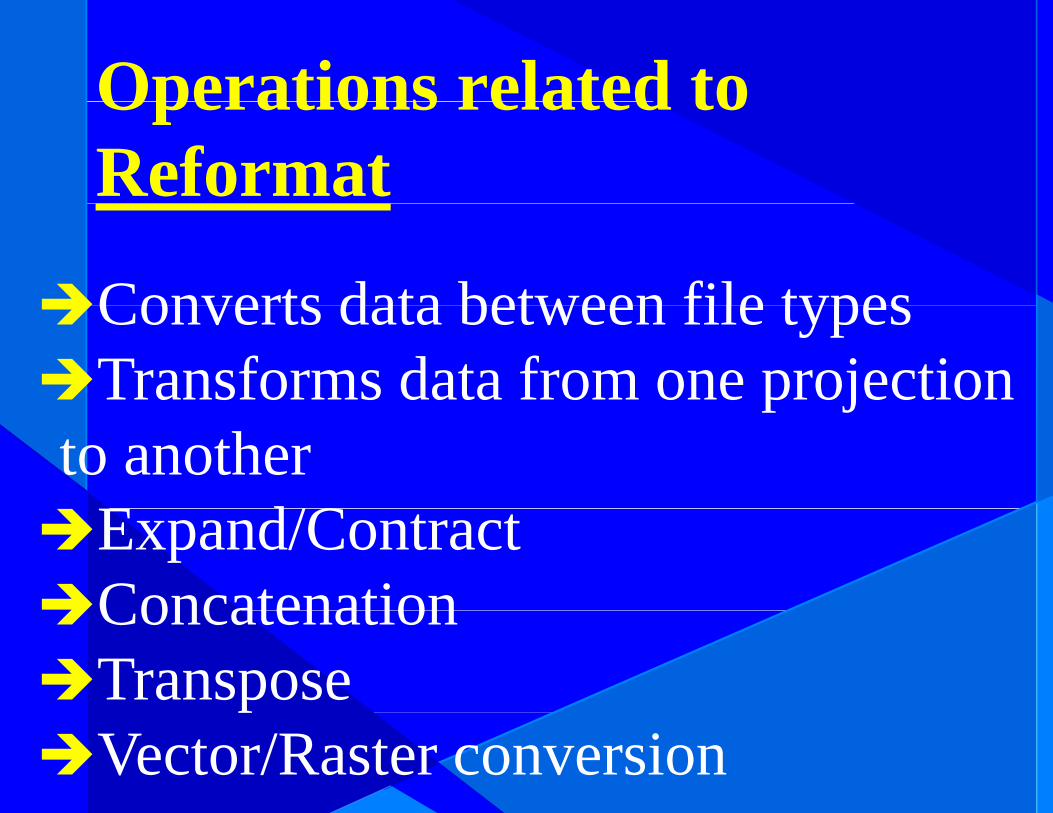
Operations related toOperations related to Reformat
Converts data between file typesConverts data between file typesTransforms data from one projection p j
to anotherE d/CExpand/ContractConcatenationConcatenationTransposepVector/Raster conversion
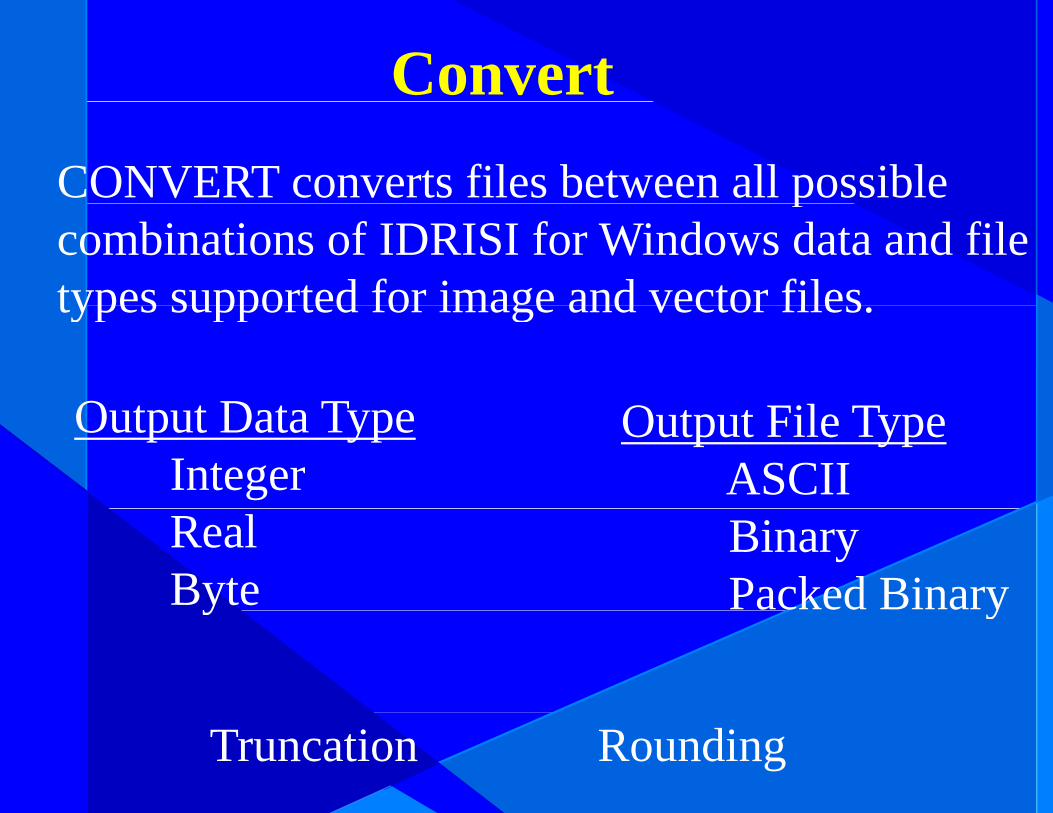
ConvertCONVERT converts files between all possible pcombinations of IDRISI for Windows data and file types supported for image and vector filestypes supported for image and vector files.
O t t D t T O Fil TOutput Data TypeInteger
Output File TypeASCII
RealByte
BinaryPacked Binaryy y
Truncation Rounding

ProjectPROJECT transforms raster images and
ProjectPROJECT transforms raster images and vector files from one grid referencing system
h I d i i d k j ito another. In doing so, it undertakes projectiontransformations using ellipsoidal formulas and g pdatum transformations using either the Molodensky transform process or in the caseMolodensky transform process or, in the case of conversions between NAD27 and NAD83 within the continental US, the US National Geodetic Survey's NADCON procedureGeodetic Survey s NADCON procedure.

Expand/ContractpEXPAND enlarges the resolution of an imagthrough pixel duplication, with a user specified increasespecified increase.
CONTRACT li i bCONTRACT generalizes an image by reducing the number of rows and columns gwhile simultaneously decreasing the cell resolution Contraction may take place byresolution. Contraction may take place by pixel thinning or pixel aggregation, with the contraction factors in X and Y being independently defined

Concatenate
CONCAT allows the pasting together of images to form a largertogether of images to form a larger one.

TTranspose
TRANSPOS systematically interchanges i l i i i IDRISI f Wi dpixel positions in IDRISI for Windows
images. Using TRANSPOS it is possible to g g preverse the order of rows or columns, or
t t th i 90 d l k irotate the image 90 degrees clockwise or counterclockwise. This module can be used, for example, to rotate an image for viewing with ORTHOwith ORTHO.
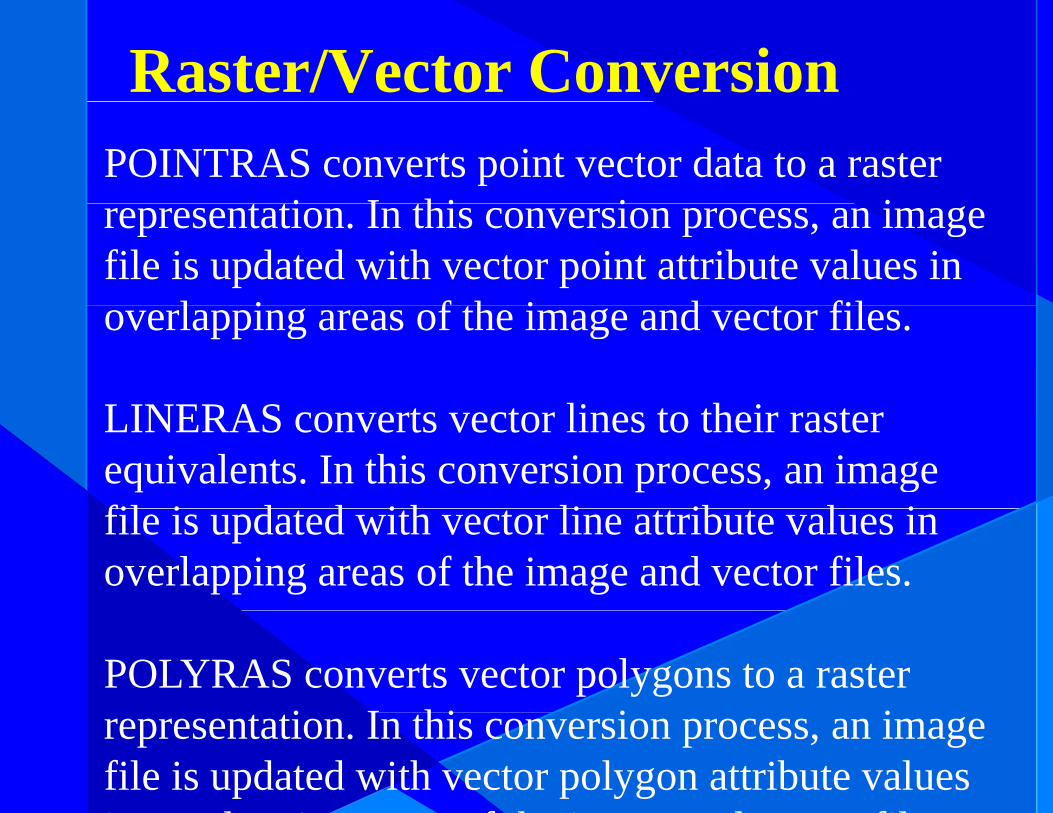
Raster/Vector ConversionPOINTRAS converts point vector data to a raster
t ti I thi i irepresentation. In this conversion process, an image file is updated with vector point attribute values in
l i f th i d t filoverlapping areas of the image and vector files.
LINERAS li h iLINERAS converts vector lines to their raster equivalents. In this conversion process, an image fil i d d i h li ib l ifile is updated with vector line attribute values in overlapping areas of the image and vector files.
POLYRAS converts vector polygons to a raster i I hi i irepresentation. In this conversion process, an image
file is updated with vector polygon attribute values i l i f h i d fil
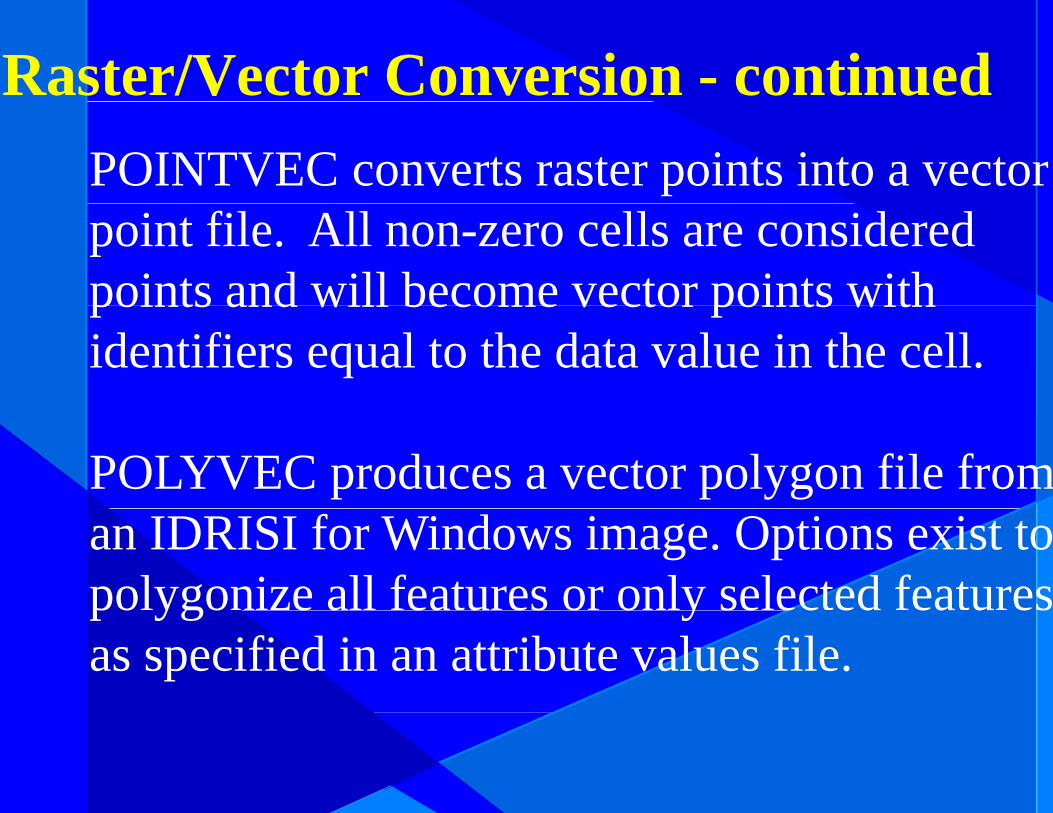
Raster/Vector Conversion - continuedPOINTVEC converts raster points into a vector point file. All non-zero cells are considered points and will become vector points withpoints and will become vector points with identifiers equal to the data value in the cell.
POLYVEC produces a vector polygon file froman IDRISI for Windows image. Options exist topolygonize all features or only selected featurespo ygo e a ea u es o o y se ec ed ea u esas specified in an attribute values file.
Operations related to pData Entry
EditEditAssigngInitialSurface interpolationUTM referenceUTM referenceDatabase workshopDatabase workshop

EdiEdit
EDIT provides an ASCII text editor for i d di i h i d filcreating and editing the various data files
that are not directly involved with images y gor vector data. ASCII format images and
t fil b dit d ith thi d lvector files can be edited with this module if they are small enough to fit into EDIT's y gbuffer (55k).

AssignASSIGN creates new images by linking the geography of features defined in an image file g g p y gwith attributes defined in an attribute values file. By separating attributes from the geography ofBy separating attributes from the geography of the features which possess them, this module allo s one to se the po er of spreadsheet andallows one to use the power of spreadsheet and data base management packages as an integral part of the IDRISI for Windows system. Only when a map of a particular attribute is required p p qwould ASSIGN be used to create that image. Note also that ASSIGN may be used as a fastNote also that ASSIGN may be used as a fast reclassification module whenever it is known that the image data are integers
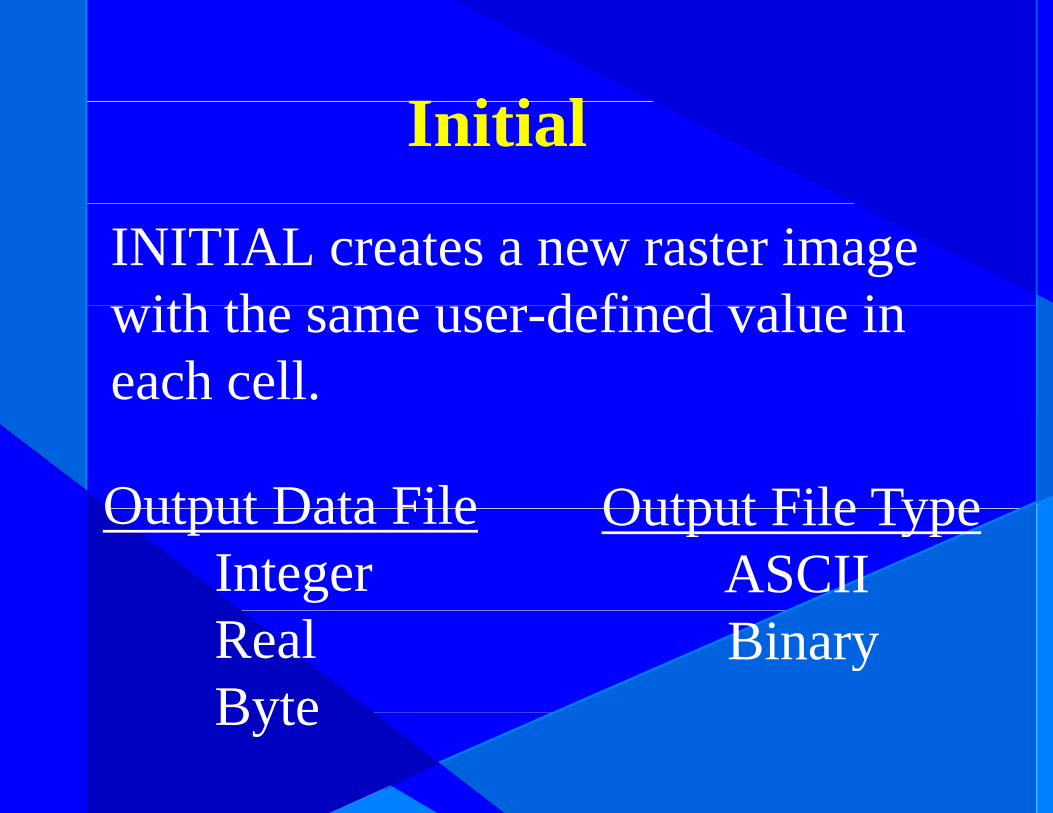
I i i lInitial
INITIAL creates a new raster image ith th d fi d l iwith the same user-defined value in
each cell.
Output Data File Output File TypeOutput Data FileInteger
Output File TypeASCII
RealByte
BinaryByte

Surface InterpolationINTERCON i t l t t Di it l El ti M d l
Surface InterpolationINTERCON interpolates a raster Digital Elevation Model (DEM) from a set of digitized contours. It uses linear i t l ti b t t t d f t d d linterpolation between contours to produce a faceted model that may be subsequently filtered to produce a smooth model.
INTERPOL interpolates a full surface from point data. The i t l ti d b ith di t i ht dinterpolation procedure can be either a distance-weighted average or a potential model.
TREND calculates linear, quadratic and cubic trend surface l i l ti f ti l d t t d i t l tpolynomial equations for spatial data sets, and interpolates
surfaces based on those equations.

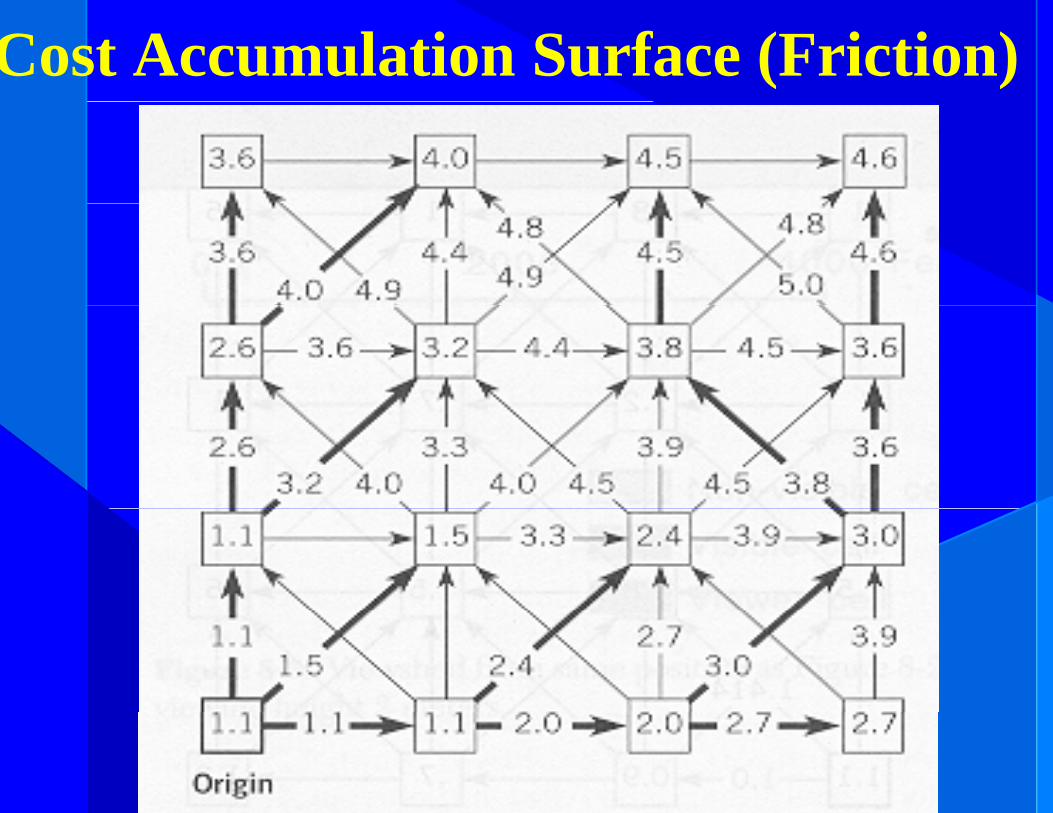
Cost Accumulation Surface (Friction)

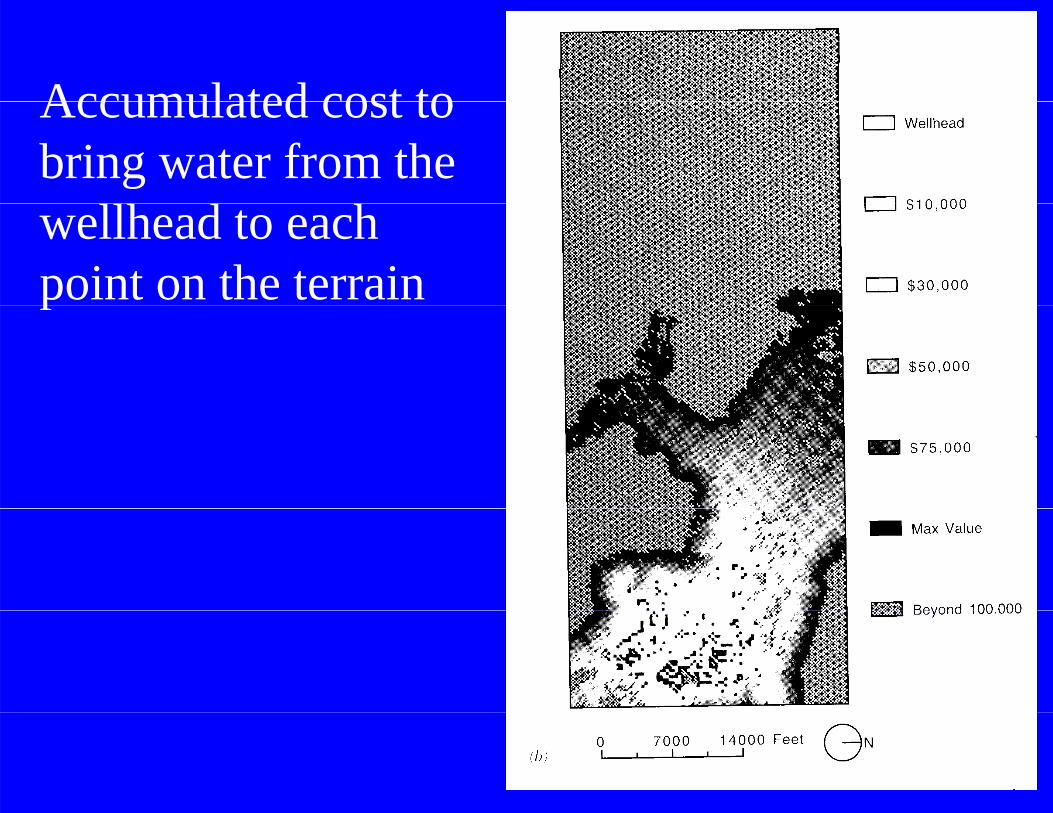
Accumulated cost toAccumulated cost tobring water from the wellhead to eachpoint on the terrainp

A l dAccumulated costfor the constructionof a water pipeline
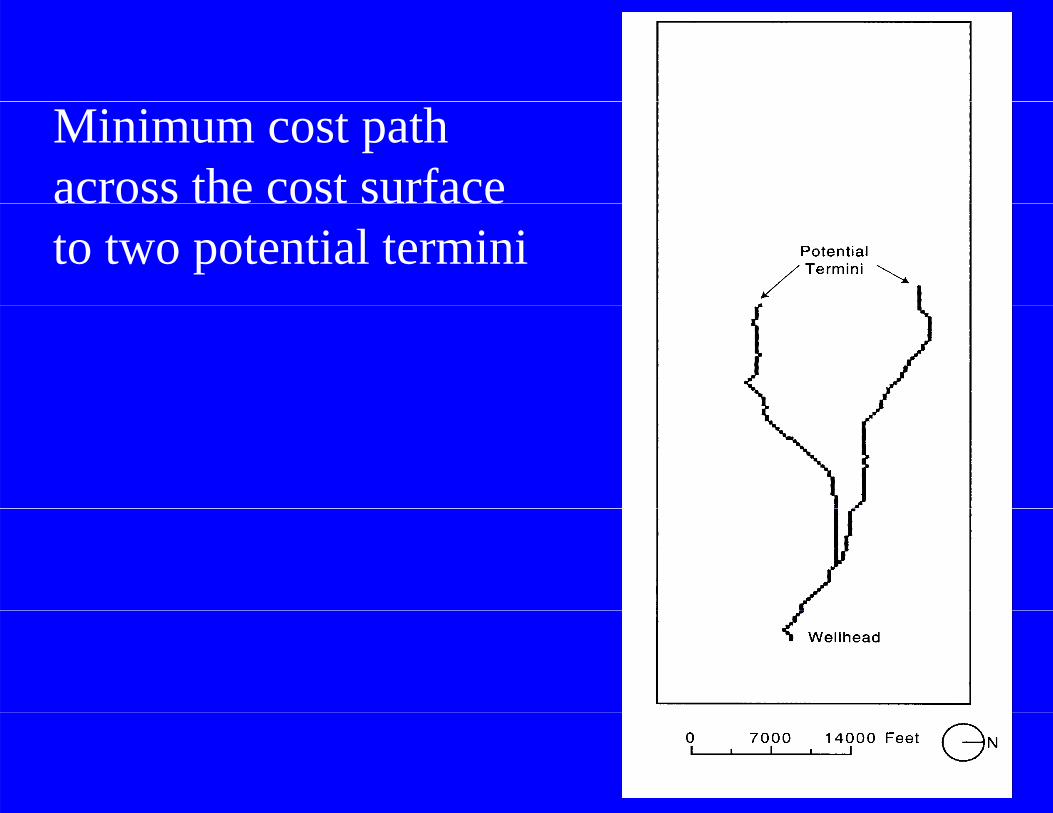
Minimum cost path across the cost surface ac oss e cos su aceto two potential termini

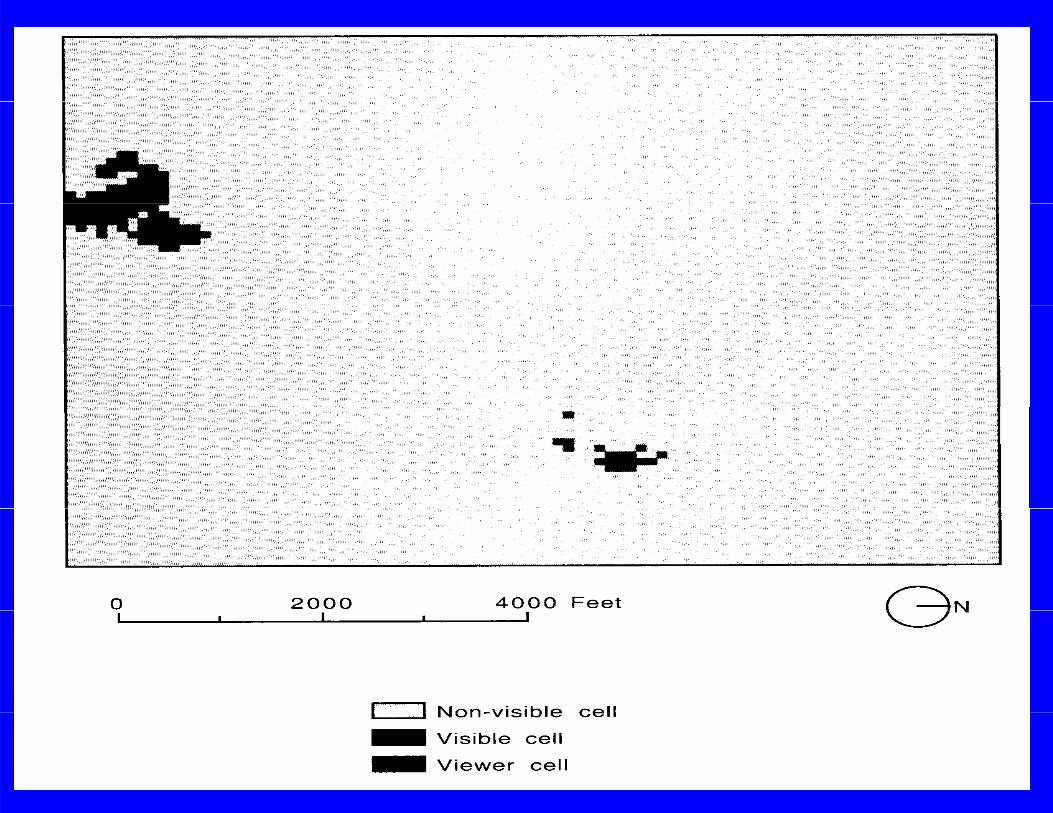
Solving Viewshed from a DEM