osteoarthritis in adults · total (mild, moderate, or severe) osteo arthritis of the hands 3....
TRANSCRIPT

NATIONAL CENTER Series 11 For HEALTH STATISTICS I Number 20
VITAL and HEALTXZ STATISTICS DATA FROM THE NATIONAL HEALTH SURVEY
Os teoarthritis in Adults
by Selected Demographic Characteristics
United States - 19604962
An analysis of differentials by family income, education, marital status, usual activity status, occupation, and industry.
Washington, D.C. November 1966
U.S. DEPARTMENT OF
HEALTH, EDUCATION, AND WELFARE Public Health Service
John W. Gardner William H. Stewart
Secretory Surgeon General
Public Health Service Publication No. 1000~Series 11-No. 20
For sale by the Superintendent of Documents, U.S. Government Printing Office Washington, D.C. 20402 - Price 25 cents

NATIONAL CENTER FOR HEALTH STATISTICS
FORREST E. LINDER, PH.D., Director THEODORE D. WOOLSEY, Deputy Director
OSWALD K. SAGEN, PH.D., Assistant Director WALT R. SIMMONS,M.A., Statistical Advisor
ALICE M. WATERHOUSE,M.D.,M~~~~~~A~~~= JAMES E. KELLY, D.D.s., Dental Advisor
LOUIS R. STOLCIS, M.A., hecdve Officer
;tI. .I ’ ;,. :., .,ari@ DONALD GREEN, information Officer! .L.T
-*I .,-;$:cLL.,,., ‘: . / ,.:;-.,~;r_i:*.r:.,:, . ‘i, “‘I.-jL : ii’.:., ic.‘J d&&&n OF HEALTH EXAMjNATlON STATISTICS
ARTHUR J. MCDOWELL, Chief TAVIA GORDON, Assistant C&f
COOPERATION OF THE BUREAU OF THE CENSUS
In accordance with specifications.established by the National Health Survey, the Bureau of the Census, under a contractual agreement, participated in the design and selection of the sample, and carried out the first stage of the field interviewing and certain parts of the statistical processing.
Public Health Sdrvice Publication No. 1000~Series 11-No. 20
Library of Congress Catalog Card Number 66-62094

----
------------------------------------
CONTENTS Page
Introduction----------------------------------------------------------- 1
Findings -__________-_-______----------------------------------------- 2 Family Income----------------------------------------------------- 2 Education---------------------------------------------------------- 2 ()/=cupation and Industry--------------------------------------------- 2 Usual Activity Stat-s - ______-___--__ - _ _ --_- _ _ _ _ _ _-____-__-_ - ______-_ 5 M,irital Status _-__ -_-_-_-_-__-- _--__---_-- - ____
Discussion ________________________________________-------------------
Summary-------------------------------------------------------------
References-----------------------------------------------------------
Detailed Tables------------------------------------------------------
- __-_ - ___-__-_ - ___-_ (j
6
7
7
8
Appendix I.Demographic Terms--------------------------------------- 22
Al&q&x 11. Statistical Notes _--_-__----- ----_- - --_------_-__--___ 24
me Survey Design------------------------------------------------- 24 Reliability--------------------------------------------------------- 24
Sampling and Measurement Error 24 Expected Values--------------------------------------------------- 27 Small Numbers---------------------------------------------------- 27 Tests of Significance _--_ - _--__ -_ _-__----__----__--__------ _________ 27

1 IN Th?lS REPORT findings aye presented on the prevalence of osteoarthritis (04 obtained from Cycle I of the Health Examination Survey. Cycle I consists of examinations of a nationwide probability sample of persons 18-79 years of age selected porn the U.S. civilian, noninstitutional population.
This report examines the relationship of the prevalence of OA to the demopaphic variables of family income, education, marital status, usual activity status, occupation, and industry. Among the differentials noted weye higher than expected OA prevalence for men employed as craftsmen and in the mining and construction industry.
SYMBOLS
Data not available ________________________ ___
Category not applicable------------------- . . .
Quantity zero---------------------------- -
Quantity more than 0 but less than O-05---- 0.0
Figure does not meet standards of *reliability or precision------------------

OSTEOARTHRITIS IN ADULTS BY SELECTED DEMOGRAPHIC CHARACTERISTICS
Arnold Engel, M.D., Division of Health Examinution Statistics
Thomas A. Burch, M.D., Institute of Arthritis and Metabolic Diseases, National Institutes of Health
INTRODUCTION
Degenerative joint disease, usually called osteoarthritis or osteoarthrosis, is a common progressive disorder characterized pathologically by deterioration of cartilage around the joint or a bony overgrowth in that region. The sites most frequently affected are the terminal joints of the hands and feet although involvement of the spine, hips, elbows, wrists, ankles, knees, and other joints is not uncommon. Osteoarthrosis is not a new disease for definite cases have been noted in Neanderthal man, Egyptian mummies, and in prehistoric American Indian remains.
This is one of a series of reports describing and evaluating the plan, conduct, and findings of the first cycle of the Health Examination Survey. The Health Examination Survey (HES) was organized to draw samples of the population and by medical examinations and with various tests and measurements to undertake to characterize the population under study.
The first goal of the Health Examination Survey was to examine a nationwide probability sample of the civilian, noninstitutional population aged 18-79 years and to obtain information on the prevalence of cardiovascular diseases and certain other chronic diseases, on dental health, and on the distribution of a number of anthropometric and sensory characteristics. Altogether 6,672 of a sample of 7,710 persons were examined in the first survey, which began in October 1959 and ended in December 1962. These sample persons
were given a specially designed standardized examination, which lasted about 2 hours, by medical and other staff members of the survey in custom-built mobile clinics.
This report continues the presentation of data on osteoarthritis (OA). The first report on this subject described the techniques of measurement of osteoarthritis, its prevalence, and the distribution of the disorder in the population according to age, sex, race, geographic area, and by population size.l The reader may refer to that report for detailed information on the procedure employed for establishing a diagnosis of osteoarthritis. Table 1 summarizes rates by age, sex, and severity for OX of the hands and feet. Descriptions of the general plan and the sample population have been published in previous reports which provide a general background for all reports of findings.2T3
At the 1961 symposium for the epidemiology of chronic rheumatism in Rome it was generally agreed that X-ray evidence is at present the most reliable in assessing the diagnosis of osteoarthritis.* The diagnosis of osteoarthritis used in the survey is based solely on X-ray evidence. Standards for the diagnostic criteria and the content of the examination for osteoarthritis used in the survey were those recommended by the late Dr. Joseph J. Bunin, Clinical Director of the National Institute of Arthritis and Metabolic Diseases. The grading of X-rays for arthritis was performed at the Institute under his direction.

In the examination, X-rays were taken of both the hands and feet of the subject. The degree of osteoarthritis found was divided into the following five grades:
None 0 Moderate 3 Doubtful 1 Severe 4 Minimal 2
Grade 0 thus indicated a definite absence of X-ray changes of osteoarthritis and grade 2 that osteoarthritis was definitely present but of minimal severity.
FINDINGS
In the discussions that follow, the population is classified in a variety of ways-by family income, education, marital status, usual activity status, occupation, and industry-and the prevalence of osteoarthritis in different groups is compared. If the population is classified by family income, for example, the prevalence of osteoarthritis in different income groups is examined to determine whether or not prevalence rates vary from one income group to another. In making these comparisons, allowance must be made for the differences of people by age and sex since the prevalence of osteoarthritis varies by age and sex. Because the sampling variability of age-sex-specific values for any group is uually large, a summary comparison by sex was thought preferable to the presentation of prevalence rates specific by age and sex. For this reason, the actual prevalence rate for each group is compared with an expected rate. The expected value of a particular group is obtained by weighting age-sex-specific rates for the total United States by the age-sex distribution for that group. The obvious meaning can be attached to differences between actual and expected rates with the under-standing that differences may arise by chance. A positive difference, for example, indicates that the prevalence rate for the group is higher than expected. Alternatively the data can be presented as a ratio of actual to expected rates. If the ratio is greater than 1.0 the actual rate is higher than expected. If the ratio is less than 1.0 the actual rate is lower than expected. In general, where there is no statistically significant difference between the actual and expected values for a
group, differences for individual age-sex groups exhibit only random fluctuations.
Prevalence rates for each of the demographic characteristics dealt with in this report were tabulated for the following five categories:
1. Moderate or severe osteoarthritis of the hands
2. Total (mild, moderate, or severe) osteoarthritis of the hands
3. Moderate or severe osteoarthritis of the feet
4. Total (mild, moderate, or severe) osteoarthritis of the feet
5. Total osteoarthritis (hands and/or feet)
For the convenience of the reader and for ready reference table A provides all the statistically significant findings in outline form.
Family Income
For moderate or severe osteoarthritis of the hands there was a lower than expected prevalence in women with a family income of $7,000-$9,999 (table 2).
There was a significantly lower than expected prevalence of moderate or severe osteoarthritis of the feet in men with annual family incomes greater than $10,000 and in women with incomes of less than $2,000 (table 3). There were no significant differences by family income of osteoarthritis of the hands and feet (table 4).
Education
There are no statistically significant differences between actual and expected prevalence rates by amount of schooling (tables 5-7). This fact does not preclude the existence of differences by education and merely shows any differences which exist either to be small or to have exhibited too large a variance to be statistically significant.
Occupation and Industry
Men employed as craftsmen had higher than expected rates for total osteoarthritis of the hands and for total osteoarthritis of the hands and/or
2

-------------------------------------
Table A. Significant differences in prevalence of osteoarthritis, by severity and siteof the disease and selected characteristics: United States, 1960-62
Total Moderate Moderate OA of Total or Total or
Characteristic hands OA of severe OA of severe and/or hands OA of feet OA of
feet hands feet
MEN-ELEVATEDPREVALENCE
Occupation Craftsmen, foremen, andother kindred workers----------------------
Industry Mining and construction---------------------
Marital status Widowed
MEN-LOWPREVAIENCE
Family income $10,000 and over----------------------------
Occupation Clerical and sales workers------------------Private household and service workers-------
Industry Transportation, communications,public utilit=es-----------------------------and other
Finance, insurance, and real estate---------
Usual activity status Other (students, unemployed, etc.)----------
Marital status Never married-------------------------------
Limitation of activity
Limited in kind or amount of major activity-
WOMEN-LOWPREVALENCE
Family income Under $2 OOO-------------------------------$7,000-$4,ggg-------------------------------
Industry
Agriculture, forestry, and fisheries--------
Usual activity status Other---------------------------------------
Marital status Never married------------------------------
+
+
+
+
+
+
+
3

feet (tables 8-10). In men, lower than expected rates of moderate or severe osteoarthritis of the hands were present for clerical workers and for private household and service workers (table 8 and fig. 1).
Lower than expected prevalence rates were present for moderate or severe osteoarthritis of the hands in men employed in finance and real estate (table 11 and fig. 2) and for moderate or severe osteoarthritis of the feet in men employed
RnTlO OF nCTU*L TO EXPECTED
0 0.5 1.0 15 2.0 I I I I
Occupation
Professional, tschnlcol, and monoperlal,,..............
Former5 and farm managers ..,.............,,.,,...,.,
Clerlcol and soles warkers,
Craftsmen foremen, ond kindred workers
Prlvoie household and sewIce workers
Farm and other laborers (except mine)
Figure I. Excess of actual over expected prevalence of moderate or severe osteoarthritis in men, by site (hands or feet) and occupation.
in transportation, communications, and other public utilities (table 12 and fig. 2). Men employed in mining and construction had a distinctly higher than expected prevalence of total osteoarthritis of the hands and/or feet (table 13).
Women employed in agriculture, forestry, and fisheries had a lower than expected prevalence rate for total osteoarthritis of the feet (table 12).
The classification schemata employed by the HES for occupation and industry involves the amalgamation of a wide variety of occupations
RATIO OF ACTUAL TO EXPECTED
7 o/5 I/O I.7 ZiO
Industry
I.21 Agriculture, forestry, ond
fisheries
Mlnlng and construction,,..~ 1’75
Wholesale and retail trOd.3 .,,,,,,..,,,..,.....,..,............ 1.35
Flnance.insuronce. and 1 O.O
Service and miscellaneous
Government
Figure 2. Excess of actual over expected prevalence of moderate or severe osteoarthritis in men, by site (hands or feet) and industry.
4
1.91

into a small number of broadgroups. Occupations within each group may vary widely in regard to amount of physical activity, type of physical activity, liability to injury, and environmental working conditions. Therefore any conclusions drawn from HES data apply only to these broad groupings. It is quite likely that more pronounced effects of occupation on osteoarthritis may exist for certain specific occupational tasks involving either unusual use or reported trauma.
In a survey of rheumatism in miners and other workers carried out in Manchester, England in 1350 osteoarthritis of the knees was found to be five times as common in the underground workers as in the office staff. Light manual workers had a;l intermediate prevalence of osteoarthritis of the knees but there was no significant difference between this prevalence and that of the office staff. Osteoarthritis of the elbows was also found to be more frequent in miners. This was especially true for those who had used a pneumatic drill although the difference in rates between miners who had used a drill for more than a year and those who had not drilled was not statistically significant (probably due to small sample size). a
In a later English survey of rheumatism in cotton operatives, radiological evidence of osteoarthritis was found to be more frequent in the distal and proximal interphalangeal joints of the fingers and in the carpometacarpal joints of the male cotton workers. In the metacarpophalangeal joints of the fingers, the male cotton workers had much the same prevalence of osteoarthritis as the controls but it was more severe. Osteoarthritis in other joints showed much the same prevalence in cotton operatives as in the controls. Lawrence stated that skilled cotton operatives used their fingers continuously and rapidly and the joints may have been subjected to continuous minor trauma as for example knocking against frames and bobbins.6
Bauer and Bennett compared the roentgenographic appearance of symmetrical joints in humans who subjected one joint to constant use or unusual trauma and noted marked differences be-tween the two joints. For example roentgenograms of onp patient revealed extensive arthritic changes with loose-body formation in the right knee where-as the? left knee showed very minimal changes.
This patient had operated a treadle machine for 30 years. In doing so she was required to flex and extend her right knee hundreds of times a day thereby subjecting this joint to unusual use for 30 years.7
In another report, arthritis of the fingers WAS cited as a common clinical finding in diamond cutters.8
The occupational groups with elevated prevalence of osteoarthritis noted-in the previously cited studies were all groups in which varying degrees of more than usual stress were applied to particular joints. In the HES likewise the two male groups with elevated osteoarthritic preval~ice {craftsmen, foremen, and kindred workers and persons employed in mining and construction) undoubtedly had an increased proportion of men with particular joints subjected tomore than usual stress. As noted previously only a certain portion of the two HES groups were probably engaged in occupations which actually exposed their joints to unusual use or repeated trauma. It is likely thst a more pronounced elevation in prevalence of osteoarthritis may have been present for those men in the two groups whose occupations involved unusual stress to joints.
In regard to occupational data it is necessary to consider the importance of health status and in particular osteoarthritis as a factor involved in change of occupation or retirement. A change in health status due to osteoarthritis might lead to retirement or to shifting the employee over to a “light job” in the same or in a different industry. Due to the paucity of symptoms in most cases of osteoarthritis ’ it is likely that changes in occupation due to osteoarthritis are relatively infrequent.
Usual Activity Status
Usual activity as classified by the HES is broken down into four categories, i.e., usually working, keeping house, retired, .and “other.” The group classified as “other” refers mainly to students and to those unemployed persons still looking for work. Both men and women in this group had lower than expected prevalence rates for moderate or severe osteoarthritis of the hands (table 14). Men belonging to this group also had lower than expected prevalence for total osteo-
5

arthritis of the feet (table 15). No significant differences were found if osteoarthritis of the hands and/or feet was considered (table 16). Lower rates of osteoarthritis occurring in the “other” usual activity group provided another indication of the association of employment with osteoarthritis.
Marital Status
Both men and women who had never married had a significantly lower prevalence of moderate or severe osteoarthritis of the hands than expected (table 17), but not of the feet (table 18). Widowers had a greater than expected prevalence of osteoarthritis of the hands and/or feet (table 19). It should be noted that the prevalence patterns for all five marital status categories for moderate or severe osteoarthritis of the hands are similar for men and women (table 17 and fig. 3).
DISCUSSION Mechanical stress due to occupation probably
affects only the joints to which it is applied and not others. This suggestion is borne out by the report by Lawrence 6 of elevated prevalence of osteoarthritis in male cotton workers only in the joints in constant use. Bennett andBauer’s observation of asymmetrical osteoarthritis in cases where only one joint was exposed to continual stress provides another source of confirmation of this hypothesis. It can also be seen in the HES (figs. 1 and 2) that in any particular occupational or industrial group an increase in the prevalence of moderate or severe osteoarthritis of the hands may be accompanied by a decrease in osteoarthritis of the feet or vice versa.
Failure in finding any significant elevations in different occupational groups in women (HES) may be the result of a relatively fewer number of occupations for women than for men that provide unusual stress to the joints. It might be mentioned that in 14 women craftsmen a prevalence of 68 percent for total osteoarthritis of the hands and/ or feet was found against an expected prevalence of 41 percent. This group is of course too small for any statistical reliability. Lawrence’ did not find any significant elevation prevalence of OA in female cotton workers as compared withcontrols
RATIO OF ACTUAL TO EXPECTED
0 0.5 1.0 1.5 2.0
I I I I I
*
Morried
Widowed
Divorced
Separated 1.56
Never marrled
Women
Married
Widowed
Divorced
Seporofed
NWW married
Figure 3. Excess of actual over expected prevalence of moderate or severe osteoarthritis of the hands in adults, by marital status.
in contrast to an elevation found in male cotton workers. The same authorlo in his studies of the genetics of osteoarthritis postulated the presence of two factors. One factor predisposes to the development of “primary” multiple osteoarthritis associated with Heberden’s nodes and the other to an inflammatory polyarthritis which eventually results in osteoarthritis of multiple joints but without special predilection for the terminal joints of the fingers. Lawrence stated that both factors probably operate more importantly in the female. Stecherlr has shown that Heberden’s nodes are inherited as a single autosomal gene dominant in females and possibly recessive in males. Thus an increased importance of multiple osteoarthritis in females genetically determined may serve to minimize the apparent effect of occupation on particular joints.
Finally as a comment on the low rates for moderate or severe osteoarthritis of the hands in unmarried men and women, it is possible to
6

speculate that this may be the result of the lack of repetitive household tasks involving some risk of minor trauma. Thus the expression “working my fingers to the bone” may possibly be true literally as well as figuratively.
SUMMARY Women with family incomes less than $2,000
had lower than expected rates for moderate or severe osteoarthritis (Oil) of the feet. Lower than expected rates for moderate or severe OX hands were present for women with family in-comes of $7,OOO-$9,999. Men with incomes of $10,000 and over had lower than expected rates for moderate or severe OA feet.
There was no pattern of prevalence associated with education. Male craftsmen and foremen and kindred workers had higher than expected rates for total OA hands and for total OA hands and/ or feet. Men employed in mining andconstruction
had higher than expected rates for total Ot\ hands and/or feet. Men employed as clerical and sales workers, private household and service workers, and those employed in finance, insurance and real estate had lower than expected rates for moderate or severe Oh hands. Men employed in transportation, communication, and other public utilities had lower than expected rates for moderate or severe OA feet while women employed in agriculture, forestry, and fisheries had lower than expected prevalence for total OA feet.
Both men and women whose usual activity status was other than working, keeping house or retired had lower than expected rates of moderate or severe OA hands while men in this group also had lower rates for total OA feet.
Both men and women who had never been m.lrried had lower than expected prevalence for moderate or severe OA hands. Widowers had higher than expected rates for total Oii hands and/or feet.
REFERENCES
1National Center for Health Statistics: Prevalence of osteoarthritis in adults by age, sex, race, and geographic area, United States, 1960-1962. Vital and He&h &%tistics. PHS Pub. No. lOOO-Series 1 l-No. 15. Public Health Service. Washington. U.S. Government Printing Office, June 1966.
2National Center for Health Statistics: Plan and initial program of the Health Examination Survey. Vital und Health Statistics. PHS Pub. No. 1000Series l-No. 4. Public Health Service. Washington. U.S. Government Printing Office, July 1965.
3National Center for Health Statistics: Cycle I of the Health Examination Survey, sample and response, United States, 1960-1962. Vital und Health Statistics. PHS Pub. No. 1000Series ll-No. 1. Public Health Service. Washington. U.S. Government Printing Office, Apr. 1964.
?L. sine, V. A.: International standardization of the diagnosis of rheumatoid arthritis and osteoarthritis, clinical aspects. Milbunk zMem.Fund.Quart. XLIII(2):133-141, Apr. 19.65.
‘Lawrence, J. S.: Rheumatism in coal miners. Part HI: Occupational factors. Brit.J.Indust.hfed. 12(3):%&g-261, July 1955.
‘Lawrence, J. S.: Rheumatism in cotton operatives. Brit.J.lndusf.,Med. 15(4):270-276, Oct. 1961.
7 Bauer, W., and Bennett, G.: Experimental and pathological studies in the depenerati\ e type of arthritis. J.Bone d Joint Sure. 18:1-I& Jan. 1936.
%‘an Brieman, J. and Tempelaar, H. C. G.: Rheumatism and occupation. dcto rheumaf.dmsferdam. 4:36, 1932.
9Colb, S., Ilerchant, W., and Rubin, T.: The relation of symptoms to osteoarthritis. J.Chrunic Dis. .5(2):197-201, Feb. 1957.
l’Coperman, W. S. C., ed.: Textbook of the Rheumatic Diseuaes. Edinburgh and London, E. and S. Livingston, Ltd., 1964.
l?Stecher, R. M.: Heberden’s nodes. A clinical description of osteo-arthritis of the finger joints. dnn.Rheumu8.Di.s. 14(1):1-10, hiar. 1955.
7

-----------------------------------------------------------------------
DETAILED TABLES
Page
Table 1. Prevalence rates of osteoarthritis in adults showing severity of disease, by sex, site, and age: United Stat-s, 1960-62-------------------------------------- 9
2. Actual and expected prevalence rates of osteoarthritis of the hands in adults,t;g6;e;;rity and site of the disease, sex, and family income: United States,
- -_------------_---------------------------------------------------------- 10
3. Actual and expected prevalence rates of osteoarthritis of the feet in adults, byseverity and site of the disease, seqand family income: United States,1960-62-- 10
4. Actual and expected prevalence rates of osteoarthritis of the hands and/or feet in adults, by sex and family income: United States, 1960-62--------------------- 11
5. Actual and expected prevalence rates of osteoarthritis of the hands in adults,by severity and site of the disease, sex, and education: United States, 1960-62- 11
6. Actual and expected prevalence rates of osteoarthritis of the feet in adults, byseverity and site of the disease, sex, and education: United States, 1960-62---- 12
7. Actual and expected prevalence rates of osteoarthritis of the hands and/or feet in adults, by sex and education: United States, 1960-62------------------------- 12
8. Actual and expected prevalence rates of osteoarthritis of the hands in adults,by severity and site of the disease,sex,and occupa.tion: United States, 1960-62-- 13
9. Actual and expected prevalence rates of osteoarthritis of the feet in adults, byseverity and site of the disease, sex, and occupation: United States, 1960-62--- 14
10. Actual and expected prevalence rates of osteoarthritis of the hands and/or feet in adults, by sex and occupation: United States, 1960-62------------------------ 15
11. Actual and expected prevalence rates of osteoarthritis of the hands in adults,by severity and site of the disease, sex, and industry: United States, 1960-62-- 16
12. Actual and expected prevalence rates of osteoarthritis of the feet in adults, byseverity and site of the disease, sex, and industry: United States, 1960-62----- 17
13. Actual and expected prevalence rates of osteoarthritis of the hands and/or feet in adults, by sex and industry: United States, 1960-62-------------------------- 18
14. Actual and expected prevalence rates of osteoarthritis of the hands in adults,by severity and site of the disease, sex, and usual activity status: United
18States, 1960-62-----------------------------------------------------------------
15. Actual and expected prevalence rates of osteoarthritis of the feet in adults, byseverity and site of the disease, sex, and usual activity status: United States1960-62------------------------------------------------------------------------~ 19
16. Actual and expected prevalence rates of osteoarthritis of the hands and/or feet in adults, by sex and usual activity status: United States, 1960-62-----'-------- 19
17. Actual and expected prevalence rates of osteoarthritis of the hands in adults,FS;6;e;;rtty and site of the disease, sex, and marital status: United States,
- - 20
18. Actual and expected prevalence rates of osteoarthritis of the feet in adults, byseverity and site of the disease, sex, and marital status: United States
201960-62------------------------------------------------------------------------~
19. Actual and expected prevalence rates.of osteoarthritis of the hands and/or feet in adults, by sex and marital status: United States, 1960-62-------------------- 21

Table 1. Prevalence rates of osteoarthritis in adults showing severity of disease, by sex, site,and age: United States, 1960-62
Total Mild Moderate
Site and age I or severe
Men Women Men Women Men Women
Hands and feet Rate per 100 adults
Total, 18-79 years------------ 37.4 37.3 31.2 26.3 6.2 11.0
18-24 years------------------------- 7.2 1.6 7.2 1.6 25-34 years------------------------- 13.6 6.2 13.5 6.2 0.1 35-44 years------------------------- 30.2 19.6 29.2 18.1 1.0 1.5 45-54 years------------------------- 47.0 46.3 43.9 39.3 3.1 7.0 55-64 years------------------------- 63.2 75.2 48.4 49.5 14.8 25.3 65-74 years------------------------- 75.8 84.7 51.0 47.c 24.8 37.7 75-79 years------------------------- 80.9 89.8 47.7 35.9 33.2 53.9
H&S
Total, 18-79 years------------ 29.4 30.4 24.1 20.5 5.3 9.9
18-24 years--------------------------- 2.8 0.4 2.8 0.4 25-34 years--------------------------- 4.8 2.1 4.7 2.1 0.1 35-44 years------------------------- 17.5 11.3 16.9 10.3 0.6 1.1 45-54 years------------------------- 39.0 34.0 37.1 28.5 1.8 5.5 55-64 years------------------------- 56.6 68.8 44.0 47.3 12.6 21.5 65-74 years------------------------- 71.0 77.1 48.6 40.1 22.4 37.0 75-79 years------------------------- 78.7 88.4 45.5 37.4 33.2 51.0
Feet
Total, 18-79 years------------ 19.8 21.3 18.3 18.4 1.5 2.9
18-24 years------------------------- 4.5 1.2 4.5 1.2 25-34 years------------------------- 9.7 4.4 9.7 4.4 35-44 years------------------------- 17.3 11.2 16.9 10.8 0.4 0.4 45-54 years------------------------- 22.8 25.0 21.3 23.1 1.5 1.9 55-64 years------------------------- 29.0 44.1 25.5 37.2 3.4 6.9 65-74 years------------------------- 40.3 47.1 34.6 38.1 5.8 9.1 75-79 years------------------------- 48.6 53.1 43.8 38.4 4.8 14.6

--------------
--------------
--------------
---------
Table 2. Actual and expected prevalence rates of osteoarthritis of the hands in adults, by severity and site of the disease, sex, and family income: United States, 1960-62
Moderate or severeTotal osteoarthritis of hands osteoarthritis of hands Sex and family income
Ex- Differ- Actual Ex- Differ- ActualActual petted ence Expected ActuaL petted ence Expected 1
Rate per 100 adults
Under $z,OOO--------------- 41.4 42.9 -1.5 0.97 1.03 $2,000-$3,ggg 32.7 32.2 1.02 1.29 $4,000-$6,999-------------- 24.3 24.7 -E 0.98 0.85
7,ooo-$g,ggg-------------- 25.1 23.6 1.06 1.15 $ 10,000 and over----------- 28.9 29.4 -i-5' 0.98 0.88Unknown-------------------- 32.2 31.7 0:5 1.02 0.55
Women
Under $2,000--------------- 43.9 43.7 1.00 18.3 17.3 1.06 $2,000-$3,ggg-------------- 33.1 32.3 :-ii 1.03 10.4 10.5 0.98$&,OOO-$6,999 ____ -me- w_____ 22.7 23.5 -0:s 0.96 6.6 1.04 $7,ooo-$g,ggg-------------- 21.9 24.2 -2.3 0.90 E 7.0 0.64 $10,000 and over----------- 29.4 26.8 1.10 1.11Unknown-------------------- 38.3 37.5 2: 1.02 138:: 1::; 1.03
L
Table 3. Actual and expected prevalence rates of osteoarthritis of the feet in adults, by severity and site of the disease, sex, and family income: United States, 1960-62
Moderate or severeTotal osteoarthritis of feet osteoarthritis of feet Sex and family income
Ex- Differ- Actual Actual petted ence Expected
Men Rate per LOO adults-
Under $2,000--------------- 24.1 26.2 -2.1 0.92 $2,000-$3,ggg 20.4 21.1 -0.7 0.97 2; -0.6 1.01
$4,000-$6,999---------- _-__ 16.3 17.6 -1.3 0.93 0.5 t% $7,ooo-$g,ggg 20.7 17.3 1.20 :+I -0.2 0.82 $10,000 and over----------- 22.3 19.8 4-2 1.13 1:4 -0.8 0.42Unknown-------------------- 19.0 20.5 -1:5 0.93 1.7 1.2 1.68
Women
Under $2,000--------------- 27.9 28.6 -0.7 0.98 3.2 4.7 -1.5 0.67 $2,000-$3,ggg ----" 21.1 22.3 -1.2 0.94 3.0 -0.5 0.83 $4,000-$6,999--------------$7,ooo-$g,ggg--------------
16.7 17.6
17.3 17.8
-0.6 -0.2
0.96 0.99
2; z! -0"-2
1.16 0.83
$10,000 and over----------- 22.1 19.5 2.6 1.13 :*07 2:3 017 1.30Unknown-------------------- 27.8 25.3 2.5 1.10 6:2 3.8 2.4 1.62
10
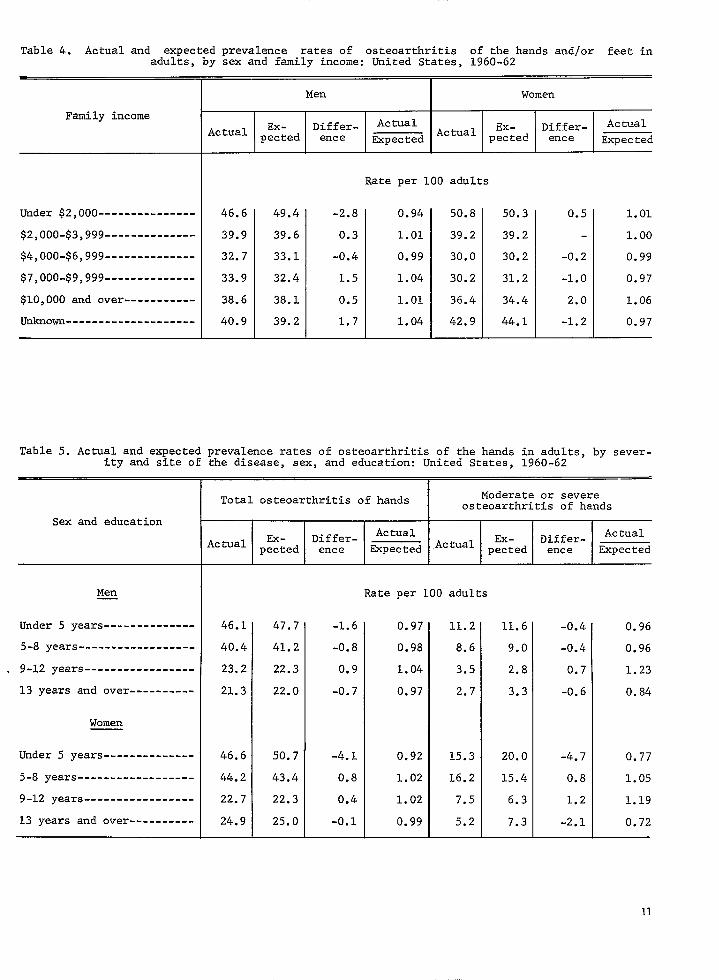
Table 4. Actual and expected prevalence rates of osteoarthritis of the hands and/or feet in adults, by sex and family income: United States, 1960-62
Family income Actual petted
Differ- Actual Ex- Differ- ActualEx- ence Expected Actual petted ence Expected
Rate per 100 adults
Under $Z,OOO--------------- 46.6 0.94 50.8 50.3 0.5 1.01
$2,000-$3,999-------------- 39.9 1.01 39.2 39.2 1.00
$4,000-$6,999-------------- 32.7 0.99 30.0 30.2 -0.2 0.99
$7,000~$9,999~~~~~~~~~~~~~~ 33.9 1.04 30.2 31.2 -1.0 0.97
$10,000 and over----------- 38.6 1.01 36.4 34.4 2.0 1.06
Unknown-------------------- 40.9 1.04 42.9 44.1 -1.2 0.97
Table 5. Actual and expected prevalence rates of osteoarthritis of the hands in adults, by severity and site of the disease, sex, and education: United States, 1960-62
Moderate severeTotal osteoarthritis of hands osteoarthritis or
of hands Sex and education
Ex- Actual .Actual petted Expected
Men Rate per 100 adults
Under 5 years-------------- 46.1 47.7 -1.6 0.97 11.2 11.6 -0.4 0.96 5-8 years------------------ 40.4 41.2 -0.8 0.98 8.6 9.0 -0.4 0.96
. g-12 years----------------- 23.2 22.3 0.9 1.04 3.5 2.8 0.7 1.23
13 years and over---------- 21.3 22.0 -0.7 0.97 2.7 3.3 -0.6 0.84
Women
Under 5 years-------------- 46.6 50.7 -4.1 0.92 15.3 20.0 -4.7 0.77 5-8 years------------------ 44.2 43.4 0.8 1.02 16.2 15.4 0.8 1.05 9-12 years----------------- 22.7 22.3 0.4 1.02 7.5 6.3 1.2 1.19
13 years and over---------- 24.9 25.0 -0.1 0.99 5.2 7.3 -2.1 0.72 c
11
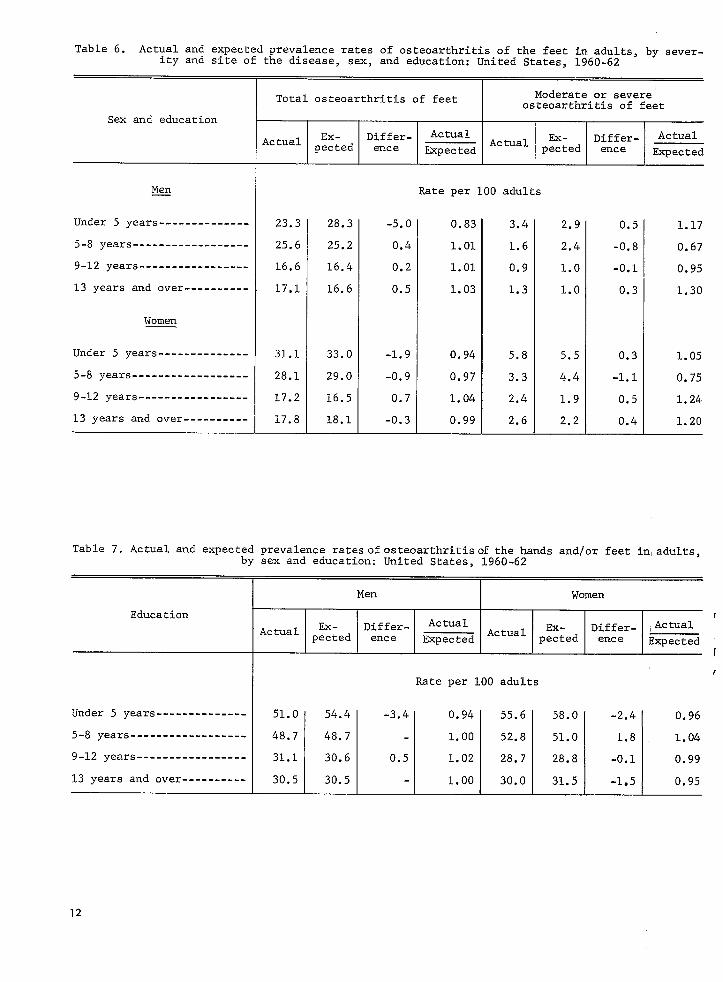
Table 6. Actual and expected prevalence rates of osteoarthritis of the feet in adults, by severity and site of the disease, sex, and education: United States, 1960-62
Moderate or severeTotal osteoarthritis of feet osteoarthritis of feet Sex and education
[
Men-
Under 5 years-------------- 23.3 28.3
5-8 years------------------ 25.6 25.2
9-12 years----------------- 16.6 16.4
13 years and over---------- 17.1 16.6
Women
Under 5 years-------------- 31.1 33.0
5-8 years------------------ 28.1 29.0
9-12 years----------------- 17.2 16.5
13 years and over---------- 17.8 18.1
-5.0
0.4
0.2
0.5
-1.9
-0.9
0.7
-0.3
Rate per 100 adults
0.83 3.4 2.9 0.5 1.17
1.01 1.6 2.4 -0.8 0.67
1.01 0.9 1.0 -0.1 0.95
1.03 1.3 1.0 0.3 1.30
0.94 5.8 5.5 0.3 1.05
0.97 3.3 4.4 -1.1 0.75
1.04 2.4 1.9 0.5 1.24
0.99 2.6 2.2 0.4 1.20
Table 7. Actual and expected prevalence ratesofosteoarthritisof the hands and/or feet in,adults, by and education: United States, 1960-62sex
Education ktual Ex-petted
Differ-ence
Actual Expected Actual Ex-petted
Differ-ence
,Actual Expected
I
I ,
Rate per 100 adults
Under 5 years--------------
5-8 years------------------
9-12 years-----------------
13 years and over----------
51.0
48.7
31.1
30.5
54.4
48.7
30.6
30.5I -3.4
0.5
0.94 55.6 58.0
1.00 52.8 51.0
1.02 28.7 28.8
1.00 30.0 31.5
-2.4
1.8L-0.1
-1.5
0.96
1.04
0.99
0.95
12

-------------------
-Table 8. Actual and expected prevalence rates of osteoarthritis of the hands in adults, by severity and site of
Ithe disease, sex, and occupation: United States, 1960-62
Moderate severeTotal osteoarthritis of hands osteoarthritis or
of hands Sex and occupation
Ex- ence Expected Actual petted ence Expected
Rate per 100 adults
Professional, technical,and managerial------------ 27.0 27.0 1.00 2.6 3.5 -0.9 0.74
Farmers and farm managers-- 40.8 40.6 0.2 1.01 9.1 6.9 2.2 1.32
Clerical and sales workers- 20.4 24.5 -4.1 0.83 1.6 3.2 -1.6 0.52
Craftsmen, foremen., and kindred workers----------- 29.6 25.8 3.8 1.15 5.2 3.3 1.9 1.58
Ogr;:vses and kindred 19.9 20.3 -0.4 0.98 2.4 2.0 0.4 1.19
Private household and service workers----------- 24.4 29.0 d.6 0.84 1.9 4.4 -2.5 0.43
Actual petted Differ- Actual
Ex- Differ- Actual
Farm and other laborers(except mine)------------- 24.5 24.7 -0.2 0.99 2.9 3.2 -0.3 0.92
Women
Professional, technical,and managerial------------ 29.5 27.1 2.4 1.09 6.8 6.5 0.3 1.05
Clerical and sales workers- 20.4 21.1 -0.7 0.97 4.6 4.8 -0.2 0.97
Operatives and kindredworkers------------------- 28.0 25.6 2.4 1.09 6.4 6.4 1.00
Private household and service workers----------- 26.4 29.7 -3.3 0.89 9.0 8.3 0.7 1.08
13

Table 9. Actual and expected prevalence rates of osteoarthritis of the feet in adults, by'severity and site of the disease, sex, and occupation: United States, 1960-62
Moderate severeTotal osteoarthritis of feet osteoarthritis or
of feet Sex and occupation
Men Rate per 100 adults-
Professional, technical,and managerial------------ 18.2 19.5 -1.3 0.93 1.5 1.2 0.3 1.21
Farmers and farm managers-- 22.4 26.2 -3.8 0.85 2.6 2.3 0.3 1.11
Clerical and sales workers- 20.7 18.2 2.5 1.14 2.3 1.1 1.2 1.99
Craftsmen, foremen, and kindred workers----------- 20.2 18.7 1.5 1.08 0.6 1.1 -0.5 0.51
Operatives and kindredworkers------------------- 15.5 15.6 -0.1 0.99 0.4 0.8 -0.4 0.52
Private household and service workers----------- 22.4 20.0 2.4 1.12 1.3 1.4 -0.1 0.89
Farm and other laborers(except mine)------------- 14.5 17.2 -2.7 0.84 1.2 1.1 0.1 1.08
Women
Professionalz technical,and managerral------------ 22.7 21.4 1. 3 1.06 2.9 2.3 0.6 1.29
Clerical and sales workers- 16.3 17.3 -1.0 0.94 1.6 1.6 0.96
Operatives and kindredworkers------------------- 18.8 20.7 -1.9 0.91 3.0 2.3 0.7 1.31
Private household and service workers----------- 26.5 22.8 3.7 1.16 1.6 2.8 -1.2
i
14

Table 10. Actual and expected prevalence rates of osteoarthritis of the hands and/or feet in adults, by sex and occupation: United States, 1960-62
Occupation
Professional, technical,and managerial------------
Farmers and farm managers----------------------
Clerical and sales workers-
Craftsmen, foremen, and kindred workers-----------
Operatives and kindredworkers-------------------
Private household and service workers-----------
Farm and other laborers(except mine)-------------
Men
34.5 36.2 -1.7
48.6 49.1 -0.5
30.8 33.2 -2.4
39.5 34.7 4.8
28.3 28.9 -0.6
34.5 37.4 -2.9
32.0 32.6 -0.6
Women
Ex- Differ- ActualActual petted ence Expected
Rate per 100 adults
0.95 34.8 35.6 -0.8 0.98
0.99 * * 9< *
0.93 28.3 28.6 -0.3 0.99
1.14 ?k f< Jc
0.98 36.1 34.3 1.8 1.05
0.92 38.6 38.7 -0.1 1.00
0.98 9: 7-c ;'; -2
15

Table 11. Actual and expected prevalence rates of osteoarthritis of the hands in adults,by severity and site of the disease, sex, and industry: United States, 1960-62
Moderate severeTotal osteoarthritis of hands osteoarthritis or
of hands Sex and industry
Men Rate per 100 adults-
Agriculture, forestry, andfisheries----------------- 33.3 33.8 -0.5 0.98 6.7 5.5 1.2 1.21
Mining and construction---- 32.1 26.3 5.8 1.22 5.8 3.3 2.5 1.75
Manufacturing-------------- 22.1 24.1 -2.0 0.92 2.2 2.9 -0.7 0.75
Transportation, couununi-cations, and other publicutilities----------------- 22.5 24.5 -2.0 0.92 3.0 3.1 -0.1 0.96
Wholesale and retail trade- 28.5 24.7 3.8 1.16 2.5 3.1 -0.6 0.82
Finance, insurance, andreal estate--------------- 18.1 25.6 -7.5 0.71 0.0 3.4 -3.4
Service and miscellaneous-- 24.6 27.5 -2.9 0.89 4.3 3.9 0.4 1.09
Gover~nt----------------- 23.7 22.4 1.3 1.06 1.5 2.1 -0.6 0.72
Women
Agriculture, forestry, andfisheries----------------- 26.4 28.2 -1.8 0.93 8.4 7.3 1.1 1.14
Manufacturing-------------- 24.0 22.9 1.1 1.05 5.0 5.6 -0.6 0.89
Wholesale and retail trade- 26.5 26.8 -0.3 0.99 7.0 6.3 0.7 1.12
Finance, insurance, andreal estate--------------- 22.6 24.2 -1.6 0.93 2.9 5.8 -2.9 0.49
Service and miscellaneous- 26.4 27.3 -0.9 0.97 8.0 7.3 0.7 1.10 c
16

Table 12. Actual and expected prevalence rates of osteoarthritis of the feet in adults, by severity and site of the disease, sex, and industry: United States, 1960-62 -r Moderate or severeTotal osteoarthritis of feet
I osteoarthritis of feet Sex and industry
Ex- IDiffer- Actual Ex- Differ- Actual
ktual Ipected ence Expected Actual petted ence Expected
@ Sate per 100 adults
Agriculture, forestry, andfisheries----------------- 18.4 22.5 -4.1 0.82 1.9 1.9 1.03
Mining and construction---- 22.0 18.8 3.2 1.17 0.7 1.2 -0.5 0.58
Manufacturing-------------- 16.4 17.6 -1.2 0.93 1.1 1.0 0.1 1.09
Transportation, communica-tions, and other publicutilities----------------- 15.9 18.3 -2.4 0.87 0.2 1.1 -0.9 0.19
Wholesale and retail trade- 20.0 18.0 2.0 1.11 1.4 1.1 0.3 1.35
Finance, insurance, andreal estate--------------- 19.2 19.2 1.00 1.1 1.3 -0.2 0.82
Service and miscellaneous-- 20.6 19.4 1.2 1.06 1.5 1.3 0.2 1.13
Government----------------- 17.8 17.5 0.3 1.02 1.7 0.9 0.8 1.91
Agriculture, forestry, andfisheries----------------- 10.5 21.7 -11.2 0.48 1.1 2.6 -1.5 0.44
Manufacturing-------------- 15.6 18.7 -3.1 0.83 2.1 2.0 0.1 1.08
Wholesale and retail trade- 22.9 21.3 1.6 1.07 3.9 2.2 1.7 1.82
Finance, insurance, andreal estate--------------- 15.3 19.4 -4.1 0.79 1.4 2.0 -0.6 0.67
Service and miscellaneous-- 24.0 21.2 2.8 1.13 1.8 1 2.5 -0.7 0.70
17

Table 13. Actual and expected prevalence rates of osteoarthritis of the hands and/or feet in adults, by sex and industry: United States, 1960-62
Men Women
Industry Actual Ex-petted
Differ-ence
Actual Expected
Actual ,",E;,, Differ-ence
Actual Expected
Rate per 100 adults
Agriculture, forestry, andfisheries----------------- 40.1 42.0 -1.9 0.96 27.6 35.9 -8.3 0.77
Mining and construction---- 42.2 35.2 7.0 1.20 * * * * Manufacturing-------------- 31.4 33.0 -1.6 0.95 32.2 30.9 1.3 1.04 Transportation, communica-
tions, and other publicutilities----------------- 30.7 33.5 -2.8 0.92 * * * *
Wholesale and retail trade- 35.1 33.3 1.8 1.05 34.1 35.4 -1.3 0.96 Finance, insurance, and
real estate--------------- 29.9 34.1 -4.2 0.88 32.5 32.1 0.4 1.01 Service and miscellaneous-- 34.7 36.0 -1.3 0.96 36.1 35.7 0.4 1.01 Government----------------- 31.2 31.9 -0.7 0.98 * * * *
L
Table 14. Actual and expected prevalence rates of osteoarthritis of the hands in adults, byseverity and site of the disease, sex, and usual activity status: United States, 1960-62
-
Moderate severeTotal osteoarthritis of hands osteoarthritis or
of hands Sex and usual
activity status Ex- Differ- Actual Differ- Actual
T Actual petted ence Expected Actual ,~~;,, ence Expected
Men Rate per 100 adults-
Usually working------------ 26.2 25.6 0.6 1.02 3.5 3.3 0.2 1.06 ,)-
Retired-------------------- 68.5 70.1 -1.6 0.98 23.9 23.2 0.7 1.03
Other---------------------- 17.1 20.7 -3.6 0.83 1.6 3.9 -2.3 0.41 :
Women
Usually working------------ 26.8 26.5 0.3 1.01 5.8 6.8 -1.0 0.85
Keeping house-------------- 33.4 33.1 0.3 1.01 12.3 11.5 0.8 1.08
Other---------------------- 9.3 12.3 -3.0 0.76 1.9 4.6 -2.7 0.41
18
I

Table 15. Actual and expected prevalence rates of osteoarthritis of the feet in adults, by severity and site of the disease, sex, and usual activity status: United States, 1960-62
Sex and usual activity status
Men-
Usually working------------
Retired--------------------
Other----------------------
Women
Usually working------------
Keeping house--------------
Other----------------------
Moderate severeTotal osteoarthritis of feet osteoarthritis or
of feetI
Actual petted Differ- Actual Ex- Differ- ActualEx- ence Expected Actua1 petted ence Expected
Rate per 100 adults
18.5 18.0 0.5 1.03 1.2 1.2 1.08
40.6 40.4 0.2 1.00 5.0 5.1 -0.1 0.97
10.1 14.3 -4.2 0.71 0.5 1.1 -0.6 0.43
21.7 19.2 2.5 1.13 2.4 2.1 013 1.11
21.5 22.9 -1.4 0.94 3.3 3.2 0.1 1.01
7.1 8.8 -1.7 0.80 0.0 1.3 -1.3
Table 16. Actual and expected prevalence rates of osteoarthritis of the hands and/or feet in adults, by sex and usual activity status: United States, 1960-62
-
T Men Women
Usual activity status
Usually working------------ 34.9 34.2
Keeping house-------------- * *
Retired-------------------- 73.1 74.6
Other---------------------- 22.6 26.9 L
Rate per 100 adults
0.7 1.02
* *
-1.5 0.98
-4.3) 0.84
Actual Expected
1.07
0.98
*
0.72
19
1

Table 17. Actual and expected prevalence rates of osteoarthritis of the hands in adults,by severity and site of the disease, sex, and marital status: -United States, 1960-62
Moderate or severeTotal osteoarthritis of hands osteoarthritis of hands Sex and marital status
Ex- Differ- Actual Actual petted ence Expected I
Men Rate per 100 adults-
Married-------------------- 30.8 30.7 0.1 1.00 5.3 5.3 1.00 Widowed-------------------- 72.6 65.1 7.5 1.11 26.6 20.1 6.5 1.32 Divorced------------------- 25.8 36.2 -10.4 0.71 3.1 7.3 -4.2 0.42 Separated------------------ 40.3 30.6 9.7 1.31 7.8 5.0 2.8 1.56 Never married-------------- 13.9 14.9 -1.0 0.94 1.6 2.4 -0.8 0.68
Women
Married-------------------- 26.5, 26.8 -0.3 0.99 7.6 7.8 -0.2 0.98 Widowed-------------------- 68.8 65.4 3.4 1.05 31.5 27.5 4.0 1.15 Divorced------------------- 34.6 33.1 1.5 1.04 5.6 9.5 -3.9 0.60 Separated------------------ 15.7 23.0 -7.3 0.68 6.6 5.4 1.2 1.23 Never married-------------- 11.9 13.3 -1.4 0.90 1.8 4.2 -2.4 0.44
Table 18. Actual and expected prevalence rates of osteoarthritis of the feet in adults, by severity and site of the disease, sex, and marital status: United States, 1960-62
-I
Moderate severeTotal osteoarthritis of feet I osteoarthritis
or of feet
I I I
Sex and marital status I-Actual1
I ,",aied(
I "di',r- /
I EAituta, Actual Ex- Differ- Actual
petted ence Expected .'
Men Rate per 100 adults
Married-------------------- 20.7 20.6 0.1 1.00 1.5 1.6 -0.1 0.99 r Widowed-------------------- 43.4 37.3 6.1 1.16 5.4 4.5 0.9 1.19
Divorced------------------- 22.0 23.0 -1.0 0.96 1.5 2.0 -0.5 0.76 Separated------------------ 13.8 21.0 -7.2 0.66 2.9 1.5 1.4 1.92 Never married-------------- 11.3 11.7 -0.4 0.96 0.6 0.7 -0.1 0.87
Women
Married-------------------- 18.8 19.4 -0.6 0.97 2.6 2.3 0.3 1.13 Widowed-------------------- 43.2 41.3 1.9 1.05 6.1 7.5 -1.4 0.81 Divorced------------------- 26.5 23.3 3.2 1.14 2.6 2.9 -0.3 0.91 Separated------------------ 15.3 17.4 -2.1 0.88 1.0 1.7 -0.7 0.58 Never ~rried-------------- Il.0 9.9 1.1 1.10 1.2 1.2 0.99 ’
20

Table 19. Actual and expected prevalence rates of osteoarthritis of the hands and/or feet in adults, by sex and marital status: United States, 1960-62
Men Women
Marital status Actual Ex-petted
Differ-ence
Actual Actual
Expected Ex- Differ-
petted ence Actual
Expected
Rate per 100 adults
Married-------------------- 39.1 39.1 1.00 33.5 34.0 -0.5 0.99
Widowed-------------------- 81.3 JO.2 11.1 1.16 75.5 72.7 2.8 1.04
Divorced------------------- 38.9 44.3 -5.4 0.88 44.7 41.2 3.5 1.08
Separated------------------ 42.5 39.6 2.9 1.07 25.2 30.5 -5.3 0.83
Never ~rried-------------- 19.8 21.1 -1.3 0.94 16.4 17.0 -0.6 0.96
21

---
-----------
-----------
------------------
APPENDIX I
DEMOGRAPHIC TERMS
Age. - The age recorded for each person is the age at last birthday. Age is recorded in single years.
Employment status. -This term applies to the employment status of persons during the 2-week period prior to the week of interview. It is not intended that this term define the labor force or provide estimates of the employed or unemployed population at the time of the survey.
Persons who report that they either worked at or had a job or business at any time during the 2-week period prior to the week of interview are considered employed. This includes paid work as an employee of someone else, self-employment in business, farming, or professional practice, and unpaid work in a family business or farm. Persons on layoff from a job and those who were absent from their job or business because of temporary illness, vacation, strike, or bad weather are considered employed if they expect to work as soon as the particular event causing their absence no longer exists. Freelance workers are considered as currently employed if they have a definite arrangement with one or more employers to work for pay according to a weekly or monthly schedule either full time or part time. Excluded are such persons who have no definite employment schedule but work only when their services are needed. Also excluded are (1) persons receiving revenue from an enterprise in whose operation they do not participate, (2) persons doing housework or charity work for which they receive no pay, and (3) seasonal workers during the portion of the year they are not working. (It should be noted that these data were not collected for Philadelphia.)
Occupation. -A person’s occupation may be defined as his principal job or business. For the purposes of this survey the principal job or business of a respondent is defined in one of the following ways. If the person worked during the 2-week-reference period of the inter-view or had a job or business, the question concerning his occupation (or what kind of work he was doing) applies to his job during that period. If the respondent held more than one job, the question is directed to the one at which he spent the most time. When equal time is spent at each job, the question refers to the one he
considers most important. A person who has not begun work at a new job, is looking for work, or is on layoff from work is questioned about his last full-time civilian job. A full-time job is defined as one at which the person spent 35 hours or more per week and which lasted 2 consecutive weeks or more. A person who has a job to which he has not yet reported and has never had a previous job or business is classified as a ‘new worker.”
The occupational groups are shown below with the appropriate census code categories.
Occupational title Census code
Professional, technical, and managerial workers----- R,OOO-195,250-285
Farmers and farm managers-- N, 222 Clerical and sales workers S, Y, Z, 301-395 Craftsmen, foremen, and
kindred workers Q, 401-545 Operatives and kindred
workers------------------- T, W, 601-721 Private household and
service workers P, 801-803, 810-890 Farm and other laborers
(except mine)-------------- U, V, X, 901, 905, 960-973
Unknown (including new workers) 995 and all other codes
(U.S. Bureau of Census, 1960 Census of Population, Classified Index of Occupations and Industries, U.S. Government Printing Office, Washington, D.C., 1960). This information was not collected for Philadelphia and Valdos ta .
Industry.- The industry in which a person was reportedly working is classified by the major activity of the establishment in which he worked.
The only exceptions to the above are those few establishments classified according to the major activity of the parent organization, and they are as follows: laboratories, warehouses, repair shops, and places for storage,
22

-------
-------
The industry groupings are shown below. (Data on industries were not collected for Valdosta and Philadelphia.) The census code (the Classified Index of Occupation and Industries) and the Standard Industrial Classification (SIC) code components are also listed.
Industry title SIC code
Agriculture, forestry, and 01, 00, 07(escludesfisheries ______________ A, 017, 018 0713), 08, 09___________
Mining and construction C, 126-156 10-14, 15-17
~~anufacturing-------------------- B, hi, ‘706-459 19-39, 0713 Transportation, communi
cations, and other publicutilities ____________________------L, 507-579 al-49
Wholesale and retail trade----- D, F, G, 606-696 50, 52-59
Finance, insurance, and real estate ____________________-----.--706-736 60-67
Service and miscellaneous---- E, H,K, 606-898 70, 72, 7:3, 75 76 78,82,84,86, ;i8, i9
Government .____________-__-_-----J, 906-936 91-94
Unknown (including new w()rkers) ___________-_---- ggg 99_
The industry title government differs somewhat from the usual industrial classification of government, since it is limited to the postal service and to Federal, State, and local public administrations. This category includes only uniquely governmental functions and excludes those activities which may also be carried out by private enterprise. For example, teachers in public educational facilities and nurses engaged in medical services of governmental agencies are included with the “service and miscellaneous” group.
Usual activity status.- All persons are classified according to their usual activity status during the 12-month period prior to the week of interview. The usual activity status, in case more than one is reported, is the one at which the person spent the most time during the 12-month period.
The categories of usual activity status are usually working, usually keeping house, retired, and other. For several reasons these categories are not comparable with somewhat similarly named categories in official Federal labor force statistics. First, the responses concerning usual activity status are accepted without detailed questioning, since the objective of the question is not to estimate the numbers of persons in labor force categories but to identify crudely certain population groups which may have differing health problems. Second, the figures represent the usual activity status over the period of an entire
L labor force statistics relate to usually 1 week. Finally in the categories which follow, certain classified differently to simplify
year, whereas official a much shorter period, definitions of specific
marginal groups are procedures.
-o-
Usually workirzg includes persons who are paid employees; self-employed in their own business, profession, or in farming; or unpaid employees in a family business or farm. Work around the house or volunteer or unpaid work, such as for a church, is not counted as working. Usually keeping house includes women whose major activity is described as “keeping house” and who cannot be classified as “working.”
tietired includes persons 45 years of age and over who consider themselves retired. In case of doubt a person 45 years of age or over is counted as retired if he or she has either voluntarily or involuntarily stopped working, is not looking for work, and is not described as ‘keeping house.” A retired person may or may not be unable to work.
Other in this report includes men not classified as “working” or “retired” and women not classified as “working, ” “keeping house,” or “retired.” Per-sons who are going to school are included in this group.
Education .-Each person is classified by education in terms of the highest grade of school completed. Only grades completed in regular schools, where per-sons are given a formal education, are included. A “regular” school is one which advances a person toward an elementary or high school ‘diploma or a college, university, or professional school degree. Thus education in vocational, trade, or business schools outside the regular school system is not countedin determining the highest grade of school completed.
Income of filmily OY unrelated individuals.- Each member of a family is classified according to the total income of the family of which he is a member. Within the household all persons related to each other by blood, marriage, or adoption constitute a family. Unrelated individuals are classified according to their own income.
The income recorded is the total of all income received by members of the family in the 12-month period preceding the week of interview. Income from all sources is included, e.g., wages, salaries, rents from properties, pensions, help from relatives.
Marital status .-The categories of marital status are married, ulidowed, divorced, separated, and never married. Persons with common-law marriages are considered married. Separated refers to married per-sons who have a legal separation, those living apart with intentions of obtaining a divorce, and other persons permanently or temporarily estranged from their spouse because of marital discord.
23
1

APPENDIX II
STATISTICAL NOTES
The Survey Design
The first cycle of the Health Examination Survey employed a highly stratified multistage probability design in which a sample of the civilian, noninstitutional population of theconterminous UnitedStates 1%79years of age was selected. At the first stage, a sample of 42 primary sampling units (PSU’s) was drawn from among the 1,900 geographic units into which the United States was divided. Random selection was controlled within regional and size-of-urban-place strata into which the units were classified. As used here a PSU is a standard metropolitan statistical area or one to three contiguous counties. Later stages result in the random selection of clusters of typically about four persons from a neighborhood within the PSU. The total sample included some 7,700 persons in 29 different States. The detailed structure of the design and the conduct of the survey have been described in previous reports. 2J
Reliability
The methodological strength of the survey derives especially from its use of scientific probability sampling techniques and highly standardized and closely con-trolled measurement processes. This does not imply that statistics from the survey are exact or without error. Data from the survey are imperfect for three major reasons: (1) results are subject to sampling error, (2) the actual conduct of a survey never agrees perfectly with the design, and (3) the measurement processes themselves are inexact even though standardized and controlled.
The first-stage evaluation of the survey was reported in reference 3, which dealt principally with an analysis of the faithfulness with which the sampling design was carried out. This study notes that out of the 7,700 sample persons the 6,670 who were examined-a response rate of over 86 percent-gave evidence that they were a highly representative sample of the civilian, noninstitutional population of the United States. Imputation of nonrespondents was accomplished by attributing to nonexamined persons the characteristics of comparable examined persons as described in reference 3. The specific procedure used amounted to inflating the sampling weight for each
24
examined person in order to compensate for sample persons at that stand of the same age-sex group who were not examined.
Sampling and Measurement Error
In the present report, reference has been made to efforts to minimize bias and variability of the measurement techniques.
The probability design of the survey makes possible the calculation of sampling errors. Traditionally the role of the sampling error has been the determination of how imprecise the survey results’may be because they come from a sample rather than from the measurement of all elements in the universe.
The estimation of sampling errors for a study of the type of the Health Examination Survey is difficult for at least three reasons: (1) measurement error and “pure” sampling error are confounded in the data-it is not easy to find a procedure which will either completely include both or treat one or the other separately, (2) the survey design and estimation procedure are complex and accordingly require computationally involved techniques for the calculation of variances, and (3) from the survey are coming thousands of statistics, many for subclasses of the population for which there are a small number of sample cases. Estimates of sampling error are obtained from the sample data and are themselves subject to sampling error when the number of cases in a cell is small or, even occasionally, when the number of cases is substantial.
Estimates of approximate sampling variability for selected statistics used in this report are presented in table I. These estimates have been prepared by a replication technique which yields overall variability through observation of variability among random sub-samples of the total sample. The method reflects both “pure” sampling variance and a part of the measurement variance.
In accordance with usual practice, the interval estimate for any statistic may be considered the range within one standard error of the tabulated statistic, with 68 percent confidence; or the range within two standard errors of the tabulated statistic, with 95 percent confidence,

---
Table I. Standard errors in prevalence rates for osteoarthritis (OA) in adults, by severity and site of the disease, sex, and selected characteristics: United States, 1960-62
Total Moderate OA of Total Total or
Characteristic hands OA of OA of severe and/or hands feet OA of
feet feet
INCOME
Men Rate per 100 adults
under $2,000----------------------------------------$2,000-$3,ggg--------------------------------------- 2’; t :o’ 0”:: $4,000-$6,999 _-___________ _-----___--____________ $7,OoD-$g,ggg--------------------------------------~ 3:; ::: i-2$lO,OOO and over------------------------------------ 0:4Unknown--------------------------------------------- 32:; E 1.4
Women
Under $2,000---------------------------------------- 2.0 2.0 $2,000-$3,ggg--------------------------------------- 2’2 1.5 1.8 $4,00()-$6,999 _____________ - _________________________ $7,ooo-$g,ggg --_-------_---------------------------- ::i ::i 29” $lO,()OO and over------------------------------------ 0.9 unknown--------------------------------------------- 29” Z E 1.6
EDUCATION
Men
Under 5 years---------------------------------------5-8 years-------------------------------------------g-12 years------------------------------------------13 years and over-----------------------------------
4.2
:s 212
2.5 0.9 0.6 1.1
23
::;
1.2
i?:. 0:6
Women
Under 5 years---------------------------------------5-8 years-------------------------------------------g-12 years------------------------------------------13 years and over-----------------------------------
4.5 2.1
2";
:-ii 0:9 1.3
1:‘;
::i
0’:: 2:
MARITAL STATUS
Men
Married--------------------------------------------- 0.4 0.9 0.3 Widowed--------------------------------------------- El 5.2 Divorced-------------------------------------------- 6:2 t -: f-2 Separated------------------------------------------- 10.7 2: 5:2 2:1 Never married--------------------------------------- 2.0 0:3 1.8 0.2
Women
Married---------------------------------------------Widowed--------------------------------------------- 2: i:f E Divorced-------------------------------------------- 4:5 Separated------------------------------------------- 2-i z-52 Never married--------------------------------------- 3:3 017 2::
25

Table I. Standard errors in prevalence rates site of the disease, sex, and selected
Characteristic
USUAL ACTIVITY STATUS
Men
Usually working-------------------------------------Retired---------------------------------------------Other-----------------------------------------------
Women
Usually working------------------------------------- 2.0 1.9 Keeping house---------------------------------------
Other----------------------------------------------- ::2 K3
OCCUPATION
Professional, technical, and managerial------------- 2.1Farmers and farm managers--------------------------- 3.9Clerical and sales workers-------------------------- 3.2
for osteoarthritis (OA) in adults, by severity and characteristics: United States, 1960-62-Con.
Total OA of Total hands OA of and/or hands
feet
Rate per 100 adults
0.2
0'::
E
Craftsmen, foremen, and kindred workers-------------Operatives and kindred workers----------------------Private household and service workers---------------Farm and other laborers (except mine)---------------
Women
Professional, technical, and managerial-------------Clerical and sales workers--------------------------Operatives and kindred workers----------------------Private household and service workers---------------
INDUSTRY
Men
Agriculture, forestry, and fisheries----------------Mining and construction-----------------------------Manufacturing---------------------------------------
Transportation, communications, and other public utilities-----------------------------------
Wholesale and retail trade--------------------------
Finance, insurance, and real estate-----------------Service and miscellaneous---------------------------Government------------------------------------------
Women
Agriculture, forestry, and fisheries----------------Manufacturing---------------------------------------
Wholesale and retail trade--------------------------Finance, insurance, and real estate-----------------Service and miscellaneous---------------------------
0.7
0'2 1:: 1:6
:*z k2 4:8 E 3.7 1:4 01::
4.0 3.1
;*6' z-9" 2:9 3:o
4.9 5: 2:5 4::
3.5 3.2 3.1
53:; 5.1
20 2::
7.2 5.2 i-2 9:.
33.02 3:4 1':; 1:4 618 7.7 2.7 2.5 2'; 0':;
26
0.5

Expected Values
In tables 2-19 the actual prevalence rates for the various demographic variables are compared with the expected. The computation of expected rates was done as follows:
Suppose that in a family income group (say, less than $2,000) the Health Examination Survey estimates that there are N, persons in the ith age grow(i= 1,2 . . ., 7; sum of Ni = N).
Suppose the Health Examination Survey estimates that the Oh prevalence rate for the United States in the i th age group is Xi.
Then the expected OA rate for the family income group is
I Z Ni xi N i
Comparison of an actual value for, say, an income group with the expected value for that group is under-taken on the assumption that a meaningful statement can be made which holds, in some average way, for all persons in that income group. This may or may not be true. The specified income group may have higher values for young persons and lower values for old persons than are found in other income groups. In that case an average comparison will obliterate one or both of these differentials. A similar remark may be made with respect to values computed for all races together, since relationships found in one race may not be found in another. In arriving at the general conclusions expressed in the text, an effort was made to consider all the
specific data, including data not included in this report; but it must be recognized that balancing such evidence is a qualitative rather than a quantitative exercise. The standard error of the difference between an actual and an expected value may be approximated by the standard error of the actual value (table I).
Small Numbers
In some tables magnitudes are shown for cells for which the sample size is so small that the sampling error may be several times as great as the statistic itself. Obviously in such instances the statistic has no meaning in itself except to indicate that the true quantity is small. Such numbers, if shown, have been included to convey an impression of the overall story of the table.
Tests of Significance
Tests of significance for the demographic variables were performed in the following way. The procedure was to divide the difference between the actual and expected values by the standard error of the actual value. For example, for unmarried women the actual value of moderate or severe osteoarthritis of the hands was 2.3 percent lower than expected, and the standard error was 0.7 percent. Since the difference was more than three times its standard error, it may be deemed statistically significant.

Series 1.
Series 2.
Series 3.
Series 4.
Series 10.
Series 11.
Series 12.
Series 13.
Series 20.
Series 21.
Series 22.
OUTLINE OF REPORT SERIES FOR VITAL AND HEALTH STATISTICS
Public Health Service Publication No. 1000
Programs and collection procedures .-Reports which describe the general programs of the National Center for Health Statistics and its offices and divisions, data collection methods used, definitions, and other material necessary for understanding the data.
Data evaluation and methods research ,-Studies of new statistical methodology including: experimental tests of new survey methods, studies of vital statistics collection methods, new analytical techniques, objective evaluations of reliability of collected data, contributions to statistical theory.
Analytical studies. -Reports presenting analytical or interpretive studies based on vital and health statistics, carrying the analysis further than the expository types of reports in the other series.
Documents and committee reports. -Final reports of major committees concerned with vital and health statistics, and documents such as recommended model vital registration laws and revised birth and death certificates.
Data from the Health Interview Survey. -Statistics on illness, accidental injuries, disability, use of hospital, medical, dental, andother services, andother health-related topics, based on data collected in a continuing national household interview survey.
Data from the Health Exuminution Survey.- Data from direct examination, testing, and measurement of national samples of the population provide the basis for two types of reports: (1) estimates of the medically defined prevalence of specific diseases in the United States and the distributions of the population with respect to physical, physiological, and psychological characteristics; and (2) analysis of relationships among the various measurements without reference to an explicit finite universe of persons.
Data from the Institutional Population Surveys.- Statistics relating to the health characteristics of persons in institutions, and on medical, nursing, and personal care received, based on national samples of establishments providing these services and samples of the residents or patients.
Data from the Hospital Discharge Survey.- Statistics relating to discharged patients in short-stay hospitals, based on a sample of patient records in a national sample of hospitals.
Data on mortality.- Various statistics on mortality other than as included in annual or monthly reports- special analyses by cause of death, age, and other demographic variables, also geographic and time series analyses.
Data on natality, marriage, anddivorce. -Various statistics onnatality, marriage, and divorce other than as included in annual or monthly reports- special analyses by demographic variables, also geographic and time series analyses, studies of fertility. 1
Data from the National Natality and Mortality Surveys. - Statistics on characteristics of births and deaths not available from the vital records, basedon sample surveys stemming from these records, including such topics as mortality by socioeconomic class, medical experience in the last year of life, characteristics of pregnancy, etc.
For a list of titles of reports published in these series, write to: Office of Information and Publications National Center for Health Statistics U.S. Public Health Service Washington, D.C. 20201