osmolarity and tonicity: an inquiry laboratory …...tested studies for laboratory teaching...
TRANSCRIPT
Tested Studies for Laboratory TeachingProceedings of the Association for Biology Laboratory Education Vol. 32, 135-150, 2011
135
Osmolarity and Tonicity: An Inquiry Laboratory Using Plant MaterialDee U. Silverthorn
Integrative Biology, One University Station C0930, University of Texas, Austin TX 78712 ([email protected])
The difference between osmolarity and tonicity is a difficult concept for students to understand and often for fac-ulty to teach. We adapted techniques from the traditional potato-plug laboratory to create an inquiry laboratory that demonstrates the principles of osmolarity and tonicity. Students design two experiments: first, they must try to determine the internal osmolarity of their plant material, and second, they test whether a particular solute is a penetrating solute for plant cells. The inquiry level can be adjusted by the instructor.
Keywords: osmolarity, osmosis, tonicity, solutions, plant cells, sugar transport, urea
© 2011 by Dee U. Silverthorn
The difference between osmolarity and tonicity is a dif-ficult concept for students to grasp. The coverage of tonicity in most introductory biology textbooks is perfunctory at best and sometimes inaccurate or misleading. Yet a clear under-standing of the difference between the osmolarity of a so-lution and its tonicity is essential for pre-health-professions students because tonicity is the basis for the appropriate selection of intravenous fluid therapy. For additional back-ground and a tutorial on this subject, see Silverthorn (2010). The traditional laboratories for teaching osmolarity in-clude exposing red blood cells to varying concentrations of NaCl solutions to observe hemolysis or crenation, or soaking potato plugs in different solutions to observe changes in the volume and texture of the plug. Unfortunately, these experi-ments do not include adequate coverage of the concept of tonicity because the NaCl solutions used contain only non-penetrating solutes. If solutes cannot enter or leave the cells, water will follow the concentration gradients and move by osmosis. If a NaCl solution is hyperosmotic, it will be hyper-tonic. If a NaCl solution is isosmotic, it will be isotonic. For students to understand tonicity, they must also be ex-posed to solutions that contain penetrating solutes, that is, solutes that can enter the cell. In medicine, glucose (dex-trose) is the main penetrating solute found in intravenous (IV) solutions. For example, the IV solution composed of 5% dextrose in water (D-5-W) is isosmotic but hypotonic. Once penetrating solutes are included in the composition of a solution, the parallel relationship between osmolarity and tonicity disappears. The concept of penetrating versus nonpenetrating solutes is the key that is usually missing in textbook discussions but is critical to understanding tonicity.
This laboratory exercise teaches students how penetrating solutes affect tonicity and challenges their understanding by asking them to design an experiment to determine whether a solute (sucrose, glucose, or urea) is penetrating for plant cells. This information is not something they can easily look up on the web, so they must make predictions based on their understanding of tonicity. Students are presented with two challenges: design an ex-periment to determine the internal osmolarity of plant cells (week 1) and design a controlled experiment to determine whether sucrose, glucose, or urea is a penetrating solute for the same plant cells. The sugar transporters of plants are H+-dependent co-transporters (Buttner and Sauer, 2000; Truer-nit, 2001), very different from the monosaccharide transport-ers of animal cells, and students usually have not been taught about the plant transporters in their biology courses unless they have taken advanced plant physiology. Their lack of knowledge about sugar transport in plants thus requires stu-dents to use their literature-research skills to find appropri-ate articles to provide background and guide their research design. The activity presented here evolved from the traditional potato-plug exercise. We use plugs of vegetables such as pumpkins and turnips rather than the more-starchy potato. One reason for not using potatoes is turgor pressure that can be exerted by the plant cell wall on the cell membrane: if the plant tissue being used is well hydrated at the start of the ex-periment, then turgor pressure will oppose osmosis into the cell. However, in our experience pumpkins and turnips pur-chased from the grocery are not well hydrated, and we can assume that turgor pressure is zero (Taiz and Zeiger, 2002).
Introduction
136 Tested Studies for Laboratory Teaching
Silverthorn
that they do not know or remember how to make solutions from dry chemicals or dilutions from stock solutions, so that is part of the laboratory curriculum. We have also learned that their graphing skills are inadequate, and one of our in-troductory labs reviews graphing and teaches them how to make graphs and run statistics using Excel. Our assessment of the exercise has been mostly informal. At the end of the semester I ask a clicker question about which exercise was conceptually the most challenging, and this osmolarity-tonicity laboratory always wins, hands down. When students select a final project at the end of the semester, about a third of the class chooses to do a variant of this experiment, often using what they have learned about the proton-dependence of sugar transport to test effects of pH on transport. The Student Outline is based on the handout we use in our laboratory manual. In classes where students need more direction, the instructor might choose to move information from the Instructor’s Guide into the student handout. We carry out the work over two weeks (parts A and B) but the students have an introductory week where they make solu-tions and measure their osmolarity with the osmometer (that activity is not included here but the background information on making solutions is included). The experiment can be run without an osmometer but the results may not be as neat.
This correlates well with mammalian cells, which lack a cell wall and do not exhibit turgor pressure. Instructors who wish to include turgor pressure as a factor in plant osmosis might consider using the potato-based activity developed by Kosin-ski and Morlok (2008). We have been using this exercise for over ten years as part of a physiology laboratory course that focuses on experimen-tal design and the process of science. The course includes several experiments that are technically simple but conceptu-ally challenging, so that technical mistakes do not confound the results. The students are expected to find appropriate pa-pers in the scientific literature, design controlled experiments, write detailed protocols, and analyze and present their results. The in-house laboratory manual for the course contains pri-marily background information, abbreviated protocols that teach students only the basic procedure they need to observe a particular phenomenon, and hints to help them design a suc-cessful protocol. In this experiment the students must make most of the design decisions, from how to create samples of the plant material to how long to incubate the plugs and what concentrations of solution to use. Because we use the course to teach students about the process of science, from finding information to designing controlled experiments, our expectations of what they can do upon entry are low. Students should have basic chemistry skills and understand moles and molarity, but we have learned
Proceedings of the Association for Biology Laboratory Education, Volume 32, 2011 137
Major Workshop: Osmolarity and Tonicity
Student OutlineBackground: Solutions
You may wish to refer to your general chemistry textbook to help review molarity and solutions. Concentration refers to the amount of a substance (solute) dissolved in a given volume of solution. The liquid in which the solute is dissolved is called the solvent. The concentration of a solution is not the same thing as the amount of solute in the solution. The amount refers to the total number of particles in the given volume of solution. However, if you know both the concentration and the volume of a solution, you can calculate the amount of solute in it.
Solutions that you encounter in laboratory and clinical settings have their concentrations expressed in a variety of ways. Some of the most common are shown in Table 1.
Table 1. Common expressions of solution concentration
amount/volume Example: 2 g/Lper cent solutions Example: 0.9% NaClmolar solutions Example: 1 M sucrose
Amount/Volume Solutions
These are the simplest solutions to make. The specified weight or volume of solute is mixed with water to create the specified volume of solution.
Percent Solutions
The word “percent” means parts per 100: Percent (%) solution = grams of solute/100 mL of total solution × 100 In medicine and biology you will see solute concentrations written as “mg%” or as “mg/dL.” Both of these terms refer to the concentration of solute in milligrams per 100 mL of solution. Because concentrations of solute are so low in biological solutions, they are expressed as milligrams instead of grams. A salt solution of sodium chloride that is approximately equal in concentration to human body fluid is a 0.9% NaCl (“saline”) solu-tion.
To make 100 mL of 8% sucrose: Put 8 g of sucrose in a 100 mL volumetric flask. Add about 75 mL of water. Stir until sucrose dissolves. Add water to make the final volume of the solution 100 mL.*
*If you put 8 g of sucrose into 100 mL water, you will end up with more than 100 mL of solution, because the sucrose occupies volume as well as the water.
Molar Solutions
In the laboratory, solution concentrations are often expressed in moles per liter or molarity (M), where 1 mole = Avoga-dro’s number of molecules = 6.02 × 10²³ molecules.
A 1 molar solution (1 M) of glucose has the same number of molecules as a 1 M solution of fructose or a 1 M solution of NaCl. The concept of molarity does not take into account molecules that ionize and dissociate in solution, such as NaCl. We will consider that concept more in the section on osmolarity. Because solute concentrations are so low in biological systems, we usually refer to solutions in terms of millimoles per liter, or millimolar solutions.
To make a molar solution of a solute, you must know the molecular weight of the solute. The molecular weight is the sum of the atomic masses of the atoms in the molecule times the number of atoms of each element. An example showing how to cal-culate the molecular weight for glucose is in Table 2. To find the molecular weight of glucose, add (the atomic mass × number of atoms) for each element in the molecule.
138 Tested Studies for Laboratory Teaching
Silverthorn
A 1 molar solution contains 1 mole of solute per liter of solution. One mole of a solute contains the equivalent of 1 molecular weight of the solute in grams. Therefore to make 1 liter of 1 M glucose, you weigh out 180 grams of glucose and add water to bring the final volume of the solution to 1 liter. Background: Osmolarity
For biological systems, we need to know exactly how many particles are in solution because it is the concentration in par-ticles/volume that will determine if water moves in response to a concentration gradient. A particle in this context can be either a molecule or an ion. Some molecules dissociate into two or more ions when dissolved in water. For example, sodium chloride (NaCl or “salt”) forms Na+ and Cl− ions when dissolved in water. Each molecule of NaCl theoretically makes two ions.
The actual number of particles in solution then cannot be based on the molarity. Instead we use the concept of osmolarity, where concentration of the solution is expressed as osmoles/liter.
To determine the osmoles for a given solute:moles of solute × number of osmotically active particles/mole
For example, glucose does not ionize, so one mole of glucose equals one osmole.
One mole of NaCl in solution will theoretically yield two osmotically active particles: Na+ and Cl−. In very dilute solutions, NaCl does dissociate completely and form two ions (one Na+ and one Cl−). As solutions become more concentrated, however, some ions fail to dissociate. At physiological concentrations, such as 154 mM NaCl, some NaCl molecules fail to separate into two ions. Instead of 2 osmoles of NaCl per mole, there will be only 1.8 osmoles per mole. Thus the dissociation factor of NaCl in these solutions is 1.8:
molarity NaCl (mol/L) × 1.8 = osmolarity NaCl (osmol/L) The dissociation factor is more correctly known as the van’t Hoff factor.
To convert between molarity and osmolarity, use the following equation:molarity (mol/L) × dissociation factor = osmolarity (osmol/L)
Standard abbreviations for solutions include the following: mol = mole; M = moles/liter; osmol = osmoles; mosmol = milliosmoles; OsM = osmoles/liter;. mOsM = milliosmoles/liter.
Osmolarity is based on colligative properties of the solution, that is, the number of particles in solution. It does not matter what kinds of particles they are (ions or molecules) or how they behave in respect to a cell membrane. All that matters is the number of particles per volume of solution.
A term that is closely related to osmolarity is osmolality. Osmolality is defined as the concentration in osmoles per kilogram of fluid. This is a better way to express concentration in clinical settings because you are much more likely to know a person’s weight than his or her fluid volume. But 1 liter of pure water weighs 1 kilogram. And physiological solutions are not very con-centrated, averaging only about 0.3 osmoles/liter or 300 mosmoles/liter. So at the dilute concentrations of physiological fluids, we consider osmolarity to be equivalent to osmolality.
Measuring Osmolarity The machine we will use to measure the osmolarities of solutions is called an osmometer. One type of osmometer works by measuring the freezing point depression of the solutions. Pure water freezes at 0 °C. Solute molecules dissolved in water will interfere with the formation of crystal lattice bonds and lower the temperature at which the water freezes. The more solute particles, the lower the freezing point. The sample of solution is placed in the machine and a probe lowered into the solution. When the solution freezes, the probe measures the temperature and translates it into an osmolarity reading that appears on the dial. A second type of osmometer that works slightly differently is a vapor-pressure osmometer.
Proceedings of the Association for Biology Laboratory Education, Volume 32, 2011 139
Major Workshop: Osmolarity and Tonicity
Comparing Osmolarities
It is possible to compare the osmolarities of any two solutions simply by considering their concentrations in osmoles/liter:
• If solution A has more osmoles/liter than solution B, then A is hyperosmotic to B.• Because B has fewer osmoles/liter, B is hyposmotic to A.• If A and B have the same concentrations, the two solutions are isosmotic [iso-, equal].
To compare osmolarities, make sure the two solutions have the same units, then compare the numbers.
The normal osmolarity of the human body is about 285-295 mosmol/L. For convenience this is often rounded to 300 mOsM.
Practice Exercises
1. You have 5 liters of glucose solution with a concentration of 5 g/L. How many grams of glucose do you have in the entire 5 liters of solution? What is the concentration of the remaining solution if you pour out 2 liters?
2. Glycerol, a sugar alcohol, has the formula C3H8O3. How would you make 500 mL of 1 M glycerol?
3. Compare the osmolarities of the following solutions:
Solution A = 1 OsM glucose, Solution B = 2 OsM glucose, Solution C = 1 M NaCl
A is ______________ osmotic to B A is ______________ osmotic to C B is ______________ osmotic to A B is ______________ osmotic to C C is ______________ osmotic to A C is ______________ osmotic to B
Background: Tonicity
Tonicity is a term used to describe a solution. It is a comparative term and it has no units – you cannot put a solution in a machine and measure its tonicity. The tonicity of a solution describes what would happen to a particular cell if the cell were placed in the solution.
• A cell placed in a hypotonic solution will swell when it reaches equilibrium with the solution. • A cell in a hypertonic solution will shrink when it reaches equilibrium with the solution. • A cell placed in an isotonic solution will not change size when it reaches equilibrium.
Note that tonicity refers to cell volume at equilibrium and says nothing about volume changes on the way to equilibrium.
By convention we always describe the tonicity of the solution (relative to a cell). We never talk about the tonicity of the cell. So although we can say “The solution is hyposmotic to this cell, and the cell is hyperosmotic to the solution,” we can only say “The solution is hypotonic to the cell.”
What determines tonicity? To predict tonicity, we must know the concentrations of penetrating and nonpenetrating solutes in the solution. A penetrating solute is a solute that can cross the cell membrane. The method by which it crosses (simple dif-fusion, carrier, channel) is not important. If it can get into the cell, it is penetrating. For mammalian cells, urea and glucose are the examples we use for penetrating solutes.
A nonpenetrating solute is one that cannot cross the cell membrane. For mammalian cells, we use NaCl as the most impor-tant nonpenetrating solute because it is the main solute in the extracellular fluid. Although small amounts of sodium leak across the membrane into the cell, they are rapidly pumped out, so NaCl is considered functionally nonpenetrating. By convention, all solutes in cells are considered nonpenetrating.
If a solution contains only nonpenetrating solutes, tonicity of the solution will parallel its osmolarity relative to the cell:• a hyposmotic solution is hypotonic,• an isosmotic solution is isotonic,• a hyperosmotic solution is hypertonic.
140 Tested Studies for Laboratory Teaching
Silverthorn
If a solution contains penetrating solutes or a mix of penetrating and nonpenetrating solutes, the key to tonicity is the rela-tive concentrations of nonpenetrating solutes in the solution and the cell. Water will move into the region with the highest concentration of nonpenetrating solutes. The concentration of penetrating solutes does not matter! For examples that illustrate this principle, see the background section for Part B of your experiment.
Osmolarity and Tonicity Lab
Objectives
1. Design an experiment to determine the internal osmolarity of plant cells.
2. Design a controlled experiment to determine whether your assigned compound is a penetrating solute for the same plant cells.
This experiment will be done over two weeks.
Protocol A - Week One
Your objective this week is to design an experiment to determine the internal osmolarity of the plant using NaCl solutions. We will be using various plant materials for this lab. You should not expect to find extensive research literature on this topic. For this first protocol you should include basic background on osmosis that provides the rationale for your design. You might also consider including information on plant cells and osmosis. Appropriate references would be an introductory biology textbook or the laboratory manual, and they should be cited.
This is one experiment where it is very important in your protocol to make up “pretend” data and decide how you will ma-nipulate it and present it in graphical form. Here is an example of how to do that. First, decide which concentrations of saline you will use. Make up a value for the plant’s osmolarity that is not exactly the same as any of your saline solutions. What will happen to the plant material in each of the solutions? Will the cell shrink, swell, or remain the same size? Create some data points. Now use your made-up data points and figure out how you would get from those data points to the plant’s osmolarity.
Bring two copies of your protocol for Part A to lab. Hand in one copy to be graded and work from the second copy.
Homework: Analyze your results from this week’s experiment and write as a Results section. Revise your protocol for part A if necessary to get good results in part B. Reflect on what you actually did in laboratory and/or what you would do differently. You may have to re-run part A simultaneously with part B next week. In your part B protocol, explain how your experience doing part A made you re-think your protocol.
Supplies in the Lab
• raw whole vegetables, such as turnips, carrots, pumpkin, eggplant, daikon radish root, winter squash• sodium chloride, either solid or as a stock solution• assorted sizes of beakers• test tubes in assorted sizes and racks to hold them• graduated cylinders and volumetrics of different sizes for making solutions• pipets and pipet pumps or bulbs• droppers: Pasteur and disposable• deionized or distilled water• sharp knives (paring or larger)• 6” rulers• cork borers in various sizes• balances with weighing paper and spatulas (1 per group if possible)• tape and/or marking pens for labeling• paper towels or Kimwipes; plastic wrap for sealing cut surfaces between labs; Parafilm• forceps for fishing the samples out of the beakers• osmometer and its supplies• NaCl, glucose, sucrose, urea for Part B
Proceedings of the Association for Biology Laboratory Education, Volume 32, 2011 141
Major Workshop: Osmolarity and Tonicity
Background Information and Assumptions
• NaCl is a nonpenetrating solute. The plant cell is filled with nonpenetrating solutes.• The internal osmolarity of the plant cell is less than or equal to that of a 4% NaCl solution.• The molecular weight of NaCl is 58.5 daltons and the dissociation factor for NaCl is 1.8 osmoles/mole. You will be given
the molecular weights of the Part B solutes. • You will be making all solutions. You should need no more than 100 mL of each solution. Think about how you can make
stock solutions and dilutions of those stock solutions.
Design Questions
1. How many different concentrations do you want to test? How many pieces of vegetable in each concentration? How will you make your vegetable pieces to minimize variability? Will you make new solutions for each concentration of solution or rely on dilutions of a stock solution? Will you put each piece of vegetable into a separate incubation container? How much solution should you use to incubate a piece of vegetable?
2. How will you measure water movement into and out of the plant tissue? Two options are weight and volume changes. Which will be more sensitive?
3. What variables do you need to control? At what points are experimental errors most likely to occur?
HINTS!
• Does knowing that you are using a 1% solution tell you anything about the osmolarity of that solution?• Your incubation time should be at least 40 minutes. • Do not allow samples to dry out before placing in the solutions. Remove any peel on your samples.• One function in Excel that you may find useful in this experiment is the “best fit” linear regression line to draw a line that
fits your data points. • Smart teams send the instructor their design for critique BEFORE the laboratory period.
Protocol B - Week Two
Your objective this week is to design an experiment to test for sugar or urea transport, using the same plant material that you used in week one.
Background
Sugar transport in animals is restricted to monosaccharides and uses either facilitated diffusion carriers (the GLUT family transporters) or a sodium-dependent secondary active transporter (SGLT) to move these sugars across cell membranes. What is known about sugar transport in plants? Your background research this week should focus on finding answers to the following questions, then using the information you find to design an experiment to test for sugar transport in your plant tissue.
What sugars are made and transported across cell membranes in plants? Where does this occur? (Caution: transport in phloem is bulk flow transport, not membrane transport.) Base your experimental design on the following premise: If a sugar is transported into a plant cell, it is a penetrating solute.
Before you design your experiment, work through the following examples in Table 3 to be sure you understand tonicity. In these examples, assume that one red blood cell (RBC or erythrocyte) is placed in a giant beaker. The volume difference is so large that any movement of solute or water from the beaker into the cell will not significantly affect the concentration of solu-tion in the beaker. We will assume that the internal concentration of the RBC is 300 mOsM. Urea will cross into the cell, so it is a penetrating solute. Sodium chloride is a functionally nonpenetrating solute and will not move into the red blood cell.
What happens when the RBC is placed in these solutions? Use the following rules to predict the osmolarity and tonicity of the solutions in the table below:
• The key to tonicity is the relative concentrations of nonpenetrating solutes in the solution and the cell. • Water will move into the region with the highest concentration of nonpenetrating solutes. • The concentration of penetrating solutes does not matter!
142 Tested Studies for Laboratory Teaching
Silverthorn
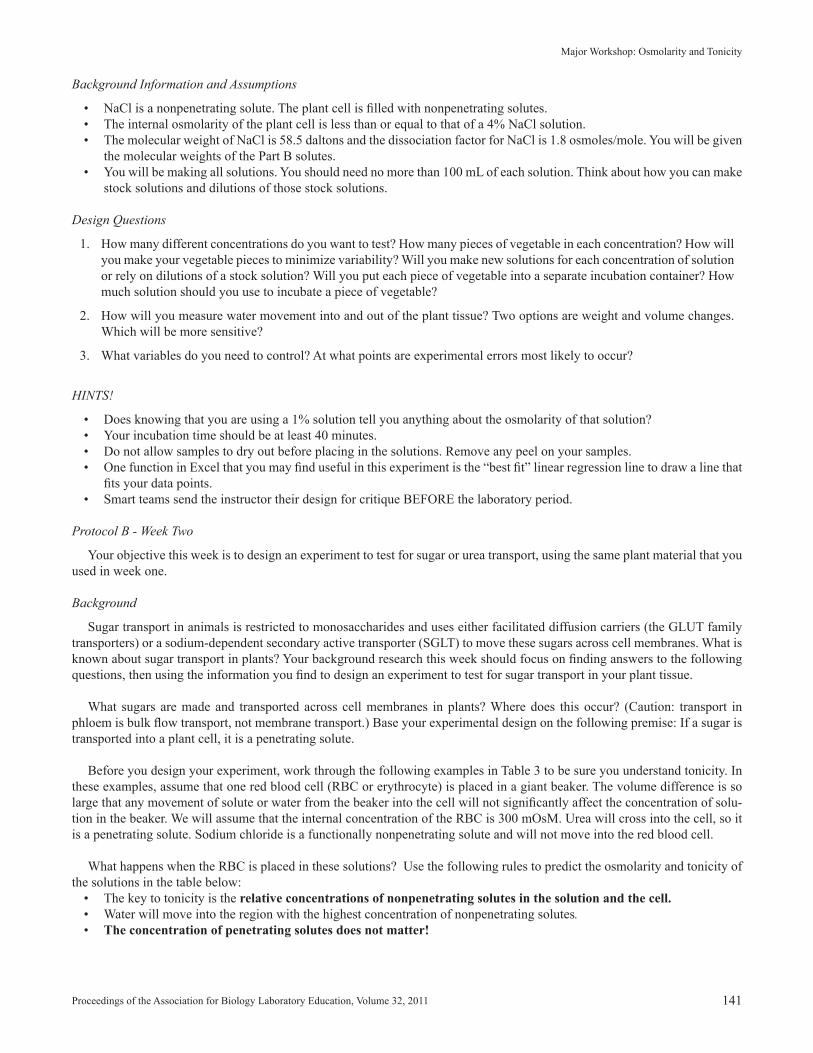
Table 3. State the osmolarity and tonicity of the following solutions to an RBC whose internal compo-sition is 300 mOsM of nonpenetrating solutes.
Solution is ________osmotic to RBC is ____tonic to RBC300 mOsM NaCl200 mOsM NaCl400 mOsM NaCl300 mOsM urea400 mOsM urea100 mOsM NaCl and 200 mOsM urea200 mOsM NaCl and 200 mOsM urea300 mOsM NaCl and 200 mOsM urea
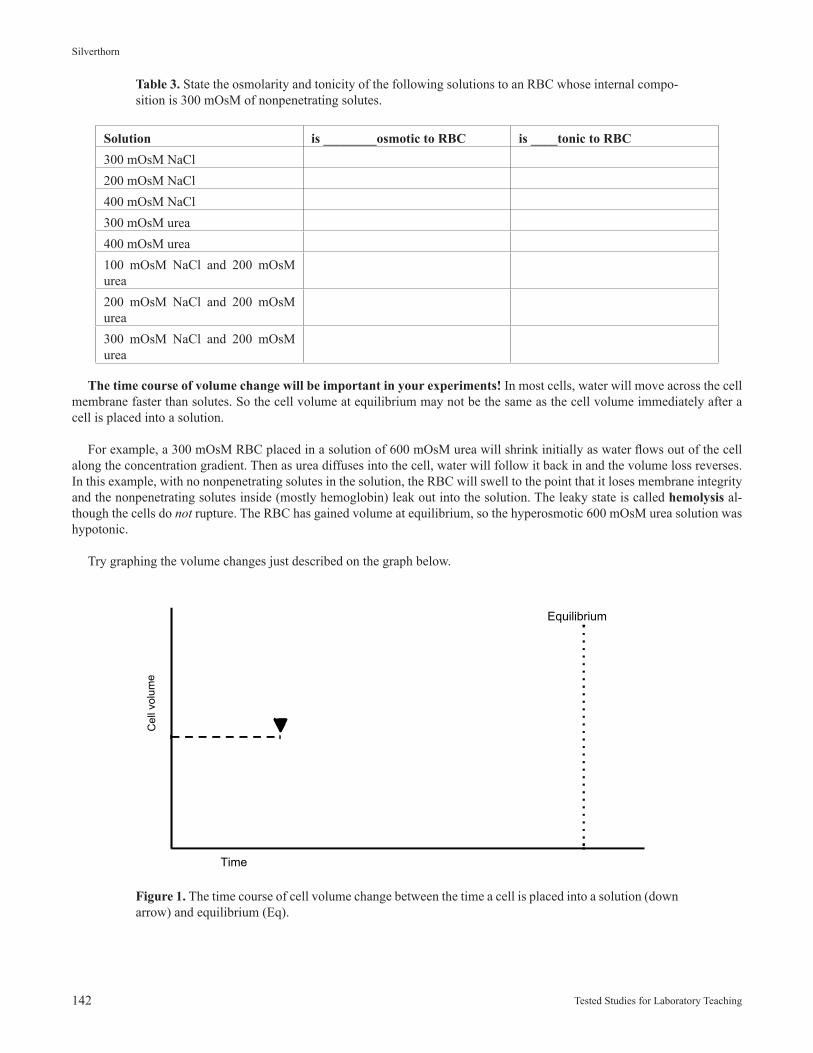
The time course of volume change will be important in your experiments! In most cells, water will move across the cell membrane faster than solutes. So the cell volume at equilibrium may not be the same as the cell volume immediately after a cell is placed into a solution.
For example, a 300 mOsM RBC placed in a solution of 600 mOsM urea will shrink initially as water flows out of the cell along the concentration gradient. Then as urea diffuses into the cell, water will follow it back in and the volume loss reverses. In this example, with no nonpenetrating solutes in the solution, the RBC will swell to the point that it loses membrane integrity and the nonpenetrating solutes inside (mostly hemoglobin) leak out into the solution. The leaky state is called hemolysis al-though the cells do not rupture. The RBC has gained volume at equilibrium, so the hyperosmotic 600 mOsM urea solution was hypotonic.
Try graphing the volume changes just described on the graph below.
Figure 1. The time course of cell volume change between the time a cell is placed into a solution (down arrow) and equilibrium (Eq).
Cel
lvol
ume
Time
Equilibrium
Proceedings of the Association for Biology Laboratory Education, Volume 32, 2011 143
Major Workshop: Osmolarity and Tonicity
Design of the Tonicity Experiment
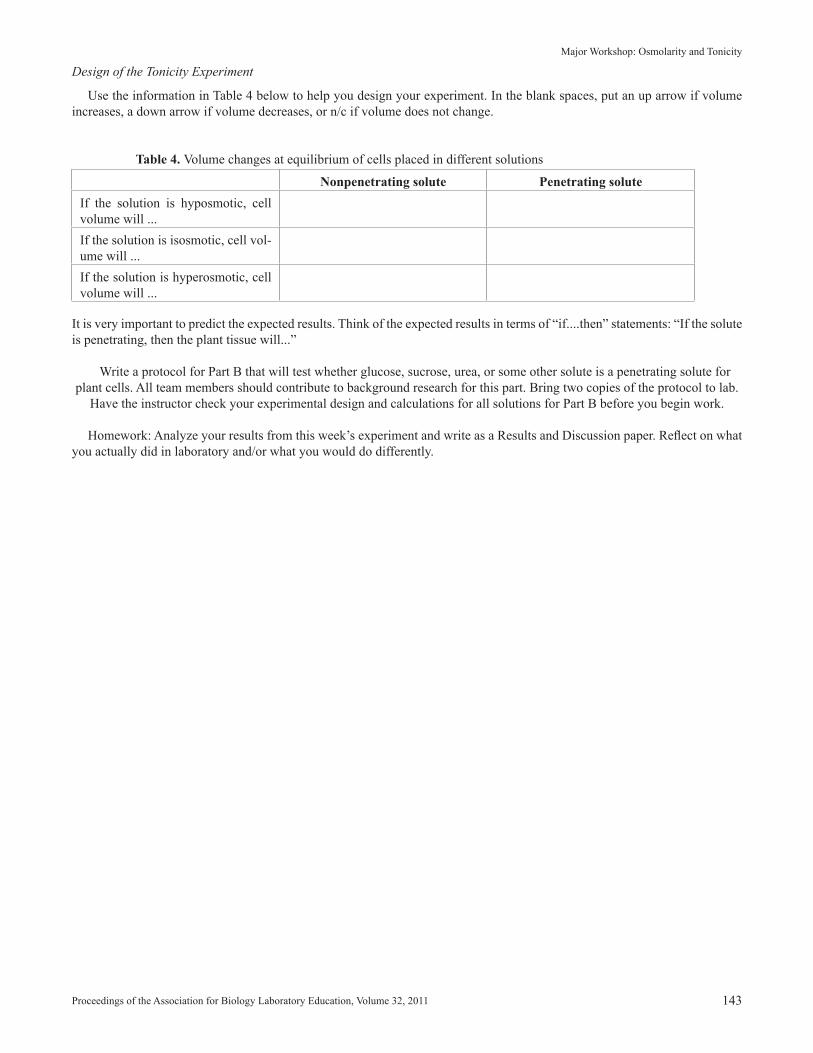
Use the information in Table 4 below to help you design your experiment. In the blank spaces, put an up arrow if volume increases, a down arrow if volume decreases, or n/c if volume does not change.
Table 4. Volume changes at equilibrium of cells placed in different solutions
Nonpenetrating solute Penetrating soluteIf the solution is hyposmotic, cell volume will ...If the solution is isosmotic, cell vol-ume will ...If the solution is hyperosmotic, cell volume will ...
It is very important to predict the expected results. Think of the expected results in terms of “if....then” statements: “If the solute is penetrating, then the plant tissue will...”
Write a protocol for Part B that will test whether glucose, sucrose, urea, or some other solute is a penetrating solute for plant cells. All team members should contribute to background research for this part. Bring two copies of the protocol to lab.
Have the instructor check your experimental design and calculations for all solutions for Part B before you begin work.
Homework: Analyze your results from this week’s experiment and write as a Results and Discussion paper. Reflect on what you actually did in laboratory and/or what you would do differently.
144 Tested Studies for Laboratory Teaching
Silverthorn
Check their dilution calculations as well. If an osmometer is not available, students can calculate osmolarity by converting their percent solution to molarity, then multiplying molarity times the dissociation factor for the solute.
Example: 150 mmol/L NaCl × 1.8 mosmol/mmol = 270 mOsM
Notes for the Instructor These instructions are for running the lab as an inquiry lab in which the students design their experiments and write their own protocols. Instructors may modify to make the ex-periment more directed.
Experimental Design for Week One
Experiment one is to determine the internal osmolarity of the plant. To do this, students should prepare a range of NaCl solutions. NaCl is nonpenetrating, therefore they can predict that the plant will gain water and swell if the NaCl solu-tion is hyposmotic (and therefore hypotonic) and lose water and shrink if the NaCl solution is hyperosmotic (hypertonic). The NaCl concentration where there is no volume change is the isosmotic concentration. This is also the internal osmo-larity of the plant cell.
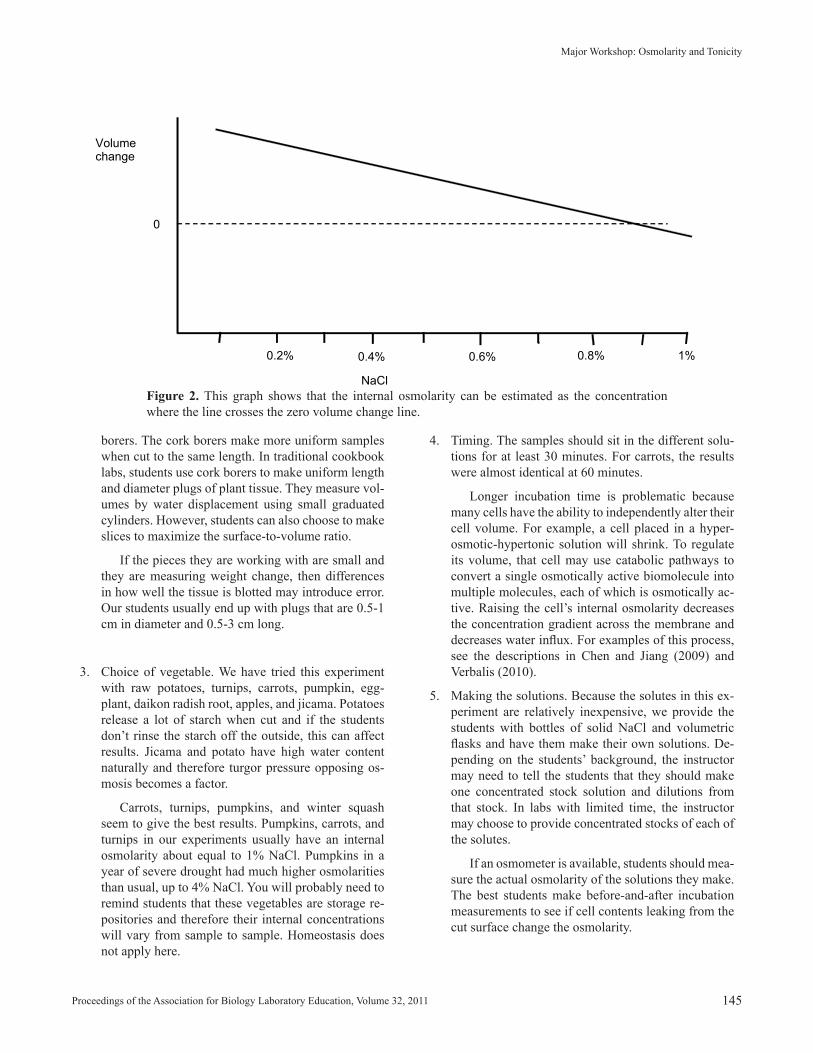
Typical results: Student data can be graphed as shown in Figure 2. The x-axis value where their best-fit line crosses the zero volume change line is the osmolarity. Notice that this student did not convert the x-axis units to osmolarity. If an osmometer is not available, students should calculate the predicted osmolarity using the dissociation factor of 1.8 for NaCl.
Experimental Design Notes - Week One
Students who are not comfortable with designing their own experiments are likely to continuously ask the instructor if their methods are “right.” It is important to reassure them that there may be more than one way to carry out the experi-ment, but some methods may give better results than others. The list below comments on some of the design decisions that students will have to make.
1. How to measure water movement. The traditional po-tato plug lab uses volume change in the samples but we have observed that weight changes are more sen-sitive than volume changes. However, let students do the experiment as they design it. Volume changes can be made by water displacement. Students will need to figure out the most accurate piece of glassware for measuring volume changes (a small graduated cylin-der).
2. How to make uniform samples. Students are provid-ed with large knives, paring knives, and sets of cork
Materials This list assumes 8 groups of 3-4 students each. When we run this set of experiments, students make their own decisions about what glassware to use. We have the lab-oratory set up like a research laboratory and they pull sup-plies from cabinets and drawers as needed. Some groups choose to run their incubations with one piece of vegetable per beaker or test tube while others will put multiple pieces into one beaker. We keep a large number of 25 and 50 mL beakers on hand for the incubations but test tubes can also be used, although it is harder to get the plugs out of the test tubes.
• raw whole vegetables, such as turnips, carrots, pump-kin, eggplant, daikon radish root, winter squash, 1 per group per week. We use the small pie pumpkins in the fall and each group gets a half.
• (solid) sodium chloride - 250 g bottle. Put into small jars so that each group can have one and so that they do not contaminate the stock jar.
• assorted sizes of beakers (25 mL to 250 mL). Plastic are inexpensive.
• test tubes and racks (small ones may be more useful for leaving samples to be tested at the osmometer)
• graduated cylinders and volumetrics of different sizes for making solutions
• pipets and pipet pumps or bulbs• droppers: Pasteur and disposable• deionized or distilled water• sharp knives (paring or larger) - 1 per group• 6” rulers - 1 per group• cork borers in various sizes • balances with weighing paper and spatulas -1 per
group if possible• tape and/or marking pens for labeling the beakers• paper towels or Kimwipes; plastic wrap for sealing cut
surfaces between labs; Parafilm• forceps for fishing the samples out of the beakers• osmometer and its supplies. The laboratory can be
done without it but results will not be as accurate.• solid glucose, sucrose, urea for Part B - 250 g each.
In jars as described above for NaCl if students will be making their solutions from scratch.
Solutions
The most independent format of this exercise allows stu-dents to make their own solutions from the dry chemicals. This can be wasteful when students do not know how to scale their calculations – they make up a liter of a solution when they only need 25 mL. We avoid this by making the students do all calculations for their solutions as homework before the lab, and we must OK their calculations before giv-ing them their jars of dry chemicals. The instructor can save time by providing students with a stock solution of 5% or 10% NaCl and stock solutions of sugars. The students then must make their own dilutions.
Proceedings of the Association for Biology Laboratory Education, Volume 32, 2011 145
Major Workshop: Osmolarity and Tonicity
4. Timing. The samples should sit in the different solu-tions for at least 30 minutes. For carrots, the results were almost identical at 60 minutes.
Longer incubation time is problematic because many cells have the ability to independently alter their cell volume. For example, a cell placed in a hyper-osmotic-hypertonic solution will shrink. To regulate its volume, that cell may use catabolic pathways to convert a single osmotically active biomolecule into multiple molecules, each of which is osmotically ac-tive. Raising the cell’s internal osmolarity decreases the concentration gradient across the membrane and decreases water influx. For examples of this process, see the descriptions in Chen and Jiang (2009) and Verbalis (2010).
5. Making the solutions. Because the solutes in this ex-periment are relatively inexpensive, we provide the students with bottles of solid NaCl and volumetric flasks and have them make their own solutions. De-pending on the students’ background, the instructor may need to tell the students that they should make one concentrated stock solution and dilutions from that stock. In labs with limited time, the instructor may choose to provide concentrated stocks of each of the solutes.
If an osmometer is available, students should mea-sure the actual osmolarity of the solutions they make. The best students make before-and-after incubation measurements to see if cell contents leaking from the cut surface change the osmolarity.
borers. The cork borers make more uniform samples when cut to the same length. In traditional cookbook labs, students use cork borers to make uniform length and diameter plugs of plant tissue. They measure vol-umes by water displacement using small graduated cylinders. However, students can also choose to make slices to maximize the surface-to-volume ratio.
If the pieces they are working with are small and they are measuring weight change, then differences in how well the tissue is blotted may introduce error. Our students usually end up with plugs that are 0.5-1 cm in diameter and 0.5-3 cm long.
3. Choice of vegetable. We have tried this experiment with raw potatoes, turnips, carrots, pumpkin, egg-plant, daikon radish root, apples, and jicama. Potatoes release a lot of starch when cut and if the students don’t rinse the starch off the outside, this can affect results. Jicama and potato have high water content naturally and therefore turgor pressure opposing os-mosis becomes a factor.
Carrots, turnips, pumpkins, and winter squash seem to give the best results. Pumpkins, carrots, and turnips in our experiments usually have an internal osmolarity about equal to 1% NaCl. Pumpkins in a year of severe drought had much higher osmolarities than usual, up to 4% NaCl. You will probably need to remind students that these vegetables are storage re-positories and therefore their internal concentrations will vary from sample to sample. Homeostasis does not apply here.
Volumechange
0
1%0.2% 0.4% 0.6% 0.8%
NaClFigure 2. This graph shows that the internal osmolarity can be estimated as the concentration where the line crosses the zero volume change line.
146 Tested Studies for Laboratory Teaching
Silverthorn
4. Allow students to get started on their first experi-ment according to the protocol they wrote before go-ing around to each group and checking on what they could improve.
5. If students choose to weigh their tissues, they should consistently blot off excess solution before weighing.
6. All solutions can go down the drain.
Optional Procedure
We ask students to bring two copies of their protocols. The instructor takes up both copies of the protocol, keeps one to grade, and hands out the rest randomly so that each group is executing another group’s protocol. We make the students put all books and backpacks in the storage room and close the door. They lose points if they need to look some-thing up or ask a question about it. Each group starts with 10 points. If the group using a pro-tocol has to ask questions of the authors or change the proto-col, the authors lose one point for each question or change. If a group needs instructions or help, they may lose a point at the instructor’s discretion.
Common Mistakes
• Using only one piece of vegetable for each concentra-tion of solution. Ask the students what their “n” for the experiment is. They may tell you that the “n” is the number of different saline concentrations they are test-ing. Point out that each saline is a different test. They usually get the point then that they have an “n” of 1 and will make replicates.
• Not testing the osmolarity of their salines before they incubate. They do not recognize that 1% NaCl is not an osmolarity. The question they are to answer is “what is the osmolarity of the cell?”
Experimental Design for Week Two
The experiment in the second week is to determine whether various compounds are penetrating or nonpenetrat-ing relative to the plant cell. The students must use the infor-mation they gathered on the internal osmolarity of the plant cell to design this experiment. The key to a successful experiment is to make the os-molarity of the unknown solution greater than the internal osmolarity of the plant. All hyposmotic solutions will be hy-potonic, no matter what the nature of the solutes (penetrating or nonpenetrating). See table below. So an unknown solution that is hyposmotic will not give results that help students dis-tinguish penetrating from nonpenetrating solutes. If they make a solution of their unknown that is exactly isosmotic, there will be no initial osmotic movement of wa-ter. If the unknown solute is penetrating, it will move into the plant, taking water with it. If it is nonpenetrating, there will be no movement of water and the cell will not change
6. Incubation volumes. Watch for students who are using such small incubation volumes that leakage from the cut cells on the surface of the plant tissue will affect the external osmolarity. Larger volumes are preferable (20 mL or more per piece of tissue).
7. How to graph and interpret data. The best graph for plotting the data was shown above. However, allow the students to decide how to make their graphs. A second graph that may or may not work well for a particular group is a graph that plots before and after weights (y axis) as a function of NaCl concentration. This works only if they choose the exact isotonic concentration as one of their test solutions.
Students often want to plot their data using a bar graph but a bar graph will not allow them to interpolate to find the point where volume/weight change is zero.
Discuss the concept of “best fit” lines and show them the function in Excel. Although the data points closest to the isosmotic point should be linear, it is pos-sible that the graph will curve and level off at the more extreme concentrations when the cells have swollen to the point that turgor pressure opposes osmotic pressure or shrunk to their smallest volume.
Class Process - Week One
1. Pick up both copies of protocol. Hand out protocols to different groups.
2. Give the groups 5-10 minutes to look over the proto-cols they’ve been given and make notes/questions.
3. Gather class back together for a discussion of what they’ve read or simply give the annotated protocols back to the groups that wrote them.
4. Set students to work on part A.
Specific Notes
1. We do not allow students to use the osmometer, so the students bring labeled samples of their solutions to the instructor for testing. Calibrate osmometers at start of laboratory. Have a piece of paper handy for recording the results as you read them.
2. Require students do all calculations for their solu-tions or dilutions as homework before the lab. Check their calculations and the volumes they are planning to make before giving them their jars of dry chemicals.
3. Have students wrap the cut vegetables in plastic wrap so that the cut surfaces don’t dry out, as drying will af-fect the results. Students should not let the samples sit around between cutting and weighing and placing in the solution.
Proceedings of the Association for Biology Laboratory Education, Volume 32, 2011 147
Major Workshop: Osmolarity and Tonicity
Experimental Design Notes - Week Two
Here are some suggestions about good design for a tonic-ity experiment. We deduct marks for missing elements in the protocol design students turn in, but if we catch the errors in lab, we correct the errors so that the students have a chance of getting decent data.
1. Students should have a rough idea of the plant’s os-molarity from the previous experiment. However, plants do not maintain osmotic homeostasis so they should run a NaCl control at the same time on the same plant tissue.
2. They should NOT use hyposmotic solutions because all hyposmotic solutions will be hypotonic.
3. They should use a range of concentrations, with the lowest concentration being no lower than their isos-motic concentration. The rationale for having mul-tiple concentrations is that they are not likely to get exactly the same concentrations for their control and experimental solutions.
4. They should measure the concentrations of ALL solu-tions with the osmometer if available. One common mistake is if they are working in percent solutions, they will assume that the concentration of 2% NaCl is equal to the concentration of 2% urea, which is wrong for two reasons. First, the NaCl dissociates while the urea does not. Second, the solutes have different mo-lecular weights.
5. They must have a control or they cannot really inter-pret their data. The control would be a series of NaCl concentrations, known to be a non-penetrating solute. We tell students that the graph comparing the time course volume changes of a cell to 400 mOsM NaCl and 400 mOsM urea (similar to the graph shown) is the clue to a good experimental design.
6. Some students may elect to do a time course of weight change, similar to the graph above. Other students may simply leave everything for 40 or more minutes, then measure. Both designs should give good results.
Safety and Clean-up
The main safety issue in this laboratory is making sure students don’t cut themselves with the knives while slicing the vegetables. We cut hard-shelled vegetables like pumpkin and winter squash in half for the students. Cleaning up is easy. Vegetables go into the garbage or compost pile, and saline and sugar solutions go down the drain.
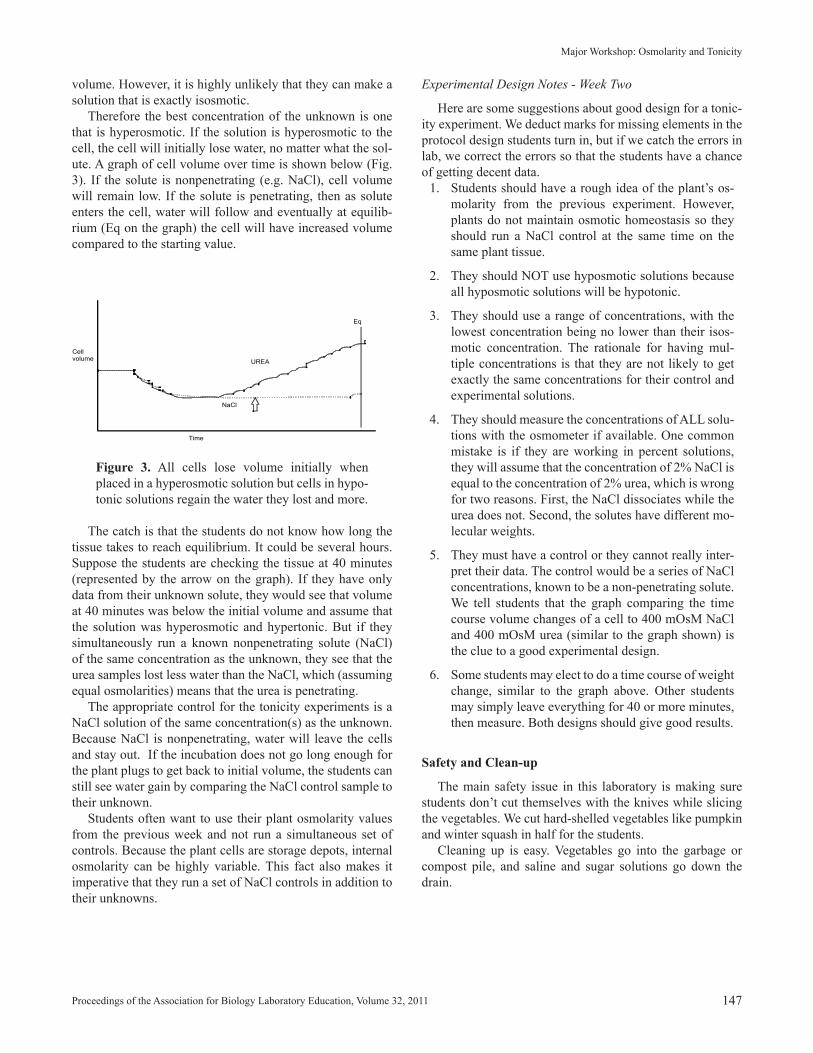
volume. However, it is highly unlikely that they can make a solution that is exactly isosmotic. Therefore the best concentration of the unknown is one that is hyperosmotic. If the solution is hyperosmotic to the cell, the cell will initially lose water, no matter what the sol-ute. A graph of cell volume over time is shown below (Fig. 3). If the solute is nonpenetrating (e.g. NaCl), cell volume will remain low. If the solute is penetrating, then as solute enters the cell, water will follow and eventually at equilib-rium (Eq on the graph) the cell will have increased volume compared to the starting value.
Figure 3. All cells lose volume initially when placed in a hyperosmotic solution but cells in hypo-tonic solutions regain the water they lost and more.
The catch is that the students do not know how long the tissue takes to reach equilibrium. It could be several hours. Suppose the students are checking the tissue at 40 minutes (represented by the arrow on the graph). If they have only data from their unknown solute, they would see that volume at 40 minutes was below the initial volume and assume that the solution was hyperosmotic and hypertonic. But if they simultaneously run a known nonpenetrating solute (NaCl) of the same concentration as the unknown, they see that the urea samples lost less water than the NaCl, which (assuming equal osmolarities) means that the urea is penetrating. The appropriate control for the tonicity experiments is a NaCl solution of the same concentration(s) as the unknown. Because NaCl is nonpenetrating, water will leave the cells and stay out. If the incubation does not go long enough for the plant plugs to get back to initial volume, the students can still see water gain by comparing the NaCl control sample to their unknown. Students often want to use their plant osmolarity values from the previous week and not run a simultaneous set of controls. Because the plant cells are storage depots, internal osmolarity can be highly variable. This fact also makes it imperative that they run a set of NaCl controls in addition to their unknowns.
Eq
Time
Cellvolume UREA
NaCl
148 Tested Studies for Laboratory Teaching
Silverthorn
transport, plants, urea, glucose, hexose, fructose, sucrose, sugar, plasma membrane. A bibliography of some of the ref-erences I find most helpful is in the Literature Cited section. Students who do the literature searches should come up with the following information. Urea is found in soil and is a source of nitrogen for plants. In plants, urea can move through water-filled pores (aquapo-rins) and is also transported by a urea-H+ symporter (Kojima et al., 2006). In that respect, plant urea transport is similar to urea movement in mammals. Urea therefore is a penetrating solute for plants. Sugars are also penetrating solutes for plant cells. The primary form of sugar transported from cell to cell by plants is sucrose rather than glucose as in animals, but monosac-charide transporters on the plasma membrane do exist in plants. The plant plasma membrane transporters for sugars are proton-sugar symporters, therefore acidic conditions pro-mote transport of sugars into the cell (Antony and Borland, 2009; Bush, 1989; Buttner and Sauer, 2000; Komora et al. 1977; Kuhn et al. 1999; Lemoine, 2000; Sauer, 2007; Truer-nit, 2001).
Additional Experiments
For additional experiments, students can test the effect of pH on sugar transport, compare the uptake of d and l isomers of a sugar, or test whether other mono- and disaccharides and sugar alcohols such as sorbitol are transported. According to Lalonde and Frommer (2008), the sucrose transporter of plants also transports maltose.
Acknowledgments I would like to thank the students and graduate teaching assistants in the BIO 371L Experimental Physiology Labo-ratory for sharing their successes and failures while this ac-tivity was being developed. I would also like to thank the participants at the ABLE 2010 workshop for their thoughtful suggestions, particularly Bob Kosinski and Bob Hodson for their comments on turgor pressure and the dissociation fac-tor.
Literature CitedAntony, E., and A. M. Borland. 2009. The role and regula-
tion of sugar transporters in plants with crassulacean acid metabolism. Progress in Botany, 70:127-143.
Bush, D. R. 1989. Proton-coupled sucrose transport in plas-malemma vesicles isolated from sugar beet (Beta vul-garis L. cv Great Western) leaves. Plant Physiology, 89(4): 1318–1323.
Buttner, M., and N. Sauer. 2000. Monosaccharide transport-ers in plants: structure, function and physiology. Bio-chimica et Biophysica Acta (BBA) - Biomembranes, 1465(1-2):263-274.
Answers for Questions in the Student Outline
1. The 5 liters contains 25 g of glucose. If you pour out two liters, the concentration of the solution does not change and is still 5 g/L.
2. (3 × 12) + (8 × 1) + (3 × 16) = 92, the molecular weight of glycerol. 92 g glycerol/1 L = ? g/0.5 L. Weigh out 46 g of glycerol, place in a 500 mL volumetric flask and add water to give a final volume of 500 mL.
3. Prediction table
Non-penetrating solute
Penetrating solute
If solution is hyposmotic, cell volume will ...
increase increase
If solution is isos-motic, cell volume will ...
not change increase
If solution is hyperosmotic, cell volume will ...
decrease increase
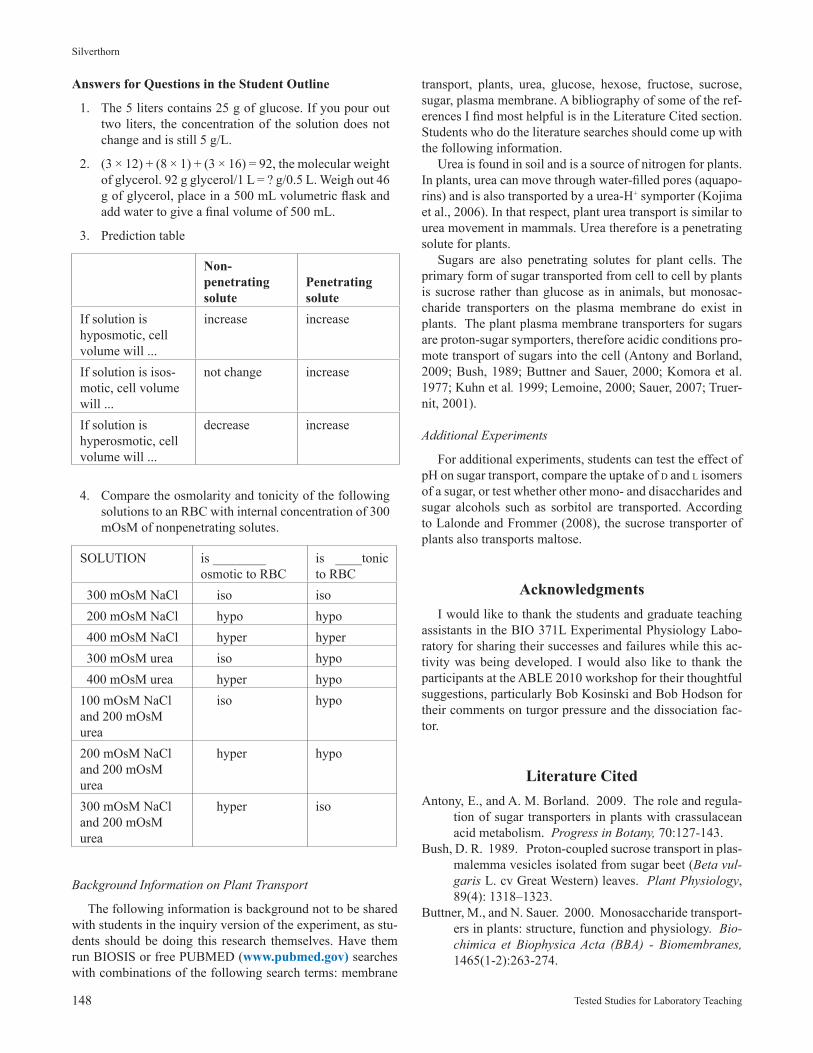
4. Compare the osmolarity and tonicity of the following solutions to an RBC with internal concentration of 300 mOsM of nonpenetrating solutes.
SOLUTION is ________osmotic to RBC
is ____tonic to RBC
300 mOsM NaCl iso iso 200 mOsM NaCl hypo hypo 400 mOsM NaCl hyper hyper 300 mOsM urea iso hypo 400 mOsM urea hyper hypo100 mOsM NaCl and 200 mOsM urea
iso hypo
200 mOsM NaCl and 200 mOsM urea
hyper hypo
300 mOsM NaCl and 200 mOsM urea
hyper iso
Background Information on Plant Transport
The following information is background not to be shared with students in the inquiry version of the experiment, as stu-dents should be doing this research themselves. Have them run BIOSIS or free PUBMED (www.pubmed.gov) searches with combinations of the following search terms: membrane
Proceedings of the Association for Biology Laboratory Education, Volume 32, 2011 149
Major Workshop: Osmolarity and Tonicity
Truernit, E. 2001. Plant physiology: the importance of su-crose transporters. Current Biology, 11(5):R169-R171.
Verbalis, J. G. 2010. Brain volume regulation in response to changes in osmolality. Neuroscience, 168(4): 862-870.
About the Author Dee Unglaub Silverthorn studied biology as an under-graduate at Tulane University and earned a Ph.D. in marine science from the University of South Carolina. Her research interest is epithelial transport, and recent work in her labora-tory has focused on aldosterone-mediated transport proper-ties of the chick allantoic membrane. She began her teach-ing career in the Physiology Department at the Medical University of South Carolina but over the years has taught a wide range of students, from medical and college students to one year teaching high school biology and algebra. At the University of Texas at Austin she lectures in physiology, co-ordinates student laboratories in physiology, and instructs graduate students in a course on developing teaching skills in the life sciences. She has received numerous teaching awards and honors, including the Society for College Sci-ence Teachers Outstanding Undergraduate Science Teacher and the American Physiological Society Arthur C. Guyton Physiology Educator of the Year. She is the author of Hu-man Physiology: An Integrated Approach, currently in its fifth edition. In addition to ABLE, she is an active member of the American Physiological Society, the Human Anatomy and Physiology Society, the American Association of Anato-mists, the Society for College Science Teachers and the So-ciety for Comparative and Integrative Biology.
Chen, H., and J. G. Jiang. 2009. Osmotic responses of Du-naliella to the changes of salinity. Journal of Cellular Physiology, 219(2): 251-258.
Kojima, S., A. Bohner, and N. von Wiren. 2006. Molecu-lar mechanisms of urea transport in plants. Journal of Membrane Biology, 212(2):83-91.
Komora, E., M. Rottera, and W. Tannera. 1977. A proton-cotransport system in a higher plant: Sucrose transport in Ricinus communis. Plant Science Letters, 9(2):153-162.
Kosinski, R. and C. K. Morlok. 2008. Challenging miscon-ceptions about osmosis. Pages 63-87 in Tested Stud-ies for Laboratory Teaching, Volume 30 (K.L. Clase, Editor). Proceedings of the 30th Workshop/Conference of the Association for Biology Laboratory Education (ABLE), 403 pages.
Kuhn, C., L. Barker, L. Burkle, and W. Frommer. 1999. Up-date on sucrose transport in higher plants. Journal of Experimental Botany, 50: 935-953.
Lalonde, S. and W. B. Frommer. 2008. Sucrose/maltose transporter. http://wiki.genomics.purdue.edu/index.php/Sucrose_transporter_gene_family. Accessed May 11, 2010.
Lemoine, R. 2000. Sucrose transporters in plants: update on function and structure. Biochimica et Biophysica Acta (BBA) - Biomembranes, 1465(1-2):246-262.
Sauer, N. 2007. Molecular physiology of higher plant su-crose transporters. FEBS Letters, 581(12):2309-17.
Silverthorn, D. 2010. Using IV fluid therapy to teach the principles of osmolarity & tonicity. MedEdPORTAL, http://services.aamc.org/30/mededportal/servlet/s/segment/mededportal/?subid=8082
Taiz, L., and E. Zeiger. Plant Physiology. Third Edition. Sinauer Associates, Inc., Sunderland, Massachusetts, 689 pages.
150 Tested Studies for Laboratory Teaching
Silverthorn
Mission, Review Process & Disclaimer The Association for Biology Laboratory Education (ABLE) was founded in 1979 to promote information exchange among university and college educators actively concerned with teaching biology in a laboratory setting. The focus of ABLE is to improve the undergraduate biology laboratory experience by promoting the development and dissemination of interesting, in-novative, and reliable laboratory exercises. For more information about ABLE, please visit http://www.ableweb.org/ Papers published in Tested Studies for Laboratory Teaching: Proceedings of the Conference of the Association for Biology Laboratory Education are evaluated and selected by a committee prior to presentation at the conference, peer-reviewed by participants at the conference, and edited by members of the ABLE Editorial Board. Although the laboratory exercises in this proceedings volume have been tested and due consideration has been given to safety, individuals performing these exercises must assume all responsibilities for risk. ABLE disclaims any liability with re-gards to safety in connection with the use of the exercises in this volume.
Citing This Article Silverthorn, D. 2011. Osmolarity and Tonicity: An Inquiry Laboratory Using Plant Material. Pages 135-150, in Tested Stud-ies for Laboratory Teaching, Volume 32 (K. McMahon, Editor). Proceedings of the 32nd Conference of the Association for Biology Laboratory Education (ABLE), 445 pages. http://www.ableweb.org/volumes/vol-32/v32reprint.php?ch=12 Compilation © 2011 by the Association for Biology Laboratory Education, ISBN 1-890444-14-6. All rights reserved. No part of this publication may be reproduced, stored in a retrieval system, or transmitted, in any form or by any means, electronic, mechanical, photocopying, recording, or otherwise, without the prior written permission of the copyright owner. Use solely at one’s own institution with no intent for profit is excluded from the preceding copyright restriction, unless otherwise noted on the copyright notice of the individual chapter in this volume. Proper credit to this publication must be included in your laboratory outline for each use; a sample citation is given above. Upon obtaining permission or with the “sole use at one’s own institution” exclusion, ABLE strongly encourages individuals to use the exercises in this proceedings volume in their teaching program.
End Adams