osml4 - process design
DESCRIPTION
operations strategyTRANSCRIPT

Operations and Service Management 1
Operations Management
Process Strategy Chapter 6
2
Dell Excel
Direct From Dell 2000 Pcs and 4000 servers delivered to
Walmart in 6 weeks. 3700 Pcs delivered to Delta’s reservation in 11
days. Manufacturing from Six locations – the latest
one is OptiPlex plant in Texas with a capability to produce 20,000 machines per day.
The command center consists of 100 servers.
Operations and Service Management

3
Dell Excel
Direct From Dell Total plant area 200,000 sq ft ( equivalent
to 23 football fields), however incoming material allocated area is only 100 sq ft – just 2 hours of component inventory.
Finished product inventory – corporate-wise – 5 days compared to similar industry – 50 to 90 days.
Production schedule revised – every two hours
Operations and Service Management

4
Dell Excel
Direct From Dell Online order downloaded – every hour. System notifies suppliers exact material
needs. Parts needed are confirmed within 15
minutes with a delivery time of 1 Hr. 15 minutes.
Delivery average is 2 days. Frictionless trade – between manufacturer,
supplier and customer.
Operations and Service Management

5
Process Strategies
Process – value creation activities Process strategy – organization’s
approach for producing goods or providing services
Objective Meet or exceed customer requirements Meet cost & managerial goals
Has long-run effects Production efficiency Product & volume flexibility Cost & quality
Operations and Service Management

6
Product-Process Matrix
Process focusprojects, job shop,
(machine, print, carpentry)
Standard RegisterRepetitive
(autos, motorcycles)Harley Davidson
Product focus(commercial baked goods, steel, glass)
Nucor Steel
High VarietyOne or few units per run, high variety(allows customization)
Changes in modulesModest runs, standardized modules
Changes in attributes (such as grade, quality, size, thickness, etc.) Long runs only
Mass Customization
(difficult to achieve, but huge rewards)
Dell Computer Co.
Poor strategy
Low-Volume(Intermittent)
Repetitive Process(Modular)
High-Volume(Continuous)
Operations and Service Management

7
Process-Focused Strategy
• Facilities are organized around specific activities or processes
• General purpose equipment and skilled personnel
• High degree of product flexibility
• Typically high costs and low equipment utilization
• Product flows may vary considerably making planning and scheduling a challenge
Operations and Service Management

Process Focused
Job shop
Operations and Service Management 8
Many Many inputsinputs
Many Many variety variety
of of outputsoutputs
Ma
ny
de
part
me
nts
an
d
ma
ny
rou
tings

9
Process Focus - Pros & Cons
Advantages Greater product flexibility More general purpose equipment –
equipment not dedicated to one product
Disadvantages High variable cost More highly trained personnel More difficult production planning &
control Low equipment utilization (5% to 25%)
Operations and Service Management

10
Process-Focus Examples
Bank
Machine Shop
Hospital
Operations and Service Management

11
Repetitive Focused Strategy
Facilities often organized by assembly lines
Characterized by modules Parts & assemblies made previously
Modules combined for many output options
Other names Assembly line E.g. auto-manufacturing, fast-food, pc’s,
house-hold appliances, etcOperations and Service Management

12
Repetitive Focus
Operations and Service Management

13
Repetitive Focus - Considerations
Product focused process that uses modules
More structured than process-focused, less
structured than product focused
Enables quasi-customization
Using modules, it enjoys economic
advantage of continuous process, and
custom advantage of low-volume, high-
variety model
Operations and Service Management

14
Repetitive Focus - Examples
Truck
Clothes Dryer
Fast Food
McDonald’sover 95 billion served
McDonald’sover 95 billion served
Operations and Service Management

15
Product-Focused Strategy Facilities are organized by product
High volume, low variety
Conversion or further processing of undifferentiated materials such as petroleum, chemicals, or beer
Follows a predetermined sequence of steps, but flow is continuous rather than discrete – highly standardized
Other names Line flow production
Continuous productionOperations and Service Management

16
Product Focus
Operations and Service Management
17
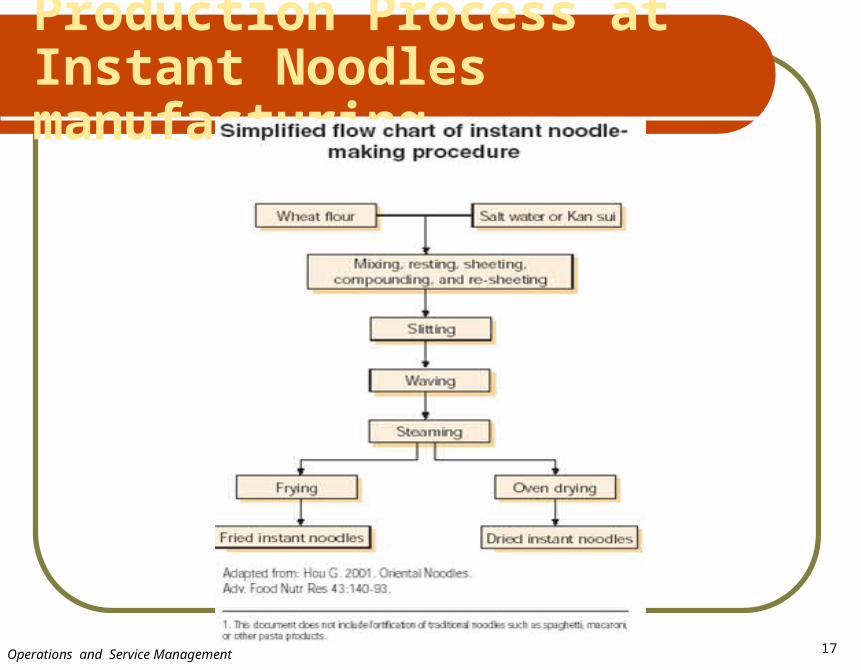
Production Process at Instant Noodles manufacturing
Operations and Service Management
18
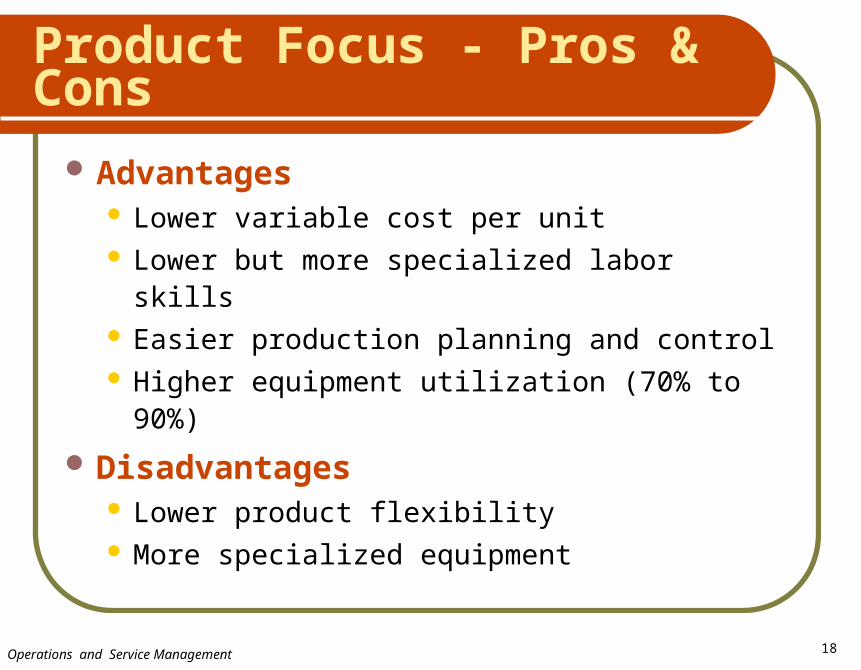
Product Focus - Pros & Cons
Advantages Lower variable cost per unit Lower but more specialized labor skills Easier production planning and control Higher equipment utilization (70% to
90%)
Disadvantages Lower product flexibility More specialized equipment
Operations and Service Management

19
Product-Focused Examples
Light Bulbs (Discrete)
Paper (Continuous)
Noodles (Continuous, then Discrete)
Operations and Service Management

20
Mass Customization
Using technology and imagination to rapidly mass-produce products that cater to unique customer desires
Under mass customization the three process models become so flexible that distinctions between them blur, making variety and volume issues less significant
Operations and Service Management

21
Process Strategies
Rapid throughput techniques
Mass Customization
Modular techniques
Repetitive FocusModular design
Flexible equipment
Product-focusedLow variety, high volume
High utilization (70% - 80%)Specialized equipment
Process-focusedHigh variety, low volume
Low utilization (5% - 20%)General purpose equipment
Effective scheduling techniques
Operations and Service Management

22
Process Analysis and Design
Is the process designed to achieve competitive advantage in terms of differentiation, response, or low cost?
Does the process eliminate steps that do not add value?
Does the process maximize customer value as perceived by the customer?
Will the process win orders?
Operations and Service Management
23
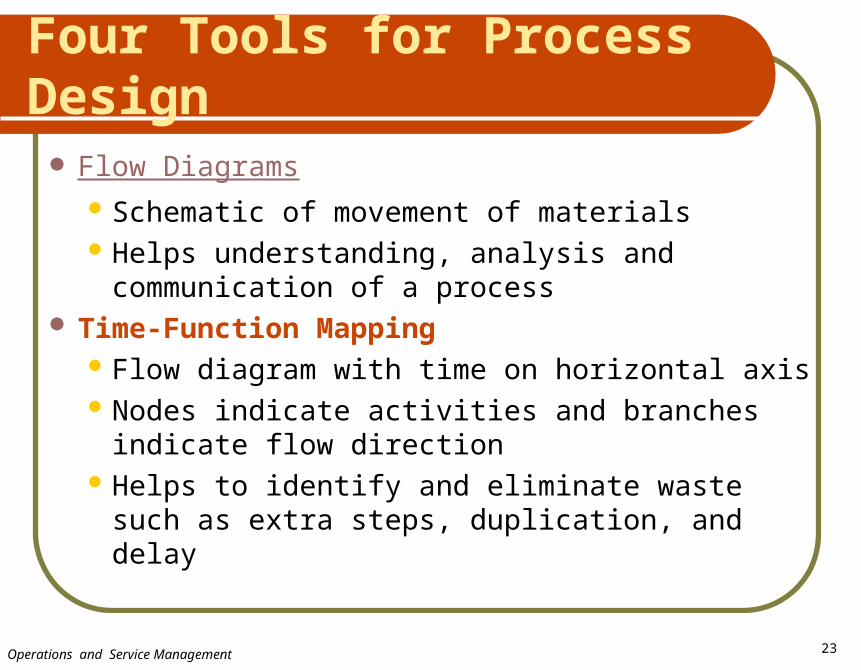
Four Tools for Process Design
Flow Diagrams Schematic of movement of materials Helps understanding, analysis and
communication of a process Time-Function Mapping
Flow diagram with time on horizontal axis Nodes indicate activities and branches
indicate flow direction Helps to identify and eliminate waste such
as extra steps, duplication, and delay
Operations and Service Management
24
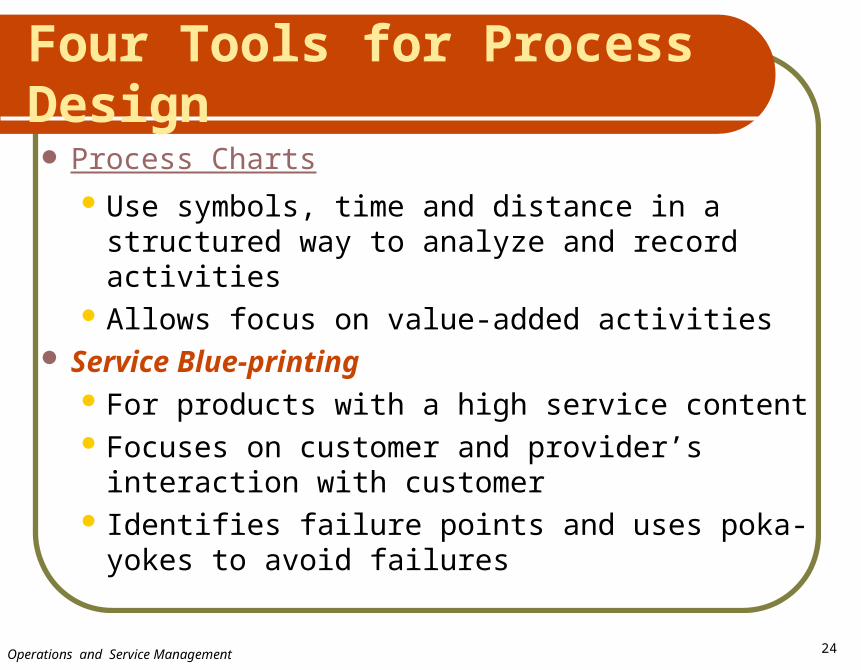
Four Tools for Process Design Process Charts
Use symbols, time and distance in a structured way to analyze and record activities
Allows focus on value-added activities Service Blue-printing
For products with a high service content Focuses on customer and provider’s
interaction with customer Identifies failure points and uses poka-yokes
to avoid failures
Operations and Service Management

25
Process Flow Diagram
Shipping
Customer
Customer sales representative
take order
Prepress Department(Prepare printing plates
and negatives)
Printing Department
Collating Department
Gluing, binding, stapling, labeling
Polywrap Department
Purchasing(order inks, paper,
other supplies)
Vendors
Receiving
Warehousing(ink, paper, etc.)
Accounting
Information flowMaterial flow
Operations and Service Management

26
Time Function Map(Baseline)
Customer
Sales
Production control
Plant A
Warehouse
Plant B
Transport
Order Product
Process Order
Extrude
Receive product
Wait
Move
Wait Wait Wait
Move
Ord
er
Ord
er
WIP
WIP
WIP W
IP
Prod
uct
Prod
uct
Prod
uct
12 days 1 day 1 day 1 day 1 day13 days 4 days 10 days 9 days
52 days
Operations and Service Management

27
Time Function Map(Target)
1 day 1 day 1 day1 day 2 days
Customer
Sales
Production control
Plant
Warehouse
Transport
Order Product
Process Order
Print Extrude
Receive product
Wait
Wait
Move
Ord
er
Ord
er
Prod
uct
Prod
uct
WIP
6 days
Product
Operations and Service Management

28
Process Chart – Hamburger Assembly
Dist. (Ft)
Time
(Mins)
Chart Symbols
Process Description
- Meat Patty in Storage
1.5 .05 Transfer to Broiler
2.50 Broiler
.05 Visual Inspection
1.0 .05 Transfer to Rack
.15 Temporary Storage
.5 .10 Obtain Buns, Lettuce, etc.
.20 Assemble Order
.5 .05 Place in Finish Rack
3.5 3.15 TOTALS
Value-added time = Operation time/Total time = (2.50+.20)/3.15=85.7%
Ⅾ
Ⅾ
ⅮⅮⅮⅮⅮⅮⅮ
Ⅾ
2 4 1 - 2
Operations and Service Management

29
The Pizza restaurant blueprint
E. LAWS, Improving tourism and hospitality services
Operations and Service Management

The Service Process Matrix
Operations and Service Management 30

35
Techniques for Improving Service Productivity
Separation
Self-service
Postponement
Focus
Structure service so customers must go where service is offered
Self-service so customers examine, compare and evaluate at their own pace
Customizing at delivery
Restricting the offerings
Strategy Technique
Operations and Service Management

36
Techniques for Improving Service Productivity - Continued
Modules
Automation
Scheduling Training
Modular selection of service. Modular production
Separating services that lend themselves to automation
Precise personnel scheduling
Clarifying the service options
Explaining how to avoid problems
Operations and Service Management

37
Capacity Planning
Operations and Service Management
38
Capacity and Strategy
Capacity decisions must be integrated
into the mission and strategy of
organization
All 10 OM decisions as well as marketing
and finance are impacted by changes in
capacity
Investments in capacity not to be isolated
but a coordinated step to achieve
organization’s objectiveOperations and Service Management

39
Types of Planning Over a Time Horizon
Add FacilitiesAdd long lead time equipment
Schedule Jobs Schedule Personnel Allocate Machinery
Sub-ContractAdd EquipmentAdd Shifts
Add PersonnelBuild or Use Inventory
Long Range Planning
Intermediate Range Planning
Short Range Planning
Modify Capacity Use Capacity
*
*
*Limited options exist
Operations and Service Management

40
Definition and Measures of Capacity
DesignCapacity:
The maximum “throughput,” or number of units a facility can produce in a period of time.
Utilization: Actual output as a percent of design capacity.
Effective capacity:
Capacity a firm can expect to receive given its product mix, methods of scheduling, maintenance, and standards of quality.
Efficiency: Actual output as a percent of effective capacity.
Operations and Service Management
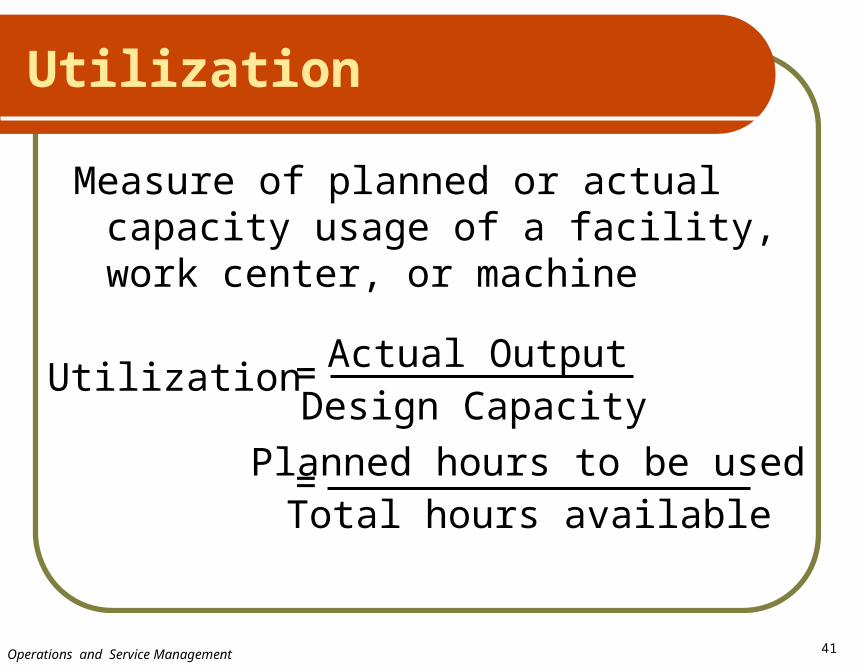
41
Measure of planned or actual capacity usage of a facility, work center, or machine
UtilizationActual Output
Design CapacityPlanned hours to be used
Total hours available
=
=
Utilization
Operations and Service Management

42
Measure of how well a facility or machine is performing when used
EfficiencyActual output
Effective CapacityActual output in units
Standard output in units
=
=
Efficiency
Operations and Service Management

43
Special Requirements for Making Good Capacity Decisions
Forecast demand accurately
Understand the technology and
capacity increments
Find the optimal operating level
(volume)
Build for change
Operations and Service Management

45
Approaches to Capacity Expansion
Expected Demand Expected Demand
Expected Demand Expected Demand
Time in Years Time in Years
Time in YearsTime in Years
Dem
and
Dem
and
Dem
and
Dem
and
New Capacity
New Capacity New Capacity
New Capacity
Capacity leads demand with an incremental expansion Capacity leads demand with a one-step expansion
Capacity lags demand with an incremental expansionAttempts to have an average capacity, with
an incremental expansion
Operations and Service Management

46
Managing Demand
Demand exceeds capacity – curtail demand by raising prices, scheduling long lead times, etc
Capacity exceeds demand – stimulate demand through price reductions, aggressive marketing, etc
Adjusting to seasonal demands – offer products with complementary demand patterns – pdts for which demand is high for one when low for the other
Operations and Service Management

48
Managing Capacity
1. Making staffing changes (increasing or decreasing the number of employees)
2. Adjusting equipment and processes – which might include purchasing additional machinery or selling or leasing out existing equipment
3. Improving methods to increase throughput; and/or
4. Redesigning the product to facilitate more throughput
Operations and Service Management
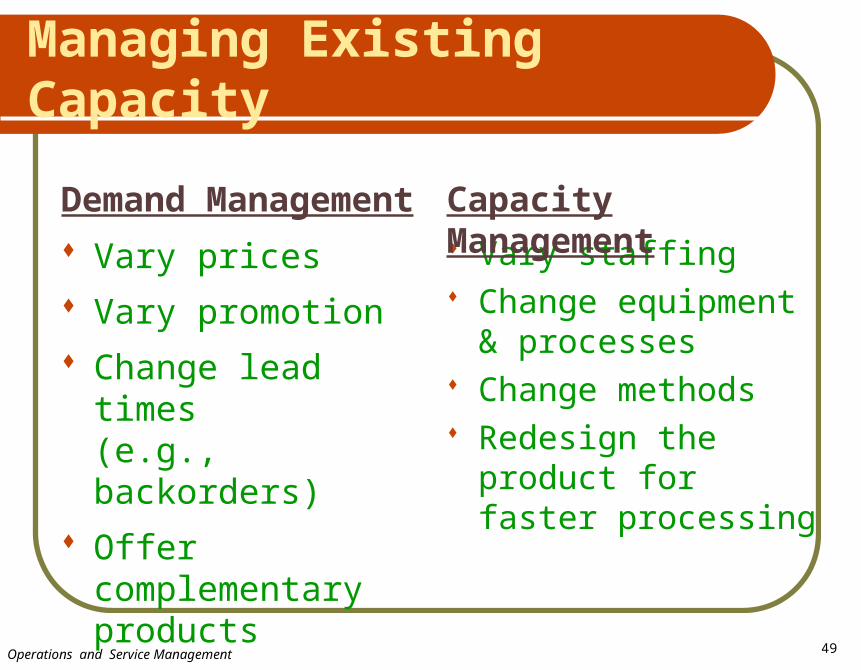
49
Vary staffing Change equipment
& processes Change methods Redesign the
product for faster processing
Capacity Management
Vary prices Vary promotion Change lead times
(e.g., backorders) Offer
complementary products
Demand Management
Managing Existing Capacity
Operations and Service Management

50
Breakeven Analysis
Technique for evaluating process & equipment alternatives
Objective: Find the point ($ or units) at which total cost equals total revenue
Assumptions Revenue & costs are related linearly to
volume All information is known with certainty No time value of moneyOperations and Service Management

51
Break-Even Analysis
Fixed costs: costs that continue
even if no units are produced:
depreciation, taxes, debt, mortgage
payments, salaries, etc
Variable costs: costs that vary with
the volume of units produced: labor
wages, materials, portion of utilities
Operations and Service Management

52
Breakeven Chart
Fixed cost
Variable cost
Total cost line
Total revenue line
ProfitBreakeven pointTotal cost = Total revenue
Volume (units/period)
Cost
in D
olla
rs
Loss
Profit
Operations and Service Management

Operations and Service Management 53
Crossover Chart
Smooth Boards Inc., wants to enter the market quickly with a new finish on its ski boards. It has three choices: Repair the old equipment at a cost of $800, Make major modifications at the cost of $1,100, orPurchase new equipment at a net cost of $1,800 If the firm chooses to repair the old equipment, materials and labor cost would be $1.10 per board. If it chooses to make modifications, materials and labor cost would be $0.70 per board. If it buys new equipment, variable costs are estimated at $0.40 per board. Graph the three total cost lines on the same chart (preferably on graph paper)Which alternative would be chosen if more than 3,000 ski-boards can be sold?Which alternative should the firm use if it thinks the market for boards would be between 1,000 and 2,000?What are the cross-over points from the graph?

Operations and Service Management 54
Crossover Chart
Fixed cost - Process A
Fixed cost - Process BFixed cost - Process C
Total cost - Process CTotal cost - Process B
Total co
st - P
roce
ss A
Process A: low volume, high varietyProcess B: Repetitive
Process C: High volume, low variety
Process CProcess BProcess A Lowest cost process