oslo, 10 february 2015 q4 2014 presentation - evry · •gaining share in sme outsourcing o five...
TRANSCRIPT

Q4 2014
Presentation
CEO Terje Mjøs
Oslo, 10 February 2015

2
• Part I – Q4`14 Report
o Highlights
o Group
o Segments
o Key figures 2014
• Part II – Market outlook
• Summary
• Appendix
Q4 2014 presentation

Highlights
3
Q4 2014 presentation
• Apax offer of NOK 16 per share recommended by the Board of Directors
o Offer period extended until February 11
o Acceptance as of February 3 was approximately 87%
• Increase in order back-log of NOK 0.7 billion
o Contract with a group of savings banks awarded
• EBITA margins increasing
o EVRY Financial Services continues to strengthen its EBITA margin
o EVRY Sweden reports solid improvement
o EVRY Norway lagging
• Further reduction in working capital

Q
4
2
0
1
3
p
r
e
s
e
n
t
a
t
i
o
n
Group figures
EVRY Q4 2014 – Part I
4

Solid cash flow and increased EBITA margin
5
Q4 2014 presentation
• Revenue NOK 3,364 million (3,473)o Organically down -3 %
• EBITA** up to NOK 268 million (243)o Margin 8.0 (7%)
• Solid operational cash flow** of NOK 706million (691) in Q4o Working capital still declining
• Earnings per share** NOK 0.67 (0.46)
*Decision made to close EVRY Denmark A/S, hence business classified as
discontinued, EBITA and revenue figures restated accordingly
**Before non-recurring items
Key group figures*

Non-recurring items
6
Q4 2014 presentation
• Non-recurring items of NOK 138 million in the quarter
o Restructuring costs of NOK 75 million related to FTE
reductions in Norway and Sweden
- In line with guiding given in Q3
o Costs related to the strategic process in EVRY of NOK
63 million
• Costs related to close down of SAP unit in Denmark (NOK 17 million) included in the figure reported as discontinued operations
- Restructuring costs somewhat lower than guiding
given in Q3
Key group figures
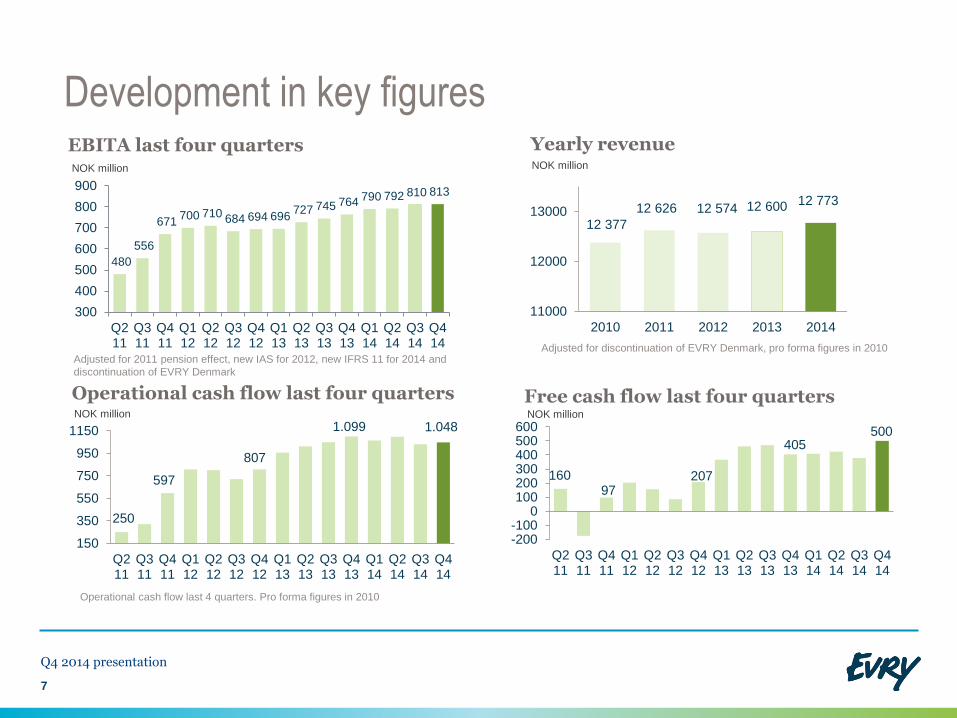
Development in key figures
7
Yearly revenueEBITA last four quarters
NOK million
Operational cash flow last 4 quarters. Pro forma figures in 2010
Operational cash flow last four quarters
Adjusted for 2011 pension effect, new IAS for 2012, new IFRS 11 for 2014 and
discontinuation of EVRY Denmark
NOK million NOK million
Q4 2014 presentation
Adjusted for discontinuation of EVRY Denmark, pro forma figures in 2010
480
556
671 700 710 684 694 696
727 745 764 790 792 810 813
300
400
500
600
700
800
900
Q211
Q311
Q411
Q112
Q212
Q312
Q412
Q113
Q213
Q313
Q413
Q114
Q214
Q314
Q414
12 377
12 626 12 574 12 600 12 773
11000
12000
13000
2010 2011 2012 2013 2014
250
597
807
1.099 1.048
150
350
550
750
950
1150
Q211
Q311
Q411
Q112
Q212
Q312
Q412
Q113
Q213
Q313
Q413
Q114
Q214
Q314
Q414
160 97
207
405 500
-200-100
0100200300400500600
Q211
Q311
Q411
Q112
Q212
Q312
Q412
Q113
Q213
Q313
Q413
Q114
Q214
Q314
Q414
Free cash flow last four quartersNOK million

Continued growth in Sweden and Financial Services
8
Q4 2014 presentation
12%
2%0% -2%
4%
12%10%
6%
1%
4% 3%
-5%
0%
5%
10%
15%
Q212
Q312
Q412
Q113
Q213
Q313
Q413
Q114
Q214
Q314
Q414
-3%
-9%
-5%
-7%
-4%-5%
1%
4%
1%
-1%
-7%-10%
-5%
0%
5%
Q212
Q312
Q412
Q113
Q213
Q313
Q413
Q114
Q214
Q314
Q414
14%
9%
-5% -4%
-9%
-6%
1%3%
6%
2% 1%
-10%
-5%
0%
5%
10%
15%
Q212
Q312
Q412
Q113
Q213
Q313
Q413
Q114
Q214
Q314
Q414
EVRY Financial Services
EVRY NorwayEVRY Sweden
3%
-1% -6% -6% -2%-2%
6%
3%2% 2%
-3%
-10%
-5%
0%
5%
10%
Q212
Q312
Q412
Q113
Q213
Q313
Q413
Q114
Q214
Q314
Q414
EVRY

0
1
2
3
4
5
6
0
200
400
600
2009 2010 2011 2012 2013 2014
Software developed in-house Ordinary capex Percentage
• Continued positive effects from the working capital project
• CAPEX decreasing
o Less investments within operations businesses
o Core and payment projects in EVRY Financial Services at full speed by end Q1 ‘15
Key financials
9
Q4 2014 presentation
NOK millionPercent of revenueCAPEX
Average last 4 quarters
Working capitalNOK millionPercent of revenue
Average last 4 quarters
Target
4%
5.7
6.5 6.7 6.86.3
6.05.5
5.1 4.94.5 4.3
3.83.3
2.9
0
1
2
3
4
5
6
7
8
Q311
Q411
Q112
Q212
Q312
Q412
Q113
Q213
Q313
Q413
Q114
Q214
Q314
Q414
Percent of revenue
Target
corridor

10
Q4 2014 presentation
Increase in order backlog
0
2000
4000
6000
8000
2015 2016 2017 2018
EVRY Norway EVRY Financial Services EVRY Sweden
Order backlog NOK 18 bnNOK million
Market highlights
17.1 16.816.1
15.5 15.3 15.0 15.3 15.3 15.114.2
16.6 16.5
18.4
17.318.0
10
12
14
16
18
20
Q211
Q311
Q411
Q112
Q212
Q312
Q412
Q113
Q213
Q313
Q413
Q114
Q214
Q314
Q414
Order backlog NOK billion
• Long-term partnership with four Norwegian banks
o Payment and core bank renewal NOK 1.2 bn
• Gaining share in SME outsourcing
o Five new customers signed
• Strategic wins in public sector
o Continued partnership with Folkeregisteret
o Healthcare in both Sweden and Norway
• New signings NOK 4.1 billion
o EVRY Financial Services NOK 1.7 billion
o EVRY Sweden NOK 0.9 billion
o EVRY Norway NOK 1.5 billion

Segments
EVRY Q4 2014

• Revenue NOK 988 million (959 )
o Organic growth driven by EVRY Card Services and Custom Solutions in Sweden
o Revenue from Solutions portfolio also increasing
• EBITA NOK 112 million (99 )
o Improved performance in Operations
o Revenue increase lifts EBITA margin
• CAPEX at low levels
o Depreciation well above investments
Highlights & Key figures
EVRY Financial Services – continued organic growth
12
Q4 2014 presentation
* Organic growth
NOK million Q4 2014 Q4 2013 Y/Y
Revenue 988 959 3%
EBITA 112 99 13%
EBITA margin 11.4% 10.3 %
CAPEX 32 55
Employees 1,457 1,490
Percent
Margin development EVRY Financial Services
EBITA-margin - moving average last 4 quarters
Target
corridor
8.58.9 9.2 9.4 9.4 9.3 9.1 9.2 8.9
9.49.8 10.1
3
6
9
12
Q112
Q212
Q312
Q412
Q113
Q213
Q313
Q413
Q114
Q214
Q314
Q414

• Revenue NOK 939 million (936 )
o SME IT operations shows healthy growth
o Market recovery still slow
• EBITA at NOK 101 million (77 )
o Restructuring giving effects
o Considerable improvement in consulting, utilisation rates up (+4.8%)
o Good performance in Healthcare and SME IT Operations continues
Highlights & Key figures
EVRY Sweden – solid margin improvement
13
Q4 2014 presentation
*Organic growth
NOK million Q4 2014 Q4 2013 Y/Y
Revenue 939 936 1%*
EBITA 101 77 31%
EBITA margin 10.8% 8.3 %
Capex 30 20
Utilisation 73.3% 68.5 %
Working days 62 62
Employees 2,219 2,308
Percent
Margin development EVRY Sweden
EBITA-margin - moving average last 4 quarters
6.7 7.0 7.1 7.1 6.8 6.6 6.5 6.4 6.5 6.4 6.67.3
2
4
6
8
10
Q112
Q212
Q312
Q412
Q113
Q213
Q313
Q413
Q114
Q214
Q314
Q414
Target
corridor
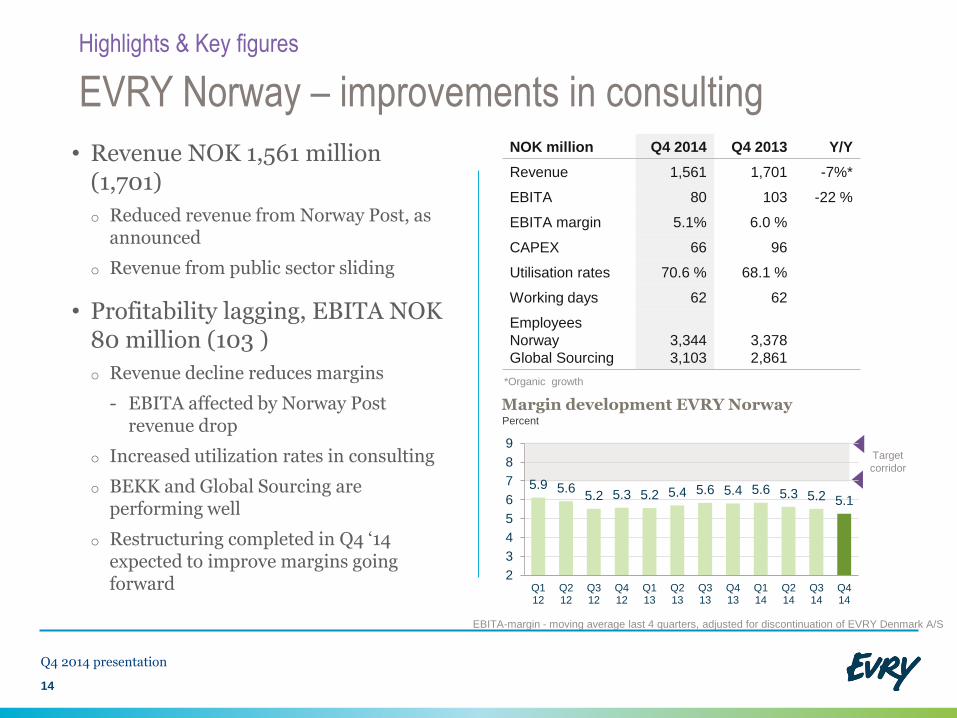
• Revenue NOK 1,561 million (1,701)
o Reduced revenue from Norway Post, as announced
o Revenue from public sector sliding
• Profitability lagging, EBITA NOK 80 million (103 )
o Revenue decline reduces margins
- EBITA affected by Norway Post revenue drop
o Increased utilization rates in consulting
o BEKK and Global Sourcing areperforming well
o Restructuring completed in Q4 ‘14 expected to improve margins goingforward
Highlights & Key figures
EVRY Norway – improvements in consulting
14
Q4 2014 presentation
*Organic growth
EBITA-margin - moving average last 4 quarters, adjusted for discontinuation of EVRY Denmark A/S
NOK million Q4 2014 Q4 2013 Y/Y
Revenue 1,561 1,701 -7%*
EBITA 80 103 -22 %
EBITA margin 5.1% 6.0 %
CAPEX 66 96
Utilisation rates 70.6 % 68.1 %
Working days 62 62
Employees
Norway
Global Sourcing
3,344
3,103
3,378
2,861
Percent
Margin development EVRY Norway
Target
corridor
5.9 5.65.2 5.3 5.2 5.4 5.6 5.4 5.6 5.3 5.2 5.1
2
3
4
5
6
7
8
9
Q112
Q212
Q312
Q412
Q113
Q213
Q313
Q413
Q114
Q214
Q314
Q414

Q
1
2
0
1
2
p
r
e
s
e
n
t
a
t
i
o
n
EVRY Q4 2014
Key figures 2014
1
5

Highlights & Key figures
EVRY full year 2014
16
Q4 2014 presentation
NOK million 2014 2013 Y/Y
Revenue 12,773 12,600 1 %*
EBITA** 813 764 6 %
EBITA margin 6.4% 6.1 %
EPS** 1.85 1.49
597
807
1099
1048
400
600
800
1000
2011 2012 2013 2014
Operational cash flow development
NOK million
559677 694
764 813
500
600
700
800
2010 2011 2012 2013 2014
EBITA development *
NOK million
* Organic growth ** Before non-recurring items* Before non-reccuring items, adjusted for discontinuation of EVRY Denmark A/S
97207
405 500
0
200
400
600
2011 2012 2013 2014
Free cash flow development
NOK million
Figures adjusted for discontinuation of EVRY Denmark A/S

Q
4
2
0
1
3
p
r
e
s
e
n
t
a
t
i
o
n
EVRY Q4 2014
Outlook
1
7

18
Q4 2014 presentation
Market outlook Sweden
• Domestic consumer and services markets areoffsetting negative global trends. Moderate upward adjustment to GDP outlook
• IT services market growth projected to improvecompared to 2014
Market outlook Norway
• Growth in IT services in Norway expected to exceedGDP growth somewhat
o GDP growth for 2015 projected to hit lowest level since2009
• Price pressure for generic consulting services expected to prevail in 2015
• Banks and financial institutions expected to increase IT spending, investing in channels and mobility

19
Q4 2014 presentation
Summary Q4`14
• Apax offer of NOK 16 per share recommended by the Board of Directors
o Offer period extended until February 11
o Acceptance as of February 3 was approximately 87%
• Increase in back-log of NOK 0.7 billion
o Contract with a group of savings banks awarded
• EBITA margins increasing, EBITA up to NOK 268 million (243)
o EVRY Financial Services higher up in the margin corridor
o EVRY Sweden reports solid improvement
o EVRY Norway lagging
• Working capital at lowest levels ever, 2.9% of last four quarters’ revenue
• Record high free cash flow in 2014 of NOK 500 million
o Operational cash flow stable
o Lower investments

Q
4
2
0
1
3
p
r
e
s
e
n
t
a
t
i
o
n
2
0

Q
4
2
0
1
3
p
r
e
s
e
n
t
a
t
i
o
n
EVRY Q4 2014
Appendix
2
1

Key consolidated figures for the Group*
22
Q4 2014 presentation
(NOK million) Q4 2014 Q4 2013 Change (%) 2014 2013 Change (%)
Operating revenue 3,364 3,473 -3 %1) 12,773 12,600 1 %1)
EBITDA 398 380 5 % 1,290 1,219 6 %
EBITA before non-recurring items 268 243 10 % 813 764 6 %
EBITA % before non-recurring items 8.0 % 7.0 % 6.4 % 6.1 %
EBIT before non-recurring items 260 235 780 731
Non-recurring items 138 586 271 621
EBIT 122 -351 509 110
Net financial items 3 -53 -89 -169
EBT 125 -404 421 -59
EPS (NOK)2) 0.67 0.46 1.85 1.49
Employees 10,350 10,295
Net interest bearing debt/EBITDA 2.46 2.49
* Adjusted for discontinuation of EVRY Denmark A/S 1) Organic growth 2) Before non-recurring items

Q
4
2
0
1
3
p
r
e
s
e
n
t
a
t
i
o
n
2
3