osc annual report 2015 - osc.gov.on.ca following year, ... osc annual report 2015 3 chair’s...
TRANSCRIPT

PUTTING INVESTORSFIRST SINCE 1933
Annual Report 2015

Contents 2 Chair’s message
4 Lead Director’s letter
7 Executive Director’s letter
9 Performance highlights
18 Management’s Discussion and Analysis
34 Financial Statements
40 Notes to the Financial Statements
60 Appendix
OSC: The early years The history of the OSC dates back to 1928 when the Ontario government introduced the Security Frauds Prevention Act. The act mandated the registration of all brokers and salespersons and prohibited trade without this requirement.
In 1931, the Honourable George A. Drew was appointed the first Chair of the Security Frauds Prevention Board, the agency responsible for enforcing the act, and he became known as the “one-man regulator.”
The following year, the Ontario government changed the name of the original act to Securities Act to reflect that the legislation dealt with more than fraud prevention.
Additionally, the agency was renamed in 1933 to its current title, Ontario Securities Commission (OSC).

OSC vision To be an effective and responsive securities regulator – fostering a culture of integrity and compliance and instilling investor confidence in the capital markets.
OSC mandateTo provide protection to investors from unfair, improper or fraudulent practices and to foster fair and efficient capital markets and confidence in capital markets.
OSC organizational goals1. Deliver strong investor protection
2. Deliver responsive regulation
3. Deliver effective enforcement and compliance
4. Support and promote financial stability
5. Run a modern, accountable and efficient organization
OSC valuesProfessional
• Protecting the public interest is our purpose and our passion
• We value dialogue with the marketplace
• We are professional, fair-minded and act without bias
People
• To get respect, we give it
• Diversity and inclusion bring out our best
• Teamwork makes us strong
Ethical
• We are trustworthy and act with integrity
• We strive to do the right thing
• We take accountability for what we say and do

Our report this year is dedicated to the generations of investors we have served since 1933. As one of the oldest securities regulators in the world, we take pride in our long history of protecting investors and fostering fair and efficient capital markets in Ontario.
As the markets have evolved over the decades, each generation has experienced unique investment opportunities and challenges, and regulation has had to keep pace. But one thing hasn’t changed: the OSC’s commitment to the public we serve.
Regulating for today’s markets
The central mandate of securities regulators has been to sustain confidence and trust in our capital markets so that investors are willing to invest, firms have access to capital and there is a robust market infrastructure to support these activities. When I became Chair of the OSC in 2010, securities regulators, and other financial regulators in Canada and globally, were facing unprecedented challenges stemming from the financial crisis that would require us to revisit how we delivered on our mandates.
Future generations of financial historians will likely conclude that the financial crisis caused an irrevocable change in the global financial system. The crisis has had a significant and long-lasting adverse impact on the global economy. It also shattered investor confidence in the financial system.
To earn back investor confidence, regulators need to work together. Today, all regulators, regardless of historical purview or perspective, must contribute to developing regulatory responses that focus on the financial system as a whole. At the same time, securities regulators must maintain a strong focus on their traditional responsibilities in areas such as registration, compliance and oversight, and enforcement.
Evolving role of investor protection
Is the traditional disclosure-based framework enough to inform and protect investors? What is the role of the advisor? How do investors actually make decisions? These are some of the questions we continue to ask ourselves.
We are seeing significant demographic shifts. Individuals have more responsibility for their retirement security, while technology and product innovation mean they have more options than ever before. For example, advances in technology allow people to easily invest on their own, whether it’s through an online broker, a “robo-advisor” or new mechanisms such as crowdfunding portals. And a competitive and innovative financial services industry has led to a wide array of investment products and financial services. How can investors understand and evaluate the choices available to them?
Chair’s message
Howard I. Wetston, Q.C.
OSC Annual Report 2015
2

We know that the availability of disclosure and investor education programs does not guarantee that investors will make better investment decisions. We know there are limitations on how much information people can process. We are open to looking at how research in areas such as behavioural economics can inform our policymaking. One of the key things we have done is establish an Office of Investor Policy, Education and Outreach. The Office is committed to making sure we consider the impact to investors in all of our policy work. A key job of the Office is reaching out to investors across Ontario through our OSC in the Community program.
Another area of focus is intermediaries, particularly the advisors that deal directly with retail investors. Ensuring that investors receive quality investment advice is a focus of securities regulators around the world. The OSC, together with other Canadian securities regulators, is examining a number of topics related to this issue, such as a best interest duty and the structure of mutual fund fees, to determine whether any regulatory intervention would be appropriate.
As a core function, regulators have a responsibility to protect investors and the markets in their jurisdiction. The public expects us to use our resources efficiently and effectively to detect, investigate and litigate alleged wrongdoing in the markets. We continue to push for new enforcement tools, such as no-contest settlements introduced this year, and strengthen our domestic and international partnerships with law enforcement agencies and other regulators. Ultimately, it’s about stronger outcomes in investor protection, greater deterrence and enhanced confidence in our markets.
Continuing the tradition
I believe that regulators – all financial regulators – have a much better understanding today of the risks challenging our financial system. And we are working more closely together to address these risks. Measures that have been put in place have improved the resiliency of the system, and our relationships are helping to pave the way to achieving our common objectives.
Our capital markets will continue to evolve and challenges will continue to materialize. I am confident the OSC will respond to them as we have in the past – by working cooperatively and effectively with our stakeholders. Together, we can achieve the efficient regulatory environment Ontario’s investors expect and deserve. To that end, we continue to support efforts toward the proposed Capital Markets Regulatory Authority (CMRA) for the benefit of all Canadians. We also continue to work with our international colleagues in the International Organization of Securities Commissions (IOSCO) to develop global standards in the interest of greater harmonization and to cooperate and coordinate in reducing cross-border conflicts.
I want to thank the members of the Commission, Vice-Chair Monica Kowal, Executive Director Maureen Jensen, management and staff of the OSC for carrying on a strong tradition of public service on behalf of Ontario’s investors and capital markets.
Howard I. Wetston, Q.C.Chair and Chief Executive Officer
Ontario Securities Commission
OSC Annual Report
20153
Chair’s message

The Commission (from left) Mary Condon, Lead Director Christopher Portner, William Furlong, Deborah Leckman, Timothy Moseley, AnneMarie Ryan, Chair Howard Wetston, Sarah Kavanagh, Janet Leiper, Alan Lenczner, James Carnwath, Vice-Chair Monica Kowal, Edward Kerwin, (not pictured) Judith Robertson
Lead Director’s letter
Christopher Portner
For more than 80 years, the Ontario Securities Commission has played a leading role in the regulation of Ontario’s capital markets, continually adapting to the regulatory challenges of an increasingly complex global market. The Commission’s leading role has been achieved through its commitment to public service, good governance, adaptability and diversity as well as a forward-looking approach that not only oversees today’s markets, but anticipates tomorrow’s.
Fulfilling the Commission’s statutory mandate of protecting investors and fostering fair and efficient capital markets requires a strong and resilient regulator capable of addressing the issues, both local and global, that affect Ontario’s capital markets.
As of March 31, 2015, the Commission has 14 members, each of whom is appointed by the Lieutenant Governor in Council. The Chair and Vice-Chair are full-time appointees while the remaining members serve on a part-time basis. The members of the Commission typically meet every two weeks to deal with matters of policy and regulation. The members also serve as directors of the Commission and hold quarterly board and committee meetings to deal with the operational aspects of the Commission. All members of the Commission, other than the Chair, also serve as members of adjudicative panels which hear enforcement proceedings under the Securities Act (Ontario).
I am pleased to report that today’s OSC is a more strategic, open and accessible organization than it was even five years ago. The executive team and staff are dealing with complex new issues, including the mitigation of systemic risk to the financial system, in addition to their core responsibilities such as investor protection, the regulation of corporate finance, oversight of market structure and the enforcement of securities laws.
Over the past year, the Commission continued to deal with significant policy issues such as facilitating access to capital and encouraging the representation of women on boards and in senior management positions. In the latter regard, you will read elsewhere in this Annual Report that 50% of the members of the Commission and the OSC’s senior management team are women.
See page 61 for the composition of the OSC’s board and senior management.
4OSC Annual Report 2015

More progress was made on the key priority of developing and implementing reforms to the regulatory framework for over-the-counter derivatives and in the use of research in the development of policy. Commissioners also provided guidance in connection with numerous policy initiatives including the consideration of a best interest duty and the publication of a proposed whistleblower program to encourage the reporting of serious misconduct to the OSC.
As members of the OSC’s Board of Directors, the Commissioners are keenly aware of their responsibilities to oversee the management and affairs of the Commission and the effect on and cost to market participants of the regulation of the capital markets. The simplification of our fee model with consideration for the fiscal circumstances of market participants is one example of the types of cost efficiencies we strive to achieve.
As a Board, we also continue to lead by example by renewing our ranks in a way that reflects the diversity of our marketplace. With the departure of members of the Commission at the end of their respective terms of office, four new Commissioners, with various backgrounds and expertise, have recently joined us – Monica Kowal, as Vice-Chair and William Furlong, Janet Leiper and Timothy Moseley, as Part-time Members. Board members with a broad range of perspectives and backgrounds constitute a strong asset, underlining our belief in the value of diversity as an effective means of addressing complexity, informing decision-making and positively shaping the direction of Ontario’s capital markets.
In our adjudicative role, the Commissioners worked with OSC staff to continue to improve the efficiency of the adjudication process. A new electronic case management system was introduced and new policies were adopted to encourage the timely and efficient resolution of matters before the Commission, consistent with the principles of law governing administrative tribunals.
In 2014-15, there were several key developments in the transition to the proposed Capital Markets Regulatory Authority, or the CMRA, a major initiative of Ontario, four other provinces and one territory and the federal government. Progress is expected to continue over the coming months, including further engagement on updated consultation draft legislation and draft initial regulations.
While OSC staff continues to work hard towards the implementation of the CMRA with the committed support of the Commission, we remain focused on the attainment of the OSC’s current policy and regulatory objectives. Cost disclosure to investors, prospectus exemptions, addressing the issues relating to market structure and improved enforcement and compliance tools are just a few examples of the issues that we are currently addressing. The OSC’s significant contribution to the proposed CMRA is running concurrently with these efforts and reflects the Commission’s history of supporting reform while at the same time doing what is necessary to achieve a modern and effective regulatory framework.
We extend our thanks for a year of considerable accomplishments to the dedicated and hardworking staff of the Commission who are ably led by Howard Wetston, the Chair and Chief Executive Officer, and by Maureen Jensen, the Executive Director and Chief Administrative Officer.
The OSC has earned a long and distinguished history of protecting investors and fostering confidence in Ontario’s capital markets. The Commission is committed to preserving this legacy by effectively and efficiently addressing the regulatory challenges of an increasingly complex marketplace.
Christopher PortnerLead Director
Ontario Securities Commission
Lead Director’s letter

(From left)
Jill Homenuk Director, Communications & Public Affairs
H.R. Goss Director, Corporate Services
Jean-Paul Bureaud Director, Office of Domestic and International Affairs
Leslie Byberg Director, Strategy, Research and Planning
Tula Alexopoulos Director, Special Projects
Cameron McInnis Chief Accountant
(From left, seated)
John Stevenson Special Counsel to the Chair
Lisa Wilkins Chief Human Resources Officer
(From left, standing)
Maureen Jensen Executive Director
Howard Wetston Chair
Josée Turcotte Secretary
James Sinclair General Counsel
(From left, seated)
Rhonda Goldberg Director, Investment Funds and Structured Products, and Acting Director, Office of Investor Policy, Education and Outreach
Naizam Kanji Office of Mergers and Acquisitions
Susan Greenglass Director, Market Regulation
(From left, standing)
Debra Foubert Director, Compliance and Registrant Regulation
Kevin Fine Director, Derivatives
Tom Atkinson Director, Enforcement
Huston Loke Director, Corporate Finance

In 2012, the OSC set out to establish a new course for our organization through a long-term Strategic Plan. To this day, the Plan serves as a road map that articulates our priorities, guides our choices, and brings focus to our efforts in areas that are integral to instilling trust and confidence in the capital markets.
I am proud to report today that many initiatives in the Plan are complete, or are on track to successful completion. OSC staff has worked hard to deliver policies and initiatives more quickly, while keeping the interests of investors at the heart of everything we do.
The next section of our annual report highlights achievements and progress in our recent fiscal year. Many initiatives have had a tangible impact on improving outcomes for investors and promoting public confidence in our capital markets, including:
1. We enhanced cost disclosure for investors by requiring dealers and advisors to disclose charges paid.
2. Another new requirement will soon mandate dealers and advisors to deliver a plain-language Fund Facts document to investors before, rather than within two days of, purchasing a mutual fund.
3. We have undertaken research to determine whether embedded mutual fund fees influence advisors’ sales recommendations. This is one example where the OSC is using independent third-party research to inform regulatory policies on important investor issues.
4. We advanced the ongoing debate on the best interest duty issue by gathering valuable insight from advisors throughout Ontario to inform our policy choices.
5. To support capital raising in Ontario’s exempt market, we adopted the first two of four prospectus exemptions – namely, the existing security holder and family, friends and business associates prospectus exemptions – that will give investors more flexibility in making investments and companies more alternatives in raising capital in a more efficient way. We expect the remaining two prospectus exemptions for the offering memorandum and crowdfunding to be published in fall 2015.
6. A new Office of Investor Policy, Education and Outreach was created to integrate all of our existing investor-related activities, previously under the Investor Education Fund (IEF) and Office of the Investor, to better focus and coordinate efforts and make more efficient use of our resources.
7. We increased the number of enforcement matters concluded before the courts from three quasi-criminal matters in 2013-14 to five quasi-criminal and criminal matters in 2014-15. Our year-over-year enforcement results are listed in the Appendix.
Executive Director’s letter
Maureen Jensen
OSC Annual Report
20157

8. Our Joint Serious Offences Team (JSOT) executed 69 search warrants during the year, and had seven matters under investigation and 15 matters before the courts at year end.
9. We completed our first two no-contest settlements, which resulted in multi-million dollar payments allocated toward compensation for respondents’ clients.
10. We have proposed a whistleblower program designed to encourage individuals to come forward and report misconduct.
11. We continued to build on our previous successes in educating the public on investment fraud prevention through seminars in local communities.
12. We partnered with our Investor Advisory Panel (IAP) to hold an inaugural roundtable discussion with seniors’ advocacy groups that focused on addressing unique financial issues and challenges facing senior investors.
And we continue to transform the OSC into a more open, accountable and innovative organization. We are very thankful to our consultation committees who offer expertise on the policy issues we are addressing.
We have now implemented a refreshed Strategic Plan that carries our goals and initiatives forward into 2017. The new Plan refines our ongoing efforts to deliver better outcomes for the investing public and to become more solutions-oriented in our responses to market developments and investor concerns. For that purpose, we will be making improvements to our existing data collection, management and analysis mechanisms to better inform policy decisions, detect misconduct, and resolve matters faster and more effectively.
Concurrent with those commitments, OSC staff continues to work with our government and regulatory partners to advance the development of the legislative and operational framework of the proposed CMRA. Our focus is to ensure that the best of Ontario securities regulation will be retained to serve our stakeholders’ interests in the long term.
In closing, I would like to thank our Chair, Howard Wetston, for his leadership and support. He prompted key changes to the way business is conducted at the OSC and brought attention to important issues such as capital formation and gender diversity. We were all pleased to see Howard recognized for his advocacy of inclusive workplaces when Catalyst Canada named him “Board Diversity Champion” in 2014.
On behalf of the OSC staff, we extend our thanks to all our stakeholders – advisory committees, investors, market participants, and regulatory and law enforcement partners across Canada and the globe – who work closely with us. Finally, I want to take this opportunity to recognize and thank OSC staff for all they do and how hard they work to protect Ontarians. Through their efforts and dedication, we accomplish a great deal and I look forward to building on their work in the year ahead.
Executive Director’s letter (continued)
Maureen JensenExecutive Director and Chief Administrative Officer
Ontario Securities Commission
OSC Annual Report 2015
8
Executive Director’s letter

GOAL 1 – Deliver strong investor protection
Strengthening our investor office
We integrated the Investor Education Fund (IEF) into our Office of the Investor to form the new Office of Investor Policy, Education and Outreach.
As the central hub for our investor-related activities, the new Office will allow us to better focus and coordinate our efforts and make more efficient use of our resources.
The new Office will:
• lead the OSC’s efforts to identify and understand investor issues and concerns through investor engagement and research,
• coordinate all investor-focused education and outreach efforts, including our OSC in the Community program, and
• ensure investors’ perspectives are considered and addressed in policy and operational activities at the OSC.
The IEF was a non-profit organization established by the OSC in 2001 to develop and promote independent financial information, programs and tools to help consumers make better financial and investing decisions. The IEF’s consumer website, GetSmarterAboutMoney.ca, is now the OSC’s primary investor website.
Focusing on seniors Together with our Investor Advisory Panel, we hosted an inaugural seniors roundtable to establish an ongoing dialogue and partnership with key groups.
This was the first step in gaining a better understanding of the issues and challenges facing seniors, and informing any regulatory action we may take to better protect senior investors.
The roundtable was attended by 29 representatives of key groups that work directly with seniors, including the Ontario government, investor advocacy organizations, industry and securities regulators.
We conducted research on the financial life stages of older Canadians.
In June 2015, we released The Financial Life Stages of Older Canadians, targeted research that identifies the financial needs and challenges of seniors. The research found that almost six out of 10 older Canadians experienced a major life event that challenged their prior financial plans (such as an investment loss or a loss of income) and that approximately 60 out of every 1,000 older Canadians are exposed to fraud.
Performance highlights
OSC Annual Report
20159

1The Canadian Securities Administrators (CSA) is the council of the securities regulators of Canada’s provinces and territories that coordinates and harmonizes regulation for the Canadian capital markets.
Focusing on the client-advisor relationship
The first set of new requirements to improve cost disclosure and performance reporting came into effect.
Effective July 15, 2014, registered dealers and advisors are required to provide investors with pre-trade disclosure of charges and commissions, and to include the annual yield and any commissions for fixed income transactions on trade confirmations.
These new requirements are part of a three-year phased approach to improving the clarity and quality of information investors receive about the costs and performance of their investments. Additional requirements will come into effect in 2015 and 2016.
Providing investors with timely and relevant information
CSA1 members finalized the requirement for pre-sale delivery of Fund Facts for mutual funds.
Effective May 30, 2016, all dealers that sell mutual funds will be required to deliver a Fund Facts to investors before they make their decision to buy a mutual fund. Fund Facts is a two-page document that highlights key information about a mutual fund, including risks, past performance and costs.
Currently, Fund Facts must be delivered to investors within two days of buying a mutual fund. Delivering Fund Facts before investors make their decision to buy provides them with relevant information at a critical time in the investment process.
CSA members proposed a new summary document for exchange-traded funds (ETFs).
In June 2015, CSA members published a proposal for “ETF Facts,” a summary disclosure document for exchange-traded funds. Like Fund Facts, the document is two pages and highlights key information that is important to ETF investors. ETF Facts was tested with over 900 investors during its development.
Conducting research on mutual fund fees
CSA members are researching whether embedded mutual fund fees influence sales recommendations.
CSA members awarded two third-party research contracts to review Canada’s mutual fund fee structure. The research will quantify the degree to which embedded commissions and other forms of compensation affect sales, and whether the use of fee-based compensation affects the advice given to clients.
Securities regulators are concerned about the potential of embedded commissions to influence advisors to recommend one product over another and the impact of these incentives on the long-term savings of investors.
Independent research will help CSA members determine whether any regulatory action is needed to address these issues. The research will be made public in 2015.
Leading international efforts in investor education
We chair the International Organization of Securities Commissions (IOSCO) Committee on Retail Investors.
In November 2014, the Committee published its Strategic Framework for Investor Education and Financial Literacy. The framework is guiding IOSCO’s efforts in establishing investor education initiatives that produce meaningful results for investors.
In May 2015, the Committee published a survey on anti-fraud messaging as a resource for regulators in developing fraud awareness programs.
OSC Annual Report 2015
10
Performance highlights
GOAL 2 – Deliver responsive regulation
Improving corporate governance
New annual disclosure requirements relating to women on boards and senior management came into effect.
Effective December 31, 2014, TSX-listed issuers are required to disclose their policies, targets and other information with respect to women on boards and senior executive positions.
Research indicates that diverse boards foster constructive dialogue, effective problem solving and better decision-making. The disclosure requirements are intended to encourage good corporate governance and more effective boards, which benefit companies, their shareholders and other stakeholders.
We will be conducting a review of the disclosure filed in 2015 to assess compliance with the new requirements and early trends toward greater representation of women on boards and in senior executive positions. We plan to publish the results of this review. We are also planning to hold a consultation roundtable in fall 2015 to discuss the progress of this initiative.
Transforming Ontario’s exempt market
We adopted two new prospectus exemptions to help companies raise capital.
The existing security holder prospectus exemption allows public companies listed on a Canadian exchange to raise capital from existing investors based on the company’s public disclosure record. Companies relying on the exemption must make the offer to all existing investors as of a record date. Investors are also subject to investment limits, unless they get advice on the suitability of the investment. The exemption came into effect on February 11, 2015.
The family, friends and business associates prospectus exemption allows start-up and early-stage companies to raise capital from investors within the personal networks of the principals of the business. As a condition of the exemption, a signed risk acknowledgement form must be obtained, setting out the key risks related to the investment and confirming how the investor qualifies to make the investment. The exemption came into effect on May 5, 2015.
These exemptions are two of four exemptions that we proposed in March 2014 as part of our initiative to transform Ontario’s exempt market. Our goal is to provide greater access to capital for businesses and expand investment opportunities for investors, while maintaining an appropriate level of investor protection.
We expect to publish the remaining two exemptions – a crowdfunding prospectus exemption, together with a registration framework for online portals, and an offering memorandum prospectus exemption – in fall 2015.
Streamlining requirements for venture issuers
CSA members proposed final disclosure requirements tailored to venture issuers.
On April 9, 2015, CSA members published their final proposal to streamline quarterly financial reporting, executive compensation disclosure and business acquisition reporting for venture issuers. These requirements are intended to better reflect the needs of companies that are at an earlier stage of development, while providing appropriate investor protection.
OSC Annual Report
201511
Performance highlights
“Diversity speaks directly to the core principles of fairness and equal opportunity. While disclosure is invaluable for transparency and accountability, our gender diversity proposals are really about good corporate governance.”Chair Howard Wetston, speaking about the OSC’s policy initiative to advance the representation of women on boards and in senior executive positions.

Harmonizing the regulatory approach to take-over bids
CSA members proposed a harmonized take-over bid regime for all Canadian jurisdictions.
On March 31, 2015, CSA members published a proposal to provide target boards with more time to respond to hostile bids, while allowing target shareholders more time to make voluntary, informed and coordinated tender decisions.
Under the current regime, non-exempt take-over bids must remain open for 35 days and are not subject to any minimum tender requirement or an extension requirement once the bidder has taken up deposited securities.
Under the proposal, bids would generally be open for at least 120 days, the minimum tender would be more than 50% of the outstanding securities that are subject to the bid and a 10-day extension would apply if the minimum tender requirement is met.
Improving proxy voting infrastructure
CSA members are modernizing the vote reconciliation process.
On January 29, 2015, CSA members published a progress report confirming that Canada’s fragmented proxy voting infrastructure needs to be modernized. Proxy voting involves the network of organizations, systems, rules and practices that supports how shareholder votes are solicited, collected, submitted and tabulated.
The report identified five improvements that must be made to vote reconciliation – the process for reconciling proxy votes and voting instructions against the list of registered holders. CSA members directed all entities that play key roles in vote reconciliation to assess their processes and identify and implement any appropriate steps they can take to improve vote reconciliation for the 2015 proxy season.
CSA members have also directed the key entities involved in vote reconciliation to develop industry protocols that, at a minimum, address the five required improvements. The protocols are intended to be completed by the 2016 proxy season. CSA members will be overseeing the development of these protocols.
Maintaining market quality and integrity
CSA members issued a notice about their concerns with routing equity orders to U.S. dealers.
In December 2014, CSA members issued a notice after learning that a number of Canadian investment dealers had entered into, or were considering entering into, arrangements to route Canadian retail orders on a broad basis to U.S. dealers for execution.
The orders were being executed by U.S. dealers off-marketplace and with minimal price improvement. This is inconsistent with the spirit of the dark pool framework, and if broadened, could negatively affect the quality of the Canadian market.
CSA members are working with the Investment Industry Regulatory Organization of Canada (IIROC) to evaluate possible regulatory options.
OSC Annual Report 2015
12
Performance highlights

Helping shape international securities regulation
We have a leadership role on the IOSCO Board.
In September 2014, OSC Chair Howard Wetston was re-elected as a Vice-Chair of the Board of IOSCO. IOSCO is the leading international policy forum for securities regulators and is recognized as the global standard setter for securities regulation. The organization’s membership regulates more than 95% of the world’s securities markets in more than 115 jurisdictions.
With a seat on the Board, the OSC has an important role in shaping and influencing international standards. We participate on, and have chaired, a number of international task forces. We are also involved in IOSCO policy committees that are developing responses to many of the issues resulting from the financial crisis.
All of this work helps inform how we regulate Ontario’s capital markets. Our goal is to ensure that domestic regulation aligns with international standards, while reflecting the unique needs of our markets.
GOAL 3 – Deliver effective enforcement and compliance
Providing guidance to market participants
We continued our education and outreach program to help market participants understand and comply with regulatory requirements.
Our program includes educational seminars, guidance and webinars to promote strong, proactive compliance practices by market participants. We also provide market participants with regular updates on initiatives, policies and programs that impact them.
Highlights for 2014-15 include:
• Small and medium enterprise (SME) seminars – Over 200 people attended four educational seminars on mineral disclosure best practices, continuous disclosure best practices, raising money in the capital markets and calculating participation fees.
• Registrant outreach seminars – Over 1,800 people attended our 12 registrant outreach seminars and webinars on topics such as complaint handling, registration requirements and participation fees.
• Topical guide for registrants – In November 2014, we launched this web-based tool for registrants to search for and access OSC registration and compliance-related guidance by topic.
OSC Annual Report
201513
Performance highlights
The Investment Funds Practitioner: Keeping industry informed
We publish The Practitioner as a resource for investment fund managers and their advisors when preparing documents that investment funds are required to file with the OSC. The Practitioner highlights issues arising from applications for discretionary relief, prospectuses and continuous disclosure documents. It also covers issues we have raised in connection with our reviews of documents filed with us and how we have resolved them.

Conducting targeted compliance reviews of market participants
The OSC, on its own or in collaboration with CSA members, conducted disclosure reviews in areas where there was a heightened risk of investor harm.
1. Mining presentations – CSA members reviewed investor presentations from the websites of 130 mining issuers. The reviews found that the issuers’ disclosure needed improvement, citing incomplete information and overly promotional language as key concerns. Forty-nine of the issuers were requested to correct non-compliant disclosure in their presentations. In some cases, they were required to issue a corrective news release and refile technical reports.
2. Medical marijuana disclosure – In 2014, the federal government overhauled its medical marijuana program, which created a new commercial industry for growers. CSA members reviewed the disclosure of 62 issuers in this emerging industry. Overall, the reviews found unbalanced disclosure that often promoted the benefits, but failed to outline the risks, cost implications and time required before the issuer can begin licensed operations. CSA members raised serious investor protection concerns about the disclosure by 25 reporting issuers, requesting 23 of them to file a clarifying disclosure document.
3. Real estate investment trust (REIT) distributions – The OSC reviewed 30 Ontario-based REITs to assess the quality of their disclosure about the sustainability of distributions. Overall, we identified 10 REITs that distributed more than they generated in cash, without sufficiently highlighting the increased risk to investors. We required these REITs to correct their disclosure in future filings by prominently disclosing to investors that excess distributions occurred, how they were financed, and that they represented a return of capital.
The OSC launched its “Registration as the First Compliance Review” program.
Good compliance practices begin at registration, and this year, we added a compliance tool to the registration process for firms that are seeking approval to register with us for the first time.
We conducted 21 pre-registration reviews to assess the firm’s financial condition, business plan, and policies and procedures. Also included were reviews of the firm’s operations, compliance systems and meetings with firm representatives.
This year, we also completed a sweep review of 32 registrants that have been in the business for three years or less. This type of review is intended to uncover any issues new registrants may have in meeting their regulatory obligations and allow them to take corrective action before serious deficiencies could occur.
The OSC conducted a review of the first interim financial reports filed by investment fund issuers under International Financial Reporting Standards (IFRS).
In September 2014, we began a review of interim financial reports for the period ended June 30, 2014. These were the first financial statements required to be filed by investment funds under IFRS.
OSC Annual Report 2015
14
Performance highlights
Refilings and restatements
When issuers fail to comply with periodic and timely disclosure requirements, they are required to refile or restate their disclosure. In 2014-15, 44 refilings or restatements were made by reporting issuers (excluding investment funds) to address deficiencies identified in our reviews. For example, issuers were required to refile financial statements and MD&A to highlight liquidity concerns, make corrections to technical reports, clarify disclosure and amend CEO & CFO internal control certificates.

We reviewed 90 investment fund managers. Our goal was to ensure that their investment funds were transitioning to IFRS, as well as to provide guidance to investment funds that had not yet filed their first IFRS financial statements.
In fall 2014, we issued a number of IFRS Releases, outlining the most common issues we identified during the review.
Developing new enforcement tools
We’re introducing new tools to help close administrative cases more quickly and efficiently. This will help free up resources to pursue complex cases involving fraud and other serious misconduct.
• No-contest settlements – We introduced no-contest settlements in March 2014. Under a no-contest settlement, an alleged wrongdoer is allowed to settle their case without formally having to admit to the wrongdoing.
• We are the only securities regulator in Canada with no-contest settlements. We only use no-contest settlements for cases that meet strict eligibility requirements. For example, we will not use them for criminal or other serious forms of misconduct.
• The Commission approved the first two no-contest settlement agreements, involving a total of four corporate respondents.
• Whistleblower proposal – In February 2015, we proposed a whistleblower program that would pay individuals up to $1.5 million for original information about misconduct, if the information leads to an enforcement proceeding that results in a significant financial sanction. The program would also include proposed legislative changes to provide for anti-retaliation measures. If approved and enacted, the program would be the first of its kind for securities regulators in Canada.
• Mediation program – On May 1, 2015, we launched a pilot program that gives respondents the option of using a third-party mediator to resolve their case more quickly. Any settlement agreement resulting from mediation must be approved by the Commission. The pilot runs until March 31, 2016.
Building on partnerships
We actively cooperate and collaborate with other securities regulators and law enforcement agencies to combat financial crime.
• Joint Serious Offences Team (JSOT) – JSOT executed 69 search warrants during the year, and had seven matters under investigation and 15 matters before the courts at year end. Formed in 2013, JSOT is an enforcement partnership between the OSC, the RCMP Financial Crime program and the OPP’s Anti-Rackets Branch. The team combines police resources and Criminal Code tools – such as the ability to do undercover surveillance and the power to arrest – with the OSC’s specialized team of litigators, accountants and computer forensic experts.
• RCMP – We’ve seen the benefits of working with the RCMP through JSOT and are building on that partnership. In March 2015, the RCMP announced that it is moving its financial crime unit to be co-located with the OSC at our offices. This is a significant step forward in our ability to investigate and prosecute financial crime.
• Wiretap proposal – We’re seeking an amendment to the Criminal Code that would add insider trading and tipping to the list of designated wiretap offences. An official proposal on the amendment has been presented to the Uniform Law Conference (ULC) – the committee that makes recommendations to amend the Criminal Code. The ULC is recommending that the federal Minister of Justice accept our proposal and introduce legislation to amend the Criminal Code. The RCMP, the OPP, the Toronto Police Service and the Ministry of the Attorney General are supporting our efforts in seeking this amendment.
OSC Annual Report
201515
Performance highlights

• Competition Bureau – In November 2014, the OSC and the federal Competition Bureau signed a Memorandum of Understanding to develop a framework for cooperation in areas such as protecting Canadians from fraudulent business practices and providing assistance in investigations, litigation or other enforcement actions.
• IOSCO – We continue to cooperate and collaborate on cross-border enforcement matters through the IOSCO Multilateral Memorandum of Understanding (MMOU). There are currently 105 signatories to the MMOU. In 2014-15, we received 79 requests for assistance from international regulators and made 40 requests for assistance. This compares to 78 and 43 respectively in 2013-14.
GOAL 4 – Support and promote financial stability
Creating an oversight regime for derivatives
The OSC continues to work with domestic and international regulators to develop an oversight regime for over-the-counter (OTC) derivatives market infrastructure and participants.
Since the financial crisis, domestic and global financial regulators have been working to address the systemic risks caused by the opaque, inter-connected and cross-border market for OTC derivatives.
The OSC is a member of the international OTC Derivatives Regulators Group (ODRG), whose members have made consistent progress since 2011 in implementing the G20’s OTC derivatives reform agenda through legislative and regulatory actions. OSC Chair Howard Wetston was named chair of the ODRG, effective March 31, 2015.
In Canada, an inter-agency group called the “Heads of Agencies” is coordinating the efforts of prudential and securities regulators to develop a comprehensive regulatory regime for OTC derivatives. The group brings together the Bank of Canada, the Department of Finance Canada, the Office of the Superintendent of Financial Institutions (OSFI), the OSC, and the Quebec, Alberta and B.C. securities commissions (AMF, ASC, BCSC respectively).
Progress continues to be made in a number of areas:
• Central clearing – In February 2015, CSA members proposed requirements for central counterparty clearing of OTC derivatives transactions. These requirements are intended to improve transparency while enhancing systemic risk mitigation.
• Clearing agencies – In November 2014, CSA members proposed a harmonized approach to clearing agency requirements for financial markets infrastructures. The proposal also adopts international standards for Canadian clearing agencies serving both derivatives and securities markets.
• Trade repositories – The OSC designated three U.S. trade repositories for the purposes of the trade reporting rules under Ontario securities law. Ontario counterparties started reporting to these repositories on October 31, 2014.
• Trading facilities – In January 2015, CSA members published a consultation paper proposing a framework to develop rules for OTC derivatives trading in Canada that align with international practices, where appropriate.
OSC Annual Report 2015
16
Performance highlights

Improving transparency in the fixed income market
We published a report on the current state of Canada’s fixed income market.
This was the first step in our review of the fixed income market. We are looking at various aspects of the market to determine if any changes need to be made to the regulatory framework.
The report was accompanied by a staff notice, which sets out next steps, including steps to promote more informed decision-making for market participants, regardless of size. These will include expanding transparency for corporate bond trades, improving market integrity and ensuring that the market is fair and equitable to all investors.
GOAL 5 – Run a modern, accountable and efficient organization
Improving efficiency We simplified our fee model for market participants.
Under the previous model, fees were calculated based on historical information from a market participant’s reference fiscal year. Under the new model, market participants will calculate their participation fees based on their most recent fiscal year information (for registrants, the most recent fiscal year ending in the calendar year). By using the most recent fiscal year, fees will track more closely with a market participant’s current market size. The new fee model came into effect on April 6, 2015.
Market participants are required to make all filings electronically.
As of February 2014, all filings to the OSC are required to be submitted electronically. In the first full year, over 12,000 electronic filings were made to the OSC.
Electronic filing reduces courier costs for market participants, provides 24/7 access and offers the convenience of paying by credit card. It also means we can start processing filings sooner. In addition, it reduces the chances of losing or misrouting a filing.
We’re delivering almost 100% of public requests for records electronically.
Since we started providing records in electronic format as a standard practice in January 2013, we have gone from 100% paper and fax delivery of records to almost 100% electronic delivery. We now only deliver records in paper or by fax when specifically requested.
Modernizing our adjudicative process
Our Tribunal is moving to electronic hearings.
We’re developing a new electronic case management system, and in April 2015 launched a pilot e-hearing using the new system. The system assists our Office of the Secretary and Commissioners with managing all documents related to hearings. Our goal is to hold electronic hearings, when appropriate and practical.
As part of our pilot e-hearing, we’re testing a web portal that parties can use to access the documents they filed and the hearing record, during and after hearing hours.
We’re offering enhanced access to hearings.
We offer live video streaming to provide more public access to hearings when needed, for example, in high profile cases where a large number of stakeholders, media and the public want to attend the hearing.
To accommodate the international nature of many of our cases, our hearing rooms have also been equipped with video-conferencing technology. This allows witnesses from around the world to testify at our hearings.
We’re committed to releasing decisions within six months.
We have implemented an internal guideline to release decisions within six months of a hearing, where possible. This is part of our priority to improve the timeliness of our adjudicative processes.
OSC Annual Report
201517
Performance highlights

18 19
MANAGEMENT’S DISCUSSION& ANALYSIS
OSC Chairs and CEOs through the years

OSC Annual Report
2015
Management’s Discussion and Analysis
18 19
Important information about this MD&A• The information in this MD&A is prepared
as of June 8, 2015.
• The terms “we”, “us”, “our” and “OSC” refer to the Ontario Securities Commission.
• This MD&A contains forward-looking information and statements regarding strategies, objectives, expected operations and financial results, which are based on the OSC’s current views of future events and financial performance. Key risks and uncertainties are discussed in the Risks and risk management section of this MD&A. However, some risks and uncertainties are beyond the control of the OSC and are difficult to predict. Actual future outcomes may substantially differ from the expectations stated or implied in this MD&A.
• The words “believe”, “plan”, “intend”, “estimate”, “expect”, “anticipate” and similar expressions, as well as future conditional verbs, such as “will”, “should”, “would” and “could” often identify forward-looking statements.
• The words “plan” and “budget” are synonymous in this MD&A and are used interchangeably. Both describe the planned budget revenue and expenses for the related fiscal year.
• Unless otherwise specified, references to a year refer to the OSC’s fiscal year ended March 31.
• Notes to the financial statements refer to the OSC’s 2015 Notes to the Financial Statements.
• All financial information related to 2014 and 2015 has been prepared in accordance with International Financial Reporting Standards (IFRS). For more information, see the notes to the financial statements, in particular, Note 2 Basis of presentation, Note 3 Significant accounting policies and Note 20 Accounting pronouncements.
• Amounts shown in this MD&A are expressed in Canadian dollars, unless otherwise specified.
• Due to rounding, some variances may not reconcile and analysis of components may not sum to the analysis for the grouped components.
Management’s Discussion and AnalysisThis Management’s Discussion and Analysis (MD&A) contains management’s interpretation of the OSC’s financial performance for the 2015 fiscal year ended March 31, 2015. While the financial statements reflect actual financial results, the MD&A explains these results from management’s perspective and sets out the OSC’s plans and budget for the year ahead.
This MD&A should be read in conjunction with the OSC’s 2015 Financial Statements and related notes. Together, the MD&A and financial statements provide key information about the OSC’s performance and ability to meet its objectives.
MD&A Contents
20
About the OSC
21
Operating results
28
Liquidity and financial position
31
2016 Strategy
32
Critical accounting estimates
32
Risks and risk management
33
Internal control over financial reporting (ICFR)

OSC Annual Report 2015
Management’s Discussion and Analysis
20 21
About the OSCA summary of our role, mandate and goals
The Ontario Securities Commission is responsible for regulating the capital markets of Ontario. We are an Ontario Crown corporation that serves as a regulatory agency with a governing board. Our powers are given to us under the Securities Act (Ontario), the Commodity Futures Act (Ontario) and certain provisions of the Business Corporations Act (Ontario). We operate independently from the government and are funded by fees charged to capital market participants. We are accountable to the Ontario Minister of Finance.
We use our rule-making and enforcement powers to help safeguard investors, deter misconduct and regulate market participants in Ontario. We regulate firms and individuals who sell securities and provide advice in Ontario, as well as public companies, investment funds and marketplaces, such as the Toronto Stock Exchange.
The OSC operates under the direction of the Commission. The Commission has two related but independent roles. It serves as the Board of Directors of the OSC and it performs a regulatory function, which includes making rules and policies, and adjudicating administrative proceedings.
We are an active member of the Canadian Securities Administrators (CSA), the forum for the 13 securities regulators of Canada’s provinces and territories. The CSA works to foster a nationally coordinated and modernized securities regulatory framework.
The OSC also contributes to the international securities regulatory agenda by actively participating in the International Organization of Securities Commissions (IOSCO) and other international organizations.
MandateTo provide protection to investors from unfair, improper or fraudulent practices and to foster fair and efficient capital markets and confidence in capital markets.
VisionTo be an effective and responsive securities regulator – fostering a culture of integrity and compliance and instilling investor confidence in the capital markets.
Goals1. Deliver strong investor protection
2. Deliver responsive regulation
3. Deliver effective enforcement and compliance
4. Support and promote financial stability
5. Run a modern, accountable and efficient organization
For more information about our goals, see our Statement of Priorities at www.osc.gov.on.ca.
Cooperative Capital Markets Regulatory System (CCMR)The new target launch date for the CCMR is fall 2016. OSC staff continue to support the effort of the Ontario Government and to work cooperatively with our counterparts in the other CCMR participating jurisdictions. The participating jurisdictions plan to publish updated consultation draft legislation, along with draft initial regulations this summer. During 2015, the OSC committed approximately $1.8 million in staff resources, in addition to the $500 thousand committed in 2014, for a total of $2.3 million toward the creation of and transition to the CCMR. These totals do not include time spent by members of the OSC’s Executive who are appointed to the CCMR Transition Committee.
On April 15, 2015, Yukon became the first territory to participate in the CCMR, joining Ontario, British Columbia, Saskatchewan, New Brunswick, Prince Edward Island and Canada.
On April 16, 2015, the Ministers representing participating jurisdictions announced the members of the nominating committee who will recommend to the Ministers candidates for appointment to the initial board of directors of the Capital Markets Regulatory Authority.

OSC Annual Report
2015
Management’s Discussion and Analysis
20 21
Operating resultsA summary of our financial results and a discussion of our revenue and expenses
As a regulatory agency funded through fees charged to capital market participants, the OSC seeks to operate on a cost-recovery basis. In prior years, we accumulated a general operating surplus, which we plan to decrease by March 31, 2018 through a planned operating deficit in fiscal 2018, which includes investments in information technology (IT) and related Property, plant & equipment.
In 2015, our general operating surplus increased by $7.7 million as a result of higher revenue, higher enforcement-related cost recoveries and extensive cost reductions.
Revenue increased from 2013 to 2014 primarily due to participation and activity fee rate increases that took effect on April 1, 2013. Revenue increased from 2014 to 2015 due to participation fee rate increases that took effect on April 7, 2014.
The general surplus increased each year as a result of the excess/(deficiency) of revenue over expenses for each related fiscal years’ operations.
Property, plant & equipment purchases were significantly higher for 2013 and 2014 than 2015 due to a two-year renovation project of the leased premises at 20 Queen Street West during 2013 and 2014.
Total assets increased from 2013 to 2014 and from 2014 to 2015 primarily as a result of the increase in Net assets held for CSA Systems operations and redevelopment that have been accumulated and are held in trust on behalf of the other CSA regulators.
Non-current liabilities increased from 2013 to 2014 and 2014 to 2015 primarily as a result of the corresponding increase to the offsetting liability which reflects Net assets held for CSA Systems operations and redevelopment obligations.
Selected three-year annual information(Thousands) 2015 2014 2013
Revenue $103,936 $98,677 $87,278
Expenses 98,870 97,663 96,052
Excess/(Deficiency) of revenue over expenses (before recoveries) 5,066 1,014 (8,774)
Recoveries of enforcement costs 2,995 508 1,245
Excess/(Deficiency) of revenue over expenses 8,061 1,522 (7,529)
General surplus $14,274 $6,540 $5,308
Property, plant & equipment (purchases) $1,616 $6,940 $7,775
Total assets $207,414 $182,249 $159,696
Non-current liabilities $157,057 $137,378 $117,298
The OSC’s operations and revenue are directly affected by market conditions and trends. Our fee revenue fluctuates with market activity.

OSC Annual Report 2015
Management’s Discussion and Analysis
22 23
Our fee structureThe OSC is funded by fees from market participants. We charge two types of regulatory fees: participation fees and activity fees. Our fee structure is designed to recover costs and is set out in OSC Rules 13-502 Fees and 13-503 (Commodity Futures Act) Fees. The most recent fee rule amendments were effective from April 1, 2013 to April 5, 2015. We normally plan to balance our budget over each three-year fee cycle. However, in 2015, we re-examined our fee rule, one year earlier than originally planned. This was due to comments received from market participants on the use of the “reference fiscal year”, which was included under the fee rules for 2014 and 2015.
In 2015, participation fees increased 11.6% year-over-year for reporting issuers and 4.7% year-over-year for registrants. There were no changes to participation fee rates for specified regulated entities year-over-year. The new fee rules (Rule), which took effect on April 6, 2015, return to the previous model of using a market participant’s most recent financial year information (in place of “reference fiscal year”). The new Rule keeps participation fee rates at the levels that became effective in April 2014 and keeps the participation fee rates flat for the duration of the Rule.
Activity fees are set to reflect the costs associated with providing the related services. Activity fee rates remained the same in 2015 as they were in 2014.
About our fees• Participation fees are charged for a participant’s use of
Ontario’s capital markets. They cover the cost of a broad range of regulatory services that cannot be practically or easily attributed to individual activities of market participants. In fiscal 2014 and 2015, participation fees were based on a reference fiscal year where future participation fees are indexed to a prior fiscal year’s results. Fees are calculated using an increasing tiered structure based on average market capitalization for issuers and revenues for registrants. Specified regulated entities are charged participation fees based on their market share or a fixed rate. The timing of participation fee revenue affects our cash flow. For more information, see the Liquidity and financial position section.
• Activity fees are charged when market participants file documents such as prospectuses and other disclosure documents, registration applications and applications for discretionary relief. Activity fees are also charged for requests such as making changes to a registration or searching for records. Activity fees are flat-rate fees based on the estimated direct cost for the OSC to review documents and respond to requests.
• Late fees are charged when market participants submit filings after applicable filing deadlines, and/or are late paying the fees related to a filing.

OSC Annual Report
2015
Management’s Discussion and Analysis
22 23
(Thousands) % of 2015 Revenue 2015 2014 Change % Change
Participation fees 85.3% $88,423 $83,267 5,156 6.2%
Activity fees 12.7% 13,111 13,208 (97) -0.7%
Late fees 2.0% 2,122 1,966 156 7.9%
Total fees 100.0% $103,656 $98,441 5,215 5.3%
Miscellaneous 159 108 51 47.2%
Interest income 121 128 (7) -5.5%
Total revenue 103,936 98,677 5,259 5.3%
RevenueParticipation fee rate increases, which became effective at the beginning of the fiscal year, resulted in higher total revenue of $103.9 million in 2015, up $5.3 million (5.3%) from total revenue of $98.7 million in 2014. Total revenue for the year exceeded plan by $2.6 million (2.6%), with higher regulatory
fee revenue in most categories. Participation fees account for 39% of the variance, while activity fees account for 60% and late fees, miscellaneous revenue and investment income together account for 1% of the variance.
[Include pie chart of the various components of revenue in
percentages for 2014.
84.6% Participation fees
13.4% Activity fees
2.0% Late fees2014
[Include pie chart of the various components of revenue in
percentages for 2014.
85.3% Participation fees
12.7% Activity fees
2.0% Late fees2015
The following is a discussion of the significant changes in Revenue components.
Variance from prior year: Participation fee revenues were $5.2 million (6%) higher in 2015 than in 2014, primarily due to a $1.3 million (4%) increase from reporting issuers, a $2.6 million (5%) increase from registrants, as a result of the rate increases previously noted, and a $1.3 million (127%) increase from marketplaces and other entities, which was primarily due to the timing of filings.
Variance from current year plan: Participation fee revenues were $1.0 million (1%) higher than the 2015 plan. Issuer participation fees were $1.9 million (5%) under plan due to the impact of consolidation and amalgamations of reporting issuers since the current fee rule was developed. Registrant participation fees are $1.9 million (4%) higher than plan due to higher participation fees pertaining to prior years collected from unregistered investment fund managers who operated in Ontario prior to relying on an exemption from registration under MI 32-102 (Registration Exemptions for Non-Resident Investment Fund Managers). Participation fees from marketplaces and other entities were $1.0 million (76%) higher than plan because some marketplaces and other entities filed and paid their fiscal 2016 fees in fiscal 2015, even though they were not due until April 30, 2015.
Participation fees
2014 Plan
2015 Plan
$84.4 M
$87.4 M
2016 Plan $97.4 M
2014 Actual
2015 Actual $88.4 M
$83.3 M

OSC Annual Report 2015
Management’s Discussion and Analysis
24 25
2016 plan: The 2016 plan for participation fees totals $97.4 million: $39.1 million from issuers, $56.7 million from registrants and $1.6 million from marketplaces and other entities. This represents a $9.0 million (10%) increase from 2015 actual results and a $10.0 million (11%) increase from the 2015 plan. The anticipated increase is due to the change in the Rule, effective April 2015, which moves away from the reference fiscal year and therefore reflects the improved market conditions since 2011/2012, which are the periods which most participants’ reference fiscal year relate to.
Variance from prior year: Activity fee revenues were $97 thousand (1%) lower this year than the prior year. An increase in activity fees from reporting issuers totaling $709 thousand (10%) has been realized as a result of an increase in volume for prospectus and exempt distribution filings. This was more than offset by a $240 thousand (4%) decrease from registrants, primarily due to fewer investment funds prospectus filings and a $566 thousand (81%) decrease for marketplaces and other entities, primarily due to fewer applications for relief.
Variance from current year plan: Activity fee revenues were $1.6 million (13%) higher than plan for the current year. Issuer activity fees were higher than plan by $377 thousand (5%), mainly due to higher exempt distribution filings, which were partially offset by lower applications for relief. Registrant activity fees were greater than plan by $1.0 million (25%) as a result of higher than expected investment fund prospectus filings and greater than expected filings of applications for relief. Activity fees attributable to marketplaces and other entities were $133 thousand (100%) higher than plan as no marketplace and other entity activities were expected for the year, given the one-time nature of these filings.
2016 plan: The 2016 plan for activity fees totals $14.7 million: $8.1 million from issuers, $6.7 million from registrants and $0 from marketplaces and other entities. This represents a $1.6 million (12%) increase from the current year actual results and a $3.2 million (27%) increase from the 2015 plan, which reflects higher activity fee rates for certain filings.
Activity fees
2014 Plan
2015 Plan
$13.7 M
$11.6 M
2016 Plan $14.7 M
2014 Actual
2015 Actual $13.1 M
$13.2 M
Variance from prior year: Late fee revenues were $156 thousand (8%) higher than the prior year as a result of more exempt distributions filings submitted late than in the prior year.
Variance from current year plan: Late fee revenues were $122 thousand (6%) higher than plan for the current year. This was also mainly due to more exempt distribution filings submitted late than planned.
2016 plan: The 2016 plan for late fees totals $2.0 million, which is consistent with the amount of late fee revenue that has been generated over the last two years.
Late fees
2014 Plan
2015 Plan
$2.7 M
$2.0 M
2016 Plan $2.0 M
2014 Actual
2015 Actual $2.1 M
$2.0 M

OSC Annual Report
2015
Management’s Discussion and Analysis
24 25
ExpensesIn 2015, our total expenses were $98.9 million, up $1.2 million (1%) from $97.7 million in 2014 (excluding Recoveries of enforcement costs). Total expenses for the year were under plan by $5.1 million (5%) before Recoveries of enforcement costs as a result of cost cutting and deferral initiatives.
Targeted underspending in Salaries and benefits accounted for 38% of the variance, while 32% related to underspending in Professional services. Other areas of underspending included Administrative expenses and Depreciation.
(Thousands) % of 2015 Expenses 2015 2014 Change % Change
Salaries and benefits 77.1% $76,231 $74,471 $1,760 2.4%
Administrative 8.1% 8,017 7,761 256 3.3%
Occupancy 7.8% 7,741 7,997 (256) -3.2%
Professional services 3.6% 3,551 4,446 (895) -20.1%
Depreciation 2.7% 2,702 2,481 221 8.9%
Other 0.7% 628 507 121 23.9%
100% $98,870 $97,663 $1,207 1.2%
Recoveries of enforcement costs (2,995) (508) (2,487) 489.6%
Total expenses (net of recoveries) $95,875 $97,155 $(1,280) -1.3%
[Include pie chart of the various components of revenue in
percentages for 2014.
76.3% Salaries and benefits
7.9% Administrative
8.2% Occupancy
4.6% Professional services
2.5% Depreciation
0.5% Other
2014
[Include pie chart of the various components of revenue in
percentages for 2014.
77.1% Salaries and benefits
7.8% Occupancy
8.1% Administrative
3.6% Professional services
2.7% Depreciation
0.7% Other
2015

OSC Annual Report 2015
Management’s Discussion and Analysis
26 27
The following is a discussion of the significant changes in Expense components.
For details on the composition of the Salaries and benefits expenses incurred, see Note 15 of the financial statements.
Variance from prior year: Salaries and benefits were $1.8 million (2%) higher this year than the prior year. This was a result of an increase in the average number of active positions coupled with salary increases implemented at the beginning of the year.
Variance from current year plan: Salaries and benefits were $2.0 million (3%) lower than plan for the current year. This was a result of targeted cost-cutting measures, including maintaining vacancies for a longer than expected period of time, where possible.
2016 plan: The 2016 plan for Salaries and benefits totals $80.7 million. This represents a $4.5 million (6%) increase from the current year actual results and a $2.5 million (3%) increase from the 2015 plan. The increase reflects an increased investment in the oversight of the derivatives and exempt markets, investor outreach and investment in IT. In addition, with the dissolution of the Investor Education Fund (IEF), the OSC will increase its focus on investors (including education) and will incur additional staffing costs toward this effort.
For details on the composition of Administrative expenses incurred, see Note 16 of the financial statements.
Variance from prior year: Administrative expenses were $256 thousand (3%) higher this year than the prior year. This was a result of higher information services costs to support our research and analysis.
Variance from current year plan: Administrative expenses were $910 thousand (10%) lower than plan for the current year. This was primarily the result of reduced spending on training initiatives, coupled with reduced maintenance costs on IT due to more cost-effective alternatives sourced, or the deferral of planned costs.
2016 plan: The 2016 plan for Administrative expenses totals $9.1 million. This represents a $1.1 million (14%) increase from 2015 actual results and a $217 thousand (2%) increase from the 2015 plan. The increase represents additional maintenance costs for our information systems deferred from 2015.
Salaries and benefits
2014 Plan
2015 Plan
$76.9 M
$78.2 M
2016 Plan $80.7 M
2014 Actual
2015 Actual $76.2 M
$74.5 M
Administrative
2014 Plan
2015 Plan
$8.5 M
$8.9 M
2016 Plan $9.1 M
2014 Actual
2015 Actual $8.0 M
$7.8 M

OSC Annual Report
2015
Management’s Discussion and Analysis
26 27
Variance from prior year: Occupancy expenses were $256 thousand (3%) lower this year than the prior year as a result of higher sublease-related recoveries and more favourable realty tax costs in our space lease costs.
Variance from current year plan: Occupancy expenses were $207 thousand (3%) lower than plan for the current year as a result of a reduction in property taxes included in our space lease costs.
2016 plan: The 2016 plan for Occupancy expenses totals $8.2 million. This represents a $470 thousand (6%) increase from the current year actual results and a $263 thousand (3%) increase from the 2015 plan. The increase reflects an increase in leased space and expected additional costs for utilities.
Variance from prior year: Professional services expenses were $896 thousand (20%) lower this year than the prior year. This was due to targeted lower spending on consulting and other support on Enforcement matters, compared to 2014 by utilizing internal resources to a greater extent.
Variance from current year plan: Professional services expenses were $1.6 million (32%) lower than plan for the current year as a result of targeted underspending, utilization of internal resources and deferral of certain initiatives.
2016 plan: The 2016 plan for Professional services expenses totals $8.0 million. This represents a $4.4 million (125%) increase from 2015 actual results and is to support the planned investments in derivatives oversight, investor outreach and IT enhancements.
Variance from prior year: Depreciation expense was $221 thousand (9%) higher than the prior year due to an increase in the capital asset base.
Variance from current year plan: Depreciation expense was $67 thousand (2%) lower than plan for the current year. This was because equipment and information systems purchases, which are capitalized, were incurred later than planned in the fiscal year.
2016 plan: The 2016 plan for Depreciation expense totals $3.0 million. This represents a $298 thousand (11%) increase from the current year actual results as new purchases begin to be depreciated.
Occupancy
2014 Plan
2015 Plan
$8.3 M
$7.9 M
2016 Plan $8.2 M
2014 Actual
2015 Actual $7.7 M
$8.0 M
Professional services
2014 Plan
2015 Plan
$6.7 M
$5.2 M
2016 Plan $8.0 M
2014 Actual
2015 Actual $3.6 M
$4.5 M
Depreciation
2014 Plan
2015 Plan
$3.1 M
$2.8 M
2016 Plan $3.0 M
2014 Actual
2015 Actual $2.7 M
$2.5 M
CSA shared costs
As a member of the CSA, the OSC pays a portion of the costs to operate the CSA’s office and joint CSA projects. In 2015, total CSA spending on shared projects was $1.8 million ($1.9 million in 2014). The OSC contributed $685 thousand ($692 thousand in 2014). CSA shared costs expenses incurred by the OSC are included in Professional services expenses.
CSA project costs are allocated to each CSA member based on the population of its jurisdiction as a percentage of all participating jurisdictions. All CSA projects, including developing harmonized securities policies and rules, are coordinated through a central secretariat. In 2015, the OSC contributed $393 thousand ($331 thousand in 2014) to support the CSA Secretariat.

OSC Annual Report 2015
Management’s Discussion and Analysis
28 29
Liquidity and financial positionA discussion of our liquidity, cash flows, financing activities and changes in our financial position
Liquidity
Cash
At March 31, 2015, the OSC held $17.0 million in Cash ($9.5 million in 2014) and $20.0 million in Reserve fund assets ($20.0 million in 2014), for a combined total of cash and cash equivalent resources available of $37.0 million ($29.5 million in 2014).
2014
2015
$9.5 M
$17.0 M
At March 31, 2015, the OSC had current assets of $21.3 million ($14.3 million in 2014) and current liabilities of $16.1 million ($18.3 million in 2014) for a current ratio of 1.3:1 (0.8:1 in 2014). The higher current ratio is due to the increase in our Cash balance as described below.
The OSC uses multi-year forward-looking operational forecasts to anticipate potential future cash requirements. In 2015, a slightly lower amount was drawn on the line of credit and for a slightly shorter period than in 2014. This resulted in a reduction in interest charges paid on the line of credit.
The OSC’s Cash position increased $7.5 million (78%) from 2014 as a result of an operational surplus in 2015 adjusted by investment in fixed assets. In 2015, we had an excess of revenue over expenses of $8.1 million ($1.5 million in 2014), and our year-end surplus was $14.3 million ($6.5 million in 2014).
Cash flows
In 2014, Cash flows from operating activities produced an inflow of $9.2 million ($5.4 million in 2014). Property, plant & equipment investments in 2015 consumed $1.6 million ($6.9 million in 2014). Financing activities, which consisted of interest on the line of credit, utilized $101 thousand.
Approximately 76% of our revenues are received in the last quarter of each fiscal year, while expenses are incurred relatively evenly over the fiscal year. This timing difference typically results in negative cash balances from the second quarter to the beginning of the fourth quarter of each fiscal year. The OSC currently uses two key tools to manage temporary negative cash positions: a $20.0 million general operating reserve and a $52.0 million revolving line of credit, both as approved by the Minister of Finance.
In 2015, we used all of our $20.0 million in Reserve fund assets and $19.5 million ($24.0 million in 2014) of our revolving line of credit to fund operations. We repaid the full outstanding balance of the line of credit and restored the $20.0 million in Reserve fund assets in early January 2015 when most registrant participation fees were received.
Financial instruments
The OSC uses Cash and Reserve fund assets to manage its operations. Both are recorded at fair value. See Note 3(a) of the financial statements for the OSC’s accounting policies related to financial instruments.
The OSC acts as a custodian of Funds held pursuant to designated settlements and orders, and funds held for CSA Systems redevelopment (included in Net assets held for CSA Systems operations and redevelopment). Both are recorded at fair value.
The OSC is not exposed to significant interest rate, currency or liquidity risks from these investments because they are short-term in nature and all balances are denominated in Canadian dollars. For a complete analysis of the risks relating to these financial instruments, see Note 4 of the financial statements.
Trade and other receivables, Trade and other payables and accrued liabilities are recorded at amortized cost, which approximates fair value given their short-term maturities. For more information on Trade and other receivables, see Note 5 of the financial statements. For more information on Trade and other payables (including accrued liabilities), see Note 10 of the financial statements.
Financial positionThe following is a discussion of the significant changes in our Statement of financial position.
Trade and other receivables
Trade and other receivables were $3.0 million ($3.5 million in 2014). The decrease was primarily due to a decrease on the amount owing to the OSC as a recovery of HST.
For more information on Trade and other receivables, see Note 4 and Note 5 of the financial statements.
Prepayments
Prepayments totaled $1.4 million ($1.3 million in 2014), reflecting a 6% increase as a result of an increase in professional memberships and subscriptions for information services that were prepaid near the end of the fiscal year.
We hold enough Cash, Reserve fund assets and credit access to ensure liquidity for our forecast cash requirements.
The OSC is not exposed to significant interest rate, currency or liquidity risks.

OSC Annual Report
2015
Management’s Discussion and Analysis
28 29
Funds held pursuant to designated settlements and orders
2014
2015
$18.6 M
$24.7 M
The Commission may impose monetary sanctions for breaches of Ontario securities law. The sanctions reflect what the Commission believes is appropriate for the circumstances, regardless of a respondent’s ability to pay. This practice is intended to deter others from contravening the Securities Act (Ontario).
The OSC may designate funds under settlement agreements and orders from enforcement proceedings to be allocated as the OSC may determine. This includes allocating money to harmed investors, where an allocation can be reasonably made, and for investor education. Funds not designated when settlements are approved or when orders are made must be paid to the Consolidated Revenue Fund of the Government of Ontario.
In 2015, $53.0 million in orders was assessed ($61.7 million in 2014). The OSC recorded $10.6 million of that money in Funds held pursuant to designated settlements and orders ($3.9 million in 2014). Of this amount, the OSC collected $7.5 million in 2015 ($1.8 million in 2014) and deemed $2.1 million ($1.9 million in 2014) as being collectible.
As authorized by its Board, the OSC distributed $22 thousand ($1.4 million in 2014) to harmed investors, $2.1 million ($3.3 million in 2014) to the IEF and $2.5 million ($500 thousand in 2014) to the Canadian Foundation for the Advancement of Investor Rights (FAIR Canada).
At March 31, 2015, the accumulated balance of designated funds was $24.7 million ($18.6 million in 2014). Of this amount, $19.9 million was held in cash ($13.9 million in 2014) and $4.9 million was deemed as being receivable ($4.7 million in 2014). After considering funds set aside for possible allocation to harmed investors, $5.6 million of the funds on hand is available for distribution ($8.4 million in 2014).
For more information on Funds held pursuant to designated settlements and orders, see Note 6 of the financial statements.
The IEF was dissolved on March 31, 2015. For more information on the IEF, see Note 19 of the financial statements.
Collecting monetary sanctions
While the OSC actively works to collect outstanding sanction amounts, material differences between assessments and collections have persisted since we began imposing monetary sanctions. Historically, collection rates from market participants have been much higher than from respondents sanctioned on matters related to fraud – where assets are typically non-existent or inaccessible. Collections of monetary sanctions improved in 2015 primarily because two of the respondents are well-established firms that paid the sanctions assessed to them.
We continue to look for ways to improve our collections rates, including reviewing the experiences of other public and private sector organizations to identify methods that can be used by the OSC. We actively pursue collections using internal and external resources.
A list of respondents who are delinquent in paying monetary sanctions to the Commission is available on the OSC website at www.osc.gov.on.ca.
The table below shows the collection rates on sanction amounts for the last three years.
2013 Assessed Collected % Collected
Settlements $33,922,886 $1,251,268 3.69%
Contested hearings 46,251,826 1,966,866 4.25%
Total $80,174,712 $3,218,134 4.01%
2014 Assessed Collected % Collected
Settlements $16,010,927 $1,230,469 7.69%
Contested hearings 45,664,682 538,300 1.18%
Total $61,675,609 $1,768,769 2.87%
2015 Assessed Collected % Collected
Settlements $17,890,404 $7,155,590 40.00%
Contested hearings 35,080,537 343,251 0.98%
Total $52,970,941 $7,498,841 14.16%

OSC Annual Report 2015
Management’s Discussion and Analysis
30 31
Reserve fund assets
Since 2001, the OSC has held $20.0 million in Reserve fund assets, as approved by the then Minister of Finance, to guard against revenue shortfalls or unexpected expenses, or to cover discrepancies between timing of revenue and expenses. Our primary investment consideration is protection of capital and liquidity. The OSC records income generated by the Reserve fund assets with general operations. The Reserve fund assets are segregated as a Reserve operating surplus to reflect their restricted use.
For more information on Reserve fund assets, see Note 8 of the financial statements.
Property, plant & equipment
Property, plant & equipment decreased 8% to $12.6 million ($13.7 million in 2014). The decrease is the result of delayed fixed asset acquisitions and the impact of depreciation of significant acquisitions in recent years.
2014
2015
$13.7 M
$12.6 M
For more information on Property, plant & equipment, see Note 9 of the financial statements.
Trade and other payables
Trade and other payables decreased 12% to $16.1 million ($18.3 million in 2014). An increase in accrued salaries and related benefits accrued at the end of 2015 was more than offset by a decrease in Trade payables from the prior year due to lower IT capital purchases made and payable near the end of fiscal 2015 relative to 2014.
2014
2015
$18.3 M
$16.1 M
For more information on Trade and other payables, see Note 10 of the financial statements.
The OSC’s lease commitments are outlined in Note 11 of the financial statements.
Pension liabilities
The accrued supplemental pension plans’ defined benefit obligation Pension liabilities of $3.6 million ($3.1 million in 2014) represents future obligations for supplemental pension plans for present and past Chairs and Vice-Chairs. Revisions to actuarial assumptions are the main reason for the increase. The OSC’s related expenses for the year were $262 thousand ($247 thousand in 2014).
2014
2015
$3.1 M
$3.6 M
For more information on the supplementary pension plan and related defined benefit obligation see Note 12(b) of the financial statements.
Net assets held for CSA Systems operations and redevelopment (formerly Net assets held for CSA Systems redevelopment)
The core CSA National Systems (CSA Systems) are hosted and operated by CGI Information Systems and Management Consultants Inc. (CGI). The CSA Systems include the System for Electronic Document Analysis and Retrieval (SEDAR), the System for Electronic Disclosure by Insiders (SEDI) and the National Registration Database (NRD). Market participants are required to use the CSA Systems to file regulatory documents, such as prospectuses and other disclosure documents, report trades by insiders, file registration information and submit fee payments.
The OSC, Alberta Securities Commission (ASC), British Columbia Securities Commission (BCSC) and l’Autorité des marchés financiers (AMF) are principal administrators (PAs) of the CSA Systems. The OSC has been appointed the Designated Principal Administrator – Operations (DPA). As DPA, the OSC oversees the custody and financial management of the system fees collected relating to CSA Systems use by market participants. The CSA IT Systems Project Office, which is housed at the OSC, manages the CSA Systems business relationships with third-party technology providers.
The Net assets held for CSA Systems operations and redevelopment includes all surplus funds accumulated from CSA Systems operations collected, held and administered by the DPA on behalf of the PAs. The use of these surplus funds is governed by various agreements between the PAs and the total is reflected in the Statement of financial position as both a Non-current asset and an equal offsetting Non-current liability of $128.8 million ($115.7 million in 2014).
For more information on the judgment exercised with respect to the appropriate accounting treatment of these surplus funds, see Note 2(d) of the financial statements.
2014
2015
$115.7 M
$128.8 M
The funds included in Net assets held for CSA Systems operations and redevelopment may be used to fund the operations of the CSA Systems, enhance the systems, reduce systems fees, offset shortfalls in system fee revenue related to operation of SEDAR, SEDI and NRD, and fund the operations of the DPA and the CSA IT Systems Project Office.
For more information on Net assets held for CSA Systems operations and redevelopment, including current and prior year operating results, see Note 7 and Note 17(a) of the financial statements.

OSC Annual Report
2015
Management’s Discussion and Analysis
30 31
2016 Strategy Our plans and budget for fiscal year 2016
Statement of Priorities Every year, the OSC publishes a Statement of Priorities for the current fiscal year. It sets out the specific areas we will focus on to fulfil our mandate. The public has an opportunity to comment on the draft document before the Statement of Priorities is published and delivered to the Minister of Finance.
On April 2, 2015, the OSC published its 2015-2016 OSC Draft Statement of Priorities – Request for Comments. The draft Statement of Priorities was open for public comment until June 1, 2015 and is available on the OSC website at www.osc.gov.on.ca.
2016 Budget approachThe 2016 OSC budget is focused on maintaining fiscal responsibility while investing in the following four key areas:
1. Improving investor education, outreach and advocacy through the creation of an integrated Office of Investor Policy, Education and Outreach
2. Developing and implementing a new regulatory framework (including supervision and oversight) for the derivatives market
3. Enhancing oversight of activities in the exempt market
4. Improving the OSC’s use of IT and data to support a greater reliance on data and research
As a result, the 2016 budget is 7% higher than the 2015 budget. Salaries and benefits, which comprise $80.5 million or 74% of the budget, represent an increase of $4.3 million or 5.6% over 2015 spending. This is largely due to:
• new positions approved to support the investments noted above,
• full-year costs for vacancies and staff hired in 2015, and
• resources for work toward the successful implementation of the CCMR.
Budget amounts will decrease or remain flat in approximately 40% of the OSC’s operating branches.
The capital budget primarily reflects costs to support the OSC’s IT needs, including a data warehouse to support the oversight of the derivatives market.
The Statement of Priorities is our cornerstone accountability document.
2016 Plan
For more information on 2016 planned budget amounts for significant revenue and expense line items, see the Revenue and Expenses sections of this MD&A.
2015-16 Budget to 2014-15 Budget
2015-16 Budget to 2014-15 Actual
(Thousands) 2014-15 Budget
2014-15Actual
2015-16 Budget Change % Change Change % Change
Revenue $101,325 $103,936 $115,782 $14,457 14.3% $11,846 11.4%
Expenses 102,976 95,875 109,182 6,206 6.0% 13,307 13.9%
(Deficiency)/Excess of revenue over expenses $(1,651) $8,061 $6,600 $8,251 $(1,461)
Property, plant & equipment $3,349 $1,616 $3,101 $(248) $1,485

OSC Annual Report 2015
Management’s Discussion and Analysis
32 33
Critical accounting estimatesJudgments, estimates and assumptions related to preparing IFRS financial statements
Preparing financial statements consistent with IFRS requires that management make judgments, estimates and assumptions that affect reported amounts of assets and liabilities for the date of the financial statements, as well as reported amounts of the revenues and expenses for the periods.
These judgments, estimates and assumptions are considered “critical” if:
• they require assumptions about highly uncertain matters when made, or
• we could reasonably have used different judgments, estimates or assumptions in the period, or
• related changes are likely to occur between periods that would materially affect our financial condition, changes in our financial condition or results of our operations.
Judgment was used to determine the appropriate accounting treatment for the IEF and the Net assets held for CSA Systems redevelopment.
Sources of estimation uncertainty primarily consisted of the supplemental pension plan defined benefit obligation Pension liabilities, Funds held pursuant to designated settlements and orders, and Recoveries of enforcement costs.
For more information on judgments and sources of estimation uncertainty that impact the OSC, see Note 2(d) of the financial statements.
Risks and risk management Risks and uncertainties facing us, and how we manage these risks
Risk can relate to threats to the OSC’s strategy or operations, or failure to take advantage of opportunities. The OSC seeks to fully address or mitigate the strategic and business risks that are most likely to impair achievement of our mandate.
Strategic risksThe OSC applies International Risk Management Standard ISO 31000 to its enterprise risk management. We do this through a Risk Management Framework, which we adopted in November 2012. The goal of the framework is to embed risk management at key strategic decision points, and within all elements of our operations and through all levels of staff. The framework sets out a process for identifying and assessing risks, and highlighting and reviewing controls.
Strategic risk inventory
Information gathered through the risk management process is captured in the OSC’s Strategic Risk Inventory. It includes a “top-down” and “bottom-up” view of the risks and controls within the OSC. The top-down portion describes the environment in which the OSC works, while the bottom-up portion deals with day-to-day operational risks that affect our ability to do our work.
The OSC’s Risk Committee reviews the Strategic Risk Inventory each quarter to identify significant changes in the OSC’s risk profile, including any new or emerging risks. This information is reported to Senior Management, the Audit and Finance Committee, and the Board of Directors.
Business risksThe OSC has established policies and processes to identify, manage and control operational and business risks that may impact our financial position and our ability to carry out regular operations. Management is responsible for ongoing control and reduction of operational risk by ensuring appropriate procedures, internal controls and processes, other necessary actions and compliance measures are undertaken.
Operational risk can include risk to the OSC’s reputation. Reputational risk, as it relates to financial management, is primarily addressed through the OSC’s Code of Conduct and governance practices established by its Board of Directors (details available at www.osc.gov.on.ca), as well as other specific risk management programs, policies, procedures and training.
Internal auditOSC Internal Audit is an assurance and advisory service to the Board of Directors and to management. Internal Audit helps the OSC develop, evaluate and improve risk management practices, risk-based internal controls, good governance and sound business practices.

OSC Annual Report
2015
Management’s Discussion and Analysis
32 33
The internal audit function is governed by a Charter approved by the OSC’s Board of Directors and by an internal annual audit plan that is approved by the Board. The Chief Internal Auditor reports, and provides quarterly updates, to the Audit and Finance Committee. In addition, the Chief Internal Auditor provides an annual report on the results of internal audit engagements to the Board of Directors.
The following are key business risks that the OSC has identified and actively manages.
Systems risk
The OSC’s Information Services group regularly monitors and reviews the OSC’s systems and infrastructure to maintain optimal operation. The OSC also performs extensive security and vulnerability assessments bi-annually to highlight potential areas of risk. All findings and key recommendations from these assessments are tracked along with a management response and target remediation date. The results of these assessments and the progress made to address these findings and recommendations are reported to the Audit and Finance Committee and are used to improve security of the OSC systems.
The OSC relies on CSA Systems, which are operated by CGI, to collect most of its fee revenue. The CSA requires CGI to provide an annual third-party audit report (CSAE 3416 – Type II) that reviews and evaluates the internal controls design and effectiveness of the CSA Systems and CGI’s outsourcing operations. CGI is also required to have an operating disaster recovery site for operating these systems and to test it annually, with the most recent test performed in February 2015.
The OSC could be contingently liable for claims against, or costs related to, CSA Systems operations. See Note 17 of the financial statements for more information. No material change is expected in the volume of fees collected through these systems. In fiscal 2016, the CSA IT Systems Project Office intends to issue a competitive tender for redeveloping these systems.
Business continuity
The OSC has a detailed Business Continuity Plan (BCP) to ensure critical regulatory services can continue if an external disruption occurs. Offsite facilities tests are performed bi-annually. The BCP is continually reviewed and refined, and includes strategies to effectively address various market disruption scenarios.
Financial risk
The OSC maintains strong internal controls, including management oversight to provide reasonable assurance of financial reporting reliability and preparation of financial statements for external purposes consistent with IFRS. These controls are tested annually through our internal control over financial reporting (ICFR) program.
The fee rules for fiscal years ending March 31, 2014 and 2015 introduced the concept of a reference fiscal year to calculate participation fees. This was expected to significantly reduce the impact of market fluctuations on participation fee revenue. However, market fluctuations continued to affect our ability to precisely forecast revenue. For fiscal years ending March 31, 2016, 2017 and 2018, we have returned to requiring participants to use their most recent fiscal year as the basis for calculating their participation fees. As a result, actual revenues received may be lower than plan, but are not expected to impair our operations.
Legal risk
Occasionally, the OSC is involved in legal actions arising from the ordinary course of business. This year, no new legal actions were commenced against the OSC and one existing action against the OSC was dismissed by the court. It is not possible to determine the outcome and ultimate disposition of all other outstanding actions involving the OSC. However, management does not expect the outcome of any such proceedings, individually or in aggregate, to have a material impact on the OSC’s financial position. Any settlements in these actions would be accounted for when they occur.
Internal control over financial reporting (ICFR)A summary of our ICFR program results
During the year, the OSC’s ICFR processes were reviewed and documentation updated where necessary. Operating effectiveness was tested using the framework and criteria established in “Internal Control – Integrated Framework (2013 version)” issued by the Committee of Sponsoring Organizations of the Treadway Commission (COSO). Staff performed an evaluation, under the supervision and with the participation of management, of the effectiveness of the OSC’s ICFR as at March 31, 2015. Based on this evaluation, the OSC has concluded that the ICFR was operating effectively and that there are no material weaknesses.
There have been no significant changes in controls that occurred during the most recent year ended March 31, 2015, that have materially affected, or are reasonably likely to materially affect, the OSC’s ICFR. The Chair and the Director, Corporate Services certify the design and effectiveness of ICFR in the Statement of Management’s Responsibility and Certification.
The OSC transitioned to the 2013 Internal Control – Integrated Framework issued by COSO in 2015.

34 35
FINANCIAL STATEMENTS
The Securities Act and registered company listings from the 1950s

OSC Annual Report
2015
Financial Statements
34 35
Management’s Responsibility and CertificationManagement is responsible for the integrity, consistency and reliability of the financial statements and other information presented in the annual report. The financial statements have been prepared by Management in accordance with International Financial Reporting Standards.
We certify that we have reviewed the financial statements and other information contained in the annual report, and, based on our knowledge, they do not contain any untrue statement of a material fact or omit to state a material fact required to be stated or that is necessary to make a statement not misleading in light of the circumstances under which it was made, with respect to the period covered by the statements and the annual report.
Based on our knowledge, the financial statements together with other financial information included in the annual report fairly present in all material respects the financial condition, results of operations and cash flows of the Ontario Securities Commission (the “OSC”) as of the dates and for the periods presented. The preparation of financial statements involves transactions affecting the current period which cannot be finalized with certainty until future periods. Estimates and assumptions are based on historical experience and current conditions, and are believed to be reasonable.
We are responsible for establishing and maintaining internal control over financial reporting for the OSC. We have designed such internal control over financial reporting, or caused it to be designed under our supervision, to provide reasonable assurance regarding the reliability of financial reporting and the preparation of financial statements for external purposes in accordance with Canadian generally accepted accounting principles.
We evaluated, or caused to be evaluated under our supervision, the effectiveness of the OSC’s internal control over financial reporting at the financial year end and the OSC has disclosed in its annual MD&A our conclusion about the effectiveness of internal control over financial reporting at the financial year end based on that evaluation.
We have also disclosed in the MD&A any change in our internal control over financial reporting that occurred during the year that has materially affected, or is reasonably likely to materially affect, our internal control over financial reporting.
The Board of Directors ensures that management fulfils its responsibility for financial reporting and internal control. The financial statements have been reviewed by the Audit and Finance Committee and approved by the Board of Directors. The Auditor General’s Report, which follows, outlines the scope of the Auditor’s examination and opinion on the financial statements.
Howard I. Wetston, Q.C.
Chair and Chief Executive Officer
June 8, 2015
H.R. Goss
Director, Corporate Services
Financial Statements Contents
36
Independent Auditor’s Report
37
Statement of financial position
38
Statement of comprehensive income
38
Statement of changes in surplus
39
Statement of cash flows
40-59
Notes to the financial statements

OSC Annual Report 2015
Financial Statements
36 37
Independent Auditor’s ReportTo the Ontario Securities Commission
I have audited the accompanying financial statements of the Ontario Securities Commission, which comprise the statement of financial position as at March 31, 2015, and the statement of comprehensive income, statement of changes in surplus and statement of cash flows for the year then ended, and a summary of significant accounting policies and other explanatory information.
Management’s Responsibility for the Financial Statements
Management is responsible for the preparation and fair presentation of these financial statements in accordance with International Financial Reporting Standards and for such internal control as management determines is necessary to enable the preparation of financial statements that are free from material misstatement, whether due to fraud or error.
Auditor’s Responsibility
My responsibility is to express an opinion on these financial statements based on my audit. I conducted my audit in accordance with Canadian generally accepted auditing standards. Those standards require that I comply with ethical requirements and plan and perform the audit to obtain reasonable assurance about whether the financial statements are free from material misstatement.
An audit involves performing procedures to obtain audit evidence about the amounts and disclosures in the financial statements. The procedures selected depend on the auditor’s judgment, including the assessment of the risks of material misstatement of the financial statements, whether due to fraud or error. In making those risk assessments, the auditor considers internal control relevant to the entity’s preparation and fair presentation of the financial statements in order to design audit procedures that are appropriate in the circumstances, but not for the purpose of expressing an opinion on the effectiveness of the entity’s internal control. An audit also includes evaluating the appropriateness of accounting policies used and the reasonableness of accounting estimates made by management, as well as evaluating the overall presentation of the financial statements.
I believe that the audit evidence I have obtained is sufficient and appropriate to provide a basis for my audit opinion.
Opinion
In my opinion, the financial statements present fairly, in all material respects, the financial position of the Ontario Securities Commission as at March 31, 2015 and its financial performance, and its cash flows for the year then ended in accordance with International Financial Reporting Standards.
Bonnie Lysyk, CPA, CA, MBA, LPA
Auditor General
June 8, 2015

OSC Annual Report
2015
Financial Statements
36 37
Statement of financial position (in Canadian dollars)
As at March 31, 2015 Note(s) 2015 2014
ASSETS
Current
Cash $16,984,305 $9,518,603
Trade and other receivables 4, 5 2,975,339 3,503,209
Prepayments 1,373,481 1,292,995
Total current $21,333,125 $14,314,807
Non-current
Funds held pursuant to designated settlements and orders 3(d), 6 24,702,966 18,573,291
Net assets held for CSA Systems operations and redevelopment 7, 17 128,793,173 115,685,590
Reserve fund assets 8 20,000,000 20,000,000
Property, plant & equipment 9 12,584,733 13,675,681
Total non-current $186,080,872 $167,934,562
Total assets $207,413,997 $182,249,369
LIABILITIES
Current
Trade and other payables 10 $16,082,770 $18,332,125
Total current $16,082,770 $18,332,125
Non-current
Pension liabilities 12(b) 3,560,802 3,118,630
Funds held pursuant to designated settlements and orders 3(d), 6 24,702,966 18,573,291
Net assets held for CSA Systems operations and redevelopment 7, 17 128,793,173 115,685,590
Total non-current $157,056,941 $137,377,511
Total liabilities $173,139,711 $155,709,636
SURPLUS
General $14,274,286 $6,539,733
Reserve 8, 13 20,000,000 20,000,000
Operating surplus $34,274,286 $26,539,733
Total liabilities and surplus $207,413,997 $182,249,369
The related notes are an integral part of these financial statements.
On behalf of the Board of the Commission
Howard I. Wetston, Q.C.
Chair
Sarah Kavanagh
Chair, Audit and Finance Committee

OSC Annual Report 2015
Financial Statements
38 39
Statement of comprehensive income (in Canadian dollars)
For the year ended March 31, 2015 Note(s) 2015 2014
REVENUE
Fees 3(c), 14 $103,655,869 $98,441,276
Miscellaneous 159,286 108,047
Interest income 120,645 127,797
$103,935,800 $98,677,120
EXPENSES
Salaries and benefits 15 $76,230,578 $74,471,187
Administrative 16 8,016,972 7,760,794
Occupancy 7,741,228 7,996,668
Professional services 3,551,063 4,446,393
Depreciation 9 2,702,076 2,480,939
Other 628,203 506,546
$98,870,120 $97,662,527
Recoveries of enforcement costs 3(c) (2,995,062) (507,879)
$95,875,058 $97,154,648
Excess of revenue over expenses $8,060,742 $1,522,472
OTHER COMPREHENSIVE INCOME
Items that will not be reclassified to profit and loss:
Remeasurements of defined benefit pension plans 12(b) $(326,189) $(290,257)
Other comprehensive loss $(326,189) $(290,257)
Total comprehensive income $7,734,553 $1,232,215
The related notes are an integral part of these financial statements.
Statement of changes in surplus (in Canadian dollars)
For the year ended March 31, 2015 Note(s) 2015 2014
Operating surplus, beginning of year $26,539,733 $25,307,518
Total comprehensive income 7,734,553 1,232,215
Operating surplus, end of year $34,274,286 $26,539,733
Represented by:
General $14,274,286 $6,539,733
Reserve 8, 13 20,000,000 20,000,000
$34,274,286 $26,539,733
The related notes are an integral part of these financial statements.

OSC Annual Report
2015
Financial Statements
38 39
Statement of cash flows (in Canadian dollars)
For the year ended March 31, 2015 Note(s) 2015 2014
CASH FLOWS FROM OPERATING ACTIVITIES
Excess of revenue over expenses $8,060,742 $1,522,472
Adjusted for:
Interest received $117,660 $134,799
Interest income (120,645) (127,797)
Interest expense on line of credit 101,499 130,305
Pension liabilities 115,982 96,846
Loss on disposal of Property, plant & equipment 9 5,159 40,214
Depreciation 9 2,702,076 2,480,939
$10,982,473 $4,277,778
CHANGES IN NON-CASH WORKING CAPITAL
Trade and other receivables $530,855 $56,032
Prepayment (80,486) (163,230)
Trade and other payables (2,249,355) 1,242,003
$(1,798,986) $1,134,805
Net cash flows from operating activities $9,183,487 $5,412,583
CASH FLOWS USED IN INVESTING ACTIVITIES
Purchase of property, plant and equipment 9 $(1,616,286) $(6,939,659)
Net cash flows used in investing activities $(1,616,286) $(6,939,659)
CASH FLOWS USED IN FINANCING ACTIVITIES
Interest paid on line of credit $(101,499) $(130,305)
Net cash flows used in financing activities $(101,499) $(130,305)
Net increase/(decrease) in cash position $7,465,702 $(1,657,381)
Cash position, beginning of period 9,518,603 11,175,984
Cash position, end of period $16,984,305 $9,518,603
The related notes are an integral part of these financial statements.

OSC Annual Report 2015
Notes to the Financial Statements
40 41
Notes to the financial statements 1. Reporting entityThe Ontario Securities Commission (OSC) is a corporation domiciled in Canada. The address of the OSC’s registered office is 20 Queen Street West, Toronto, Ontario, M5H 3S8. The OSC is a corporation without share capital and is the regulatory body responsible for regulating the province’s capital markets. As a Crown corporation, the OSC is exempt from income taxes.
2. Basis of presentation
(a) Statement of complianceThese financial statements are prepared in accordance with International Financial Reporting Standards (IFRS). These financial statements are for the year ended March 31, 2015 (including comparatives) and were authorized for issue by the Board of Directors on June 8, 2015.
(b) Basis of measurementThe financial statements have been prepared on the historical cost basis except for certain financial instruments that are measured at fair value, and pension liabilities that are measured net of actuarial gains and losses, as explained in Note 3(e). Historical cost is generally based on the fair value of the consideration given in exchange for assets.
(c) Functional and presentation currencyThese financial statements are presented in Canadian dollars, which is the OSC’s functional currency. Amounts have been rounded to the nearest dollar.
(d) Use of judgments and sources of estimation uncertainty
(i) Judgments
The preparation of financial statements in accordance with IFRS requires that management make judgments in applying accounting policies that can affect the reported amounts of assets and liabilities as at the date of the financial statements, as well as the reported amounts of revenue and expenditures for the period.
The following are the judgments in applying accounting policies, apart from those involving estimates, that have the most significant effect on the amounts recognized in the financial statements.
Investor Education Fund (IEF)
The IEF was a non-profit organization funded by settlements and fines from enforcement proceedings of the OSC. Prior to the dissolution of the IEF on March 31, 2015, there were a number of areas where judgment was exercised to establish whether the IEF needed to be consolidated with the OSC. Key areas of judgment included control, legal relationships, contractual terms, board and management representation, power to govern, benefits and materiality. OSC management has exercised judgment in these areas to determine that consolidation of the IEF with the OSC results would not be appropriate because investors in the capital markets, rather than the OSC, obtain the benefit or variable returns from the activities of the IEF.

OSC Annual Report
2015
Notes to the Financial Statements
40 41
With the dissolution of the IEF, judgment was exercised in the transfer of its remaining assets and liabilities to the OSC as the sole shareholder. For more information on the IEF, including its dissolution, see Note 18 and Note 19.
Net assets held for Canadian Securities Administrators (CSA) Systems operations and redevelopment (CSA Systems net assets)
The OSC has been appointed to administer the financial management processes of the CSA Systems net assets, which mainly consist of surplus funds accumulated from systems fees charged to market participants. Based on an evaluation of the contractual terms and conditions related to the arrangement, OSC management has exercised judgment to determine that participants in the capital markets, rather than the OSC (or other CSA members, including the Investment Industry Regulatory Organization of Canada [IIROC] in the case of the National Regristration Database [NRD] until October 13, 2013) obtain the benefit or rewards from the net assets or any future development of the CSA Systems. The OSC has also determined that in performing its administrative role for the CSA Systems net assets, it does not control or have significant influence over how the net assets are managed.
The OSC exercised judgment to determine that the net assets administered by the OSC on behalf of CSA Systems are best represented by the presentation of an asset and a corresponding liability.
See Note 7 for more information, including summary financial information related to the CSA Systems net assets.
(ii) Sources of estimation uncertainty
The preparation of financial statements in accordance with IFRS requires management to make assumptions about the future and other sources of estimation uncertainty that have a significant risk of affecting the carrying amounts of assets and liabilities within the next fiscal year.
Determining the carrying amounts of some assets and liabilities requires management to estimate the effects of uncertain future events on those assets and liabilities at the end of the reporting period. Actual amounts can differ from these estimates to the extent future outcomes differ significantly from management’s estimations. Estimates and underlying assumptions are reviewed on an ongoing basis. Revisions to accounting estimates are recognized in the period in which the estimates are revised and in any future periods affected.
The following are the key assumptions and other major sources of estimation uncertainty that have a significant risk of resulting in a material adjustment within the next financial year.
Supplemental pension plan
Supplemental pension plan liabilities represent the estimated present value of the OSC’s obligation for future payments on March 31, 2015. The OSC utilizes an independent actuarial expert to determine the present value of the defined benefit obligation of the Supplemental pension plan and related impact to the Statement of comprehensive income, and Other comprehensive income (OCI).
In some cases, this determination will involve management’s best estimates and information from other accredited sources. A change in one or more of these assumptions could have a material impact on the OSC’s financial statements.
The significant actuarial assumptions used to determine the present values of the defined benefit obligations and sensitivity analysis of changes in the actuarial assumptions used are outlined in Note 12(b).

OSC Annual Report 2015
Notes to the Financial Statements
42 43
Designated settlements and orders and Recoveries of enforcement costs
Designated settlements and orders and Recoveries of enforcement costs are recognized net of amounts deemed uncollectible when it is expected that the amount related to the sanction imposed on respondents is collectible. Estimation is required to determine the amount of designated settlements to recognize and orders that will be collected, and the estimated Recoveries of enforcement costs.
Management considers the ability of the respondent to pay the sanction amount, the ability to locate the respondent and whether the respondent owns any assets. A change in any of these factors can have a material impact on the OSC’s financial statements. Assets and liabilities will change related to estimated designated settlements and order amounts deemed to be collectible. Expenses may change related to the Recoveries of enforcement costs. For more information on Designated settlements and orders, see Note 6.
3. Significant accounting policiesThe accounting policies set out below have been applied consistently to all periods presented in these financial statements. See Note 20 for discussion related to accounting standards, interpretations and amendments that became effective in the year.
(a) Financial instrumentsFinancial assets and financial liabilities are recognized when the OSC becomes a party to the contractual provisions of the instrument.
Financial instruments are classified into one of the following categories: financial assets at fair value through profit or loss (held-for-trading), loans and receivables, and other liabilities.
Financial assets and financial liabilities are measured initially at fair value plus transaction costs, except for financial assets carried at fair value through profit or loss, which are measured initially at fair value.
Financial assets are derecognized when the contractual rights to the cash flows from the financial asset expire or when all substantial risks and rewards of the financial assets are transferred.
A financial liability is derecognized when it is extinguished; that is, when the contractual obligation is discharged, cancelled or expires.
The OSC has adopted the following classifications for financial assets and financial liabilities:
Financial assets at fair value through profit or loss (held-for-trading)
Cash, Funds held pursuant to designated settlements and orders, funds included in the Net assets held for the CSA Systems operations and redevelopment, and Reserve fund assets are classified as held-for-trading. The recorded balances approximate their fair value.
Loans and receivables
Trade and other receivables and receivables from designated settlements and orders are classified as loans and receivables and are measured at amortized cost, less any impairment loss. Impairment provisions are recognized when there is objective evidence (such as significant financial difficulties on the part of a market participant, or default or significant delay in payment) that the OSC will be unable to collect all of the amounts due under the terms of the amount receivable.
Other liabilities
Trade and other payables are classified as other liabilities and measured at amortized cost. The recorded balances approximate their fair value.

OSC Annual Report
2015
Notes to the Financial Statements
42 43
(b) Property, plant & equipmentItems of Property, plant & equipment are recorded at cost less accumulated depreciation and accumulated impairment losses. Cost includes expenditures that are directly attributable to the acquisition of the asset.
The cost of the Property, plant & equipment, less any residual value, is depreciated and recognized in profit and loss on a straight-line basis over the estimated useful life of the asset, as follows:
The estimated useful lives, residual values and depreciation method are reviewed at the end of each fiscal year. Any changes in estimates are accounted for on a prospective basis.
An item of Property, plant & equipment is derecognized upon disposal or when no future economic benefits are expected to arise from the continued use of the asset. Any gain or loss arising from the disposal or retirement of an item of Property, plant & equipment is determined as the difference between the net disposal proceeds and the carrying amount of the asset, and is recognized in profit or loss.
Items of Property, plant & equipment are reviewed for impairment at each reporting date. If any impairment is indicated, the asset’s recoverable amount is estimated. The recoverable amount is the higher of an asset’s fair value less costs to sell and value in use. An impairment loss is recognized for the amount by which the asset’s carrying amount exceeds its recoverable amount.
(c) Revenue recognition
Participation fees
Participation fees are recognized when received. Prior to receipt of the fee, the probability that the economic benefits associated with the transaction will flow to the OSC is unknown. In addition, reliable measurement of participation fees for new market participants is not possible because the market capitalization of issuers or the specified Ontario revenue of registrants, on which their participation fees are based, cannot be determined prior to receipt.
These fees represent the payment for the right to participate in the Ontario capital markets, and the OSC has no specific obligations throughout the year to any individual market participant. As such, the OSC’s performance consists of a single act, which is receipt of the fee payment. Once the fee is paid, there is no obligation to refund the fees and there are no other unfulfilled conditions on behalf of the OSC. Therefore, participation fees are deemed to be earned upon receipt, except in the case of specified regulated entities that file their participation fees through the OSC’s electronic filing portal, which are recognized when the fee amount can be reliably measured, which is the date the required document has been filed, or the corresponding outstanding fee is paid.
Activity fees
Activity fees represent the direct cost of OSC staff resources expended in undertaking certain activities requested of staff by market participants. Because the activities undertaken are normally completed in a relatively short period of time, activity fees are recognized when the filing is received.
Computer hardware and related applications
Network servers and cabling
Office furniture and equipment
Leasehold improvements
3 years 5 years 5 to 10 years Over remaining term of the lease plus one option period

OSC Annual Report 2015
Notes to the Financial Statements
44 45
Late filing fees
Late filing fees relating to insider trading reports are recognized weekly and include fees related to all insider trading reports filed late in the preceding seven-day period. Other late fee amounts are recognized when the fee amount can be reliably measured, which is the date the required document has been filed, or the corresponding outstanding fee is paid.
Recoveries of enforcement costs
Recoveries of enforcement costs are recorded as offsets to total expenses on the date a settlement is approved or an order is issued by the OSC, unless management determines that collecting the settlement amount is significantly doubtful, in which case, recovery is recognized when payment is received.
(d) Funds held pursuant to designated settlements and ordersFunds held pursuant to designated settlements and orders are recorded when settlements are approved or orders are made by the Commission, unless management determines that collecting the settlement amount is significantly doubtful, in which case they are recognized when payment is received. Due to the restricted use of Funds held pursuant to designated settlements and orders, a corresponding Non-current liability that equals the related Non-current asset is reflected in the Statement of financial position.
(e) Employee benefits
Ontario’s Public Service Pension Plan
The OSC provides pension benefits to its full-time employees through participation in Ontario’s Public Service Pension Plan (OPSPP), which is a multi-employer defined benefit pension plan. The Province of Ontario is the sole sponsor of the OPSPP. This plan is accounted for as a defined contribution plan because sufficient information is not provided to the OSC or otherwise available for the OSC to apply defined benefit plan accounting to this pension plan.
The plan sponsor is responsible for ensuring that the pension funds are financially viable. Any surpluses or unfunded liabilities arising from statutory actuarial funding valuations are not assets or obligations of the OSC. The OSC is not exposed to any liability to the plan for other entities’ obligations under the terms and conditions of the multi-employer plan. There is no deficit or surplus in the plan that could affect the amount of future contributions for the OSC.
In addition, there is no agreed allocation of a deficit or surplus on wind-up or withdrawal by the OSC from the plan. Payments made to the plan are recognized as an expense when employees have rendered service entitling them to the contributions. For more information on the OPSPP, see Note 12(a).
Supplemental pension plan
The OSC also maintains unfunded supplemental pension plans for certain full-time Commission members as described in Note 12(b). These plans are final salary pension plans, which provide benefits to members in the form of a guaranteed level of pension payable for life. The level of the target benefits provided depends on the members’ length of service and their salary in the final years prior to retirement. In some plans, the target benefits are indexed with inflation. The target benefits are then offset by the benefits payable from the OPSPP (registered and supplemental plans), which is linked to inflation.
The defined benefit liability recognized in the Statement of financial position for the supplemental pension plans is the present value of the defined benefit obligation at the reporting date.
Actuarial gains and actuarial losses resulting from remeasurements of the net defined benefit liability arising from the supplemental pension plans are recognized immediately in the Statement of financial position with a corresponding debit or credit through OCI in the period in which they occur. Remeasurements are not reclassified to profit or loss in subsequent periods.

OSC Annual Report
2015
Notes to the Financial Statements
44 45
Other post-employment obligations
The costs of non-pension benefits for eligible pensioners are paid by the Government of Ontario and are not included in the Statement of comprehensive income, as described in Note 18(c).
Termination benefits
Termination benefits are generally payable when employment is terminated before the normal retirement date or when an employee accepts voluntary redundancy in exchange for these benefits. The OSC recognizes a liability and an expense for termination benefits as the earlier of the date the OSC has demonstrably committed to either terminating the employment of current employees according to a detailed formal plan without a realistic possibility of withdrawal, or when the OSC has recognized costs for providing termination benefits as a result of a restructuring involving a fundamental reorganization that has a material effect on the nature and focus of OSC operations.
Short-term benefits
Short-term employee benefits, such as salaries, pension contributions, paid annual leaves and bonuses, are measured on an undiscounted basis and are expensed as the related service is provided to the OSC.
(f) LeasesAll leases currently recorded are classified as operating leases. Lease payments are expensed on a straight-line basis over the term of the lease.
In the event that lease incentives are received to enter into operating leases, the aggregate benefit of the incentives is recognized as a reduction of rental expense on a straight-line basis, except where another systematic basis is more representative of the time pattern in which economic benefits from the leased asset are consumed.
(g) ProvisionsA provision is recognized when a present legal or constructive obligation results from past events, it is probable that an outflow of resources will be required to settle the obligation and when a reliable estimate of the amount of the obligation can be made.
4. Financial instruments risksThe OSC is exposed to various risks in relation to financial instruments. The OSC’s objective is to maintain minimal risk. The OSC’s financial assets and liabilities by category are summarized in Note 3(a). The main types of risks related to the OSC’s financial instruments are currency risk, interest rate risk, credit risk and liquidity risk. This note provides information about the OSC’s exposure to these risks and the OSC’s objectives, policies and processes for measuring and managing these risks.
Currency riskThe OSC’s exposure to currency risk is minimal due to the low number of transactions denominated in currencies other than Canadian dollars.
Interest rate riskThe OSC’s financial assets and liabilities are not exposed to significant interest rate risk due to their short-term nature. The OSC’s Cash, Funds held pursuant to designated settlements and orders, Net assets held for CSA Systems operations and redevelopment (cash components) and Reserve fund assets are held by Schedule 1 banks (and credit unions in British Columbia with respect to Net assets held for CSA Systems operations and redevelopment cash components). The bank balances earn interest at a rate of 1.85% below the prime rate. The average rate of interest earned on bank balances for the year was 1.12% (2014 – 1.15%). The Reserve fund earned interest at an average rate of 1.12% (2014 – 1.15%).

OSC Annual Report 2015
Notes to the Financial Statements
46 47
A 25 basis points change in the interest rate would impact the OSC’s operating surplus as follows:
Impact on operating surplus
25 basis points increase in rates
25 basis points decrease in rates
Reserve fund assets $5,526 $(5,526)
Cash balance 22,206 (22,206)
$27,732 $(27,732)
Credit riskThe OSC is exposed to minimal credit risk related to Cash, Funds held pursuant to designated settlements and orders, cash components of Net assets held for CSA Systems operations and redevelopment, Reserve fund assets and Trade and other receivables.
Schedule 1 financial institutions hold approximately 61% of the OSC’s financial assets including those held for CSA Systems operations and redevelopment and another 34% are held in two credit unions in British Columbia (for cash components of Net assets held for CSA Systems operations and redevelopment exclusively). The Credit Union Deposit Insurance Corporation (CUDIC), a statutory corporation, guarantees all deposits of British Columbia credit unions, as set out in the Financial Institutions Act. Given the nature of these counterparties, it is management’s opinion that exposure to concentration of credit risk is minimal. In addition, the investment policy for Cash, Reserve fund assets and for Funds held pursuant to designated settlements and orders limits amounts held on deposit in any one of the Schedule 1 banks to $30.0 million for each category.
Trade receivable balances consist of a large number of debtors owing individually immaterial balances.
Other receivables in aggregate are material, with most debtors owing individually and in aggregate immaterial amounts, and a small number of debtors owing larger amounts, which are material in aggregate or individually, and are receivable from:
• Net assets held for CSA Systems operations and redevelopment, which the OSC oversees, to recover staff costs and other charges incurred, and
• Government of Canada for recovering Harmonized Sales Tax (HST) paid during the year.
Therefore, the OSC’s exposure to concentration of credit risk is minimal.
The OSC maintains an allowance for doubtful accounts. Therefore, the carrying amount of Trade and other receivables generally represents the maximum credit exposure. Based on historical information about debtors’ default rates, management considers the credit quality of trade receivables that are not past due or impaired to be good. Collection efforts continue for Trade and other receivables balances, including those that are captured in the allowance for doubtful accounts.
The aging of Trade and other receivables is as follows:
Note March 31, 2015 March 31, 2014
Current $1,965,003 $2,310,349
Past due 31 to 60 days 383,682 575,207
Past due 61 to 90 days 266,971 312,354
Past due greater than 90 days (net) 359,683 305,299
Trade and other receivables 5 $2,975,339 $3,503,209

OSC Annual Report
2015
Notes to the Financial Statements
46 47
Past due greater than 90 days detail Note March 31, 2015 March 31, 2014
Past due greater than 90 days (gross) $667,761 $1,445,598
Allowance for doubtful accounts 5 (308,078) (1,140,299)
Past due greater than 90 days (net) $359,683 $305,299
Reconciliation of allowance for doubtful accounts is as follows:
Past due greater than 90 days detail Note March 31, 2015 March 31, 2014
Opening balance $1,140,299 $1,070,344
Current year provision 455,799 164,215
Written-off during the year (1,288,020) (94,260)
Closing balance 5 $308,078 $1,140,299
In 2015, $1,288,020 of Trade and other receivables that related to balances owing prior to April 1, 2014 were written off, resulting in a reduction to the allowance for doubtful accounts and a corresponding reduction of Trade and other receivables for the same amount. As a result, there was no change to the Trade and other receivables balance in the Statement of financial position. The amount written off was charged to bad debt expense in prior years as part of the current year provision for those prior years. The current year provision of $455,799 was charged to bad debt expense for fiscal 2015.
Liquidity riskThe OSC’s exposure to liquidity risk is low as the OSC has sufficient Cash, Reserve fund assets, and access to a credit facility to settle all current liabilities. As at March 31, 2015, the OSC had a cash balance of $17.0 million and reserve fund assets of $20.0 million to settle current liabilities of $16.1 million.
The OSC has a $52.0 million credit facility to address any short-term cash deficiencies. Interest on the credit facility is charged at a rate of 0.5% below the prime rate. During the year, the OSC utilized the credit facility to a maximum of $19.5 million. As at March 31, 2015, there is no amount outstanding on the credit facility.
The overall exposure to liquidity risk remains unchanged from 2014.
Supplemental pension plan risksThe OSC’s overall exposure to supplemental pension plan risks is low due to the plan being a supplemental plan and the limited number of plan members entitled to plan benefits. For more information, see Note 12(b).
5. Trade and other receivables
Note March 31, 2015 March 31, 2014
Trade receivables $1,228,444 $1,040,114
Other receivables 1,637,527 1,979,836
Allowance for doubtful accounts 4 (308,078) (1,140,299)
$2,557,893 $1,879,651
Interest receivable 26,785 24,638
Due from IEF 19 – 330,018
HST recoverable 390,661 1,268,902
Total Trade and other receivables 4 $2,975,339 $3,503,209

OSC Annual Report 2015
Notes to the Financial Statements
48 49
6. Funds held pursuant to designated settlements and orders
The OSC has a number of settlement agreements and orders arising from enforcement proceedings where monies from these settlements and orders are to be set aside and allocated to such third parties as the OSC may determine. As a result of an amendment to the Securities Act (Ontario) effective June 2012, the Commission may also use these funds for the purpose of educating investors, or promoting or otherwise enhancing knowledge and information of persons regarding the operation of the securities and financial markets, including such designated internal costs as approved by the Board. The accumulated funds are held in a segregated bank account and earn interest at the monthly average bank prime rate less 1.85%. The OSC will allocate these funds as it determines appropriate in its discretion. This includes allocations to harmed investors, where appropriate and where an allocation can be reasonably effected.
As at March 31, 2015, the accumulated balance is determined as follows:
Note March 31, 2015 March 31, 2014
Opening balance $18,573,291 $19,756,165
Assessed during the year $52,970,941 $61,675,609
Less:
Amounts to be paid directly to investors – –
Adjustments to present value (114,977) (11,909)
Orders deemed uncollectible (43,315,108) (57,911,552)
Amount recorded from assessments in year 9,540,856 3,752,148
Amounts collected in advance of an order – 100,000
Adjustments to amounts assessed in prior years 1,042,072 31,720
Total Settlements and orders recorded 10,582,928 3,883,868
Add: interest 187,634 165,271
Less:
Paid to IEF 19 (2,070,000) (3,295,000)
Net IEF Liabilities 19 (48,675) –
Paid to FAIR Canada (2,500,000) (500,000)
Other payments (22,212) (1,437,013)
Closing balance $24,702,966 $18,573,291
Represented by:Cash $19,863,303 $13,854,489
Receivable 4,839,664 4,718,802
$24,702,966 $18,573,291
The $10,582,928 (2014 – $3,883,868) identified as total settlements and orders recorded reflects the portion of $52,970,941 (2014 – $61,675,609) in settlements and orders that was assessed during the year, for which payment was either received or has been deemed collectible. This total includes $1,042,072 (2014 – $31,720) in adjustments from orders recorded in prior years.
The adjustments to amounts assessed in prior years include portions of orders from prior years that are on payment plans that were recorded in fiscal 2015, plus the amount that had been previously deemed uncollectible where payment was received in fiscal 2015, less the amount that is now deemed as uncollectible, but had been deemed as collectible in prior periods. As at March 31, 2015, $4,839,664 (2014 – $4,718,802) was considered receivable because these amounts are expected to be collected.

OSC Annual Report
2015
Notes to the Financial Statements
48 49
The OSC collected a total of $7,498,841 (2014 – $1,768,769) of the designated settlements and orders assessed during the year resulting in an average collection rate of 14.16% (2014 – 2.87%).
As authorized by the Board, the OSC made the following payments from the designated funds: $2,070,000 to the IEF (2014 – $3,295,000), $2,500,000 (2014 – $500,000) to the Canadian Foundation for the Advancement of Investor Rights (FAIR Canada) to support their operations and $22,212 (2014 – $1,437,013) to be distributed to the eligible investors in an enforcement matter.
As described in Note 19, the IEF was dissolved effective March 31, 2015 and the financial assets and liabilities controlled by the IEF were transferred to the OSC on March 31, 2015. The net financial liabilities of the IEF retained by the OSC amounting to $48,675 were transferred into Funds held pursuant to designated settlement and orders as disclosed in Note 19.
7. Net assets held for CSA Systems operations and redevelopment (CSA Systems net assets)
The core Canadian Securities Administrators National Systems (CSA Systems) consist of the System for Electronic Document Analysis and Retrieval (SEDAR), the NRD and the System for Electronic Disclosure by Insiders (SEDI).
The OSC, British Columbia Securities Commission (BCSC), Alberta Securities Commission (ASC) and l’Autorité des marchés financiers (AMF) are principal administrators (PAs) of the CSA Systems.
The OSC has been appointed the Designated Principal Administrator – Operations (DPA) to collect, hold and administer the surplus funds accumulated from system fees charged to market participants that use the CSA systems. This role is essentially that of a custodian. The Net assets held for CSA Systems operations and redevelopment include surplus funds accumulated from operation of the CSA Systems, which are received, held and managed by the DPA on behalf of the PAs, and IIROC (in the case of NRD system fee surplus funds accumulated to October 13, 2013). The use of these surplus funds is restricted by various agreements between the PAs.
CGI Information Systems and Management Consultants Inc. (CGI), as service provider, hosts and maintains the CSA Systems. CGI forwards the gross system fees collected from users of the CSA Systems to the DPA as they are received and invoices the DPA for services provided by CGI in relation to the CSA Systems.
The DPA administers payments to CGI for services provided as they become due from the surplus funds. A CSA Systems Governance Committee (SGC), consisting of members of the four PAs, was established through an agreement signed on April 2, 2013. This agreement also created a governance framework for management and oversight of the CSA Systems, including that of CGI. It outlines how user fees will be collected and deployed, and addresses allocation and payment of liabilities that may arise.
Use of the surplus funds within the terms of the various agreements requires the approval of members of the SGC. Majority approval is required for all permissible uses of the surplus funds as outlined within the various agreements, with the exception of the following, which all require unanimous approval of the PAs:
a. any financial commitments in excess of the lesser of (i) $5.0 million and (ii) 15% of the accumulated surplus at such date;
b. significant changes to the design of the systems; and
c. any changes to system fees.
In the case of NRD, IIROC approval is required for any use of the surplus funds that deviates from the contractually agreed uses for funds accumulated prior to October 13, 2013.
The CSA plans to redevelop the CSA Systems in a multi-year phased approach. Funding for the redevelopment will come from the accumulated surplus funds.

OSC Annual Report 2015
Notes to the Financial Statements
50 51
The results of the Net assets held for CSA Systems operations and redevelopment are presented below.
Financial position
As at March 31, 2015
ASSETS
Current
Cash $35,390,508
Investments 90,000,000
Trade and other receivables 3,003,521
Prepayments 672,909
Total current $129,066,938
Intangible asset 1,400,176
Total assets $130,467,114
LIABILITIES
Current
Trade and other payables $1,613,001
Deferred revenues 60,940
Total current $1,673,941
Total liabilities $1,673,941
SURPLUS
Opening surplus $115,685,590
Excess of revenue over expenses 13,107,583
Closing surplus $128,793,173
Total liabilities and surplus $130,467,114
Results of operations
Year ended March 31, 2015
REVENUE
NRD system fees $13,935,844
SEDAR system fees 11,039,597
Data disribution services fees 489,875
Interest income 1,552,815
Total revenues $27,018,131
EXPENSES
Salaries and benefits $2,542,607
Professional services 10,718,950
Depreciation 269,980
Other 379,011
Total expenses $13,910,548
Excess of revenues over expenses $13,107,583

OSC Annual Report
2015
Notes to the Financial Statements
50 51
Cash flows
Year ended March 31, 2015
CASH FLOWS FROM OPERATING ACTIVITIES
Excess of revenue over expenses $13,107,583
Adjusted for:
Interest income received 1,116,584
Interest income (1,552,815)
Depreciation 269,980
$12,941,332
Changes in non-cash working capital:
Trade and other receivables $416,475
Prepayments 577,359
Trade and other payables 250,371
Deferred revenue 60,940
$1,305,145
Net cash flows from operating activities $14,246,477
CASH FLOWS USED IN INVESTING ACTIVITIES
Purchase of intangible asset $(961,822)
Purchase of investments (90,000,000)
Net cash flows used in investing activities $(90,961,822)
CASH FLOWS USED IN FINANCING ACTIVITIES –
Net increase/(decrease) in cash position $(76,715,345)
Cash position, beginning of period 112,105,853
Cash position, end of period $35,390,508
For more information on the Net assets held for CSA Systems operations and redevelopment, see Note 2(d) and Note 17.

OSC Annual Report 2015
Notes to the Financial Statements
52 53
8. Reserve fund assetsAs part of the approval of its self-funded status, the OSC was allowed to establish a $20.0 million reserve to be used as an operating contingency against revenue shortfalls and unanticipated expenditures, or to cover the discrepancy between timing of revenue and expenses.
The prime investment consideration for the reserve is the protection of the principal and appropriate liquidity to meet cash flow needs. Interest earned on investments is credited to the operations of the OSC. The March 31, 2015 accumulated reserve fund assets are held in a segregated bank account and earn interest at the monthly average bank prime rate less 1.85%.
9. Property, plant & equipment Computer hardware Computer and related hardware applications Office Office and related held under Networks Leashold furniture equipment applications finance leases and servers improvements Total
2015
GROSS CARRYING AMOUNT
Balance as at April 1, 2014 $4,696,639 $583,871 $18,795,601 $309,964 $2,513,937 $9,348,307 $36,248,319
Additions 88,766 84,529 1,139,644 – 303,347 – 1,616,286
Disposals $(65,050) – (3,399) (309,964) – (3,545) (381,958)
Balance at March 31, 2015 $4,720,355 $668,400 $19,931,846 $0 $2,817,284 $9,344,762 $37,482,648
DEPRECIATION
Balance as at April 1, 2014 $(4,135,852) $(464,407) $(16,594,672) $(309,964) – $(1,067,743) $(22,572,638)
Depreciation for the year (188,308) (15,450) (918,216) – (464,848) (1,115,254) (2,702,076)
Disposals 52,920 – (79,007) 309,964 – 92,922 376,799
Balance at March 31, 2015 $(4,271,240) $(479,857) $(17,591,895) $0 $(464,848) $(2,090,075) $(24,897,914)
Carrying amount at March 31, 2015 $449,115 $188,543 $2,339,951 $0 $2,352,436 $7,254,687 $12,584,733
2014
GROSS CARRYING AMOUNT
Balance as at April 1, 2013 $4,531,620 $581,252 $18,695,699 $309,964 – $5,594,364 $29,712,899
Additions 266,263 2,619 402,897 – 2,513,937 3,753,943 6,939,659
Disposals (101,244) – (302,995) – – – (404,239)
Balance at March 31, 2014 $4,696,639 $583,871 $18,795,601 $309,964 $2,513,937 $9,348,307 $36,248,319
DEPRECIATION
Balance as at April 1, 2013 $(3,984,278) $(449,591) $(15,552,446) $(309,964) – $(159,445) $(20,455,724)
Depreciation for the year (239,959) (14,816) (1,317,866) – – (908,298) (2,480,939)
Disposals 88,385 – 275,640 – – – 364,025
Balance at March 31, 2014 $(4,135,852) $(464,407) $(16,594,672) $(309,964) $0 $(1,067,743) $(22,572,638)
Carrying amount at March 31, 2014 $560,787 $119,464 $2,200,929 $0 $2,513,937 $8,280,564 $13,675,681

OSC Annual Report
2015
Notes to the Financial Statements
52 53
10. Trade and other payables
March 31, 2015 March 31, 2014
Trade payables $591,452 $3,699,262
Payroll accruals 13,395,062 12,148,952
Other accrued expenses 2,096,256 2,483,911
$16,082,770 $18,332,125
11. Lease commitments
Operating leasesThe OSC has entered into operating lease agreements for equipment and office space, and is committed to operating lease payments as follows:
March 31, 2015 March 31, 2014
Less than one year $8,216,281 $7,484,445
Between one and five years 11,806,868 18,007,672
More than five years – –
$20,023,149 $25,492,117
Lease expense recognized during 2015 was $7,346,719 (2014 – $7,695,633). This amount consists of minimum lease payments. A small portion of the OSC’s office space is subleased to the CSA IT Systems Project Office (CSA ITSO) and the IEF until March 31, 2015. Prior to March 31, 2015, the OSC entered into an additional lease agreement that was consolidated with the master premises lease for office space at 20 Queen Street West. The additional leased premises will be subleased to the CSA ITSO and another entity on a full cost-recovery basis beginning in fiscal 2016, with sublease payments of $657,104 expected to be received during fiscal 2016.
The lease on OSC premises began August 30, 2012 for a term of five years, expiring on August 31, 2017. The OSC has two consecutive options to extend the term beyond August 31, 2017, each for a period of five years. The OSC expects to exercise the first option. The OSC’s operating lease agreements do not contain any contingent rent clauses.
12. Pension plans
(a) Ontario Public Service Pension PlanAll eligible OSC employees must, and members may, participate in the OPSPP. The OSC’s contribution to the OPSPP for the year ended March 31, 2015 was $4,533,161 (2014 – $4,565,594), which is included under Salaries and benefits in the Statement of comprehensive income. The expected contributions for the plan for fiscal 2016 are $4,803,316.
Information on the level of participation of the OSC in the multi-employer OPSPP compared with other participating entities is not available.
(b) Supplemental pension plansThe OSC also has unfunded supplemental defined benefit pension plans for its current and former Chairs and Vice-Chairs. These supplemental pension plans have no plan assets.

OSC Annual Report 2015
Notes to the Financial Statements
54 55
The actuarial liability and the current service cost are determined by independent actuaries using the projected benefit method prorated on services and management’s best estimate assumptions. The supplemental defined benefit pension plans are non-registered plans. The benefit payments are made by the OSC as they become due.
The OSC is responsible for governance of these plans. The OSC Board’s Audit and Finance Committee and Human Resources and Compensation Committee assist in the management of the plans. The OSC has also appointed experienced, independent professional actuarial experts to provide a valuation of the pension obligation for the supplemental plans in accordance with the standards of practice established by the Canadian Institute of Actuaries.
Under the projected benefit method, the Pension liabilities are the actuarial present value of benefits accrued in respect of service prior to the valuation date, based on projected final average earnings. The current service cost is the increase in the present value of the defined benefit obligation resulting from employee service in the current period. The current service cost, expressed as a percentage of pensionable earnings, will be stable over time if the demographic characteristics of the active membership remain stable from valuation to valuation. However, all other things being equal, the current service cost of an active membership whose average age rises between actuarial valuations will result in an increasing current service cost.
The supplemental pension plans expose the OSC to the following risks:
• Changes in bond yields – a decrease in corporate bond yields will increase the plans’ liabilities.
• Inflation risk – in plans where the target benefit is not indexed, given the pension offset amounts are linked to inflation, higher inflation will lead to lower liabilities. Conversely, for plans where the target benefits are linked to inflation, the OSC’s liability increases when inflation increases.
• Life expectancy – the majority of the obligations are to provide benefits for the life of the members. Therefore, increases in life expectancy will result in an increase in the plans’ liabilities.
There were no plan amendments, curtailments or settlements during the period. The duration of all plans combined is approximately 12.0 years (2014 – 11.4 years).
March 31, 2015 March 31, 2014
Defined benefit obligation, beginning of year $3,118,630 $2,731,527
Current service cost 137,153 147,095
Interest cost 124,868 99,622
Benefit payments (146,038) (149,871)
Plan amendment – –
Actuarial loss on obligation 326,189 290,257
Defined benefit obligation, end of year $3,560,802 $3,118,630
Actuarial assumptions
The significant actuarial assumptions used to determine the present value of the defined benefit obligation were as follows:
March 31, 2015 March 31, 2014
Discount rate(s) 3.40% 4.10%
Inflation 2.25% 2.50%
Expected rate(s) of salary increase 0% 0%
CPP YMPE increase 2.75% 3.00%
Increase in CRA limit $2,818.9 $2,770.0

OSC Annual Report
2015
Notes to the Financial Statements
54 55
The assumptions for mortality rates are based on the 2014 Public Sector Mortality Table (CPM2014Publ), with a size adjustment factor for monthly income of $6,000 and more, and with fully generational projections using the improvement scale CPM-B.
Sensitivity analysis
Changes in the actuarial assumptions used have a significant impact on the defined benefit obligation.
The following is an estimate of the sensitivity of the defined benefit obligation to a change in the significant actuarial assumptions (the sensitivity assumes all other assumptions are held constant):
March 31, 2015 March 31, 2014
Discount rate increased by 0.5% (obligation will decrease by) 5.5% 5.4%
Discount rate decreased by 0.5% (obligation will increase by) 6.1% 5.9%
Life expectancy increased by 1 year (obligation will increase by) 2.7% 2.3%
Life expectancy decreased by 1 year (obligation will decrease by) 2.8% 2.4%
Inflation rate increased by 0.5% (obligation will decrease by) 2.4% 2.6%
Inflation rate decreased by 0.5% (obligation will increase by) 2.9% 3.0%
The OSC’s pension expense relating to the supplemental pension plans for the year ended March 31, 2015 was $262,021 (2014 – $246,717). The OSC expects to incur $215,000 in benefit payments relating to the supplemental pension plan during the next fiscal year.
13. Capital managementThe OSC has established a $20.0 million reserve fund, as described in Note 8, which it considers as capital. The primary objective of maintaining this capital is to fund OSC’s operations in the event of revenue shortfalls and unanticipated expenditures, or to cover the discrepancy between timing of revenue and expenses. The OSC’s overall strategy remains unchanged from 2014.
The OSC maintains an investment policy where Reserve fund assets are restricted to direct and guaranteed obligations of the Government of Canada and its provinces, and to instruments issued by Canadian Schedule 1 banks to protect the principal.
The OSC has a $52.0 million credit facility with a Schedule 1 financial institution to address any short-term cash deficiencies. The current credit facility will require renewed approval from the Ministry of Finance prior to June 30, 2016 for a subsequent two-year term.
The OSC is not subject to any externally imposed capital requirements.
14. FeesThe OSC’s fee structure is designed to generate fees that recover the OSC’s cost of providing services to market participants. The fee structure is based on the concept of “participation fees” and “activity fees”. Participation fees are based on the cost of a broad range of regulatory services that cannot be practically or easily attributed to individual activities or entities, and are intended to serve as a proxy for the market participants’ use of the Ontario capital markets.
Activity fees represent the direct cost of OSC staff resources expended in undertaking certain activities requested of staff by market participants.
Late fees represent fees applied to market participants for not filing required documents and/or paying their participation and activity fees on time.

OSC Annual Report 2015
Notes to the Financial Statements
56 57
Any general operating surpluses generated are normally returned to market participants through lower fees than otherwise required to recover costs or direct refunds.
The Commission revised its participation fees and activity fees through fee rule amendments that became effective April 1, 2013. Some fees were subsequently adjusted at the beginning of fiscal 2015. The current fee rule amendments came into effect on April 6, 2015.
Fees received are as follows:
March 31, 2015 March 31, 2014
Participation fees $88,423,432 $83,267,321
Activity fees 13,110,801 13,208,161
Late filing fees 2,121,636 1,965,794
$103,655,869 $98,441,276
15. Salaries and benefits
March 31, 2015 March 31, 2014
Salaries $63,853,257 $62,042,890
Benefits 7,083,761 6,736,097
Pension expense 4,795,182 4,786,283
Severance/termination payments 498,378 905,917
$76,230,578 $74,471,187
16. Administrative
March 31, 2015 March 31, 2014
Commission expense $1,915,710 $1,872,675
Communications & publications 1,477,687 1,725,924
Maintenance & support 2,267,653 2,043,621
Supplies 743,307 802,870
Other expenses 1,078,123 674,019
Training 534,492 641,685
$8,016,972 $7,760,794
17. Contingent liabilities and contractual commitments
(a) The OSC has committed to paying in full any liability with respect to CSA Systems operations and custody of the related surplus funds that arises as a result of wilful neglect or wilful misconduct on behalf of the OSC.
Under the agreements described in Note 7, the OSC, ASC, BCSC and AMF, as PAs, have committed to paying an equal share of any claim or expenses related to operation and redevelopment of the CSA Systems that exceed the surplus funds held.

OSC Annual Report
2015
Notes to the Financial Statements
56 57
In 2015, there were no such claims or expenses. As described in Note 7, the OSC, in its capacity as DPA, is holding funds in segregated bank and investment accounts that may be used to settle claims and expenses relating to the operation and redevelopment of the CSA Systems.
(b) The OSC is involved in various legal actions arising from the ordinary course and conduct of business. The outcome and ultimate disposition of these actions cannot be measured with sufficient reliability at this time. However, management does not expect the outcome of any such proceedings, individually or in aggregate, to have a material impact on the OSC’s financial position. Any settlements concerning these contingencies will be accounted for in the period in which the settlement occurs.
18. Related party transactions
(a) Net assets held for CSA Systems operations and redevelopment
In the course of normal operations, the OSC entered into transactions with the Net assets held for CSA Systems operations and redevelopment. For more information, see Note 7.
(b) IEFIn the course of normal operations and as part of the March 31, 2015 dissolution, the OSC entered into transactions with the IEF. For more information, see Note 19.
(c) The Province of OntarioIn the course of normal operations, the OSC entered into the following transactions with the Province of Ontario:
(i) The Securities Act (Ontario) states that when ordered to do so by the responsible Minister, the OSC shall remit to the Province of Ontario such surplus funds as determined by the Minister. In light of the fee model as described in Note 14 and the OSC’s practice of setting fees periodically, the OSC is not required to make remittances of its surplus to the Consolidated Revenue Fund. Surpluses retained by the OSC are subject to appropriate terms and conditions to be agreed with the Ministry.
(ii) Costs of non-pension benefits for eligible pensioners are paid by the Government of Ontario and are not included in the Statement of comprehensive income.
(d) Compensation to key management personnelThe OSC’s key management personnel are the members of the Board of Directors, Chair, Vice-Chairs and Executive Director.
The remuneration of key management personnel includes the following expenses:
March 31, 2015 March 31, 2014
Short-term employee benefits $3,749,157 $3,683,102
Post-employment benefits 508,650 302,740
Termination benefits – –
Total compensation $4,257,807 $3,985,842

OSC Annual Report 2015
Notes to the Financial Statements
58 59
19. Investor Education FundThe IEF was incorporated by letters patent of Ontario dated August 3, 2000 as a non-profit corporation without share capital. The IEF was managed by a separate Board of Directors and its purpose was to increase knowledge and awareness among investors and potential investors, and to support the research and development of programs and partnerships that promoted investor and financial education in schools and among adult learners.
The OSC was the sole voting member of the IEF. However, the OSC had determined, based on an evaluation of the terms and conditions of the arrangement, that investors in the capital market, rather than the OSC, obtained the benefit or rewards from the activities of the IEF. As such, the OSC did not control the IEF, and the IEF had not been consolidated in the OSC’s financial statements as discussed in Note 2(d). The IEF was exempt from income taxes.
During the year, the OSC entered into transactions with the IEF as follows:
(i) The OSC paid $2,070,000 to the IEF during the year (2014 – $3,295,000), plus accrued $48,675 to address the amount of shortfall from the IEF’s dissolution as noted below. These payments were issued from the Funds held pursuant to designated settlements and orders as described in Note 6.
(ii) The OSC had a Management Services agreement with the IEF for the provision of administrative and management services, at cost. For the period ended March 31, 2015, the OSC incurred costs totalling $1,044,822 (2014 – $1,088,307) for services related to the IEF. The total cost of these services has been charged to the IEF and, of this amount, nil ($0) was owing to the OSC at March 31, 2015 (2014 – $330,018).
(iii) On March 31, 2015 financial assets and liabilities were transferred to the OSC as part of the IEF dissolution at their fair values. These financial assets and liabilities are listed below, with the net liability of $48,675 being settled through the Funds held pursuant to designated settlements and orders.
Certain program and website content previously held by IEF were also transferred to the OSC. A portion of the content will be spun off to an unrelated third party at no charge ($0). The remaining content will continue to be supported by the OSC and made publicly available through the OSC website. Since this remaining program and website content is not being made available for the purpose of deriving a future economic benefit for the OSC it has been transferred at an exchange value of nil ($0).
Transferred to the Funds held pursuant to designated settlements and orders:
Asset/liability Type Exchange value
Cash Financial asset $60,548
Accounts receivable Financial asset 114,379
Accrued liabilities Financial liability (223,602)
Total $(48,675)

OSC Annual Report
2015
Notes to the Financial Statements
58 59
20. Accounting pronouncements
Effective in the yearA new IFRS interpretation, issued by the International Accounting Standards Board (IASB), effective for the first time for periods beginning on (or after) April 1, 2014, has been adopted in these financial statements.
IFRIC 21, Levies
In May 2013, the IFRS Interpretation Committee issued IFRIC 21, Levies. IFRIC 21 provides guidance on when to recognize a liability to pay a levy imposed by government that is accounted for in accordance with IAS 37, Provisions, Contingent Liabilities and Contingent Assets. IFRIC 21 is effective for annual periods beginning on or after January 1, 2014, and is to be applied retrospectively. The adoption of IFRIC 21 did not have an impact on the financial statements of the OSC.
New and revised in issue, but not yet effectiveThe following new IFRS standards, interpretations and amendments, which have been issued but are not yet effective for the year ended March 31, 2015, have not been applied in preparing these financial statements. These pronouncements are currently under consideration or have been determined not to have a material impact on the financial statements of the OSC.
IFRS 9, Financial Instruments
In July 2014, the IASB issued a finalized version of IFRS 9, Financial Instruments. The completed version of IFRS 9 provides revised guidance on the classification and measurement of financial assets, and incorporates the final hedge accounting requirements. It also carries forward the guidance on recognition and derecognition of financial instruments from IAS 39. This standard is effective for annual periods beginning on or after January 1, 2018 with early adoption permitted. IFRS 9 is not expected to have a material impact on the OSC financial statements.
IFRS 15, Revenue from Contracts with Customers
In May 2014, the IASB issued IFRS 15, Revenue from Contracts with Customers. This standard replaces all existing IFRS revenue requirements and applies to all revenue arising from contracts with customers. The standard outlines the principles an entity must apply to measure and recognize revenue. This standard is effective for annual periods beginning on or after January 1, 2017. OSC is currently assessing the impact on the OSC financial statements.
IAS 1, Presentation of financial statements
In December 2014, the IASB, as part of its Disclosure Initiative, published amendments to IAS 1, Presentation of financial statements, which are aimed at improving the effectiveness of disclosure. Specifically, the amendment clarifies that information should not be obscured by providing immaterial information. The amendments introduce new requirements when an entity presents subtotals in primary statements. The amendments also clarify that entities have flexibility on the order in which notes are presented and emphasize that understandability and comparability should be considered when determining the order. The amendments will be effective for annual periods beginning on or after January 1, 2016. Earlier application is permitted. OSC is currently assessing the impact on the OSC financial statements.
IAS 19, Employee benefits
In September 2014, the IASB issued Annual Improvements to IFRSs 2012-2014 Cycle. These included several non-urgent amendments that were necessary. The amendments clarify the regional market issue for estimating the discount rate. Specifically, high quality corporate bonds used in estimating the discount rate for post-employment benefits should be denominated in the same currency as the benefits to be paid. IAS 19 (2014) is effective for annual periods beginning on or after January 1, 2016. OSC is currently assessing the impact on the OSC financial statements.

APPENDIX
OSC Investor Town Hall in 2005
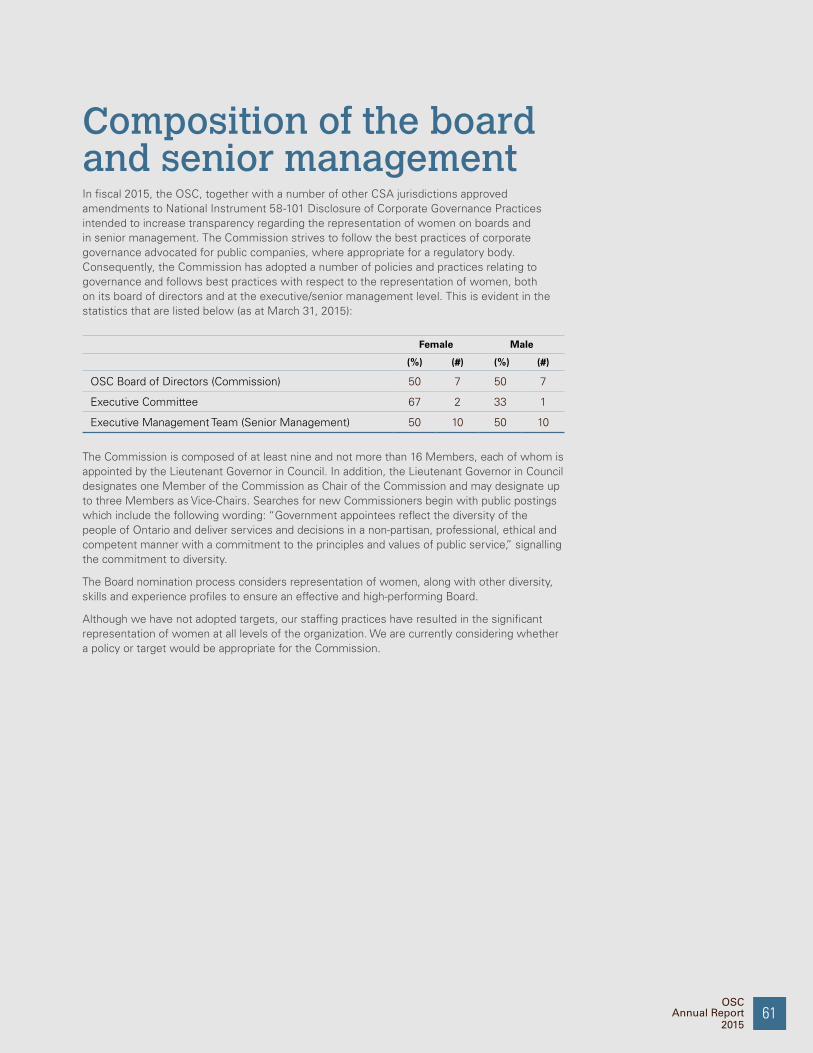
The Commission is composed of at least nine and not more than 16 Members, each of whom is appointed by the Lieutenant Governor in Council. In addition, the Lieutenant Governor in Council designates one Member of the Commission as Chair of the Commission and may designate up to three Members as Vice-Chairs. Searches for new Commissioners begin with public postings which include the following wording: “Government appointees reflect the diversity of the people of Ontario and deliver services and decisions in a non-partisan, professional, ethical and competent manner with a commitment to the principles and values of public service,” signalling the commitment to diversity.
The Board nomination process considers representation of women, along with other diversity, skills and experience profiles to ensure an effective and high-performing Board.
Although we have not adopted targets, our staffing practices have resulted in the significant representation of women at all levels of the organization. We are currently considering whether a policy or target would be appropriate for the Commission.
Female Male
(%) (#) (%) (#)
OSC Board of Directors (Commission) 50 7 50 7
Executive Committee 67 2 33 1
Executive Management Team (Senior Management) 50 10 50 10
Composition of the board and senior managementIn fiscal 2015, the OSC, together with a number of other CSA jurisdictions approved amendments to National Instrument 58-101 Disclosure of Corporate Governance Practices intended to increase transparency regarding the representation of women on boards and in senior management. The Commission strives to follow the best practices of corporate governance advocated for public companies, where appropriate for a regulatory body. Consequently, the Commission has adopted a number of policies and practices relating to governance and follows best practices with respect to the representation of women, both on its board of directors and at the executive/senior management level. This is evident in the statistics that are listed below (as at March 31, 2015):
OSC Annual Report
201561

Assistance for market participants in 2014-15
Total contacts from market participants to the OSC Inquiries & Contact Centre11,927
Assistance for investors in 2014-15
Total contacts from investors to the OSC Inquiries & Contact Centre4,662
Most common areas of contact with investors
Trading without registration and/or prospectus and/or exemption 17%
Information about public companies and investment offerings 11%
Registrant services-related issues 11%
Information about hearings, proceedings and orders 10%
Checking advisor registration, prospectus or exemption 8%
Abusive trading or market manipulation 7%
Registrant misconduct, registrant-related (OSC) rules 7%
Inadequate or misleading disclosure 7%
Educational materials, resources for retail investors 3%
Shareholder rights, director/officer responsibilities, corporate law 3%
Scams / frauds / misrepresentations 2%
Illegal insider trading 1%
How and where to complain 1%
All other 12%
Most common areas of contact with market participants
Registration requirements and related information 60%
System for Electronic Disclosure by Insiders (SEDI) filing, reports, info 12%
Information about issuers’ obligations 12%
Fees 6%
Exemptions, exempt distributions 5%
Hearings, proceedings, enforcement orders 2%
Other 3%
OSC Annual Report 2015
62
Appendix

Requests from domestic and international regulators and agencies
Fiscal year 2012-13 2013-14 2014-15
Database searches for external agencies 13,775 12,428 12,437
Assistance requests received
U.S. 31 44 38
International 18 16 21
Domestic 11 18 20
Total 60 78 79
Assistance requests sent
U.S. 11 18 19
International 30 17 13
Domestic 9 8 8
Total 50 43 40
OSC Enforcement Branch: intake
Fiscal year 2012-13 2013-14 2014-15
Number of cases assessed 238 289 288
Number transferred for investigation 18 41 37
OSC Enforcement Branch: investigations
Fiscal year 2012-13 2013-14 2014-15
Number of completed investigations 36 42 54
Number transferred for litigation 25 24 28
Temporary orders
Fiscal year 2012-13 2013-14 2014-15
Number of temporary orders 9 3 4
Number of respondents 25 8 13
Number of freeze directions obtained 2 8 26
Amount frozen $1,013,000 $1,377,829 $9,046,425
OSC Annual Report
201563
Appendix

OSC Enforcement Branch: litigation
Fiscal year 2012-13 2013-14 2014-15
PROCEEDINGS COMMENCED:
Proceedings before the Commission 21 17 18
Number of respondents 102 35 55
Quasi-criminal proceedings 5 4 8
Number of accused 11 6 10
Criminal Code proceedings n/a 3 2
Number of accused n/a 3 3
Search warrants executed n/a 22 69
ENFORCEMENT TIMELINES:
Average number of months from intake to commencement of a proceeding 20.3 15.9 16.7
Concluded settlement and contested hearings before the Commission
Fiscal year 2012-13 2013-14 2014-15
Number of proceedings 42 40 31
Number of respondents 147 111 80
SANCTIONS INCLUDE:
Cease trade orders 139 103 58
Exemptions removed 93 99 54
Director and Officer bans 60 53 39
Registration restrictions 63 69 40
Administrative penalties, disgorgement orders, settlement amounts $80,174,712 $61,675,609 $52,970,941
Total costs ordered $3,725,219 $2,611,402 $5,148,291
Concluded matters before the courts
Fiscal year 2012-13 2013-14 2014-15
Total number of proceedings 2 3 5
Total number of accused 2 3 6
SANCTIONS INCLUDE:
Jail sentences 24 months 39 months 41 months
Fines – – $10,000
Restitution – $155,000 $4,841,806
OSC Annual Report 2015
64
Appendix

Reciprocal orders
Fiscal year 2012-13 2013-14 2014-15
Number of proceedings commenced 9 9 12
Respondents 19 14 27
Number of orders obtained 8 11 13
Respondents 14 21 22
SANCTIONS INCLUDE:
Cease trade orders 10 21 17
Exemptions removed 10 12 10
Director and Officer bans 9 14 14
Registration restrictions 2 12 7
Adjudicative activities of the Commission
Number of sitting days per fiscal year*
Type of adjudicative proceeding 2012-13 2013-14 2014-15
Contested hearings on the merits (Includes sanctions hearings and hearings in writing) 138 137.5 157
Settlement hearings (Includes settlement conferences) 28.5 41 46
Hearings on temporary cease trade orders 28 44 28
Motions and other interlocutory matters 35 43 43
Applications Includes applications for review, applications relating to take-over bids and applications under section 17 (disclosure), section 144 23 15.5 37 (revocations or variations of decisions), and section 127(10) (inter-jurisdictional enforcement) of the Securities Act.
All other matters (Includes pre-hearing conferences, appearances, etc.) 47.5 58 42
Total 300 339 353
* More than one sitting day can occur in one calendar day as a result of multiple proceedings.
OSC Annual Report
201565
Appendix

Terms of Members of the Commission (As at April 1, 2015)
Appointed Current term expires
James D. Carnwath August/09 August/15
Mary G. Condon June/14 June/16
William J. Furlong January/15 January/17
Sarah B. Kavanagh June/11 May/16
Edward P. Kerwin January/11 January/16
Monica Kowal July/14 July/16
Deborah Leckman February/13 February/17
Janet Leiper January/15 January/17
Alan J. Lenczner February/13 February/17
Timothy Moseley January/15 January/17
Christopher Portner December/10 December/15
Judith N. Robertson June/11 May/16
AnneMarie Ryan February/13 February/17
Howard I. Wetston November/10 November/15
More information about the Members of the Commission is available on www.osc.gov.on.ca
OSC Annual Report 2015
66
Appendix

Board and Commission Committees (As at April 1, 2015)
Audit and Finance CommitteeSarah Kavanagh, Chair
William Furlong
Deborah Leckman
Alan Lenczner
AnneMarie Ryan
Governance and Nominating CommitteeAnneMarie Ryan, Chair
James Carnwath
Mary Condon
Sarah Kavanagh
Janet Leiper
Howard Wetston ex officio member
Human Resources and Compensation CommitteeJudith Robertson, Chair
Edward Kerwin
Deborah Leckman
Timothy Moseley
Adjudicative Committee*
Alan Lenczner, Chair
James Carnwath
Mary Condon
Edward Kerwin
Monica Kowal
Christopher Portner
Judith Robertson
John Stevenson, ex officio member
Josée Turcotte, ex officio member
*The Adjudicative Committee is a standing policy committee of the Commission.
The mandates of the Committees and of the Lead Director are available at www.osc.gov.on.ca.
OSC Annual Report
201567
Appendix

OSC Advisory Committees
Investor Advisory Panel(As at June 1, 2015)
Ursula Menke, Chair Connie Craddock Letty Dewar
Harold Geller Ken Kivenko Allison Knight
Louise Tardif
Continuous Disclosure Advisory Committee(As at March 31, 2015)
Abbas Ali Khan Bennett Jones LLP
Ivan Chittenden Ernst & Young LLP
Eleanor Fritz TSX Group
Marc Gold Thomson Reuters
Andrew Grossman Ogilvy Renault LLP
Paul Guthrie Royal Bank of Canada
Gale Kelly KPMG LLP
Dimitri Lascaris Siskinds LLP
Yvette Lokker Canadian Investor Relations Institute
Philip Maguire Glenidan Consultancy Ltd.
Bruce Mann Rogers Communications Inc.
Catherine McCall Canadian Coalition for Good Governance
Anthony Scilipoti Veritas Investment Research
Bassem Shakeel Magna International Inc.
Debra Sisti RiskMetrics Group
Bob Tait IAMGOLD Corporation
OSC Annual Report 2015
68
Appendix

Exempt Market Advisory Committee(As at March 31, 2015)
Robert Antoniades RBC Capital Markets
Julia Dublin Barrister and Solicitor
Kerri Golden JOLT Fund, L.P.
Neil Gross Canadian Foundation for Advancement of Investor Rights (FAIR Canada)
Darrin Hopkins Richardson GMP
Andrea Johnson Fraser Milner Casgrain LLP
David Kaufman Westcourt Capital Corporation
Jeff Kennedy Cormark Securities Inc.
Brian Koscak Exempt Market Dealers Association of Canada
Vaughn MacLellan Wildeboer Dellelce LLP
Janka Palkova Convention of Independent Financial Advisors
David Palmer Probe Mines Limited
Craig Skauge Western Exempt Market Association
Michael Smith Baker & McKenzie
Glorianne Stromberg Consultant
Bryce Tingle University of Calgary
Martine Valcin TMX Group
Financial Reporting Advisory Committee(As at March 31, 2015)
Carolyn Anthony PricewaterhouseCoopers LLP
Reinhard Dotzlaw KPMG LLP
Lara Gaede Alberta Securities Commission
Bhupender Gosain MNP LLP
Carla-Marie Hait B.C. Securities Commission
Karen Higgins Deloitte LLP
Guy Jones Ernst & Young LLP
Hélène Marcil Autorité des marchés financiers
Rinna Sak Grant Thornton LLP
Janet Stockton BDO LLP
Eric Turner Auditing and Assurance Standards Board
Rebecca Villmann Accounting Standards Board
OSC Annual Report
201569
Appendix
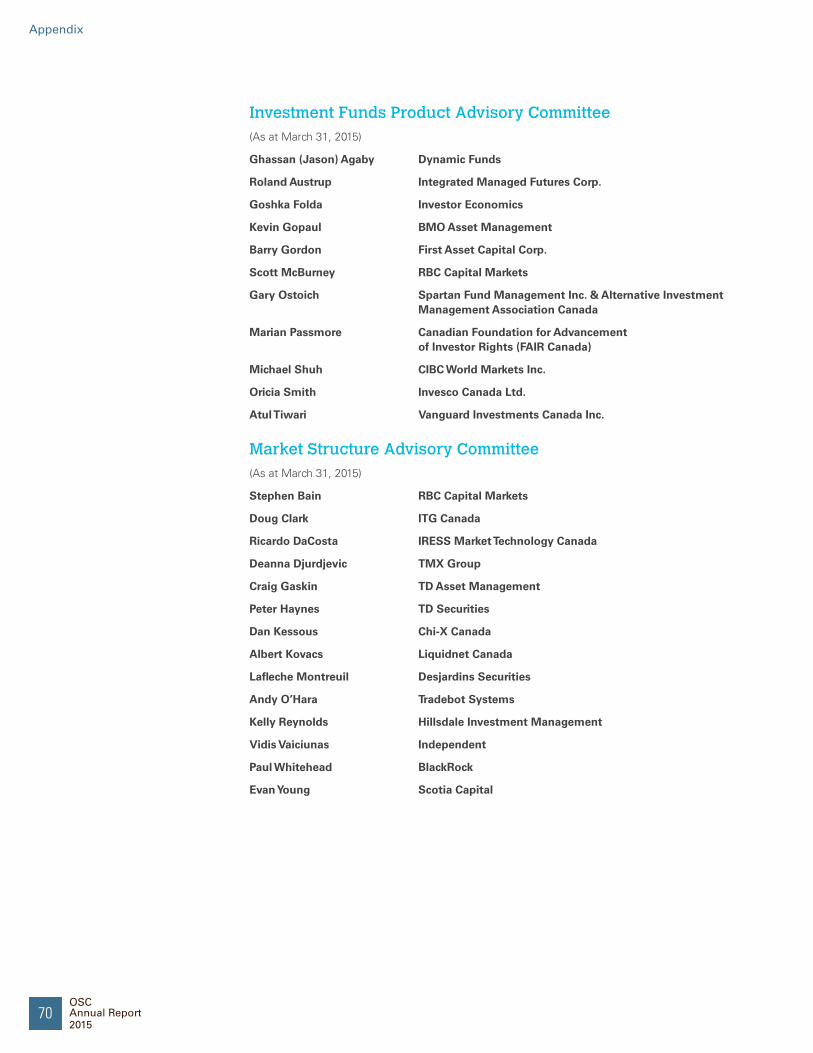
Investment Funds Product Advisory Committee(As at March 31, 2015)
Ghassan (Jason) Agaby Dynamic Funds
Roland Austrup Integrated Managed Futures Corp.
Goshka Folda Investor Economics
Kevin Gopaul BMO Asset Management
Barry Gordon First Asset Capital Corp.
Scott McBurney RBC Capital Markets
Gary Ostoich Spartan Fund Management Inc. & Alternative Investment Management Association Canada
Marian Passmore Canadian Foundation for Advancement of Investor Rights (FAIR Canada)
Michael Shuh CIBC World Markets Inc.
Oricia Smith Invesco Canada Ltd.
Atul Tiwari Vanguard Investments Canada Inc.
Market Structure Advisory Committee(As at March 31, 2015)
Stephen Bain RBC Capital Markets
Doug Clark ITG Canada
Ricardo DaCosta IRESS Market Technology Canada
Deanna Djurdjevic TMX Group
Craig Gaskin TD Asset Management
Peter Haynes TD Securities
Dan Kessous Chi-X Canada
Albert Kovacs Liquidnet Canada
Lafleche Montreuil Desjardins Securities
Andy O’Hara Tradebot Systems
Kelly Reynolds Hillsdale Investment Management
Vidis Vaiciunas Independent
Paul Whitehead BlackRock
Evan Young Scotia Capital
OSC Annual Report 2015
70
Appendix

Mining Technical Advisory and Monitoring Committee(As at March 31, 2015)
Brian Abraham Dentons Canada LLP
Luc Arsenault Autorité des marchés financiers
Paul Bankes Reserve Evaluations Advisor
Lynda Bloom Analytical Solutions Ltd.
George Cavey Gold Jubilee Capital
Michel Champagne Sidex s.e.c.
Chris Collins B.C. Securities Commission
Peter Dietrich Independent Technical Advisor
Catherine Gignac Independent Consultant
Greg Gosson Amec Foster Wheeler
Stefan Lopatka (Observer) TSX Venture Exchange
Deborah McCombe Roscoe Postle Associates Inc.
Joseph Ringwald Selwyn Resources Ltd.
Paul Teniere (Observer) Toronto Stock Exchange
Registrant Advisory Committee(As at March 31, 2015)
Eric Adelson Invesco Canada Ltd.
Matthew Brady Mutual Fund Dealers Association of Canada
Sandra Blake Investment Industry Regulatory Organization of Canada
Catherine Chamberlain Vanguard Investments Canada Inc.
Richard Goldstein First Republic Capital Corporation
Matthew Irwin Ewing Morris & Co. Investment Partners Ltd.
Robert Maxwell Arrow Capital Management Inc.
Brent Moore Mackenzie Financial Corporation
Cora Pettipas National Exempt Market Association
Leonard Racioppo Coerente Capital Management Inc.
Prema Thiele Borden Ladner Gervais LLP
Cathy Tuckwell Portfolio Management Association of Canada and 1832 Asset Management L.P.
OSC Annual Report
201571
Appendix

Securities Advisory Committee(As at March 31, 2015)
Douglas Bryce Osler, Hoskin & Harcourt LLP
Judy Cotte RBC Global Asset Management
Blair Cowper-Smith OMERS Administration Corporation
Carol Derk Borden Ladner Gervais LLP
Sheldon Freeman Goodmans LLP
Mindy Gilbert Davies Ward Phillips & Vineberg LLP
Ian Michael McCarthy Tétrault LLP
Shahen Mirakian McMillan LLP
Kathleen Ritchie Gowling Lafleur Henderson LLP
Julie Shin Toronto Stock Exchange
Sean Vanderpol Stikeman Elliott LLP
Diana Wisner Bank of Montreal
Securities Proceedings Advisory Committee(As at February 23, 2015)
Wendy Berman Cassels Brock & Blackwell LLP
Nigel Campbell Blake, Cassels & Graydon LLP
Alexander Cobb Osler, Hoskin & Harcourt LLP
Emily Cole Miller Thomson LLP
James Doris Davies Ward Phillips & Vineburg LLP
James Douglas Borden Ladner Gervais LLP
Linda Fuerst Lenczner Slaght Royce Smith Griffin LLP
James Grout Thornton Grout Finnigan LLP
Paul LeVay Stockwoods LLP
Melissa MacKewn Crawley MacKewn Brush LLP
Janice Wright Wright Temelini LLP
OSC Annual Report 2015
72
Appendix

Small and Medium Enterprises Committee(As at March 31, 2015)
Tim Babcock TSX Venture Exchange
Steven Callan Grant Thornton LLP
Robert Cook Canadian Securities Exchange
Mark George Hampton Securities
Donald Henderson Former CEO of Interactive Ontario
Barbara Hendrickson BAX Securities Law
James Hershaw Greenock Resources Inc.
Oscar Jofre KoreConx
Shafin Kanji KV Capital
Charlie Malone Wildeboer Dellelce LLP
Blair Milroy Capital Canada Limited
Rick Nathan Kensington Capital Partners Limited
Jason Saltzman Dentons Canada LLP
Pierre Soulard Norton Rose Fulbright
The Derivatives branch consults regularly with an industry group called the Canadian Markets Infrastructure Committee on derivatives regulatory matters.
OSC Annual Report
201573
Appendix

As the regulatory body responsible for overseeing the capital markets in Ontario, the Ontario Securities Commission administers and enforces the
provincial Securities Act and the provincial Commodity Futures Act, and administers certain provisions of the provincial Business Corporations Act.
The OSC is a self-funded Crown corporation accountable to the Ontario Legislature through the Minister of Finance.