origins of the monitoring, evaluation and learning, communities of practice (cop) & task force...
TRANSCRIPT

2014 => CRPs: outcome-based approach & RBM; 5 pilot trials; W1 $ (4M)
2014 -16 => Recruiting effort MEL specialists W1-2 $ (CIMMYT/MAIZE & WHEAT, IRRI/GRiSP, CIP/RTB, ICARDA/DS, IWMI/WLE, ICRAF/FTA, etc…)
Dec 2014 => 1st meeting MEL > 5 commodity CRPs
July 2015 => 2nd meeting MEL > 12 CRPs; CoP proposed and created Q3 2016
Nov 2015 => 1st MEL CoP meeting > 16 CRPs , 15 Centers, CO, IEA, IAU, ISPC/SPIA; feed-back on Guidance document for full proposals; CRP performance assessment; etc…
April 2016 => Task Force on Indicators (TFI) commissioned by CO/SMO
June & Sept 2016 => TFI f2f meetings; harmonized approach for selection of system level indicators & their monitoring
Oct 2016 => 2nd MEL CoP meeting; integrated framework for MEL at system level and draft templates for POWB and AR
W1-2 $
Origins of the MEL CoP and TFI

Task Force on IndicatorsTowards Operationalizing the SRF with a Suite of Indicators within a Monitoring, Evaluation and Learning Framework
Update 28 September 2016 / work on progress
Philippe Ellul (SMO), Michelle Guertin (MAIZE/WHEAT/CIMMYT), Tonya Schuetz (SMO consultant), Shaylyn Gaffney (MAIZE/WHEAT/CIMMYT), David Rider-Smith (WLE/IWMI), Hope Webber (RICE/IRRI), Claudio Proietti
(RTB/CIP), Nancy Johnson (A4NH/IFPRI), Karl Hughes (GLDC, FTA/ICRAF)
Tom Randolph (Livestock & Fish), Graham Thiele (CIP/RTB), Bas Bouman (IRRI/RICE), Robert Nasi (ICRAF/FTA)
Ahmed Kablan (USAID), Leslie Perlman (USAID), Michel Bernhardt (GIZ), Corinne Abbas (Dutch Government)
Sirkka Immonen (IEA), James Stevenson (ISPC/SPIA),

Phased approach
April-June 2016
Putting the task force together and develop an approach for selection of system level indicators
Key insights

Proposed Approach for Selecting Indicators
Develop pathways for each SLO targets to
• Make general case for contribution to change substantiated at CRP level with evidence from research and evaluative approaches
• Identify a set of suitable indicators that could be tracked and used as evidence of progress towards SRF targets at portfolio/ system level, most relevant ones to demonstrate CGIAR’s contribution to the target
• Using most cost-effective data collection method

Based on aspirational SLO targets from the CGIAR SRF

SLO3 target 3 (Land restored) : 55 million ha of degraded land restored.Pathway 1: Improve management of degraded land through public and private policies and investments, governance mechanisms and adoption of solutions
Need to add SDSN Indicator
Numbers
http://indicators.report/indicators/Indicators and a Monitoring FrameworkLaunching a data revolution for the Sustainable Development Goals# SDSN indicator numbers
5
84
5
83, 85

Task Force Tested the Approach
• Example draft pathway
• To be developed for the 3 SLOs and 10 SRF targets
• Mapped CRPs and flagships from proposals
• Examples of indicators by draft pathway
• Identified some initial SDSN indicators
Cross Cutting IDOs
1,2,3
5
13
13
14
15, 16
8, 12
56
73
49, 83, 84, 85
# SDSN indicator number
SLO Targets
IDO
Sub-IDO
Sub-IDO
IDO
Sub-IDO
Sub-IDO
IDO
DCL, FTALivestockRice, PIM, A4NH, CCAFS
List of CRPs that budgeted money
DCL FP1, FTA FP4, Livestock FP3, Rice FP2,
Rice FP2, FTA FP4
Livestock FP3
DCL FP1
DCL FP1
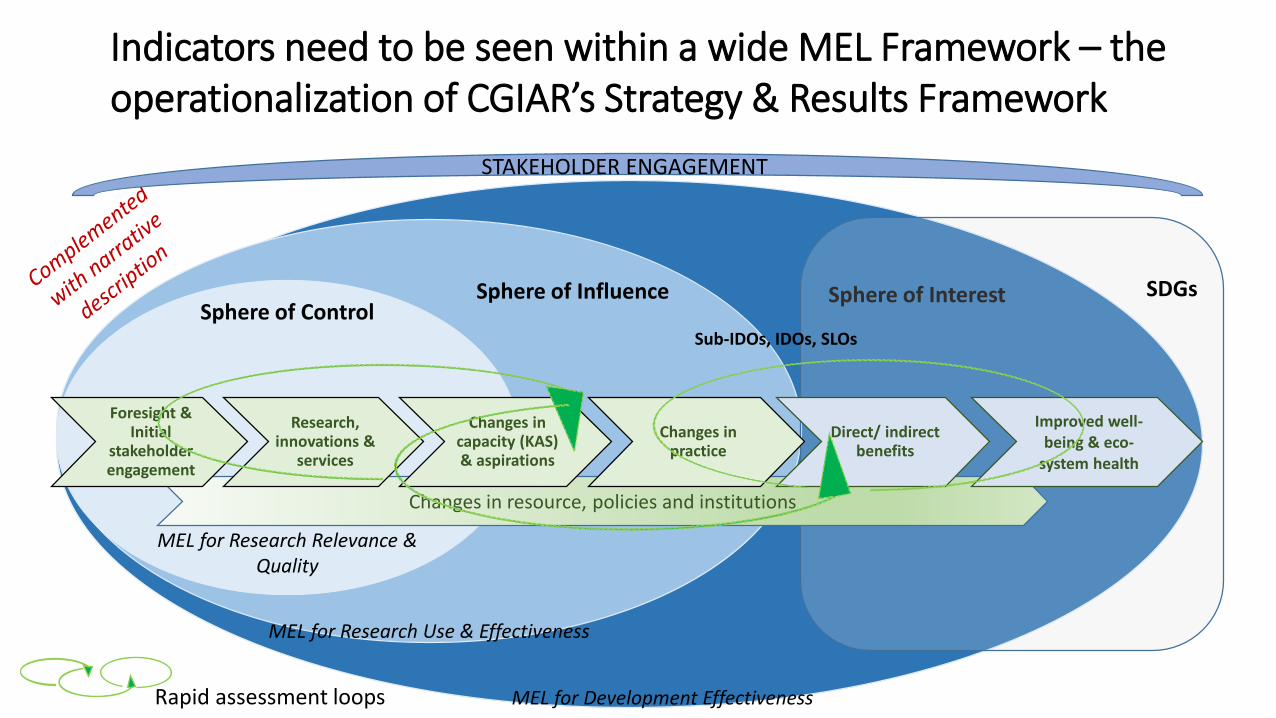
Indicators need to be seen within a wide MEL Framework – the operationalization of CGIAR’s Strategy & Results Framework
Sphere of Interest
MEL for Development Effectiveness
Sphere of Influence
MEL for Research Use & Effectiveness
Sphere of Control
MEL for Research Relevance & Quality
STAKEHOLDER ENGAGEMENT
SDGs
Sub-IDOs, IDOs, SLOs
Changes in resource, policies and institutions
Foresight & Initial
stakeholder engagement
Research, innovations &
services
Changes in capacity (KAS) & aspirations
Changes in practice
Direct/ indirect benefits
Improved well-being & eco-
system health
Rapid assessment loops
July-September 2016
Developing the Impact Pathways and see if we can get to a concise set of system level indicators

www.cgiar.org
Aspirational SRF/SLO1 targets for 2022
1.1. 100M more farm households have adopted improved varieties, breeds or trees, …
1.2 30 M people, of which 50% are women, assisted to exit poverty
www.cgiar.org
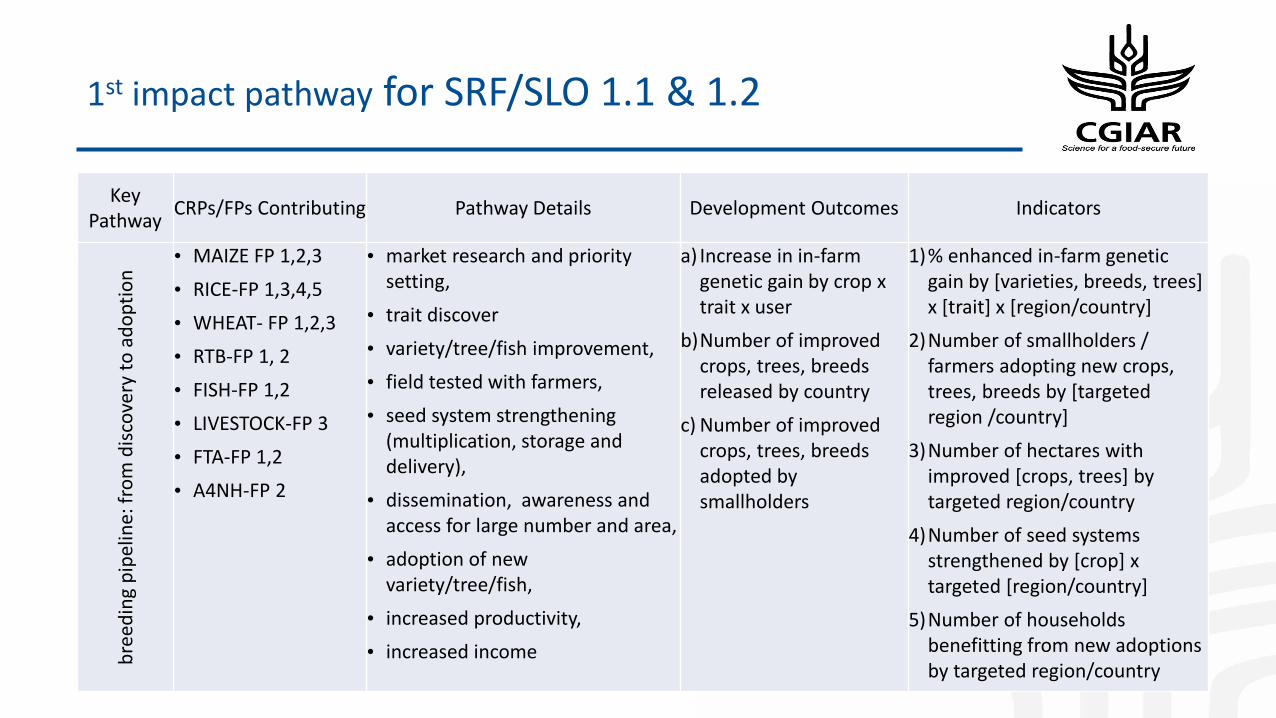
1st impact pathway for SRF/SLO 1.1 & 1.2
Key Pathway
CRPs/FPs Contributing Pathway Details Development Outcomes Indicators
bre
edin
g p
ipel
ine:
fro
m d
isco
very
to
ad
op
tio
n
• MAIZE FP 1,2,3
• RICE-FP 1,3,4,5
• WHEAT- FP 1,2,3
• RTB-FP 1, 2
• FISH-FP 1,2
• LIVESTOCK-FP 3
• FTA-FP 1,2
• A4NH-FP 2
• market research and priority setting,
• trait discover
• variety/tree/fish improvement,
• field tested with farmers,
• seed system strengthening (multiplication, storage and delivery),
• dissemination, awareness and access for large number and area,
• adoption of new variety/tree/fish,
• increased productivity,
• increased income
a) Increase in in-farm genetic gain by crop x trait x user
b)Number of improved crops, trees, breeds released by country
c) Number of improved crops, trees, breeds adopted by smallholders
1)% enhanced in-farm genetic gain by [varieties, breeds, trees] x [trait] x [region/country]
2)Number of smallholders / farmers adopting new crops, trees, breeds by [targeted region /country]
3)Number of hectares with improved [crops, trees] by targeted region/country
4)Number of seed systems strengthened by [crop] x targeted [region/country]
5)Number of households benefitting from new adoptions by targeted region/country
www.cgiar.org
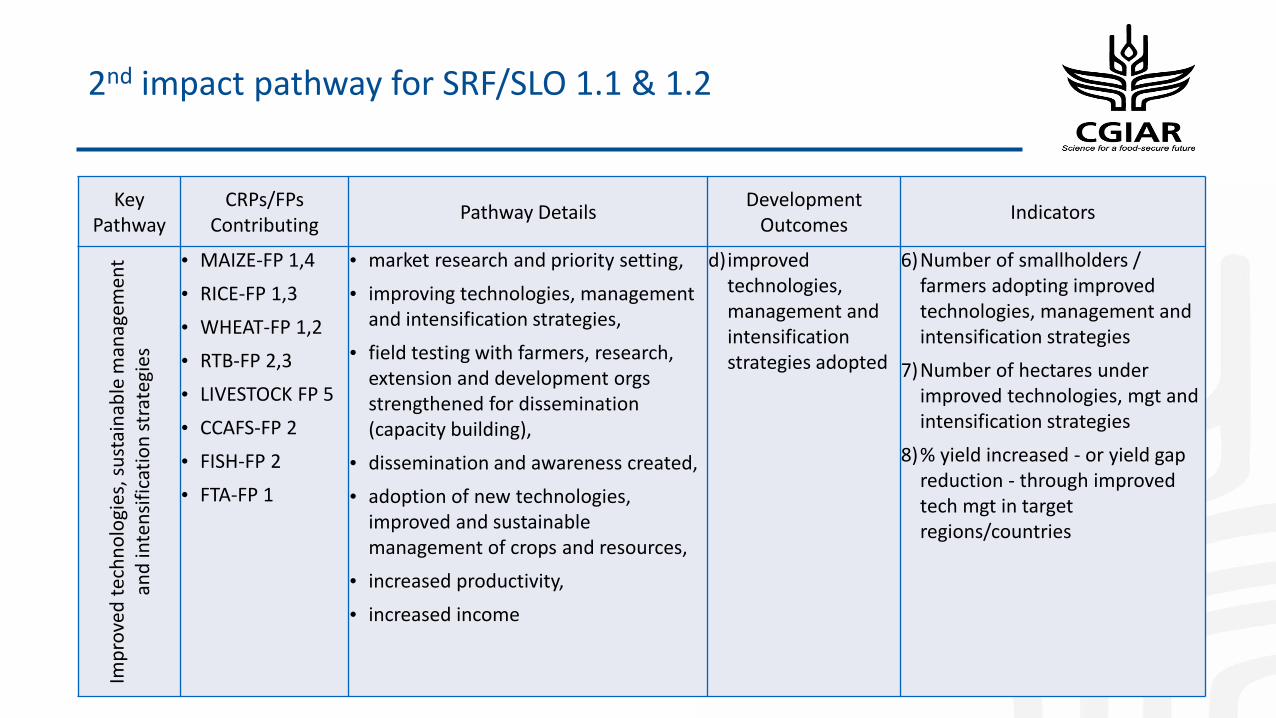
2nd impact pathway for SRF/SLO 1.1 & 1.2
Key Pathway
CRPs/FPs Contributing
Pathway DetailsDevelopment
OutcomesIndicators
Imp
rove
d t
ech
no
logi
es, s
ust
ain
able
man
agem
ent
and
inte
nsi
fica
tio
n s
trat
egie
s
• MAIZE-FP 1,4
• RICE-FP 1,3
• WHEAT-FP 1,2
• RTB-FP 2,3
• LIVESTOCK FP 5
• CCAFS-FP 2
• FISH-FP 2
• FTA-FP 1
• market research and priority setting,
• improving technologies, management and intensification strategies,
• field testing with farmers, research, extension and development orgs strengthened for dissemination (capacity building),
• dissemination and awareness created,
• adoption of new technologies, improved and sustainable management of crops and resources,
• increased productivity,
• increased income
d)improved technologies, management and intensification strategies adopted
6)Number of smallholders / farmers adopting improved technologies, management and intensification strategies
7)Number of hectares under improved technologies, mgt and intensification strategies
8)% yield increased - or yield gap reduction - through improved tech mgt in target regions/countries

www.cgiar.org
3rd impact pathway for SRF/ mainly for SLO 1.2
Key PathwayCRPs/FPs
ContributingPathway Details
Development Outcomes
Indicators
Val
ue
chai
n im
pro
vem
ent
• RICE-FP 1,2,3
• MAIZE-FP 1,5
• WHEAT-FP 1,4
• RTB-FP 4,5
• FTA-FP 3
• FISH-FP 3
• LIVESTOCK-FP 2
• value chain analysis and market research,
• Targeted actors/stakeholders:
producers/growers
processors,
distributers,
consumers
• different types of interventions by actors to targeted weak areas
• improved value chains
• easier and more efficient market access for value chain actors,
• increased sales and profit for value chain actors
• increased incomes
h)improved access to financial and other VC services
i) diversified enterprise opportunities
9)Number of actors benefitting from targeted VC improvement by region/country
10)% change in actors’ profits by targeted VC x region/country
11)% of increased income by targeted VC actors and by region/country
SLO 3 - Improved NR systems and ES services
3.1 20 % increase in water and nutrient (inorganic, biological) use efficiency in agro-ecosystems, including through recycling and reuse.


Outputs summary second phase (Jul-Sep)
1. Consolidated generic pathways which will outline and link the portfolios
proposed work and contribution to the defined System Level Outcomes (SLO)
described in the SRF
2. Derived at a draft set of 25-30 high level indicators, from the consolidated
outcomes of the identified key pathways under each SLO (1 Poverty, 2 Nutrition
and 3 Health, Natural Resource Management) mapped with the Intermediary
Development Outcomes (IDOs) of the SRF
3. Tested the robustness and quality of the SLO 1 (Poverty) identified indicators
against a set of criteria: annually measurable, aggregable, affordable/ feasible to
measure, and
4. Mapped the tested indicators with the three spheres of control, influence, and
interest to identify they - high – level of contribution.
5. Near full fleshed example for SLO 1 (Poverty)

The third phase (Sep-Nov)
3 SLOs • 10 SLO targets
Sub-SLOs• 25-30 high-level indicators
(link w/ sub-IDO, IDOs, others?)
Outcomes (B) & milestones (D)
• Other CRP-FP indicators?

The third phase (Sep-Nov)
• Refine products described above and follow the same process for SLO 2 & 3
• Consult with CRP and flagship leaders to ensure technical appropriateness and
quality for the indicators (validation)
• Provide further detail on each indicator, including a definition for each, caveats
and limitations, standardized methodologies to measure them (where available,
draw from expertise within CGIAR and beyond, e.g. building on SDSN)
• Provide an update at the MEL CoP meeting in October (12-14) and broader
framework / discussion for further validation through the MEL expertise
• Socializing the indicators product, e.g. handbook, webinar, pptx
• Present to the System Council and System Management Board in November
• Clarify system-wide roles and responsibilities for next steps