original research open access … · diameter of 27mm were used in the test of second group...
TRANSCRIPT

Loading rate conditions and specimen size effect on strength and deformability of rock materials under uniaxial compressionEren Komurlu*
IntroductionDetermination of the uniaxial compressive strength (UCS), one of the most crucial inputs in rock engineering design works is detailed in different standards and sugges-tions by the International Society for Rock Mechanics and Rock Engineering (ISRM). The relevant standards and suggestions include some statements to select appropriate values of different parameters like geometry, size and loading rate. As ideal geometry of the UCS test specimens, length to diameter (L/D) ratio of the cylindrical specimens is suggested to be 2–2.5 by ASTM (American Society for Testing and Materials) and TSE (Turkish Standards Institution). On the other hand, the ratio should be 2.5–3 according to ISRM suggestions [1–3]. The geometry effect on the UCS values is one of the well-studied topics in rock testing. It is known that an increase in the ratio of length to diam-eter of the cylindrical core specimens make strength values to decrease [4–6].
The specimen size has also a significant effect on the UCS test results that an increase in the size makes a decrease in the UCS values [7–9]. Stress concentration at the crack
Abstract
In this study, various rock and cementitious rock-like material specimens with same ratio of length to diameter and different sizes were tested under various deformation controlled loading rate (mm/min) and load controlled rate (kN/s) conditions. Accord-ing to the results obtained from 93 specimens of 5 different types of rock material and 2 different rock-like materials (cement paste and a concrete mix including sand) tested in this study, uniaxial compressive strength (UCS) values were found to signifi-cantly decrease with an increase in the specimen size under the condition of a load controlled rate (kN/s) selection. To practically remove the size effect on UCS values, the uniaxial compression test is suggested to perform selecting the loading rate as strain controlled (s−1) and proportional to diameters of specimens with different sizes and same geometry. In addition to the UCS values, Modulus of elasticity values, stress and strain graph shapes and deformation characteristics were found to significantly change with the change of the specimen size and loading rate. According to the results, both modulus of elasticity values and brittleness were found to notably increase as a result of increase in loading rate values.
Keywords: Uniaxial compressive strength, Modulus of elasticity, Rock core size, Loading rate, Specimen geometry
Open Access
© The Author(s) 2018. This article is distributed under the terms of the Creative Commons Attribution 4.0 International License (http://creat iveco mmons .org/licen ses/by/4.0/), which permits unrestricted use, distribution, and reproduction in any medium, provided you give appropriate credit to the original author(s) and the source, provide a link to the Creative Commons license, and indicate if changes were made.
ORIGINAL RESEARCH
Komurlu Geo-Engineering (2018) 9:17 https://doi.org/10.1186/s40703-018-0085-z
*Correspondence: [email protected] Department of Civil Eng., Giresun University, Giresun, Turkey

Page 2 of 11Komurlu Geo-Engineering (2018) 9:17
initiation location in the specimens increases with an increase in the size under a same load per a contact area condition. That situation is a significant reason making bigger specimens to fail under lower measured strength values in comparison with smaller size specimens [10–12]. In the UCS tests of rock materials, the loading rate is many times load control selected with the unit of kN/s. It is known that the increase in the loading rate makes also an increase in the UCS values [13–17]. Big size specimens tested under a same load controlled rate (kN/s) have lower deformation rates (mm/min) and strain rates (s−1) which cause to measure lower UCS values than those of the specimens with smaller sizes. From this point of view, it can be inferred that a relatively high loading rate should be selected to not have a decrease in the UCS values in case of increase in the specimen size.
In this study, different size rock core specimens and cementitious rocklike materials were tested to investigate whether the size effect on UCS values can be eliminated by loading under an appropriately changed loading rate selection. In addition to the UCS values, changes in the modulus of elasticity values and deformation characteristics of dif-ferent rock and rocklike specimens were determined to investigate variations in the uni-axial deformability test results with the change of the size and loading rate conditions.
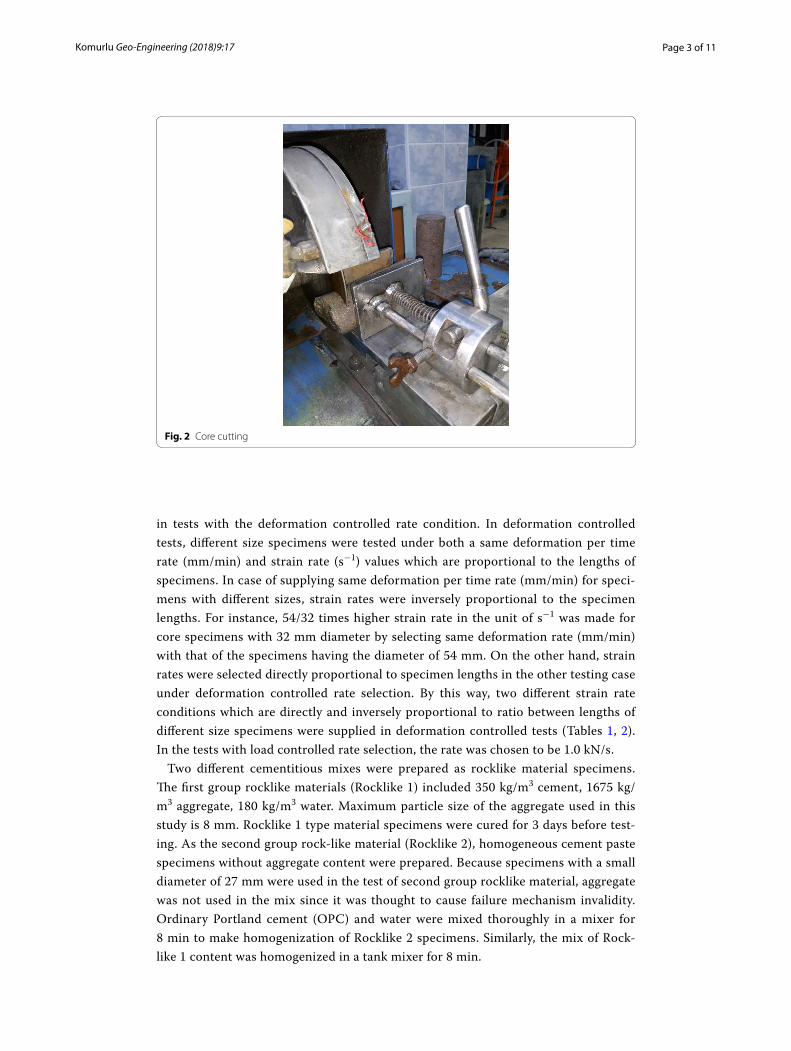
Materials and methodsTo prepare rock specimens with different sizes, core cutters with the inner diameters of 32 mm and 54.7 mm (NX size) were used (Fig. 1). All of the rock core specimens were cut to have a same length to diameter ratio of 2 by using sawing machines (Fig. 2). The end faces of the cores and rock-like cementitious samples were smoothened to maintain precision within 0.02 mm and made perpendicular to the sample axis within 0.05 mm using comparator. A total of 75 rock core samples were prepared and used in triplication for each testing condition of size and loading rate. Totally, five different rock materials (Limestone, Tuff, Siltstone, Dacite, Akarsen mine ore) were tested for the present study. All the rock materials tested in this study were taken from the vicinity of Akarsen copper mine, an underground mine in Artvin city of Turkey.
Size effect of the rock specimens were investigated under both load controlled rate (kN/s) and deformation controlled rate (mm/min) conditions. To load under various rate unit selection conditions, two different equipments with hydraulic and electrical motor presses were used. A linear variable differential transformer (LVDT) was used
Fig. 1 Coring process by using drill bits with diameters of 32 mm (a) and 54 mm (b), different size core drillers (c)
Page 3 of 11Komurlu Geo-Engineering (2018) 9:17
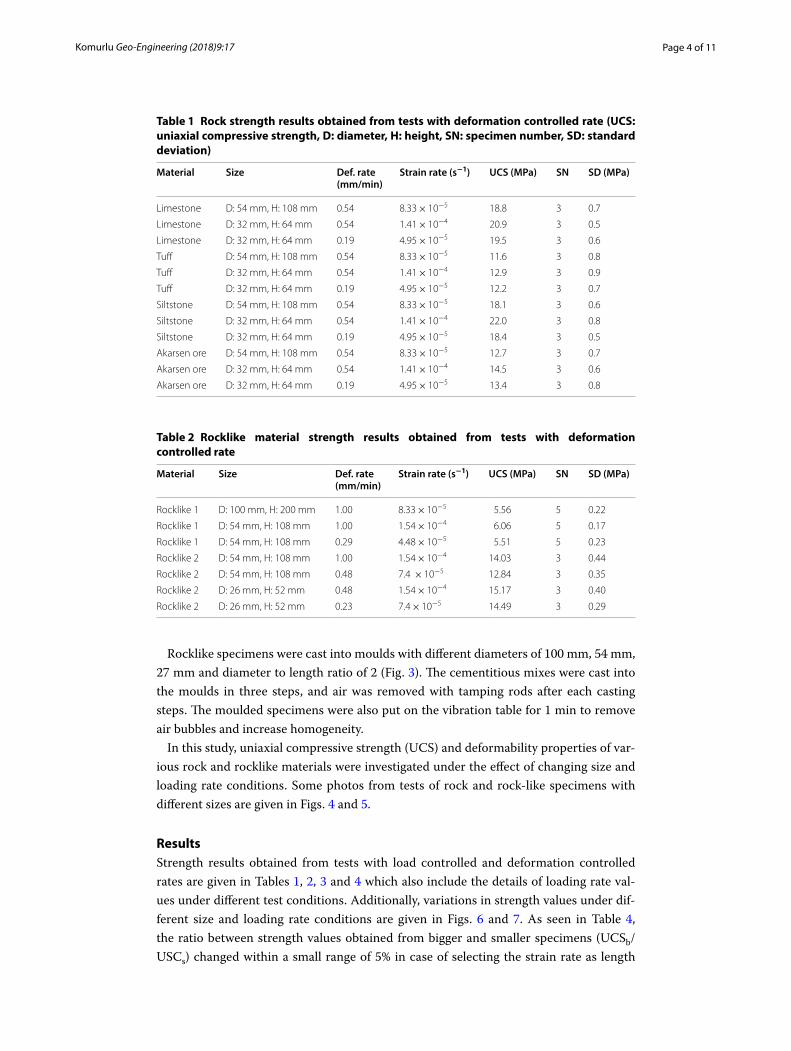
in tests with the deformation controlled rate condition. In deformation controlled tests, different size specimens were tested under both a same deformation per time rate (mm/min) and strain rate (s−1) values which are proportional to the lengths of specimens. In case of supplying same deformation per time rate (mm/min) for speci-mens with different sizes, strain rates were inversely proportional to the specimen lengths. For instance, 54/32 times higher strain rate in the unit of s−1 was made for core specimens with 32 mm diameter by selecting same deformation rate (mm/min) with that of the specimens having the diameter of 54 mm. On the other hand, strain rates were selected directly proportional to specimen lengths in the other testing case under deformation controlled rate selection. By this way, two different strain rate conditions which are directly and inversely proportional to ratio between lengths of different size specimens were supplied in deformation controlled tests (Tables 1, 2). In the tests with load controlled rate selection, the rate was chosen to be 1.0 kN/s.
Two different cementitious mixes were prepared as rocklike material specimens. The first group rocklike materials (Rocklike 1) included 350 kg/m3 cement, 1675 kg/m3 aggregate, 180 kg/m3 water. Maximum particle size of the aggregate used in this study is 8 mm. Rocklike 1 type material specimens were cured for 3 days before test-ing. As the second group rock-like material (Rocklike 2), homogeneous cement paste specimens without aggregate content were prepared. Because specimens with a small diameter of 27 mm were used in the test of second group rocklike material, aggregate was not used in the mix since it was thought to cause failure mechanism invalidity. Ordinary Portland cement (OPC) and water were mixed thoroughly in a mixer for 8 min to make homogenization of Rocklike 2 specimens. Similarly, the mix of Rock-like 1 content was homogenized in a tank mixer for 8 min.
Fig. 2 Core cutting
Page 4 of 11Komurlu Geo-Engineering (2018) 9:17
Rocklike specimens were cast into moulds with different diameters of 100 mm, 54 mm, 27 mm and diameter to length ratio of 2 (Fig. 3). The cementitious mixes were cast into the moulds in three steps, and air was removed with tamping rods after each casting steps. The moulded specimens were also put on the vibration table for 1 min to remove air bubbles and increase homogeneity.
In this study, uniaxial compressive strength (UCS) and deformability properties of var-ious rock and rocklike materials were investigated under the effect of changing size and loading rate conditions. Some photos from tests of rock and rock-like specimens with different sizes are given in Figs. 4 and 5.
ResultsStrength results obtained from tests with load controlled and deformation controlled rates are given in Tables 1, 2, 3 and 4 which also include the details of loading rate val-ues under different test conditions. Additionally, variations in strength values under dif-ferent size and loading rate conditions are given in Figs. 6 and 7. As seen in Table 4, the ratio between strength values obtained from bigger and smaller specimens (UCSb/USCs) changed within a small range of 5% in case of selecting the strain rate as length
Table 1 Rock strength results obtained from tests with deformation controlled rate (UCS: uniaxial compressive strength, D: diameter, H: height, SN: specimen number, SD: standard deviation)
Material Size Def. rate (mm/min)
Strain rate (s−1) UCS (MPa) SN SD (MPa)
Limestone D: 54 mm, H: 108 mm 0.54 8.33 × 10⁻⁵ 18.8 3 0.7
Limestone D: 32 mm, H: 64 mm 0.54 1.41 × 10⁻⁴ 20.9 3 0.5
Limestone D: 32 mm, H: 64 mm 0.19 4.95 × 10⁻⁵ 19.5 3 0.6
Tuff D: 54 mm, H: 108 mm 0.54 8.33 × 10⁻⁵ 11.6 3 0.8
Tuff D: 32 mm, H: 64 mm 0.54 1.41 × 10⁻⁴ 12.9 3 0.9
Tuff D: 32 mm, H: 64 mm 0.19 4.95 × 10⁻⁵ 12.2 3 0.7
Siltstone D: 54 mm, H: 108 mm 0.54 8.33 × 10⁻⁵ 18.1 3 0.6
Siltstone D: 32 mm, H: 64 mm 0.54 1.41 × 10⁻⁴ 22.0 3 0.8
Siltstone D: 32 mm, H: 64 mm 0.19 4.95 × 10⁻⁵ 18.4 3 0.5
Akarsen ore D: 54 mm, H: 108 mm 0.54 8.33 × 10⁻⁵ 12.7 3 0.7
Akarsen ore D: 32 mm, H: 64 mm 0.54 1.41 × 10⁻⁴ 14.5 3 0.6
Akarsen ore D: 32 mm, H: 64 mm 0.19 4.95 × 10⁻⁵ 13.4 3 0.8
Table 2 Rocklike material strength results obtained from tests with deformation controlled rate
Material Size Def. rate (mm/min)
Strain rate (s−1) UCS (MPa) SN SD (MPa)
Rocklike 1 D: 100 mm, H: 200 mm 1.00 8.33 × 10⁻⁵ 5.56 5 0.22
Rocklike 1 D: 54 mm, H: 108 mm 1.00 1.54 × 10⁻⁴ 6.06 5 0.17
Rocklike 1 D: 54 mm, H: 108 mm 0.29 4.48 × 10⁻⁵ 5.51 5 0.23
Rocklike 2 D: 54 mm, H: 108 mm 1.00 1.54 × 10⁻⁴ 14.03 3 0.44
Rocklike 2 D: 54 mm, H: 108 mm 0.48 7.4 × 10⁻⁵ 12.84 3 0.35
Rocklike 2 D: 26 mm, H: 52 mm 0.48 1.54 × 10⁻⁴ 15.17 3 0.40
Rocklike 2 D: 26 mm, H: 52 mm 0.23 7.4 × 10⁻⁵ 14.49 3 0.29

Page 5 of 11Komurlu Geo-Engineering (2018) 9:17
proportional. Therefore, it can be inferred that the size effect on UCS values can be prac-tically neglected selecting strain rate proportional to lengths of specimens.
Strains of specimens were not measured in tests with load controlled rate selection. On the other hand, both strength and deformability parameters were determined under the tests carried out with deformation controlled rate selection. According to the stress and strain graphs drawn by the loading equipment program, secant modulus of elasticity (Esec) and tangent modulus of elasticity (Etan) values were calculated as given in Table 5. To calculate the modulus of elasticity values, methodology suggested by the ISRM [1] was followed. Average modulus of elasticity values were not calculated since it is not usable for comparison of different loading conditions as stress strain graphs are line-arized under different stress levels for different specimens.
As seen in Figs. 8 and 9, modulus of elasticity values were found to increase with increasing loading rate. Besides, stress strain graph shapes of all the materials tested
Fig. 3 Molded cementitious mixes: Rocklike 1 (a) and Rocklike 2 (b) specimens
Fig. 4 Testing strengths of rocklike specimes with different diameters of 100 mm (a), 54 mm (b) and 26 mm (c)

Page 6 of 11Komurlu Geo-Engineering (2018) 9:17
in this study were determined to significantly differ with the change in load conditions that the specimens were found to be fail with a more brittle characteristic as a result of increase in loading rate values. Some stress–strain graphs given as example for the
Fig. 5 Testing strengths of rock specimes with different diameters of 32 mm (a), 54 mm (b)
Table 3 Results of tests with load controlled rate selection
Material Size Load rate (kN/s)
UCS (MPa) SN SD (MPa)
Limestone D: 54 mm, H: 108 mm 1.0 18.3 3 0.5
Limestone D: 32 mm, H: 64 mm 1.0 22.4 3 0.6
Tuff D: 54 mm, H: 108 mm 1.0 10.6 3 0.6
Tuff D: 32 mm, H: 64 mm 1.0 13.8 3 0.7
Siltstone D: 54 mm, H: 108 mm 1.0 17.2 3 0.9
Siltstone D: 32 mm, H: 64 mm 1.0 24.3 3 0.8
Dacite D: 54 mm, H: 108 mm 1.0 49.7 3 1.3
Dacite D: 32 mm, H: 64 mm 1.0 62.4 3 1.5
Akarsen ore D: 54 mm, H: 108 mm 1.0 13.2 3 1.0
Akarsen ore D: 32 mm, H: 64 mm 1.0 17.5 3 0.9
Table 4 Strength relations obtained under the condition of strain rate values selected as proportional to specimen heights (UCSb: uniaxial compressive strength of big specimens, USCs: uniaxial compressive strength of small specimens)
Material Strength ratios (UCSb/USCs) Height of big size specimens Height of small specimens
Limestone 0.96 108 64
Tuff 0.95 108 64
Siltstone 0.98 108 64
Akarsen ore 0.95 108 64
Rocklike 1 1.01 200 108
Rocklike 2 0.97 108 52

Page 7 of 11Komurlu Geo-Engineering (2018) 9:17
Fig. 6 UCS values under same load rate (kN/s)
Fig. 7 UCS values under same deformation rate (mm/min)

Page 8 of 11Komurlu Geo-Engineering (2018) 9:17
change in brittleness with variations in strain rate values are shown in Fig. 10. As a result of the increase in the brittleness with increasing in strain rate, failure shapes were also differed. As a remarkable failure variation with the change of strain rate, limestone specimens exhibited a failure with throwing particles and crumbling parts under the high strain rate of 1.41 × 10⁻⁴ s−1, whereas limestone specimens loaded under low strain rate value of 4.95 × 10⁻⁵ s−1 failed with one narrow crack (Fig. 11).
Table 5 Deformation modulus values (Esec: secant modulus of elasticity, Etan: tangent modulus of elasticity)
Material Size Def. rate (mm/min)
Strain rate (s−1) Esec (GPa) Etan (GPa)
Limestone D: 54 mm, H: 108 mm 0.54 8.33 × 10⁻⁵ 9.32 11.53
Limestone D: 32 mm, H: 64 mm 0.54 1.41 × 10⁻⁴ 8.87 11.09
Limestone D: 32 mm, H: 64 mm 0.19 4.95 × 10⁻⁵ 8.06 10.35
Tuff D: 54 mm, H: 108 mm 0.54 8.33 × 10⁻⁵ 7.44 9.61
Tuff D: 32 mm, H: 64 mm 0.54 1.41 × 10⁻⁴ 6.90 8.98
Tuff D: 32 mm, H: 64 mm 0.19 4.95 × 10⁻⁵ 6.31 8.64
Siltstone D: 54 mm, H: 108 mm 0.54 8.33 × 10⁻⁵ 9.53 10.77
Siltstone D: 32 mm, H: 64 mm 0.54 1.41 × 10⁻⁴ 10.22 12.86
Siltstone D: 32 mm, H: 64 mm 0.19 4.95 × 10⁻⁵ 8.98 11.43
Akarsen ore D: 54 mm, H: 108 mm 0.54 8.33 × 10⁻⁵ 9.69 11.90
Akarsen ore D: 32 mm, H: 64 mm 0.54 1.41 × 10⁻⁴ 8.75 10.06
Akarsen ore D: 32 mm, H: 64 mm 0.19 4.95 × 10⁻⁵ 7.39 9.31
Rocklike 1 D: 100 mm, H: 200 mm 1.00 8.33 × 10⁻⁵ 1.40 2.78
Rocklike 1 D: 54 mm, H: 108 mm 1.00 1.54 × 10⁻⁴ 0.83 1.49
Rocklike 1 D: 54 mm, H: 108 mm 0.29 4.48 × 10⁻⁵ 0.61 1.02
Rocklike 2 D: 54 mm, H: 108 mm 1.00 1.54 × 10⁻⁴ 1.82 2.73
Rocklike 2 D: 54 mm, H: 108 mm 0.48 7.4 × 10⁻⁵ 1.54 2.45
Rocklike 2 D: 26 mm, H: 52 mm 0.48 1.54 × 10⁻⁴ 2.24 3.34
Rocklike 2 D: 26 mm, H: 52 mm 0.23 7.4 × 10⁻⁵ 1.91 2.53
Fig. 8 Secant modulus of elasticity values

Page 9 of 11Komurlu Geo-Engineering (2018) 9:17
Fig. 9 Tangent modulus of elasticity values
Fig. 10 Some stress–strain graphs
Fig. 11 An example for variation in failure under different strain rates: Limestone specimens tested under different strain rates of 1.41 × 10⁻⁴ s−1 (a) and 4.95 × 10⁻⁵ s−1 (b)

Page 10 of 11Komurlu Geo-Engineering (2018) 9:17
Discussions and conclusionFinding the increase of the UCS values with an increase in loading rate is parallel with the results obtained from other previous studies carried out by different researchers [13–17]. Under a load controlled rate (kN/s), change in the size causes also a change in the strain rate (s−1) that a decrease of the size makes an increase in the rate value. Therefore, UCS values measured from smaller size specimens are higher than those of bigger ones.
The size effect was assessed to be not ignorable under the conditions of both load controlled and deformation controlled rates [18–20]. However, it should be noted herein that the size effect was found to be considerably minimized by testing under a same deformation rate condition in comparison with a load controlled rate selection. To practically remove the size effect, strain controlled loading rate (s−1) selected to proportionally increase with the change in specimen lengths was found usable. For instance, in case of increase in rock core specimen length from 64 mm to 108 mm, strain rate should be increased 108/64 times in comparison to the rate in test of the small specimen. In this study, core diameters of 32 mm and 54 mm were compared to investigate a 1.7 times change in size of the core specimens with the ratio of length to diameter of 2. Therefore, findings of this study should be considered for that kind of size variation and not be used for generalization since relation between UCS values can change for different variations in specimen sizes [21–23].
The size and loading rate have significant effect not only for strength values but also on deformability properties of rock and rocklike materials. The modulus of elasticity values were found to increase with increasing in loading rate as similar with results of other studies [24–26]. As another significant observation from this study, brittleness of rock and rocklike materials was determined to increase with an increase in loading rate. This situation confirms that more energy absorption is needed to make the start of cracking as the loading rate increases and the increase in energy absorption under the elastic deformation limit makes more rapid crack propagation and immediate fail-ure as the plastic deformation starts [27–29].
In conclusion, the loading rate was found to significantly change strength and deformability properties of rock and cementitious rocklike materials that the increase in loading rate made increases in both UCS and modulus of elasticity values and the brittleness. As the most notable outcome of this study, the loading rate is suggested to select as strain controlled and proportional to diameters of specimens with different sizes to practically eliminate the size effect on the UCS values.Authors’ contributions The author read and approved the final manuscript.
Competing interestsThe author declares that he has no competing interests.
Publisher’s NoteSpringer Nature remains neutral with regard to jurisdictional claims in published maps and institutional affiliations.
Received: 16 May 2018 Accepted: 23 October 2018
Page 11 of 11Komurlu Geo-Engineering (2018) 9:17
References 1. ISRM (2007) The blue book—the complete ISRM suggested methods for rock characterisation, testing and
monitoring: 1974–2006 (Ulusay R, Hudson JA in eds). ISRM & Turkish National Group of ISRM, Ankara 2. ASTM D7012–14e1 (2014) Standard test methods for compressive strength and elastic moduli of intact rock core
specimens under varying states of stress and temperatures. ASTM International, West Conshohocken. http://www.astm.org
3. TS 699 (1987) Tabii Yapı Taşları Muayene ve Deney Metotları. Turkish Standards Institution, Ankara (in Turkish) 4. Fan X, Xu F, Chen L, Chen Q, Liu Z, Yao G, Nie W (2016) Dimension analysis-based model for prediction of shale
compressive strength. Adv Mater Sci Eng. https ://doi.org/10.1155/2016/79486 12 5. Tuncay E, Tunar Özcan N, Kalender A (2015) New approach for determination of length to diameter ratio of speci-
men used for uniaxial compressive strength test. In: Proceedings of national engineering geology symposium of Turkey (MühJeo 2015). Trabzon, Turkey, pp 246–253
6. Kim JK, Yi ST (2002) Application of size effect to compressive strength of concrete members. Sadhana 27:467–484 7. Darlington WJ, Ranjith PG, Choi SK (2011) The effect of specimen size on strength and other properties in laboratory
testing of rock and rock-like cementitious brittle materials. Rock Mech Rock Eng 44:513–529 8. Meng Q, Zhang M, Han L, Pu H, Li H (2016) Effects of size and strain rate on the mechanical behaviors of rock speci-
mens under uniaxial compression. Arabian J Geosci 9:527 9. Lee BJ, Kee SH, Oh T, Kim YY (2015) Effect of cylinder size on the modulus of elasticity and compressive strength of
concrete from static and dynamic tests. Adv Mater Sci Eng. https ://doi.org/10.1155/2015/58063 8 10. Weiss J, Girard L, Gimbert F, Amitrano D, Vandembroucq D (2014) (Finite) statistical size effects on compressive
strength. Proc Natl Acad Sci USA 111:6231–6236 11. Hamad AJ (2017) Size and shape effect of specimen on the compressive strength of HPLWFC reinforced with glass
fibres. J King Saud Univ Eng Sci 29:373–380 12. Komurlu E, Kesimal A, Demir S (2016) An experimental and numerical study on determination of indirect (splitting)
tensile strength of rocks under various load apparatus. Can Geotech J 53:360–372 13. Lajtai EZ, Scott Duncan EJ, Carter BJ (1991) The effect of strain rate on rock strength. Rock Mech Rock Eng 24:99–109 14. Sun JS, Ma LJ, Dou YM, Zhou J (2012) Effect of strain rate on the compressive mechanical properties of concrete.
Adv Mater Res 450–451:244–247 15. Kohmura Y, Inada Y (2006) The effect of the loading rate on stress–strain characteristics of tuff. J Soc Mater Sci Japan
55:323–328 16. Fabjan T, Ivars DM, Vukadin V (2015) Numerical simulation of intact rock behaviour via the continuum and Voronoi
tesselletion models—a sensitivity analysis. Acta Geotechnica Slovenica 12(2):5–23 17. Komurlu E, Kesimal A (2017) An experimental study on determination of crack propagation energies of granite type
different rock materials under impact effect (in Turkish). In: Proceedings of national engineering geology sympo-sium of Turkey (MühJeo 2017), Adana, Turkey, pp 231–238
18. Thuro K, Plinninger RJ, Zah S, Schutz S (2001) Scale effects in rock strength properties. Part1: unconfined compres-sive test and Brazilian test. In: Proceedings of Eurock 2001, ISRM regional symposium 2001, Espoo, Finland, pp 169–174
19. Walton G (2018) Scale effects observed in compression testing of stanstead granite including post-peak strength and dilatancy. Geotech Geol Eng 36:1091–1111
20. Kourkoulis SK, Ganniari-Papageorgiou E (2010) Experimental study of the size- and shape-effects of natural building stones. Construct Build Mater 24:803–810
21. Symons IF (1970) The effect of size and shape of specimen upon the unconfined compressive strength of cement-stabilized materials. Magaz Concrete Res 22:45–50
22. Tuncay E, Hasançebi N (2009) The effect of length to diameter ratio of test specimens on uniaxial compressive strength of rock. Bull Eng Geol Environ 68(4):491–497
23. Kaklis KN, Maurigiannakis SP, Agioutantis ZG, Stathogianni FK, Steiakakis EK (2015) Experimental investigation of the size effect on the mechanical properties on two natural building stones. In: Proceedings of 8th GRACM international congress on computational mechanics, Volos, Greece
24. Liang CY, Zhang QB, Li X, Xin P (2016) The effect of specimen shape and strain rate on uniaxial compressive behavior of rock material. Bull Eng Geol Environ 75:1669–1681
25. Yang J (2015) Effect of displacement loading rate on mechanical properties of sandstone. Elect J Geotech Eng 20:591–602
26. Felekoglu B, Türkel S (2004) The effect of loading rate on compressive strength and modulus of elasticity of con-crete. Dokuz Eylul Univ Fac Eng J Sci Eng 6:65–75 (in Turkish)
27. Shkolnik IE (2008) Influence of high strain rates on stress–strain relationship, strength and elastic modulus of con-crete. Cem Concr Composit 30:1000–1012
28. Zhang ZX, Kou SQ, Yu J, Yu Y, Jiang LG, Lindqvist PA (1999) Effects of loading rate on rock fracture. Int J Rock Mech Mining Sci 36:597–611
29. Chen X, Wu S, Zhou J, Chen Y (2013) Effect of testing method and strain rate on stress–strain behavior of concrete. J Mater Civil Eng 25:1752–1761