original paper - department of zoology, ubcwoodcm/woodblog/wp-content/uploads/...original paper...
TRANSCRIPT
ORIGINAL PAPER
Physiological and molecular analysis of the interactive effectsof feeding and high environmental ammonia on branchialammonia excretion and Na+ uptake in freshwater rainbow trout
Alex M. Zimmer • C. Michele Nawata •
Chris M. Wood
Received: 15 February 2010 / Revised: 11 May 2010 / Accepted: 4 June 2010
� Springer-Verlag 2010
Abstract Recently, a ‘‘Na?/NH4? exchange complex’’
model has been proposed for ammonia excretion in fresh-
water fish. The model suggests that ammonia transport
occurs via Rhesus (Rh) glycoproteins and is facilitated by
gill boundary layer acidification attributable to the hydra-
tion of CO2 and H? efflux by Na?/H? exchanger (NHE-2)
and H?-ATPase. The latter two mechanisms of boundary
layer acidification would occur in conjunction with Na?
influx (through a Na? channel energized by H?-ATPase
and directly via NHE-2). Here, we show that natural
ammonia loading via feeding increases branchial mRNA
expression of Rh genes, NHE-2, and H?-ATPase, as well
as H?-ATPase activity in juvenile trout, similar to previous
findings with ammonium salt infusions and high environ-
mental ammonia (HEA) exposure. The associated increase
in ammonia excretion occurs in conjunction with a fourfold
increase in Na? influx after a meal. When exposed to HEA
(1.5 mmol/l NH4HCO3 at pH 8.0), both unfed and fed trout
showed differential increases in mRNA expression of
Rhcg2, NHE-2, and H?-ATPase, but H?-ATPase activity
remained at control levels. Unfed fish exposed to HEA
displayed a characteristic reversal of ammonia excretion,
initially uptaking ammonia, whereas fed fish (4 h after the
meal) did not show this reversal, being able to immediately
excrete ammonia against the gradient imposed by HEA.
Exposure to HEA also led to a depression of Na? influx,
demonstrating that ammonia excretion can be uncoupled
from Na? influx. We suggest that the efflux of H?, rather
than Na? influx itself, is critical to the facilitation of
ammonia excretion.
Keywords Rhesus glycoproteins � Ammonia excretion �High environmental ammonia (HEA) � Rainbow trout �Feeding
Abbreviations
HEA High environmental ammonia
Jamm Ammonia flux
JinNa Sodium influx
JoutNa Sodium efflux
JnetNa Sodium net flux
mRNA Messenger RNA
NHE-2 Na?/H? exchanger-2
PNH3 Partial pressure of NH3
Rh Rhesus glycoprotein
Tamm Total ammonia concentration
Introduction
In rainbow trout (Oncorhynchus mykiss), as well as in a
majority of other freshwater teleost fish, a large proportion
of nitrogenous waste is excreted as ammonia via the gills
with a relatively small amount being excreted renally
(Smith 1929; Fromm 1963; Wood 1993). Ammonia
excretion increases after ammonia loading via direct infu-
sion (Maetz 1972; Wilson et al. 1994; Salama et al. 1999;
Nawata and Wood 2009) and is inhibited by exposure to
high environmental ammonia (HEA), but with later
recovery (Fromm and Gillette 1968; Payan 1978; Wilson
et al. 1994; Nawata et al. 2007). These treatments are
Communicated by I. D. Hume.
A. M. Zimmer (&) � C. M. Nawata � C. M. Wood
Department of Biology, McMaster University,
Hamilton, ON L8S 4K1, Canada
e-mail: [email protected]
123
J Comp Physiol B
DOI 10.1007/s00360-010-0488-4

associated with increases in Na? influx from the water
during ammonia infusion (Wilson et al. 1994; Salama et al.
1999) and decreases in Na? influx and later recovery
during HEA (Twitchen and Eddy 1994; Wilson et al.
1994). A relatively new idea is the potential involvement of
Rh proteins in these processes (Weihrauch et al. 2009;
Wright and Wood 2009).
Rhesus (Rh) proteins are thought to be implicated in
ammonia transport due to their similarity to the methylam-
monium/ammonium permease (MEP)/ammonia transporter
(Amt) protein families (Marini et al. 1997). It remains con-
troversial whether they transport NH3 or NH4? (Khademi
et al. 2004; Bakouh et al. 2004; Li et al. 2007). Recently,
several Rh cDNA sequences were identified in the gills of
rainbow trout (Nawata et al. 2007), mangrove killifish (Hung
et al. 2007), pufferfish (Nakada et al. 2007b), and zebrafish
(Nakada et al. 2007a). When expressed in Xenopus oocytes,
trout Rh proteins significantly increased the flux of ammonia,
with experimental results favoring the transport of NH3 rather
than NH4? (Nawata et al. 2010). Furthermore, fish exposed to
HEA or infused with ammonia displayed increases in bran-
chial mRNA levels of Rhcg2 as well as Na?/H? exchanger
(NHE-2) and/or V- type H?-ATPase (Hung et al. 2007;
Nawata and Wood 2009; Nawata et al. 2007). Tsui et al.
(2009) demonstrated that, in vitro, gill cells of rainbow trout
pre-exposed to HEA and cortisol show increases in Rhcg2,
H?-ATPase, and NHE-2 gene expression.
The partial pressure gradient for NH3 (PNH3), which is
thought to drive ammonia excretion, appears to be main-
tained by the acidification of the gill boundary layer (Avella
and Bornancin 1989; Randall and Wright 1987; Wilson
et al. 1994; Salama et al. 1999). This causes protonation of
NH3 after it diffuses across the gills, transforming it to
NH4? and thus maintaining a positive PNH3 gradient from
blood to water under normal conditions (see Wood 1993).
Acidification of the gill boundary layer is thought to be due
in part to an apically located V- type H?-ATPase (Lin et al.
1994; Sullivan et al. 1995), an apical H?/Na? exchanger
(NHE; Wilson et al. 2000; Ivanis et al. 2008), and also the
hydration of CO2 (see Wilkie 2002). In freshwater fish,
active pumping of H? out of the gills by the apical H?-
ATPase is believed to create an electrochemical gradient,
which drives Na? into the gills (Avella and Bornancin
1989; Lin and Randall 1991, 1993; Wilson et al. 2000).
Apical NHEs may also function in Na? uptake in con-
junction with a basolaterally located Na?/K?-ATPase
and an electrogenic Na?HCO3- cotransporter (NBC-1)
(Wilson et al. 2000; Perry et al. 2003; Scott et al. 2005;
Parks et al. 2007). Thus, the gill boundary layer acidification
that facilitates the transport of ammonia would be linked to
Na? influx in this scheme.
Recently, Wright and Wood (2009) proposed an exten-
sion of this model for ammonia excretion in freshwater
fish, a ‘‘Na?/NH4? exchange complex’’, which was based
mainly on data of Tsui et al. (2009) obtained from cultured
gill epithelia in vitro. The model suggests that ammonia
moves passively through Rhcg (presumably Rhcg2 in
rainbow trout) as NH3 and is coupled to the efflux of H?
through H?-ATPase and NHE-2. These mechanisms may
provide the driving force necessary for Na? uptake
(through NHE-2 or through a Na? channel energized by
H?-ATPase), but may not necessarily do so in a 1:1 ratio.
Very recently, partial support for this model was provided
by Wu et al. (2010) from in situ studies of mitochondrial-
rich cells (MRCs) in the larvae of Japanese medaka. Here
ammonia excretion through Rhcg (Rhcg1) was dependent
on H? excretion by NHE-3 and appeared to be tightly
linked to Na? uptake. However, in this case, H? flux was
shown to be insensitive to bafilomycin A1, demonstrating
that H?-ATPase does not necessarily play a role (Wu et al.
2010). This work contrasts with the findings of Nakada
et al. (2007a) that Rhcg1 co-localizes with V–H?-ATPase
and Rhcg1 in MRCs in the skin of larval zebrafish. These
studies demonstrate the complexity and variability of the
relationship among different transport proteins and differ-
ent species. However, to date, what has been missing is any
examination in intact animals of the potential linkages of
ammonia flux via Rh proteins to Na? influx via NHE or
H?-ATPase.
Also overlooked to date is the potential role of feeding, as
mechanistic in vivo studies are traditionally done on fasted
fish to standardize N status. Fromm (1963) showed that
during unfed periods, total nitrogenous waste excretion of
trout falls substantially to a baseline level. It is now well
established that plasma total ammonia concentration (Tamm)
and ammonia excretion rate increase markedly after feeding
in fish (Kaushik and Teles 1985; Wicks and Randall 2002a,
b; Wood 1993; Gelineau et al. 1998; Bucking and Wood
2008). Based on findings with HEA and ammonia infusion
discussed above, we hypothesized that this more natural
pathway of internal ammonia loading in trout would cause
upregulation of Rhcg2, NHE-2, and H?-ATPase mRNA in
the gills and increased Na? influx after feeding.
This study aims to determine the effects of feeding,
HEA exposure, and a combination of both feeding and
HEA on ammonia excretion, plasma Tamm, Na? uptake,
and gill mRNA levels of Rhcg2, NHE-2, and H?ATPase in
juvenile rainbow trout, as well as branchial H?ATPase
activity. Specifically, we hypothesized that fed fish under
normal conditions (no HEA) would demonstrate increases
in ammonia excretion, plasma Tamm, Na? uptake, and
mRNA expression of associated gill transport proteins.
Secondly, we hypothesized that this prior upregulation
would allow fed fish to excrete ammonia against HEA
better than unfed fish. Thirdly, we predicted that HEA
would inhibit Na? influx in both fed and unfed fish, but
J Comp Physiol B
123

recovery of both Na? influx and ammonia excretion would
be more rapid in fed fish since they would already have
increased levels of Rhcg2, NHE2, and H?ATPase.
Methods and materials
Animals
Juvenile rainbow trout (Oncorhynchus mykiss) weighing
3–9 g were obtained from Humber Springs Trout Hatchery,
Ontario, Canada. The fish were kept in dechlorinated
Hamilton tap water (moderately hard: [Na?] = 0.6
mequiv/l, [Cl-] = 0.8 mequiv/l, [Ca2?] = 1.8 mequiv/l,
[Mg2?] = 0.3 mequiv/l, [K?] = 0.05 mequiv/l; titration
alkalinity 2.1 mequiv/l; pH *8.0; hardness *140 mg/l as
CaCO3 equivalents; temperature 12.5–15�C), and fed
*1% of their weight per day with commercial trout pel-
lets. The measured Na? and Cl- contents of the pellets
were approximately 200 mequiv/kg each. Fish were fasted
for 48 h prior to the start of experiments.
Experimental series
The study consisted of a variety of experiments, all per-
formed at a pH of 8.0, with each fish placed in an indi-
vidual 80-ml chamber containing aerated water at
approximately 15�C and limited light exposure to reduce
stress. The treatments included exposure to high environ-
mental ammonia (HEA; 1.5 mM NH4HCO3 at pH 8.0),
feeding to satiation, feeding to satiation followed by HEA
exposure, and no feeding and no HEA exposure. The pH
was monitored throughout using a Radiometer-Copenha-
gen combination glass electrode (GK24O1C) and main-
tained by the addition of 0.1 M KOH or 0.1 M HCl to the
chambers as necessary.
Ammonia excretion experiments
A variety of experiments designed to evaluate ammonia
excretion were performed. Exposures had durations of 6, 12,
or 24 h. Those lasting longer than 6 h were flushed with new
water every 6 h to limit ammonia buildup in the chambers.
For measurements of ammonia excretion rates, water sam-
ples (2 ml) were taken at 2-h intervals (in one experiment at
3-h intervals). For fed treatments, trout were fed to satiation
in their communal holding tanks (they would not feed in the
individual chambers) and then transferred immediately to the
chambers. For an initial 12-h post-prandial evaluation of
ammonia excretion, flux measurements were started imme-
diately after transfer. Based on this initial test (see Fig. 1), as
well as the study of Gelineau et al. (1998), in subsequent
experiments, fed fish began the HEA or corresponding
control exposures at 4 h after feeding (i.e., 3? h after
transfer) as this seemed to be the time at which elevated
ammonia excretion and, potentially, transporter upregula-
tion, would be well established in trout. Therefore, for these
HEA exposures and corresponding control exposures (no
HEA), both fed and unfed fish were acclimated to the
chambers for at least 3 h prior to the start of the exposures.
Plasma ammonia and tissue collection experiments
Fish were exposed to the same conditions as mentioned
above. Fed and unfed fish were euthanized at times cor-
responding to 2, 4, 6, 8, and 10 h post-feeding. Trout were
killed using an MS-222 solution (0.1 g/l), which had been
set to the same pH and ammonia concentration as the
experimental conditions. Blood samples were collected
into sodium-heparinized plastic microhematocrit capillary
tubes from the caudal vessels after severing the tail, and
plasma was separated from red cells by centrifugation
(10,000g for 2 min). Though this method of collection had
the possibility of raising plasma Tamm (see ‘‘Discussion’’),
the effect would likely be uniform across treatments.
Plasma samples were subsequently flash-frozen in liquid
nitrogen and stored at -70�C. Gill (entire gill basket)
samples were dissected from the fish following blood
sampling and were immediately flash-frozen in liquid
nitrogen and stored at -70�C until analysis.
Sodium flux experiments
Experiments to determine sodium flux were performed
separately from all other experiments. Fish were placed
Time (h)
Control 0-2 2-4 4-6 6-8 8-10 10-12
J amm (
μ mol
/g/h
)
-1.8
-1.6
-1.4
-1.2
-1.0
-0.8
-0.6
-0.4
-0.2
0.0
unfed
a
a
b b b
c
bc
Fig. 1 Effects of feeding on ammonia excretion rates (Jamm) over
12 h including rates from a 6-h control using an unfed group of fish.
Feeding occurred at 0 h. Means sharing the same letter are not
significantly different from one another. Comparisons were made
using one-way ANOVA statistical analysis followed by a Fisher LSD
post hoc multiple comparison test (P \ 0.05, N = 8)
J Comp Physiol B
123
into identical chambers (at appropriate times post-feeding)
as described above and 1 lCi/l of 22Na was added to each
chamber. When chambers were flushed at 6-h time periods,
radioisotope was re-administered to each chamber. All
other procedures were performed identically to the
ammonia excretion experiments described above. How-
ever, terminal plasma collection was done using ammo-
nium-heparinized glass microhematocrit capillary tubes.
These samples were required for measurement of final
plasma 22Na and total Na? levels, for backflux correction
(see below).
Determination of mRNA expression
Total RNA was extracted from gill samples using TRIzol
(Invitrogen, Burlington, ON), quantified via spectropho-
tometry (Nanodrop ND-1000, Nanodrop Technologies,
Wilmington, DE, USA) and electrophoresed on 1% agarose
gels stained with ethidium bromide to verify integrity.
cDNA was synthesized from 1 lg total RNA (DNaseI-
treated, Invitrogen) with an oligo(dT17) primer and Super-
script II reverse transcriptase (Invitrogen). mRNA expres-
sion levels of Rhcg2, H?-ATPase (v-type, B-subunit), and
NHE2 in the gill were determined by quantitative real-time
PCR (qPCR) using the above synthesized cDNA and
transporter-specific primers published previously (Nawata
et al. 2007). Analyses were performed on an Mx3000P
QPCR System (Stratagene, Cedar Creek, TX). Reactions
(20 ll) containing 4 ll of 59 diluted cDNA described
above, 4 pmol each of forward and reverse primers, 0.8 ll
ROX dye (1:10 dilution), and 10 ll Platinum SYBR Green
qPCR SuperMix-UDG (Invitrogen), were performed at
50�C (2 min) and 95�C (2 min), followed by 40 cycles of
95�C (15 s) and 60�C (30 s). No-template controls and non-
reversed-transcribed controls were run in parallel while
melt-curve analysis verified the presence of a single product.
Values were extrapolated from standard curves generated by
the serial dilution of one randomly selected control sample.
Because the mRNA expression levels for three housekeep-
ing genes, beta-actin, elongation factor-1a, and 18S, were
unstable across treatments, data were normalized to ng total
RNA, an established method of normalization (Bustin 2000,
2002), which we have used previously for these genes in
trout gills (Nawata and Wood 2008, 2009).
Determination of branchial H?- ATPase activity
Gill H?-ATPase activity measurements were obtained
from the same unperfused tissue samples (control, fed no
HEA, fed and unfed HEA) used for mRNA expression
measurements. A protocol for measuring H?-ATPase
activity was modified from Lin and Randall (1993) and
adapted to a Na?/K?-ATPase activity assay (McCormick
1993) using sodium azide and NEM (N-ethylmaleimide)
and ouabain as inhibitors to measure H?-ATPase activity
levels in control and experimental fish gills. This was the
same protocol used by Nawata et al. (2007). Activities are
reported as activity (no inhibitor) minus inhibitor-treated
activity (sodium azide with N-ethylmaleimide (NEM) for
V-type H?-ATPase), measured at 340 nm and at room
temperature in a kinetic microplate reader (SpectraMAX
Plus; Molecular Devices, Menlo Park, CA) at 15-s intervals
for 30 min. Protein concentrations were measured using
Bradford Reagent (Sigma) and BSA standards.
Analytical techniques
For plasma total ammonia (Tamm) analyses, freshly thawed
plasma samples were assayed enzymatically using a
Raichem kit (Cliniqa Corporation, San Diego, CA). For
water total ammonia analyses, the collected water samples
were refrigerated at -4�C for no more than 24 h or frozen
(-20�C) until assay. Water ammonia concentration was
determined (in triplicate) via spectrophotometry using a
modified protocol based on indophenol formation with
sodium salicylate (Verdouw et al. 1978). The two different
ammonia assays were cross-validated. Gamma-radioactiv-
ity of 22Na (in counts per minute, cpm) was measured by
gamma counting (Perkin Elmer Wizard 1480 300 Auto
Gamma Counter) and sodium concentration was measured
by atomic absorption spectroscopy (SpectrAA 220FS
Atomic Absorption Spectrometer).
Calculations
Ammonia flux rates (lmol/g/h) were calculated as:
JAmm ¼ Amm½ �i� Amm½ �f� �
� V= t �Mð Þ; ð1Þ
where [Amm]i and [Amm]f are the initial and final con-
centrations of ammonia in the water (in lmoles/l) obtained
from comparison to a standard curve. V indicates volume (l),
t time (h), and M mass (g). Sodium influx (lmol/g/h) was
measured using values obtained from gamma counting
(cpm/ml), and water and plasma concentrations (lmol/ml)
obtained from atomic absorption spectroscopy. The following
equation described by Maetz (1956), which incorporates
backflux corrections, was used:
JNain ¼ Ri� Rfð ÞVext � SAintð½ ½Na i�� ½Na f Þ
� �=
SAext � SAintð Þ �M � t½ �; ð2Þ
where Ri and Rf are the initial and final radioactivity levels
(cpm/ml) in the water for each flux period, Vext indicates
final volume (ml) of water, SAint and SAext are the mean
internal and external specific activities over the flux period,
and [Na]i and [Na]f are the initial and final concentrations
J Comp Physiol B
123

of sodium (in lmol/ml) measured by atomic absorption.
Net sodium flux (lmol/g/h) was obtained using the
following equation:
JNanet ¼ Na½ �i� Na½ �f
� �� V= M � tð Þ: ð3Þ
Finally, sodium efflux (lmol/g/h) was obtained using
the following equation:
JNaout ¼ JNa
net � JNain : ð4Þ
To calculate values for water and plasma ammonia
chemistry ([NH4?], [NH3], and PNH3), pK and aNH3
constants for the appropriate experimental pH and
temperature were obtained from Cameron and Heisler
(1983). Using pK and the experimental Tamm values,
[NH4?] was derived from a modified version of the
Henderson–Hasselbalch equation:
NHþ4� �
¼ Tamm= 1þ antilog pH� pKð Þ½ � ð5Þ
From this, [NH3] was calculated from the following
equation:
NH3½ � ¼ TAmm � NHþ4� �
ð6Þ
Then PNH3 (in lTorr) was calculated using the
appropriate aNH3 values from Cameron and Heisler
(1983) using the following equation:
PNH3 ¼ NH3=aNH3 ð7Þ
DPNH3 values were calculated by subtracting the
corresponding PNH3 value calculated for water from that
calculated for blood plasma at the same time for each
individual fish. For these calculations, a blood plasma pH
of 7.9 was assumed (see ‘‘Discussion’’).
Statistical analyses
Data have been expressed as means ± 1 SEM
(N = number of fish). In the case of the 6-h ammonia flux
(Jamm) experiments, controls are representative of an
average of a 6-h flux made over the corresponding time
period for trout subjected to no HEA, no feeding, or
feeding only, as appropriate (see ‘‘Results’’). Comparisons
between these controls (significant differences represented
by asterisks) were made using a Mann–Whitney rank sum
test. Comparisons made between experimental data points
and a given control were analyzed using a one-way
ANOVA followed by a Dunnett’s method post hoc test. In
the case of a failed normality test, an ANOVA on ranks
analysis was performed using a Dunn’s post hoc test with
multiple comparisons versus a control. All comparisons
made among multiple treatments within time points (sig-
nificance represented using the lettering system, whereby
means sharing the same letter are not significantly differ-
ent) were analyzed using a one-way ANOVA analysis with
a Fisher LSD post hoc test. In the case of a failed normality
test, an ANOVA on ranks analysis was performed using a
Dunn’s post hoc test with multiple pair-wise comparisons.
In all cases, statistical significance was accepted at the
P = 0.05 level. Figure legends specify the statistical test
employed to determine significance within the given data.
Results
Control experiments (6 h) with unfed fish were performed
in all experimental series as a check on handling distur-
bance. As ammonia excretion rates and Na? flux rates do
not vary significantly over time, average values are shown
as mean control values in figures.
Ammonia excretion
Prior to feeding, ammonia excretion (Jamm) was typically
around -0.4 lmol/g/h in juvenile trout, which had been
fasted for 48 h. Following feeding, Jamm increased 2.4-fold
by 2–4 h, and 3.6-fold by 8–10 h (Fig. 1).
When exposed to HEA, unfed fish displayed a reversal
of ammonia flux from a control (no HEA) value of
-0.40 lmol/g/h to ?0.62 lmol/g/h (i.e., net ammonia
uptake) over the first 3 h of exposure (Fig. 2). However,
after 3 h of HEA, these fish were able to re-establish
ammonia excretion to a value not significantly different
from the control, a situation which persisted through
12–24 h despite the continued presence of HEA (Fig. 2).
Therefore, in all subsequent experiments, fed fish were
Time (h)
Control 0-3 3-6 6-9 9-12 12-24
J amm
(μ m
ol/g
/h)
-1.5
-1.0
-0.5
0.0
0.5
1.0 high external ammonia
*
unfed
*
Fig. 2 Ammonia excretion rates (Jamm) in unfed fish during HEA
exposure including rates from a 6-h control using an unfed group of
fish. HEA exposure began at 0 h. Asterisks denote values that are
significantly different from the control value based on a one-way
ANOVA statistical analysis followed by a Dunnett’s post hoc test
against the control value (P \ 0.05, N = 6–8)
J Comp Physiol B
123
exposed to HEA at 4–10 h post-feeding, a time by which
the elevated Jamm response was well established, and
measurements were taken of Jamm at 2-h intervals com-
mencing with the start of HEA exposure, to capture the
time period over which Jamm would be reversed and
ammonia loading would occur in unfed fish.
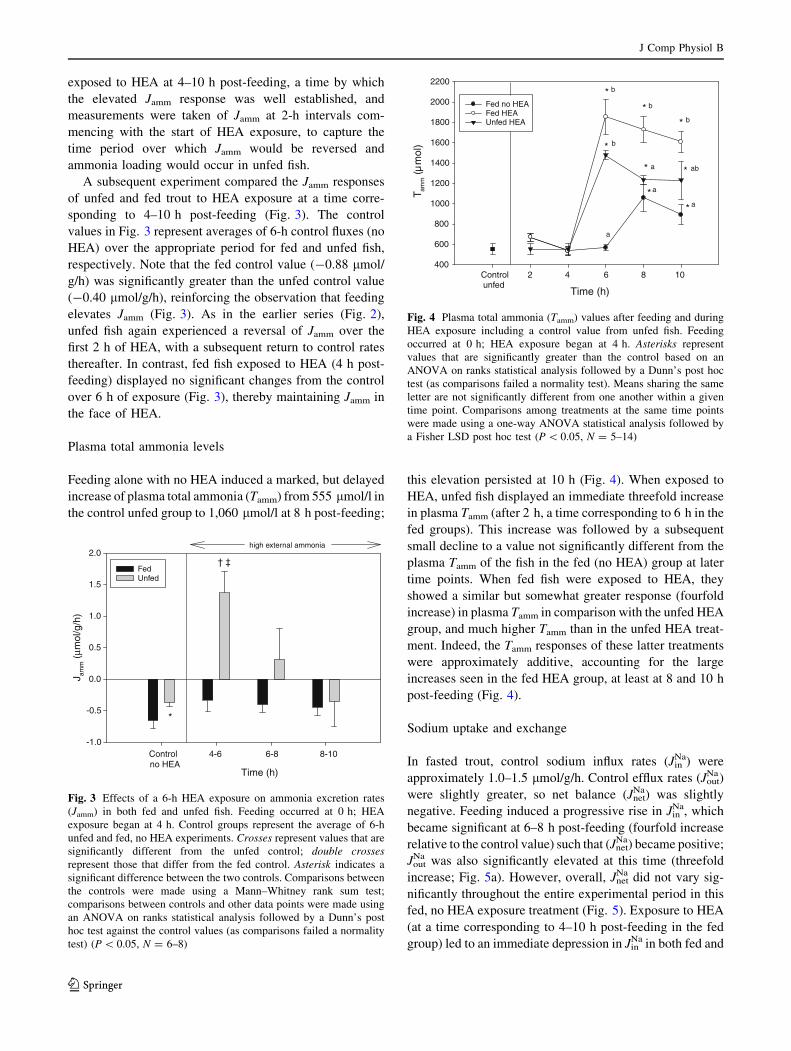
A subsequent experiment compared the Jamm responses
of unfed and fed trout to HEA exposure at a time corre-
sponding to 4–10 h post-feeding (Fig. 3). The control
values in Fig. 3 represent averages of 6-h control fluxes (no
HEA) over the appropriate period for fed and unfed fish,
respectively. Note that the fed control value (-0.88 lmol/
g/h) was significantly greater than the unfed control value
(-0.40 lmol/g/h), reinforcing the observation that feeding
elevates Jamm (Fig. 3). As in the earlier series (Fig. 2),
unfed fish again experienced a reversal of Jamm over the
first 2 h of HEA, with a subsequent return to control rates
thereafter. In contrast, fed fish exposed to HEA (4 h post-
feeding) displayed no significant changes from the control
over 6 h of exposure (Fig. 3), thereby maintaining Jamm in
the face of HEA.
Plasma total ammonia levels
Feeding alone with no HEA induced a marked, but delayed
increase of plasma total ammonia (Tamm) from 555 lmol/l in
the control unfed group to 1,060 lmol/l at 8 h post-feeding;
this elevation persisted at 10 h (Fig. 4). When exposed to
HEA, unfed fish displayed an immediate threefold increase
in plasma Tamm (after 2 h, a time corresponding to 6 h in the
fed groups). This increase was followed by a subsequent
small decline to a value not significantly different from the
plasma Tamm of the fish in the fed (no HEA) group at later
time points. When fed fish were exposed to HEA, they
showed a similar but somewhat greater response (fourfold
increase) in plasma Tamm in comparison with the unfed HEA
group, and much higher Tamm than in the unfed HEA treat-
ment. Indeed, the Tamm responses of these latter treatments
were approximately additive, accounting for the large
increases seen in the fed HEA group, at least at 8 and 10 h
post-feeding (Fig. 4).
Sodium uptake and exchange
In fasted trout, control sodium influx rates (JinNa) were
approximately 1.0–1.5 lmol/g/h. Control efflux rates (JoutNa)
were slightly greater, so net balance (JnetNa) was slightly
negative. Feeding induced a progressive rise in JinNa, which
became significant at 6–8 h post-feeding (fourfold increase
relative to the control value) such that (JnetNa) became positive;
JoutNa was also significantly elevated at this time (threefold
increase; Fig. 5a). However, overall, JnetNa did not vary sig-
nificantly throughout the entire experimental period in this
fed, no HEA exposure treatment (Fig. 5). Exposure to HEA
(at a time corresponding to 4–10 h post-feeding in the fed
group) led to an immediate depression in JinNa in both fed and
Time (h)
Control 4-6 6-8 8-10
J amm (
μ mol
/g/h
)
-1.0
-0.5
0.0
0.5
1.0
1.5
2.0
Fed Unfed
*
† ‡
no HEA
high external ammonia
Fig. 3 Effects of a 6-h HEA exposure on ammonia excretion rates
(Jamm) in both fed and unfed fish. Feeding occurred at 0 h; HEA
exposure began at 4 h. Control groups represent the average of 6-h
unfed and fed, no HEA experiments. Crosses represent values that are
significantly different from the unfed control; double crossesrepresent those that differ from the fed control. Asterisk indicates a
significant difference between the two controls. Comparisons between
the controls were made using a Mann–Whitney rank sum test;
comparisons between controls and other data points were made using
an ANOVA on ranks statistical analysis followed by a Dunn’s post
hoc test against the control values (as comparisons failed a normality
test) (P \ 0.05, N = 6–8)
Time (h)
Control 2 4 6 8 10
T amm (µ
mol
)
400
600
800
1000
1200
1400
1600
1800
2000
2200
Fed no HEAFed HEA Unfed HEA
*
*
*
*
*
*
*
*
a
b
b
a
a
b
a
ab
b
unfed
Fig. 4 Plasma total ammonia (Tamm) values after feeding and during
HEA exposure including a control value from unfed fish. Feeding
occurred at 0 h; HEA exposure began at 4 h. Asterisks represent
values that are significantly greater than the control based on an
ANOVA on ranks statistical analysis followed by a Dunn’s post hoc
test (as comparisons failed a normality test). Means sharing the same
letter are not significantly different from one another within a given
time point. Comparisons among treatments at the same time points
were made using a one-way ANOVA statistical analysis followed by
a Fisher LSD post hoc test (P \ 0.05, N = 5–14)
J Comp Physiol B
123

unfed fish (at 4–6 h), though this decrease was not signifi-
cant (P = 0.230) in the unfed group (Fig. 5b, c). Thereafter,
JinNa tended to recover in both the fed and unfed HEA groups
despite the persistence of HEA. JoutNa values and Jnet
Na tended to
be more negative during HEA in both these groups, but there
was high variability and no significant overall differences
from the control (Fig. 5b, c).
Gill mRNA expression
In all three treatment groups, significant increases in the
mRNA expression levels of transporters of interest in the
gills were not seen until times corresponding to 6 and 10 h
post-feeding (i.e., 2 and 6 h of HEA; Fig. 6a, b, c). There
were no significant changes at 2 or 4 h.
Elevations in Rhcg2 expression levels were significant
in all three treatments at times corresponding to 6 and 10 h
post-feeding (i.e., 2 and 6 h of HEA; Fig. 6a). The HEA-
exposed groups exhibited generally greater upregulation
(fed HEA = 23- and 93-fold increases; unfed HEA = 111-
and 75-fold increases over the control at 6 and 10 h,
respectively) than in the fed, no HEA control group
(32- and 30-fold increases over the control at 6 and 10 h,
respectively; Fig. 6a).
There was also a sixfold increase in NHE-2 mRNA
expression at 6 h in fed fish not exposed to HEA; the mean
value at 10 h remained about the same but was no longer
significantly different from the control (P = 0.08) because
of increased variability (Fig. 6b). In unfed fish, exposure to
HEA caused a significant increase in the expression of
NHE-2 at 6 and 10 h (18- and 8-fold, respectively),
whereas fed fish exposed to HEA displayed a tenfold
increase only after 10 h (Fig. 6b).
The unfed HEA treatment was the only group to display
a significant increase (sevenfold) in H?ATPase mRNA
expression at 6 h; however, the increase in the fed only
treatment was close to being significant (P = 0.07;
Fig. 6c). After 10 h, all treatment groups showed signifi-
cant increases in H?ATPase expression (10-, 11-, and
10-fold for fed no HEA, fed HEA, and unfed HEA groups,
respectively; Fig. 6c).
Branchial H?-ATPase activity
Branchial H?-ATPase activity increased significantly by
about 1.7-fold at 4 h after the meal in the fed fish (Fig. 7).
Thereafter, activity tended to decline, with a tendency for
greater decreases in the two HEA treatments. However at 6
and 10 h, none of these values were significantly different
from the control or from one another.
-4
-2
0
2
4
6
InfluxEffluxNet Flux
*
*
AJN
a (μ m
ol/g
/h)
-4
-2
0
2
4
6
high externalammonia
B
*
Time (h)Control 0-2 2-4 4-6 6-8 8-10
-4
-2
0
2
4
6
C
Fig. 5 Effects of a feeding, b feeding combined with a 6-h HEA
exposure, and c exposure to 6 h of HEA alone on unidirectional (JinNa,
upward light gray bars; JoutNa, downward dark gray bars) and net rates
(JnetNa, black bars) of sodium flux over a 10-h time period. The rates
from a 6-h control using an unfed group of fish are included. Feeding
occurred at time 0; HEA began at 4 h. Asterisks denote values that are
significantly different from their respective control values based on a
one-way ANOVA statistical analysis followed by a Dunnett’s post
hoc test against the control value. In the case of a failed normality
test, an ANOVA on ranks statistical analysis was used followed by a
Dunn’s method post hoc test (P \ 0.05, n = 8)
J Comp Physiol B
123

Discussion
Overview
Two of our original three hypotheses were confirmed.
Firstly, feeding did cause upregulation of Rhcg2, NHE-2,
and H?-ATPase mRNA expression in the gills, a transient
increase in branchial H?-ATPase activity, and a transient
rise in Na? influx. Though the mRNA expression data do
not explicitly demonstrate that the expression or activity of
the associated proteins increased, they certainly suggest a
role for these proteins during feeding and in response to
HEA as demonstrated in other treatments from this study.
Notably, for one gene (H?-ATPase), we recorded both
mRNA expression and functional activity and found a
marked temporal disconnect between the two. Secondly,
after feeding, trout were able to excrete ammonia against
HEA more effectively than unfed fish. With respect to our
third hypothesis, the results are complex. HEA did inhibit
Na? influx as predicted, though the effect was significant
only in the fed fish. Ammonia excretion was not inhibited
at all by HEA in fed fish, so in a sense ‘‘recovery’’ of
ammonia excretion in the face of HEA was more rapid in
fed fish. However, contrary to prediction, there was no
0
20
40
60
80
100
120
140
160
Col 10 Col 16 Rh Col 22
mR
NA
Exp
ress
ion
0
5
10
15
20
25
30
Fed no HEAFed HEAUnfed HEAControl
Time (h)
Control 2 4 6 100
5
10
15
20
25
30
**
*
*
*
*
a
a
b
a
a
a
*
*
*
*
a
ab
b
a
a
a
b
a
b
a
a
a
*
**
*
H+-ATPaseC
A Rhcg2
NHE-2B
Fig. 6 mRNA expression of a Rhcg2, b NHE-2, and c H?-ATPase
relative to total RNA in the gills of unexposed (no HEA) fed fish as
well as fed and unfed fish exposed to HEA. The control value
represents gene expression in the gills of unfed, no HEA fish.
Sampling for both fed groups (HEA and non-HEA) took place at 2, 4,
6, 8, and 10 h. The 2 and 4 h time points (where fish are yet to be
exposed to HEA) are the same for each of these groups, as the
treatment up to these times was identical, and so only a single value is
shown at each of these time points. Sampling for the unfed HEA
group took place only at 6, 8, and 10 h, as 2 and 4 h points for this
treatment would represent the unfed, no HEA control. Feeding
occurred at 0 h; HEA exposure began at 4 h. Asterisks denote values
that are significantly different from the control levels based on an
ANOVA on ranks statistical analysis followed by a Dunn’s post hoc
test (as all comparisons failed a normality test). Means sharing the
same letter are not significantly different from one another within a
given time point. Since all comparisons among treatments at a given
time point failed a normality test, all comparisons were made using an
ANOVA on ranks statistical analysis followed by a Dunn’s post hoc
test (P \ 0.05, N = 5–6)
Time (h)Control 2 4 6 10
Act
ivity
(μ m
ol A
DP
/mg
prot
ein/
h)
0.0
0.2
0.4
0.6
0.8
1.0
1.2Fed no HEAFed HEAUnfed HEA
a
a
aa
a
a
*
Fig. 7 H?-ATPase activity in the gills of unexposed (no HEA) fed
fish as well as fed and unfed fish exposed to HEA. The control value
represents gene expression in the gills of unfed, no HEA fish.
Sampling for both fed groups (HEA and non-HEA) took place at 2, 4,
6, 8, and 10 h. The 2 and 4 h time points (where fish are yet to be
exposed to HEA) are the same for each of these groups, as the
treatment up to these times was identical, and so only a single value is
shown at each of these time points. Sampling for the unfed HEA
group took place only at 6, 8, and 10 h, as 2 and 4 h points for this
treatment would represent the unfed, no HEA control. Feeding
occurred at 0 h; HEA exposure began at 4 h. Asterisks denote values
that are significantly different from the control levels based on an
ANOVA on ranks statistical analysis followed by a Dunn’s post hoc
test (as all comparisons failed a normality test). Means sharing the
same letter are not significantly different from one another within a
given time point (P \ 0.05, N = 5–6)
J Comp Physiol B
123
difference in the rates at which Na? influx recovered in the
face of continued HEA between fed and unfed fish. As
outlined below, we believe the interpretation of these
results may be more complicated than the original ideas
behind our hypotheses, involving important roles for sim-
ple diffusion, for changing PNH3 gradients, for non-geno-
mic modification of transporter activity, and for uncoupling
of Na? uptake from H? and ammonia efflux during HEA.
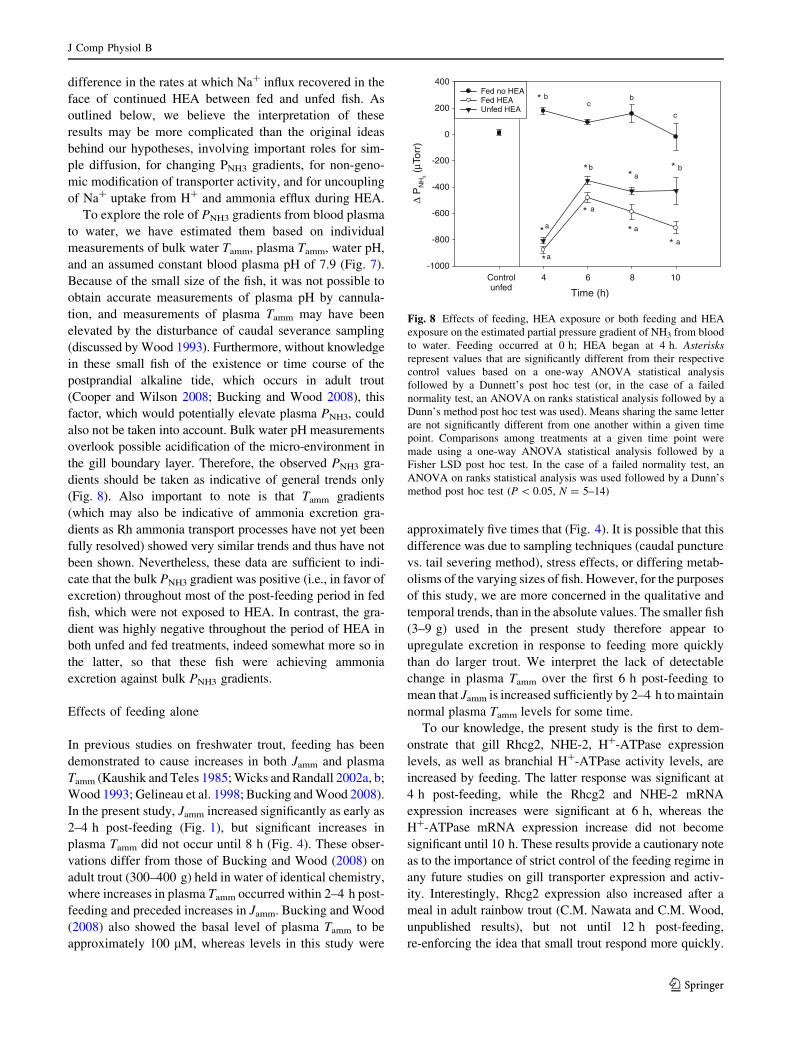
To explore the role of PNH3 gradients from blood plasma
to water, we have estimated them based on individual
measurements of bulk water Tamm, plasma Tamm, water pH,
and an assumed constant blood plasma pH of 7.9 (Fig. 7).
Because of the small size of the fish, it was not possible to
obtain accurate measurements of plasma pH by cannula-
tion, and measurements of plasma Tamm may have been
elevated by the disturbance of caudal severance sampling
(discussed by Wood 1993). Furthermore, without knowledge
in these small fish of the existence or time course of the
postprandial alkaline tide, which occurs in adult trout
(Cooper and Wilson 2008; Bucking and Wood 2008), this
factor, which would potentially elevate plasma PNH3, could
also not be taken into account. Bulk water pH measurements
overlook possible acidification of the micro-environment in
the gill boundary layer. Therefore, the observed PNH3 gra-
dients should be taken as indicative of general trends only
(Fig. 8). Also important to note is that Tamm gradients
(which may also be indicative of ammonia excretion gra-
dients as Rh ammonia transport processes have not yet been
fully resolved) showed very similar trends and thus have not
been shown. Nevertheless, these data are sufficient to indi-
cate that the bulk PNH3 gradient was positive (i.e., in favor of
excretion) throughout most of the post-feeding period in fed
fish, which were not exposed to HEA. In contrast, the gra-
dient was highly negative throughout the period of HEA in
both unfed and fed treatments, indeed somewhat more so in
the latter, so that these fish were achieving ammonia
excretion against bulk PNH3 gradients.
Effects of feeding alone
In previous studies on freshwater trout, feeding has been
demonstrated to cause increases in both Jamm and plasma
Tamm (Kaushik and Teles 1985; Wicks and Randall 2002a, b;
Wood 1993; Gelineau et al. 1998; Bucking and Wood 2008).
In the present study, Jamm increased significantly as early as
2–4 h post-feeding (Fig. 1), but significant increases in
plasma Tamm did not occur until 8 h (Fig. 4). These obser-
vations differ from those of Bucking and Wood (2008) on
adult trout (300–400 g) held in water of identical chemistry,
where increases in plasma Tamm occurred within 2–4 h post-
feeding and preceded increases in Jamm. Bucking and Wood
(2008) also showed the basal level of plasma Tamm to be
approximately 100 lM, whereas levels in this study were
approximately five times that (Fig. 4). It is possible that this
difference was due to sampling techniques (caudal puncture
vs. tail severing method), stress effects, or differing metab-
olisms of the varying sizes of fish. However, for the purposes
of this study, we are more concerned in the qualitative and
temporal trends, than in the absolute values. The smaller fish
(3–9 g) used in the present study therefore appear to
upregulate excretion in response to feeding more quickly
than do larger trout. We interpret the lack of detectable
change in plasma Tamm over the first 6 h post-feeding to
mean that Jamm is increased sufficiently by 2–4 h to maintain
normal plasma Tamm levels for some time.
To our knowledge, the present study is the first to dem-
onstrate that gill Rhcg2, NHE-2, H?-ATPase expression
levels, as well as branchial H?-ATPase activity levels, are
increased by feeding. The latter response was significant at
4 h post-feeding, while the Rhcg2 and NHE-2 mRNA
expression increases were significant at 6 h, whereas the
H?-ATPase mRNA expression increase did not become
significant until 10 h. These results provide a cautionary note
as to the importance of strict control of the feeding regime in
any future studies on gill transporter expression and activ-
ity. Interestingly, Rhcg2 expression also increased after a
meal in adult rainbow trout (C.M. Nawata and C.M. Wood,
unpublished results), but not until 12 h post-feeding,
re-enforcing the idea that small trout respond more quickly.
Time (h)
Control 4 6 8 10
Δ P
NH
3 (μ T
orr)
-1000
-800
-600
-400
-200
0
200
400Fed no HEAFed HEAUnfed HEA
unfed
* b
a
a
a
a
b
b
c
*
*
**
a
** a
* b
c
*
Fig. 8 Effects of feeding, HEA exposure or both feeding and HEA
exposure on the estimated partial pressure gradient of NH3 from blood
to water. Feeding occurred at 0 h; HEA began at 4 h. Asterisksrepresent values that are significantly different from their respective
control values based on a one-way ANOVA statistical analysis
followed by a Dunnett’s post hoc test (or, in the case of a failed
normality test, an ANOVA on ranks statistical analysis followed by a
Dunn’s method post hoc test was used). Means sharing the same letter
are not significantly different from one another within a given time
point. Comparisons among treatments at a given time point were
made using a one-way ANOVA statistical analysis followed by a
Fisher LSD post hoc test. In the case of a failed normality test, an
ANOVA on ranks statistical analysis was used followed by a Dunn’s
method post hoc test (P \ 0.05, N = 5–14)
J Comp Physiol B
123

We interpret these as responses to ‘‘natural’’ internal ammo-
nia loading associated with de-amination of absorbed amino
acids and proteins, comparable to those seen when trout were
infused with exogenous ammonium salts (Nawata and Wood
2009), though it is possible that the complex hormonal events
associated with feeding (Buddington and Krogdahl 2004)
may have played a modulating role.
The elevation of Jamm by 2–4 h post-feeding (Fig. 1) and
the maintenance of normal levels of plasma Tamm through
6 h (Fig. 4) suggest that the branchial ammonia excretion
mechanism(s) were quickly upregulated after feeding. This
is not obvious from the mRNA expression of the putative
transport proteins, since at 2 and 4 h post-feeding there were
no significant increases in Rhcg2, NHE-2, or H?-ATPase
(Fig. 6). However, these data represent only the messages
for the proteins, and it was instructive to find that branchial
H?-ATPase activity had increased significantly by 4 h post-
feeding, long before the significant increase in mRNA
expression at 10 h. Indeed, it is very possible that non-
genomic upregulation of the activity of existing proteins was
sufficient for early elevation of Jamm, prior to later, larger
increases in Jamm, which may have been due to the signifi-
cantly increased plasma Tamm levels occurring at 8 h
(Figs. 1, 4) associated with slow processing of the dietary
N-load. In fact, Seshadri et al. (2006a) demonstrated that
when acidosis is induced in rats, a condition that is known to
cause an increase in urinary ammonia excretion, Rhcg protein
expression increased in several areas of the kidney though
mRNA expression of Rhcg remained unchanged. In a fol-
low-up study, it was demonstrated that acidosis induced an
increase in apical protein expression of Rhcg and a decrease
in cytosolic protein expression, suggesting that these pro-
teins are present in vesicles and are inserted during acidosis
(Seshadri et al. 2006b). This, together with the early tran-
sient increase in H?-ATPase activity at 4 h, is a potential
explanation for the increase in ammonia excretion capacity,
which occurs in the absence of an increase in mRNA
expression demonstrated here. The delayed and larger
increase in Jamm seen 8 h after a meal (Fig. 1) was pre-
sumably associated with increases in protein synthesis
associated with increases in Rhcg2 and NHE-2mRNA levels
at 6 h post-feeding (Fig. 6a, b). It was not until 10 h post-
feeding that a significant increase in H?-ATPase mRNA
also occurred (Fig. 6c), perhaps a response to the increase in
plasma Tamm that occurred at 8 h (Fig. 4). A generally
higher bulk PNH3 gradient favoring excretion was seen
throughout most of the post-feeding period (Fig. 8) and may
also have contributed to the sustained elevation in Jamm, by
either Rh-mediated transport (Nawata et al. 2010) or simple
diffusion (Kelly and Wood 2001; Tsui et al. 2009). If a
postprandial alkaline tide (Bucking and Wood 2008; Cooper
and Wilson 2008) occurs in these juvenile trout, then the
contribution of this component would be increased.
Also critical to the induction of elevated Jamm was the
observed transient increase in JinNa, which became signifi-
cant at 6 h after the meal (Fig. 6a). This transient increase,
which may be related to a sustained increase in Jamm, could
be an indication of the rather loose coupling between these
processes. In situ studies of MRCs in the larvae of Japanese
medaka indicated that ammonia excretion through Rhcg
(Rhcg1) was dependent on H? excretion by NHE-3, which
appeared to be tightly linked to Na? uptake (Wu et al.
2010), These were similar, but not identical to the findings
of Tsui et al. (2009) where in vitro studies on cultured trout
gill epithelia indicated that Rhcg-2, NHE-2, and H?-
ATPase all played a role in the linkage of a portion of
ammonia excretion to Na? uptake, whereas a portion
occurred by simple diffusion along PNH3 gradients. In vivo,
this increase in JinNa probably occurred in response to
internal ammonia loading associated with feeding, since
the infusion of exogenous ammonium salts is also known
to cause an increase in JinNa in intact fish (Kerstetter and
Keeler 1976; Maetz and Garcia-Romeu 1964; Maetz 1973;
Kerstetter and Keeler 1976; Wilson et al. 1994; Salama
et al. 1999). The increase in branchial H?-ATPase activity
seen at 4 h post-feeding may also have played a role here.
To our knowledge, this is the first demonstration that
feeding a normal meal causes an increase in JinNa in fresh-
water fish; notably, JoutNa also increased, so Na? homeostasis
was preserved (Fig. 6a). Previous studies have instead
focused on the inhibition of JinNa and large elevations of Jout
Na,
which are associated with ingestion of experimental high-
NaCl meals (Smith et al. 1995; Pyle et al. 2003).
Overall, these observations and the increases in mRNA
expression of NHE-2 (Fig. 6b) and H?ATPase (Fig. 6c)
demonstrate that the handling of ammonia post-feeding is
likely to be, at least in part, coupled to Na? uptake. Thus, on
an overall basis, feeding causes similar responses in gill
mRNA expression patterns, JinNa, and Jamm to ammonium salt
infusion (Wilson et al. 1994; Salama et al. 1999; Nawata and
Wood 2009). These in vivo results support the ‘‘Na?/NH4?
exchange complex’’ model of Rhcg2, NHE-2, H?ATPase
function proposed by Wright and Wood (2009), which
loosely links Rhcg2-mediated NH3 excretion to active Na?
uptake through boundary layer acidification. As originally
proposed by Heisler (1990), there may be a plasma Tamm
threshold above which this ‘‘active’’ mechanism cuts in.
Effects of HEA exposure in unfed fish
Exposure to HEA led to an initial reversal of ammonia
excretion (Figs. 2, 3) as earlier demonstrated by Wilson
et al. (1994) and Nawata et al. (2007) in unfed adult trout.
In response to HEA exposure, there was a dramatic
increase in plasma Tamm, which was rapid (within 2 h),
compared to the delayed and less prominent increase seen
J Comp Physiol B
123
in response to feeding (within 8 h; Fig. 4). This increase
occurred in conjunction with the reversal of ammonia
excretion during HEA (Figs. 2, 3). A trend of decreasing
plasma Tamm ensued (Fig. 4) as unfed fish were able to re-
establish ammonia excretion by 4–6 h of exposure to HEA
(Fig. 3). This ability to overcome a large inwardly directed
PNH3 gradient (Fig. 7) may be attributed to the induction of
branchial ammonia excretion mechanisms, which are
potentially active. Exposure to HEA led to an increase in
the mRNA expressions of Rhcg2, NHE-2, and H?-ATPase
mRNA after only 2 h of exposure (corresponding to the 6 h
time point in Fig. 6), similar to responses to ammonium
salt infusion (Nawata and Wood 2009). These increases
were more immediate than the increases seen in response to
feeding, which did not occur until 6–10 h after the meal
(Fig. 6). Notably, these responses to HEA occurred more
rapidly than in adult trout faced with the same HEA
challenge in identical water chemistry (Nawata et al. 2007).
In the adult trout, similar increases in Rhcg2 and H?-
ATPase mRNA expression were not seen until 12–48 h,
and re-establishment of positive Jamm did not occur until
12–24 h (Nawata et al. 2007), again highlighting the more
rapid responses of these juvenile trout.
High environmental ammonia exposure tended to
depress JinNa, though not by a significant margin (Fig. 5c).
This response contrasts with the response to feeding alone,
where JinNa (likely coupled to boundary layer acidification)
was clearly increased (Fig. 5a) as a putative mechanism
enhancing Jamm (Fig. 1). This inhibition of JinNa by HEA is
similar to results reported by Twitchen and Eddy (1994)
and Wilson et al. (1994) and may be attributed to compe-
tition by NH4? with Na? for external binding sites on Na?
transport proteins (Na? channels and/or NHE-2). Whether
this simply slows down Na? uptake, or whether it results in
greater NH4? uptake (i.e., increased ammonia loading) in
substitution for Na? uptake through these pathways is
unknown. However, the latter would clearly be maladap-
tive, otherwise why then upregulate NHE-2 and H?-ATP-
ase mRNA during HEA exposure (Fig. 6b, c)? A more
likely scenario is that Na? influx is slowed, but H? efflux is
maintained or increased. This scenario envisages that Na?
uptake may be uncoupled from H? flux and ammonia
excretion. Using low doses of amiloride (10-5 M) in the
brown trout, Salmo trutta, Nelson et al. (1997) demonstrated
that JinNa could be reduced by 75% while H? efflux and Jamm
continued at control rates. We speculate that during HEA
exposure, NH4? acts like low dose amiloride, such that H?
efflux and boundary layer acidification for trapping of
Rhcg2-mediated NH3 efflux can still occur. By this scenario,
upregulation of NHE-2 would serve to maintain some
degree of Na? uptake and linked H? excretion, while H?-
ATPase (now uncoupled from Na? uptake), together with
CO2 hydration, would provide the bulk of the H? efflux and
acid trapping mechanism. H?-ATPase mRNA was upregu-
lated (Fig. 6c), whereas H?-ATPase activity remained at
control levels though with a non-significant tendency to
decline in HEA (Fig. 7). Presumably, H?-ATPase activity
would increase over the longer term if HEA were main-
tained, as reported by Nawata et al. (2007) in adult trout.
Protective effects of feeding against HEA exposure
Unlike unfed fish exposed to HEA, fed fish were able to
immediately maintain normal ammonia excretion rates
when exposed to HEA, demonstrating that feeding has a
protective effect against HEA exposure (Fig. 3). There was
no initial reversal of Jamm to negative values. These fed
trout also displayed increases in plasma Tamm during HEA
similar to or greater than those seen in the unfed, HEA
group, reflecting the additive effect of feeding (Fig. 4).
However, on an individual fish basis, the bulk PNH3 gra-
dient against which they were excreting was in fact even
more negative than in the unfed HEA group (Fig. 7), owing
to the fact that they were actively excreting ammonia into
the water from the beginning of the exposure, effectively
increasing the PNH3 gradient by increasing water Tamm.
Contrary to our original ideas (see ‘‘Introduction’’), this
increased ability to excrete ammonia against the gradient
cannot be attributed to prior upregulation of Rhcg2,
NHE-2, and H?-ATPase mRNA expression associated with
feeding, for two reasons. Firstly, after 2 h of HEA (6 h time
point in Fig. 6), upregulation of message in these fed fish
exposed to HEA was quantitatively equal to or less than in
fed fish, which had not been exposed to HEA at the same
time. Secondly, compared to unfed fish exposed to HEA,
fed fish exposed to HEA demonstrated a delayed upregu-
lation of mRNA expression of NHE-2 and H?-ATPase,
which was never greater in magnitude (Fig. 6b, c). Though
the upregulation of Rhcg2 mRNA expression was not
delayed, it also was not greater in magnitude than that seen
in unfed fish exposed to HEA (Fig. 6a).
We speculate that the explanation for this apparent par-
adox lies in the upregulated ammonia excretion capacity
seen early on in response to feeding alone (within 2–4 h after
the meal), without mRNA recruitment, as discussed earlier.
It is likely that by the time of HEA exposure (4 h post-
feeding), fed fish already possessed increased ammonia
transport activity levels in their gill cells due to non-genomic
modification. Note for example the significant increase in
branchial H?-ATPase activity at 4 h post-feeding (Fig. 7),
prior to any significant increase in H?-ATPase message
(Fig. 6c). Any later protein synthesis associated with mRNA
increases would likely add to this activity. This may be the
explanation for the finding of Wicks and Randall (2002a)
that feeding protects rainbow trout from ammonia toxicity,
elevating the LC50 during the first 24 h of HEA exposure.
J Comp Physiol B
123

Unlike the unfed HEA group, fed fish exposed to HEA
displayed a depression of JinNa, which was significant
(Fig. 5b), and recovery of JinNa was certainly no faster even
though Jamm was well maintained (Fig. 3). It is unclear
why the inhibitory effect of high NH4? should be greater in
fed fish; perhaps, these trout were relying more on NHE-2
at this time compared to unfed fish. Their branchial H?-
ATPase activity levels also tended to be lower (Fig. 7).
Regardless, these data demonstrate that upregulation of
Na? influx is not a requirement for ‘‘active’’ ammonia
excretion against the PNH3 gradient during HEA exposure.
The depression of JinNa may seem counter-intuitive given
that expressions of both NHE-2 (Fig. 6b) and H?-ATPase
mRNA (Fig. 6c) were increased significantly at 6 h after
exposure to HEA (10 h after the meal). However, as in the
case of the unfed HEA group, it is likely that NH4? was
competing for Na? binding sites, such that H? efflux and
ammonia excretion were then uncoupled from Na? uptake
at that time. Perhaps with longer HEA exposure, a more
complete recovery or increase of JinNa would have been seen
in both HEA treatments.
Conclusions
Rhcg2, NHE-2, and H?-ATPase all appear to play signif-
icant roles in ammonia excretion in trout in vivo, in
accordance with the ‘‘Na?/NH4? exchange complex’’
model of Wright and Wood (2009), but simple diffusive
flux along the PNH3 gradient is also important. Juvenile
trout can elevate ammonia excretion more rapidly than
adult trout in response to feeding or HEA. After feeding,
the ammonia excretion capacity of the gills increases
before elevated Rhcg2, NHE-2, and H?-ATPase mRNA
levels are seen, suggesting non-genomic activation of
existing transport protein function. This confers a greater
capacity for fed fish to excrete ammonia against a bulk
PNH3 gradient in the face of HEA. Later after feeding,
elevated Na? influx appears to play an important role in
augmenting ammonia excretion, but this is not the case
during HEA exposure. The influx of Na? is loosely tied to
an efflux of H? (either by NHE-2 or H?-ATPase) and it is
this efflux of H?, not the influx of Na?, which is respon-
sible for facilitating ammonia excretion. This becomes
evident during HEA where Na? influx is depressed even
though Rhcg2, NHE-2, and H?-ATPase are all upregulated
and ammonia excretion is restored: i.e., Na? influx is
uncoupled from H? and ammonia efflux. In future studies,
it would be interesting to examine ammonia and net H?
excretion during HEA when Na? is not present in the
water. This would quantify whether or not ammonia
excretion during HEA (in fed or unfed fish) can, in fact, be
completely uncoupled from Na? influx. Studies examining
the post-transcriptional regulation of the implicated trans-
porters will also be essential to realizing the complete
model for ammonia excretion during feeding and HEA
exposure. The temporal disconnect between recorded
changes in H?-ATPase mRNA expression and functional
activity observed in the present study underscores the need
for such studies. Finally, the use of pharmacological
blockers to inhibit H? excretion (bafilomycin, EIPA, and
acetazolamide) during HEA would be useful in determin-
ing the relative contribution to ammonia excretion of H?-
ATPase, NHE-2, and carbonic anhydrase, respectively.
Acknowledgments This study was funded by an NSERC Discovery
Grant to CMW, who is also supported by the Canada Research Chair
Program. The experiments were approved by the institutional animal
care committee at McMaster University.
References
Avella M, Bornancin M (1989) A new analysis of ammonia and
sodium transport through the gills of the freshwater rainbow
trout (Salmo gairdneri). J Exp Biol 142:155–175
Bakouh N, Benjelloun F, Hulin P, Brouillard F, Edelman A, Cherif-
Zahar B, Planelles G (2004) NH3 is involved in the NH4?
transport induced by the functional expression of the human Rh
C Glycoprotein. J Biol Chem 279:15975–15983
Bucking C, Wood CM (2008) The alkaline tide and ammonia
excretion after voluntary feeding in freshwater rainbow trout.
J Exp Biol 211:2533–2541
Buddington RK, Krogdahl A (2004) Hormonal regulation of the fish
gastrointestinal tract. Comp Biochem Physiol A 139:261–271
Bustin SA (2000) Absolute quantification of mRNA using real-time
reverse transcription polymerase chain reaction assays. J Mol
Endocrinol 25:169–193
Bustin SA (2002) Quantification of mRNA using real-time reverse
transcription PCR (RT-PCR): trends and problems. J Mol
Endocrinol 29:23–39
Cameron JN, Heisler N (1983) Studies of ammonia in the rainbow
trout: physico-chemical parameters, acid–base behaviour, and
respiratory clearance. J Exp Biol 105:107–125
Cooper CA, Wilson RW (2008) Post-prandial alkaline tide in
freshwater rainbow trout: effects of meal anticipation on
recovery from acid–base and ion regulatory disturbances.
J Exp Biol 211:2542–2550
Fromm PO (1963) Studies on renal and extra-renal excretion in a
freshwater teleost, Salmo gairdneri. Comp Biochem Physiol
10:121–128
Fromm PO, Gillette JR (1968) Effect of ambient ammonia on blood
ammonia and nitrogen excretion of rainbow trout (Salmogairdneri). Comp Biochem Physiol 26:887–896
Gelineau A, Medale F, Boujard T (1998) Effect of feeding time on
postprandial nitrogen excretion and energy expenditure in
rainbow trout. J Fish Biol 52:655–664
Heisler N (1990) Mechanisms of ammonia elimination in fishes. In:
Truchot JP, Lahlou B (eds) Animal nutrition and transport
processes. Transport, respiration and excretion: comparative and
environmental aspects. Comp Physiol, vol 2, Karger, Basel,
pp 137–151
Hung CYC, Tsui KNT, Wilson JM, Nawata CM, Wood CM, Wright
PA (2007) Rhesus glycoprotein gene expression in the mangrove
killfish Kryptolebias marmoratus exposed to elevated environ-
mental ammonia levels and air. J Exp Biol 210:2419–2429
J Comp Physiol B
123

Ivanis G, Esbaugh AJ, Perry SF (2008) Branchial expression and
localization of SLC9A2 and SLC9A3 sodium/hydrogen
exchangers and their possible role in acid–base regulation in
freshwater rainbow trout (Oncorhynchus mykiss). J Exp Biol
211:2467–2477
Kaushik SJ, Teles AD (1985) Effect of digestible energy on nitrogen
and energy balance in rainbow trout. Aquaculture 50:89–101
Kelly SP, Wood CM (2001) The cultured branchial epithelium of the
rainbow trout as a model for diffusive fluxes of ammonia across
the fish gill. J Exp Biol 204:4115–4124
Kerstetter TH, Keeler M (1976) On the interaction of NH4? and Na?
fluxes in the isolated trout gill. J Exp Biol 64:517–527
Khademi S, O’Connell J, Remis J, Robles-Colmenares Y, Miercke LJW,
Stroud RM (2004) Mechanism of ammonia transport by Amt/MEP/
Rh: Structure of AmtB at 1.35 A. Science 305:1587–1596
Li X, Jayachandran S, Nguyen HHT, Chan MK (2007) Structure of
the Nitrosomonas europaea Rh protein. Proc Natl Acad Sci USA
104:19279–19284
Lin H, Randall D (1991) Evidence for the presence of an electrogenic
proton pump on the trout gill epithelium. J Exp Biol 161:119–134
Lin H, Randall D (1993) H?-ATPase in crude homogenates of fish
gill tissue: inhibitor sensitivity and environmental and hormonal
regulation. J Exp Biol 180:163–174
Lin H, Pfeiffer DC, Vogl AW, Pan J, Randall DJ (1994) Immuno-
localization of H?-ATPase in the gill epithelia of rainbow trout.
J Exp Biol 195:169–183
Maetz J (1956) Les echanges de sodium chez le poisson Carassiusauratus L. Action d’un inhibiteur de l’anhydrase carbonique.
J Physiol Paris 48:1085–1099
Maetz J (1972) Branchial sodium exchange and ammonia excretion in
the goldfish Carassius auratus. Effects of ammonia loading and
temperature changes. J Exp Biol 56:601–620
Maetz J (1973) Na?/NH4?, Na?/H? exchanges and NH3 movement
across the gill of Carassius auratus. J Exp Biol 58:255–275
Maetz J, Garcia-Romeu F (1964) The mechanism of sodium and
chloride uptake by the gills of fresh-water fish, Carassiusauratus: II. Evidence for NH4
?/Na? and HCO3-/Cl- exchanges.
J Gen Physiol 47:1209–1227
Marini AM, Urrestarazu A, Beauwens R, Andre B (1997) The Rh
(Rhesus) blood group polypeptides are related to NH4? trans-
porters. Trends Biochem Sci 22:460–461
Nakada T, Hoshijima K, Esaki M, Nagayoshi S, Kawakami K, Hirose
S (2007a) Localization of ammonia transporter Rhcg1 in
mitochondrion-rich cells of yolk sac, gill, and kidney of
zebrafish and its ionic strength-dependent expression. Am J
Physiol Regul Integr Comp Physiol 293:R1743–R1753
Nakada T, Westhoff CM, Kato A, Hirose S (2007b) Ammonia
secretion from fish gills depends on a set of Rh glycoproteins.
FASEB J 21:1067–1074
Nawata CM, Wood CM (2008) The effects of CO2 and external
buffering on ammonia excretion and Rhesus glycoprotein
mRNA expression in rainbow trout. J Exp Biol 211:3226–3236
Nawata CM, Wood CM (2009) mRNA expression analysis of the
physiological responses to ammonia infusion in rainbow trout.
J Comp Physiol B 179:799–810
Nawata CM, Hung CYC, Tsui TKN, Wilson JM, Wright PA, Wood
CM (2007) Ammonia excretion in rainbow trout (Oncorhynchusmykiss): evidence for Rh glycoprotein and H?-ATPase involve-
ment. Physiol Genomics 31:463–474
Nawata CM, Wood CM, O’Donnell MJ (2010) Functional character-
ization of Rhesus glycoproteins from an ammoniotelic teleost,
the rainbow trout, using oocyte expression and SIET analysis.
J Exp Biol 213:1049–1059
Nelson ID, Potts WTW, Huddart H (1997) The use of amiloride to
uncouple branchial sodium and proton fluxes in the brown trout,
Salmo trutta. J Comp Physiol B 167:123–128
Parks SK, Tresguerres M, Goss GG (2007) Interactions between Na?
channels and Na?-HCO3- cotransporters in the freshwater fish
gill MR cell: a model for transepithelial Na? uptake. Am J
Physiol Cell Physiol 292:935–944
Payan P (1978) A study of the Na?/NH4? exchange across the gill of
the perfused head of the trout (Salmo gairdneri). J Comp Physiol
124:181–188
Perry SF, Furimsky M, Bayaa M, Georgalis T, Shahsavarani A,
Nickerson JG, Moon TW (2003) Integrated responses of Na?/
HCO3- cotransporters and V-type H?-ATPases in the fish gill
and kidney during respiratory acidosis. Biochim Biophys Acta
30:175–184
Pyle GG, Kamunde CN, McDonald DG, Wood CM (2003) Dietary
sodium inhibits aqueous copper uptake in rainbow trout
(Oncorhynchus mykiss). J Exp Biol 206:609–618
Randall DJ, Wright PA (1987) Ammonia distribution and excretion in
fish. Fish Physiol Biochem 3:107–120
Salama A, Morgan IJ, Wood CM (1999) The linkage between Na?
uptake and ammonia excretion in rainbow trout: kinetic analysis,
the effects of (NH4)2SO4 and NH4HCO3 infusion and the
influence of gill boundary layer pH. J Exp Biol 202:697–709
Scott GR, Claiborne JB, Edwards SL, Schulte PM, Wood CM (2005)
Gene expression after freshwater transfer in gills and opercular
epithelia of killifish: insight into divergent mechanisms of ion
transport. J Exp Biol 208:2719–2729
Seshadri RM, Klein JD, Kozlowski S, Sands JM, Kim YH, Han KH,
Handlogten ME, Verlander JW, Weiner ID (2006a) Renal
expression of the ammonia transporters, Rhbg and Rhcg, in
response to chronic acidosis. Am J Physiol Renal Physiol
290:397–408
Seshadri RM, Klein JD, Smith K, Sands JM, Handlogten ME,
Verlander JW, Weiner ID (2006b) Changes in subcellular
distribution of the ammonia transporter, Rhcg, in response to
chronic metabolic acidosis. Am J Physiol Renal Physiol
290:1443–1452
Smith HW (1929) The excretion of ammonia and urea by the gills of
fish. J Biol Chem 81:727–742
Smith NF, Eddy FB, Talbot C (1995) Effect of dietary salt load on
transepithelial Na? exchange in freshwater rainbow trout
(Oncorhynchus mykiss). J Exp Biol 198:2359–2364
Sullivan GV, Fryer JN, Perry SF (1995) Immunolocalization of
proton pumps (H?-ATPase) in pavement cells of rainbow trout
gill. J Exp Biol 198:2619–2629
Tsui TKN, Hung CYC, Nawata CM, Wilson JM, Wright PA, Wood
CM (2009) Ammonia transport in cultured gill epithelium of
freshwater rainbow trout: the importance of Rhesus glycopro-
teins and the presence of an apical Na?/NH4? exchange
complex. J Exp Biol 212:878–892
Twitchen ID, Eddy FB (1994) Effects of ammonia on sodium balance
in juvenile rainbow trout Oncorhynchus mykiss Walbaum. Aquat
Toxicol 30:27–45
Verdouw H, van Echteld CJA, Dekkers EMJ (1978) Ammonia
determination based on indophenols formation with sodium
salicylate. Water Res 12:399–402
Weihrauch D, Wilkie MP, Walsh PJ (2009) Ammonia and urea
transporters in gills of fish and aquatic crustaceans. J Exp Biol
212:1716–1730
Wicks BJ, Randall DJ (2002a) The effect of feeding and fasting on
ammonia toxicity in juvenile rainbow trout, Oncorhynchusmykiss. Aquat Toxicol 59:71–82
Wicks BJ, Randall DJ (2002b) The effect of sub-lethal ammonia
exposure on fed and unfed rainbow trout: the role of glutamine in
regulation of ammonia. Comp Biochem Physiol A 132:275–285
Wilkie MP (2002) Ammonia excretion and urea handling by fish gills:
present understanding and future research challenges. J Exp Zool
293:284–301
J Comp Physiol B
123
Wilson RW, Wright PM, Munger S, Wood CM (1994) Ammonia
excretion in freshwater rainbow trout (Oncorhynchusmykiss) and the importance of gill boundary layer acidifi-
cation: lack of evidence for Na?/NH4? exchange. J Exp Biol
191:37–58
Wilson JM, Laurent P, Tufts BL, Benos DJ, Donowitz M, Vogl AW,
Randall DJ (2000) NaCl uptake by the branchial epithelium in
freshwater teleost fish: an immunological approach to ion-
transport protein localization. J Exp Biol 203:2279–2296
Wood CM (1993) Ammonia and urea metabolism and excretion. In:
Evans DH (ed) The physiology of fishes. CRC Press, Boca
Raton, pp 379–425
Wright PA, Wood CM (2009) A new paradigm for ammonia
excretion in aquatic animals: role of Rhesus (Rh) glycoproteins.
J Exp Biol 212:2303–2312
Wu SC, Horng JL, Liu ST, Hwang PP, Wen ZH, Lin CS, Lin LY (2010)
Ammonium-dependent sodium uptake in mitochondrion-rich cells
of medaka (Oryzias latipes) larvae. Am J Physiol 298:C237–C250
J Comp Physiol B
123