original article identification of cancer biomarkers of
TRANSCRIPT

Received: April 20, 2017; Revised: September 25, 2017; Accepted: November 7, 2017
© The Author(s) 2017. Published by Oxford University Press.
Carcinogenesis, 2018, Vol. 39, No. 3, 407–417
doi:10.1093/carcin/bgx122Advance Access publication November 8, 2017Original Article
407
Original Article
Identification of cancer biomarkers of prognostic value using specific gene regulatory networks (GRN): a novel role of RAD51AP1 for ovarian and lung cancersDimple Chudasama1, Valeria Bo2,6, Marcia Hall3, Vladimir Anikin4, Jeyarooban Jeyaneethi1, Jane Gregory4, George Pados5, Allan Tucker2, Amanda Harvey1, Ryan Pink7 and Emmanouil Karteris1,*1Institute for Environment, Health and Societies and 2Department of Computer Science, Brunel University London, Uxbridge UB8 3PH, UK, 3Mount Vernon Cancer Centre, Northwood HA6 2RN, UK, 4Department of Cardiothoracic Surgery, Harefield Hospital, Royal Brompton and Harefield Trust, Harefield UB9 6JH, UK, 5University of Thessaloniki Medical School, Thessaloniki, Greece, 6Cancer Research UK Cambridge Institute, University of Cambridge, Cambridge CB2 0RE, UK and 7Department of Biological and Medical Sciences, Oxford Brookes University, Oxford OX3 0BP, UK
*To whom correspondence should be addressed. Tel. +00441895265892, Fax: +0044 1895 269873, Email: [email protected]
Abstract
To date, microarray analyses have led to the discovery of numerous individual ‘molecular signatures’ associated with specific cancers. However, there are serious limitations for the adoption of these multi-gene signatures in the clinical environment for diagnostic or prognostic testing as studies with more power need to be carried out. This may involve larger richer cohorts and more advanced analyses. In this study, we conduct analyses—based on gene regulatory network—to reveal distinct and common biomarkers across cancer types. Using microarray data of triple-negative and medullary breast, ovarian and lung cancers applied to a combination of glasso and Bayesian networks (BNs), we derived a unique network-containing genes that are uniquely involved: small proline-rich protein 1A (SPRR1A), follistatin like 1 (FSTL1), collagen type XII alpha 1 (COL12A1) and RAD51 associated protein 1 (RAD51AP1). RAD51AP1 and FSTL1 are significantly overexpressed in ovarian cancer patients but only RAD51AP1 is upregulated in lung cancer patients compared with healthy controls. The upregulation of RAD51AP1 was mirrored in the bloods of both ovarian and lung cancer patients, and Kaplan–Meier (KM) plots predicted poorer overall survival (OS) in patients with high expression of RAD51AP1. Suppression of RAD51AP1 by RNA interference reduced cell proliferation in vitro in ovarian (SKOV3) and lung (A549) cancer cells. This effect appears to be modulated by a decrease in the expression of mTOR-related genes and pro-metastatic candidate genes. Our data describe how an initial in silico approach can generate novel biomarkers that could potentially support current clinical practice and improve long-term outcomes.
IntroductionMicroarray analyses of cancer patients over the years have led to the discovery of specific ‘molecular signatures’, but there are limitation in their adoption for diagnostic or prognostic purposes. For example, data available from next generation sequencing and RNAseq have provided a plethora of informa-tion regarding differential expression of genes or mutations, but
most of this data requires further validation. In addition, most studies concentrate on tissues, which are not readily accessible for use as biomarkers as liquid biopsies.
To make matters more complicated, a recent study revealed extensive genetic similarities across 14 major cancer types (breast, lung and ovarian amongst them) based on whole exome
This is an Open Access article distributed under the terms of the Creative Commons Attribution Non-Commercial License (http://creativecommons.org/licenses/by-nc/4.0/), which permits non-commercial re-use, distribution, and reproduction in any medium, provided the original work is properly cited. For commercial re-use, please contact [email protected]
Downloaded from https://academic.oup.com/carcin/article-abstract/39/3/407/4604869by Brunel University London useron 03 July 2018

408 | Carcinogenesis, 2018, Vol. 39, No. 3
somatic mutation profiles (1). This has been corroborated by studies demonstrating similarities between carcinomas from different organs, such as high-grade serous ovarian carcinomas, basal-like breast cancer and uterine serous carcinomas (2–4).
Thus, generic analyses may reveal distinct and common gen-etic features across cancer types, and if so, these features could have the potential to be biomarkers of diagnostic or prognostic value. For this reason, we have employed the Unique Network Identification Pipeline (UNIP) focusing on four different cancer datasets: ovarian cancer, lung cancer, triple-negative breast and medullary breast cancer. UNIP aims to semi-automatically identify an enriched set of genes and the relationships between them, specific to one or a number of independent studies (5).
This is of particular importance to ovarian cancer, since it has been shown to be ineffective and possibly harmful for some (UK Collaborative Trial of Ovarian Cancer Screening) (6). Ovarian cancer is known as the ‘silent killer’ as it causes no symptoms in the early stages which makes detection problematic. Even in advanced disease, the symptoms are very vague. Current strate-gies to diagnose ovarian cancer and recurrent ovarian cancer in patients with symptoms are based on blood tests and imaging. The most common screening tools used are measurement of the serum cancer antigen 125 and transvaginal ultrasound (7). Unfortunately, cancer antigen 125 does not have the required specificity and sensitivity for routine screening; in a study that randomized approximately 40 000 women, at no special risk for ovarian cancer, Buys et al. (7) found no statistically significant reduction in mortality from ovarian cancer in the screened (six annual cancer antigen 125 tests and four annual transvaginal ultrasounds) cohort of women versus those randomized to no screening intervention (7). Therefore, there is a need for the dis-covery of more specific and sensitive biomarkers. In this study, we have identified, through NCBI (8), a list of genes known to be involved uniquely in each type of cancer. From all the iden-tified candidate genes, assessment of the function, expression and signalling characteristics of a potential novel biomarker termed RAD51AP1 was chosen, as this gene, common to all four cancers, is known to be overexpressed in both lung and ovarian cancer patients in both tissue and blood compared with healthy controls.
Methodology
UNIP description
GSE18864 (triple-negative breast), GSE9891 (ovarian), GSE21653 (medullary breast) and GSE10445 (non-small cell adenocar-cinoma of lung) cancer datasets are downloaded from NCBI Gene Expression Omnibus database. Robust multi-array average expression measure was applied as a pre-processing step (9–11). To enrich the genes required for the analysis, the R function
pvacFilter is applied separately for each study (breast, ovarian, medullary and lung; https://www.rdocumentation.org/pack-ages/pvac/versions/1.20.0/topics/pvacFilter). This filter function involves two main steps. First, it performs principal component analysis for each individual probe set, and the proportion of variation explained by the first component PC1 (PVAC) is used to measure the degree of consistency among probes within a probe set. Second, it derives an empirical distribution of the PVAC scores of the probe sets that are called ‘Absent’ and sets the 99% percentile value of this distribution (with a maximum value of 0.5, i.e. 50% of the total variation) as the threshold and applies it to all the probe sets on the chip (i.e. filtering out probe sets with PVAC scores less than the threshold value; https://www.biocon-ductor.org/packages/devel/bioc/vignettes/pvac/inst/doc/pvac.pdf, https://www.ncbi.nlm.nih.gov/pubmed/21525126). pvac Filter includes variables that account for most of the variation in the data and filters out genes with little variation. PVAC scores are provided as Supplementary Tables 1 and 2, available at Carcinogenesis Online.
Across all the samples for each of the cancer types (high-grade serous ovarian, non-small cell lung, medullary and triple-negative breast cancers), the standard deviation (SD) of each gene profile is calculated and only genes with SD > 1.5 (threshold decided based on the number of genes believed to be reason-ably analysed) in at least one of the four studies are selected. To build a gene regulatory network for each condition/study in the dataset, we applied glasso (9,11), which calculated the inverse covariance matrix using the lasso penalty to enforce sparseness, with the penalization parameter rho = 0.05. To further improve the sparsity and reduce the nodes involved, we only maintained the connections with an inverse covariance value ≥0.8. The thresholds were set in order to balance filtering out an appropri-ate amount of uninformative signal while not removing impor-tant information that may be key in the identification of unique pathways. Given the poor diagnostic/prognostic landscape, we focussed on the ovarian cancer structure. For the ovarian cancer subtype, connections that do not appear in any other study net-work are isolated. Genes involved in these unique connections are selected, and the Bayesian network (BN) (12) is applied to infer the unique network for the ovarian cancer dataset.
Sample collection and preparation
Tissue cDNA Array plates were purchased from Origene™ (Rockville, MD, USA), consisting of three cancer subtypes: lung, ovarian and breast, with five individual patient samples per cancer type, including one normal control.
Tissue and blood samples were collected from lung and ovarian cancer patients and non-malignant normal organ tis-sue from consenting patients undergoing tissue biopsies/sur-gical resections. Lung cancer tissue was collected from Harefield Hospital, London. Ovarian cancer samples were obtained from the University of Thessaloniki, Greece (13) and Mount Vernon Cancer Centre, London.
All samples were retrieved in formalin fixed, paraffin embed-ded blocks. Tissue sections were cut at 5 µm using a microtome, followed by oil immersion to remove paraffin. Forty milligrams of ovarian/lung tissue were lysed in a Qiagen Tissue Lyser II for 2 min with a 3 mm stainless steel ball bearing.
Cell lines
Two cell lines were used as in vitro models for lung (A549; ATCC, USA) and ovarian (SKOV3; ATCC, USA) cancer. Both cell lines have been authenticated by providing SKOV3 cells to DNA Diagnostics
Abbreviations
BNs Bayesian networksCOL12A1 collagen type XII alpha 1FBS foetal bovine serumFSTL1 follistatin like 1KM Kaplan MeierOS overall survivalPBS phosphate buffered salineRAD51AP1 RAD51 associated protein 1SPRR1A small proline-rich protein 1ATBS tris-buffered salineUNIP unique network identification pipeline
Downloaded from https://academic.oup.com/carcin/article-abstract/39/3/407/4604869by Brunel University London useron 03 July 2018

D. Chudasama et al. | 409
Centre (4 August 2016) and by providing DNA from A549 cells to NorthGene (20 April 2017). Cells were grown in Dulbeccos modi-fied Eagle medium (PAA), supplemented with 10% foetal bovine serum (FBS) (Gibco), and 1% penicillin/streptomycin (Gibco), or Roswell Park Memorial Institute media supplemented with 10% FBS (Gibco) and 1% penicillin/streptomycin (Gibco), respectively. Cell lines were cultured at 37°C, 5% CO2 in a humidified environ-ment. Once cells reached 70% confluency, they were harvested and RNA extracted.
RNA isolation, cDNA synthesis and quantitative RT-PCR
RNA was extracted from cell lines and tissue samples, using the GenElute mRNA MiniPrep Kit (Sigma-Aldrich), a silica membrane/spin column method, and stored at −80°C until further use.
RNA from the lung tissue sections was extracted using the Promega formalin fixed, paraffin embedded RNA extraction kit (Promega) and stored at −80°C until further use. cDNA was synthesized from mRNA using Superscript II (Invitrogen). cDNA concentration was normalized using RNA concentrations deter-mined by NanoDrop (Thermo Scientific) and was synthesized to a concentration of 1000 ng. RNA from blood samples was extracted using the Ribopure blood RNA kit (Ambion, Fisher, UK) according to the manufacturer’s protocol.
RT-qPCR of tissue samples
Relative expression of the genes of interest was assessed by quantitative PCR using the SYBR green PCR mastermix ROX (ABI, UK). β-Actin was used as the endogenous control for all samples, as recommended by the manufacturers of the Tissue Array plates, and to maintain consistency across the rest of the samples. GAPDH was also used for all clinical samples, and for cell line qPCR, B2M and YHWZA were used as endogenous controls based on GeNorm analyses. The following primers were used from PrimerDesign (Chandlers Ford, UK), RAD51 associ-ated protein 1 (RAD51AP1 F: AGTGAAGGTAAAATCCCCAGTAGA, R: TGGCAAGGACTGAGATTCTGAT), collagen type XII alpha 1 (COL12A1 F: GTGCCTGGACTGATTTGGTTT; R: AGACACAAGAG CAGCAATGAAG), follistatin like 1 (FSTL1 F: TAAAGGCAG CAACTACGTGAAAT; R: TTGTTCTCCTGGTCTGGATACG) and small proline-rich protein 1A (SPRR1A F: GCCACTGGATA CTGAACACC, R: AGAATGAGGGTAAGGGACATC TT). qPCR data of relative gene expression was analysed using the ΔCt method whereby the endogenous control Ct is subtracted from the gene of interest Ct to calculate ΔCt, and an relative quantity value was calculated by finding 2−ΔCt. Where more than one reference gene was used, the relative quantity values were averaged. A Student’s unpaired t-test was used to calculate statistical significance.
Immunofluorescence microscopy
Seventy thousand cells were seeded onto coverslips in indi-vidual wells of a 24-well plate. Cells were left to adhere for up to 24 h and then fixed with 4% paraformaldehyde and permea-bilized with 0.5% Triton X-100. Coverslips were then blocked in 5% FBS/phosphate buffered saline (PBS) (vol/vol) and incubated with rabbit anti-human RAD51AP1 antibody (Bioscience) at a dilution of 1:100 in 5% FBS/Tris-buffered saline (TBS) (vol/vol). Coverslips were washed with 5% FBS/PBS (vol/vol) before being incubated with a staining solution that consisted of Alexafluor 488 secondary anti-rabbit antibody at a dilution of 1:1000 in 5% FBS/PBS (vol/vol), (Invitrogen, Life Technologies), for 45 min in
the dark. After washing with 5% FBS/PBS, the coverslips were mounted onto slides and visualized on a HF14 Leica DM4000 microscope.
ImageStreamx Mark II flow cytometry
A confluent 75 cm2 flask of SKOV3 and A549 cells, respectively, was split evenly into eppendorf tubes, which were centrifuged at 1500 rpm for 5 min. The supernatant was discarded and the pel-let was washed with sterile PBS, followed by another spin for 3 min at 2000 rpm. Cells were fixed in 4% paraformaldehyde for 7 min on ice and then centrifuged for 5 min at 1500 rpm. The pellet was washed with PBS and spun at 2000 rpm for 3 min. Cells were blocked for 30 min in FBS-PBS and then centrifuged at 2000 rpm for 3 min. The pellet was incubated overnight with primary antibody (RAD51AP1) diluted in FBS-PBS (1:200) at 4oC. After incubation, cells were centrifuged at 2000 rpm for 3 min and then washed with PBS. Secondary horseradish peroxidase (HRP)-conjugated anti-rabbit antibody diluted in FBS-PBS (1:200) was added to the cells for a 30 min incubation. The cells were centrifuged and washed once more as described above. Accumax (Sigma) and the nuclear marker DRAQ5 (BioStatus) were added before visualizing in the ImageStream. Compensation samples, that only contained anti-bodies or only DRAQ5, were used for data normalisation. Data and images were analysed using an ImageStreamx Mark II Imaging Flow Cytometer (Amnis, Merck Millipore).
RAD51AP1 knockdown
We used siRNA targeted to RAD51AP1 (SMARTpool: ON-TARGETplus, Dharmacon, CO, USA) to suppress RAD51AP1 expression in SKOV-3 and A549 cells. Both cell lines were seeded at 2 × 10⁴ and 1 × 10⁵ cells, per well in 6-well and 24-well plates, respectively. Transfection efficiency was determined previously with siGLO-labelled siRNA to be more than 90%. The siRNA transfection was carried out once at a concentra-tion of 50 nmol/L per well/dish using Dharmafect 1 transfec-tion reagent and serum-free media, a scrambled control was also included (ON-TARGETplus Non-targeting Pool; Thermo Scientific). Complete medium was added to the transfection mix to ensure that transfections (one hit) were carried out in serum-containing medium. Twenty-four hours after transfection, the medium in the wells were replaced with fresh complete media, to avoid toxicity. RNA and lysate cell samples were collected at baseline, 48 and 72 h post transfection.
Western blotting
Protein lysates were extracted from transfected and control SKOV3 and A549 cells. Proteins were first separated by a 10% v/v SDS-PAGE. The separated proteins were then electrophoretically transferred onto a nitrocellulose membrane (Thermo Scientific, Massachusetts, USA) in wet transfer buffer as described previ-ously (13). The membrane was incubated in Tris-buffered saline containing 5% dried milk powder (wt/vol) and 0.1% Tween-20, for 1 h at room temperature to block non-specific binding. The membrane was then incubated with primary anti-human RAD51AP1 polyclonal antibodies (raised in rabbit), at 4oC over-night. The membranes were washed in Tris-buffered saline + 0.1% Tween-20 (three times, 15 min each) before incubation with the secondary anti-rabbit HRP-conjugated secondary antibody for 1 h at room temperature.
Microarrays and analysis
Experiments were performed in pooled biological replicates. The extracted RNA was quality verified on a 2100 expert Agilent
Downloaded from https://academic.oup.com/carcin/article-abstract/39/3/407/4604869by Brunel University London useron 03 July 2018

410 | Carcinogenesis, 2018, Vol. 39, No. 3
bioanalyzer, all samples had an RNA yield greater than 30 μg and RNA integrity number values of 10 (Supplementary Figure 1A, available at Carcinogenesis Online). Samples were amplified and labelled with Agilent Low Input Quick Amp labelling two colour kit and hybridized with a dye swap to an Agilent G3 8plex × 60k gene Human transcriptome microarray and washed to supplier’s protocol. The array slide was scanned at 3 μM and 20 bit tagged image file format (TIFF) file dynamic range on an Agilent Surescan G2565CA microarray scanner at 100% photomultiplier tube gain for both red and green lasers and exported TIFF images. The TIFF images were then aligned to their design files, quality controlled and converted into probe intensity values using the Agilent Feature Extraction Software Ver 12.0.1.1. Using this software, this data was probe and Loess normalized and then quantile normal-ized for subarray variation using Genespring 14.8 GX – Build 7274 (Agilent) and baseline transformed by the median of all samples.
Genes showing 2-fold change between groups and moderated t-test significance P-value < 0.05 to remove technical variation (no false discovery rate was carried out due to small sample num-bers) were enriched and loaded into pthways analysis module of Genespring and compared with Wikipathways January 2017 release, BioCyc Ver 20.5 and KEGG Release 81.0 annotated path-ways to report on significantly enriched pathways (14–16).
Results
Unique networks predicted four unique genes for ovarian and lung cancer
Application of the previously developed UNIP (5) was used to analyse four different cancer datasets: triple-negative and medullary breast, ovarian and lung cancers. Initially, enrich-ment of the interesting genes was undertaken using principal
Figure 1. Unique network for ovarian cancer. Grey nodes indicate highly predictive (average correct-prediction level higher or equal to 0.6) genes.
Downloaded from https://academic.oup.com/carcin/article-abstract/39/3/407/4604869by Brunel University London useron 03 July 2018
D. Chudasama et al. | 411
component analysis and a threshold on the standard deviation. Glasso was then applied to identify a gene regulatory network for each cancer subtype and derive unique connections com-mon to the networks. BN was applied to obtain the unique net-work structure (Figure 1) for each cancer subtype and identify, through inference, the most predictive (how well it predicts other expression level values) and predictable (how well its expression level values are predicted) genes within (intra) and outside (inter) the cancer subtypes using the leave-one-out cross-validation technique. In Figure 1, the nodes with a grey background indicate genes with intra-study predicted accuracy higher than 0.6.
To capture study-specific genes, we queried GeneCards encyclopaedia to obtain the list of genes that are known to be involved in each cancer. We compared the list for each study to the others and to the list of genes included in the unique networks and, finally, selected the genes that appeared in the ovarian cancer study as described in methods. This pipeline identified four novel markers: SPRR1A, FSTL1, COL12A1 and RAD51AP1.
RAD51AP1 is overexpressed in tissue and blood of ovarian and lung cancer patients
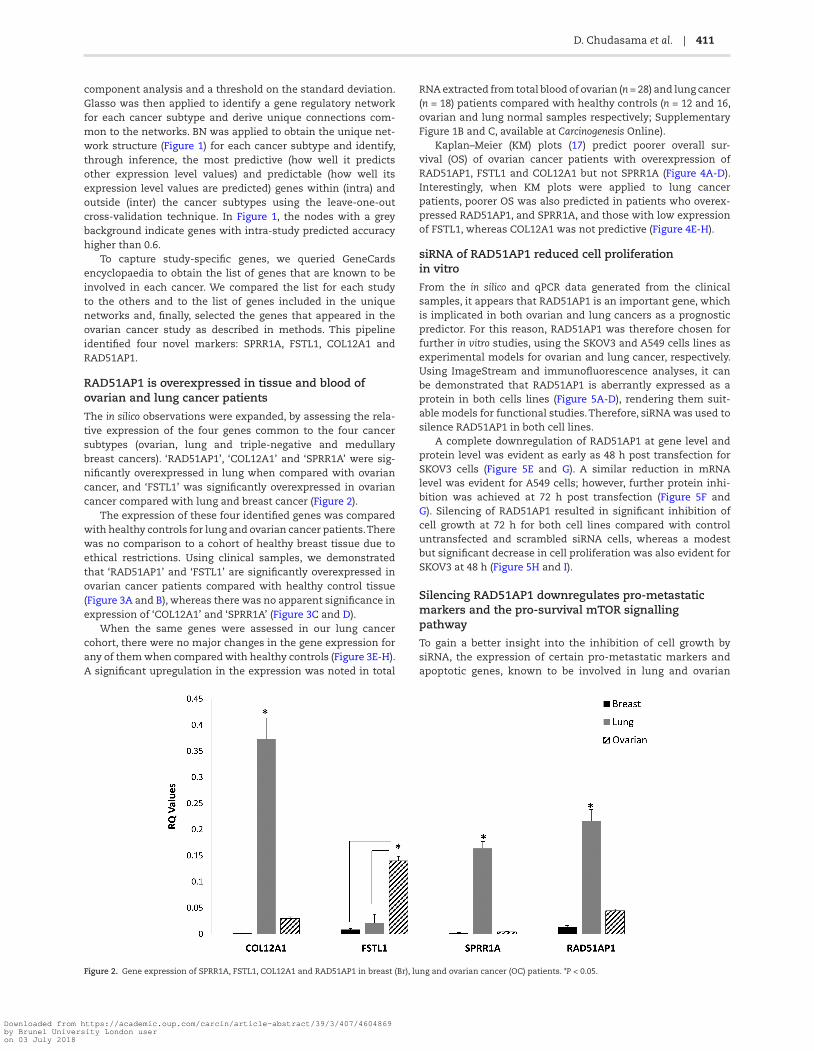
The in silico observations were expanded, by assessing the rela-tive expression of the four genes common to the four cancer subtypes (ovarian, lung and triple-negative and medullary breast cancers). ‘RAD51AP1’, ‘COL12A1’ and ‘SPRR1A’ were sig-nificantly overexpressed in lung when compared with ovarian cancer, and ‘FSTL1’ was significantly overexpressed in ovarian cancer compared with lung and breast cancer (Figure 2).
The expression of these four identified genes was compared with healthy controls for lung and ovarian cancer patients. There was no comparison to a cohort of healthy breast tissue due to ethical restrictions. Using clinical samples, we demonstrated that ‘RAD51AP1’ and ‘FSTL1’ are significantly overexpressed in ovarian cancer patients compared with healthy control tissue (Figure 3A and B), whereas there was no apparent significance in expression of ‘COL12A1’ and ‘SPRR1A’ (Figure 3C and D).
When the same genes were assessed in our lung cancer cohort, there were no major changes in the gene expression for any of them when compared with healthy controls (Figure 3E-H). A significant upregulation in the expression was noted in total
RNA extracted from total blood of ovarian (n = 28) and lung cancer (n = 18) patients compared with healthy controls (n = 12 and 16, ovarian and lung normal samples respectively; Supplementary Figure 1B and C, available at Carcinogenesis Online).
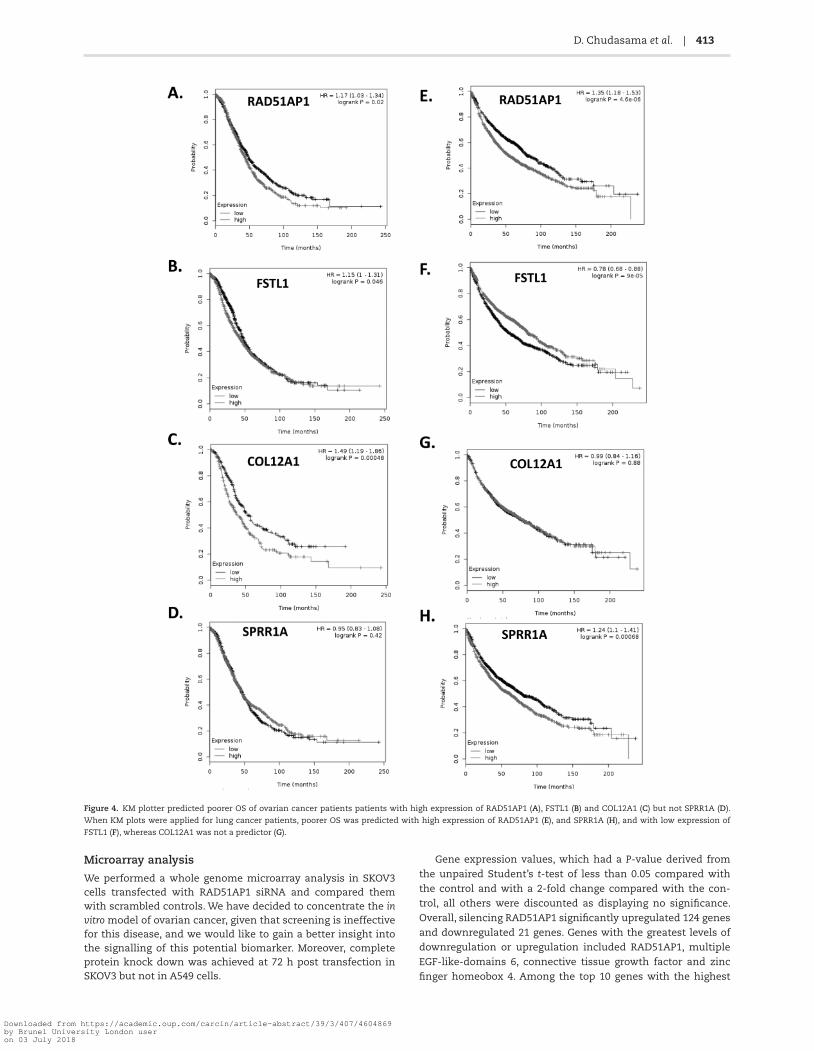
Kaplan–Meier (KM) plots (17) predict poorer overall sur-vival (OS) of ovarian cancer patients with overexpression of RAD51AP1, FSTL1 and COL12A1 but not SPRR1A (Figure 4A-D). Interestingly, when KM plots were applied to lung cancer patients, poorer OS was also predicted in patients who overex-pressed RAD51AP1, and SPRR1A, and those with low expression of FSTL1, whereas COL12A1 was not predictive (Figure 4E-H).
siRNA of RAD51AP1 reduced cell proliferation in vitro
From the in silico and qPCR data generated from the clinical samples, it appears that RAD51AP1 is an important gene, which is implicated in both ovarian and lung cancers as a prognostic predictor. For this reason, RAD51AP1 was therefore chosen for further in vitro studies, using the SKOV3 and A549 cells lines as experimental models for ovarian and lung cancer, respectively. Using ImageStream and immunofluorescence analyses, it can be demonstrated that RAD51AP1 is aberrantly expressed as a protein in both cells lines (Figure 5A-D), rendering them suit-able models for functional studies. Therefore, siRNA was used to silence RAD51AP1 in both cell lines.
A complete downregulation of RAD51AP1 at gene level and protein level was evident as early as 48 h post transfection for SKOV3 cells (Figure 5E and G). A similar reduction in mRNA level was evident for A549 cells; however, further protein inhi-bition was achieved at 72 h post transfection (Figure 5F and G). Silencing of RAD51AP1 resulted in significant inhibition of cell growth at 72 h for both cell lines compared with control untransfected and scrambled siRNA cells, whereas a modest but significant decrease in cell proliferation was also evident for SKOV3 at 48 h (Figure 5H and I).
Silencing RAD51AP1 downregulates pro-metastatic markers and the pro-survival mTOR signalling pathway
To gain a better insight into the inhibition of cell growth by siRNA, the expression of certain pro-metastatic markers and apoptotic genes, known to be involved in lung and ovarian
Figure 2. Gene expression of SPRR1A, FSTL1, COL12A1 and RAD51AP1 in breast (Br), lung and ovarian cancer (OC) patients. *P < 0.05.
Downloaded from https://academic.oup.com/carcin/article-abstract/39/3/407/4604869by Brunel University London useron 03 July 2018

412 | Carcinogenesis, 2018, Vol. 39, No. 3
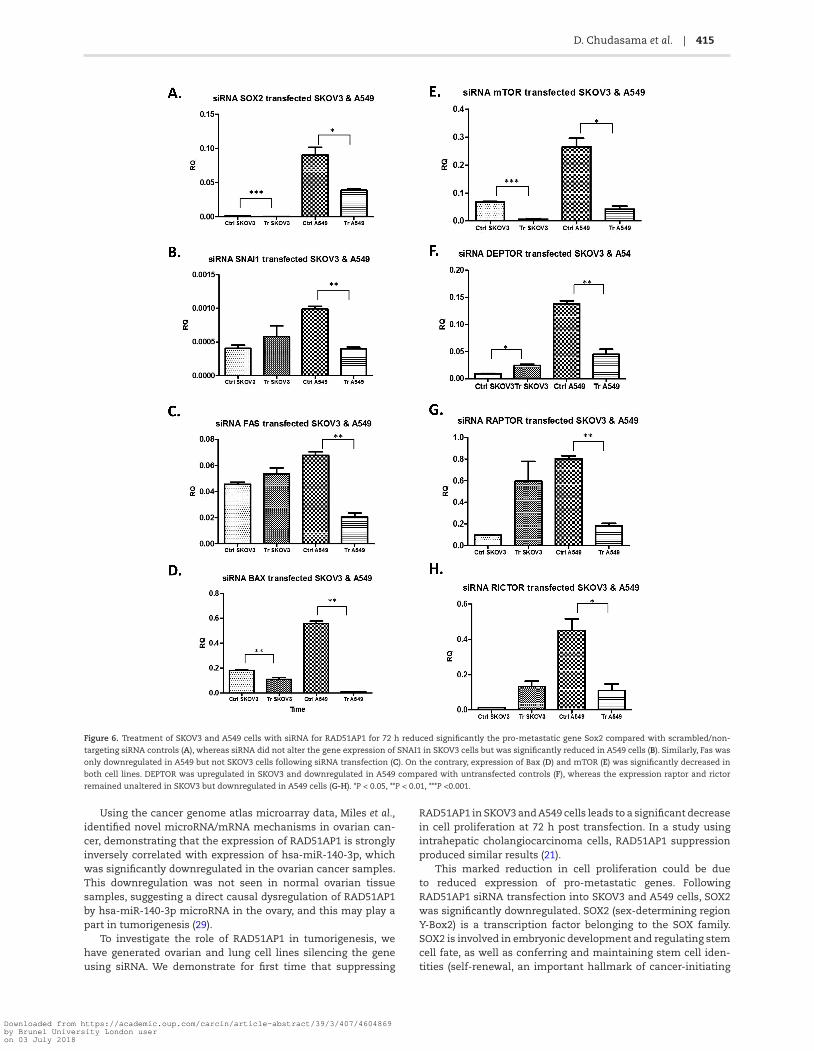
cancer, was measured. Treatment of SKOV3 and A549 cells with siRNA for 72 h significantly reduced the pro-metastatic gene Sox2 compared with controls (Figure 6A). Transfection of siRNA did not exert an effect on the expression of SNAI1 in SKOV3 cells, but SNAI1 expression was significantly reduced in A549 cells (Figure 6B). Similarly, in SKOV3 cells, siRNA did not exert an effect on expression of the pro-apoptotic gene Fas at 72 h, whereas Fas expression in A549 cells after siRNA transfection was significantly reduced (Figure 6C), whereas the expression of another pro-apoptotic gene, Bax, was significantly decreased in both cell lines (Figure 6D). Collectively, these data suggest a cytostatic effect for RAD51AP1 rather a cytotoxic effect. This was further corroborated by studies where cleavage of
caspase 3 remained unaltered following siRNA transfection (Supplementary Figure 1D and E, available at Carcinogenesis Online).
Finally, investigation of key genes in the mTOR signalling pathway was explored in vivo (SKOV3 and A549 cell lines). The expression of mTOR was significantly reduced in both SKOV3 and A549 cell lines in the siRNA samples (Figure 6E), whereas DEPTOR depicted cancer-specific expression, being upregulated in SKOV3 and downregulated in A549 compared with controls (Figure 6F). The expression of key components for mTORC1 and mTORC2, namely raptor and rictor, remained unaltered in SKOV3 but was markedly reduced in A549 cells (Figure 6G and H).
Figure 3. Expression of RAD51AP1 (panels A and E), FSTL1 (panels B and F), COL12A1 (panels C and G), SPRR1A (panels D and H) in ovarian (A-D) and lung (E-H) cancers
compared with healthy controls. *P < 0.05, **P < 0.01 and ***P < 0.001.
Downloaded from https://academic.oup.com/carcin/article-abstract/39/3/407/4604869by Brunel University London useron 03 July 2018
D. Chudasama et al. | 413
Microarray analysis
We performed a whole genome microarray analysis in SKOV3 cells transfected with RAD51AP1 siRNA and compared them with scrambled controls. We have decided to concentrate the in vitro model of ovarian cancer, given that screening is ineffective for this disease, and we would like to gain a better insight into the signalling of this potential biomarker. Moreover, complete protein knock down was achieved at 72 h post transfection in SKOV3 but not in A549 cells.
Gene expression values, which had a P-value derived from the unpaired Student’s t-test of less than 0.05 compared with the control and with a 2-fold change compared with the con-trol, all others were discounted as displaying no significance. Overall, silencing RAD51AP1 significantly upregulated 124 genes and downregulated 21 genes. Genes with the greatest levels of downregulation or upregulation included RAD51AP1, multiple EGF-like-domains 6, connective tissue growth factor and zinc finger homeobox 4. Among the top 10 genes with the highest
Figure 4. KM plotter predicted poorer OS of ovarian cancer patients patients with high expression of RAD51AP1 (A), FSTL1 (B) and COL12A1 (C) but not SPRR1A (D).
When KM plots were applied for lung cancer patients, poorer OS was predicted with high expression of RAD51AP1 (E), and SPRR1A (H), and with low expression of
FSTL1 (F), whereas COL12A1 was not a predictor (G).
Downloaded from https://academic.oup.com/carcin/article-abstract/39/3/407/4604869by Brunel University London useron 03 July 2018

414 | Carcinogenesis, 2018, Vol. 39, No. 3
levels of upregulation were interleukin 1β, endothelial lipase, tumor necrosis factor, forkhead box A2 and intercellular adhe-sion molecule 1 (Table 1). Enrichment analysis using GeneSpring Software using KEGG, Reactome and Wikipathways produced 32 pathways that have four more genes changed in them includ-ing apoptotic signalling, MAPK signalling, Toll-like receptor and PI3K-Akt-mTOR signalling (Supplementary Figure 2, available at Carcinogenesis Online).
DiscussionIn this study, we provide evidence of how genes derived from unique networks can be of importance as potential biomarkers or therapeutic targets. Using a combination of glasso network learning, graph theory and BN prediction, the Unique Network approach enables us to explore many possible mechanisms in existing data by focussing on those that appear specifically in a subset of conditions—here four different cancer types. This is in stark contrast to many data integration techniques that risk ‘averaging’ over multiple datasets. It does this through a combi-nation of glasso network learning, graph theory and BN predic-tion. Only genes that are predictive in the subset of cancer types are preserved in the unique networks and this approach has enabled us to identify one key gene termed RAD51AP1.
RAD51AP1 has been shown to participate in the homologous recombination DNA damage response pathway, as an accessory protein to RAD51, known as the main mediator (18). Interaction of the RAD51AP1 with RAD51 greatly enhances its recombinase activ-ity, stimulating the RAD51-mediated D-loop reaction (18). Over the past years, novel roles for RAD51AP1 have emerged, including act-ing as a growth promoting signalling molecule (19) and is possibly critical during early stages of neoplasia where replication stress
occurs at higher than normal levels. Elevated levels of RAD51AP1 can then shift the balance from a pre-cancerous lesion to cancer (20). In the same study, RAD51AP1-deficient cells appear to be sen-sitized to cisplatin’s cytotoxic effects. Here, RAD51AP1 upregulation is described in both tissue and matching blood from patients with ovarian and lung cancer compared with healthy controls. These data expand and compliment previous cancer studies, where overexpression of RAD51AP1 has been described in cholangio-carcinoma tissues (21), hepatocellular carcinomas (22) and acute myeloid leukaemia with complex karyotipic abnormalities (23). Moreover, data from publicly available microarrays corroborate our findings, demonstrating significant upregulation of the gene in ovarian and lung malignancies (Supplementary Figure 3, avail-able at Carcinogenesis Online). The overexpression of RAD51AP1 described above is associated with reduced OS in ovarian and lung cancer patients and this too is reported for breast cancer (19).
With the emergence of circulating tumour cells, readily avail-able in the blood of lung and ovary cancer patients (24), there is renewed hope of developing this tool further to identify cir-culating surrogate biomarkers, i.e. ‘liquid biopsy’ which would be considerably more accessible than repeated tissue biopsies. Circulating tumour cells are cells that have detached from the primary tumour, or a metastatic site, and entered the blood cir-culation (25). Despite the limitations of biological heterogene-ity and difficult identification of circulating tumour cells, there is an increasing evidence of the clinical utility of these and circulating free DNA as diagnostic, prognostic and predictive testing in cancer patients (26–28). Given the overexpression of RAD51AP1 in ovary and lung cancer patients tissue and periph-eral blood, compared with normal healthy controls described here, RAD51AP1 could be explored as potential biomarker for both ovarian and lung cancer.
Figure 5. RAD51AP1 was aberrantly expressed—primarily in the nucleus—in both SKOV3 (A, B) and A549 cells (C, D), as it was evident by ImageStream (A, C) and im-
munofluorescent analyses (B, D). Using siRNA for RAD51AP1, a substantial and significant downregulation of the gene was evident at both 48 and 72 h post transfec-
tion for both SKOV3 (E) and A549 (F) cells compared with scrambled control. The downregulation was mirrored at protein level with maximal downregulation at 72 h
post transfection (G). Silencing of RAD51AP1 resulted in significant inhibition of cell growth at 48 and 72 h for SKOV3 cells compared with control untransfected and
scrambled siRNA cells (H), whereas in A549 cells a significant decrease in cell proliferation was also evident only at 72 h (I). **P < 0.01, ***P < 0.001. Magnification ×40.
Downloaded from https://academic.oup.com/carcin/article-abstract/39/3/407/4604869by Brunel University London useron 03 July 2018
D. Chudasama et al. | 415
Using the cancer genome atlas microarray data, Miles et al., identified novel microRNA/mRNA mechanisms in ovarian can-cer, demonstrating that the expression of RAD51AP1 is strongly inversely correlated with expression of hsa-miR-140-3p, which was significantly downregulated in the ovarian cancer samples. This downregulation was not seen in normal ovarian tissue samples, suggesting a direct causal dysregulation of RAD51AP1 by hsa-miR-140-3p microRNA in the ovary, and this may play a part in tumorigenesis (29).
To investigate the role of RAD51AP1 in tumorigenesis, we have generated ovarian and lung cell lines silencing the gene using siRNA. We demonstrate for first time that suppressing
RAD51AP1 in SKOV3 and A549 cells leads to a significant decrease in cell proliferation at 72 h post transfection. In a study using intrahepatic cholangiocarcinoma cells, RAD51AP1 suppression produced similar results (21).
This marked reduction in cell proliferation could be due to reduced expression of pro-metastatic genes. Following RAD51AP1 siRNA transfection into SKOV3 and A549 cells, SOX2 was significantly downregulated. SOX2 (sex-determining region Y-Box2) is a transcription factor belonging to the SOX family. SOX2 is involved in embryonic development and regulating stem cell fate, as well as conferring and maintaining stem cell iden-tities (self-renewal, an important hallmark of cancer-initiating
Figure 6. Treatment of SKOV3 and A549 cells with siRNA for RAD51AP1 for 72 h reduced significantly the pro-metastatic gene Sox2 compared with scrambled/non-
targeting siRNA controls (A), whereas siRNA did not alter the gene expression of SNAI1 in SKOV3 cells but was significantly reduced in A549 cells (B). Similarly, Fas was
only downregulated in A549 but not SKOV3 cells following siRNA transfection (C). On the contrary, expression of Bax (D) and mTOR (E) was significantly decreased in
both cell lines. DEPTOR was upregulated in SKOV3 and downregulated in A549 compared with untransfected controls (F), whereas the expression raptor and rictor
remained unaltered in SKOV3 but downregulated in A549 cells (G-H). *P < 0.05, **P < 0.01, ***P <0.001.
Downloaded from https://academic.oup.com/carcin/article-abstract/39/3/407/4604869by Brunel University London useron 03 July 2018

416 | Carcinogenesis, 2018, Vol. 39, No. 3
cells). SOX2 has also been linked to epithelial mesenchymal transition, and studies show that knocking down SOX2 results in the decreased expression of drivers of epithelial mesenchy-mal transition, including SNAI1 (30). Interestingly, SOX2 over-expression occurs in the majority of patients with high-grade serous ovarian cancer irrespective of tumour stage (Hellner et al., 2016). However, a more cell-specific effect was noted for SNAI1, since transfection of RAD51AP1 siRNA did not alter its expression in SKOV3 cells but was significantly downregulated in A549 cells. SNAI1 is a transcription factor, shown to down-regulate E-cadherin expression, resulting in loss of cell-to-cell adhesion and facilitating the epithelial mesenchymal transition, promoting metastasis (31).
With regards to Bax, this is not the first time that a variable expression is documented. For example, when FSTL1 gene was silenced in ovarian cancer cells, a decrease in proliferation was noted while the Bax gene expression remained unchanged (32). It is possible therefore, the mitochondrial-initiated intrinsic pathway of apoptotic events might not be involved, but the decrease in cell proliferation is due to a compromized mTOR signalling.
The mTOR signalling regulates growth, proliferation, con-trols cellular behaviour and acts as a nutrient and amino acid sensor (33–36). Studies from our laboratory have shown involve-ment of this pathway in drug resistance in ovarian cancer, medi-ation of responses of the complement protein C1q (37) and as a therapeutic target, given that rapalogues can exert an inhibi-tory effect on ovarian cancer cells (13). Here, we demonstrate that mTOR (the key component for both mTORC1 and mTORC2 complexes) is significantly downregulated in both cell lines. For the remaining of the mTOR pathway genes, there is cell specific-ity. For example, DEPTOR appeared to be upregulated in SKOV3, whereas the key components for mTORC1 and mTORC2, namely raptor and rictor, respectively, were downregulated only in A549 cells but not in SKOV3 cells. Collectively, these data points towards a compromized mTOR signalling in both cell lines in vitro. In SKOV3 cells, decreased mTOR signalling along with the increase in DEPTOR would inhibit the activity of complexes, if protein mirrors the changes in the gene expression changes. In A549 cells, similarly compromized activity occurs through the reduction in expression of the key components (raptor and ric-tor) of mTORC1 and mTORC2 complexes. Future work on protein expression of these components or changes in the phosphoryla-tion status of downstream components, like S6 kinase, would provide a more detailed insight into the effects of RAD51AP1 on mTOR signalling.
To summarize, unique networks and unique genes are derived in a way that only the genes that are uniquely involved
in the mechanism considered and not in any other are selected. This means that unique networks of different conditions can still include genes that are present in both as long as they are connected in different ways. The main risk of unique networks is small sample sizes may affect the significance of the connec-tions identified. This is increased the more specific the networks become, the opposite to data integration. However, prediction experiments demonstrate the power of the learnt network mod-els (avoiding overfitting). Also, although BNs are excellent at dealing with uncertainty and noisy data, they do not scale well. This is to overcome a degree by using glasso approaches.
Finally, RAD51AP1 is not only overexpressed in lung and ovarian cancer tissue but also readily identified in the peripheral blood of these patients as opposed to normal healthy controls. Thus, it has the potential to be biomarker. Future studies using ‘liquid biopsies’will also provide evidence as to whether this gene can be of diagnostic value non-invasively. In addition, the knocking out RAD51AP1 reduces cell proliferation in vitro pos-sibly offering itself as a therapeutic target for ovarian and lung cancers. Preliminary work here suggests that RAD51AP1 has the potential to influence many pathways from pro-metastatic genes such as SOX2, transcription factors such as SNAI1 and the mTOR pathway.
Supplementary materialSupplementary data are available at Carcinogenesis online.Conflict of Interest Statement: None declared.
References 1. Heim, D. et al. (2014) Cancer beyond organ and tissue specificity: next-
generation-sequencing gene mutation data reveal complex genetic similarities across major cancers. Int. J. Cancer, 135, 2362–2369.
2. Koboldt, D.C. et al. (2012) Comprehensive molecular portraits of human breast tumours. Nature, 490, 61–70.
3. Bell, D. et al. (2011) Integrated genomic analyses of ovarian carcinoma. Nature, 474, 609–615.
4. Klein, C.A. (2013) Selection and adaptation during metastatic cancer progression. Nature, 501, 365–372.
5. Bo, V. et al. (2014) Discovering study-specific gene regulatory networks. PLoS One, 9, e106524.
6. Pavlik, E.J. (2016) Ovarian cancer screening effectiveness: a realization from the UK Collaborative Trial of Ovarian Cancer Screening. Womens Health (Lond), 12, 475–479.
7. Buys, S.S. et al.; PLCO Project Team. (2011) Effect of screening on ovar-ian cancer mortality: the Prostate, Lung, Colorectal and Ovarian (PLCO) Cancer Screening Randomized Controlled Trial. JAMA, 305, 2295–2303.
8. Rebhan, M. et al. (1997) GeneCards: integrating information about genes, proteins and diseases. Trends Genet., 13, 163.
Table 1. The top 10 genes with the highest levels of up or downregulation following siRNA for RAD51AP1 in SKOV3 ovarian cancer cells
GeneName (most downregulated) GeneBank accession GeneName (most upregulated) GeneBank accession
RAD51 associated protein 1 NM_006479 Dehydrogenase/reductase (SDR family) member 3 NR_034089Multiple EGF-like-domains 6 NM_001409 Interleukin 1β NM_001275Interferon, alpha 4 NM_021068 BCL2 binding component 3 NM_014417Nexilin (F-actin-binding protein) NM_144573 ADP-ribosylation factor-like 14 effector protein-like NM_016371Connective tissue growth factor NM_001901 Olfactomedin 1 NM_006334Cysteine-rich, angiogenic inducer, 61 NM_001554 Lipase, endothelial NM_021784INO80 complex subunit NM_017553 Forkhead box A2 NM_021784RUN and FYVE domain containing 2 NM_017987 Tumor necrosis factor NM_000594Zinc finger homeobox 4 NM_024721 Intercellular adhesion molecule 1 NM_000201Urothelial cancer associated 1 (non- protein coding)
NR_015379 Early growth response 1 NM_001002236
Downloaded from https://academic.oup.com/carcin/article-abstract/39/3/407/4604869by Brunel University London useron 03 July 2018

D. Chudasama et al. | 417
9. Friedman, J. et al. (2008) Sparse inverse covariance estimation with the graphical lasso. Biostatistics, 9, 432–441.
10. CRAN-Package glasso. [Online]. https://cran.r-project.org/web/pack-ages/glasso/index.html (13 March 2017, date last accessed).
11. Meinshausen, N. et al. (2006) High-dimensional graphs and variablese-lection with the lasso. Ann. Stat., 34, 1436–1462.
12. Scutari, M. (2010) Learning Bayesian Networks with the bnlearn. R Package. J. Stat. Softw., 35, 1–22.
13. Rogers-Broadway, K.-R. et al. (2016) Differential effects of rapalogues, dual kinase inhibitors on human ovarian carcinoma cells in vitro. Int J Oncol., 49, 133–143. University of Crete, Faculty of Medicine, Laboratory of Clinical Virology. PMID: 490206.
14. Kutmon, M. et al. (2016) WikiPathways: capturing the full diversity of pathway knowledge. Nucleic Acids Res., 44, D488–D494.
15. Caspi, R. et al. (2010) The MetaCyc database of metabolic pathways and enzymes and the BioCyc collection of pathway/genome databases. Nucleic Acids Res., 38, D473–D479.
16. Kanehisa, M. et al. (2000) KEGG: kyoto encyclopedia of genes and genomes. Nucleic Acids Res., 28, 27–30.
17. Kaplan Meier-plotter. [Online]. http://kmplot.com/analysis/index.php?p=service&cancer=ovar (13 March 2017, date last accessed).
18. Wiese, C. et al. (2007) Promotion of homologous recombination and genomic stability by RAD51AP1 via RAD51 recombinase enhancement. Mol. Cell, 28, 482–490.
19. Pathania, R. et al. (2016) Combined inhibition of DNMT and HDAC blocks the tumorigenicity of cancer stem-like cells and attenuates mammary tumor growth. Cancer Res., 76, 3224–3235.
20. Parplys, A.C. et al. (2014) RAD51AP1-deficiency in vertebrate cells impairs DNA replication. DNA Repair (Amst), 24, 87–97.
21. Obama, K. et al. (2008) Enhanced expression of RAD51 associating pro-tein-1 is involved in the growth of intrahepatic cholangiocarcinoma cells. Clin. Cancer Res., 14, 1333–1339.
22. Song, L.J. et al. (2015) PU.1 is identified as a novel metastasis suppres-sor in hepatocellular carcinoma regulating the miR-615-5p/IGF2 axis. Asian Pac. J. Cancer Prev., 16, 3667–3671.
23. Schoch, C. et al. (2005) Acute myeloid leukemia with a complex aber-rant karyotype is a distinct biological entity characterized by genomic imbalances and a specific gene expression profile. Genes Chromosomes Cancer, 43, 227–238.
24. Bo, V. et al. (2017) Identification of novel cancer biomarkers of prognos-tic value using specific gene regulatory networks (GRN): a novel role for RAD51AP1 for ovarian and lung cancers. Presented in 2017 at the European Association of Cancer Research (EACR).
25. Dawson, S.J. et al. (2013) Analysis of circulating tumor DNA to monitor metastatic breast cancer. N. Engl. J. Med., 368, 1199–1209.
26. Cabel, L. et al. (2017) Circulating tumor cells: clinical validity and utility. Int. J. Clin. Oncol., 22, 421–430.
27. Van Berckelaer, C. et al. (2016) Current and future role of circulating tumor cells in patients with epithelial ovarian cancer. Eur. J. Surg. Oncol., 42, 1772–1779.
28. Calabuig-Fariñas, S. et al. (2016) Circulating tumor cells versus circulat-ing tumor DNA in lung cancer-which one will win? Transl. Lung Cancer Res., 5, 466–482.
29. Miles, G.D. et al. (2012) Identifying microRNA/mRNA dysregulations in ovarian cancer. BMC Res. Notes, 5, 164.
30. Herreros-Villanueva, M. et al. (2013) SOX2 promotes dedifferentia-tion and imparts stem cell-like features to pancreatic cancer cells. Oncogenesis, 2, e61.
31. Bell, C.E. et al. (2009) SNAI1 and SNAI2 are asymmetrically expressed at the 2-cell stage and become segregated to the TE in the mouse blasto-cyst. PLoS One, 4, e8530.
32. Chan, Q.K. et al. (2009) Tumor suppressor effect of follistatin-like 1 in ovarian and endometrial carcinogenesis: a differential expression and functional analysis. Carcinogenesis, 30, 114–121.
33. Foster, H.A. et al. (2014) The human myometrium differentially expresses mTOR signalling components before and during pregnancy: evidence for regulation by progesterone. J. Steroid Biochem. Mol. Biol., 139, 166–172.
34. Mparmpakas, D. et al. (2012) Placental DEPTOR as a stress sensor during pregnancy. Clin. Sci. (Lond), 122, 349–359.
35. Foster, H. et al. (2010) Differential expression of mTOR signalling com-ponents in drug resistance in ovarian cancer. Anticancer Res., 30, 3529–3534.
36. Mparmpakas, D. et al. (2010) Expression of mTOR and downstream sig-nalling components in the JEG-3 and BeWo human placental chorio-carcinoma cell lines. Int. J. Mol. Med., 25, 65–69.
37. Kaur, A. et al. (2016) Human C1q induces apoptosis in an ovarian cancer cell line via tumor necrosis factor pathway. Front. Immunol., 7, 599.
Downloaded from https://academic.oup.com/carcin/article-abstract/39/3/407/4604869by Brunel University London useron 03 July 2018