original article hyperuricemia as a mediator of the...
TRANSCRIPT

Hyperuricemia as a Mediator of the ProinflammatoryEndocrine Imbalance in the Adipose Tissue in a MurineModel of the Metabolic SyndromeWilliam Baldwin,
1Steven McRae,
1George Marek,
1David Wymer,
1Varinderpal Pannu,
1Chris Baylis,
2
Richard J. Johnson,1,3
and Yuri Y. Sautin1
OBJECTIVE—Hyperuricemia is strongly associated with obe-sity and metabolic syndrome and can predict visceral obesity andinsulin resistance. Previously, we showed that soluble uric aciddirectly stimulated the redox-dependent proinflammatory signal-ing in adipocytes. In this study we demonstrate the role ofhyperuricemia in the production of key adipokines.
RESEARCH DESIGN AND METHODS—We used mouse 3T3-L1 adipocytes, human primary adipocytes, and a mouse model ofmetabolic syndrome and hyperuricemia.
RESULTS—Uric acid induced in vitro an increase in the pro-duction (mRNA and secreted protein) of monocyte chemotacticprotein-1 (MCP-1), an adipokine playing an essential role in induc-ing the proinflammatory state in adipocytes in obesity. In addition,uric acid caused a decrease in the production of adiponectin, anadipocyte-specific insulin sensitizer and anti-inflammatory agent.Uric acid–induced increase in MCP-1 production was blocked byscavenging superoxide or by inhibiting NADPH oxidase and bystimulating peroxisome-proliferator–activated receptor-g with rosi-glitazone. Downregulation of the adiponectin production was pre-vented by rosiglitazone but not by antioxidants. In obese mice withmetabolic syndrome, we observed hyperuricemia. Lowering uricacid in these mice by inhibiting xanthine oxidoreductase with al-lopurinol could improve the proinflammatory endocrine imbalancein the adipose tissue by reducing production of MCP-1 and increas-ing production of adiponectin. In addition, lowering uric acid inobese mice decreased macrophage infiltration in the adipose tissueand reduced insulin resistance.
CONCLUSIONS—Hyperuricemia might be partially responsiblefor the proinflammatory endocrine imbalance in the adiposetissue, which is an underlying mechanism of the low-grade in-flammation and insulin resistance in subjects with the metabolicsyndrome. Diabetes 60:1258–1269, 2011
Elevated blood levels of uric acid, the final productof the purine degradation in humans, is stronglyassociated with cardiovascular and kidney dis-ease, hypertension, and overall risk of mortality
(1,2). It is also commonly present in metabolic syndrome
(3). Serum levels of uric acid are positively correlated withindividual components of the metabolic syndrome, inparticular visceral obesity (4,5), and this correlation isstronger when other components are also present (5). In1993 Reaven and colleagues (6) suggested that hyperuri-cemia is commonly part of the cluster of metabolic andhemodynamic abnormalities along with abdominal obe-sity, glucose intolerance, insulin resistance, dyslipidemia,and hypertension (7). Most authorities have viewed thepresence of hyperuricemia in metabolic syndrome asa secondary response to obesity and hyperinsulinemia andhave attributed this to the effects of insulin on proximaltubular urate transport (8), the effect of elevated leptin (9),or altered purine metabolism (10).
Recent studies, however, have suggested a potentialcontributory role of uric acid to metabolic syndrome. Forexample, an elevated serum uric acid has been reported tobe an independent predictor of obesity (11) and hyper-insulinemia (12,13), and thus if it precedes the de-velopment of hyperinsulinemia, it is difficult to attribute itsolely to the effects of elevated insulin levels. Loweringuric acid also ameliorates the elevation in blood pressure,serum triglycerides, and insulin resistance in the fructose-induced metabolic syndrome in rats (3,14). We showedrecently that adipocyte differentiation is associated withan increase in uptake of uric acid by cells and, in dif-ferentiated adipocytes, uric acid induced an activationof NADPH oxidase (NOX) followed by the activation ofredox-dependent proinflammatory signaling via proteinkinase p38 (15).
Adipose tissue is important not only as a site for fatsequestration and storage, but also as a major endocrinegland that secretes hormones and cytokines referred to asadipokines (16,17). Adipocytes from lean and healthysubjects express high levels of adiponectin, which is se-creted into the circulation, reaching serum concentrationsof up to 10 mg/mL (18,19). Adiponectin stimulates fat oxi-dation, acts as an insulin sensitizer in many cell types(19,20), and has antiatherogenic properties (21). In obesesubjects, adiponectin levels are decreased, and its ben-eficial effects are diminished (20,22,23). Obesity is alsoassociated with an inflammatory response in the adiposetissue (24,25) with an increased local expression ofmonocyte chemotactic protein-1 (MCP-1), tumor necrosisfactor-a (TNF-a), interleukin-6 (IL-6), and other proin-flammatory molecules (23,25,26). MCP-1 has a key role inthe macrophage infiltration in the adipose tissue in obesityand development of insulin resistance (27,28). The obesity-induced imbalance in the production of adipokines con-tributes to insulin resistance of the liver and muscles,impairs vascular homeostasis, and induces low-grade sys-temic inflammation that is critical in the development of
From the 1Department of Medicine, University of Florida, Gainesville, Florida;the 2Department of Physiology and Functional Genomics, University ofFlorida, Gainesville, Florida; and the 3Department of Medicine, Universityof Colorado, Denver, Colorado.
Corresponding author: Yuri Y. Sautin, [email protected] 30 June 2010 and accepted 2 January 2011.DOI: 10.2337/db10-0916This article contains Supplementary Data online at http://diabetes.
diabetesjournals.org/lookup/suppl/doi:10.2337/db10-0916/-/DC1.W.B. and S.M. contributed equally to this article.� 2011 by the American Diabetes Association. Readers may use this article as
long as the work is properly cited, the use is educational and not for profit,and the work is not altered. See http://creativecommons.org/licenses/by-nc-nd/3.0/ for details.
1258 DIABETES, VOL. 60, APRIL 2011 diabetes.diabetesjournals.org
ORIGINAL ARTICLE

type 2 diabetes and cardiovascular disease (18,19,29,30).Uric acid has also been reported to induce an increase inthe expression of MCP-1 in some cell types (31,32) whileclinical studies revealed a negative correlation betweenthe levels of uric acid and adiponectin in the serum (33–35). In addition, uric acid is recognized by immune cellsas a signal of cell death that alerts the immune system(36,37). Recently Cheung et al. (38) have reported that thexanthine dehydrogenase form of xanthine oxidoreductase(XOR), the enzyme that produces uric acid from xanthine,may also have a role in adipocyte differentiation.
Given these observations, we investigated whether uricacid might modulate the production of adiponectin and MCP-1 in the adipocyte and if this was dependent on local oxi-dative stress or peroxisome-proliferator–activated receptor-g(PPAR-g). We also examined whether hyperuricemia canbe a factor contributing to the proinflammatory imbalancein the adipose tissue via effects on the MCP-1 and adipo-nectin production in a mouse model of the metabolic syn-drome.
RESEARCH DESIGN AND METHODS
Cell culture and treatments.Mouse preadipocyte cells 3T3-L1 obtained fromATCC (Manassas, VA) were maintained in high glucose Dulbecco’s modifiedEagle’s medium (Invitrogen, Carlsbad, CA) supplemented with 10% FBSand antibiotics. For adipocyte differentiation, confluent cells were treated with10 mg/mL insulin, 0.25 mmol/L dexamethasone, and 0.5 mmol/L isobutyl-1-methylxanhine for 2 days followed by 3- to 5-day treatment with insulin alone.Differentiation of adipocytes was confirmed by lipid staining with Red Oil andmRNA expression of PPAR-g and adiponectin as described earlier (15). Hu-man primary subcutaneous adipocytes were obtained from ZenBio (ResearchTriangle Park, NC) and cultured following the instruction of the manufacturerin subcutaneous adipocyte medium AM-1 (ZenBio). Uric acid solution for celltreatments (Ultrapure, 1–15 mg/dL; Sigma) was prepared in prewarmed cellculture medium as previously described (15). If treatments with uric acid werecontinued for more than 3 days, medium was replaced with freshly preparedidentical medium. By the end of the 3-day treatment, there was no differencein pH between cell culture medium containing uric acid and control medium.In some experiments, conditioned medium was collected and stored at 280°Cfor measuring the levels of adipokines.Animal model. The Animal Care and Use Committee of the University ofFlorida approved protocols for all animal experiments. To test the effect oflowering uric acid, we used the Pound mouse, a recently established pre-diabetes/metabolic syndrome model (Charles River, Wilmington, MA). Thesemice have a mutation in the leptin receptor (a deletion of the exon 2), andthey develop obesity, insulin resistance, dyslipidemia, and fatty liver diseasebut do not progress to type 2 diabetes (39). In preliminary experiments weshowed that these mice develop hyperuricemia (RESULTS). Obese (C57BL/6NCrl-Leprdb-lb/Crl) and lean (C57BL/6NCrl) 6-week-old mice were maintained
on a standard Purina 5001 Diet (PMI, Richmond, IN) under a 12-h light/12-hdark cycle with access to food and water ad libitum. To assess the effects oflowering uric acid levels, obese and lean animals (8–10 animals per group)were either administered for 8 weeks with allopurinol, an inhibitor of XOR(125 mg/L in the drinking water; Sigma, St. Louis, MO) or remained untreated.Every 3 weeks, samples of blood were obtained through facial vein to monitorthe level of uric acid. Insulin tolerance testing was performed 1 week prior tothe end of the experiment. Animals were fasted for 4 h and then injected in-traperitoneally with insulin (Humulin R; Eli Lilly, Indianapolis, IN) at 1 unit/kgbody wt. Glucose in tail vein blood was measured immediately before in-jection (time 0) and at 15, 30, 60, 90, and 120 min after injection using One-Touch Ultra glucometer (LifeScan, Milpitas, CA). At the end of the treatmentperiod, the animals were killed by the intraperitoneal injection of 150 mg/kgsodium pentobarbital. Blood was collected via cardiac puncture, and serumwas stored in aliquots at 280°C. For the mean arterial blood pressure (MAP)measurements, animals were placed under anesthesia (1–3% isoflurane), andarterial blood pressure was measured via the carotid artery by inserting a27-gauge needle connected to a pressure transducer as described (40,41)followed by blood collection. While measurement of blood pressure underanesthesia may not recapitulate values in the conscious, unstressed state, wehave previously reported that differences in MAP between experimentalgroups are maintained (40). Samples of visceral adipose tissue were col-lected on ice and rinsed in ice-cold PBS. For RNA isolation, tissue sampleswere preserved in RNAlater Solution (Applied Biosystems/Ambion, Austin, TX)at 280°C.Quantitative real-time RT-PCR. Total RNA was extracted using TRIzol re-agent (Invitrogen, Carlsbad, CA). Trace DNAwas removed using a DNA-free kit(Applied Biosystems/Ambion, Austin, TX), and 0.5 mg of total RNA was con-verted to cDNA using iScript cDNA synthesis kit (Bio-Rad, Hercules, CA).Quantitative real-time RT-PCR was performed using SsoFast EvaGreenSupermix (Bio-Rad) with primers spanning two or more exons and optimizedfor real-time PCR, which were designed using Geneious Pro software (v. 4.8;Biomatters Ltd., Auckland, New Zealand) and Beacon Designer (v. 7.70; Pre-mier Biosoft International, Palo Alto, CA). Sequences for all used primers areshown in Table 1. Real-time PCR was performed using CFX96 real-time PCRdetection system as follows: 50°C for 2 min, then 95°C for 2 min, then 40 cyclesof denaturation at 95°C for 15 s, annealing at 55°C for 30 s, and extension at72°C for 30 s. Reaction specificity was confirmed by 1) electrophoresis ofproducts in 2% agarose gel after real-time RT-PCR to check if bands ofexpected size were detected; 2) melting curve analysis; and 3) sequencingamplified fragments. Relative gene expression was analyzed by DDC(t)method using the CFX Manager software (v. 1.6; Bio-Rad, Hercules, CA).Immunohistochemistry. To assess the macrophage infiltration in the adiposetissue, samples of the visceral adipose tissue were collected in 10% bufferedformalin, processed, embedded in paraffin, and sectioned. Macrophages werestained as described (42) with the F4/80 antibody from Invitrogen/CaltagLaboratories (Carlsbad, CA), secondary horseradish peroxidase–conjugatedantibody, diaminobenzidine chromogen, and a hematoxylin counterstain.Measurement of serum levels of MCP-1 and adiponectin. Levels of MCP-1and adiponectin in the cell culture medium were measured using the multiplexmouse adipocyte LINCOplex kit (Linco Research, St. Charles, MO) and theLuminex 100 system (Luminex, Austin, TX). Serum levels of MCP-1 and adi-ponectin were measured with the Milliplex MAP mouse single-plex kit and the
TABLE 1Primers for gene expression analysis by quantitative RT-PCR
GeneGeneBank
Accession Number Forward (59–39) Reverse (59–39)Productlength, bp
MouseAdiponectin AF304466 GGAACTTGTGCAGGTTGGAT TCCTGTCATTCCAACATCTCC 162MCP-1 NM_011333 CGGAACCAAATGAGATCAGAA TGTGGAAAAGGTAGTGGATGC 126GAPDH BC083149 GGGTGTGAACCACGAGAAATA AGTTGTCATGGATGACCTTGG 104TNF-a NM_013693 CCAGTCTGTGTCCTTCTA ATCTTGTGTTTCTGAGTAGTT 93XOR NM_011723 TATGACCGCCTTCAGAAC TATGCCTTCCACAGTTGT 102b-Actin NM_007393 GAGAGGTATCCTGACCCTGAAGTA TGTTGAAGGTCTCAAACATGATCT 203
HumanAdiponectin NM_004797 AAGGAGATCCAGGTCTTATTG CCCACACTGAATGCTGAG 151MCP-1 NM_002982 TGTGCCTGCTGCTCATAG CTTGCTGCTGGTGATTCTTC 150XOR NM_000379 TGGTGGATGCTGTGGAGGAGATG AAGATGGCGAGAGGCTGACTGAG 86b-Actin NM_001101 CGTGCGTGACATTAAGGAGA AGGAAGGAAGGCTGGAAGAG 177
bp, base pairs.
W. BALDWIN AND ASSOCIATES
diabetes.diabetesjournals.org DIABETES, VOL. 60, APRIL 2011 1259

mouse serum adipokine Milliplex MAP kit (Millipore, Billerica, MA), corre-spondingly using the Luminex 100 system.Uric acid and thiobarbituric acid reactive substance assays. Uric acid wasmeasured by an enzymatic assay with urate oxidase (Diagnostic ChemicalsLimited, Oxford, CT). Thiobarbituric acid reactive substances were measuredwith the assay from Cayman Chemical (Ann Arbor, MI).Statistics. At least three independent experiments were performed in the caseof in vitro studies, and/or 6–10 animals per group were used for the in vivostudies. Each experiment was performed in triplicate. Data were analyzed byone-way ANOVA followed by Fisher least significant test, unpaired Studentt test, or Mann-Whitney U test, with a value of P , 0.05 considered to representa significant difference. Comparisons between two values were performed byt test or U test. ANOVA was used to test differences among several means.
RESULTS
Effect of uric acid on mRNA expression for MCP-1and adiponectin: dose-response and time courseexperiments. To test the effects of uric acid on the adi-pokine production in vitro, we used differentiated mouse3T3-L1 adipocytes and human primary subcutaneous adi-pocytes. When differentiated mouse adipocytes were in-cubated in the presence of 5 or 15 mg/dL uric acid for 3days, we observed a significant dose-dependent increasein the mRNA abundance for MCP-1 (Fig. 1A). Even thelower dose of 5 mg/dL was significant (P, 0.05, U test). Atime course experiment showed that 15 mg/dL uric acid
induced an increase in MCP-1 mRNA at day 3, continued toincrease to day 7, and plateaued between days 7 and 14(Fig. 1B). The mRNA expression for adiponectin, whichwas induced by in vitro adipocyte differentiation, waslowered by both 5 mg/dL and 15 mg/dL of uric acid (Fig.1C). In time course studies, uric acid also induced a grad-ual decrease in the adiponectin mRNA in adipocytesstarting from day 3 to day 14 (Fig. 1D). Uric acid produceda similar effect in human primary subcutaneous adipo-cytes. Treatment with uric acid at a concentration of 15mg/dL for 7 days induced a dramatic increase in mRNAlevel for MCP-1 and a decrease in the mRNA abundancefor adiponectin (Supplementary Fig. 1A and B). A con-centration of 7.5 mg/dL, which is a urate concentrationtypical for mild hyperuricemia in modern humans (43), didnot produce statistically significant effects in this experi-ment (Supplementary Fig. 1).Urate-induced activation of MCP-1 production inmouse adipocytes is prevented by antioxidants androsiglitazone. We showed previously (15) that uric acidinduced NOX-dependent reactive oxygen species (ROS)production in 3T3-L1 adipocytes, which triggered redox-dependent activation of the proinflammatory signaling byprotein kinase p38. Therefore, we tested the hypothesisthat production of proinflammatory factors in adipocytes
FIG. 1. Effect of uric acid on the mRNA expression for MCP-1 and adiponectin in 3T3-L1 adipocytes: time course and dose response. Differentiated3T3-L1 adipocytes were treated with different concentrations of uric acid for varying periods of time. Relative mRNA expression for the MCP-1 (Aand B) and adiponectin (C and D) in the dose response (A and C) and time course (B and D) for the effects of uric acid are shown. The values aremean 6 SEM for 3–5 independent experiments performed at least in duplicate. *P < 0.05 (nonparametric Mann-Whitney U test) in comparisonwith untreated differentiated adipocytes. d, days; CTRL, control; undif., undifferentiated.
HYPERURICEMIA AND ADIPOSE TISSUE
1260 DIABETES, VOL. 60, APRIL 2011 diabetes.diabetesjournals.org

in response to uric acid is also redox-dependent, and NOXactivity is required for this effect. 3T3-L1 adipocytes weretreated with uric acid for 7 days with or without Mn(II)tetrakis(1-methyl-4-pyridyl)porphyrin (MnTMPyP), a su-peroxide scavenger, or apocynin, an inhibitor of NADPHoxidase, and the MCP-1 and adiponectin mRNA and pro-tein were determined. Uric acid induced a highly signifi-cant increase in MCP-1 mRNA in cells and proteinconcentration in the conditioned medium (Fig. 2A and B)while the presence of MnTMPyP or apocynin in the me-dium completely prevented these effects (Fig. 2A and B).These data suggest that urate-induced activation of theMCP-1 expression and secretion in adipocytes is mediatedby the superoxide-dependent ROS, likely generated byNADPH oxidase. Moreover, urate-induced MCP-1 expressionwas abrogated by rosiglitazone, a PPAR-g agonist (Fig. 2Cand D), suggesting that activation of PPAR-g prevents theeffect of urate.
Urate-induced decrease in the production of adiponectinin mouse adipocytes is prevented by rosiglitazone butnot antioxidants. Treatment of adipocytes with 15 mg/dLuric acid for 7 days induced a dramatic fall in the adipo-nectin mRNA level, which was accompanied by moderatebut significant decrease in the adiponectin concentrationin the incubation medium (Fig. 3A and B). In contrast toMCP-1, the effect of uric acid on adiponectin productionwas not prevented by either MnTMPyP or apocynin (Fig.3A and B), while rosiglitazone restored adiponectin mRNAin cells and adiponectin levels in conditioned media tocontrol levels (Fig. 3C and D). These experiments suggestthat uric acid–induced inhibition of adiponectin pro-duction is not mediated by redox-dependent signaling butrather by a mechanism involving PPAR-g.Effect of uric acid on mRNA expression for XOR.PPAR-g activation by rosiglitazone prevented the effects ofuric acid in our experiments. On the other hand, XOR, an
FIG. 2. Effect of the superoxide scavenger MnTMPyP and inhibitor of NADPH oxidase apocynin on the uric acid–induced increase in the mRNAexpression and protein release for MCP-1 in 3T3-L1 adipocytes. 3T3-L1 adipocytes were incubated in the presence of 15 mg/dL uric acid with orwithout MnTMPyP (25 mmol/L, 30-min preincubation), apocynin (200 mmol/L), or rosiglitazone (10 mmol/L) for 7 days. Medium was changed onceduring this period with the fresh aliquot containing the same additives and stored at 280°C to pool with the medium collected at the end of thetreatment. Total mRNA was isolated from the monolayer while media were used for measuring concentration of adipokines. The effect of uric acidin the presence or absence of antioxidants is shown in A for the relative expression of the mRNA for MCP-1 and in B for the concentration of MCP-1 in the pooled conditioned medium. The effect of rosiglitazone on the urate-stimulated MCP-1 production is shown in C (relative mRNA ex-pression) and in D for the released protein. The values are mean 6 SEM for three independent experiments performed in triplicate. *P < 0.05 and**P < 0.01 (nonparametric Mann-Whitney U test) in comparison with untreated adipocytes. &P < 0.05 (nonparametric Mann-Whitney U test) forthe effect of an antioxidant/rosiglitazone. CTRL, control; Rosi, rosiglitazone; UA, uric acid.
W. BALDWIN AND ASSOCIATES
diabetes.diabetesjournals.org DIABETES, VOL. 60, APRIL 2011 1261

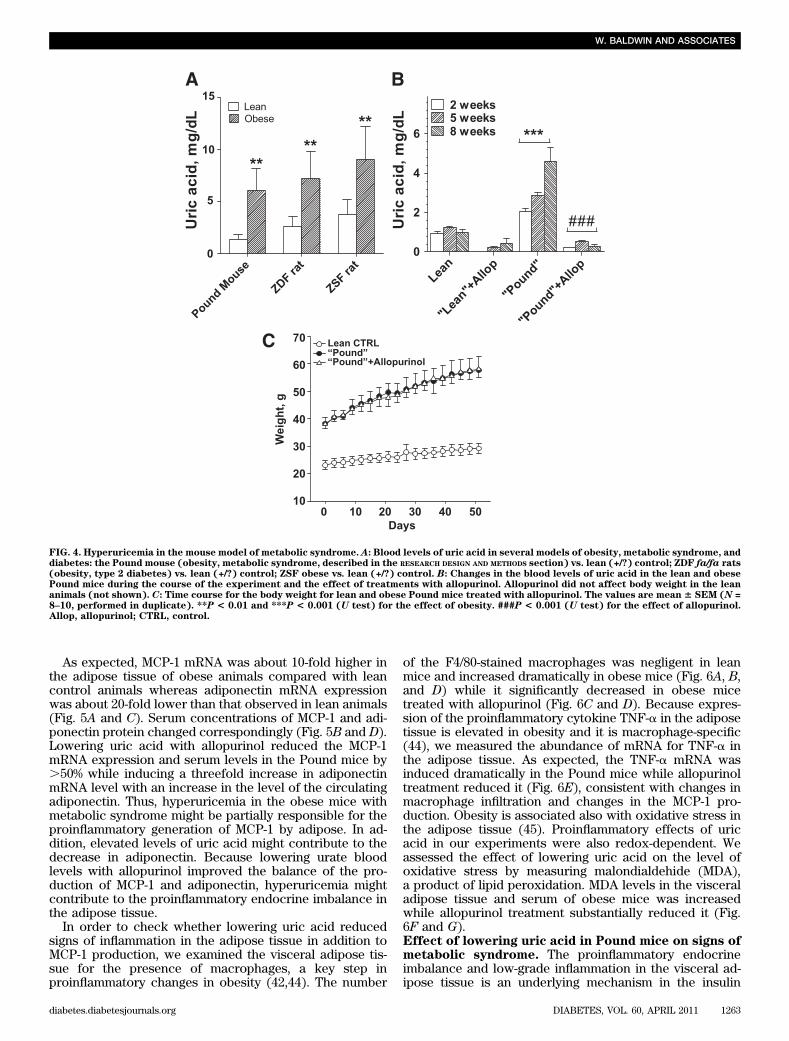
enzyme-producing uric acid, is a crucial upstream regula-tor of PPAR-g activity (38). Therefore, we hypothesizedthat uric acid could induce downregulation of PPAR-g byaffecting XOR via negative feedback mechanism. Wetested an expression of the XOR mRNA in mouse andhuman adipocytes treated with uric acid for 7 days andfound that uric acid induced a significant decrease in theXOR mRNA abundance in both cell types (SupplementaryFig. 2A and B).Effect of lowering serum uric acid in mice withmetabolic syndrome. We analyzed several animal modelsof obesity and metabolic syndrome or type 2 diabetes in-cluding Zucker diabetic fatty rats, ZSF1 rats, and thePound mouse as well as corresponding lean control ani-mals of the same age to compare the blood levels of uricacid in obese and lean animals. As shown in Fig. 4A, foreach analyzed model, the level of uric acid in 8–week-oldobese animals was substantially higher than in the corre-sponding lean animals. The greatest ratio between the
level of uric acid in the lean control and obese animalswas found in the Pound mice (Fig. 4A). These mice havemetabolic syndrome but do not develop type 2 diabetes(39) and showed hyperuricemia compared with their lit-termates (Fig. 4A). Therefore, this model was selected forfurther experiments. To lower blood levels of uric acid,both lean and obese mice were treated with or withoutallopurinol for 8 weeks. Obese animals were hyper-uricemic from the beginning of the study, and hyperuri-cemia progressed to even higher levels of uric acid duringthe course of the experiment (Fig. 4B). The correlationbetween the body weight and the level of uric acid in thePound mouse is highly significant (R = 0.860, N = 33, P ,0.001). Serum uric acid substantially decreased in obeseand lean animals after 2 weeks of treatments andremained low to the end of the study (Fig. 4B). The bodyweight gain was not affected by treatments with allo-purinol in either obese (Fig. 4C) or lean animals (notshown).
FIG. 3. Effect of the superoxide scavenger MnTMPyP and inhibitor of NADPH oxidase apocynin on the uric acid–induced decrease in the mRNAexpression and protein release for adiponectin in 3T3-L1 adipocytes. The experimental conditions were as described in Fig. 2. The effect of uricacid in the presence or absence of antioxidants is shown in A for the relative expression of the mRNA for adiponectin and in B for the concen-tration of adiponectin in the pooled conditioned medium. The effect of rosiglitazone on the urate-stimulated adiponectin production is shown in C(relative mRNA expression) and D for the released protein. The values are mean 6 SEM for three independent experiments performed in trip-licate. *P< 0.05 (nonparametric Mann-WhitneyU test) in comparison with untreated adipocytes. &P< 0.05 (nonparametric Mann-WhitneyU test)for the effect of an antioxidant/rosiglitazone. CTRL, control; Rosi, rosiglitazone; UA, uric acid.
HYPERURICEMIA AND ADIPOSE TISSUE
1262 DIABETES, VOL. 60, APRIL 2011 diabetes.diabetesjournals.org
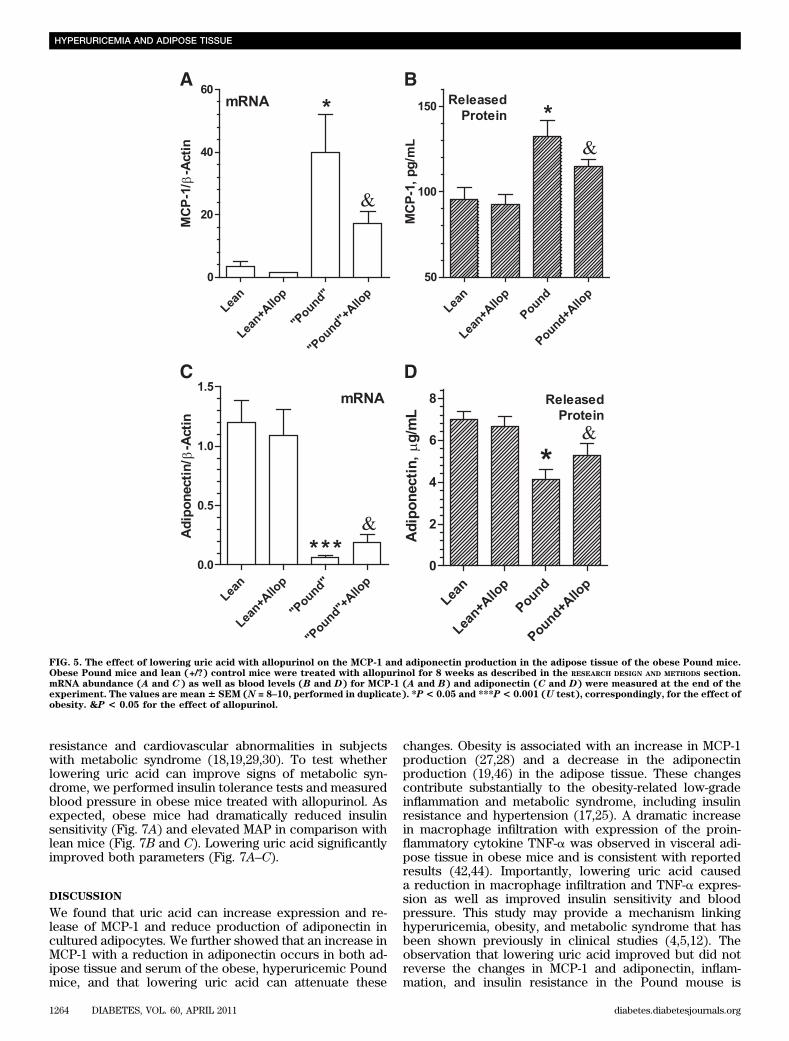
As expected, MCP-1 mRNA was about 10-fold higher inthe adipose tissue of obese animals compared with leancontrol animals whereas adiponectin mRNA expressionwas about 20-fold lower than that observed in lean animals(Fig. 5A and C). Serum concentrations of MCP-1 and adi-ponectin protein changed correspondingly (Fig. 5B and D).Lowering uric acid with allopurinol reduced the MCP-1mRNA expression and serum levels in the Pound mice by.50% while inducing a threefold increase in adiponectinmRNA level with an increase in the level of the circulatingadiponectin. Thus, hyperuricemia in the obese mice withmetabolic syndrome might be partially responsible for theproinflammatory generation of MCP-1 by adipose. In ad-dition, elevated levels of uric acid might contribute to thedecrease in adiponectin. Because lowering urate bloodlevels with allopurinol improved the balance of the pro-duction of MCP-1 and adiponectin, hyperuricemia mightcontribute to the proinflammatory endocrine imbalance inthe adipose tissue.
In order to check whether lowering uric acid reducedsigns of inflammation in the adipose tissue in addition toMCP-1 production, we examined the visceral adipose tis-sue for the presence of macrophages, a key step inproinflammatory changes in obesity (42,44). The number
of the F4/80-stained macrophages was negligent in leanmice and increased dramatically in obese mice (Fig. 6A, B,and D) while it significantly decreased in obese micetreated with allopurinol (Fig. 6C and D). Because expres-sion of the proinflammatory cytokine TNF-a in the adiposetissue is elevated in obesity and it is macrophage-specific(44), we measured the abundance of mRNA for TNF-a inthe adipose tissue. As expected, the TNF-a mRNA wasinduced dramatically in the Pound mice while allopurinoltreatment reduced it (Fig. 6E), consistent with changes inmacrophage infiltration and changes in the MCP-1 pro-duction. Obesity is associated also with oxidative stress inthe adipose tissue (45). Proinflammatory effects of uricacid in our experiments were also redox-dependent. Weassessed the effect of lowering uric acid on the level ofoxidative stress by measuring malondialdehide (MDA),a product of lipid peroxidation. MDA levels in the visceraladipose tissue and serum of obese mice was increasedwhile allopurinol treatment substantially reduced it (Fig.6F and G).Effect of lowering uric acid in Pound mice on signs ofmetabolic syndrome. The proinflammatory endocrineimbalance and low-grade inflammation in the visceral ad-ipose tissue is an underlying mechanism in the insulin
FIG. 4. Hyperuricemia in the mouse model of metabolic syndrome. A: Blood levels of uric acid in several models of obesity, metabolic syndrome, anddiabetes: the Pound mouse (obesity, metabolic syndrome, described in the RESEARCH DESIGN AND METHODS section) vs. lean (+/?) control; ZDF fa/fa rats(obesity, type 2 diabetes) vs. lean (+/?) control; ZSF obese vs. lean (+/?) control. B: Changes in the blood levels of uric acid in the lean and obesePound mice during the course of the experiment and the effect of treatments with allopurinol. Allopurinol did not affect body weight in the leananimals (not shown). C: Time course for the body weight for lean and obese Pound mice treated with allopurinol. The values are mean 6 SEM (N =8–10, performed in duplicate). **P < 0.01 and ***P < 0.001 (U test) for the effect of obesity. ###P < 0.001 (U test) for the effect of allopurinol.Allop, allopurinol; CTRL, control.
W. BALDWIN AND ASSOCIATES
diabetes.diabetesjournals.org DIABETES, VOL. 60, APRIL 2011 1263
resistance and cardiovascular abnormalities in subjectswith metabolic syndrome (18,19,29,30). To test whetherlowering uric acid can improve signs of metabolic syn-drome, we performed insulin tolerance tests and measuredblood pressure in obese mice treated with allopurinol. Asexpected, obese mice had dramatically reduced insulinsensitivity (Fig. 7A) and elevated MAP in comparison withlean mice (Fig. 7B and C). Lowering uric acid significantlyimproved both parameters (Fig. 7A–C).
DISCUSSION
We found that uric acid can increase expression and re-lease of MCP-1 and reduce production of adiponectin incultured adipocytes. We further showed that an increase inMCP-1 with a reduction in adiponectin occurs in both ad-ipose tissue and serum of the obese, hyperuricemic Poundmice, and that lowering uric acid can attenuate these
changes. Obesity is associated with an increase in MCP-1production (27,28) and a decrease in the adiponectinproduction (19,46) in the adipose tissue. These changescontribute substantially to the obesity-related low-gradeinflammation and metabolic syndrome, including insulinresistance and hypertension (17,25). A dramatic increasein macrophage infiltration with expression of the proin-flammatory cytokine TNF-a was observed in visceral adi-pose tissue in obese mice and is consistent with reportedresults (42,44). Importantly, lowering uric acid causeda reduction in macrophage infiltration and TNF-a expres-sion as well as improved insulin sensitivity and bloodpressure. This study may provide a mechanism linkinghyperuricemia, obesity, and metabolic syndrome that hasbeen shown previously in clinical studies (4,5,12). Theobservation that lowering uric acid improved but did notreverse the changes in MCP-1 and adiponectin, inflam-mation, and insulin resistance in the Pound mouse is
FIG. 5. The effect of lowering uric acid with allopurinol on the MCP-1 and adiponectin production in the adipose tissue of the obese Pound mice.Obese Pound mice and lean (+/?) control mice were treated with allopurinol for 8 weeks as described in the RESEARCH DESIGN AND METHODS section.mRNA abundance (A and C) as well as blood levels (B and D) for MCP-1 (A and B) and adiponectin (C and D) were measured at the end of theexperiment. The values are mean6 SEM (N = 8–10, performed in duplicate). *P< 0.05 and ***P< 0.001 (U test), correspondingly, for the effect ofobesity. &P < 0.05 for the effect of allopurinol.
HYPERURICEMIA AND ADIPOSE TISSUE
1264 DIABETES, VOL. 60, APRIL 2011 diabetes.diabetesjournals.org

FIG. 6. The effect of lowering uric acid levels on the macrophage infiltration, TNF-a expression, and oxidative stress in the adipose tissue of theobese Pound mice. Samples of the adipose tissue from lean (A), obese (Pound) (B), and obese mice treated with allopurinol for 8 weeks (C) werestained with F4/80 antibody and counterstained with hematoxylin. Because diaminobenzidine was used as a chromogen, macrophages (F4/80-positive cells) are stained in brown as indicated with arrowheads (see also magnified rectangular region). D: The percentage of F4/80-positivemacrophages within the adipose tissue is greatly induced by obesity and reduced by allopurinol treatment. Allopurinol did not affect macrophagestaining in lean mice (not shown). Counting positive and negative cells were performed in a blind fashion at least in three fields per animal.E: Effect of allopurinol treatment on the relative expression of mRNA for TNF-a in the visceral adipose tissue of the obese (Pound) mice. Inaddition, the level of the oxidative stress in the serum (F) and in the visceral fat (G) in these mice was assessed by measuring the product of lipidperoxidation MDA using thiobarbituric acid reactive substance assay. The values are mean 6 SEM (N = 5–6, performed in triplicate). **P < 0.01and ***P < 0.001 (U test), correspondingly, for the effect of obesity. &P < 0.05 for the effect of allopurinol. WAT, white adipose tissue. (A high-quality digital representation of this figure is available in the online issue.)
W. BALDWIN AND ASSOCIATES
diabetes.diabetesjournals.org DIABETES, VOL. 60, APRIL 2011 1265

consistent with uric acid being a modifying factor—but notthe sole causal factor—in driving these changes.
We observed an increase in serum uric acid in the Poundmice and other animal models of obesity in comparisonwith the corresponding lean controls. This observation isin agreement with published data (38,47). Hyperuricemiaprogressed as animals gained weight, and the level of uricacid correlated with the body weight. As these mice areobese and insulin-resistant because of the mutation in theleptin receptor (39), hyperuricemia cannot be consideredas a causal factor of obesity in this case. However, anincrease in uric acid contributed to the low-grade in-flammation and metabolic syndrome via its direct effect onthe production of MCP-1 and adiponectin in the adiposetissue.
In mouse 3T3-L1 adipocytes and human primary adipo-cytes, uric acid can induce a direct dose-dependent in-crease in the production of MCP-1 and a decrease in theproduction of adiponectin at the level of the mRNA ex-pression and protein release. For mice, cells responded touric acid beginning at concentrations of 5 mg/dL, which issimilar to the levels of uric acid in the obese Pound mice.In the case of human adipocytes, cells responded to 7.5–15mg/dL uric acid, which encompass the range observed insubjects with asymptomatic hyperuricemia to severe gout (3).
The ability of soluble uric acid to induce MCP-1 ex-pression was first demonstrated in rat vascular smooth
muscle cells (31). The effect of uric acid was mediated byMAP kinases ERK1/2 and p38 and nuclear factor-kB ina redox-dependent fashion (31). In our previous work with3T3-L1 adipocytes (15), we showed that uric acid inducedROS production via activation of NADPH oxidase followedby phosphorylation of p38. The urate-induced increase inthe MCP-1 expression in adipocytes was downregulated bya superoxide scavenger and a NOX inhibitor. Collectively,these data suggest that uric acid induced MCP-1 pro-duction in adipocytes via the redox-dependent signalinginitiated by NOX activation. Furukawa et al. (45) reportedthat obesity was associated with oxidative stress in adi-pose tissue, which, in turn, caused an overexpression ofa variety of proinflammatory cytokines including MCP-1.We observed an increase in oxidative stress in our mousemodel of obesity by measuring MDA in the adipose tissueand serum. This was reduced by allopurinol, suggestingthat hyperuricemia induced by obesity is another mecha-nism triggering oxidative stress followed by induction ofthe MCP-1 expression and inflammation in the adiposetissue.
The uric acid–induced increase in the MCP-1 productionobserved in adipocytes was prevented not only by anti-oxidants but also by activation of PPAR-g with rosi-glitazone. An activation of PPAR-g is known to blockthe proinflammatory effects of TNF-a in adipocytes byaffecting the proinflammatory branch of the nuclear
FIG. 7. Lowering uric acid levels in obese (Pound) mice improves signs of metabolic syndrome (insulin resistance, hypertension). A: To assess levelof insulin sensitivity, the insulin tolerance test was used. Insulin (1 unit/kg) was injected, and blood level was measured at 0, 15, 30, 60, 90, and 120min after injection. Sensitivity to insulin was normal in lean mice but dramatically reduced in obese mice, which was partially improved bytreatment with allopurinol. B: Obesity induced increase in the MAP in mice, which was attenuated by allopurinol treatment. C: Representativerecordings of blood pressure averaged in B. The values are mean 6 SEM (N = 5–6, performed in triplicate). **P < 0.01 and ***P < 0.001 (U test),correspondingly, for the effect of obesity. ##P < 0.01 for the effect of allopurinol. Allo, allopurinol; CTRL, control. (A high-quality color repre-sentation of this figure is available in the online issue.)
HYPERURICEMIA AND ADIPOSE TISSUE
1266 DIABETES, VOL. 60, APRIL 2011 diabetes.diabetesjournals.org

factor-kB–dependent signaling (48). XOR in adipocytes isthought to be a crucial upstream regulator of PPAR-g ac-tivity (38). Treating adipocytes with exogenous uric acidreduced expression of XOR, which could be a cause ofdownregulated anti-inflammatory activity of PPAR-g andfacilitated redox-dependent MCP-1 production.
The mechanism of downregulation of the adiponectinproduction in obesity is not completely understood butappears to involve proinflammatory pathways (48,49),oxidative stress (45), and a deficiency in the PPAR-g ac-tivity (48,50). The uric acid–induced decrease in adipo-nectin expression and secretion in our experiments was
FIG. 8. Model for the effect of hyperuricemia on the endocrine balance in adipocytes. This model summarizes the results of the current and theprevious (15) studies. Uric acid can enter adipocytes through a uric acid–specific transporter. We identified that adipocytes express at least oneuric acid transporter, URAT1. Activation of NOX by uric acid occurs via unknown mechanism, and it was localized on the plasma membrane as wellas on intracellular membranes. ROS generated from superoxide produced by NOX is followed by ROS-dependent activation of the proinflammatorysignaling via p38. An activation of this mechanism in response to uric acid is followed by an increase in the production of MCP-1 and a decrease inthe production of adiponectin. In addition, uric acid entering the adipocyte may downregulate expression of XOR, which (xanthine dehydrogenasebut not xanthine oxidase) is known as a crucial upstream regulator of activity of PPAR-g, a master-regulator of adipogenesis, expression ofadiponectin, and an anti-inflammatory factor in adipocytes (38). Upregulation of MCP-1 in response to uric acid can be prevented by a superoxidescavenger or by inhibiting NOX. PPAR-g activation can prevent both effects of uric acid. The effect of hyperuricemia might be partially responsiblefor the low-grade inflammation and insulin resistance in the adipose tissue and for increased risk of cardiovascular disease induced by obesity.
W. BALDWIN AND ASSOCIATES
diabetes.diabetesjournals.org DIABETES, VOL. 60, APRIL 2011 1267

preventable by the PPAR-g agonist, rosiglitazone, suggest-ing an involvement of the same kind of proinflammatorymechanism that was responsible for the induction ofMCP-1. On the other hand, antioxidants could not im-prove adiponectin production affected by uric acid. Wecan suggest therefore that the deficiency of PPAR-g butnot oxidative stress was a primary trigger of this down-regulation.
Because rosiglitazone prevented the uric acid–inducedinduction of MCP-1 and downregulation of adiponectin,these effects of uric acid might depend on PPAR-g. XOR-dependent regulation of the adipocyte differentiation viacontrol of PPAR-g activity is known to be a finely or-chestrated mechanism, which could be affected by ma-nipulating the expression of XOR (38). Our data suggestthat elevated concentrations of uric acid may reduce ex-pression of XOR and attenuate PPAR-g–dependent endo-crine regulation in adipocytes.
In summary, uric acid can affect adipocytes directlyby inducing effects resembling those observed in obesity:upregulation of proinflammatory factors and downregula-tion of the production of the insulin sensitizer and anti-inflammatory factor adiponectin via redox-dependentmechanisms, which can be prevented by an agonist ofPPAR-g (Fig. 8). In the mouse model of the metabolicsyndrome, we observed hyperuricemia, which progressedwith an increase in body weight. Lowering uric acid byinhibiting xanthine oxidoreductase in obese mice with themetabolic syndrome could improve the proinflammatoryendocrine imbalance in the adipose tissue by loweringproduction of MCP-1 and increasing production of adipo-nectin.
ACKNOWLEDGMENTS
This work was supported by American Heart AssociationGrant 0755595B (to Y.Y.S.) and by U.S. Public HealthService Grant HL-68607 (to R.J.J. and Y.Y.S.).
R.J.J. has several patent applications related to loweringuric acid as a means to treat hypertension and metabolicsyndrome. He also has a lay book, The Sugar Fix (Rodale,2008), that discusses the potential effects of fructose onobesity, diabetes, and cardiovascular disease.
No potential conflicts of interest relevant to this articlewere reported.
W.B. and S.M. researched data and reviewed and editedthe manuscript. G.M., D.W., and V.P. researched data. C.B.contributed blood pressure measurements, contributed todiscussion, and reviewed and edited the manuscript. R.J.J.contributed to discussion and reviewed and edited themanuscript. Y.Y.S. researched data and wrote the manu-script.
The University of Florida Hypertension Center andBruce Cunningham, University of Florida, Gainesville,Florida, are acknowledged for help with measuring bloodpressure in mice. Molecular Pathology and ImmunologyCore, University of Florida, Gainesville, Florida, is alsoacknowledged for help with histochemistry. The authorsthank Charles River, Wilmington, Massachusetts, for gener-ously providing serum samples for several models of obesity.
REFERENCES
1. Feig DI, Kang DH, Johnson RJ. Uric acid and cardiovascular risk. N Engl JMed 2008;359:1811–1821
2. Johnson RJ, Segal MS, Srinivas T, et al. Essential hypertension, progressiverenal disease, and uric acid: a pathogenetic link? J Am Soc Nephrol 2005;16:1909–1919
3. Johnson RJ, Perez-Pozo SE, Sautin YY, et al. Hypothesis: could excessivefructose intake and uric acid cause type 2 diabetes? Endocr Rev 2009;30:96–116
4. Matsuura F, Yamashita S, Nakamura T, et al. Effect of visceral fat accu-mulation on uric acid metabolism in male obese subjects: visceral fatobesity is linked more closely to overproduction of uric acid than sub-cutaneous fat obesity. Metabolism 1998;47:929–933
5. Hikita M, Ohno I, Mori Y, Ichida K, Yokose T, Hosoya T. Relationshipbetween hyperuricemia and body fat distribution. Intern Med 2007;46:1353–1358
6. Zavaroni I, Mazza S, Fantuzzi M, et al. Changes in insulin and lipid me-tabolism in males with asymptomatic hyperuricaemia. J Intern Med 1993;234:25–30
7. Moller DE, Kaufman KD. Metabolic syndrome: a clinical and molecularperspective. Annu Rev Med 2005;56:45–62
8. Reaven GM. The kidney: an unwilling accomplice in syndrome X. Am JKidney Dis 1997;30:928–931
9. Fruehwald-Schultes B, Peters A, Kern W, Beyer J, Pfützner A. Serum leptinis associated with serum uric acid concentrations in humans. Metabolism1999;48:677–680
10. Hayden MR, Tyagi SC. Uric acid: a new look at an old risk marker forcardiovascular disease, metabolic syndrome, and type 2 diabetes mellitus:the urate redox shuttle. Nutr Metab (Lond) 2004;1:10
11. Masuo K, Kawaguchi H, Mikami H, Ogihara T, Tuck ML. Serum uric acidand plasma norepinephrine concentrations predict subsequent weight gainand blood pressure elevation. Hypertension 2003;42:474–480
12. Nakanishi N, Okamoto M, Yoshida H, Matsuo Y, Suzuki K, Tatara K. Serumuric acid and risk for development of hypertension and impaired fastingglucose or type II diabetes in Japanese male office workers. Eur J Epi-demiol 2003;18:523–530
13. Yoo TW, Sung KC, Shin HS, et al. Relationship between serum uric acidconcentration and insulin resistance and metabolic syndrome. Circ J 2005;69:928–933
14. Cirillo P, Sato W, Reungjui S, et al. Uric acid, the metabolic syndrome, andrenal disease. J Am Soc Nephrol 2006;17(Suppl. 3):S165–S168
15. Sautin YY, Nakagawa T, Zharikov S, Johnson RJ. Adverse effects of theclassic antioxidant uric acid in adipocytes: NADPH oxidase-mediatedoxidative/nitrosative stress. Am J Physiol Cell Physiol 2007;293:C584–C596
16. Kershaw EE, Flier JS. Adipose tissue as an endocrine organ. J Clin En-docrinol Metab 2004;89:2548–2556
17. Scherer PE. Adipose tissue: from lipid storage compartment to endocrineorgan. Diabetes 2006;55:1537–1545
18. Kadowaki T, Yamauchi T. Adiponectin and adiponectin receptors. EndocrRev 2005;26:439–451
19. Matsuzawa Y. Adiponectin: identification, physiology and clinical rele-vance in metabolic and vascular disease. Atheroscler Suppl 2005;6:7–14
20. Lihn AS, Pedersen SB, Richelsen B. Adiponectin: action, regulation andassociation to insulin sensitivity. Obes Rev 2005;6:13–21
21. Goldstein BJ, Scalia R. Adiponectin: a novel adipokine linking adipocytesand vascular function. J Clin Endocrinol Metab 2004;89:2563–2568
22. Lau DC, Dhillon B, Yan H, Szmitko PE, Verma S. Adipokines: molecularlinks between obesity and atheroslcerosis. Am J Physiol Heart Circ Physiol2005;288:H2031–H2041
23. Berg AH, Scherer PE. Adipose tissue, inflammation, and cardiovasculardisease. Circ Res 2005;96:939–949
24. Wellen KE, Hotamisligil GS. Obesity-induced inflammatory changes inadipose tissue. J Clin Invest 2003;112:1785–1788
25. Wellen KE, Hotamisligil GS. Inflammation, stress, and diabetes. J Clin In-vest 2005;115:1111–1119
26. Hotamisligil GS, Shargill NS, Spiegelman BM. Adipose expression of tumornecrosis factor-alpha: direct role in obesity-linked insulin resistance. Sci-ence 1993;259:87–91
27. Kanda H, Tateya S, Tamori Y, et al. MCP-1 contributes to macrophageinfiltration into adipose tissue, insulin resistance, and hepatic steatosis inobesity. J Clin Invest 2006;116:1494–1505
28. Sartipy P, Loskutoff DJ. Monocyte chemoattractant protein 1 in obesityand insulin resistance. Proc Natl Acad Sci USA 2003;100:7265–7270
29. Peelman F, Waelput W, Iserentant H, et al. Leptin: linking adipocyte me-tabolism with cardiovascular and autoimmune diseases. Prog Lipid Res2004;43:283–301
30. Hug C, Lodish HF. The role of the adipocyte hormone adiponectin incardiovascular disease. Curr Opin Pharmacol 2005;5:129–134
31. Kanellis J, Watanabe S, Li JH, et al. Uric acid stimulates monocyte che-moattractant protein-1 production in vascular smooth muscle cells viamitogen-activated protein kinase and cyclooxygenase-2. Hypertension2003;41:1287–1293
HYPERURICEMIA AND ADIPOSE TISSUE
1268 DIABETES, VOL. 60, APRIL 2011 diabetes.diabetesjournals.org

32. Kang DH, Park SK, Lee IK, Johnson RJ. Uric acid-induced C-reactiveprotein expression: implication on cell proliferation and nitric oxide pro-duction of human vascular cells. J Am Soc Nephrol 2005;16:3553–3562
33. Huang KC, Lue BH, Yen RF, et al. Plasma adiponectin levels and metabolicfactors in nondiabetic adolescents. Obes Res 2004;12:119–124
34. Yamamoto Y, Hirose H, Saito I, et al. Correlation of the adipocyte-derivedprotein adiponectin with insulin resistance index and serum high-densitylipoprotein-cholesterol, independent of body mass index, in the Japanesepopulation. Clin Sci (Lond) 2002;103:137–142
35. Tamba S, Nishizawa H, Funahashi T, et al. Relationship between the serumuric acid level, visceral fat accumulation and serum adiponectin concen-tration in Japanese men. Intern Med 2008;47:1175–1180
36. Kono H, Rock KL. How dying cells alert the immune system to danger. NatRev Immunol 2008;8:279–289
37. Shi Y, Evans JE, Rock KL. Molecular identification of a danger signal thatalerts the immune system to dying cells. Nature 2003;425:516–521
38. Cheung KJ, Tzameli I, Pissios P, et al. Xanthine oxidoreductase is a regu-lator of adipogenesis and PPARgamma activity. Cell Metab 2007;5:115–128
39. Charles River Informational Resources. The C57BL/6NCrl-Leprdb-lb/CrlMouse: A Model for Metabolic Syndrome/Pre-Diabetes [Internet], 2008.Available from http://www.criver.com/SiteCollectionDocuments/rm_rm_r_POUND_MOUSE_fact_sheet.pdf. Accessed 10 April 2010
40. Erdely A, Wagner L, Muller V, Szabo A, Baylis C. Protection of wistar furthrats from chronic renal disease is associated with maintained renal nitricoxide synthase. J Am Soc Nephrol 2003;14:2526–2533
41. Muller V, Tain YL, Croker B, Baylis C. Chronic nitric oxide deficiency andprogression of kidney disease after renal mass reduction in the C57Bl6mouse. Am J Nephrol 2010;32:575–580
42. Xu H, Barnes GT, Yang Q, et al. Chronic inflammation in fat plays a crucialrole in the development of obesity-related insulin resistance. J Clin Invest2003;112:1821–1830
43. Johnson RJ, Titte S, Cade JR, Rideout BA, Oliver WJ. Uric acid, evolutionand primitive cultures. Semin Nephrol 2005;25:3–8
44. Weisberg SP, McCann D, Desai M, Rosenbaum M, Leibel RL, Ferrante AW,Jr. Obesity is associated with macrophage accumulation in adipose tissue.J Clin Invest 2003;112:1796–1808
45. Furukawa S, Fujita T, Shimabukuro M, et al. Increased oxidative stress inobesity and its impact on metabolic syndrome. J Clin Invest 2004;114:1752–1761
46. Kadowaki T, Yamauchi T, Kubota N, Hara K, Ueki K, Tobe K. Adiponectinand adiponectin receptors in insulin resistance, diabetes, and the meta-bolic syndrome. J Clin Invest 2006;116:1784–1792
47. Kosugi T, Nakayama T, Heinig M, et al. Effect of lowering uric acid onrenal disease in the type 2 diabetic db/db mice. Am J Physiol Renal Physiol2009;297:F481–F488
48. Ruan H, Pownall HJ, Lodish HF. Troglitazone antagonizes tumor necrosisfactor-alpha-induced reprogramming of adipocyte gene expression by in-hibiting the transcriptional regulatory functions of NF-kappaB. J BiolChem 2003;278:28181–28192
49. Liu M, Liu F. Transcriptional and post-translational regulation of adipo-nectin. Biochem J 2010;425:41–52
50. Tsuchida A, Yamauchi T, Takekawa S, et al. Peroxisome proliferator-activated receptor (PPAR)alpha activation increases adiponectin receptorsand reduces obesity-related inflammation in adipose tissue: comparison ofactivation of PPARalpha, PPARgamma, and their combination. Diabetes 2005;54:3358–3370
W. BALDWIN AND ASSOCIATES
diabetes.diabetesjournals.org DIABETES, VOL. 60, APRIL 2011 1269