origin and evolution of large brains in toothed whales
TRANSCRIPT

Origin and Evolution of Large Brainsin Toothed Whales
LORI MARINO,1* DANIEL W. MCSHEA,2 AND MARK D. UHEN3
1Neuroscience and Behavioral Biology Program, Emory University, Atlanta, Georgia2Department of Biology, Duke University, Durham, North Carolina
3Cranbrook Institute of Science, Bloomfield Hills, Michigan
ABSTRACTToothed whales (order Cetacea: suborder Odontoceti) are highly en-
cephalized, possessing brains that are significantly larger than expected fortheir body sizes. In particular, the odontocete superfamily Delphinoidea(dolphins, porpoises, belugas, and narwhals) comprises numerous specieswith encephalization levels second only to modern humans and greater thanall other mammals. Odontocetes have also demonstrated behavioral facul-ties previously only ascribed to humans and, to some extent, other greatapes. How did the large brains of odontocetes evolve? To begin to investigatethis question, we quantified and averaged estimates of brain and body sizefor 36 fossil cetacean species using computed tomography and analyzedthese data along with those for modern odontocetes. We provide the firstdescription and statistical tests of the pattern of change in brain sizerelative to body size in cetaceans over 47 million years. We show that brainsize increased significantly in two critical phases in the evolution of odon-tocetes. The first increase occurred with the origin of odontocetes from theancestral group Archaeoceti near the Eocene-Oligocene boundary and wasaccompanied by a decrease in body size. The second occurred in the originof Delphinoidea only by 15 million years ago. © 2004 Wiley-Liss, Inc.
Key words: cetacean; encephalization; odontocetes
Primates are known for their elaborated brains andhigh encephalization levels, i.e., larger brains than ex-pected for their body sizes (Marino, 1998). The only othermammalian group that rivals primates in this regard iscetaceans (dolphins, porpoises, and whales). Modern ceta-ceans have been evolving separately from their closestliving sister taxa for at least 52 Ma (Gingerich and Uhen,1998) and from Primates for up to 92 Ma (Kumar andBlair Hedges, 1998). The limited data prior to this studyshows that the earliest cetaceans possessed low enceph-alization levels well below one (Jerison, 1973; Gingerich,1998; Marino et al., 2000), as was typical of Cretaceousmammals (Jerison, 1973), among which are likely thecommon ancestor of Primates and Cetacea. Many moderntoothed whale (suborder: Odontoceti) species, on the otherhand, possess extremely high encephalization levels sec-ond only to that of modern humans (Marino, 1998) andtherefore have undergone substantial increases in enceph-alization during their evolutionary history. Likewise,there is evidence for convergent behavioral abilities be-tween odontocetes and humans plus great apes as well(Marino, 2002). These include mirror self-recognition(Reiss and Marino, 2001), comprehension of artificial sym-
bol-based communication systems and abstract concepts(Herman, 2002), and the learning and intergenerationaltransmission of behaviors that have been described ascultural (Rendall and Whitehead, 2001).
Despite these commonalities, the odontocete evolution-ary pathway has proceeded under a very different selec-tive regime from that of primates. Therefore, the highlyexpanded brain size and behavioral abilities of odonto-cetes are, in a sense, convergently shared with humans. Adescription of the pattern of encephalization in toothedwhales has enormous potential to yield new insights intoodontocete evolution, whether there are shared featureswith hominoid brain evolution, and more generally how
*Correspondence to: Lori Marino, Neuroscience and BehavioralBiology Program, 1462 Clifton Road, Suite 304, Emory Univer-sity, Atlanta, GA 30322. Fax: 404-727-7471.E-mail: [email protected]
Received 13 May 2004; Accepted 29 June 2004DOI 10.1002/ar.a.20128Published online 20 October 2004 in Wiley InterScience(www.interscience.wiley.com).
THE ANATOMICAL RECORD PART A 281A:1247–1255 (2004)
© 2004 WILEY-LISS, INC.

large brains evolve. Yet, up until now, little has beenknown about the basic pattern of encephalization thatcharacterized odontocete evolution since their adoption ofan aquatic lifestyle. The present study provides the firstcomprehensive description and statistical tests of the pat-tern of change in encephalization level in cetaceans over47 million years.
MATERIALS AND METHODSScanning and Measurement of EndocranialVolume
Fossil cetacean endocranial volumes were measuredfrom computed tomography (CT) scans acquired with aSiemens Somatom SP scanner at the National Museum ofNatural History (USNM), Smithsonian Institution. Imageacquisition, analysis, and file conversions were controlledby Siemens SOMARIS software. OSIRIS software wasused to convert Siemens image files into DICOM images.Additional scans were obtained at the Medical Universityof Charleston in Charleston, South Carolina, on a MarconiMX8000 multiple-slice spiral scanner and at MethodistHospital in Arcadia, California, on a Picker PQ 5000 sin-gle-slice spiral scanner. Contiguous 1–2 mm coronal scansof the entire cranium of each specimen were obtainedusing different scanning parameters depending on theestimated density of the fossil and endocranial matrix,level of permineralization of the bone, and whether theskull was embedded in hardened matrix (Marino et al.,2003).
Each coronal slice through the endocranial cavity wastraced manually using Scion Image or ImageJ image anal-ysis software to calculate the area of endocranial space ineach slice. The slice areas were then multiplied by theslice thickness and summed to determine the endocranialvolume for each specimen, which was used as an estimateof brain mass. Endocranial volume can be converted tomass using the density of brain tissue, approximately 1.0g/ml, and can be measured directly in modern cetaceans.Previous within-rater and between-rater intraclass corre-lation coefficients for a subset of archaeocete specimensranged from 0.91 to 0.98, indicating extremely high agree-ment across ratings of these specimens. Figure 1A dis-plays an example of a fossil odontocete cranium from thesample and Figure 1B displays an example of a coronal CTimage through a fossil odontocete cranium.
The volume of the endocranial space is an overestimateof brain size because cetaceans have an endocranial vas-cular structure known as the rete mirabile that also occu-pies this space. From fossil and recent specimens in whichthe rete mirabile volume can be measured or accuratelyestimated, it has been shown that the relative size of therete mirabile has not systematically changed over time(Marino, 1995; Marino et al., 2000).
A total of 66 fossil cetacean crania were scanned andmeasured. This subset was added to brain and bodyweight data from a total of 144 modern cetacean speci-mens for a total sample in the present study of 210 spec-imens representing 37 families and 62 species. The datafor each modern and fossil species in the present study aredisplayed in Table 1.
Estimation of Body MassSince very few fossil cetacean specimens include entire
skeletons from which one can obtain a skeletal length orthe multiple anatomical measurements needed to esti-mate body mass from postcranial elements, we selectedthe occipital condyle breadth (OCB) to predict body size ofodontocetes. OCB was measured on a wide range of mod-ern cetacean specimens with known body masses and wasstrongly correlated with body mass (r2 � 0.79). This al-lowed us to use the regression parameters from that anal-ysis to estimate body mass for fossil cetacean specimenswhen only the cranium was available.
Calculation of Encephalization QuotientsEncephalization is typically expressed as an enceph-
alization quotient (EQ). EQ is an index that quantifieshow much larger or smaller a given animal’s brain isrelative to the expected brain size for an animal at thatbody size (Jerison, 1973). Brains with EQs larger than 1are larger than the expected size, while those less than 1are smaller than the expected size. EQ values were calcu-lated for each specimen in the present study using mea-sured endocranial volumes (or fresh brain weight in someRecent specimens) and estimated body sizes in fossils andactual body weights for all Recent specimens (Marino etal., 2003). The equation EQ � brain weight/0.12 (bodyweight)0.67 from Jerison (1973) was used to derive EQvalues (hereafter referred to as EQ0.67) for each genus or,when possible, each species represented in our sample.
Fig. 1. A: Photograph of early-mid Miocene fossil odontocete (Rhabdosteus longirostris, USNM 187213).B: Coronal 1.22 mm thick CT image of the same specimen showing differentiation of the hardened matrix thatfills the endocranial area and the surrounding bone.
1248 MARINO ET AL.
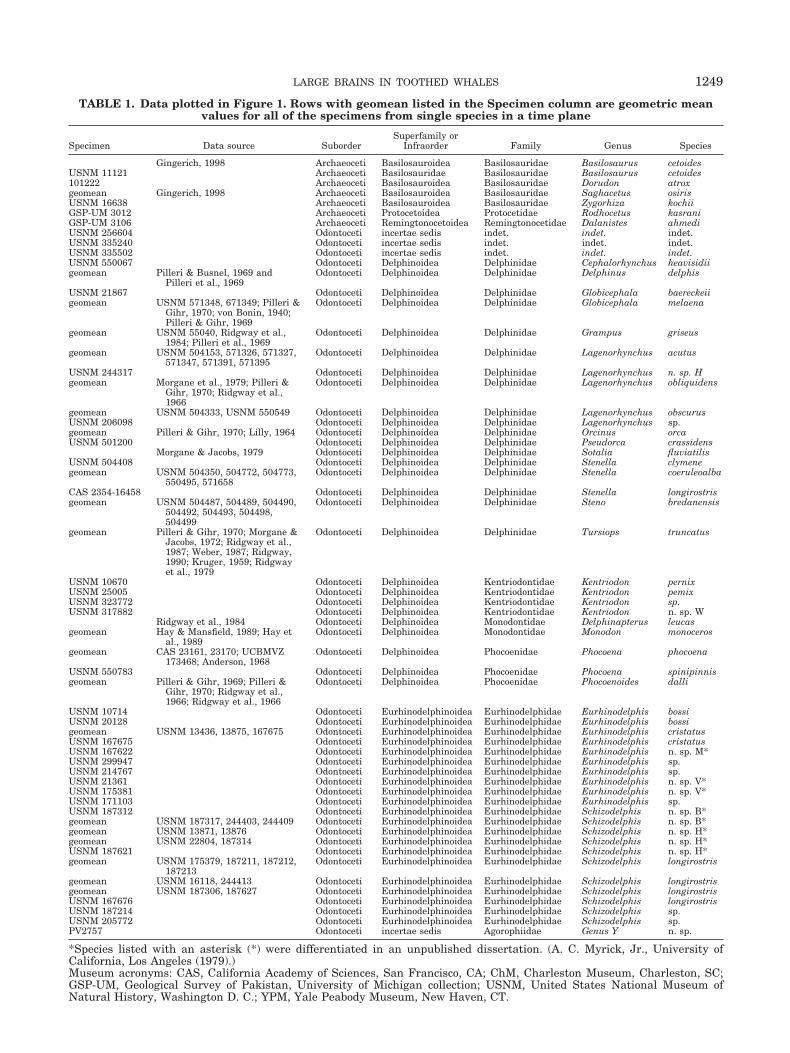
TABLE 1. Data plotted in Figure 1. Rows with geomean listed in the Specimen column are geometric meanvalues for all of the specimens from single species in a time plane
Specimen Data source SuborderSuperfamily or
Infraorder Family Genus Species
Gingerich, 1998 Archaeoceti Basilosauroidea Basilosauridae Basilosaurus cetoidesUSNM 11121 Archaeoceti Basilosauridae Basilosauridae Basilosaurus cetoides101222 Archaeoceti Basilosauroidea Basilosauridae Dorudon atroxgeomean Gingerich, 1998 Archaeoceti Basilosauroidea Basilosauridae Saghacetus osirisUSNM 16638 Archaeoceti Basilosauroidea Basilosauridae Zygorhiza kochiiGSP-UM 3012 Archaeoceti Protocetoidea Protocetidae Rodhocetus kasraniGSP-UM 3106 Archaeoceti Remingtonocetoidea Remingtonocetidae Dalanistes ahmediUSNM 256604 Odontoceti incertae sedis indet. indet. indet.USNM 335240 Odontoceti incertae sedis indet. indet. indet.USNM 335502 Odontoceti incertae sedis indet. indet. indet.USNM 550067 Odontoceti Delphinoidea Delphinidae Cephalorhynchus heavisidiigeomean Pilleri & Busnel, 1969 and
Pilleri et al., 1969Odontoceti Delphinoidea Delphinidae Delphinus delphis
USNM 21867 Odontoceti Delphinoidea Delphinidae Globicephala baereckeiigeomean USNM 571348, 671349; Pilleri &
Gihr, 1970; von Bonin, 1940;Pilleri & Gihr, 1969
Odontoceti Delphinoidea Delphinidae Globicephala melaena
geomean USNM 55040, Ridgway et al.,1984; Pilleri et al., 1969
Odontoceti Delphinoidea Delphinidae Grampus griseus
geomean USNM 504153, 571326, 571327,571347, 571391, 571395
Odontoceti Delphinoidea Delphinidae Lagenorhynchus acutus
USNM 244317 Odontoceti Delphinoidea Delphinidae Lagenorhynchus n. sp. Hgeomean Morgane et al., 1979; Pilleri &
Gihr, 1970; Ridgway et al.,1966
Odontoceti Delphinoidea Delphinidae Lagenorhynchus obliquidens
geomean USNM 504333, USNM 550549 Odontoceti Delphinoidea Delphinidae Lagenorhynchus obscurusUSNM 206098 Odontoceti Delphinoidea Delphinidae Lagenorhynchus sp.geomean Pilleri & Gihr, 1970; Lilly, 1964 Odontoceti Delphinoidea Delphinidae Orcinus orcaUSNM 501200 Odontoceti Delphinoidea Delphinidae Pseudorca crassidens
Morgane & Jacobs, 1979 Odontoceti Delphinoidea Delphinidae Sotalia fluviatilisUSNM 504408 Odontoceti Delphinoidea Delphinidae Stenella clymenegeomean USNM 504350, 504772, 504773,
550495, 571658Odontoceti Delphinoidea Delphinidae Stenella coeruleoalba
CAS 2354-16458 Odontoceti Delphinoidea Delphinidae Stenella longirostrisgeomean USNM 504487, 504489, 504490,
504492, 504493, 504498,504499
Odontoceti Delphinoidea Delphinidae Steno bredanensis
geomean Pilleri & Gihr, 1970; Morgane &Jacobs, 1972; Ridgway et al.,1987; Weber, 1987; Ridgway,1990; Kruger, 1959; Ridgwayet al., 1979
Odontoceti Delphinoidea Delphinidae Tursiops truncatus
USNM 10670 Odontoceti Delphinoidea Kentriodontidae Kentriodon pernixUSNM 25005 Odontoceti Delphinoidea Kentriodontidae Kentriodon pemixUSNM 323772 Odontoceti Delphinoidea Kentriodontidae Kentriodon sp.USNM 317882 Odontoceti Delphinoidea Kentriodontidae Kentriodon n. sp. W
Ridgway et al., 1984 Odontoceti Delphinoidea Monodontidae Delphinapterus leucasgeomean Hay & Mansfield, 1989; Hay et
al., 1989Odontoceti Delphinoidea Monodontidae Monodon monoceros
geomean CAS 23161, 23170; UCBMVZ173468; Anderson, 1968
Odontoceti Delphinoidea Phocoenidae Phocoena phocoena
USNM 550783 Odontoceti Delphinoidea Phocoenidae Phocoena spinipinnisgeomean Pilleri & Gihr, 1969; Pilleri &
Gihr, 1970; Ridgway et al.,1966; Ridgway et al., 1966
Odontoceti Delphinoidea Phocoenidae Phocoenoides dalli
USNM 10714 Odontoceti Eurhinodelphinoidea Eurhinodelphidae Eurhinodelphis bossiUSNM 20128 Odontoceti Eurhinodelphinoidea Eurhinodelphidae Eurhinodelphis bossigeomean USNM 13436, 13875, 167675 Odontoceti Eurhinodelphinoidea Eurhinodelphidae Eurhinodelphis cristatusUSNM 167675 Odontoceti Eurhinodelphinoidea Eurhinodelphidae Eurhinodelphis cristatusUSNM 167622 Odontoceti Eurhinodelphinoidea Eurhinodelphidae Eurhinodelphis n. sp. M*USNM 299947 Odontoceti Eurhinodelphinoidea Eurhinodelphidae Eurhinodelphis sp.USNM 214767 Odontoceti Eurhinodelphinoidea Eurhinodelphidae Eurhinodelphis sp.USNM 21361 Odontoceti Eurhinodelphinoidea Eurhinodelphidae Eurhinodelphis n. sp. V*USNM 175381 Odontoceti Eurhinodelphinoidea Eurhinodelphidae Eurhinodelphis n. sp. V*USNM 171103 Odontoceti Eurhinodelphinoidea Eurhinodelphidae Eurhinodelphis sp.USNM 187312 Odontoceti Eurhinodelphinoidea Eurhinodelphidae Schizodelphis n. sp. B*geomean USNM 187317, 244403, 244409 Odontoceti Eurhinodelphinoidea Eurhinodelphidae Schizodelphis n. sp. B*geomean USNM 13871, 13876 Odontoceti Eurhinodelphinoidea Eurhinodelphidae Schizodelphis n. sp. H*geomean USNM 22804, 187314 Odontoceti Eurhinodelphinoidea Eurhinodelphidae Schizodelphis n. sp. H*USNM 187621 Odontoceti Eurhinodelphinoidea Eurhinodelphidae Schizodelphis n. sp. H*geomean USNM 175379, 187211, 187212,
187213Odontoceti Eurhinodelphinoidea Eurhinodelphidae Schizodelphis longirostris
geomean USNM 16118, 244413 Odontoceti Eurhinodelphinoidea Eurhinodelphidae Schizodelphis longirostrisgeomean USNM 187306, 187627 Odontoceti Eurhinodelphinoidea Eurhinodelphidae Schizodelphis longirostrisUSNM 167676 Odontoceti Eurhinodelphinoidea Eurhinodelphidae Schizodelphis longirostrisUSNM 187214 Odontoceti Eurhinodelphinoidea Eurhinodelphidae Schizodelphis sp.USNM 205772 Odontoceti Eurhinodelphinoidea Eurhinodelphidae Schizodelphis sp.PV2757 Odontoceti incertae sedis Agorophiidae Genus Y n. sp.
*Species listed with an asterisk (*) were differentiated in an unpublished dissertation. (A. C. Myrick, Jr., University ofCalifornia, Los Angeles (1979).)Museum acronyms: CAS, California Academy of Sciences, San Francisco, CA; ChM, Charleston Museum, Charleston, SC;GSP-UM, Geological Survey of Pakistan, University of Michigan collection; USNM, United States National Museum ofNatural History, Washington D. C.; YPM, Yale Peabody Museum, New Haven, CT.
1249LARGE BRAINS IN TOOTHED WHALES

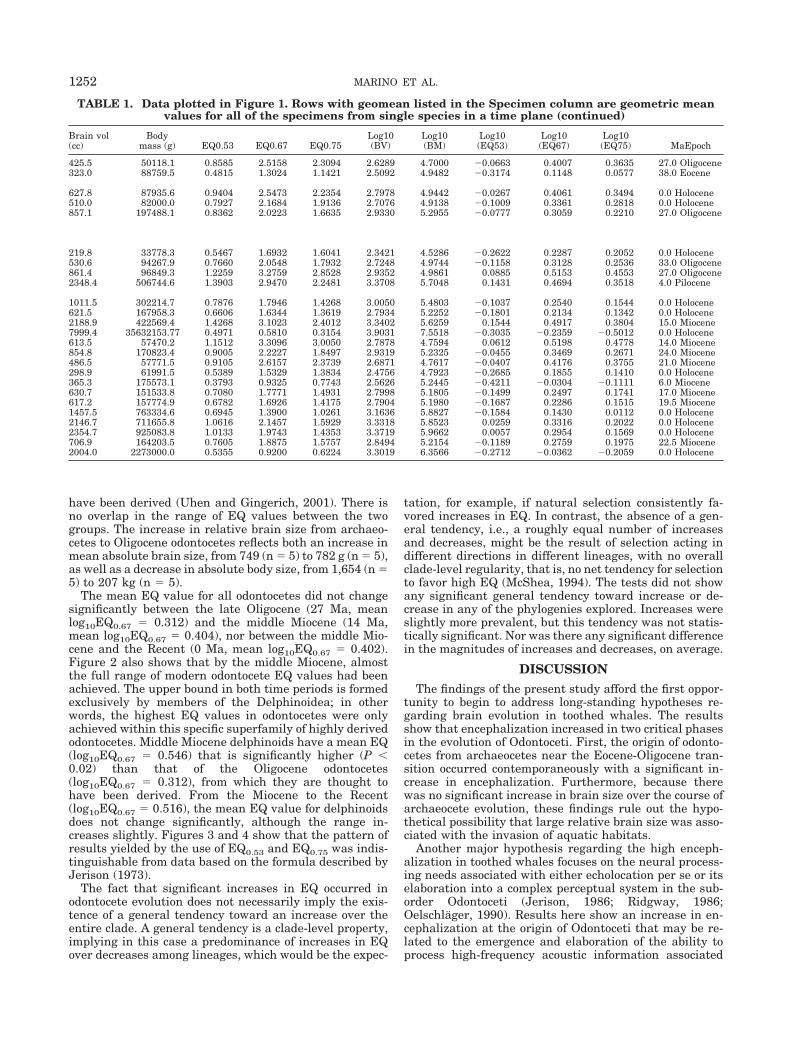
TABLE 1. Data plotted in Figure 1. Rows with geomean listedin the Specimen column are geometric meanvalues for all of the specimens from single species in a time plane (continued)
Brain vol(cc)
Bodymass (g) EQ0.53 EQ0.67 EQ0.75
Log10(BV)
Log10(BM)
Log10(EQ53)
Log10(EQ67)
Log10(EQ75) MaEpoch
2240.0 6480000.0 0.3436 0.5097 0.3171 3.3502 6.8116 �0.4640 �0.2927 �0.4988 39.0 Eocene302.8 730849.1 0.1476 0.2973 0.2202 2.4811 5.8638 �0.8308 �0.5268 �0.6571 37.0 Eocene1185.4 2240000.0 0.3192 0.5496 0.3722 3.0739 6.3502 �0.4959 �0.2600 �0.4292 39.0 Eocene388.0 350000.0 0.2795 0.6239 0.4902 2.5888 5.5441 �0.5537 �0.2049 �0.3096 39.0 Eocene800.8 2040000.0 0.2266 0.3953 0.2697 2.9035 6.3096 �0.6447 �0.4031 �0.5691 37.0 Eocene291.0 290000.0 0.2316 0.5308 0.4234 2.4639 5.4624 �0.6353 �0.2751 �0.3733 47.0 Eocene400.0 750000.0 0.1924 0.3860 0.2854 2.6021 5.8751 �0.7158 �0.4134 �0.5446 45.0 Eocene256.7 78081.8 0.4096 1.1280 0.9994 2.4095 4.8925 �0.3877 0.0523 �0.0003 27.0 Oligocene302.4 78081.8 0.4824 1.3287 1.1772 2.4806 4.8925 �0.3166 0.1234 0.0708 17.0 Miocene507.5 54810.8 0.9766 2.8263 2.5759 2.7054 4.7389 �0.0103 0.4512 0.4109 27.0 Oligocene763.0 71000.0 1.2801 3.5727 3.1895 2.8825 4.8513 0.1072 0.5530 0.5037 0.0 Holocene814.3 59980.7 1.4939 4.2691 3.8629 2.9108 4.7780 0.1743 0.6303 0.5869 0.0 Holocene
4165.9 900766.2 1.8182 3.5558 2.5905 3.6197 5.9546 0.2596 0.5509 0.4134 1.0 Pliocene2861.7 938074.6 1.2224 2.3771 1.7262 3.4566 5.9722 0.0872 0.3760 0.2371 0.0 Holocene
2384.4 319974.0 1.8011 4.0717 3.2224 3.3774 5.5051 0.2555 0.6098 0.5082 0.0 Holocene
1100.5 244217.1 0.9593 2.2521 1.8213 3.0416 5.3878 �0.0181 0.3526 0.2604 0.0 Holocene
1129.2 98673.7 1.5912 4.2411 3.6878 3.0528 4.9942 0.2017 0.6275 0.5668 14.0 Miocene1045.0 63500.0 1.8601 5.2732 4.7498 3.0191 4.8028 0.2695 0.7221 0.6767 0.0 Holocene
886.1 58473.1 1.6478 4.7257 4.2848 2.9475 4.7670 0.2169 0.6745 0.6319 0.0 Holocene1344.0 112804.5 1.7642 4.6149 3.9700 3.1284 5.0523 0.2465 0.6642 0.5988 14.0 Miocene5028.0 1953201.4 1.4561 2.5551 1.7497 3.7014 6.2907 0.1632 0.4074 0.2430 0.0 Holocene3512.0 579196.4 1.9370 4.0298 3.0414 3.5456 5.7628 0.2871 0.6053 0.4831 0.0 Holocene688.0 42200.0 1.5207 4.5651 4.2486 2.8376 4.6253 0.1821 0.6594 0.6282 0.0 Holocene666.0 86000.0 1.0094 2.7500 2.4112 2.8235 4.9345 0.0041 0.4393 0.3822 0.0 Holocene938.5 128715.6 1.1488 2.9500 2.5111 2.9725 5.1096 0.0602 0.4698 0.3999 0.0 Holocene
660.0 66200.0 1.1491 3.2388 2.9076 2.8195 4.8209 0.0604 0.5104 0.4635 0.0 Holocene1541.9 123830.9 1.9264 4.9738 4.2470 3.1881 5.0928 0.2847 0.6967 0.6281 0.0 Holocene
1759.2 206823.8 1.6747 4.0242 3.2980 3.2453 5.3156 0.2239 0.6047 0.5183 0.0 Holocene
230.3 18295.7 0.7928 2.6754 2.6621 2.3624 4.2623 �0.1008 0.4274 0.4252 18.0 Miocene276.0 17036.8 0.9866 3.3628 3.3652 2.4409 4.2314 �0.0058 0.5267 0.5270 15.0 Miocene638.0 41653.3 1.4200 4.2705 3.9786 2.8048 4.6196 0.1523 0.6305 0.5997 14.0 Miocene305.1 49227.1 0.6216 1.8262 1.6787 2.4845 4.6922 �0.2065 0.2615 0.2250 14.0 Miocene2083.0 636000.0 1.0933 2.2449 1.6816 3.3187 5.8035 0.0387 0.3512 0.2257 0.0 Holocene2993.7 1578116.9 0.9707 1.7550 1.2225 3.4762 6.1981 �0.0129 0.2443 0.0872 0.0 Holocene
522.7 53510.9 1.0188 2.9584 2.7014 2.7183 4.7284 0.0081 0.4711 0.4316 0.0 Holocene
597.0 68041.9 1.0244 2.8763 2.5765 2.7760 4.8328 0.0105 0.4588 0.4110 0.0 Holocene861.4 85748.3 1.3076 3.5544 3.1255 2.9352 4.9332 0.1165 0.5508 0.4949 0.0 Holocene
949.3 123019.4 1.1902 3.0758 2.6277 2.9774 5.0900 0.0756 0.4880 0.4196 18.0 Miocene625.9 90009.0 0.9260 2.5001 2.1900 2.7965 4.9543 �0.0334 0.3980 0.3404 14.0 Miocene769.7 91675.6 1.1278 3.0370 2.6563 2.8863 4.9623 0.0522 0.4824 0.4243 14.0 Miocene816.3 191866.9 0.8086 1.9637 1.6190 2.9119 5.2830 �0.0922 0.2931 0.2093 15.0 Miocene531.8 64044.8 0.9424 2.6684 2.4019 2.7258 4.8065 �0.0258 0.4263 0.3806 14.0 Miocene431.5 57771.5 0.8075 2.3196 2.1052 2.6349 4.7617 �0.0929 0.3654 0.3233 19.5 Miocene574.5 98673.7 0.8096 2.1577 1.8762 2.7593 4.9942 �0.0918 0.3340 0.2733 14.0 Miocene543.1 78081.8 0.8663 2.3859 2.1138 2.7348 4.8925 �0.0623 0.3777 0.3251 16.0 Miocene627.2 184651.4 0.6341 1.5481 1.2803 2.7974 5.2664 �0.1979 0.1898 0.1073 15.0 Miocene650.8 57771.5 1.2180 3.4989 3.1755 2.8135 4.7617 0.0856 0.5439 0.5018 14.0 Miocene346.1 74378.7 0.5666 1.5711 1.3973 2.5393 4.8714 �0.2467 0.1962 0.1453 14.0 Miocene478.9 64903.9 0.8427 2.3816 2.1415 2.6803 4.8123 �0.0743 0.3769 0.3307 15.0 Miocene642.7 57029.5 1.2110 3.4852 3.1663 2.8080 4.7561 0.0831 0.5422 0.5006 16.0 Miocene342.1 62426.2 0.6144 1.7461 1.5749 2.5341 4.7954 �0.2115 0.2421 0.1973 14.0 Miocene476.9 85893.8 0.7232 1.9654 1.7281 2.6784 4.9340 �0.1407 0.2935 0.2376 15.0 Miocene388.1 94819.0 0.5585 1.4969 1.3058 2.5889 4.9769 �0.2530 0.1752 0.1159 14.0 Miocene
495.1 89983.5 0.7326 1.9781 1.7327 2.6947 4.9542 �0.1351 0.2962 0.2387 15.0 Miocene595.6 84253.0 0.9125 2.4866 2.1896 2.7749 4.9256 �0.0398 0.3956 0.3404 16.0 Miocene361.2 90009.0 0.5344 1.4428 1.2638 2.5577 4.9543 �0.2721 0.1592 0.1017 17.0 Miocene328.0 78081.8 0.5232 1.4409 1.2766 2.5158 4.8925 �0.2813 0.1586 0.1061 14.0 Miocene416.2 67363.3 0.7179 2.0186 1.8096 2.6193 4.8284 �0.1439 0.3050 0.2576 15.0 Miocene1234.4 594725.0 0.6713 1.3915 1.0480 3.0914 5.7743 �0.1731 0.1435 0.0203 27.0 Oligocene
1250 MARINO ET AL.

Standard EQ values, like most ratios, are not normallydistributed. To avoid the problematic statistical propertiesof ratios and to be able to perform parametric statisticaltests on EQ values, log10EQ0.67 values were calculated. Allstatistical tests were performed on the logged values,which has the same outcome as taking residuals betweenlogged actual and logged expected brain mass values. EQvalues can be calculated using alternative methods to thatof Jerison (1973). One way is to derive the regressionparameters empirically from the actual sample. The re-sulting regression equation is the following: EQ � brainweight/1.6 (body weight)0.53. Another popular format forEQ is based on the work of Armstrong (1985), Eisenberg(1981), and others. This approach results in a regressionequation of EQ � brain weight/0.055 (body weight)0.75. Wecalculated EQ for our sample based on these two alterna-tive methods, hereafter known as EQ0.53 and EQ0.75.
Tests of Mean DifferencesEach test for a mean difference was conducted using a
bootstrap method in which specimens from the groups tobe compared were pooled and repeatedly sampled 10,000times with replacement to produce a distribution of differ-ences between the means. In most comparisons conducted,the actual difference between the two means was outsidethe range of the bootstrapped distribution of differences.
Tests for Directional TendenciesA tendency toward increase or decrease in EQ values
was tested by reconstructing ancestral states at nodesusing parsimony (Maddison and Maddison, 1992), fossilfirst occurrences (Alroy, 1998), and maximum likelihood(Pagel, 1997) methods using published phylogenies for theDelphinoidea (de Muizon, 1988), Odontoceti (de Muizon,
1991), and Cetacea (Geisler and Sanders, 2003) based onfossil and extant morphology and a phylogeny based onmolecular data for Cetacea (Nikaido et al., 2001). Forparsimony and fossil first occurrences, nodal states werereconstructed and then compared to the values for adja-cent nodes to produce counts of increase and decrease. Inthe fossil first-occurrence method, each node in the treewas assigned the same state as the descendent taxon withthe earliest first occurrence. For maximum likelihood, alikelihood value was calculated for a model of evolutionthat includes a tendency toward increase or decrease.Then, another likelihood value was calculated for a nullmodel in which no tendency toward increase or decreaseexists. Finally, the likelihood value for the model repre-senting a tendency was compared to the likelihood valuefor the null model to determine if the first is significantlyhigher than the second.
RESULTSFigure 2 shows the mean values of EQ0.67 and
log10EQ0.67 for the modern and fossil genera or species inthe present sample. The range of values measured formodern odontocetes is shown at the top of Figure 2, at 0Ma. Modern odontocetes have EQ0.67 values ranging fromslightly less than 1 to slightly greater than 5, indicatingthat most modern odontocetes are more encephalized thanaverage mammals at all body sizes occupied by odonto-cetes. Humans have an EQ0.67 of about 7 on this scale(Marino, 1998).
The most striking finding is that Oligocene odontocetes(mean log10EQ0.67 � 0.312) are significantly more highlyencephalized (bootstrap test of difference between means,P � 0.0001) than the Eocene archaeocetes (meanlog10EQ0.67 � �0.339), from which they are thought to
TABLE 1. Data plotted in Figure 1. Rows with geomean listed in the Specimen column are geometric meanvalues for all of the specimens from single species in a time plane (continued)
Specimen Data source SuborderSuperfamily or
Infraorder Family Genus Species
PV4961 Odontoceti incertae sedis Eosqualodontidae n. gen. n. sp.USNM 205491 Odontoceti Eurhinodelphinoidea Eurhinodelphidae n. gen. n. sp.
geomeanPilleri & Gihr, 1968; Best & Da
Silva, 1989; Best et al., 1989 Odontoceti incertae sedis Iniidae Inia geoffrensisOdontoceti incertae sedis Lipotidae Lipotes vexillifer
PV2761 Odontoceti incertae sedis Patriocetidae n. gen. n. sp.
geomean
USNM 501125; 501126; 501168;Pilleri & Gihr, 1970; Kamiya& Yamasaki, 1974; Kamiya etal., 1974 Odontoceti incertae sedis Pontoporiidae Pontoporia blainvillei
USNM 256517 Odontoceti incertae sedis Simocetidae Simocetus rayiPV4266 Odontoceti incertae sedis Xenorophidae Xenorophus n. sp.USNM 187015 Odontoceti Physeteroidea Kogiidae n. gen. n. sp.
geomeanUSNM 302040; 550396; Ridgway
et al., 1984 Odontoceti Physeteroidea Kogiidae Kogia brevicepsgeomean USNM 550482; 550487 Odontoceti Physeteroidea Kogiidae Kogia simus14730 Odontoceti Physeteroidea Physeteridae Orycterocetus crocodilinusgeomean Pilleri & Gihr, 1970 Odontoceti Physeteroidea Physeteridae Physeter macrocephalusUSNM 425788 Odontoceti Platanistoidea indet. indet. indet.YPM 13408 Odontoceti Platanistoidea Platanistidae Allodelphis prattiUSNM 214911 Odontoceti Platanistoidea Platanistidae indet. indet.geomean Pilleri & Gihr, 1970 Odontoceti Platanistoidea Platanistidae Platanista gangeticaUSNM 323775 Odontoceti Platanistoidea Platanistidae Pomatodelphis? sp.USNM 10484 Odontoceti Platanistoidea Squalodontidae Squalodon calvertensisUSNM 328343 Odontoceti Platanistoidea Squalodontidae Squalodon calvertensisgeomean USNM 504217; 550338; 550754 Odontoceti Ziphioidea ZZiphiidae Mesoplodon densirostrisgeomean USNM 550105; 550390 Odontoceti Ziphioidea Ziphidae Mesoplodon europaeusgeomean USNM 504612; 504724 Odontoceti Ziphioidea Ziphiidae Mesoplodon mirusUSNM 181528 Odontoceti Ziphioidea Ziphiidae Squaloziphius emlongi
Ridgway & Brownson, 1984 Odontoceti Ziphioidea Ziphiidae Ziphius cavirostris
1251LARGE BRAINS IN TOOTHED WHALES
have been derived (Uhen and Gingerich, 2001). There isno overlap in the range of EQ values between the twogroups. The increase in relative brain size from archaeo-cetes to Oligocene odontocetes reflects both an increase inmean absolute brain size, from 749 (n � 5) to 782 g (n � 5),as well as a decrease in absolute body size, from 1,654 (n �5) to 207 kg (n � 5).
The mean EQ value for all odontocetes did not changesignificantly between the late Oligocene (27 Ma, meanlog10EQ0.67 � 0.312) and the middle Miocene (14 Ma,mean log10EQ0.67 � 0.404), nor between the middle Mio-cene and the Recent (0 Ma, mean log10EQ0.67 � 0.402).Figure 2 also shows that by the middle Miocene, almostthe full range of modern odontocete EQ values had beenachieved. The upper bound in both time periods is formedexclusively by members of the Delphinoidea; in otherwords, the highest EQ values in odontocetes were onlyachieved within this specific superfamily of highly derivedodontocetes. Middle Miocene delphinoids have a mean EQ(log10EQ0.67 � 0.546) that is significantly higher (P �0.02) than that of the Oligocene odontocetes(log10EQ0.67 � 0.312), from which they are thought tohave been derived. From the Miocene to the Recent(log10EQ0.67 � 0.516), the mean EQ value for delphinoidsdoes not change significantly, although the range in-creases slightly. Figures 3 and 4 show that the pattern ofresults yielded by the use of EQ0.53 and EQ0.75 was indis-tinguishable from data based on the formula described byJerison (1973).
The fact that significant increases in EQ occurred inodontocete evolution does not necessarily imply the exis-tence of a general tendency toward an increase over theentire clade. A general tendency is a clade-level property,implying in this case a predominance of increases in EQover decreases among lineages, which would be the expec-
tation, for example, if natural selection consistently fa-vored increases in EQ. In contrast, the absence of a gen-eral tendency, i.e., a roughly equal number of increasesand decreases, might be the result of selection acting indifferent directions in different lineages, with no overallclade-level regularity, that is, no net tendency for selectionto favor high EQ (McShea, 1994). The tests did not showany significant general tendency toward increase or de-crease in any of the phylogenies explored. Increases wereslightly more prevalent, but this tendency was not statis-tically significant. Nor was there any significant differencein the magnitudes of increases and decreases, on average.
DISCUSSIONThe findings of the present study afford the first oppor-
tunity to begin to address long-standing hypotheses re-garding brain evolution in toothed whales. The resultsshow that encephalization increased in two critical phasesin the evolution of Odontoceti. First, the origin of odonto-cetes from archaeocetes near the Eocene-Oligocene tran-sition occurred contemporaneously with a significant in-crease in encephalization. Furthermore, because therewas no significant increase in brain size over the course ofarchaeocete evolution, these findings rule out the hypo-thetical possibility that large relative brain size was asso-ciated with the invasion of aquatic habitats.
Another major hypothesis regarding the high enceph-alization in toothed whales focuses on the neural process-ing needs associated with either echolocation per se or itselaboration into a complex perceptual system in the sub-order Odontoceti (Jerison, 1986; Ridgway, 1986;Oelschlager, 1990). Results here show an increase in en-cephalization at the origin of Odontoceti that may be re-lated to the emergence and elaboration of the ability toprocess high-frequency acoustic information associated
TABLE 1. Data plotted in Figure 1. Rows with geomean listed in the Specimen column are geometric meanvalues for all of the specimens from single species in a time plane (continued)
Brain vol(cc)
Bodymass (g) EQ0.53 EQ0.67 EQ0.75
Log10(BV)
Log10(BM)
Log10(EQ53)
Log10(EQ67)
Log10(EQ75) MaEpoch
425.5 50118.1 0.8585 2.5158 2.3094 2.6289 4.7000 �0.0663 0.4007 0.3635 27.0 Oligocene323.0 88759.5 0.4815 1.3024 1.1421 2.5092 4.9482 �0.3174 0.1148 0.0577 38.0 Eocene
627.8 87935.6 0.9404 2.5473 2.2354 2.7978 4.9442 �0.0267 0.4061 0.3494 0.0 Holocene510.0 82000.0 0.7927 2.1684 1.9136 2.7076 4.9138 �0.1009 0.3361 0.2818 0.0 Holocene857.1 197488.1 0.8362 2.0223 1.6635 2.9330 5.2955 �0.0777 0.3059 0.2210 27.0 Oligocene
219.8 33778.3 0.5467 1.6932 1.6041 2.3421 4.5286 �0.2622 0.2287 0.2052 0.0 Holocene530.6 94267.9 0.7660 2.0548 1.7932 2.7248 4.9744 �0.1158 0.3128 0.2536 33.0 Oligocene861.4 96849.3 1.2259 3.2759 2.8528 2.9352 4.9861 0.0885 0.5153 0.4553 27.0 Oligocene2348.4 506744.6 1.3903 2.9470 2.2481 3.3708 5.7048 0.1431 0.4694 0.3518 4.0 Pilocene
1011.5 302214.7 0.7876 1.7946 1.4268 3.0050 5.4803 �0.1037 0.2540 0.1544 0.0 Holocene621.5 167958.3 0.6606 1.6344 1.3619 2.7934 5.2252 �0.1801 0.2134 0.1342 0.0 Holocene2188.9 422569.4 1.4268 3.1023 2.4012 3.3402 5.6259 0.1544 0.4917 0.3804 15.0 Miocene7999.4 35632153.77 0.4971 0.5810 0.3154 3.9031 7.5518 �0.3035 �0.2359 �0.5012 0.0 Holocene613.5 57470.2 1.1512 3.3096 3.0050 2.7878 4.7594 0.0612 0.5198 0.4778 14.0 Miocene854.8 170823.4 0.9005 2.2227 1.8497 2.9319 5.2325 �0.0455 0.3469 0.2671 24.0 Miocene486.5 57771.5 0.9105 2.6157 2.3739 2.6871 4.7617 �0.0407 0.4176 0.3755 21.0 Miocene298.9 61991.5 0.5389 1.5329 1.3834 2.4756 4.7923 �0.2685 0.1855 0.1410 0.0 Holocene365.3 175573.1 0.3793 0.9325 0.7743 2.5626 5.2445 �0.4211 �0.0304 �0.1111 6.0 Miocene630.7 151533.8 0.7080 1.7771 1.4931 2.7998 5.1805 �0.1499 0.2497 0.1741 17.0 Miocene617.2 157774.9 0.6782 1.6926 1.4175 2.7904 5.1980 �0.1687 0.2286 0.1515 19.5 Miocene1457.5 763334.6 0.6945 1.3900 1.0261 3.1636 5.8827 �0.1584 0.1430 0.0112 0.0 Holocene2146.7 711655.8 1.0616 2.1457 1.5929 3.3318 5.8523 0.0259 0.3316 0.2022 0.0 Holocene2354.7 925083.8 1.0133 1.9743 1.4353 3.3719 5.9662 0.0057 0.2954 0.1569 0.0 Holocene706.9 164203.5 0.7605 1.8875 1.5757 2.8494 5.2154 �0.1189 0.2759 0.1975 22.5 Miocene2004.0 2273000.0 0.5355 0.9200 0.6224 3.3019 6.3566 �0.2712 �0.0362 �0.2059 0.0 Holocene
1252 MARINO ET AL.

with echolocation. Echolocation is an ability found in allmodern odontocetes, thought to have existed in all knownfossil odontocetes (Fleischer, 1976; Fordyce and de Mui-zon, 2001) and to have been absent in all archaeocetes(Uhen, 2004). Further investigations of echolocatory abil-ities are currently being undertaken in odontocetes andmysticetes to explore the relationship between changes inencephalization and perception of high-frequency soundas indicated by study of the fine scale anatomy of theinternal periotic.
Figure 3.
Fig. 4. Mean log encephalization quotients (EQ0.75) of archaeoceteand odontocete cetaceans species over time. Archaeocetes are shownin blue squares; delphinoid odontocetes are shown in green circles;nondelphinoid odontocetes are shown in red triangles. Time scale is inMa. EQ � brain weight (g)/[0.055 � body weight (g)]0.75.
Figure 2.
Fig. 2. Mean encephalization quotients (EQ0.67) or archaeocete andodontocete cetacean species over time. Scales for both raw EQ0.67 andlog10 EQ0.67 are shown across the bottom. Archaeocetes are shown inblue squares; delphinoid odontocetes are shown in green circles; non-delphinoid odontocetes are shown in red triangles. Time scale is inmillions of years (Ma). Note the large shift in EQ at the origin of Odon-toceti, and that the Delphinoidea form the upper range of odontocete EQvalues from the middle Miocene to Recent.
Fig. 3. Mean log encephalization quotients (EQ0.53) of archaeoceteand odontocete cetaceans species over time. Archaeocetes are shownin blue squares; delphinoid odontocetes are shown in green circles;nondelphinoid odontocetes are shown in red triangles. Time scale is inMa. EQ � brain weight (g)/[1.6 � body weight (g)]0.53.
1253LARGE BRAINS IN TOOTHED WHALES

The post-Oligocene period is characterized by littlechange in the mean encephalization level for Odontocetias a whole. The origin of Delphinoidea, however, is asso-ciated with a significant increase in encephalization overother odontocetes. From the middle Miocene to the Recent,delphinoids form the upper range of encephalization levelsand are the exclusive occupants of the upper third of therange of encephalization levels in the Recent.
The present findings provide critical data for furtherinvestigations of those factors that may have played a rolein the increase in encephalization in delphinoids above theencephalization levels achieved by odontocetes in general.Hypothesized causes of increased encephalization in odon-tocetes include such varied and not altogether indepen-dent factors as social ecology (Connor et al., 1998) andcommunication (Jerison, 1986). Now that the basic pat-tern of encephalization change for Odontoceti as a wholehas been documented, this pattern can be mapped onto anaccepted phylogeny and these other factors can be ex-plored as potential causative factors for the documentedchanges in encephalization.
The conventional wisdom holds that increased enceph-alization confers a selective advantage and that increasesin encephalization should be pervasive across groups andtheir component lineages (Gould, 1988). The shift tohigher encephalization levels within Odontoceti at theorigin of Delphinoidea, however, and the continued expan-sion (toward both higher and lower levels) within Delphi-noidea suggests the absence of an overall drive towardhigher levels of encephalization for Delphinoidea as awhole. This does not preclude the possibility that theremay have been selective forces acting on individual lin-eages within the Odontoceti. If increasing encephalizationwas pervasively advantageous across lineages, however,our tests did not detect it in the available historical recordof this group.
The observation that there is a single remaining humanlineage that has been pruned down from a bushier treehas led to a popular view that several species of highlyencephalized animal cannot coexist spatially or tempo-rally (Tattersall, 2000). Our results show that not only domultiple highly encephalized delphinoids coexist in simi-lar and overlapping environments today, but this situa-tion arose at least as early as the middle Miocene and haspersisted for at least 15 million years.
ACKNOWLEDGMENTSSpecimens and CT scanning facilities were provided by
the National Museum of Natural History and D. Bohaska,B. Frolich, J. Mead, C. Potter, F. Whitmore, R. Purdy.Access to additional specimens were provided by A. Sand-ers, Charleston Museum; P. Gingerich, University ofMichigan Museum of Paleontology; L. Barnes and H.Thomas, Natural History Museum of Los Angeles County.Additional CT scanning was provided by the Medical Uni-versity of South Carolina (Charleston, SC) and MethodistHospital (Arcadia, CA). Emory University students E. Ga-rafalo, N. Pyenson, S. Rotenberg, and B. Shamsai assistedin endocranial measurements. Special thanks to P.M. No-vack-Gottshall for ancestral-state reconstructions andmaximum-likelihood analyses and E.P. Venit for assis-tance with the statistical analyses. The authors also thankTodd Preuss for his comments on an earlier draft of themanuscript and Louis Lefebvre for his assistance and
support. Funding was provided by the National ScienceFoundation (to L.M. and M.D.U.) and the Center for theStudy of Life in the Universe, SETI Institute (to L.M. andD.W.M.).
LITERATURE CITEDAlroy J. 1998. Cope’s rule and the dynamics of body mass evolution in
North American fossil mammals. Science 280:731–734.Armstrong E. 1985. Allometric considerations of the adult mamma-
lian brain with special emphasis on Primates. In: Jungers WL,editor. Size and scaling in primate biology. New York: PlenumPress. p 115–146.
Connor RC, Mann J, Tyack PL, Whitehead H. 1998. Social evolutionin toothed whales. Trends Ecol Evol 13:228–232.
Eisenberg JF. 1981. The mammalian radiations. Chicago: Universityof Chicago Press.
de Muizon C. 1988. Les relations phylogenetiques des Delphinida(Cetacea, mammalia). Ann Paleo 74:159–227.
de Muizon C. 1991. A new Ziphiidae (Cetacea) from the early Mioceneof Washington State (USA) and phylogenetic analysis of the majorgroups of odontocetes. Bull Natl Mus Nat Hist Paris 12:279–326.
Fleischer G. 1976. Hearing in extinct cetaceans as determined bycochlear structure. J Paleo 50:133–152.
Fordyce RE, de Muizon C. 2001. Evolutionary history of the cetaceans:a review. In: Mazin JM, Buffrenil V, editors. Secondary adaptationof tetrapods to life in water. Munich: Verlag. p 169–223.
Geisler J, Sanders AE. 2003. Morphological evidence for the phylog-eny of Cetacea. J Mamm Evol 10:23–129.
Gingerich PD. 1998. Paleobiological perspectives on Mesonychia, Ar-chaeoceti, and the origin of whales. In: Thewissen JGM, editor. Theemergence of whales: evolutionary patterns in the origin of Cetacea.New York: Plenum Press. p 423–449.
Gingerich PD, Uhen MD. 1998. Likelihood estimation of the time oforigin of cetacean and the time of divergence of cetacean and Ar-tiodactyla. Paleo-electronica 2:1–47.
Gould SJ. 1988. Trends as changes in variance: a new slant onprogress and directionality in evolution. J Paleontol 62:319–329.
Herman LM. 2002. Language learning. In: Perrin WF, Wursig B,Thewissen JGH, editors. Encyclopedia of marine mammals. SanDiego, CA: Academic Press. p 685–689.
Jerison HJ. 1973. Evolution of the brain and intelligence. New York:Academic Press.
Jerison HJ. 1986. The perceptual world of dolphins. In: SchustermanR, Thomas JA, Wood FG, editors. Dolphin cognition and behavior: acomparative approach. Mahwah, New Jersey: Lawrence Erlbaum. p141–166.
Kumar S, Blair Hedges S 1998. A molecular timescale for vertebrateevolution. Nature 392:917–920.
Maddison WP, Maddison DR. 1992. MacClade: analysis of phylogenyand character evolution, version 3.0. Sunderland, MA: Sinauer As-sociates.
Marino L. 1995. Brain-behavior relationships in cetaceans andprimates: implications for the evolution of complex intelligence.PhD thesis. Albany, NY: State University of New York at Albany.
Marino L. 1998. A comparison between odontocete cetaceans andanthropoid primates. Brain Beh Evol 51:230–238.
Marino L, Uhen MD, Frohlich B, Aldag JM, Blane C, Bohaska D,Whitmore FC Jr. 2000. Endocranial volume of mid-late EoceneArchaeocetes (order: Cetacea) revealed by computed tomography:implications for cetacean brain evolution. J Mamm Evol 7:81–94.
Marino L. 2002. Convergence in complex cognitive abilities in ceta-ceans and primates. Brain Behav Evol 59:21–32.
Marino L, Uhen MD, Pyenson ND, Frohlich B. 2003. Reconstructingcetacean brain evolution using computed tomography. Anat Rec(New Anat) 272B:107–117.
McShea DW. 1994. Mechanisms of large-scale evolutionary trends.Evolution 48:1747–1763.
Nikaido M, Matsuno F, Hamilton H, Brownell RL Jr, Cao Y, Ding W,Zuoyan Z, Shedlock AM, Fordyce RE, Hasegawa M, Okada N. 2001.Retroposon analysis of major cetacean lineages: the monophylyly of
1254 MARINO ET AL.

toothed whales and the paraphyly of river dolphins. Proc Natl AcadSci USA 98:7384–7389.
Oelschlager HA. 1990. Evolutionary morphology and acoustics in thedolphin skull. In: Thomas JA, Kastelein R, editors. Sensory abilitiesof cetaceans. New York: Plenum Press. p 137–162.
Pagel M. 1997. Inferring evolutionary processes from phylogenies. ZooScripta 26:331–348.
Reiss D, Marino L. 2001. Self-recognition in the bottlenose dolphin: acase of cognitive convergence. Proc Natl Acad Sci USA 98:5937–5942.
Rendell L, Whitehead H. 2001. Culture in whales and dolphins. BehavBrain Sci 24:309–382.
Ridgway SH. 1986. Physiological observations on dolphin brains. In:Schusterman RJ, Thomas TA, Wood FG, editors. Dolphin cognitionand behavior: a comparative approach. Hillsdale, NJ: LawrenceErlbaum. p 31–59.
Tattersall I. 2000. Once we were not alone. Sci Am 282:56–62.Uhen MD, Gingerich PD. 2001. A new species of dorudontine (Ar-
chaeoceti, Cetacea) from the Eocene of South Carolina. Mar MammSci 17:1–34.
Uhen MD. 2004. Form, function, and anatomy of Dorudon atrox(Mammalia, Cetacea): an Archaeocete from the middle to lateEocene of Egypt. Michigan Mus Paleo Papers on Paleontol 34:239.
1255LARGE BRAINS IN TOOTHED WHALES