organizational research methods best-practice … · topic of outliers has also caught the popular...
TRANSCRIPT
Article
Best-PracticeRecommendations forDefining, Identifying, andHandling Outliers
Herman Aguinis1, Ryan K. Gottfredson1,and Harry Joo1
AbstractThe presence of outliers, which are data points that deviate markedly from others, is one of the mostenduring and pervasivemethodological challenges in organizational science research.Weprovide evidencethatdifferentwaysofdefining, identifying, andhandlingoutliers alter substantive researchconclusions.Then,we report results of a literature review of 46 methodological sources (i.e., journal articles, book chapters,and books) addressing the topic of outliers, aswell as 232 organizational science journal articlesmentioningissues about outliers. Our literature review uncovered (a) 14 unique and mutually exclusive outlier defi-nitions, 39 outlier identification techniques, and 20 different ways of handling outliers; (b) inconsistenciesin how outliers are defined, identified, and handled in variousmethodological sources; and (c) confusionand lack of transparency in how outliers are addressed by substantive researchers.We offer guidelines,including decision-making trees, that researchers can follow to define, identify, and handle error, inter-esting, and influential (i.e., model fit and prediction) outliers. Although our emphasis is on regression,structural equation modeling, and multilevel modeling, our general framework forms the basis for aresearch agenda regarding outliers in the context of other data-analytic approaches.Our recommenda-tions can be used by authors as well as journal editors and reviewers to improve the consistency andtransparency of practices regarding the treatment of outliers in organizational science research.
Keywordsquantitative research, ethics in research, outliers
The presence of outliers, which are data points that deviate markedly from others, is one of the most
enduring and pervasive methodological challenges in organizational science research (Bollen &
1Department of Management and Entrepreneurship, Kelley School of Business, Indiana University, Bloomington, IN, USA
Corresponding Author:
Herman Aguinis, Department of Management and Entrepreneurship, Kelley School of Business, Indiana University, 1309 E.
10th Street, Bloomington, IN 47405, USA.
Email: [email protected]
Organizational Research Methods16(2) 270-301ª The Author(s) 2013Reprints and permission:sagepub.com/journalsPermissions.navDOI: 10.1177/1094428112470848orm.sagepub.com
Jackman, 1990; Grubbs, 1969; Hunter & Schmidt, 2004; Rousseeuw & Leroy, 2003). Outliers, by
virtue of being different from other cases—be it other individuals, teams, or firms—usually exert
disproportionate influence on substantive conclusions regarding relationships among variables.
Accordingly, the issue of outliers is of concern to organizational science research spanning all levels
of analysis and ranging from organizational behavior and human resource management (e.g., Orr,
Sackett, & DuBois, 1991) to strategy (e.g., Hitt, Harrison, Ireland, & Best, 1998). Moreover, the
topic of outliers has also caught the popular attention, as indicated by Gladwell’s (2008) book
Outliers, which occupied the number one position on the best-seller list for the New York Timesfor 11 consecutive weeks. The fact that outliers are of concern to micro- and macro-level organiza-
tional science researchers, as well as the public in general, indicates that, indeed, this is an important
methodological topic.
Despite the importance of outliers, researchers do not have clear guidelines about how to deal
with them properly. Furthermore, although in many cases outliers are seen as ‘‘data problems’’
that must be ‘‘fixed,’’ outliers can also be of substantive interest and studied as unique phenomena
that may lead to novel theoretical insights (e.g., Hitt et al., 1998). Thus, there is a need for a better
understanding and clear guidelines regarding the following three issues: (a) how to define them
(i.e., ‘‘What exactly is an outlier?’’), (b) how to identify them (i.e., ‘‘How do I know whether a
particular case is an outlier?’’), and (c) how to handle them (i.e., ‘‘What do I do with a case that
has been identified as an outlier?’’). At present, researchers are faced with multiple and often con-
flicting definitions of outliers, techniques to identify outliers, and suggestions on what to do with
outliers once they are found. Moreover, the methodological literature on outliers seems fragmen-
ted and, for the most part, addresses outliers in specific contexts only; for example, most metho-
dological sources discuss outliers only within the context of a single data-analytic approach such
as ordinary least squares (OLS) regression (e.g., Cohen, Cohen, West, & Aiken, 2003). In addition
to the conflicting and fragmented methodological literature on outliers, there is little transparency
surrounding how substantive researchers define, identify, and handle outliers in published journal
articles.
The main goal of our article is to offer best-practice recommendations for defining, identifying,
and handling outliers within the context of the three most popular data-analytic techniques in man-
agement and related fields as identified by Aguinis, Pierce, Bosco, and Muslin (2009): regression,
structural equation modeling (SEM), and multilevel modeling. Note that because the general lin-
ear model serves as a common mathematical foundation for both regression and ANOVA, our dis-
cussion of outliers in the context of regression also applies to the ANOVA context. As such, our
article serves as a useful guide for the majority of organizational science researchers who engage
in empirical research using these data-analytic techniques. In addition, we report results of a lit-
erature review on the topic of outliers that will serve as a foundational step toward a research
agenda addressing outliers within the context of other data-analytic approaches such as cluster
analysis, meta-analysis, and time-series analysis, among others.
The remainder of our article is organized around four sections. In the first section, we pro-
vide evidence that different ways in which outliers are defined, identified, and handled change
substantive conclusions. In the second section, we describe a literature review leading to the
creation of a comprehensive taxonomy including 14 outlier definitions, 39 outlier identification
techniques, and 20 different ways of handling outliers. In addition, results of our literature
review reveal challenges and problems encountered by organizational science researchers when
addressing outliers in substantive domains. The third section includes best-practice recommen-
dations, including decision-making trees, that researchers can follow when defining, identify-
ing, and handling outliers within the context of regression, SEM, and multilevel modeling.
Finally, we offer suggestions that rely on our literature review regarding a research agenda
on the topic of outliers.
Aguinis et al. 271

Choices About Defining, Identifying, and Handling Outliers ChangeSubstantive Conclusions
Outliers can lead to important changes in parameter estimates when researchers use statistical
methods that rely on maximum likelihood estimators (Cohen et al., 2003; Hunter & Schmidt,
2004; Kutner, Nachtsheim, Neter, & Li, 2004). Accordingly, Bollen and Jackman (1990) concluded
that how we deal with outliers ‘‘can lead us to false acceptance or rejection of hypotheses’’ (p. 286).
There is an additional important consideration regarding the treatment of outliers, which was
described by Cortina (2002) as follows:
Caution also must be used because, in most cases, deletion [of outliers] helps us to support our
hypotheses. Given the importance of inter-subjectivity and the separation of theoretical and
empirical evidence in the testing of hypotheses, choosing a course of action post hoc that is
certain to increase our chances of finding what we want to find is a dangerous practice. (p. 359)
The impact of outliers on substantive conclusions is perhaps most evident in situations where
an article is first published, and then a subsequent rebuttal is published by a different team of
researchers demonstrating that the original findings should be put into question specifically
because of the way outliers were dealt with in the original study. For example, Hollenbeck,
DeRue, and Mannor (2006) demonstrated the influence that one data point can have on substan-
tive conclusions. To do so, they reexamined data collected by Peterson, Smith, Martorana, and
Owens (2003), who investigated the relationships among CEO personality, team dynamics, and
firm performance. Peterson et al. tested 48 different correlations for statistical significance
based on a sample of 17 CEOs, and 17 of these 48 relationships were found to be statistically
significant. To assess the influence that single data points had on Peterson et al.’s results, Hol-
lenbeck et al. removed each of the 17 data points (i.e., 17 CEOs) one at a time, thereby con-
ducting 17 different outlier analyses, and they calculated how many times each of Peterson
et al.’s 17 correlations remained statistically significant. Hollenbeck et al.’s results showed that,
of the 17 statistically significant results, only 1 correlation was significant for all 17 analyses.
Of the remaining 16 statistically significant correlations, 7 were not significant once, 5 were
not significant between 2 and 6 times, and 4 were not significant between 10 and 17 times.
In short, substantive conclusions regarding relationships among CEO personality, team
dynamics, and firm performance changed almost completely depending on the treatment of out-
liers. Several additional examples of results and substantive conclusions that have been chal-
lenged based on how authors dealt with outliers exist in other research domains including social
psychology (e.g., see exchanges in Blanton et al., 2009a, 2009b; McConnell & Leibold, 2001,
2009; Ziegert & Hanges, 2009) and sociology (e.g., see exchanges in Jasso, 1985; Kahn & Udry,
1986), among others.
In summary, the decisions that researchers make about how to define, identify, and handle
outliers have important implications. Specifically, such decisions change substantive conclusions
including the presence or absence, direction, and size of an effect or relationship. Next, we describe
a literature review that allows us to understand the current state of science regarding outliers in a
comprehensive and systematic fashion.
Outliers: Literature Review
We conducted a literature review with the goal of producing a comprehensive taxonomy of the various
ways in which outliers are defined, identified, and handled. As a result of our review, we found that
there is a great deal of confusion and contradictory information regarding how researchers are
272 Organizational Research Methods 16(2)
supposed to address issues about outliers. On a more positive note, however, our review allowed us to
distill best-practice recommendations within the context of regression, SEM, and multilevel modeling,
as well as identify fruitful directions for future work regarding outliers in other data-analytic contexts
such as cluster analysis, meta-analysis, and time series analysis, among others.
Literature Search Procedures
Our review focused on two distinct bodies of literature. First, we conducted a search involving meth-
odological sources that addressed issues about outliers. Second, we conducted a search involving
articles published in organizational science journals that addressed substantive issues and mentioned
the topic of outliers—typically because the study included some type of outlier analysis. In short, our
review consisted of a review of the methodological literature and also of the substantive literature.
Review of the methodological literature. We conducted the methodological review in two parts. The
first part involved a broad review of the methodological literature on outliers. The second part
involved a specific review of the outlier literature, focused within three contexts: regression, SEM,
and multilevel modeling.
Our broad review of the methodological literature involved four steps. In the first step, we con-
ducted a full-text search using the Advanced Scholar Search function in Google Scholar with the
following terms: outlier, influential case, influential cases, influential observation, influential obser-
vations, influential data, extreme influence, and outlying. Because our purpose in this first step was
to identify influential journal articles, we constrained our search to articles with at least 100 citations
(as indicated by Google Scholar). In the second step, we conducted the same search but did not use
the 100-citation cutoff. The purpose was to identify articles that may not have been cited more than
100 times because they were published more recently, yet may be relevant to the topic of outliers.
Third, we manually examined each of the sources identified through the two previously mentioned
searches. Among these manually examined sources, we kept those that addressed a definition of a
specific type of outlier, an identification technique, or a handling technique. As a result of Steps
1 through 3, we were able to identify 18 articles. Fourth, we manually examined the references sec-
tion of each of the 18 articles to identify sources other than journal articles that may also provide
suggestions on how to address outliers. This final step led to 59 non-journal article sources. Out
of these 59 sources, 10 sources (i.e., three book chapters and seven books) were cited more than
100 times. Adding the 18 articles, which were compiled in the first three steps, to the 10 sources
we selected in the fourth step, resulted in a total of 28 sources (the list of 28 sources is available from
the authors on request). Taken together, these sources included a total of 13 outlier definitions,
34 identification techniques, and 16 handling techniques.
Next, we conducted a more focused review of the methodological literature with the purpose of
distilling best-practice recommendations on how to deal with outliers when using regression, SEM,
and multilevel modeling. We used Google Scholar to identify articles dealing specifically with how
to define, identify, and handle outliers in these three data-analytic contexts. We used the same search
terms we used in the broad literature review, and we also added the three focal data-analytic
approaches as search terms. We also checked the references section of each article for additional
relevant sources. It was not uncommon for an article published more recently to offer a revised and
improved recommendation on how to define, identify, and/or handle outliers initially offered by a
previously published source. In these instances, we kept only the improved recommendation. This
review allowed us to identify 18 sources specifically addressing outliers in the context of regression,
SEM, and multilevel modeling, which added 1 outlier definition, 5 identification techniques, and
4 handling techniques to our previous lists (the list of 18 sources is available from the authors
on request).
Aguinis et al. 273

Review of the substantive literature. The main goal of our review of the substantive literature was to
understand current practices on how organizational science researchers define, identify, and handle
outliers in their substantive research. To do so, we conducted a full-text search using the Advanced
Scholar Search function in Google Scholar with the same search terms used in our review of the
methodological literature described earlier. In addition, we constrained our search to the following
journals covering the years 1991 through 2010: Academy of Management Journal, Journal of
Applied Psychology, Personnel Psychology, Strategic Management Journal, Journal of Manage-
ment, and Administrative Science Quarterly. Our search resulted in 232 journal articles (the list
of articles is available from the authors on request).
Results and Discussion
R.K.G. and H.J. examined 5 of the 46 sources from the methodological review in detail and inde-
pendently extracted any paragraphs including information on any of these three issues. After the pro-
cess was completed, the two coders met and compared results. More than 90% of their selected
paragraphs matched. Given the high level of agreement, we divided the remaining 41 sources
between the two coders. Our review of the 232 substantive organizational science journal articles
did not lead us to identify any additional and appropriate outlier definitions, identification tech-
niques, and handling techniques, although we found instances of improper outlier definitions, iden-
tification techniques, and handling techniques (e.g., outliers were identified through a subjective
process as being deemed either ‘‘too big’’ or ‘‘too small’’ compared to the rest of the data). We did
not include these improper techniques in our tables so as to not perpetuate their use.
Our review of the 46 methodological sources led to a comprehensive and mutually exclusive list
of 14 outlier definitions (see Table 1), 39 identification techniques (see Table 2), and 20 handling
techniques (see Table 3). Given the large number of definitions, identification techniques, and han-
dling techniques identified in our review, it is no surprise that prominent methodological sources
such as Kutner et al. (2004) and Tabachnick and Fidell (2007), which are textbooks widely used
in doctoral seminars in the organizational sciences, provide inconsistent recommendations as to how
to define, identify, and handle outliers.
In addition to inconsistent recommendations in the methodological literature, our review of the
232 substantive articles dealing with outliers uncovered three specific shortcomings in the current
state of how outliers are addressed in the organizational sciences. These shortcomings highlight the
need for clear guidelines and best-practice recommendations.
First, it is common for organizational science researchers to be either vague or not transparent in
how outliers are defined and in how a particular outlier identification technique was chosen and
used. For example, Reuer and Arino (2002) studied strategic alliances and noted that ‘‘After
accounting for missing data and outliers, 71 alliances (37.6%) involving 63 companies were avail-
able for analysis’’ (p. 54). Unfortunately, this statement fails to explain the type of outlier the authors
were trying to identify, describe the method used to do so, or provide a clear rationale for why the
removal of such data points was the most appropriate handling technique.
Second, many authors define outliers in one way but then use an outlier identification technique
that is not congruent with their adopted outlier definition. As an illustration of this issue, Kulich,
Trojanowski, Ryan, Haslam, and Renneboog (2011) examined gender differences in executive com-
pensation to identify ‘‘a small number of influential observations’’ (p. 312) that could have driven
the results (i.e., model fit and/or parameter estimates). However, Kulich et al. identified as outliers
those data points that were three standard deviations away from the mean. As we describe in more
detail later in our article, extreme observations may or may not influence parameter estimates
(Cohen et al., 2003). In other words, the way in which outliers are identified is often inconsistent
with how outliers are defined.
274 Organizational Research Methods 16(2)

Table 1. Outlier Definitions Based on a Review of Methodological and Substantive Organizational ScienceSources.
1. Single construct outliers Data values that are unusually large or small compared tothe other values of the same construct. These pointstypically fall in the tails of a data distribution.
2. Error outliers Data points that lie at a distance from other data pointsbecause they are the result of inaccuracies. Morespecifically, error outliers include outlying observationsthat are caused by not being part of the population ofinterest (i.e., an error in the sampling procedure), lyingoutside the possible range of values, errors inobservation, errors in recording, errors in preparing data,errors in computation, errors in coding, or errors in datamanipulation.
3. Interesting outliers Accurate (i.e., nonerror) data points that lie at a distancefrom other data points and may contain valuable orunexpected knowledge.
4. Discrepancy outliers Data points with large residual values, with possibly (but notnecessarily) large influence on model fit and/or parameterestimates.
5. Model fit outlier An influential outlier whose presence influences the fit ofthe model.
6. Prediction outlier An influential outlier whose presence affects the parameterestimates of the model.
7. Influential meta-analysis effect size outlier A data point that is unusually large or small compared toothers in a meta-analytic database, specifically regardingthe size of the effect or relationship.
8. Influential meta-analysis sample size outliers In the context of a meta-analysis, these are single constructoutliers in terms of their sample size compared to theother studies’ sample sizes.
9. Influential meta-analysis effect and sample sizeoutliers
Primary-level studies that, via a combination of unusuallylarge or small effect sizes and unusually large sample sizes,exert a large influence on the meta-analytic results.
10. Cluster analysis outliers Outliers that exist as a result of conducting cluster analysis.11. Influential time series additive outlier An observation that markedly deviates from surrounding
others in a time series analysis. A time series additiveoutlier may exist in isolation, such that connecting thesurrounding data points and the outlier with a continuousline would yield a spike shape at the time point where theoutlier exists. Alternatively, a group of time seriesadditive outliers may exist as a patch within a range oftime points.
12. Influential time series innovation outlier An observation that not only has a large absolute valuecompared to surrounding others in a time series analysis,but also affects the values of subsequent observations inunequal amounts.
13. Influential level shift outliers A data point causing an abrupt and permanent step change(i.e., jump) in the values of subsequent observations in aseries.
14. Influential temporary changes outliers A data point causing an abrupt step change (i.e., jump) in thevalues of subsequent observations in a series, but thisdiffers from a level shift outlier in that this changeeventually dies out with time. That is, the step change isnot permanent.
Aguinis et al. 275

Table 2. Outlier Identification Techniques Based on a Review of Methodological and Substantive Organiza-tional Science Sources.
Single-construct techniques1. Box plot A plot that depicts a summary of the smallest value of a construct (excluding
outliers), lower quartile (Q1), median (Q2), upper quartile (Q3), and largestvalue (excluding outliers). Outliers can be identified as those points that liebeyond the plot’s whiskers (i.e., the smallest and largest values, excludingoutliers).
2. Stem and leaf plot A plot that simultaneously rank-orders quantitative data and provides insightabout the shape of a distribution. Stem-and-leaf pairs that are substantiallyfar away from the rest of the pairs signal the presence of outliers.
3. Schematic plot analysis Similar to a box plot, but used specifically for effect sizes in the context of ameta-analysis.
4. Standard deviation analysis Distance of a data point from the mean in standard deviation units.5. Percentage analysis Relative standing of a data point in a distribution of scores as indexed by its
percentile.Multiple-construct (i.e., ‘‘distance’’) techniques6. Scatter plot A plot of the values of two variables, with one variable on the x-axis (usually
the independent variable) and the other variable on the y-axis (usually thedependent variable). A potential outlier can be identified by a data point lyingfar away from the centroid of data.
7. q-q plot A plot (q stands for quantile) that compares two probability distributions bycharting their quantiles against each other. A nonlinear trend indicates thepossible presence of outlier(s).
8. p-p plot A plot (p stands for probability) that assesses the degree of similarity of twodata sets (usually the observed and expected) by plotting their twocumulative distribution functions against each other. A nonlinear trendindicates the possible presence of outlier(s).
9. Standardized residual A residual value that is calculated by dividing the ith observation’s residual valueby a standard deviation term. Observations with high standardized residualvalues are likely to be outliers. However, an observation’s standardizedresidual value does not measure an observation’s outlyingness on thepredictor variables.
10. Studentized residual A residual value that measures both the outlyingness of the observation interms of its standardized residual value (i.e., one type of distance) and theoutlyingness of the observation on the predictor variables (i.e., another typeof distance), such that a data point that is outlying in terms of both types ofdistance would have a studentized residual value that is greater than itsstandardized residual value. Observations with high studentized residualvalues are likely to be outliers.
11. Standardized deletedresidual
A residual value that is identical to a standardized residual, except that thepredicted value for the focal observation is calculated without theobservation itself. This exclusion prevents the focal observation fromdeflating the residual value and inflating the standard deviation term, wheresuch deflation and inflation mask the existence of any outlyingness of theobservation. Observations with high standardized deleted residual valuesare likely to be outliers.
12. Studentized deletedresidual (i.e., externallystudentized residual,jackknife residual)
A residual value that is identical to a studentized residual, except that thepredicted value for the focal observation is calculated without theobservation itself. This exclusion prevents the focal observation fromdeflating the residual value and inflating the standard deviation term, wheresuch deflation and inflation mask the existence of any outlyingness of theobservation. Observations with high studentized deleted residual values arelikely to be outliers.
(continued)
276 Organizational Research Methods 16(2)
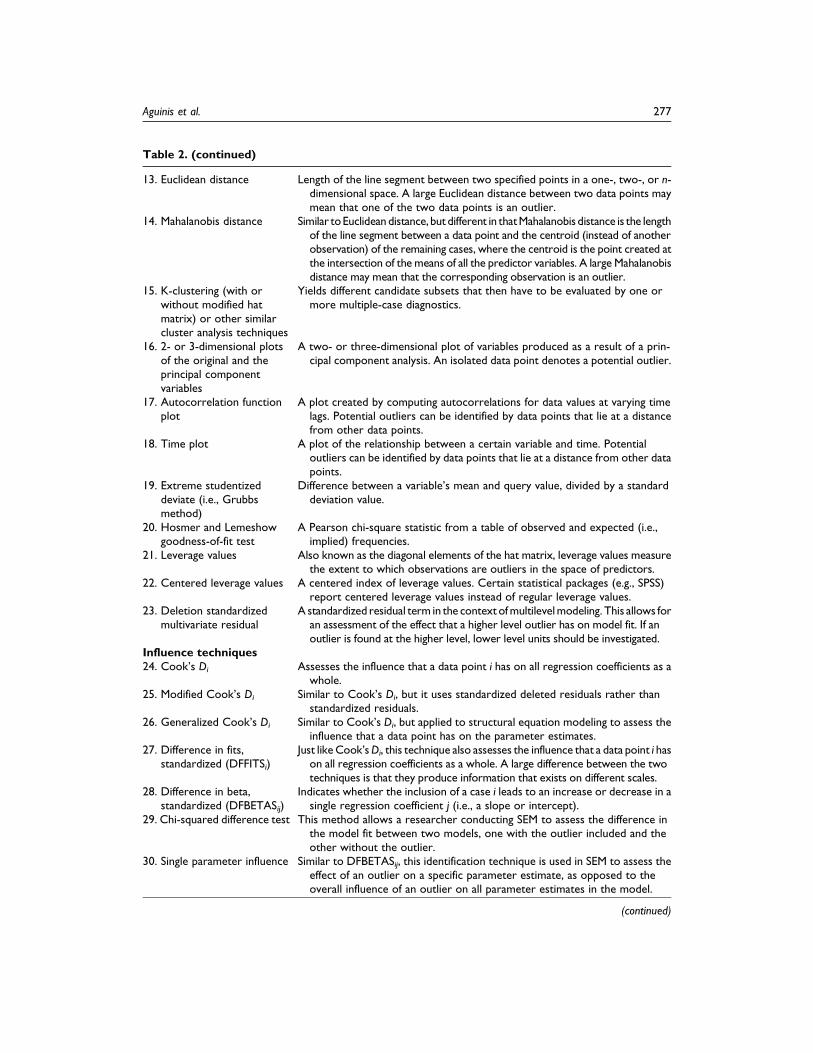
Table 2. (continued)
13. Euclidean distance Length of the line segment between two specified points in a one-, two-, or n-dimensional space. A large Euclidean distance between two data points maymean that one of the two data points is an outlier.
14. Mahalanobis distance Similar toEuclideandistance, but different in thatMahalanobis distance is the lengthof the line segment between a data point and the centroid (instead of anotherobservation) of the remaining cases, where the centroid is the point created atthe intersection of the means of all the predictor variables. A large Mahalanobisdistance may mean that the corresponding observation is an outlier.
15. K-clustering (with orwithout modified hatmatrix) or other similarcluster analysis techniques
Yields different candidate subsets that then have to be evaluated by one ormore multiple-case diagnostics.
16. 2- or 3-dimensional plotsof the original and theprincipal componentvariables
A two- or three-dimensional plot of variables produced as a result of a prin-cipal component analysis. An isolated data point denotes a potential outlier.
17. Autocorrelation functionplot
A plot created by computing autocorrelations for data values at varying timelags. Potential outliers can be identified by data points that lie at a distancefrom other data points.
18. Time plot A plot of the relationship between a certain variable and time. Potentialoutliers can be identified by data points that lie at a distance from other datapoints.
19. Extreme studentizeddeviate (i.e., Grubbsmethod)
Difference between a variable’s mean and query value, divided by a standarddeviation value.
20. Hosmer and Lemeshowgoodness-of-fit test
A Pearson chi-square statistic from a table of observed and expected (i.e.,implied) frequencies.
21. Leverage values Also known as the diagonal elements of the hat matrix, leverage values measurethe extent to which observations are outliers in the space of predictors.
22. Centered leverage values A centered index of leverage values. Certain statistical packages (e.g., SPSS)report centered leverage values instead of regular leverage values.
23. Deletion standardizedmultivariate residual
A standardized residual term in the context ofmultilevelmodeling. This allows foran assessment of the effect that a higher level outlier has on model fit. If anoutlier is found at the higher level, lower level units should be investigated.
Influence techniques24. Cook’s Di Assesses the influence that a data point i has on all regression coefficients as a
whole.25. Modified Cook’s Di Similar to Cook’s Di, but it uses standardized deleted residuals rather than
standardized residuals.26. Generalized Cook’s Di Similar to Cook’s Di, but applied to structural equation modeling to assess the
influence that a data point has on the parameter estimates.27. Difference in fits,
standardized (DFFITSi)Just likeCook’sDi, this technique also assesses the influence that a data point i hason all regression coefficients as a whole. A large difference between the twotechniques is that they produce information that exists on different scales.
28. Difference in beta,standardized (DFBETASij)
Indicates whether the inclusion of a case i leads to an increase or decrease in asingle regression coefficient j (i.e., a slope or intercept).
29. Chi-squared difference test This method allows a researcher conducting SEM to assess the difference inthe model fit between two models, one with the outlier included and theother without the outlier.
30. Single parameter influence Similar to DFBETASij, this identification technique is used in SEM to assess theeffect of an outlier on a specific parameter estimate, as opposed to theoverall influence of an outlier on all parameter estimates in the model.
(continued)
Aguinis et al. 277
We emphasize that our review of the substantive literature revealed that lack of transparency and
incongruence in how outliers are defined, identified, and handled are quite pervasive in articles
published in some of the most prestigious and influential journals in the organizational sciences.
As suggested by anonymous reviewers, we offer the aforementioned illustrations as concrete exam-
ples of these issues, but we emphasize that we do not wish to convey the impression that there is
anything particularly unique about these specific studies.
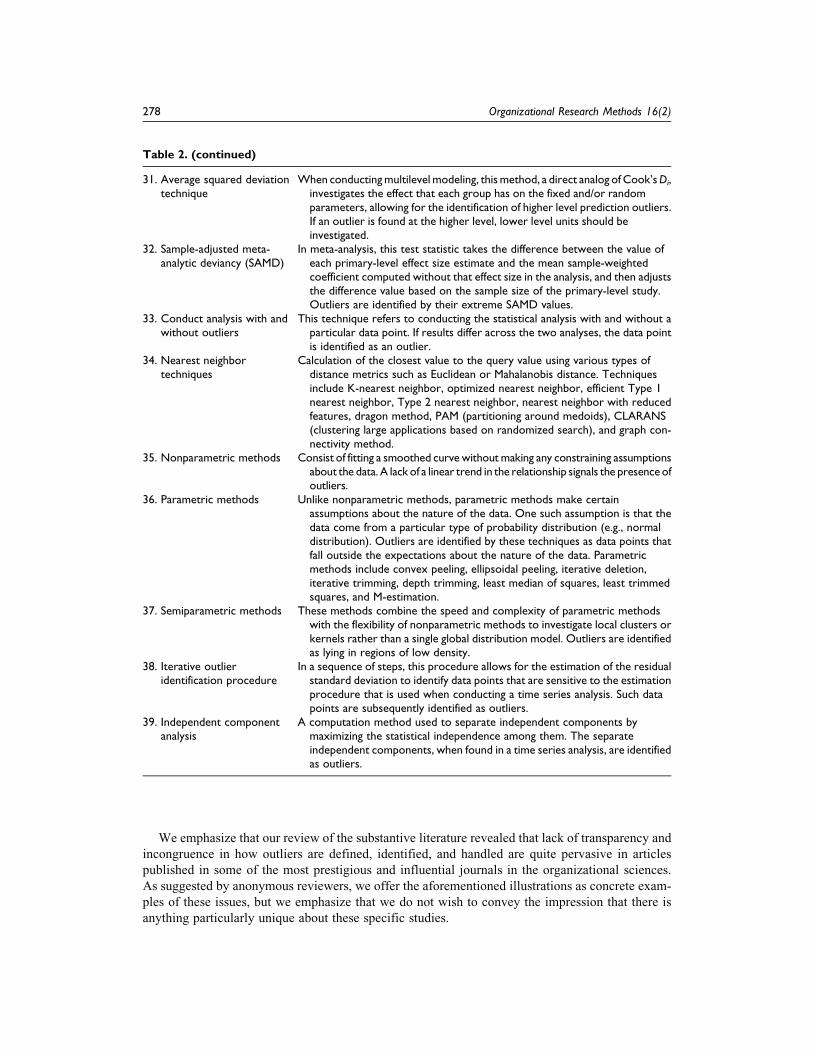
Table 2. (continued)
31. Average squared deviationtechnique
When conductingmultilevelmodeling, thismethod, a direct analog ofCook’sDi,investigates the effect that each group has on the fixed and/or randomparameters, allowing for the identification of higher level prediction outliers.If an outlier is found at the higher level, lower level units should beinvestigated.
32. Sample-adjusted meta-analytic deviancy (SAMD)
In meta-analysis, this test statistic takes the difference between the value ofeach primary-level effect size estimate and the mean sample-weightedcoefficient computed without that effect size in the analysis, and then adjuststhe difference value based on the sample size of the primary-level study.Outliers are identified by their extreme SAMD values.
33. Conduct analysis with andwithout outliers
This technique refers to conducting the statistical analysis with and without aparticular data point. If results differ across the two analyses, the data pointis identified as an outlier.
34. Nearest neighbortechniques
Calculation of the closest value to the query value using various types ofdistance metrics such as Euclidean or Mahalanobis distance. Techniquesinclude K-nearest neighbor, optimized nearest neighbor, efficient Type 1nearest neighbor, Type 2 nearest neighbor, nearest neighbor with reducedfeatures, dragon method, PAM (partitioning around medoids), CLARANS(clustering large applications based on randomized search), and graph con-nectivity method.
35. Nonparametric methods Consist of fitting a smoothed curve without making any constraining assumptionsabout the data. A lack of a linear trend in the relationship signals the presenceofoutliers.
36. Parametric methods Unlike nonparametric methods, parametric methods make certainassumptions about the nature of the data. One such assumption is that thedata come from a particular type of probability distribution (e.g., normaldistribution). Outliers are identified by these techniques as data points thatfall outside the expectations about the nature of the data. Parametricmethods include convex peeling, ellipsoidal peeling, iterative deletion,iterative trimming, depth trimming, least median of squares, least trimmedsquares, and M-estimation.
37. Semiparametric methods These methods combine the speed and complexity of parametric methodswith the flexibility of nonparametric methods to investigate local clusters orkernels rather than a single global distribution model. Outliers are identifiedas lying in regions of low density.
38. Iterative outlieridentification procedure
In a sequence of steps, this procedure allows for the estimation of the residualstandard deviation to identify data points that are sensitive to the estimationprocedure that is used when conducting a time series analysis. Such datapoints are subsequently identified as outliers.
39. Independent componentanalysis
A computation method used to separate independent components bymaximizing the statistical independence among them. The separateindependent components, when found in a time series analysis, are identifiedas outliers.
278 Organizational Research Methods 16(2)

Table 3. Outlier Handling Techniques Based on a Review of Methodological and Substantive OrganizationalScience Sources.
1. Correct value Correcting a data point to its proper value.2. Remove outlier Elimination of the data point from the analysis.3. Study the outlier in detail Conducting follow-up work to study the case as a unique phe-
nomenon of interest.4. Keep Acknowledging the presence of an outlier, but doing nothing to the
outlier value prior to the analysis.5. Report findings with and withoutoutliers
Reporting substantive resultswith andwithout theoutliers—which alsoincludes providing an explanation for any difference in the results.
6. Winsorization Transforming extreme values to a specified percentile of the data. Forexample, a 90th percentile Winsorization would transform all thedata below the 5th percentile to the 5th percentile, and all the dataabove the 95th percentile would be set at the 95th percentile.
7. Truncation Setting observed values within a believable range and eliminatingother values from the data set.
8. Transformation Applying a deterministic mathematical function (e.g., log function, lnfunction) to each value to not only keep the outlying data point in theanalysis and the relative ranking among data points, but also reducethe error variance and skew of the data points in the construct.
9. Modification Manually changing an outlier value to another, less extreme value.10. Least absolute deviation Similar to ordinary least squares, this method chooses values of the
regression coefficients that limit the residuals by producing afunction that closely approximates a set of data.
11. Least trimmed squares This technique orders the squared residual for each case from thehighest to the lowest, and then trims or removes the highest value.
12. M-estimation A class of robust techniques that reduce the effect of influentialoutliers by replacing the squared residuals by another function ofthe residuals. In particular, in a time series analysis, this method isused when influential time series innovation outliers are identified.
13. Bayesian statistics Bayesian statistics derive parameter estimates by weighing priorinformation and the observed data at hand. The use of such priorinformation helps ‘‘shrink’’ or pull the outlying data points closerto the center or centroid of the data.
14. Two-stage robust procedure This method uses Mahalanobis distance to assign weights to eachdata point, so that cases that are extreme in the predictorvariables are downweighted. This assignment of weights iscompleted through a two-stage process.
15. Direct robust method using iterativelyreweighted least squares
Similar to two-stage robust procedures, this method uses Mahala-nobis distance to assign weights to each data point. However, theassignment of weights is completed through the use of an itera-tively reweighted least squares algorithm.
16. Generalized estimating equations(GEE) methods
These methods estimate the variances and covariances in therandom part of the multilevel model directly from the residuals.The emphasis of this approach is on estimating averagepopulation effects, rather than on modeling individual and groupdifferences. Though GEE estimates are less efficient thanmaximum likelihood estimates, GEE estimates make weakerassumptions about the structure of the random part of themultilevel model, thereby limiting the effect of influential outliers.
17. Bootstrapping methods These methods estimate the parameters of a model and theirstandard errors from the sample, without reference to atheoretical sampling distribution. As a result, the researcher cancalculate the estimates of the expected value and the variability ofthe statistics as taken from an empirical sampling distribution.
(continued)
Aguinis et al. 279
The third shortcoming we uncovered in our review of the substantive literature is that we found
little discussion, let alone recommendations, on the subject of studying outliers that are found to be
interesting and worthy of further examination. A pervasive view of outliers among substantive
researchers is that outliers are ‘‘problems’’ that must be ‘‘fixed,’’ usually by removing particular
cases from the analyses. However, there are research domains in which outliers should more fre-
quently be the focus of substantive research. For example, O’Boyle and Aguinis (2012) conducted
five separate studies including 198 samples and 632,500 individual performers including research-
ers, politicians, entertainers, and athletes. O’Boyle and Aguinis found that the distribution of indi-
vidual performance based on untransformed scores (i.e., scores expressed in their original metric) is
not normal, but instead follows a Pareto (i.e., power law) distribution. The percentage of individual
scores that deviate markedly from the sample mean is larger under a Pareto compared to a normal
distribution, and therefore, outliers are more pervasive than previously thought. In short, there are
some particular research domains in which studying outliers, rather than treating them as a nuisance
that must be eliminated prior to conducting ‘‘cleaner’’ data analyses, may lead to important theore-
tical advancements.
In conclusion, as shown in Tables 1 through 3, our review of the methodological literature uncov-
ered a staggering list of 14 outlier definitions, 39 identification techniques, and 20 handling tech-
niques. Our review of the substantive literature revealed lack of transparency as well as
incongruence in how substantive researchers define, identify, and handle outliers. Moreover, the per-
vasive view of outliers is that they are problematic observations that somehow must be ‘‘fixed’’—
which is not necessarily appropriate in many research contexts. Overall, our literature review pro-
vided evidence regarding the need for guidelines on how to define, identify, and handle outliers.
We address this need next.
Making Decisions on How to Define, Identify, and Handle Outliers
Our recommendations on how to define, identify, and handle outliers are based on two overarching
principles. The first principle is that choices and procedures regarding the treatment (i.e., definition,
identification, and handling) of outliers should be described in detail to ensure transparency—
including a rationale for the particular procedures that have been implemented. The second principle
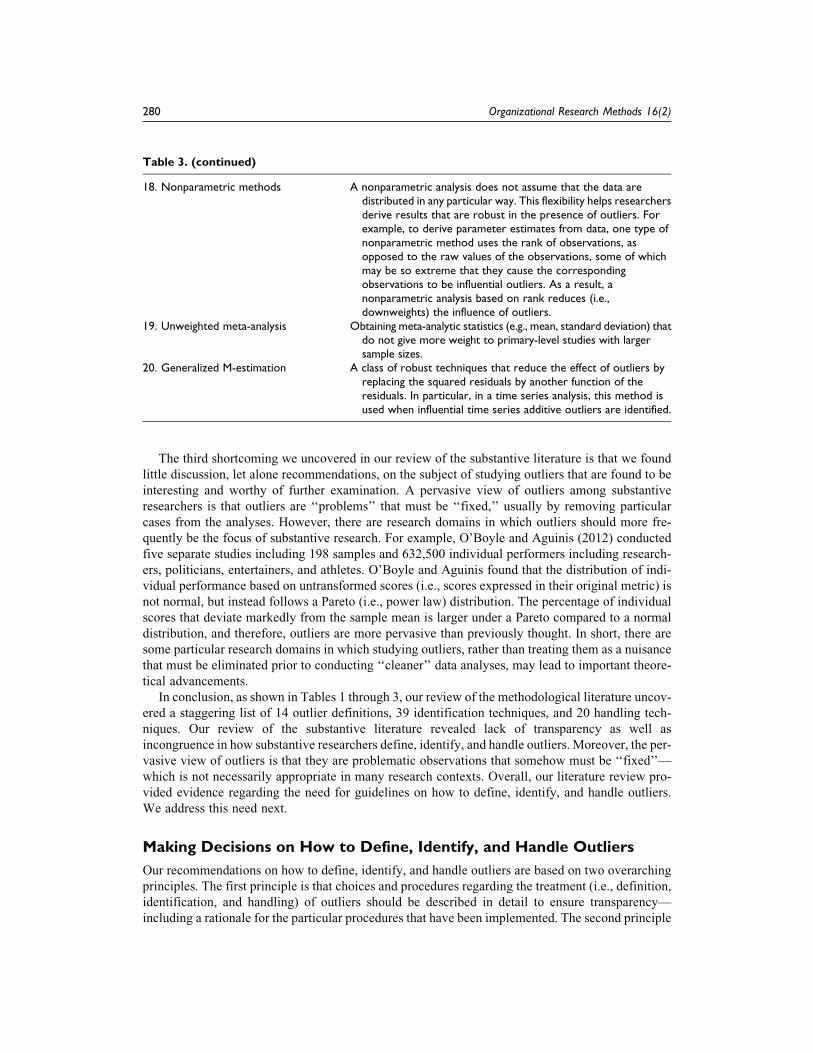
Table 3. (continued)
18. Nonparametric methods A nonparametric analysis does not assume that the data aredistributed in any particular way. This flexibility helps researchersderive results that are robust in the presence of outliers. Forexample, to derive parameter estimates from data, one type ofnonparametric method uses the rank of observations, asopposed to the raw values of the observations, some of whichmay be so extreme that they cause the correspondingobservations to be influential outliers. As a result, anonparametric analysis based on rank reduces (i.e.,downweights) the influence of outliers.
19. Unweighted meta-analysis Obtaining meta-analytic statistics (e.g., mean, standard deviation) thatdo not give more weight to primary-level studies with largersample sizes.
20. Generalized M-estimation A class of robust techniques that reduce the effect of outliers byreplacing the squared residuals by another function of theresiduals. In particular, in a time series analysis, this method isused when influential time series additive outliers are identified.
280 Organizational Research Methods 16(2)

is that researchers should clearly and explicitly acknowledge the type of outlier in which they are
interested, and then use an identification technique that is congruent with the outlier definition.
Although the focus of our article is on regression, SEM, and multilevel modeling, these principles
apply to outliers in all data-analytic contexts because their adoption will improve the replicability of
substantive results—which is required for the advancement of science in general (Aytug, Rothstein,
Zhou, & Kern, 2012; Brutus, Aguinis, & Wassmer, 2013). Moreover, the application of these two
overarching principles will improve the interpretability of substantive conclusions.
Our more specific best-practice recommendations described next are built around a sequence of
steps involving three categories of outliers, as shown in Figure 1. The first category consists of error
outliers, or data points that lie at a distance from other data points because they are the result of
inaccuracies. The second category represents interesting outliers, which are accurate data points that
Identify
1. Error Outliers
Identify
2. Interesting Outliers 3. Influential Outliers
Step 1: Identify potential error outliers (i.e., candidates for error outliers):
-Use single construct techniques:-Visual tools (e.g., box plots)
Step 1: Identify potential interesting outliers:
Regression (see Figure 2)
and then follow up with quantitative techniques (e.g., percentage analysis)
-Also use multiple construct (i.e., “distance”) techniques:
-Visual tools (e.g., scatter plots) and then follow up
-Use techniques for identifying potential error outliers-Potential error outliers that are not
l liStructural equation
with quantitative techniques in each of the two categories: (1) outlyingness based on predictor scores (e.g., centered leverage values) and (2) outlyingness based on
actual error outliers are potential interesting outliers
modeling (see Figure 2)
( )residual scores (e.g., studentized deleted residuals)
Step 2:Determine which potential interesting
tli t l
Multilevel modeling(see Figure 2)
Step 2:Determine which potential error outliers are actual error outliers
outliers are actualinteresting outliers
Future research
HandleDo both:-Correct or remove, and-Report the nature of the errors in detail
HandleStudy them using:-Quantitative approaches, and/or-Qualitative approaches
agenda:Meta-analysis, cluster analysis, time series analysis, and other data-analytic approaches
Figure 1. Decision-making tree summarizing sequential steps in the process of understanding the possiblepresence of outliers.
Aguinis et al. 281

lie at a distance from other data points and may contain valuable or unexpected knowledge. The third
category refers to influential outliers, which are accurate data points that lie at a distance from other
data points, are not error or interesting outliers, and also affect substantive conclusions. The
approaches to identifying and handling error and interesting outliers are similar across data-
analytic techniques. However, the way influential outliers are identified and handled depends on the
particular technique—for example, regression versus SEM. Thus, we first provide a discussion
regarding error and interesting outliers and then offer a separate treatment of influential outliers
within each of the specific contexts of regression, SEM, and multilevel modeling. As seen in Figure 1,
our recommendation is that all empirical studies follow the same sequence of steps. In addition, an
anonymous reviewer suggested that all empirical research reports should include a short section on
‘‘Outlier Detection and Management,’’ including a description of how each of the three types of
outliers has been addressed.
Error Outliers
As shown in Figure 1, the first step in the process of understanding the possible presence of outliers
is to check for error outliers. For this particular type of outlier, no a priori theory is needed. The
rationale for checking for the possible presence of error outliers first is that this type of outlier is
always undesirable (Huffman, Cohen, & Pearlman, 2010).
Defining Error Outliers
Error outliers are data points that lie at a distance from other data points because they are the result of
inaccuracies. More specifically, error outliers include outlying observations that are caused by not
being part of the targeted population of interest (i.e., an error in the sampling procedure), lying
outside the possible range of values, errors in observation, errors in recording, errors in preparing
data, errors in computation, errors in coding, or errors in data manipulation (Kutner et al., 2004; Orr
et al., 1991; Tabachnick & Fidell, 2007). In short, error outliers are nonlegitimate observations.
Identifying Error Outliers
Identifying error outliers involves the first step of locating outlying observations (i.e., identification
of potential error outliers—candidates for error outliers), and then the second step of separately
investigating whether the outlyingness of such data points was caused by errors (i.e., identification
of actual error outliers). Identifying potential error outliers involves using a variety of visual and
quantitative techniques, which compensates for the relative weakness of each (Belsley, Kuh, &
Welsh, 1980; Edwards & Cable, 2009). In other words, using more than one technique is necessary
to identify as many potential error outliers as possible, even if some of these observations eventually
do not turn out to be actual error outliers.
Results of our literature review summarized in Table 2 show that there are several techniques
available for identifying potential error outliers, which can be grouped into two categories: single
construct techniques and multiple construct (also labeled ‘‘distance’’) techniques. Single construct
techniques examine extreme values within each individual construct, whereas multiple construct
techniques assess how far an observation is from a centroid of data points computed from two
or more constructs. We recommend that both single and multiple construct techniques be used.
For single construct techniques, the recommendation is to use visual tools first and then follow up
with quantitative approaches, which include standard deviation analysis or percentage analysis. The
recommended cutoff for the quantitative techniques is that potential error outliers be identified as
observations in the top and bottom 2.5% (two-tailed, a¼ .05) in a percentage analysis, or observations
282 Organizational Research Methods 16(2)

above or below+2.24 standard deviation (SD) units in a standard deviation analysis, if the underlying
population distribution is assumed to be approximately normal (M. Martin & Roberts, 2010). The rea-
son for this cutoff rule is that cases above or below the top and bottom 2.5% are considered sufficiently
unlikely to be caused by substantive reasons assuming a ‘‘t-like’’ distribution (M. Martin & Roberts,
2010, p. 258). Furthermore, the cutoff rule accounts for a study’s particular research design by identi-
fying a greater number of potential error outliers for studies with larger sample sizes.
For multiple construct techniques, the recommendation is to also begin with visual tools and
then follow up with at least one quantitative approach in each of the following two categories:
(a) outlyingness based on scores of predictors (i.e., leverage, centered leverage, and Mahalanobis
distance values) and (b) outlyingness based on residual scores (i.e., studentized deleted residuals,
deletion standardized multivariate residuals). Regarding outlyingness based on scores of predictors,
researchers can use leverage, centered leverage, or Mahalanobis distance values because they produce
the same type of information but on different scales (Fidell & Tabachnick, 2003). Regarding outlying-
ness based on residuals scores, studentized deleted residuals can be used for regression (Cohen et al.,
2003) and SEM (Tabachnick & Fidell, 2007), and deletion standardized multivariate residuals can be
used for multilevel modeling (Snijders & Bosker, 2012). Also, for the particular case of multilevel
modeling, identification techniques are first applied at the highest level of analysis. For example, in
a two-level model consisting of individuals nested in groups, single construct techniques are applied
to the groups (in a later section on influential outliers in multilevel modeling, we discuss when and how
to then check for error outliers in lower level[s] of analysis). We recommend this top-down approach
based on a practical consideration given that it allows the researcher to pinpoint a smaller number of
groups whose lower level data points are worth examining.
Recommended cutoffs for leverage values are 2(k þ 1)/n for large sample sizes and 3(k þ 1)/n for
small sample sizes, where k ¼ number of predictors and n ¼ sample size (Cohen et al., 2003). For
centered leverage values, recommended cutoffs are 2k/n for large sample sizes and 3k/n for small sam-
ple sizes (Cohen et al., 2003). For Mahalanobis distance, recommended cutoffs are w2df ¼ p; alpha
level ¼ a/n for large sample sizes (Becker & Gather, 1999), andpðn�1Þ2 Fdf¼p;n�p�1;alphalevel¼a
nð Þ
n n�p�1þpFdf¼p;n�p�1;alphalevel¼an
ð Þ for small
sample sizes (Barnett & Lewis, 1994), where p ¼ number of variables, w2 ¼ critical value in a chi-
square distribution, F ¼ critical value in an F distribution, and a ¼ .05 or .01. Recommended cut-
offs for studentized deleted residuals are t df ¼ n–k–1; alphalevel ¼ a/n, where t ¼ critical value in a
t distribution, and a ¼ .05 or .01. Finally, cutoffs for deletion standardized multivariate residuals
for multilevel modeling are based on w2 df ¼ n of highest level unit j; alphalevel ¼ a/n, where a¼ .05 or .01
(Snijders & Bosker, 2012, p. 169).
The rationale for the aforementioned recommendations is that they take into account research
design considerations by adjusting the cutoff value based on the sample size and number of predic-
tors in the model (M. Martin & Roberts, 2010). From a practical standpoint, our recommendations
are also based on the availability of these techniques in widely used software packages for regression
(Cohen et al., 2003), SEM (Byrne, 2001; Tomarken & Waller, 2005; Zhang & Yuan, 2012), and
multilevel modeling (Raudenbush, Bryk, Cheong, Congdon, & Du Toit, 2004). Moreover, code that
derives deletion standardized multivariate residuals is also available in MLwiN, R, and Stata (see
www.stats.ox.ac.uk/~snijders/mlbook.htm).
Once potential error outliers have been identified, it is premature to subsequently conclude that
the outlying data points are error outliers—at this point, they are only candidates for error outliers.
Instead, it is necessary to determine the cause of the identified outlying observations by, for exam-
ple, checking whether original data entries (e.g., questionnaire responses) match the entries in the
electronic data files. If caused by an error in recording, coding, or data collection (e.g., not part of
population of interest), then an outlying observation is an error outlier (Huffman et al., 2010). All
Aguinis et al. 283

remaining outlying data points whose cause is unclear are treated as interesting outliers (as dis-
cussed later in our article).
Handling Error Outliers
Once error outliers have been identified, the correct procedure is to either adjust the data points to
their correct values or remove such observations from the data set (Kutner et al., 2004). In addition, it
is necessary to explain in detail the reasoning behind the classification of the outlier as an error out-
lier. For example, was it a coding error? A data entry error? A case that was inadvertently and incor-
rectly included in the database? As noted earlier, transparency is an important overarching principle
that is particularly critical in the case of error outliers. The reason is that an error outlier must be
handled by changing the value of the data point or removing it—either of which can lead to impor-
tant changes in substantive conclusions.
Table 4 includes information resulting from our substantive literature review. Specifically, it
includes examples of common situations faced by researchers in terms of how they have defined,
identified, and handled various types of outliers. We will continue to refer to Table 4 throughout
our article. Regarding error outliers, this table illustrates the common situation researchers
face when dealing with such outliers. A positive example of handling error outliers is a study
by Worren, Moore, and Cardona (2002). First, Worren et al. identified an outlying data point
(i.e., a potential error outlier). Then, to determine whether this was an error outlier, they placed
a phone call to the respondent and found that this individual had misunderstood some of the
questions. Subsequently, corrections were made to the error outlier based on the conversation.
Table 4 also describes an incorrect, yet frequently used, way of addressing possible error outliers.
This involves automatically deleting data points that deviate markedly from the rest without
clearly understanding the reasons for such deviation. Deleting outlying data points prior to deter-
mining if they are indeed errors or not is an incorrect procedure. Each row in Table 4 includes
illustrations of correct and incorrect ways of dealing with outliers—including error, interesting,
and influential outliers—and how these different procedures result in changes in substantive
conclusions.
We readily acknowledge that Institutional Review Boards (IRBs) vary with respect to how they
would view the practice of contacting participants to clarify outlying responses. Moreover, many
IRBs may require that data files be made anonymous as quickly as possible by stripping out identi-
fying information, which may make it very difficult to identify individual respondents. Thus, it is
important for researchers to keep diaries, logs, or journals during data collection that can be used
retrospectively to determine if something unusual happened with some particular case that can no
longer be traced after the fact.
Interesting Outliers
As shown in Figure 1, the second step in the process of understanding the possible presence of out-
liers is to examine interesting outliers. As noted in the previous section, we recommend against the
practice of automatically treating any outlying data point as harmful (Hawawini, Subramanian, &
Verdin, 2003). We make this recommendation for two reasons. First, defining outliers in a negative
way most often leads to simply removing these cases, a practice that may result in artificial range
restriction (McNamara, Aime, & Vaaler, 2005). Second, whether these outliers are eventually
excluded from the analysis or not, simple removal and thus failure to study these outliers separately
in detail can mean forgoing discovery of valuable, future-oriented knowledge (Mohrman & Lawler,
2012).
284 Organizational Research Methods 16(2)

Table
4.CommonResearchSituationsIllustratingCorrectandIncorrectProceduresforDefining,Identifying,andHandlingDifferentTypes
ofOutliers.
CorrectProcedures
RationaleforCorrectProcedures
IncorrectProcedures
Difference
inSubstantive
Conclusions
Erroroutlier
Worren
etal.(2002)identifiedapo
tential
erroroutlier.Theyinvestigated
further
andfoundthat,afteraphone
call,the
respondenthadmisunderstoodsome
ofthequestions.Corrections
were
madeto
thedatabasedonthe
telephone
conversation.Also,Huffman
etal.(2010)
eliminated
someoutliers,
which
they
foundwerecaused
bycodingerrors.
The
amountofd
eviationofa
datapo
int
from
othersdoes
notnecessarily
mean
thatthedatapo
intwas
caused
byerror.
Apo
tentialerroroutlierisan
actual
erroroutlierwhenitsdeviationis
caused
byinaccuracies—andevidence
mustbe
providedregardingthisissue.
Huffman
etal.(2010)removedoutlying
datapointsthat
werecausedby‘‘some
unidentifiable
change
inthe[firm]
structure’’(p.263),suggestingthat
thesecaseswereoutsidethe
populationofinterest.Y
et,neither
the
hypotheses
northetheo
retical
rationaleforthehypotheses
explained
whytheseoutlyingfirms,which
underwentunidentifiable
changesin
firm
structure,felloutsidethefocal
population,therebyputtinginto
questionwhether
such
caseswere
actuallyerroroutliers.Thus,Huffman
etal.essentiallydeleted
someoutliers
that
wereassumed
tobeerror
outliers,butwithoutdetermining
beforehandwhether
they
wereindeed
erroroutliers.
Huffman
etal.(2010)notedthat
someof
thedatapoints
they
incorrectly
removedhad
‘‘corruptingeffects’’on
theresults(p.263),indicatingthat
the
removalofthesedatapoints
changed
substantive
conclusions.Had
the
authors
insteadtreatedthesedata
points
asinterestingorinfluential
outliers,andthen
reported
theresults
withandwithouttheinfluential
outliers,they
would
havebeenableto
providemultiple
versionsofthe
analyticalresults,therebyenrichingthe
substantive
conclusionsandpotential
forreplicability
oftheirstudy.
Interestingoutlier
Treatingunusuallysuccessfulor
unsuccessfulacquisitionsas
potential
sources
ofvaluableknowledge,Hitt
etal.(1998)identifiedthe12most
successfulandthe12leastsuccessful
acquisitionsas
interestingoutliers.
Then,they
appliedacase
studymethod
onthe24pairs
offirmsidentifiedas
interestingoutliers.
Astudyofinterestingoutliers
may
result
inagenerationoffuture-oriented
knowledge
that
also
inform
spractice
(Mohrm
an&Lawler,2012).
Although
Haw
awiniet
al.(2003)defined
exceptionallyhigh-perform
ing(i.e.,
outlying)butrare
firmsas
‘‘interesting’’
outliers
(p.2),theauthors
did
not
separatelystudythesecasesas
sources
ofknowledge.Instead,Haw
awiniet
al.
investigated
theinfluence
that
outliers
haveonfirm-specificandindustry
effectsbysimplyreportingtheresults
withandwithouttheoutliers.
Byapplyingthecorrectprocedures,Hitt
etal.(1998)wereableto
derive
potentialpredictors
ofoutliers
inthe
research
domainofacquisitions.That
is,they
foundthat
certainattribute
configurations(e.g.,resource
complementarities,friendly
negotiations,low
tomoderatedebt,
andchange
experience)facilitated
unusualacquisitionsuccess,whereas
other
distinct
attribute
configurations
(e.g.,largeto
extraordinarydebt,
inadequatetarget
evaluation,ethical
concerns,andtopmanagem
entteam
changes)
ledto
unusualacquisition
failure.
(continued)
285

Table
4.(continued)
CorrectProcedures
RationaleforCorrectProcedures
IncorrectProcedures
Difference
inSubstantive
Conclusions
Influentialoutliers
when
conducting
regression
Multipleauthorship
team
sclearlystated
theidentificationtechniques
that
they
used,andtheseidentification
techniques
wereappropriate(although
authors
did
notuse
DFB
ETAS ij;
Colbertet
al.,2008;Edwardset
al.,
2006).
Correctidentificationtechniques,and
theirdescription,arenecessary
tomaximizetransparency
andto
ensure
that
influence
outliers
areproperly
detected.
Godfrey,Merrill,andHansen(2009)did
notexplicitlystatehow
outliers
were
identified.Instead,they
madethevague
statem
entthat
they
‘‘ran
regression
diagnosticsto
lookforoutliers’’(p.
435).
Failure
toexplicitlystatehow
outliers
wereidentifiedorfailure
touse
any
outlieridentificationtechniqueharms
thecredibility
ofsubstantive
conclusionsin
theeyes
ofaskeptical
scientific
readership.Had
Godfrey
etal.(2009)usedcorrectprocedures
(i.e.,use
appropriateidentification
techniques,andclearlystatethat
they
wereused),theauthors
would
be
betterable
topreventreadersfrom
raisingdoubtsabouttheconclusionsof
theirstudies.
Influentialoutliers
when
conducting
structural
equation
modeling
GoerzenandBeamish(2005)useda
handlingtechnique(i.e.,deletion)and
reported
findings
withandwithoutthe
handlingtechniqueto
ensure
transparency.
Reportingresultswithandwithoutthe
handlingtechniqueensures
transparency
andprevents
readers
from
questioningwhether
thedata
were‘‘m
anipulated’’to
confirm
support
forthehypotheses.
Multipleauthorshipteam
susedahandling
technique(i.e.,deletion)onhigher
levelunits,butdid
notreport
the
findings
both
withandwithoutthe
deleted
outliers
(Amiot,Terry,Jim
-mieson,&
Callan,2006;B
rown,C
ober,
Kane,Levy,&Shalhoop,2006).
Instudiesconducted
byAmiotet
al.
(2006),as
wellas
Brownet
al.(2006),
resultswerenotreported
withand
withouttheoutlierhandlingtechnique
used,thusprovidingreaderswithonly
oneversionoftheresults.In
contrast,
byreportingtheresultsboth
withand
withoutinfluentialoutliers,Goerzen
andBeamish(2005)notonlyensured
transparency
butalso
gave
readers
both
versionsoftheiranalyticalresults,
therebyenrichingthesubstantive
conclusionsoftheirstudies.
Influentialoutliers
when
conducting
multilevel
modeling
Smillieet
al.(2006)usedashortfootnote
toclearlystatethat
theremovalof
threeinfluentialoutliers
changedthe
statisticalsignificance
oftw
oparam
eter
estimates
butultimately
failedto
change
thesubstantive
conclusions.
Evenifinfluentialoutliers
ultimatelyfailto
change
thesubstantive
conclusions,the
practiceofreportingtheresultswith
andwithoutthehandlingtechnique
(e.g.,deletion)prevents
skeptical
readersfrom
suspectingthat
the
researchersofastudymanipulated
datato
maximizethechance
offinding
support
fortheirhypotheses
andthen
deliberatelyrefrained
from
mentioning
such
amanipulation.
Wanberg,Glomb,So
ng,andSo
renson
(2005)usedahandlingtechnique(i.e.,
replacingoutliervalues
atthe99th
percentile
oftheresponses)
butdid
notreport
thefindings
both
withand
withoutthehandlingtechnique.
InW
anberget
al.(2005),theauthors
did
notreport
theirfindings
withand
withoutthehandlingtechnique.
Thus,
readerswerepresentedwithonlyone
versionoftheresults,possiblyraising
suspicionin
theeyes
ofaskeptical
scientific
readership.Had
Wanberg
etal.reported
theirresultswithand
withoutthehandlingtechnique,such
asuspicionwould
beminimized
oreven
eliminated.
286

Defining Interesting Outliers
Interesting outliers are outlying data points that are accurate—that is, data points that have been iden-
tified as outlying observations (i.e., potential error outliers), but not confirmed as actual error outliers.
Also, these cases may contain potentially valuable or unexpected knowledge (Cohen et al., 2003;
Mohrman & Lawler, 2012). Consider the following three examples from different organizational sci-
ence domains. First, Wiggins and Ruefli (2005) identified firms that were interesting outliers because
they lost their superior economic performance. Second, the positive psychology movement has
focused on studying and analyzing individuals who are interesting outliers in terms of their feelings
of happiness (Diener, 2000; Seligman & Csikszentmihalyi, 2000). Finally, as mentioned earlier,
O’Boyle and Aguinis (2012) encouraged the study of interesting outliers defined as top performers.
In fact, Gladwell’s (2008) best-selling book is based on the premise of interesting outliers: unique indi-
viduals whose lives and career trajectories can be used in support of the contention that success in any
field is largely the result of practicing a specific task for a minimum of about 10,000 hours.
Identifying Interesting Outliers
Identifying interesting outliers involves two steps. The first step is to identify potential interesting
outliers, and the second step is to identify which outliers are actually interesting outliers. The first
step will have been already completed by the researcher following our decision-making tree in Fig-
ure 1. The reason is that this step also involves the use of techniques that are the same as the tech-
niques used to identify potential error outliers, and then any potential error outlier that is not an
actual error outlier automatically becomes a potential interesting outlier. In the second step, the par-
ticular research domain influences how interesting outliers are identified from potential interesting
outliers identified in the previous step. For example, if there is an interest in identifying certain indi-
viduals who are on more than 10 corporate boards, then potential interesting outliers identified
through single construct techniques would be considered interesting outliers. If there is an interest
in studying the relationship between two constructs, such as firms that are outliers in annual profit
and annual cost in research and development, then potential interesting outliers would be identified
through multiple construct identification techniques. Note that interesting outliers can either be the
focus of a study prior to data collection (i.e., a priori interesting outliers) or be identified after the
data are collected (i.e., post hoc interesting outliers).
It is possible that a case is an error outlier, but the source of the error is not detected. In such situa-
tions, this case is likely to be treated as a potential interesting outlier incorrectly. As noted by an
anonymous reviewer, pursuing potential interesting outliers is likely to include the examination
of a great many error outliers that simply went undetected as errors. Such a situation is addressed
by referring back to the first of the two overarching principles we mentioned earlier: Choices and
procedures regarding the treatment of outliers should be described in detail to ensure transpar-
ency—including a rationale for the particular procedures that have been implemented. In the partic-
ular situation involving possible undetected error outliers, because procedures were open and
transparent, future research would be able to attempt to replicate results (i.e., the presence of a large
number of potentially interesting outliers). As noted by an anonymous reviewer, ‘‘The chances of an
error outlier occurring twice are calculably infinitesimal. If it does occur twice, however, then the
evidence of its uniqueness is almost beyond reproach.’’
Handling Interesting Outliers
Our recommendation on how to handle interesting outliers is to study them. This can be done by
using a quantitative approach similar to that used by St. John and Harrison (1999), who empirically
Aguinis et al. 287

analyzed differences between the manufacturing synergies of high and low outlier performers. In addi-
tion, interesting outliers can be examined by adopting a qualitative approach similar to the one used by
Gladwell (2008), who investigated the factors that contribute to high levels of individual success.
A positive example of how to handle interesting outliers is a study by Hitt et al. (1998), which
examined firm acquisitions that were either highly successful or highly unsuccessful. These authors
identified highly successful acquisitions as 12 pairs of firms that showed increases in both industry-
adjusted performance (i.e., return on assets) and industry-adjusted research and development inten-
sity after the acquisition, whereas highly unsuccessful acquisitions were identified as 12 pairs of
firms exhibiting the greatest reduction in both of the previously mentioned firm characteristics after
the acquisition. They then applied a case study method on the 24 pairs of firms identified as inter-
esting outliers. Doing so resulted in substantial theoretical implications in which Hitt et al. were able
to derive potential predictors of outliers in the research domain of acquisitions. In contrast, failing to
study numerous observations identified as interesting outliers constitutes an incorrect way of han-
dling interesting outliers (see Table 4). The alternative of studying such outliers could have resulted
in novel theoretical insights.
Influential Outliers
In contrast to the procedures for defining, identifying, and handling error and interesting outliers,
which are fairly invariant across data-analytic approaches, influential outliers are addressed differ-
ently depending on particular statistical techniques. There are two types of influential outliers:
(a) model fit outliers and (b) prediction outliers. Model fit outliers are data points whose presence
alters the fit of a model, and prediction outliers are data points whose presence alters parameter esti-
mates. Next, we discuss influential outliers within the particular contexts of (a) regression, (b) SEM,
and (c) multilevel modeling. Please refer to Figure 2 for decision-making charts showing the
sequence of steps involved in defining, identifying, and handling model fit and prediction outliers
within the context of each of these three popular data-analytic approaches.
Regression
Defining and identifying model fit outliers.Model fit outliers are defined as cases that affect model fit
(e.g., R2). Depending on their location, they can either increase or decrease model fit. In practice, a
model fit outlier often affects both model fit and parameter estimates (i.e., slope and/or intercept
coefficients).
Figure 3 includes a simplified graphic illustration of a regression analysis on a hypothetical data
set involving one predictor and one criterion. Please note that we use an unusually small sample size
for this illustration for pedagogical purposes. The R2 for the data included in Figure 3 is .73 when
Cases 1, 2, and 3 are excluded from the analysis. When Case 1, Case 2, or Case 3 is included, model
fit changes to .11, .95, or .17, respectively. Furthermore, the inclusion of Case 1 or Case 3 reduces
model fit and also affects the parameter estimates (i.e., the intercept and/or slope). In contrast, Case 2
affects (i.e., improves) only model fit because of its location along the regression line.
To identify model fit outliers, we recommend a two-step process. The first step involves identify-
ing data points that are most likely to have influence on the fit of the model because they deviate
markedly from other cases in the data set. The second step involves investigating such cases to
understand if they actually have influence on model fit. The rationale for the first step is a practical
one because the first step reduces the number of cases to which the more time-consuming and effort-
ful second step must be applied.
The first step is automatically completed once the researcher has implemented our recommenda-
tions regarding error and interesting outliers earlier (see Figure 1). More specifically, cases that have
288 Organizational Research Methods 16(2)

been identified with multiple construct techniques and subsequently determined not to be error or
interesting outliers constitute candidates for model fit outliers.
The second step in the identification of model fit outliers is to determine whether cases that differ
markedly from the rest actually influence model fit (e.g., R2). This involves checking whether the
removal of an observation changes the statistical significance of a model fit index either from
statistically significant to statistically nonsignificant, or vice versa (Yuan & Bentler, 1998).
Defining and identifying prediction outliers. Prediction outliers are defined as cases that affect para-
meter estimates (i.e., slope and/or intercept coefficients). As illustrated in Figure 3, a data point can
yfitnedIenifeD HandleRegression
Step 2: Check if removal of a case changes model fit (e g R2)
Model fit outlier
Report findings with and without either of the following approaches:-Respecify model
Step 1: Outlying cases identified via multiple construct techniques but not deemed error or interesting outliers (see Figure 1)
. ., 2
Do both:-Calculate DFFITS, Cook’s D, and DFBETAS values-Use cutoff rules based on research design considerations
Prediction outlier
p y-Remove outlier-Robust approaches (e.g., absolute deviation, least trimmed squares, M-estimation, Bayesian statistics)
are potential model fit outliers
eldnaHyfitnedIenifeDStructural Equation Modeling
Step 2: Check if removal of a case
M d l fi
Report findings with and without either of the
Step 1: Outlying cases identified via multiple construct techniques
changes model fit (e.g., χ2, CFI, RMSEA)
o el fit outlier
Prediction
following approaches:-Respecify model-Remove outlier-Robust approaches (e.g., two-stage robust procedure, direct robust method using
Do both:For each case calculate its generalized Cook’s D (gCD) and
but not deemed error or interesting outliers (see Figure 1) are potential model fit outliers
outlier
giteratively reweighted least squares)
- , (single parameter influence values-Use an index plot as a follow-up
fitnedIenifeD y HandleMultilevel Modeling
y
Step 2: Check if removal of a group changes model fit (e.g., AIC BIC)
Model fit outlier
Report findings with and without either of the following
h
For model fit and prediction
outliers:Use Figure 1 for each outlier group to check
Step 1: Outlying groups identified via multiple construct techniques but not deemed error or interesting outliers (see Figure 1) are potential ,
Prediction outlier
Do both:- For each group, calculate its average squared deviation Cj-Use an index plot
approaches:-Respecify model-Remove outlier-Robust approaches(e.g., GEE, bootstrapping)
group towhether the group (1) includes lower-level outliers and/or (2) is itself a higher-level outlier
1)model fit outlier groups
Figure 2. Decision-making tree summarizing sequential steps in the process of defining, identifying, andhandling influential outliers in the context of regression, structural equation modeling (SEM), and multilevelmodeling.
Aguinis et al. 289

be a prediction outlier by either (a) having a large residual value (e.g., Case 1) or (b) having both a
large residual value and extreme value(s) on the predictor(s) (e.g., Case 3). Note that having extreme
values on the predictors but a small residual value will not make a data point a prediction outlier (see
Case 2), although, as noted earlier, this case is likely to be a model fit outlier.
There are three techniques that are specifically designed to assess the presence of prediction out-
liers in the context of regression: DFFITSi (DIFFerence in FIT, Standardized—note that this is an
index of prediction and not model fit outliers in spite of its label), Cook’s Di, and DFBETASij(DIFFerence in BETA, Standardized). Subscript i refers to an observation, and j denotes a regression
coefficient (Cohen et al., 2003). These prediction outlier identification techniques are available in
most software packages, and they share two common characteristics. First, each is calculated for
every observation. Second, each of them is a ratio, where the numerator quantifies the amount of
change in the parameter estimate(s) when the observation i is excluded from the sample. The
denominator is a standard error term that is also calculated without observation i in the sample.
In spite of their similarities, these three techniques also have an important difference. DFFITSiand Cook’s Di are global indicators that assess the influence that a data point has on all regression
coefficients as a whole, whereas DFBETASij is a more specific index that quantifies the influence
that an observation has on a particular regression coefficient j. Given this difference, DFFITSi or
Regression line R2 Slope Intercept
With only .73 .83 5.34
With and .11 .83 9.13
With and .95 .83 5.34
With and .17 –.22 30.34
Non-outlying cases Case #3
Case #2
Case #1
Y
X
Figure 3. Graphic illustration of influential outliers (i.e., model fit and prediction outliers) in the context ofregression.
290 Organizational Research Methods 16(2)
Cook’s Di and DFBETASij do not always converge. That is, a case may have a strong influence on
just one regression coefficient but very small influence on others. As a result, the observation’s
strong influence on the single regression coefficient may be masked in a global measure of influ-
ence. Referring back to Figure 3, DFFITSi and Cook’s Di could easily detect prediction outliers such
as Case 3 because it exerts a disproportionate influence on both the slope and the intercept. However,
these two global measures of influence are less likely to detect Case 1 because this prediction outlier
exerts a disproportionate influence only on the intercept. Using DFBETASij would increase the like-
lihood that Case 1 is identified as a prediction outlier. Therefore, it is important to also investigate
specific prediction outliers in addition to global prediction outliers.
We suggest the following cutoffs (Belsley et al., 1980). For DFFITSi, the recommended
cutoff is�2ffiffiffiffiffiffikþ1n
qfor observation i to be considered a prediction outlier, where k represents the num-
ber of predictors, and n represents the number of observations. For Cook’s Di, the recommendation
is to use the F distribution, with df ¼ (k þ 1, n – k – 1) and a ¼ .50, to determine the statistical sig-
nificance of the values at hand (Cohen et al., 2003). For DFBETASij, the recommended cutoff is
+2/ffiffiffin
pfor the observation i to be considered a prediction outlier regarding regression coefficient
j. The rationale for these recommendations is that they were intentionally designed to adjust cutoff
values depending on characteristics of the particular research context such as sample size and num-
ber of predictors (Cohen et al., 2003).
Handling model fit and prediction outliers. The options for handling model fit and prediction outliers
are the same. Cohen et al. (2003) offered a framework that consists of three courses of action:
(a) respecification, (b) deletion, and (c) robust approaches. These approaches also coincide with the
handling techniques that we identified in our review of the methodological literature.
Respecification refers to adding additional terms to the regression equation. For example, these
additional terms may carry information about nonlinear effects (i.e., squared terms; Pierce &
Aguinis, 2013) or moderating effects (i.e., product terms; Aguinis, 2004; Cohen et al., 2003).
If the added variable adds incremental variance, there is a chance that the outlier may no longer
be such. If the respecified model is supported (i.e., if the terms added post hoc significantly improve
model fit or prediction), then the researcher can also build new theoretical models that can be tested,
confirmed, or disconfirmed in future research. In other words, respecifying models post hoc is ben-
eficial in terms of helping researchers engage in theory building (Locke, 2007), which is a type of
contribution that is underutilized in many domains in the organizational sciences (Aguinis, Forcum,
& Joo, in press; Shepherd & Sutcliffe, 2011). Note that respecification capitalizes on chance—an
element that should not be used for theory testing because of generalizability and ethical concerns
(Leung, 2011). So if the researcher decides to report respecified model(s), along with a discussion
about their implications for theory building, we recommend that the discussion be elaborated in the
‘‘future research directions’’ section of the manuscript (Brutus et al., 2013).
Regardless of whether respecification is used, other ways of handling influential outliers are to
delete them or use robust approaches (which involves a non-OLS standard such as least absolute
deviation, least trimmed squares, M-estimation, and Bayesian statistics; Kruschke, Aguinis, & Joo,
2012). We emphasize the importance of reporting the results with and without the chosen handling
technique, which includes providing an explanation for any differences in the results, because the
mere presence of influential outliers causes a dilemma in determining proper inference about a
population based on a sample. In other words, deletion or robust techniques remove or limit the
information provided by an actual data point, perhaps making the sample a biased representation
of the population. Because the absence or presence of a handling technique may lead to improper
inferences about a population, both results should be reported to (a) place the burden of determina-
tion for the most ‘‘accurate conclusions’’ on the reader and (b) ensure complete transparency so that
Aguinis et al. 291

the handling technique does not appear to have been chosen because it supported one’s hypotheses.
This recommendation is consistent with a customer-centric approach to reporting scientific results
(Aguinis et al., 2010).
On a positive note, our review of the substantive literature yielded examples of authorship teams
that clearly stated the identification techniques used, and these identification techniques were
appropriate (although authors did not use DFBETASij; e.g., Colbert, Kristof-Brown, Bradley, & Bar-
rick, 2008; Edwards, Cable, Williamson, Lambert, & Shipp, 2006). However, on a less positive note,
other authors did not clearly state the techniques used to identify influential outliers (see Table 4).
Without a description of the identification techniques used, a skeptical scientific audience might
raise doubts about a study’s substantive conclusions.
Structural Equation Modeling
In this section, we discuss influential outliers in the context of SEM by addressing model fit and
prediction outliers. Please refer to Figure 2 for a summary of the decision points involved.
Defining and identifying model fit outliers. Similar to regression, the identification of model fit out-
liers in SEM is a two-step process. The first involves identifying model fit outlier candidates. The
second involves investigating which of the candidates have influence on the model’s fit. As
explained in our earlier section on regression, the first step helps researchers save time and effort,
especially if the sample size is large.
As was the case with regression, the first step should already be completed after the implemen-
tation of our recommendations regarding error and interesting outliers (see Figure 1). In other words,
outliers that have been identified with multiple construct techniques and subsequently determined
not to be error or interesting outliers constitute candidates for model fit outliers. The second step
in identifying model fit outliers in SEM is to check whether the removal of a candidate changes
the fit of the model (Yuan & Bentler, 1998). That is, excluding an observation may cause a change
in the statistical significance of the overall model fit based on w2 or other fit indexes such as the
comparative fit index (CFI) or root mean square error of approximation (RMSEA).
Defining and identifying prediction outliers. As is the case in the context of regression, there are two
types of prediction outliers: global prediction outliers and specific prediction outliers. A global
prediction outlier influences all parameter estimates in a particular model. On the other hand, a
specific prediction outlier is defined as a data point that exerts influence on a single parameter esti-
mate. Thus, global prediction outlier methods in SEM are analogous to Cook’s Di and DFFITSi in
regression, whereas specific prediction outlier techniques in SEM are analogous to DFBETASij.
Our recommendation is to use the generalized Cook’s distance (gCDi) statistic to identify global
prediction outliers, where i refers to a data point (Pek & MacCallum, 2011). We suggest calculating
a gCDi value for every observation for the following reasons. First, gCDi values are calculated using
a software package, and, consequently, there is no additional effort required in investigating all cases
compared to just a few. Second, it is usually the case that there are no specific a priori predictions
about which cases may be prediction outliers. Accordingly, it is beneficial to examine gCDi values
for all observations.
A gCDi value is interpreted as a ratio, where the numerator quantifies the amount of change in a
group of parameter estimates when an observation i is excluded from the sample. The denominator
of this ratio is a standard error term that is also calculated without observation i in the sample. Note
that gCDi will always be positive, such that it indicates the absolute magnitude of change but not the
direction of change. The reason for this is that gCDi represents the change in multiple parameter
estimates (not a single estimate), and it is not logically possible to show through a single value how
292 Organizational Research Methods 16(2)

multiple parameter estimates change in possibly different directions. Nonetheless, the absolute mag-
nitude of change is summarized in a single value of gCDi: The greater the value of gCDi, the greater
the global influence of the corresponding data point on the parameter estimates (Pek & MacCallum,
2011). There are no clear cutoffs regarding what gCDi value indicates a global prediction outlier.
Thus, we recommend the use of an index plot, which includes case numbers on the x-axis and gCDi
values on the y-axis, to gain a better understanding of which gCDi values, and thus corresponding
cases, markedly deviate from others. For example, N. Martin and Pardo (2009) used index plots for
a variety of test statistics.
Note that a case may have a strong influence on just one parameter estimate but very small influ-
ence on others. As a result, the observation’s strong influence on the single parameter estimate may
be masked in a global measure of influence. Therefore, it is important to also examine specific pre-
diction outliers. Specific prediction outliers are identified by Dyji, or the single parameter influence,
which is the standardized change in the jth parameter resulting from the deletion of observation i
(Pek & MacCallum, 2011). Please note that positive values of Dyji indicate that excluding case i
causes a smaller value of yj (i.e., estimate of the jth parameter), whereas negative values of Dyji indi-
cate that excluding case i causes a larger value of yj. Thus, unlike a global prediction outlier repre-
sented by gCDi, which expresses the absolute magnitude of change but not the direction of change, a
specific prediction outlier identified byDyji captures both the magnitude and the direction of change.
In addition, for Dyji values to be identified as being influential, we recommend that Dyji values also
be graphed in an index plot because there are no clear cutoffs. Observations with Dyji values that
markedly deviate from other Dyji values are deemed specific prediction outliers (Pek &MacCallum,
2011). Finally, Dyji can be calculated by using a combination of R code, Mplus batch runs, and SAS
code. More generally useful R code is currently being developed by Pek and MacCallum (Jolynn
Pek, personal communication, July 6, 2012).
Handling influential outliers. Our recommendations for handling influential outliers in SEM are,
overall, similar to those for regression. That is, regardless of whether researchers decide to respecify
the model for theory-building purposes, we recommend the use of deletion or robust approaches.
Regarding robust approaches, we recommend a two-stage robust procedure (Yuan & Bentler,
1998) or a direct robust method using iteratively reweighted least squares (Yuan & Zhong, 2008;
Zhong & Yuan, 2011). Both of these methods use Mahalanobis distance to identify extreme cases
and limit their influence in the analysis. Using either of these robust methods will lead to estimators
that are not as heavily affected by influential outliers (Zhong & Yuan, 2011). Whether deletion or
robust regression is used, we again emphasize the need to report the results obtained with and
without the technique—a practice that also includes providing an explanation for any difference
in substantive results. Implementing this recommendation will improve transparency in the eyes
of a skeptical scientific audience.
Based on our review of the substantive literature, fewer than 5% of the 232 studies relied on SEM.
One likely reason for this low frequency, compared to approximately 40% of the 232 studies that
used regression, is that there are not many studies or textbooks discussing the role of outliers when
conducting SEM as is the case for regression. Therefore, it is likely that if more clear guidelines for
SEM exist, as we are hoping to provide with our article, researchers will be able to routinely address
outliers, and also will report their choices for doing so, in future studies relying on SEM. At the same
time, a common situation that we found across the studies that dealt with outliers when using SEM
was the choice of how to handle influential outliers. In a study by Goerzen and Beamish (2005), the
authorship team addressed outliers correctly by reporting their findings with and without a specific
handling technique (i.e., deletion). On the other hand, there were multiple other authorship teams
Aguinis et al. 293

that engaged in a specific handling technique (i.e., deletion) yet did not report their findings with and
without the handling technique (see Table 4).
Multilevel Modeling
Multilevel modeling incorporates data at multiple levels of analysis and estimates parameters that
reflect fixed and random effects. Given the complexity of the issues involved, it is not surprising
that there are few resources that discuss outliers in multilevel modeling, and many of those are
highly technical (e.g., Shi & Chen, 2008). In the multilevel modeling context, the task of defining,
identifying, and handling outliers becomes more complex compared to regression and SEM. When
using multilevel modeling, assuming a research design involving individuals nested within groups,
the relationship between a lower level predictor and a lower level criterion can be plotted for each
group, representing as many lines of relations as there are groups. So, for each of these groups, there
could be model fit and/or prediction outliers. Also, there could be groups that are vastly different
from other groups in terms of their mean value, variance, intercept, and/or slope. Finally, there can
be variation in sample sizes across groups, such that one group has many lower level units and
another group has few lower level units. Specifically, Mathieu, Aguinis, Culpepper, and Chen
(2012) reviewed 79 multilevel investigations published in the Journal of Applied Psychology
between 2000 and 2010 and found that Level 2 sample size ranged from 12 to 708 (Mdn ¼ 51).
Regardless of whether a multilevel study includes hypotheses about same-level direct effects
(e.g., effect of individual job satisfaction on individual job performance), cross-level direct
effects (e.g., effect of team-level cohesion on individual job performance), or cross-level interaction
effects (e.g., moderating effect of team-level cohesion on the relationship between individual job
satisfaction and individual job performance), the main goal of any analysis is to assess the size of
the variance components and the sources of such variances. Consider the case where there is a data
point in one group that causes the intercept and/or slope of that group to be vastly different from
other groups. Such a point could lead one to believe that there are between-group differences when
in fact such differences may not actually exist across most groups. Figure 2 includes a summary of
the decision points involved in the process of defining, identifying, and handling influential outliers
in multilevel modeling, which we discuss next.
Defining and identifying model fit outliers. From a practical standpoint, it is beneficial to adopt a top-
down approach to identifying model fit outliers in multilevel modeling (Langford & Lewis, 1998).
Thus, the implementation of outlier identification procedures begins at the highest level of analysis
(i.e., Level 3 in a three-level model, Level 2 in a two-level model). As a result of these identification
procedures, the researcher then determines whether a group of observations affects the model fit
because of (a) the group itself and/or (b) a particular data point(s) in the group. If the former situation
is correct, then the focal group is identified as a higher level outlier (i.e., outlier group). If the latter
situation is correct, then the individual observation(s) is identified as a lower level outlier. Again, the
rationale for this top-down approach is practical in nature because doing so is less time-consuming
compared to using a bottom-up approach (i.e., examining lower level outliers within each group
first). Next, we elaborate on the details of this top-down approach applied to model fit outliers.
In doing so, we base our discussion on a two-level model, but our discussion can be extrapolated
to situations involving more than two levels.
The identification of model fit outliers takes place through three steps: first, identifying model fit
outlier group candidates; second, assessing whether the candidate groups truly affect model fit; and
third, checking whether an actual model fit outlier group’s outlyingness is driven by (a) an outlying
data point(s) in the group and/or (b) the entire group. The first step is automatically completed once
the researcher has implemented our recommendations regarding error and interesting outliers
294 Organizational Research Methods 16(2)

discussed earlier (see Figure 1). In short, outlier groups that have been identified with multiple con-
struct techniques and subsequently determined not to be error or interesting outliers constitute can-
didates for model fit outlier groups. The second step involves checking whether the removal of a
candidate group changes model fit either from statistically significant to statistically nonsignificant,
or vice versa (Yuan & Bentler, 1998). More specifically, the exclusion of a candidate group may
cause a change in the statistical significance of the overall model fit (e.g., Akaike information
criterion [AIC] or Bayesian information criterion [BIC]) or incremental variance explained (see Van
Dick, Van Knippenberg, Kerschreiter, Hertel, & Wieseke, 2008). If the exclusion of a candidate
group changes the statistical significance of a model fit index, then the group constitutes a model
fit outlier group. The third step is to check whether the outlier group’s effect on model fit is driven
by (a) an outlying data point(s) in the group (hence, an individual observation identified as a lower
level model fit outlier) and/or (b) the entire group (hence, a group identified as a higher level model
fit outlier). To determine exactly which one of the two situations is at hand for a model fit outlier
group, we recommend that researchers follow our recommendations in Figure 1—those regarding
error outliers, then interesting outliers, and finally influential outliers in the context of regres-
sion—for the lower level cases in each model fit outlier group. The reason is that each group in a
multilevel analysis constitutes a separate regression analysis. If one or more nonerror, model fit out-
liers exist within the focal group, and if the exclusion of the model fit outliers within the group, in
turn, makes the exclusion of the group to no longer cause a statistically significant change in a model
fit, then the model fit outliers within the focal group are lower level model fit outliers. In contrast, if
no model fit outliers exist within the focal group, or if the focal group’s exclusion still causes a sta-
tistically significant change in a model fit index even after removing the model fit outlier(s), then the
focal group itself is (also) considered a higher level model fit outlier.
Defining and identifying prediction outliers. As was the case with model fit outliers, prediction outliers
are identified by using a top-down approach (Langford &Lewis, 1998). First, the recommendation is to
calculate the average squared deviation, orCj, for each group of cases, where the focal group is denoted
by j (Snijders&Berkhof, 2008; Snijders&Bosker, 2012). That is,Cj assesses the combined influence of
a group j on both the fixed and randomparameter estimates. A statistical test for determining the signifi-
cance of Cj has not yet been formally developed. Nevertheless, researchers can compare Cj values
against one another using an index plot. Snijders and Bosker have made statistical code available for
this procedure in MLwiN, R, and Stata (see www.stats.ox.ac.uk/~snijders/mlbook.htm).
Next, for each group whose Cj is found to be markedly deviant, the researcher should check
exactly what is driving the group’s particularly large value. As was with the previous situation
involving model fit outliers, a markedly large Cj may be driven by (a) a prediction outlier(s) within
the group and/or (b) the entire group as a prediction outlier. To determine which one of the two
situations is at hand for a group with a markedly large Cj (i.e., prediction outlier group), we once
again recommend an examination of any prediction outliers within each prediction outlier group
by using procedures described in our discussion of prediction outliers in the context of regression.
If one or more prediction outliers within the focal group are identified, and if the exclusion of the
prediction outlier(s) within the group makes the group’s Cj value no longer notably different from
those of other groups, then the prediction outlier(s) within the focal group are lower level predic-
tion outliers. In contrast, if the prediction outlier identification procedure reveals no prediction
outliers within the focal group, or if the focal group’s Cj value remains notably different from
other groups even after removing the prediction outlier(s) in the group, then the focal group itself
is (also) considered a higher level prediction outlier.
Handling influential outliers. Approaches for handling influential outliers in multilevel modeling
are, overall, similar to those used in regression and SEM. One option is to try to respecify the
Aguinis et al. 295

model for theory-building purposes. Regardless of whether respecification is used, the recom-
mendation is to use either deletion or robust techniques. Furthermore, regardless of whether
deletion or robust regression is used, results should be reported based on all of the approaches
used—a practice that also includes providing an explanation for any differences in the results.
This ensures transparency and also empowers the reader to be more fully informed of the
study’s results.
The technique of respecification, as in the situation involving regression, can take the form of
including another term in the model (e.g., cross-level interaction term). Once again, this inductive
practice of respecifying models post hoc is beneficial in terms of helping researchers engage in the-
ory building. However, unlike in regression, the multilevel modeling context requires the researcher
to first decide on the level where any additional predictor(s) are to be added. In a two-level model, if
the identified outliers (by following the procedures previously explained) mainly consist of higher-
level outliers (i.e., outlier groups), then we may consider adding additional Level 2 predictors. If the
identified outliers mainly consist of lower level outliers, then we may consider adding additional
Level 1 predictors. In either case, if the added variable is one that significantly adds incremental
variance explained, a data point previously identified as an outlier may no longer be such after the
model is respecified.
Options regarding robust techniques in the multilevel context include generalized estimating
equations (GEE) methods and bootstrapping methods. GEE methods estimate the variances and
covariances in the random part of the multilevel model directly from the residuals (Hox, 2010). This
approach estimates average population effects rather than modeling individual and group differ-
ences. The result of using GEE estimates is that they are less efficient than maximum likelihood esti-
mates, but they make weaker assumptions about the structure of the random part of the multilevel
model, which limits the effect of influential outliers. One drawback to this approach is that it only
approximates the random effects, so that these effects cannot be analyzed in detail. Bootstrapping
methods is another type of robust technique that could be used (Hox, 2010). These methods estimate
the parameters of a model and their standard errors from the sample, without reference to a theore-
tical sampling distribution. One drawback of this approach is that it is accurate only for large sample
sizes (n > 150; Hox, 2010).
An example of a study that used a correct handling procedure in the multilevel modeling context
is Smillie, Yeo, Furnham, and Jackson (2006; see Table 4). In this study, the authors used deletion as
a handling technique. In doing so, they reported their results with and without the handling tech-
nique. On the other hand, Table 4 includes an example of a study that used an incorrect handling
procedure because researchers deleted outliers, which is not necessarily incorrect per se, but they
did not report results with the outliers included in the analysis.
A Framework for Future Research on Outliers
Our article provides specific guidelines regarding how to define, identify, and handle outliers within
the context of the three most popular data-analytic techniques in organizational science research. In
addition, our article offers a general framework that can be used in future research for creating
guidelines that are specific to other data-analytic contexts.
First, Figure 1 shows that the process of addressing error and interesting outliers is virtually the
same regardless of which data-analytic technique is used. Therefore, these first two steps in the
process remain very similar if a researcher uses any of the three data-analytic approaches we dis-
cussed (i.e., regression, SEM, and multilevel analysis), meta-analysis, cluster analysis, or any other
data-analytic technique.
Second, regarding influential outliers, Tables 1 to 3 include information that forms the basis
for a future research agenda. Specifically, we foresee future research on outliers focusing on
296 Organizational Research Methods 16(2)
other data-analytic approaches that would rely on the results of our literature review summari-
zed in these tables. For example, Table 1 includes definitions of outliers in the context of addi-
tional data-analytic approaches such as meta-analysis (e.g., influential meta-analysis effect size
outlier), time series analysis (e.g., influential time series innovation outlier), and cluster anal-
ysis (e.g., cluster analysis outlier). Similarly, Table 2 includes various options in terms of
how to identify outliers in contexts other than regression, SEM, and multilevel modeling. As
examples, these identification techniques include schematic plot analysis (for meta-analysis),
2- or 3-dimensional plots of the original and the principal component variables (for principal
component analysis), and autocorrelation function plot (for time series analysis). Finally,
Table 3 includes a list of outlier handling techniques, some of which can be used across various
data-analytic contexts.
In short, we see our article as the first within a broader research agenda on outliers that will
eventually include specific guidelines that researchers can use in their substantive work regardless
of the particular data-analytic approach used. The general framework offered in Figure 1, combined
with the information included in Tables 1 to 3, form the basis for future work that can produce
decision-making charts similar to those summarized in Figure 2 and would address other data-
analytic approaches such as meta-analysis, cluster analysis, principal component analysis, and
time-series analysis, among others.
Concluding Remarks
Outliers, or observations that deviate markedly from the rest, often cause important changes in
substantive conclusions. Outliers, although typically not acknowledged or discussed openly
in published journal articles, are pervasive in all empirical research, ranging from the micro
to the macro level of analysis and spanning all types of methodological and statistical
approaches. The way in which researchers define, identify, and handle outliers has important
implications for substantive conclusions. Yet, our review of influential methodological sources
regarding outliers revealed that there is inconsistent information regarding how researchers
should define, identify, and handle them. It is not surprising that our literature review of sub-
stantive articles published in organizational science journals revealed that researchers often
implement idiosyncratic, nontransparent, and difficult-to-replicate practices regarding outliers.
Moreover, a cynical view is that outliers are treated in such a way that their inclusion or exclu-
sion from a data set is not based on sound and standardized practices, but on whether results
favor one’s preferred hypotheses.
Our article offers specific recommendations that researchers can follow in a sequential manner to
deal with outliers. We believe that our guidelines will not only be helpful for researchers, but also
serve as a useful tool for journal editors and reviewers in the evaluation of manuscripts. For example,
much like editors and reviewers should demand that authors be clear and specific about a study’s
limitations (Brutus et al., 2013), we suggest that they should also request that authors include a few
sentences in every empirically based manuscript describing how error, interesting, and influential
outliers were defined, identified, and handled. Moreover, an anonymous reviewer suggested that
guidelines for publication such as those produced by the Academy of Management and the
American Psychological Association should force authors to include a short section on ‘‘Outlier
Detection and Management’’ within the results section. In other words, this description should
include how each of the three types of outliers has been addressed in all empirical studies. Our
decision-making charts can serve as a checklist in this regard. Overall, we hope that our guidelines
will result in more consistent and transparent practices regarding the treatment of outliers in
organizational science research.
Aguinis et al. 297

Acknowledgments
We thank Terri Scandura and three Organizational Research Methods anonymous reviewers for their highly
constructive and detailed feedback on previous drafts. Some of the material included in this article was pre-
sented as preconference development workshops at the meetings of the Academy of Management in August
2011 (San Antonio, TX) and August 2012 (Boston, MA). The second and third authors contributed equally
to this research, and their names are listed alphabetically.
Declaration of Conflicting Interests
The author(s) declared no potential conflicts of interest with respect to the research, authorship, and/or
publication of this article.
Funding
The author(s) received no financial support for the research, authorship, and/or publication of this article.
References
Aguinis, H. (2004). Regression analysis for categorical moderators. New York, NY: Guilford.
Aguinis, H., Forcum, L. E., & Joo, H. (in press). Using market basket analysis in management research. Journal
of Management. doi:10.1177/0149206312466147
Aguinis, H., Pierce, C. A., Bosco, F. A., &Muslin, I. S. (2009). First decade ofOrganizational Research Methods:
Trends in design, measurement, and data-analysis topics. Organizational Research Methods, 12, 69-112.
Aguinis, H., Werner, S., Abbott, J. L., Angert, C., Park, J. H., & Kohlhausen, D. (2010). Customer-centric sci-
ence: Reporting significant research results with rigor, relevance, and practical impact in mind.
Organizational Research Methods, 13, 515-539.
Amiot, C. E., Terry, D. J., Jimmieson, N. L., & Callan, V. J. (2006). A longitudinal investigation of coping
processes during a merger: Implications for job satisfaction and organizational identification. Journal of
Management, 32, 552-574.
Aytug, Z. G., Rothstein, H. R., Zhou, W., & Kern, M. C. (2012). Revealed or concealed? Transparency of
procedures, decisions, and judgment calls in meta-analyses. Organizational Research Methods, 15, 103-133.
Barnett, V., & Lewis, T. (1994). Outliers in statistical data (3rd ed.). New York, NY: John Wiley.
Becker, C., & Gather, U. (1999). The masking breakdown point of multivariate outlier identification rules.
Journal of the American Statistical Association, 94, 947-955.
Belsley, D. A., Kuh, E., &Welsh, R. E. (1980). Regression diagnostics: Identifying influential data and sources
of collinearity. New York, NY: John Wiley.
Blanton, H., Jaccard, J., Klick, J., Mellers, B., Mitchell, G., & Tetlock, P. E. (2009a). Strong claims and weak
evidence: Reassessing the predictive validity of the IAT. Journal of Applied Psychology, 94, 567-582.
Blanton, H., Jaccard, J., Klick, J., Mellers, B., Mitchell, G., & Tetlock, P. E. (2009b). Transparency should
trump trust: Rejoinder to McConnell and Leibold (2009) and Ziegert and Hanges (2009). Journal of
Applied Psychology, 94, 598-603.
Bollen,K.A.,& Jackman, R.W. (1990). Regression diagnostics:An expository treatment of outliers and influential
cases. In J. Fox & J. S. Long (Eds.),Modern methods of data analysis (pp. 257-291). Newbury Park, CA: Sage.
Brown, D. J., Cober, R. T., Kane, K., Levy, P. E., & Shalhoop, J. (2006). Proactive personality and the success-
ful job search: A field investigation with college graduates. Journal of Applied Psychology, 91, 717-726.
Brutus, S., Aguinis, H., &Wassmer, U. (2013). Self-reported limitations and future directions in scholarly reports:
Analysis and recommendations. Journal of Management, 39, 48-75. doi:10.1177/0149206312455245
Byrne, B. M. (2001). Structural equation modeling with AMOS, EQS, and LISREL: Comparative approaches to
testing for the factorial validity of a measuring instrument. International Journal of Testing, 1, 55-86.
Cohen, J., Cohen, P., West, S. G., & Aiken, L. S. (2003). Applied multiple regression/correlation analysis for
the behavioral sciences (3rd ed.). Mahwah, NJ: Lawrence Erlbaum.
298 Organizational Research Methods 16(2)

Colbert, A. E., Kristof-Brown, A. L., Bradley, B. H., & Barrick, M. R. (2008). CEO transformational leader-
ship: The role of goal importance congruence in top management teams. Academy of Management Journal,
51, 81-96.
Cortina, J. M. (2002). Big things have small beginnings: An assortment of ‘‘minor’’ methodological misunder-
standings. Journal of Management, 28, 339-362.
Diener, E. (2000). Subjective well-being: The science of happiness and a proposal for a national index.
American Psychologist, 55, 34-43.
Edwards, J. R., & Cable, D. M. (2009). The value of value congruence. Journal of Applied Psychology, 94,
654-677.
Edwards, J. R., Cable, D. M., Williamson, I. O., Lambert, L. S., & Shipp, A. J. (2006). The phenomenology of
fit: Linking the person and environment to the subjective experience of person-environment fit. Journal of
Applied Psychology, 91, 802-827.
Fidell, L. S., & Tabachnick, B. G. (2003). Preparatory data analysis. In J. A. Schinka & W. F. Velicer (Eds.),
Handbook of psychology: Research methods in psychology (Vol. 2, pp. 115-141). New York, NY: JohnWiley.
Gladwell, M. (2008). Outliers: The story of success. New York, NY: Little, Brown.
Godfrey, P. C., Merrill, C. B., & Hansen, J. M. (2009). The relationship between corporate social responsibility
and shareholder value: An empirical test of the risk management hypothesis. Strategic Management
Journal, 30, 425-445.
Goerzen, A., & Beamish, P. W. (2005). The effect of alliance network diversity on multinational enterprise
performance. Strategic Management Journal, 26, 333-354.
Grubbs, F. E. (1969). Procedures for detecting outlying observations in samples. Technometrics, 11, 1-21.
Hawawini, G., Subramanian, V., & Verdin, P. (2003). Is performance driven by industry- or firm-specific
factors? A new look at the evidence. Strategic Management Journal, 24, 1-16.
Hitt, M. A., Harrison, J. S., Ireland, R. D., & Best, A. (1998). Attributes of successful and unsuccessful acquisi-
tions of US firms. British Journal of Management, 9, 91-114.
Hollenbeck, J. R., DeRue, D. S., & Mannor, M. (2006). Statistical power and parameter stability when subjects
are few and tests are many: Comment on Peterson, Smith, Martorana, and Owens (2003). Journal of Applied
Psychology, 91, 1-5.
Hox, J. J. (2010). Multilevel analysis: Techniques and applications (2nd ed.). New York, NY: Routledge.
Huffman, M. L., Cohen, P. N., & Pearlman, J. (2010). Engendering change: Organizational dynamics and
workplace gender desegregation, 1975–2005. Administrative Science Quarterly, 55, 255-277.
Hunter, J. E., & Schmidt, F. L. (2004). Methods of meta-analysis: Correcting error and bias in research
findings (2nd ed.). Thousand Oaks, CA: Sage.
Jasso, G. (1985). Marital coital frequency and the passage of time: Estimating the separate effects of spouses’
ages and marital duration, birth and marriage cohorts, and period influences. American Sociological Review,
50, 224-241.
Kahn, J. R., & Udry, J. R. (1986). Marital coital frequency: Unnoticed outliers and unspecified interactions lead
to erroneous conclusions. American Sociological Review, 51, 734-737.
Kruschke, J. K., Aguinis, H., & Joo, H. (2012). The time has come: Bayesian methods for data analysis in the
organizational sciences. Organizational Research Methods, 15, 722-752.
Kulich, C., Trojanowski, G., Ryan, M. K., Haslam, S. A., & Renneboog, L. D. R. (2011). Who gets the carrot
and who gets the stick? Evidence of gender disparities in executive remuneration. Strategic Management
Journal, 32, 301-321.
Kutner, M. H., Nachtsheim, C. J., Neter, J., & Li, W. (2004). Applied linear statistical models (5th ed.). Boston:
McGraw-Hill/Irwin.
Langford, I. H., & Lewis, T. (1998). Outliers in multilevel data. Journal of the Royal Statistical Society, Series
A, 161, 121-160.
Leung, K. (2011). Presenting post hoc hypotheses as a priori: Ethical and theoretical issues. Management and
Organization Review, 7, 471-479.
Aguinis et al. 299
Locke, E. A. (2007). The case for inductive theory building. Journal of Management, 33, 867-890.
Martin, M. A., & Roberts, S. (2010). Jackknife-after-bootstrap regression influence diagnostics. Journal of
Nonparametric Statistics, 22, 257-269.
Martin, N., & Pardo, L. (2009). On the asymptotic distribution of Cook’s distance in logistic regression models.
Journal of Applied Statistics, 36, 1119-1146.
Mathieu, J. E., Aguinis, H., Culpepper, S. A., & Chen, G. (2012). Understanding and estimating the power
to detect cross-level interaction effects in multilevel modeling. Journal of Applied Psychology, 97,
951-966.
McConnell, A. R., & Leibold, J. M. (2001). Relations among the Implicit Association Test, discriminatory
behavior, and explicit measures of racial attitudes. Journal of Experimental Social Psychology, 37, 435-442.
McConnell, A. R., & Leibold, J. M. (2009). Weak criticisms and selective evidence: Reply to Blanton et al.
(2009). Journal of Applied Psychology, 94, 583-589.
McNamara, G., Aime, F., & Vaaler, P. M. (2005). Is performance driven by industry- or firm-specific factors?
A response to Hawawini, Subramanian, and Verdin. Strategic Management Journal, 26, 1075-1081.
Mohrman, S. A., & Lawler, E. E., III. (2012). Generating knowledge that drives change. Academy of
Management Perspectives, 26, 41-51.
O’Boyle, E., Jr., & Aguinis, H. (2012). The best and the rest: Revisiting the norm of normality of individual
performance. Personnel Psychology, 65, 79-119.
Orr, J. M., Sackett, P. R., & DuBois, C. L. Z. (1991). Outlier detection and treatment in I/O psychology: A
survey of researcher beliefs and an empirical illustration. Personnel Psychology, 44, 473-486.
Pek, J., & MacCallum, R. C. (2011). Sensitivity analysis in structural equation models: Cases and their
influence. Multivariate Behavioral Research, 46, 202-228.
Peterson, R. S., Smith, D. B., Martorana, P. V., & Owens, P. D. (2003). The impact of chief executive officer
personality on top management team dynamics: One mechanism by which leadership affects organizational
performance. Journal of Applied Psychology, 88, 795-808.
Pierce, J. R., & Aguinis, H. (2013). The too-much-of-a-good-thing effect in management. Journal of
Management, 39(2), 313-338. doi:10.1177/0149206311410060
Raudenbush, S. W., Bryk, A. S., Cheong, Y. F., Congdon, R. T., Jr., & Du Toit, M. (2004). HLM 6:
Hierarchical linear and nonlinear modeling. Lincolnwood, IL: Scientific Software International.
Reuer, J. J., & Arino, A. (2002). Contractual renegotiations in strategic alliances. Journal of Management, 28,
47-68.
Rousseeuw, P. J., & Leroy, A. M. (2003). Robust regression and outlier detection. Hoboken, NJ: John Wiley.
Seligman, M. E. P., & Csikszentmihalyi, M. (2000). Positive psychology: An introduction. American
Psychologist, 55, 5-14.
Shepherd, D. A., & Sutcliffe, K. M. (2011). Inductive top-down theorizing: A source of new theories of
organization. Academy of Management Review, 36, 361-380.
Shi, L., & Chen, G. (2008). Detection of outliers in multilevel models. Journal of Statistical Planning and
Inference, 138, 3189-3199.
Smillie, L. D., Yeo, G. B., Furnham, A. F., & Jackson, C. J. (2006). Benefits of all work and no play: The
relationship between neuroticism and performance as a function of resource allocation. Journal of
Applied Psychology, 91, 139-155.
Snijders, T. A. B., & Berkhof, J. (2008). Diagnostic checks for multilevel models. In J. de Leeuw & E. Meijer
(Eds.), Handbook of multilevel analysis (pp. 141-176). New York, NY: Springer.
Snijders, T. A. B., & Bosker, R. J. (2012).Multilevel analysis: An introduction to basic and advanced multilevel
modeling (2nd ed.). Thousand Oaks, CA: Sage.
St. John, C. H., & Harrison, J. S. (1999). Manufacturing-based relatedness, synergy, and coordination. Strategic
Management Journal, 20, 129-145.
Tabachnick, B. G., & Fidell, L. S. (2007). Using multivariate statistics (5th ed.). Boston, MA: Pearson.
300 Organizational Research Methods 16(2)
Tomarken, A. J., & Waller, N. G. (2005). Structural equation modeling: Strengths, limitations, and misconcep-
tions. Annual Review of Clinical Psychology, 1, 31-65.
Van Dick, R., Van Knippenberg, D., Kerschreiter, R., Hertel, G., & Wieseke, J. (2008). Interactive effects of
work group and organizational identification on job satisfaction and extra-role behavior. Journal of
Vocational Behavior, 72, 388-399.
Wanberg, C. R., Glomb, T. M., Song, Z., & Sorenson, S. (2005). Job-search persistence during unemployment:
A 10-wave longitudinal study. Journal of Applied Psychology, 90, 411-430.
Wiggins, R. R., & Ruefli, T. W. (2005). Schumpeter’s ghost: Is hypercompetition making the best of times
shorter? Strategic Management Journal, 26, 887-911.
Worren, N., Moore, K., & Cardona, P. (2002). Modularity, strategic flexibility, and firm performance: A study
of the home appliance industry. Strategic Management Journal, 23, 1123-1140.
Yuan, K.-H., & Bentler, P. M. (1998). Structural equation modeling with robust covariances. Sociological
Methodology, 28, 363-396.
Yuan, K.-H., & Zhong, X. (2008). Outliers, leverage observations, and influential cases in factor analysis:
Using robust procedures to minimize their effect. Sociological Methodology, 38, 329-368.
Zhang, Z., & Yuan, K.-H. (2012). semdiag: Structural equation modeling diagnostics (R Package Version 0.1.2)
[Computer software manual]. Retrieved from http://cran.at.r-project.org/web/packages/semdiag/semdiag.pdf
Zhong, X., & Yuan, K.-H. (2011). Bias and efficiency in structural equation modeling: Maximum likelihood
versus robust methods. Multivariate Behavioral Research, 46, 229-265.
Ziegert, J. C., & Hanges, P. J. (2009). Strong rebuttal for weak criticisms: Reply to Blanton et al. (2009).
Journal of Applied Psychology, 94, 590-597.
Author Biographies
Herman Aguinis is the Dean’s Research Professor, a professor of organizational behavior and human
resources, and the founding director of the Institute for Global Organizational Effectiveness in the Kelley
School of Business, Indiana University. His research interests span several human resource management, orga-
nizational behavior, and research methods and analysis topics. He has published five books and more than 100
articles in refereed journals. He is the recipient of the 2012 Academy of Management Research Methods Divi-
sion Distinguished Career Award and a former editor-in-chief of Organizational Research Methods.
Ryan K. Gottfredson is a doctoral student in organizational behavior and human resource management in the
Kelley School of Business, Indiana University. His research interests include performance management,
research methods and analysis, and relationship perceptions in the workplace (e.g., trust, justice). His work has
appeared in several refereed journals including Academy of Management Learning and Education, Journal of
Organizational Behavior, and Business Horizons.
Harry Joo is a doctoral student in organizational behavior and human resource management in the Kelley
School of Business, Indiana University. His research interests include performance management and research
methods and analysis. His work has appeared in several refereed journals including Organizational Research
Methods, Journal of Management, Academy of Management Perspectives, and Business Horizons.
Aguinis et al. 301