organizational development: an investigation into the
TRANSCRIPT

Portland State University Portland State University
PDXScholar PDXScholar
Dissertations and Theses Dissertations and Theses
1-1-1986
Organizational development: an investigation into Organizational development: an investigation into
the knowledge obsolescence of engineers in the the knowledge obsolescence of engineers in the
electronics industry electronics industry
Cheryl J. Hubbard Portland State University
Follow this and additional works at: https://pdxscholar.library.pdx.edu/open_access_etds
Let us know how access to this document benefits you.
Recommended Citation Recommended Citation Hubbard, Cheryl J., "Organizational development: an investigation into the knowledge obsolescence of engineers in the electronics industry" (1986). Dissertations and Theses. Paper 825. https://doi.org/10.15760/etd.825
This Dissertation is brought to you for free and open access. It has been accepted for inclusion in Dissertations and Theses by an authorized administrator of PDXScholar. Please contact us if we can make this document more accessible: [email protected].

ORGANIZATIONAL DEVELOPMENT: AN INVESTIGATION INTO THE
KNOWLEDGE OBSOLESCENCE OF ENGINEERS IN THE
ELECTRONICS INDUSTRY
By
Cheryl J. Hubbard
A dissertation submitted in partial fulfillment of the requirement for the degree of
DOCTOR OF EDUCATION
in
PUBLIC SCHOOL ADMINISTRATION AND SUPERVISION
Portl alia State University The University of Oregon
1986
------------------

TO THE OFFICE OF GRADUATE STUDIES AND RESEARCH:
The members of the Committee approve the dissertation of Cheryl
J. ~~bbard presented May 22, 1986.
State Oniversity
APPROVED:
AN ABSTRACT OF THE DISSERTATION OF Cheryl J. Hubbard for the
Doctor of Education in Public School Administration and Supervision
presented May 22, 1986.
Title: Organizational Development: An Investigation into the
Knowledge Obsolescence of Engineers in the Electronics
Industry.
Dr. Ulrich Hardt, Ghalr, Portland State Unlversity
nlVerslty
Purpose
This organizational study was designed to investigate
development climate within the context of a single organization

2
experiencing rapid change in its environment resulting in increasing
employee knowledge obsolescence.
Secondary purposes were: 1) to determine current development
methods and the extent of their use; 2) to identify preferred develop
ment methods; 3) to examine the influence of educational background on
development; 4) to examine the influence of length of service on
development and 5) to investigate reward preferences and their link to
development.
Procedure
The data were collected through a survey of 550 nonmanager engi
neers. Additional information was obtained from the Human Resource
Information System database. The questionnaire consisted of indi
vidual background information and a modified version of the Work Des
cription Questionnaire for Engineers (WDQE) with supplemental reward
and development sections. Key work environment factors investigated
were: 1) organization support; 2) management support; 3) peer sup
port; 4) communication and involvement and 5) work assignments.
Responses were obtained from 320 nonmanager engineers. A chi-square
analysis tested null hypotheses for education and length of service
groups.
Summary of Findings and Conclusions
The following findings and conclusions resulted from the study:
1) The engineering population differed significantly in their
education and length of service backgrounds. 2) Knowledge foundation
3
requirements for entry in the organization in the past five years have
increased. 3) Non-degree development is more important for the
majority, while degree development is important to bachelor-degreed
and shorter length-of-service employees. 4) Reported non-degreed
development averaged one course/seminar per year, 2-4 hours of
independent reading per week and discussions within the immediate work
group. Education groups reported significant differences in internal
course/seminar participation and reading behavior. 5) The most
effective development methods included a. challenging job, reading, an
advanced degree, courses/seminars, interdisciplinary teams and
internal networking. Education groups showed significant differences
for reading and interdisciplinary teams. 6) Primary barriers to
development included time, cost, management and workload. 7) The
work environment climate for development in the organization was
moderate. Peer support received the highest rating; organization,
management, and work assignments were rated moderately. Education
groups showed greater significant differences than did length of
service groups for development climate. 8) The most preferred
rewards included salary/merit increases, achievement, advancement,
recognition and challenging work. Education groups reported
significant differences in key preferred rewards. 9) Moderate
opportunity for preferred rewards occurred independent of development
behavior. Education groups showed significant differences in
opportunity for challenging work with improved development. Length of
service groups reported significant differences for opportunity of
rewards even with increased development •
. _._ .... _--_ .... __ .. - .. _-----_ .. __ ._--- .. -. __ . -._ .. _---_._ ....• _._-.-._-

ACKN(M LEDGEMENTS
First, mY greatest respect and appreciation is extended to my
grandmother, Gladys M. Beckman who has been an endless source of
inspiration and encouragement for me throughout my life.
A special appreciation is given to mY advisor, Dr. Ulrich H.
Hardt, who caring1y and masterfully guided me through the doctoral
program and to the dissertation committee members, Dr. Carol A.
Burden, Dr. John F. Heflin, Dr. Alan Cabe11y, Dr. Walter Ellis, Dr.
Ralph Rands and Mr. Eddie R. Ward for their expertise, direction, and
continuous support.
Finally, this project would still be unfinished without the
understanding of mY manager, Dr. Angelica Pilato, and the support of
my staff, Laura, Tam, Mary and Marilyn.
TABLE OF CONTENTS
PAGE
ACKNCWLEDGEMENTS •••••••••• ~............................ •••••••• iii LIST OF TABLES................................................. vi LIST OF FIGURES ••••••••••••••••••••••••••••••••••.•••..•••••••• viii
CHAPTER
I INTRODUCTION •••••••••••••••••• o •••••••••••••••• &... 1 Background..................................... 2 Statement of the Research Problem.............. 5 Conceptual Framework........................... 5 Assumptions.................................... 7 Delimitations of the Study..................... 8 Definition of Key Terms........................ 8 Importance of the Study........................ 9
Human Resource Management.................... 9 Human Resource Information System............ 10 Education Theory and Practice................ 10 Electronics Industry......................... 12
II REVIEW OF LITERATURE............................... 14 Organization Behavior and Development.......... 14 Environment: The Driving Force for
Development.................................. 22 An Example: The Technical Organization........ 28
Engineering Development: Research Overview.. 32 Engineering Development: Key Studies........ 35
Conclusion..................................... 46 III METHODOLOGY AND PROCEDURES......................... 48
Population and Sample.......................... 48 Representativeness of Sample................... 50 The Survey Instrument.......................... 54 Research Design and Procedures................. 59
IV DATA PRESENTATION AND DISCUSSION................... 64 Introduction................................... 64 Educational Foundations of Nonmanager Engineers. 66
Non-degreed Engineers....................... 67 Engineers with Bachelor Degrees.............. 68 Engineers with Advanced Degrees.............. 69 Currentness of Engineering Education......... 69 Currentness of Education by Length of
Service ••••••••••••••••••••.•••••••••••••. 70
------------------_._---_.-.. -._._.,

v.
Implications for Organization •••••••••••••••• Conclusion •••••••••••••••••••••••••••••••••••
Educational Development of Engineers ••••••••••• Motivation for Educational Development ••••••• Educational Development Practices ••••••••••••
Degree-Related Development ••••••••••••••••• Non-degree Development •••••••••••••••••••••
Courses and Seminars ••••••••••••••••••••• Independent Reading •••••••••••••••••••••• Networking •••••••••••••••••••••••••••••••
Effective Development Methods •••••••••••••••••• Barriers to Development •••••••••••••••••••••••• Work Environment for Development •••••••••••••••
Organizational Support ••••••••••••••••••••••• Management Support ••••••••••••••••••••••••••• Peer Support •••••.••••.••••••••.••••••••••••• Work Assignments ••••••••••••••••••••••••••••• Involvement/Communication •••••••••••••••••••• Climate •••••••••••••••••••••••••••••••••••••• Conclusion ••••••• oo ••••• o ••••••••••••••••••••
Rewards ••••••••••••••••••••••• oo •••••••••••••••
Preferences ••••••••••.•••••••••.••.•.•••••... Relationship to Development ••••••••••••••••••
Analysis of Group Differences ••••••••••••••••••
SUMMARY, CONCLUSIONS AND RECOMMENDATIONS •••••••••• Introduction ••••••••••••••••••••••••••••••••• o.
Summa ry ••••••••••••••••••••••••••••• 0 •• 0 0 0 0 0 ••
Conclusions •••••••••••••••••••••••••••••••••••• Importance of Study ••••••••••••••••••••••••••••
Human Resource Management •••••••••••••••••••• Human Resource Information Systems ••••••••••• Educational Theory and Practice •••••••••••••• Electronics Industry •••••••••••••••••••••••••
Recommendations for Further Research •••••••••••
v
Page 72 75 75 76 78 78 79 79 82 83 89 92 92 93 95 98 99
100 102 104 106 106 109 112
115 115 116 123 125 125 127 127 132 133
Bibliography.................................................. 136 Appendix A.................................................... 148 Appendix B..................................................... 155 Appendix C ••••••••••••••••••••••••••••••••••••••••••••••••••••• 157

TABLE
LIST OF TABLES
PAGE
I Engineer Distribution by length of Service......... 51 II Engir.~er Distribution by Age....................... 52
III Engineer Distribution by Company Groups............ 53 IV Levels of Engineering Education by length of
Service, Age and Sex Groups...................... 68 V Completion Dates of Respondents Engineering Degree. 70
VI Completion Dates of Engineering Degrees for length of Service Groups................................ 71
VII Relationship of Educational Development to Career for length of Service Groups..................... 76
VIII Relationship of Educational Development to Career for Education Groups............................. 77
IX Degree Development for length of Service and Education Groups................................. 78
X Non-degree Course and Seminar Participation........ 79 XI Number of Courses/Seminars Taken by Education
GroupSoaoo....................................... 80 XII Number of Courses/Seminars by length of Service
Groups •••••••••••• e ..... e.e...................... 81 XIII Independent Reading by Education Groups............ 82
XIV Independent Reading by length of Service Groups.... 83 XV Technical Discussion within Work Group for
Education Groups................................. 84 XVI Technical Di scussion within Work Groups for length
of Service Groups................................ 85 XVII Networking across Groups/Divisions for Education
Groups........................................... 85 XVIII Networking across Groups/Divisions for Length of
Service Groups................................... 86 XIX Networking Outside of Organization for Education
Groups........................................... 86 XX Networking Outside of Organization for length of
Service Groups................................... 86 XXI Summary of Networking Behavior..................... 87
XXII Non-degree Development Summary for Engineers not 88 Working on Degrees ••• ~ •••••••••••••••••••••••• < ••
XXIII Non-degree Development Summary for Engineers in Degree Programs.................................. 88
--------.-.~-... -----------------.. -------.---------.-
XXIV XXV
XXVI XXVII
XXVIII XXIX
XXX XXXI
XXXII XXXIII
XXXIV XXXV
vii
Page
List of Effective Development Methods.............. 91 Organization Support for Development............... 94 Management Support for Development................. 97 Peer Support for Development....................... 98 Work Assignments................................... 100 Involvement/Communication.......................... 101 Climate ••••••••••••••••••.••••••••••••.•••••••••••• 103 Work Environment Summary ••••••••••••••••••••••••••• 105 Ranking of Reward Preferences •••••••••••••••••••••• 108 Opportunity for Reward/Same Skill •••••••••••••••••• 110 Opportunity for Reward/Improved Skill.............. 111 Group Differences.................................. 112

Figure
LIST OF FIGURES
PAGE
1 A Systems Model of Organizational Behavior.......... 6 2 Model of Organization as a Transformation Process... 16 3 Components of an Organizational System.............. 17 4 Model of Integrative Mechanisms for Organizational
Effectiveness..................................... 20 5 Dubin's Model of Technical Updating................. 55 6 Work Description Questionnaire for Engineers Sub-
scale Reliabilities Estimated by Coefficient alpha............................................. 57
7 A Systems Model of Organizational Behavior •••••••••• 117
----------------~----.---.... -.... --

CHAPTER I
INTRODUCTION
Modern organizational theory increasingly views organizations as
systems characterized by interdependent and interactive elements.
Open systems interact with their environments taking energy,
materials, information from the external environments, transforming
these resources into a flow of products and services for users as well
as outcomes that maintain and renew the system (French & Bell, 1984;
Nadler & Tushman, 1980). The concept of organization as a system is
one of the major underlying principles of organizational development
-- a continuous process of renewal to achieve sustained organizational
effectiveness and efficiency.
With increasingly rapid changes in the environment, organiza
tions must learn to adapt. Organization development at all levels -
individual, group, and organization -- provides opportunity for this
required change. Change in technology, knowledge, social values and
attitudes, international markets influences people's capability to
contribute to organizational goals. Thus, knowledge obsolescence in
today's organization presents a formidable organization renewal and
development issue.
2
Background
Organizations and people together face the challenge of managing
knowledge obsolescence in work settings as technological change, in
creased world competition and shifting labor force values and expec
tations exert new pressures on the production of quality goods and
services. Knowledge obsolescence threatens both the individual's
ability to contribute as well as the organization's ability to adapt
to changing environmental conditions. Technological change, economic
pressures and increasing complexity of jobs contribute to the ac
celerating pace of knowledge obsolescence in today's work environments
(Westcott, 1976; Best, 1984).
For the individual, not confronting knowledge obsolescence may
have serious consequences: reduced ability to perform effectively,
displacement, temporary layoff, and even termination. The individual
who seeks personal satisfaction and growth through work may experience
over time the frustration of eroded performance, diminished contribu
tion and recognition, and a reduced sense of personal competence,
ach i evement and se 1f -worth (Mill er, 1977b).
For the organization, not confronting knowledge obsolescence
also has critical outcomes: reduced productivity and profitability,
increased costs, lowered market position, and even organizational
failure. Thus, the organization and the individual together must ac
cept the challenge of eliminating, or at least, diminishing knowledge
obsolescence so that they can strive for a mutually beneficial, pro
ductive future.
-----------_ .... _-_._-_._-_ ... _----

3
Knowledge obsolescence has been described in various ways. It
has been defined as the lack of knowledge and techniques related to a
particular discipline, as reduced individual performance over time, as
a discrepancy between job requirements and individual capabilities,
and as the erosion of the applicability of knowledge and skills
(Criss, 1973; Zelikoff, 1969; Burack, 1972).
Essentially, knowledge obsolescence exists when the optimal
knowledge and skills necessary to produce organizational results are
not available to the organization, or if available, they are unused
and unnurtured to the maximum benefit of the individual and the
organization. Knowledge obsolescence exists, then, when anyone or
combination of the following conditions persist in an organization:
1. Deficient knowledge and skills that reduce present produc
tivity and innovation.
2. Underutilization of available knowledge and skills that
reduce productivity and innovation.
3. Limited development of new knowledge and skills integrally
related to future productivity and innovation.
4. Work environments that minimize stimulation and motivation
for new knowledge development and application that in turn
reduce both present and future innovation and productivity.
Thus, an organization whose present effectiveness and future
survival is dependent on competent, current knowledge for innovation
and pr'oducti vity must address these essenti al questi ons.
1. To what degree are the existing knowledge and skills limit
ing productivity and innovation?
4
2. To what degree are the available knowledge and skills cur
rently underutilized?
3. To what degree do the work environment and job experiences
of individuals optimize exposure to new developments and,
thereby, serve as incentives to development of new knowledge
and skills?
4. To what degree are new knowledge and skills being developed
to increase the capability of the organization for future
organizational strength?
Combatting knowledge obsolescence requires the individual and
the organization to recognile the degree of change occurring within
the organization and its environment and to strategically plan for the
continuous development and optimal utilization of the labor force so
that the required vitality of the human resources will match the
degree of change. Therefore, in the dynamic organization systematic
and continuous development of knowledge and skills is vital for long
term organizational excellence and continuity of employment for its
members.
Thus, lifelong learning is no longer academic conversation, a
II perk II given to increase job satisfaction, an enticement for key
talent, or a management luxury to be set aside when budgets are
tight. Continued, systematic learning is an individual and organiza
tional necessity--a reality for the employee who wants to remain pro
ductive and vital and for the organization that wants continued
growth, profitability, and innovation.
--------------------.. -~ .•........

Statement of the Research Problem
This research investigates knowledge obsolescence within the
context of a private sector organization influenced by rapidly
changing external and internal environmental factors for its
survival. The investigation includes the following foci:
1) Knowledge Foundations: the extent and currentness of the
basic knowledge base evidenced by a combination of employee educa
tional background and experience.
5
2) Knowledge Renewal: the extent that the knowledge foundation
is continually improved or renewed through directed and nondirected
learning activities.
3) Development Climate: the extent that the organization sus
tains a positive, focused development climate for members through its
structures and processes.
ConceptLlal Framework
The framework for the study of knowledge obsolescence is a
systems model emphasizing the influence of the individual, the task,
the informal organization and the formal organization on
organizational development. (See Figure 1)

Inputs
Environment Resources History
Tranformation procl!'SS
Informal organization
Individual
Feedback
6
Output
Organizational Group Individual
Figure 1. A systems model of organizational behavior (Nadler & Tushman, 1980).
The study focuses on individual background, behavior, and pre
ferences as well as work environment factors in the informal and
formal structure to investigate knowledge obsolescence. The study is
guided by the following central questions:
1. What is the current knowledge base of organizational
members?
2. To what degree do members update their knowledge bases?
3. What methods do members prefer to update their knowledge?
4. To what degree do the organization's structure and processes
provide focus and support for development?
5. To what degree are the focus and support for development
provided independent of members current educational back
ground and experience within the organization?
------ ------------- ----------.-------

7
Assumptions of the Study
First, this study assumes that people are assets to organiza
tions; therefore, the knowledge foundations, and extent of knowledge
renewal, are indicators of the organization's present and future
capability. Development climate provides the will, i.e., motivation
through management direction and support as well as opportunity to
increase the capability of the organization over time.
Secondly, this study assumes that individuals put forth effort
for the organization in exchange for available rewards that meet the
individual needs and values.
Thirdly, it is assumed that the organization-member relationship
is mutually beneficial and one of mutual, if not necessarily equal,
influence. Thus, the organization needs to be sensitive to its
members' needs, values, work and learning styles. Members must also
be sensitive to the demands placed on the organization by the external
environment and must be willing to adapt and to develop their capabil
ities to make continued value-added contributions.
Fourth, this study assumes that a holistic, integrated approach
is a viable strategy for the studying of an issue. The systems ap
proach that recognizes the interdependent nature and complexity of
organizational systems is recognized as an appropriate way of explor
ing and defining at the macro level the components and the relation
ships of an issue. Thus, development as a subsystem of an organiza
tion exists within a context and is interdependent for its success or
failure with other subsystems in the organization.
---------------------- ---_ ..•. _--.....

8
Delimitations of the Study
The study is limited to the ~manager professional engineering
population of a single, medium-sized electronics manufacturing firm in
the Northwest.
The study does not attempt to relate development to produc
tivity. To do so would alter the focus of the study, that is, the
building of present and future organization capability through con
tinuous development.
Definition of Key Terms
The following definitions (Lippitt, 1982) are key to
understanding of the researcher1s perspective on human development
within an organizational context:
Holistic: An integrative approach to the examination of devel
opment from both the micro and macro aspects of human systems.
Human Systems Renewal: A holistic way of investigating micro
(individual) and macro (organization and its environment) to further
understand their potential for directing energies toward increased ef
fectiveness.
Organizational Renewal: A process of initiating, creating and
confronting needed changes to ensure the organization1s capability to
survive over time, i.e., to adapt to new conditions, to solve
problems, to learn from experience.
Development: The contfnuous process of learning (individual,
group, organization) from life experiences, interaction with environ
ments and participation in planned development activities.

9
Renewal Facilitator: A person or group who initiate change con
tributing to human systems or organization renewal.
Other definitions specific to this study include:
Electronics Industry: A domain of industry that produces goods
and services through innovation, advancement, and application of
electronic technology.
Engineer: An individual employed to do engineering work.
Knowledge: Information applied to the innovation and production
of goods and services.
Obsolescence: A condition of incremental or total decline in
application or use.
Importance of the Study
Human Resource Management
The persistence of knowledge obsolescence implies that human
resource managers must increase their awareness of and capability to
manage individual development and career stages of employees with the
same rigor as is initially given to attracting talented individuals to
the organization. This study will contribute to human resource
managers' understanding of key elements influencing development within
the context of work as opposed to development independent of the
"psychological contractU of the individual and the organization. The
study seeks to increase management's understanding that planning for
human systems renewal is strategic and must be done in concert with
and on an ongoing basis with the organizational planning process or
mission, objectives, activities, results to be achieved. This ap
proach contrasts with the traditional view of development at the
-------------------- ---_ .. _-.- .. -
10
operational level focusing only on activities and programs independent
of the strategic thrust of the organization.
Human Resource Information System (HRIS)
The study should benefit HRIS managers in understanding the
significance of maintaining updated information of the educational
background and dire~ted learning activities of employees. Without
this minimal information, it is difficult, if not virtually impos
sible, for an organization to readily assess even present capability
of the organization to achieve its goals, given the current knowledge
base of its members. Further, without documenting development be
havior, the organization cannot assess the curren!..1ess of the knowl
edge base on which its future depends.
Education Theory and Practice
The study by investigating an adult population's learning pat
terns will provide educators information on the continuing influence
of schooling processes on lifelong learning habits. This may, in
turn, provide insights as to why development in nonschooling environ
ments continues to lag behind the need for renewal of knowledge and
skills, even though opportunities for continued formal schooling have
been prevalent. Diebold (1984) indicates that part of the resistance
to the change needed for continuous development stems from the educa
tional system that focuses on learnings of the past rather than underd
standing the present and coping with the future. Thus, educators too
need greater awareness that today's knowledge is insufficient and that
continuous renewal of knowledge will be imperative for survival in the
--- ---------------_._-----------_. ----_.-.. -... - ... _. __ .-... _--.. _--.
11
economic environment. It seems essential for educators to acknowledge
that imparting of today's knowledge is less important than formerly
when an existing knowledge base would essentially be effective for an
individual's life. Lewis (1983) suggests that the real critical
skills for the 21st century adult include problem solving, analysis,
synthesis, critical thinking and communication. Culbertson (1983) too
emphasizes that educating youth for information enterprises will
require a transition from "muscle power" to "brain power" and develop
ment of higher cognitive skills.
Educators need to realize the potential long-term impact of
teaching methods and processes on the individual's socialization,
interpersonal skills, sense of competence, adaptability, and motiva
tion for continued learning. As this study examines an "at-risk"
population in a nonschooling environment experiencing continued change
and uncertainty, it will raise questions about the educational pro
cesses that contribute to an individual's ability to accept and manage
continually changing knowledge bases. Central to this issue are such
questions as:
1. To what degree are adults dependent on continued schooling
to acquire information needed for their effectiveness?
2. To what degree do adults prefer formal methods of learning
versus informal or self-directed systematic learning activi
ties?
3. To what degree do passive learning strategies persist in the
adult population and actually serve as barriers to lifelong
learning?

The study of adult learning patterns may assist educational
administrators understand the validity of the processes and
knowledge/skills taught, practiced, and rewarded in educational
institutions.
12
The criticalness of lifelong learning, the learning to learn
concept, as a goal of education has been recognized as essential for
life in modern society (Cropley, 1979). Thus, the issue raised by
obsolescing knowledge bases is far greater than the content of
education. Equally critical are the processes that reinforce
individual initiative and strengthen the individual IS ability to take
charge of life situations, to manage continuous change, to create a
"steady-state" when change is rampant and to remain effective even
when the environment is uncertain.
Electronics Industry
Sustained viability in the electronics industry requires a bank
of cutting-edge technical and management knowledge and skills. With
the rapid shifts in technology, markets, and international competi
tion, organizationai survival is dependent on the talent of its
people--human resources--to adapt, to learn, to continuously renew
their knowledge/skills in directions related to the organization.
Projections in the future of the electronics industry indicate that
change will occur at increasingly rapid rates. Further, technical
knowledge bases that were valued-added for up to 10 years currently
may have a half-life value of 3-5 years. The problem is exaggerated
in the industry by reports stating that critical. technical skills of
------------------ ---------------

13
the quality required to be competitive will not be available in the
market place--essentially a shortage will occur (Hubbard & Storm,
1984). Thus, electronics companies will become more dependent on
present internal talent for future capability. Increasing numbers
of competitors for the projected shortage of critical skills further
underscores the need for employers in the electronic industry to
assess closely their current talent, their present and future
knowledge/skill needs and to direct employee development to meet the
needs of the future. This study should provide electronic industry
employers an increased understanding of the issue of knowledge
obsolescence that will continue to confront them through the
beginnings of the 21st century and exacerbate productivity and the
indirect labor costs of the knowledge worker.
-,--------------------_ .. -._ .. _._. __ .... -.

CHAPTER II
REVIEW OF RELATED LITERATURE
Introduction
The foundation of the study of development in organizations
begins with a view of modern organizational behavior emphasizing the
systems approach to organizational change. With the increasing impor
tance of the external environment on modern organization for survival,
the environment is presented as a key driving force for development.
Since the focus of this study is on knowledge development in the
context of a rapidly changing, uncertain environment producing high
levels of knowledge obsolescence, a review of research related to
knowledge obsolescence is presented followed by an overview of current
organizational practices of companies in similar dynamic, uncertain
environments.
Organization Behavior and Development
Current theories of organizational behavior emphasize the diver
sity and complexity of factors that influence organizational effec
tiveness. The study of human behavior in organizations has grown
rapidly following the influential Hawthorne Studies conducted by Elton
Mayo, a Harvard psychologist, in the early 1930's. While the studies
----------------------,-----_._--_ ...
15
investigated the influence of the physical environment on produc
tivity, the studies ultimately demonstrated the influence of group
norms on individual behavior and the limited value of money as a
reward when strategies are perceived to be a threat to job security
and potential negative feedback to group members (Robbins, 1983).
Prior to the Hawthorne Study Frederick Taylor introduced scien
tific management principles in work organizations to improve produc
tivity. Characteristics of the Taylor methodology were time and mo
tion studies that identified the most efficient way to complete a task
and the standard time required for completion. Workers were trained
in efficient task completion; jobs were repetitive and simplified.
While gains in productivity were observed over the previous random ap
proach to work design, employees complained about meaningless and bor
ing work. Other deleterious effects emerged including increases in
tardiness, absenteeism, and turnover (Gibson, Ivanavich & Donnelly,
1982; Robbins, 1983). From these initial unintended learnings, the
focus of job technology embedded in work simplification and concern
with workers' physical environments broadened to include more atten
tion to human behavior on job design and organizational effectiveness.
A review of current organizational behavior theorists (Robbins,
1983; Gibson et a1., 1982; Ivancevich, Szilagyi & Wallace, 1977; Hack
man, 1983; Nadler, Hackman & Lawler, 1979) shows an increasing trend
to a systems approach to organizational behavior in organizations with
a focus of improved human resource utilization for increased produc
tivity, performance and individual satisfaction as a second-level out
come. Present models of organization behavior include the tasks--the
16
work to be done--individuals, groups, organizational configurations,
and the environment of the organization as essential elements of
study. These elements, then, are the primary focus of organizational
development and change efforts.
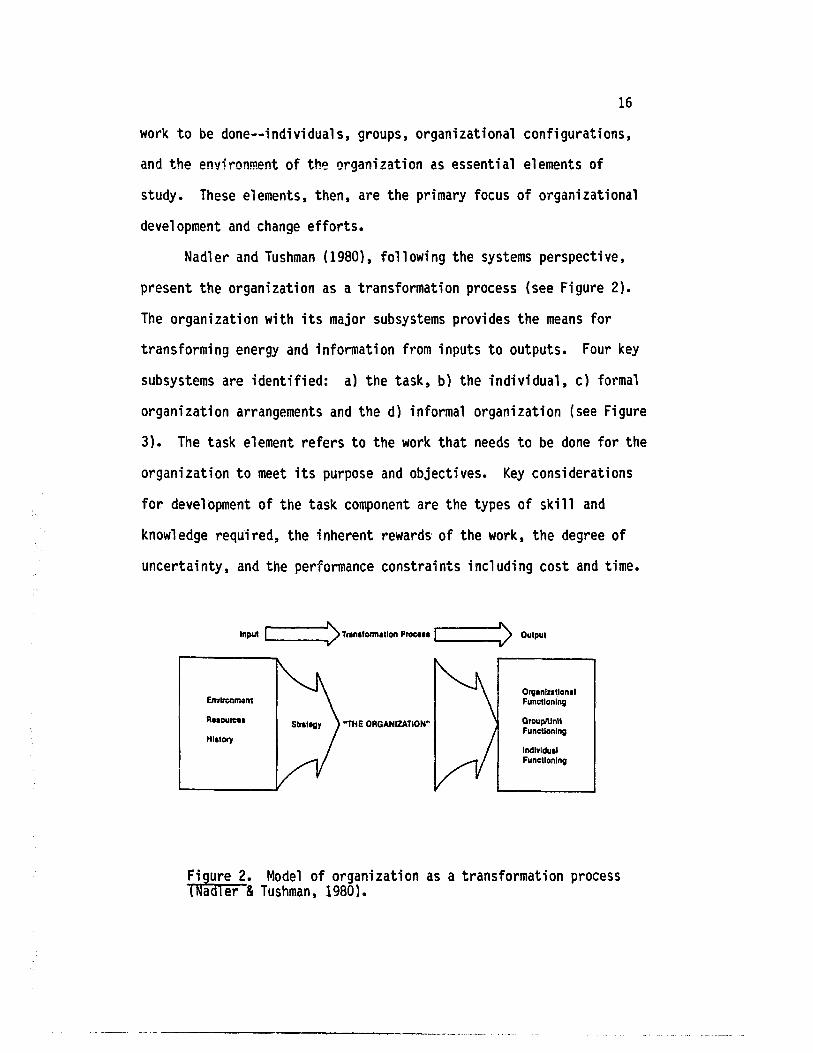
Nadler and Tushman (1980), following the systems perspective,
present the organization as a transformation process (see Figure 2).
The organization with its major subsystems provides the means for
transforming energy and information from inputs to outputs. Four key
subsystems are identified: a) the task, b) the individual, c) formal
organization arrangements and the d) informal organization (see Figure
3). The task element refers to the work that needs to be done for the
organization to meet its purpose and objectives. Key considerations
for development of the task component are the types of skill and
knowledge required, the inherent rewards of the work, the degree of
uncertainty, and the performance constraints including cost and time.
Inpul ... 1 ___ > Trlnl'onnillon Proc.11 .... 1 ___ > Output
Environment
Rllource. ''THE ORGANIZATION"
HI.tory
Orvlnlzillonil Funcllonlng
Group/Unit Funcllonlng
Indlvldull Funcllonlng
Figure 2. Model of organization as a transformation process (Nadler & Tushman, 1980).
--------_._-------_._-.. __ ...... _.

INPUT
ENVIROt.tlENT • Markets • Competition • Government • Suppliers
'STRATEGY:
RESOURCES • Capital • Plant • Technology • People • Intangible
HISTORY • Key Decisions • Norms & Values
• Mission o Supporting
Strategies • Goals &:
Objectives
TRANSFORMATION PROCESS
INfORHAl ORGANIZATION
o Management Practices D Interpersonal Relationships • Informal Working Arrangements
TASK FORMAL ORGANIZATIONAL ARRANGEMENTS
o Knowledge &: Skill Requirements a Organizat Lon
o Uncertainty Structure • Inherent Rewards a Job Design
D"Methods &: Practices a Standards &:
o Basic Work To Be Done
Measurements a Physical Environment D Human Resource
Management Systems • Reward Systems
INDIVIDUAL I o Knowledge &: Skills • Needs &: Preferences o Reward Expectations
Figure 3. Components of an Organizational System (Nadler &: Tushman. 1980).
OUTPUT
ORGANIlA TIONAl • Goal Attainment • Resource Utilization o Adaptability
GROUP/UNIT o Productivity o Collaboration o Quality of
COlllTlJnicat Ion
INDIVIDUAL o Task Performance • Membership Behavior o Affective Responses
...... -....J
18
Individuals, the second subsystem, perform the tasks. Critical
elements of individuals influencing performance and, therefore,
critical to development are individual knowledge and skill, needs and
preferences, perceptions and experiences, and other background
factors.
The formal organization includes a diversity of structures, pro
cesses, methods and procedures designed to motivate and optimize indi
vidual and group work performance. Examples include job design,
reward systems, and human resource systems for sourcing, developing
and evaluating people. Finally, the informal system is composed of
leader behavior, intergroup and intergroup relations as well as com
munication and influence processes. These four subsystems as genera
tors of organizational health and effectiveness are the primary focus
for continuous development efforts.
Too, the model indicates that the tasks, individual, and groups
must be arranged appropriately to meet the demands of the organiza
tion's environment. The model asserts that the organization's rela
tion with the environment influences what tasks should be done, what
the appropriate allocation of resources are, and what the best work
and organizational design would be given the current environmental
conditions and strategy of the organization. The environment in an
open social system presents the relationships critical to survival,
places constraints on organizational choice, makes demands, and pro
vides opportunities for the organization to use its "unique or dis
tinctive resources and competencies" (Nadler, et al., 1979).
----------------------- '-~"_.'--'.- .- - -_._ ....

19
For survival the organization must not only develop a strategy,
but must have the resources to implement the strategy in a timeframe
that meets the competitive market. Thus, resource accounting and al
location is critical. In addition to physical, financial, historical,
cultural assets, the individual assets--skills, experience, and
commitment--are seen as key determinants of the successful strategy
and goal accomplishment. Theorists contend that organizations by
their pattern of resource utilization deplete or strengthen and in
crease resource capacity for the future use of the organization.
A second model of organizational behavior (see Figure 4) depicts
the critical nature of the management philosophy in integrating two
sets of environmental inputs, those related to market, technology, and
regulation and those related to society and culture that influence the
people variables over time. Further, the model illustrates the
required integration of the organizational variables--goals, tasks,
and technology--with the people variables--capabilities, attitudes and
needs. The effectiveness of the integrative processes and their
congruency with each other ultimately determine the performance of the
organization and the satisfaction of the people with their work and
with the organization as an employer.

Organizational - Variables E
N Goal s
V
I Tasks
R
0 Technology
N
M
E
N
T ~
Management Philosophy
Integrative Mechanism
Selection-Orientation-Training
Job Design
Reward Systems
Supervision
Participation
Appraisal/Development
Organization Structure/Development
Communication/Control
Conflict Resolution
Organization Development
Outcome Variables
Performance/Job Satisfaction
20
People Variables
Capabil ities
Attitudes
Needs
Figure 4. Model of integrative mechanisms for organizational effectiveness (Strauss, Miles, Snow & Tannenbaum, 1981).
E
N
V
I
R
0
N
M
E
N
T

21
Both models of organizational behavior establish complexity as
the basic element of understanding organizational issues. Further the
models reflect the contingency view of behavior and design. The con
tingency approach, in contrast to normative or prescriptive ap
proaches, is directed at developing actions most appropriate to a
given situation. Relevant variables and their relative significance
are identified within a given situation; relationships of the vari
ables are considered (Ivancevich, et al., 1977). Thirdly, the models
assert the interrelatedness of the elements so that the study of one
element necessarily must be studied in view and consideration of all
other elements. The totality of consideration given to a variable
reflects a holistic and integrative approach to organizational problem
solving seen as necessary for decision-making. Thus, current
organization behavior models emphasize the examination of relevant
variables, not simple solutions (Ivancevich et al., 1977) for
organizational effectiveness.
Organization development plays a key role in the adaptation of
an organization to its environment and in the integration of the
various internal systems. It has been described in different ways
(Margulies & Raia, 1978): 1} a means of increasing the capacity of
the organization to generate and use valid information about itself,
2) a re~ponse to change, a complex and educational strategy intended
to change the beliefs, attitudes, values, and structure of organiza
tions so they can better adapt to new technologies, markets, and chal
lenges, and change itself, 3) a total system, planned change efforts
initiated to cope with organizational issues, 4) a long-range effort

22
to improve organizational problem-solving capabilities as a coping
response to changes in the external and maternal environment and 5) a
value-based process of self assessment and planned change, involving
specific strategies and technology, aimed at improving the overall ef
fectiveness of an organizational system.
While organizational development practitioners may differ on
definition, scope and methodology (Margulies & Raia, 1978; French, &
Bell 1984; Lippitt, 1982) one could conclude that organization
development has as its purpose the invoking of needed behavior for
change within the organization to better achieve the near-term
objectives and long-term effectiveness through coping with, adapting
to and increasing present and future capacity in relation to the
environment. Thus, the environment plays a key role in determining
the degree that organizational change efforts are planned,
implemented, and continuously integrated into modern organizations.
Environment: The Driving Force for Development
The organizational environment is a critical component that
influences the behavior and success of the organization. An open
organizational system has been defined as "a coalition of shifting
interest groups that develop goals by negotiation" whose structures,
activities and outcomes are strongly influenced by environmental fac
tors (Scott, 1981). This system is dependent on appropriate flows of
resources in and out of the organization as well as maintenance of
the commitment of their members to contribute resources, energy and
time.
23
Emery and Trist (1965) after researching a variety of organiza
tions identified four types of environments that require different
management responses. The first type, the placid environment, has
goals, constraints and opportunities that are unchanged and occur
randomly. The appropriate response of the organization is simply to
do the best at what it is doing, because no presence or force requires
differently.
A second type of environment, though placid, displays clustered
configurations of goals, opportunities, and threats that need to be
examined in relation to each other. In this environment, Emery and
Trist indicate that survival is critically linked with knowledge of
the organization1s environment. In this environment the objective is
optimal positioning in the marketplace and development of distinctive
competence.
The third environment, the disturbed-reactive, is characterized
by competition. In this environment, adaptability, flexibility, and
capability become critical to responding to the persistent, competi
tive challenge.
Finally, the turbulent, complex environment is dynamic not just
in relation to competitors but to changes in the society at large,
i.e., government regulation, public policy, educational institutions,
cultural and social values. Also, development and innovation become
critical to maintain the capability of the organization to respond ef
fectively to the competitive market. Change is continuous and uncer
tainty high when compared with the other organizational environments.
---- -------------- --.---~----.- .. --.--~------

24
In the open organizational system, planning and analysis
processes identify the internal expectations as well as the external
expectations from the organization's environment (Jayaram, 1976). The
need for development in an organization is dependent on the degree of
change occurring in the organization's environment that forces inter
nal adaptation for continued effectiveness and survival. However,
commitment to development as purposeful behavior competes with other
organizational goals including production, efficiency, and satisfac
tion that are near-term considerations for survival. Traditionally
adaptiveness, flexibility, and development have been viewed as 10ng
term effectiveness strategies that became secondary to near-term goals
seen as more integrally related to the present organizational goals
and more often rewarded by the organization. This secondary attention
to development is, in part, a reflection of high-growth in organiza
tions with stable environments where little necessity for development
occurred except as a method to retain and satisfy organizational
members.
However, uncertainty and rapid rates of change in today's orga
nizational environments present a different focus and meaning for
development (Scott, 1981; Mintzberg, 1979). For example, the greater
the degree of uncertainty entering the organization, the greater the
need to process information to maintain performance levels (Gai1-
braith, 1973). Furthermore, to maintain balance with a changing
environment, organizations must be able not only to adapt but to in
novate when change is outside of their current strategies. Innova
tion, it is noted, is limited by the quantity and variety of informa-
--------------- -------- ------------ -- ------------

25
tion present in a system. New alternatives for innovative purposes
are dependent on 1) the capability of the system to supply informa
tion, 2) the range of available information in the system, 3) operat
ing rules affecting analysis and flow of information, and 4) the
ability of the system to forget previous solutions (Shafritz & Whit
beck, 1978). As the environment of the organization increases in
diversity and turbulence, the organization must be able to manage the
diversity and change within the organization. Open systems theory
stresses the variability of organizational parts, shifts attention
from structure to process, and recognizes adaptation to the
environment as critical for survival (Scott, 1981).
In an open system two key processes have been identified (Scott,
1981;. The morphostasis preserves the current structure or state,
while morphogenesis changes the system through growth, learning, and
differentiation. In a condition of environmental change, the morpho
genesis processes should outweigh the morphostasis ones so that the
organization is adapting and innovating to meet the demands of the
environment.
If the need for development is related to the degree of change
and a highly changing environment is established, the next question
then is whether or not the organization analyzes its environment,
recognizes the changes that are occurring, and then links the occurr
ing change to a need for development. Further, it is increasingly
recognized that the work environment with its many different factors
influences not only both the degree and quality of work performance
(Mintzberg, 1973, 1979; Hersey & Blanchard, 1977; Walton, 1980; Davis,
26
1977; Hackman & Oldham, 1975; Pasmore, 1982), but also the degree of
development and innovation that occurs (Misshauk, 1970; Miller, 1979;
Dubin, 1970, 1977; Tushman & Moore, 1982; Kaufman, 1974, 1979; Farr
Emory, Steiner & Kozlowski, 1984) in the organization. Thus, any
study of development in an organization must examine the characteris
tics of the work environment that enhance or inhibit development.
The diversity of individual values, interests, and abilities
that exist within the organization also influence whether development
is valued, what strategies are appropriate for development, and what
rewards will be viewed as incentives for development (MacGregor, 1978;
Glueck, 1982; Farr et al., 1984). Several accounts have been given
about the increasing heterogeneity of the labor force, changing
values, and emerging expectations. Walton (1984) and Yankelovich and
Lefkowitz (1982) note the influence of rising levels of education,
wealth and security, and the decreasing emphasis placed on authority
by traditional socializing forces in society, including families and
schools, the decline in achievement motivation j and the shifting
emphasis from individualism to social commitment on the effectiveness
of the work force. Herzberg (1979) indicates that identifying the
wants and needs of individuals is exacerbated by the mix of the Ameri
can population that holds conflicting values. Rosow (1981) indicates
that people will bring more complex and varied sets of needs to the
workplace.
Concomitant with changing values come different expectations.
Walton (1984) indicates that today's people want to be challenged, to
experience personal growth, and to have influence in organizations.
---------------------------_. ----....... _- .
27
At the same time, many organizations are characterized by simple, nar
row, or specialized job roles that limit opportunty for development
and broadened experiences. Hierarchies, status differentials, and
chains of command are also still evident. The intrinsic worth of work
is often neglected by the organization while being increasingly impor
tant to people. People desire more attention to emotional and psycho
logical aspects of organizational life, including self esteem, open
ness and warmth.
Macy (1981) in a nationwide survey of American workers reported
that over 70% of people wanted more control over their work, 60%
wanted more p~y and fringe benefits, 80% were concerned about health
and job safety, 36% indicated they were under-utilized and that their
skills were not effectively used, and 33% indicated they had more edu
cation than their jobs required. People reported feeling locked into
jobs without alternatives, and, in general, job satisfaction had de
cli ned 8% between 1973 and 1977. r~acy concl udes that whil e si gnif;
cant progress has been made in working conditions of American workers,
the human-relations aspect of work has lagged behind changed atti
tudes, values and expectations of the people.
In conclusion, complex and various environmental changes-
technological, market-based, and social--provide the impetus for
another look at human resource development in organizational environ
ments. With the various forces, both external and internal, vying for
limited time, energy, and resources of the people and the organiza
tion, it is unlikely that development, though vital, will be effective
unless all systems of an organization support the drive for develop-
----------------- -- ---- -._----_._----------
28
mente Thus, the following study, investigating the the subsystems of
an organization in supporting development, presents a comprehensive
approach to addressing the issue of kYio~ledge obsolescence in a
modern, dynamic organization.
An Example: The Technical Organization
Technically-based organizations are particularly susceptible to
knowledge and skill obsolescence as their survival is dependent on in
novation and the advancement of new technologies into quality products
and services. Management concern for technical vitality emerged in
the 1950's and increased in the 1960's. Many organizations subscribed
to continuing education and graduate programs for their technical
employees to solve the problem of growing knowledge obsolescence
(Miller, 1977b). Yet, even in these progressive organizations where
the implications of aging knowledge bases were understood and initial
remedies enacted, present indicators suggest that knowledge obsoles
cence persists and even flourishes (Thompson & Dalton, 1976; Miller,
1977a). The threat of knowledge obsolescence in technical
organizations is mounting in the 1980's as world competition and
changing markets drive innovation at increasingly rapid rates and
continues to place pressure on productivity improvements (Fitch,
1982) •
In the past few years company leaders in the electronics in
dustry have reevaluated their approach to development of engineers.
Some have updated educational programs targeted to specific tech
nologies; others have broadened engineering development to include

personal, business and communications. Two report work climate
studies. One has created an integrated approach to development as
part of the business planning process.
29
General Electric (Aerospace Electonic Systems Department)
(Zukowski, 1985) found that major obstacles to continuing engineering
education included a) inadequate management support, b) no involvement
in business planning, c) insufficient funding in budgets, d) unidenti
fied program goals, objectives and direction, e) poor administration
of programs, f) low employee motivation. Following an analysis of
shifts in future technology and business environment, AESD overcame
these obstacles by establishing a required technical renewal program
--a 2-year concentrated-on-site program to put in place the knowledge
and skills needed to respond to shifts in the environment. Engineers
were required to attend or feel the consequences of demotion, reduced
pay, or layoff. Follow-up intensive training in specific technologies
was provided. A continuing engineering education program was
established under the direction of an engineering education advisory
council that identifies trends in technology and critiques proposed
and existing courses. Council recommendations are subject to manage
ment review and approval. Employee response to these new directions
has been favorable, with increased course offerings directed to meet
ing needs and sharply increased participation in continuing education.
Honeywell's approach to engineering development includes a
variety of programs: a) ACE, After-Hours Continuing Education, b)
Unite, University-Industry Television for Education, c) Microcomputer
and Microelectronics Training and Technical Update, as well as divi-

30
sional programs (Sackett, 1985). Yet, with a diversity of programs
available, the Vice President of Corporate Research, Science and Tech
nology Operations, reports that problems persist stemming from lack of
management and the individual engineer's commitment--budgets, release
time, job pressures. Further, the Vice President indicated that the
company knows little about the real issues of career management, dif
ferences in needs and approaches to development of the engineering
population. Currently, Honeywell is exploring its development climate
for engineers and the issues surrounding knowledge obsolescence and
career management.
Though IBM has had a history of employee development and human
resource planning (since 1964) to assist in the employment continuity
process, it, too, has updated its approach to human resource planning
and personnel issues so that human resource issues are identified at
the strategic level (Dyer, 1984). Strategic HRP reports the results
of the corporation's envir'onmental scans, special studies and policy
decisions by major personnel activities, i.e., personnel planning,
employment and recruitment, employee development and compensation.
These serve as guidelines and checklists for division and corporate
personnel involved in business planning. Corporate personnel requests
and reviews personnel information from these areas as an essential
part of the human resource planning process. Hewlett Packard also
reports a new corporate focus on human resource planning and
development as a result of division managers' inability to see the
overall impact of overstaffing or forecasting of needed skills. Both
IBM and H-P (Levering, Moskowitz & Katz, 1985) maintain extensive
-------_._-------_._. __ ... _ ....•

31
educational programs for employees and have served as models for the
electronics industry (Moye, 1986).
Alcoa Laboratories (Bridenbaugh, 1985) has shifted from an ad
hoc approach for education and training of their scientific and
engineering community to one they depict as IIthorough and aggressive. 1I
The mission and philosophy statements reflect the integral nature of
development to the laboratories mission. The strategic plan is based
on extensive needs analysis, design and formulation delivery strategy.
Lawrence Livermore National Laboratory (Murphy & Werne, 1985)
also provides multiple education programs for their engineers:
advanced degree programs, technical non-degree related courses recom
mended and reviewed by a continuing education committee and employee
development programs that concentrate on non-technical career develop
ment courses.
These examples demonstrate current approaches to engineering
development involving four key elements:
1. A renewed focus and commitment to employee development pro
grams
2. A tighter link and greater control of programs for business
objectives
3. Increased forecasting and reporting of development needs as
an activity of the business planning process
4. An understanding of the link of limited work environments to
employee motivation for development.
32
Engineering Oeyelopment: Research Overview
Initial research studies of knowledge obsolescence established
obsolescence indexes and erosion curves to identify the degree of
decline in the existing knowledge of engineers and managers (Mali,
1969; Zelikoff, 1969; Seifert, 1964). Others examined the changing
patterns of engineers and scientists related to persistence of perfor
mance in organizations (Kaufman, 1974; Dalton & Thompson, 1977;
Bailyn, 1980). Another group of studies investigated the degree that
personal, work, and organizational characteristics combined to encour
age obsolescence (Kaufman, 1973, 1979; Ritti, 1971; Pelz & Andrews,
1976). While research studies of engineering performance based large
lyon manager evaluation has correlated age with declining technical
skills, recent studies indicate that organizational climate,
management practices, performance systems, job assignments, and reward
structures interact to create a work environment that influences long
term technical excellence. Further, these studies link organizational
subsystems to individual development and demonstrate the potential in
fluence of them on the engineer, currentness of technical information,
and performance.
The studies suggest that organizations concerned with long-term
technical performance assess policies and practices that influence the
continued growth of the engineer. Further, strategies need to be
developed that consistently support, encourage, and reward development
and performance on a career basis. The research also indicates that
organizations should examine the methods used for development. While
33
organizations continue to look to seminars, courses, and advanced
degrees as primary methods for development, engineers may prefer to
use other approaches and indicate that the structure of courses are
not always compatible with needs, learning style and job
requirements. Available courses also may lack current information and
may have inappropriate focus and depth for different engineering
functions.
Recent studies suggest that organizations approach the issue of
technical innovation and excellence differently than in the past. In
fact, strategic planning for sustained technical performance may need
to include a new orientation to work, job design, development, and
career. These findings indicate that extended technical vitality may
be achieved by creating a career path that simultaneously provides op
portunity and integration of learning and application in the work
environment that is rewarded by the organization and valued by the
individual. Optimal results ma.y oe achieved if the job, development,
and career integration process is systematic and begins prior to
selection and continues to separation from the organization. Random
approaches to selection, job assignment, development, and career limit
the potential technical performance achievable on a long term basis.
Prior approaches to technical obsolescence focused on the indi
vidual engineer's knowledge for present performance only. While the
importance of the current knowledge persists, the concern with techni
cal obsolescence is now extended to future job performance. Thus,
development must include strategies for both present and future orga
nizational results.

34
Approaches to technical performance are also shifting from
measurement to process. The process focus recognizes the significance
of managing variables that influence knowledge obsolescence and devel
opment. Thus, organizational variables that influence technical
development must be identified and their influence measured. The
interaction of the individual engineer, the manager, and the work
environment forms the basis of the most current studies.
The responsibility for technical development, once entirely
placed on the individual engineer, is also changing. Studies indicate
that the organization and the individual together must determine the
level of technical development to be achieved. Engineers must commit
their ability, energy, and motivation to a process of continued devel
opment, since rigidity and lack of interest in development as related
to organizational goals and objectives increase the potential for
reduced technical vitality and job performance. Additionally, the
organization plays a critical role in providing a work environment
conducive to sustained learning that is rewarded and offers a variety
of opportunities for development. Without specific and ongoing
direction from the organization, the individual cannot determine
independently the knowledge base that the organization will need.
Non-directed development efforts, though monetarily supported by the
organization, may have limited effectiveness.
In conclusion, sustained technical innovation and excellence
require an environment that fosters the continuous development and
systematic integration of the individual into the organization--its
-------------------- ._,-_ ....... ..

35
goals, objectives, and future direction--through a varied set of work
roles and continuous development strategies.
Engineering Development: Key Studies
Dalton and Thompson (1971) in their initial study of 1500 design
engineers in six organizations examined the relationship of age, tech
nical vitality, and performance over a 14-year period. The study
found that fewer older engineers (afte~ mid-thirties) received high
performance ratings by managers than younger engineers. No group over
40 had average rankings above the 50th percentile. It appeared that
continued lower performance ratings related to diminished rewards and
more limited job assignments that in turn increased the loss of tech
nical skills and reduced the opportunity to learn new technologies. A
further examination of job assignments, job complexity and age showed
that indeed engineers under 40 had job assignments with higher
complexity.
Dalton and Thompson concluded that the organizational environ
ment created a negative performance and reward spiral that discouraged
development. This negative spiral contributed to the diminishing
technical performance of the engineer and, ultimately, the organiza
tion.
Additionally, an examination of the engineers' recent education
al experience showed a negative correlation to performance rankings.
For example, in one company the engineers over 40 who recently had
taken courses were the ones who still received lower performance rat
ings than those who had n~t taken courses. This may suggest that late

referrals for education or technical updating may be ineffective.
Timing of technical development appears to be a critical factor in
long-term performance. In contrast, an examination of performance
ratings of engineers with master's degrees or intensive mid-career
graduate work indicated that this strategy extended the engineers'
productive technical work approximately ten years.
36
A follow-up study of 730 engineers examined engineering perform
ance by age groups (Price, Thompson & Dalton, 1975). The study at
tempted to identify factors related to sustained high, medium, and low
performance of the engineers. The results showed no significant dif
ferences in performance based on reported activities to improve tech
nical competence, i.e., college courses, company courses, reading.
However, job-related factors including time spent on the job and job
complexity highly correlated to top performance. Further, in contrast
to the historical assumption that technical obsolescence related to
age, older engineers in the study demonstrated high technical perform
ance. Greater differences in performance appeared within age groups
than between age groups.
Additional probing of performance rankings of 311 engineers in
two organizations across a 9-year period examined performance gains
and losses by age groups (Price, et al., 1975). Performance rankings
were examined for shifts among high, middle, and low performance with
others in the age groups. The study reported that engineers over 50
tended to remain in the same performance group. Thus, a high
performance at the initial rating tended to predict continued high
performance; a lower performance rating initially tended to predict a

37
continued pattern of low performance. In the 40-50 age group, two
thirds of the initial low performers remained low; 90% of the high
performers stayed within the high and middle categories. Middle per
formers showed the greatest variance with a tendency toward high per
formance.
In the 30-40 age group (reflecting pp.rformance in the 20's)
slightly more than 50% of the low performers persisted as low per
formers. About one-third became middle performers; approximately
two-thirds of the high performers continued as high performers.
Again, middle performers showed the most variance with slightly less
than 50% remaining as middle performers.
The data showed strong performance pers i s:cence patterns in both
high and low performing groups across all age groups. These patterns
suggest that low performers require immediate identification and
systematic review since the pattern begins with the young engineer.
An initial low performer needs identification and a plan for contin
uous improvement to avoid a long-term performance problem. Middle
performers appear to require consistent attention to development and
performance throughout a career since they are nearly as likely to
become low as high performers. A pattern of high performance sta
bility suggests that an organization remove barriers and provide con
tinued challenging work and developmental opportunities for motivated
and talented individuals.
A final study of 550 professionals including scientists, engi
neers, professors, and accountants examined career progression of low
and high performers (Dalton, Thompson & Price, 1977). The study con-
--_ ..... _-_ .. _------

38
eluded that professionals with sustained high performance had differ
ent career patterns than low performers. The career stages that led
to long-term high performance included an initial apprentice stage
that emphasized challenging technical work accompanied by induction to
the organization by a senior mentor. In the second stage of exper
tise, the high performer gained credibility through strong technical
performance supported by a collegial network. Thirdly, the high per
former as mentor had increased responsibility for others through
broadened work roles related to the area of expertise gained in stage
two. Example roles included consultant, idea person, liaison, and
manager. The final stage achieved by a limited few in the organiza
tion i ncl uded peopl e who achi eved responsibil ity for over all
strategic planning and direction of at least a major segment of the
organization.
The researchers concluded that individuals in all stages of
development make significant contributions to the organization. In
fact, long-term organizational effectiveness may be related to an
appropriate distribution of engineering resources in all four stages.
Also, success in each stage appeared related to success in the prior
stage. Success as an individual contributor seemed especially criti
cal to long-term contribution and successful movement to the mentor
stage. Further, movement to the mentor stage, both in management and
nonmanagement roles, was highly correlated to continued high perform
ance. An examination of five research and development organizations
showed that 65% of the mentor function was accomplished by nonmanagers
and 30% of the sponsor role was attributed to the nonmanager as well.
----------- -------------------------

39
This study indicated that sustained high performance was demon
strated by those professionals (independent of age) who successfully
moved through initiation, individual contributor, and mentor roles.
The percentage of above average performance ratings for individual
contributors diminished over time.
Pennsylvania State researchers studied the impact of the work
environment and individual characteristics on the performance of engi
neers. From prior research five key variables were identified:
organizational climate, job characteristics, supervisor-subordinate
relationship, colleague interaction, and management policy. In their
initial study (Farr, Dubin 5 Enscore, Kozlowski & Cleveland, 1980)
engineers and engineering managers identified ten factors that contri
buted to development. These included a sense of achievement from the
job assignment, challenging work, management expectation of excel
lence, opportunity to be creative and innovative, opportunity to
exercise personal initiative in the job, opportunity for advancement
based on quality work i recognition for accomplishments and technical
success, salary and merit increases based on performance, opportunity
for major responsibility for project, and quality relations with
peers.
In a later study (Farr, et al., 1984) of 483 engineers and 220
engineering supervisors in seven organizations, these 10 factors and
their influence on the development activities of engineers were
examined. The study investigated the engineers' perceptions of the
work environment, the reward system, the value of different types of
development activities, and the relationship between technical
-----------------------_._---.-_._._ .. -.

40
currentness and valued rewards. The study was replicated one year
later' with a reduced population of 231 engineers and 110 supervisors.
The findings initially reported remained reliable.
The engineers reported taking more technical courses if they
believed that becoming current improved their opportunities for promo
tion and personal initiative on the job. Correlations between the
number of technical courses taken and beliefs about salary increase,
job security, and challenging work assignments were only slightly less
significant. Further, engineers reported taking more technical
courses if they perceived a negative impact or reduced opportunity for
rewards including less opportunity for assignments on the forefront of
technology.
The work environment variables also were associated with the
value of development methods. The value of taking in-house seminars,
reading technical journals, and peer interaction on technical issues
and challenging work, for example, were positively correlated to
several variables including supervisor feedback, policy encouraging
development, the technological orientation of the organization, engi
neer participation in decision-making, technical support, and cli
mate. The work environment factors also, correlated to the engineers'
beliefs about whether rewards were available for technical current
ness. Challenging work assignments positively correlated with per
formance ratings, technical knowledge, and continuing education.
The study also examined the relationship of the engineers' per
ception of work environment and supervisory evaluations of technical
performance with development activities. The findings showed a posi-
----------------~-. -_ .. _ .... -...
41
tive correlation to supervisor communication and technical information
exchange, participation in continuing education and job performance.
On the other hand, work pressure (time) negatively correlated with
ratings of organization and planning, responding to change, and
involvement in professional activities.
Two individual factors, age and length of service, were examined
in relation to rewards and technical development. Both older and
longer service engineers reported less desire for advancement, salary
increase and job initiative. Additionally, longer service engineers
placed a lower value on challenging work as a reward than did engi
neers with shorter length of service. Older engineers also associated
less reward with remaining technically current.
Another series of studies conducted by Kaufman (1972, 1975,
1978, 1979) investigated the relationship of personal, work, and
organizational factors on technical development. In one study of 110
engineers (Kaufman, 1972) ability predicted currentness of knowledge
but did not serve as a predictor for sustained job performance. Kauf
man questions the use of performance as a measure of technical cur
rency when individual job assignments may not require the application
of a high degree of engineering knowledge.
In another study (Kaufman, 1975), individual differences, early
work challenge, and participation in continuing education were exa
mined. Early work challenge positively correlated with graduate
courses participation while it negatively correlated with in-house
course participation during the early years of service. Graduate
courses and in-house course participation also differed according to

42
cognitive ability. The study concludes that engineers who are
superior in knowledge and ability tend to enroll in graduate courses
early in their careers, while those more prone to obsolescent skills
tend to avoid difficult graduate courses.
In a study of 404 engineers in a single organization, indi
vidual, work, and climate variables significantly related to job per
formance (Kaufman, 1979). Work assignments, policies, and practices
were more important to technical performance than individual differ
ences. Kaufman also studied the methods that engineers perceived as
likely to contribute to development. The preferred methods ranked as
follows: 1) new job in company, 2) self-study, 3) formal courses, 4)
job redesign, 5) company change, 6) career counseling, 7) career
change.
The preferred methods of development linked to technical effec
tiveness. The more current engineers identified self-study, formal
courses, and job redesign as their preferred methods with self-study
as the most consistent choice. The more obsolescent engineer identi
fied career change, a new job, or a company change as the preferred
methods.
Finally, the study examined the relationship of the work envi
ronment to career strategies. The study concluded that the key to
career development was providing engineers with challenging job re
quiring high degrees of technical knowledge. Utilization and
rewarding of current knowledge and skills stimulated the learning of
new knowledge and skill through self-study and course work.

43
In the study, age failed to correlate to obsolescence! Age,
however, did relate to preferred methods for development. Informal
methods--self study and participation--correlated more to technical
performance than formal methods of development. In general, Kaufman's
research indicates that the organization should examine job assignment
strategies and organizational climate factors that influence
development. Further, the organization in developing learning
strategies and activities must recognize that the preferred methods of
development may differ depending on the age, educational background,
and job experience of the individual engineers.
~n MIT study of 1366 engineering graduates (Bailyn, 1980) indi
cated that technically trained individuals had varied orientations to
work at mid-career that require a variety of roles and career oppor
tunities. The survey examined the job history, work attitudes and
values of the targeted population for 10-15 years following gradua
tion. The study identified two key technical career patterns: engi
neering and scientific-professional. The two patterns showed differ
ent career values. The engineering group stressed contribution, high
earnings, advancement, and leadership. The scientific-professional
career group valued accomplishment, challenge, opportunity to advance
knowledge, and creative use of knowledge on the job.
Further, the engineering and scientific-professional career pat
terns were distinguishable by job positions that resulted in four dis
tinct career types. Staff engineers at mid-career reported the lowest
degree of success, work involvement, and job satisfaction. In con
trast, engineering managers, consultants, and entrepeneurs felt suc-

44
cessful and were satisfied with their job. Science managers and pro
fessors exhibited the highest work involvement, success and job satis
faction. The difference among the career patterns suggests a greater
need for role differentiation, responsibility and recognition beyond
management positions.
In conclusion, the MIT study, reflecting a relatively "homo
geneous" technical population as far as education and interests early
in their careers, suggested that sustained technical performance
requires examination of job roles, management styles, and reward sys
tems for their responsiveness to multiple individual, mid-career
orientations, and abilities of technical personnel.
A survey (Adam, 1984) of 1100 electrical engineers examined the
methods that engineers use to keep current and the role of continuous
learning as related to their work. The survey reported that the job
assignment was the single most important factor related to maintaining
technically currentness. However, differences existed among age
groups. Engineers in the 25~34 age group found job assignment less
significant for development than the 35-39 years old. While one-third
of the engineers 30-34 years old indicated that continuing education
was a strong factor in remaining current, only 23% of the 55-59 group
agreed. In general, older respondents stressed self-study and
conferences.
The degree that the engineer needed to stay current to perform
the job also related to the method used. Those who perceived techni
cal currentness as essential valued technical publications, job as
signments, conferences and self-study more than those where technical

45
currentness was less important. The survey also reported that engi
neers who selected leaving the company placed higher value on
continuing education.
Younger engineers reported the highest preference for changing
companies. Slightly more than 50% of the 22-29 group and 40% of the
30-34 group indicated a desire to change companies. Engineers in
companies without payment for continuing education also preferred
leaving the organization. Further, engineers with a preference for
leaving the organization had different reasons for taking continuing
education than those preferring to stay with a company. Company
leavers cited preparation for a job in a new field, intellectual
stimulation, preparation for a new job in the same field, or a salary
increase; persisters associated continuing education with improved
performance in the job, maintenance of current position in company,
and understanding of technologies.
The survey also indicated differences between supervisors' and
engineers' reasons for continuing education. Supervisors supported
continuing education for understanding technology, preparation for
increased responsibility, and improvement of job performance. Though
supervisors strongly supported continuing education, 85% indicated
that engineers should decide on what courses to take, while 70% of the
engineers preferred managers to recommend appropriate courses.
Like other studies reporting participation levels, this survey
showed that even though both managers and engineers recognized the
rapid changes in technology, participation remained low. Reasons for
nonparticipation included time, course quality and cost.
46
The study also investigated the preferred formats of study.
Engineers showed preference for both university-and industry-sponsored
courses. Self-study received a strong second rating by 25% of the
respondents. Semester/term courses were preferred by 22-34 year olds;
engineers 30-39 found it difficult to find courses to meet their
interests.
While 75% of the engineers wanted professional development plan
ning, less than one-third had written plans of development. Supervi
sors favored the written development plan slightly more than the engi
neers.
Conclusion
The current research literature on the development of engineers
in technical organizations indicates that individual, work, and
organizational factors do influence the degree of continuous develop
ment that occurs. Further, the age of engineers does not correlate
with knowledge obsolescence except to the degree that age indicates
time from development. The key organizational factors associated with
sustained technical performance include:
1. An organizational climate and culture that recognizes and
supports ongoing technical development and performance.
2. Management and supervisory practices that integrate develop
ment with job assignment and performance appraisal.
3. Management accountability for continuous development of
technical knowledge within the work group.

4. Reward systems that include both monetary and visible
recognition for development and technical performance.
47
5. Varied challenging job assignments that stimulate continuous
learning and application of technical skills.
6. Varied and continuous development activities that recognize
individual preferences for learning targeted to selected
changing technologies.
7. Broadly based flexible technical career roles recognized and
rewarded by the organization.
Finally, long-term sustained technical excellence requires a
work environment that expects, supports, and rewards the continuous
development and systematic integration of the individual engineer with
the current and future technologies of the organization. Strategies "
for development, rewards, and job assignments must reflect changing
individual interests, capabilities, and preferences.
-----------------~~--------------- -----

CHAPTER I I I
METHODOLOGY AND PROCEDURE3
A major purpose of this study is to describe the current
knowledge base of a population highly sensitive to knowledge
obsolescence and their current developmental responses to this
"at-risk" position. Additionally, the degree of organizational
support for development provided in the work environment is
investigated to identify patterns of relationships that emerge between
different subpopulations, work environment factors, and the kind and
degree of development activity.
This chapter describes the population and sampling procedure,
provides a description of the questionnaire, and identifies research
design and procedures used to conduct the study.
Population and Sample
The population for this study includes nonmanager professional
engineers in a medium-sized electronics manufacturing firm. An engi
neer is defined as an individual employed to do engineering work. Un
like other studies that have defined engineers as individuals with a
bachelor1s degree in engineering, the broader definition allows an
examination of the characteristics of an actual engineering population
in an organization. The job code classification for engineers

49
includes a wide range of nonmanager engineering/scientific functions.
Key types of engineers in the organization include:
1. Software engineer 21%
2. Electronic engineer 15%
3. Software/hardware 12%
4. Performance assurance 6%
5. Mechanical/electromechnical 6%
6. Technical writer 6%
7. Manfacturing engineer 5%
S. IC/hybrid 4%
9. Electron device 3%
10. Software evaluation 3%
11. Principal scientist/engineer 2%
All other engineering classifications comprise 1% or less of the
total engineering functions. The listed job codes comprised 83% of
the engineering population in January 1985.
Engineer job groupings are also divided into six job grades:
Engineer/scientist I, engineer/scientist II, engineer/scientist III,
senior engineer/scientist, principal engineer/scientist, and chief
engineer/scientist. Typical minimum qualifications for Level I
include a bachelor's degree and/or equivalent experience and train
ing. Level II requires a bachelor's degree with 1-2 years experience
or a Master's degree. Level III requires a bachelor's degree with 4-6
years experience or a master's degree with 2-3 years experience, or
PhD in appropriate academic discipline. Senior, principal and chief

50
engineer/scientist grades include degree requirements with increasing
amounts of experience. Current distribution of engineers by job
grades are:
1. Level I 12%
2. Level II 35%
3. Level III 34't
4. Senior 15't
5. Principal 4't
6. Chief 2%
Engineers are distributed across the various Groups/Divisions of
the company. Ninety-four percent of the engineer/scientists work in
seven .key groups: Group A, 21.5; Group B-19.6; Group C, 18.7; Group
D, 11.1: Group E, 7.8; Group F, 7.7; Group G, 7.5. The remaining 6%
are distributed in administration and corporate groups.
Sample
A simple random sample of 550 engineers was selected using the
Human Resource Information System computer base of professional
engineer job codes. The sample size exceeded the number required to
ensure a .95 confidence level (Krejcie & Morgan, 1970) from the total
population of 2,213.
Representativeness of Sample
With a moderate response rate of 58't (n = 320) from the initial
random sample of 550, several tests were completed to investigate the
potential bias of the nonrespondents on the study findings. Tests for
-----~.-----~ ._-------_ .. __ . -- -----_ ... _----.. _-------.. _---.--_ ... - ---'---

51
representativeness of sample included age, sex, length of service
and distribution across Groups of the Organization. Results of the
tests for sample representativeness follow:
Length of Service
The length of service of respondents ranged from 1 to 34 years
with an average of 8 years. Seventy-nine percent of the respondents
had 12 or fewer years of service. The highest single LOS category was
1 year with 17% followed by 2 years at 11%, 5 years at 8%, 7 years at
7%. The sample population distribution skewed toward shorter length
of service. However, the respondents' distribution is closely repre-
sentative of the total engineering population in the company.
TABLE I
ENGINEER DISTRIBUTION
BY LENGTH OF SERVICE
LOS Sample Total in Organization
0-5 46% 45%
6-10 26% 28%
11+ 28% 27%
Total 100% 100%
One might conclude that nonrespondents of the survey would be similar
in nature as respondents based on the degree of LOS representativeness
of the total engineering population.

52
A comparison of the respondents· age distribution with the total
population is provided in Table II.
Age
20-29
30-39
40-49
50+
No age given
Total
TABLE II
ENGINEER DISTRIBUTION BY AGE
Sample
28%
40%
16%
5%
11%
100%
Company Population
26%
44%
21%
9%
100%
If the probability is higher that older engineers may less often
choose not to identify their specific age and the 11% unindentified
were distributed in the 40-49 and 50+ categories, the age distribution
of the respondents would reasonably follow the pattern of age
distribution in the total company engineering population. With 53% of
the respondents who did not specify their age indicating an LOS of 11+
years and an additional 18% indicating LOS of 6-10 years, the
assumption seems to have merit.
-------------------.------

53
Group Distribution
Nonmanager engineers are distributed across seven primary
Groups of the organization. Sample and population distribution are
reported in Table III.
Group
A
B
C
D
E
F
G
H (All
Total
TABLE I II
ENGINEER DISTRIBUTION BY
GROUP
Sample Organization
26.6 21.5
16.2 19.6
17.5 18.7
8.4 11.1
8.4 7.8
8.4 7.7 ., n 1.0 7.5
others combined) 6.7 6.1
100 100
Difference
+5.1
-3.4
-1.2
-2.7
+.06
+.07
+.03
+.05
The distribution variance by Groups ranged from 3.4% underrepresenta
tion in Group B to 5.1% over representation in Group A, the two groups
with the largest total population of nonmanager engineers in the
organization. Four of the Groups showed 1% or less variance in
response rates. With maximum variance of 5% to total engineering

population, the Group sample distribution reasonably reflected the
actual distribution.
Sex Distribution
54
The respondents are 89.4% male and 10.6% female. These percent
ages compare equivalently to a 89.6% and 10.4% male and female distri
bution of nonmanager engineers in the total population.
The Survey Instrument
The questionnarie used for collection of the data on the work
environment, reward preferences and their relationships to develop
ment, and development activity preference was the Work Description
Questionnaire for Engineers developed by a team of Pennsylvania State
University researchers funded by the National Science Foundation
(Farr et al., 1980, 1984). The WDQE questionnaire and supplemental
instruments were designed to test the Dubin technical updating model
for engineers (see Figure 4).
------------------------------------------

P(U) = f (M, W.L),
where:
P(U) = probability of updating,
r~ = individual motivation, and
W.E. = work environment.
W.E. =Wl (O.C.) +W2 (J.C.) +W3 (5.5.) +W4 (C.l.) +WS (M.P.),
such that:
W1 ••• WS = weight assigned to each variable,
O.C. = organizational climate,
J.C. = job characteristics,
S.S. = supervisor-subordinate relationships,
5.1. = colleague interactions, and
M.P. = management policy.
S5
Figure 4. Dubin's model of technical updating (Farr et al., 1980) •

56
Information for the development of WDQE was obtained from engi
neers and technical supervisors from 200 private-sector and government
organizations. In the interactive design process engineers and engi
neering managers indicated the degree of influence that each item
would have on an engineer remaining technically current. Following
the design and testing of the instrument, an initial study was
completed with a one-year follow-up study to test the reliability of
the instrument.
Since the items of the instrument were developed by a population
similar to that of this study, the investigator felt that the WDQE had
sufficient content validity to be useful in exploring more in depth
the work environment and reward factors of the current population.
From previous research, Dubin (1977) established five key work
environment factors that influenced technical-updating -- organiza
tional climate, job characteristics, supervisor-subordinate relation
ships, colleague interactions, and management policy. The Pennsyl
vania Studies used the Dubin model as a framework for designing
instruments to further trst the relationship of these factors and
technical development. The Pennsylvania Studies produced twelve
factors (see Figure 5) with varying degrees of reliability that ac
counted for 54% of response variance (Farr et al., 1980). All other
individual factors produced less than 2% of the variance.
-~-- -------------------------

57
Subscale Number of Items Reliability
1. Supervisor Feedbuck and Communication 10 .84
2. Organization Policies Encouraging Updating 6 .61
3. Project and Work Management 3 .56
4. Technological Orientation of Organization 7 .80
5. Work Assignments Encouraging Updating 5 .65
6. Technical Expertise of Peers 6 .63
7. Engineer's Participation in Organizational Decisions 11 .81
8. Technical Support within the Organization 4 .52
9. Organizational Policies Discouraging Updating 3 .38
10. Comprehensive Project Assignments 4 .48
11. Availability of Technical Course 1 Not Calcul able
12. Assignments to Nontechnical and Repetiti ve Work 7 .66
13. Overall Organizational Attitude 27 .95
Fisure 5. Work description questionnaire for engineers subscale reliabillties estimated by coefficient alpha (Farr et al., 1980).

58
For this study, only those subscales with .60 or greater
reliability were used. Median intercorrelation among the subscales is
.35 (Farr et al., 1980).
Key environment factors included in this study utilize 60% of
the list items of the WDQE; in general, the items are analyzed in the
same categories as the WDQE. However, the general areas of the WDQE
used in this study have been modified to reflect more clearly the
content of the items. The following groupings and definitions were
used for examination of environment factors:
1. Company Support--the extent that the company provides clear
goals, maintains a competitive market attitude, and provides
opportunities for engineers to meet development and
performance objectives.
2. Management Support for Development--the extent that managers
establish performance goals, solicit ideas, share
information, encourage development, and reward appropriate
behavior.
3. Peer Support--the extent that peers share ideas, provide
feedback, and encourage development.
4. Work Assignments--the extent that job assignments are
challenging, interesting, and non-repetitive.
5. Involvement/Communication--the extent that engineers
participate in work-related decisions and an open
information exchange exists among engineers and managers.
59
6. Climate--the extent that the general company lIatmosphere ll
fosters growth, creativity and innovation, and high perform
ance.
The rewards section of the questionnaire seeks to establish what
rewards engineers value and to what degree those valued rewards are
linked to development. A final section on development activities
explores the effectiveness of various development methods.
In addition to work environment, rewards and outcome
preferences, and effective development activities, the following types
of information were collected to establish population background and
recent/current development behavior.
1. Background: primary group within organization, length of
service, sex, age, education.
2. Development practices: development plan, degree program,
course-seminar participation, independent reading, and net
working.
3. Key learning methods.
4. Motivation for learning and importance to current job and
career.
5. Key barriers to development within organization.
Research Design and Procedures
Descriptive research is viewed as appropriate to the exploration
of phenomena in a variety of contexts when insufficient knowledge or
information is known to generate hypotheses. Purposes of descriptive
research include efforts to secure evidence about an existing situa-

60
tion or current condition, to identify standards or norms with which
to compare present conditions and to make decisions for action (Hill
& Kerber, 1967). Further, the aim of descriptive research is to
conceptualize phenomena and to lay the groundwork for hypothesis
testing and prediction (Warwick & Lininger, 1975). Descriptive
research alsosearches for patterns that explain, why, how or when
(Murdick, 1969).
It is in the realm of descriptive research that this study is
conducted. The study seeks to 1) establish what the current condition
of the population is in terms of knowledge foundations and development
behavior, perceptions of the work environment, and the relationship of
valued rewards to development and then to 2) identify patterns within
this context of rapid knowledge and organizational change that enhance
development or encourage knowledge obsolescence.
A cross-sectional survey served as the primary data collection
methodology. Additional information available from the HRIS system
was used to validate findings and provide supporting information. The
survey provided the base-line data for identifying key subgroups from
which to explore patterns of similarity and differences and to measure
the significance of those differences on dependent variables.
To increase understanding of knowledge obsolescence in the
organization, it seemed reasonable that the basic characteristics and
background of the population should first be established to determine
the homogeneity or heterogeneity of the population. Then differences
in development behavior could be studied in relationship to differ-

61
ences in individual backgrounds as further mediated by organizational
systems.
Two individual factors of the respondents were used to analyze
the similarities and differences of work climate, rewards, and
development preferences: length of service, and education. The
following null hypotheses were tested:
1. All education and LOS groups will report the same degree of
current development behavior. (.05)
2. All education and LOS groups will report equivalent work
climates. (.05)
3. All education and LOS groups will value the same rewards.
(.05)
4. All education and LOS groups will report the same
opportunity for valued rewards if technically current. (.05)
5. All education and LOS groups \'1il1 val ue the same
developmental activities. (.05)
Pretesting of the Instrument
A pilot test to further check the validity of the survey instru
ment for the purposes of the study was conducted. A cross-section of
engineers (N=10) by function, culture, sex, educational background,
and tenure in the organization were hand selected for the pretest.
Each individual was scheduled for a one hour session with the investi
gator. During the session the researcher explained the focus of the
research and the purpose of the pretest. Each individual completed
the survey and noted any problems in language and construction of

62
items and instructions as they completed the survey. The investigator
and the individual discussed any ambiguities of the questionnaire
items as well as possible content omissions related to the intent of
the study. In addition, general perceptions of the participants
related to the development of engineers were noted. The investigator
timed each participant and observed the difficulty of the individual
in completing the survey.
As a result of the pretest, changes were made in language, for
mat, and items of the questionnaire to decrease ambiguity, to increase
the ease of self-administration, and to personalize the questionnaire
for the population. Few content changes were made, i.e., deletions
for irrelevance or additions from omission.
In general, pretest participants responded positively to the
questionnaire, despite its length and complexity. Participants were
eager to discuss their views on development and felt that engineers in
the company would respond to the survey. The average time for comple
tion of the survey was 30 minutes.
Survey Procedures
The survey (Appendix A) was sent to the sample population
through the inter-plant mail system at the individual's work site. A
cover letter (Appendix B) introduced the investigator, explained the
purpose of the survey, and encouraged the engineers to participate.
Participants were told that the information provided would be confi
dential and that a summary of survey results would be made available
to them. Individuals were also asked if they would be willing to

63
participate in a follow-up interview. A follow-up letter (Appendix C)
was sent to all sample members. The follow-up letter generated a 10%
increase in response.

C tJ.APTE R I V
DATA PRESENTATION AND DISCUSSION
Introduction
A context of rapid change in technology, increased international
and national competition, demographic and social value shifts, demands
that American industry increase productivity and the quality of goods
and services by substantial margins. An example of this expectation
is reflected in one target of the organization under study to decrease
product time to market by 50% in 3 years--an average of 16.67% a
year.
Considering the dynamics of the international marketplace and
the competitive state of the electronics industry, these expectations
are realistic. These levels of performance must be met to ensure
survival of the organization. Yet, for the individuals who must
produce these results in the engineering community, both managers and
nonmanagers, these expectations may seem impossible especially in view
that financial resources are constrained.
To achieve this level of performance change, the human resource
contribution must be optimized once the productivity gains from auto
mation, tools and improved material/inventory control systems, i.e.,
hard technologies are equalized across the industry. It has been

65
suggested that improvements in these IIhard technolgies ll will result in
30 to 50% improvement in productivity;yet they will be insufficient to
be competitive (Snyder, 1984). The soft technologies involving
relationships and work design currently provide 80% of the Japanese
advantage. Ultimately, the synergistic use of both hard and soft
technologies will provide the competitive edge and the productivity
gains required for survival.
People make value-added contributions through two primary means:
knowledge/skill and experience. At any point in time the cumulative
knowledge/skill of the human resources in an organization is indica
tive of the present capacity of the organization to achieve its objec
tives. Focused development behavior is indicative of what the near
term and, if continuous development is present, the long-term capa
bility of the organization may be. The motivation of the organization
and the individuals to direct present knowledge/skill and development
behavior to achieve organizational objectives represents the internal
environment of will and opportunity (Blumberg & Pringle, 1982). The
data and discussion of this study are examined in terms of these
elements and their implications for the present and future of the
organization. Additionally, the present state of knowledge and skill,
the differences in individual development behavior, preferences for
development activity, and the organization systems that support per
formance and development are examined.
Information from 320 nonmanager engineers from a random sample
of 550 engineer in a mid-size Northwest electronics manufacturing firm
has been collected to gain insights into the characteristics, knowl-
- ---._-_._._._----- . __ .- ---------- ,-----

66
edge base, and development behavior of an actual engineering
population. The engineers also provided information related to their
work environment. A modified version of the Work Description
Questionnaire for Engineers with a supplemental reward and outcome
form developed by a team of Pennsylvania State Researchers (Farr et
al., 1980) was used for this purpose. A narrative of the respondent
data describes education and service backgrounds, motivation for
educational development, and recent development behavior. Preferences
for development incentives and rewards are also analyzed. Information
about work environment factors is summarized noting particularly the
relationship of rewards to development.
Included in the discussion is an analysis of different subgroups
by education and length of service. The key educational subgroups are
non-degreed, bachelor-degreed and advanced-degreed engineers. Respon
dents are also divided into three length of service groups: 0-5
years, 6-10 years, 11+ years. The break between the earlier entry
years (0-5) and transition years (6-10) to career employees (11+) for
engineers in the organization occurs on an average of six years. This
is determined by high levels of turnover that the organization
experiences in engineers during this time.
Knowledge/Skill Foundations of Nonmanager Engineers
An essential question of the study investigates the degree that
engineers in the company have basic knowledge/skills of engineering.
One method of determining the strength of engineering knowledge is
-----~---------------------~-- .. -----------_._-_._-- _._----_._. __ ._- -.

67
through educational background in engineering and engineering-related
disciplines. The education information has been divided into three
categories: non-degree, bachelor's, and advanced degree (master's and
doctorate).
Overall, 30% of the respondents had no engineering-related
degree, 50% reported having earned bachelor degrees, 16% held master's
degrees, and 4%, doctorates. Primary specializations of the degreed
engineers included electrical engineering, computer science, mechani
cal engineering, mathematics, physical sciences, and other specific
engineering disciplines.
Non-degreed Engineers
Non-degreed engineers exist in all age, length of service and
sex groups, but are more prevalent in longer service, older, and male
subgroups (Table IV). Eighty-one percent of the non-degreed engineers
come from engineers with 6 or more years of experience in the company
who are 30 or more years of age. However, 19% of the non-degreed
engineers have 5 or fewer years of experience or are 20-29 years of
age. While females represent 11% of the sample and the total
engineering population in the organization, they account for only 6%
of the non-degreed sample.
Engineers with Bachelor Degrees
Engineers with bachelor degrees show less length of service with
more than 50% reporting 0-5 years with the company. However, the
relationship of bachelor degrees to age is not direct. The highest
number of engineers with bachelor degrees is from the 30-39 age group

68
with 39%, followed closely by the 20-29 age group of 37%. Thus, the
increased preference for bachelor degrees present in less length of
service engineers appears more strongly associated with hiring
practices than age. Males are slightly underrepresented (2%) in the
bachelor degree category, while their female colleagues are slightly
overrepresented (2%) in the population.
Categories
LOS:
0-5 6-10 11+
Total
AGE:
20-29 30-39 40+
No Age Given
Total
SEX:
Male Female
Total
TABLE IV
ENGINEER EDUCATION BY LENGTH OF SERVICE, AGE AND SEX GROUPS
No Degree % (n)
19% (18) 31% (30) 50% (48)
100% (96)
19% (18) 36% (35) 31% (30) 14% (13)
100% (96)
94% (90) 06% (06)
100% (96)
54% (86) 26% (42) 20% (31)
100% (159)
37% (58) 39% (62) 13% (21) 11% (18)
100% (159)
87% (138) 13% (21)
100% (159)
------.-----
Advanced % (n)
65% (41) 17.5% (11) 17.5% (11)
100% (63)
19% (12) 44% (28) 27% (17) 10% (06)
100% (63)
89% (56) 11% (07)
100% (63)

69
Engineers with Advanced Degrees
Two-thirds of advanced-de greed engineers show five or fewer
years of experience with the company. The remaining one-third are
divided equally between 6-10 and 11+ length of service groups. While
the largest number of advanced-degreed engineers show 5 or fewer years
with the company, 44% are 30-39 years of age. Again the data show
that the knowledge base of engineering is more directly related to
external sourcing practices than the age of engineers. Male and
female engineers with advanced degrees are represented proportionally
to their presence in the sample and primary population.
Currentness of Engineering Education
To further characterize the knowledge base of engineers, the
investigator completed an analysis of degree completion dates. The
data indicate that 69% of the bachelor degrees were completed in the
last 10 years. Similarly 64% of advanced degrees have been earned
within ten years. With the half-life of an engineer's knowledge pro
jected in today's rate of technological change at 3-5 years (Kaufman,
1978), using the degree as one indicator of engineering knowledge, the
company could have a 30% knowledge obsolescence factor unless
additional evidence of non-degreed development exists. This rate of
obsolescence assumes that the knowledge base gained through
engineering-related degrees is effectively utilized in the work
environment to minimize knowledge regression.
The data also indicate that the overall formal knowledge-base is
relatively current. This shows it has been gained disproportionately

70
through recent education. One would conclude that the more recent the
knowledge base, the less potential there would be for present
knowledge obsolescence. On the other hand, while present liability
may be minimized, future liability may be great without continuous
development.
TABLE V
COMPLETION DATES OF RESPONDENTS' ENGINEERING DEGREES*
Degrees Years (n)
1981-85 43.1 (60) 1976-80 25.9 (36) 1971-75 11.5 ( 16) 1965-70 7.9 (11) 1964- 11.5 (16)
Total 100 (139)
Advanced
1981-85 39.0 (23) 1976-80 25.4 (15) 1971-75 20.3 (12) 1965-70 10.2 ( 6) 1964 5.0 ( 3)
Total 100 (59)
*Not all respondents reported completion dates.
Currentness of Education by Length of Service
Degree completion is analyzed in relation to LOS to assess
whether or not the development of engineers through education is
sustained over time. In the 0-5 LOS groups 86% have education

71
completed in the last 10 years with 65% showing completion within the
last five. In the 6-10 LOS group, respondent education currency drops
to 52% in the past 10 years with 7% education completion in the past
five. Career engineers (11+) show 26% completion in the past 10 years
with 8% in the last five.
The data indicate that currentness of education declines with
i nCr'eased service. The potenti al of knowl edge obsol escence as a
function of LOS also increases with the percentage of engineers who
increasingly report no engineering degrees: 12%, 0-5: 36% in 6-10 and
53% in 11+.
The data demonstrate that the majority of engineers do not
increase their educational level as a function of their career within
the organization. As time passes, engineers rely on initial education
for levels of performance and contribution to the organization. Thus,
the importance of continuous development through non-degree methods is
obvious. The results seem to suggest that the organization has not
consistently monitored the education background of engineers since
TABLE VI
COMPLETION DATES OF ENGINEERING DEGREE FOR LENGTH OF SERVICE GROUPS
Years 0-5 (n) 6-10 (n) 11+ (n)
1981-85 65.2 (77) 7.1 ( 3) 7.9 ( 3) 1976-80 21.1 (25) 45.2 (19) 18.4 ( 7) 1971-75 8.5 (l0) 16.7 ( 7) 29.0 (11) 1965-70 3.4 ( 4) 16.7 ( 7) 15.8 ( 6) 1964 1.7 ( 2) 14.3 ( 6) 29.0 (11)
Total 100 (118) 100 (42) 100 (38)

many career engineers have not earned basic engineering degrees or
up-dated prior degree work.
Implications for Organization
72
The hiring behavior of the organization seems to show a trend of
increasing the engineering knowledge base of the organization. This
trend is marked with an increase of bachelor-degree hiring, resulting
in a 26% presence in the 6-10 LOS groups to 54% in the 0-5 LOS group.
This represents a shift of more than 50%. This trend is more power
fully displayed in the hiring of advanced-degreed engineers, changing
markedly from a 17.5% presence in the 6-10 LOS group to 65% in the 0-5
LOS group. However, another possibility exists. Engineers with
bachelor and advanced degrees may be showing greater mobility than
non-degree engineers. Another trend that is logically occurring
simultaneously is the decline in the numbers of recent hires without
degrees. The changes are more marked in the LOS groups than in the
age groups; this suggests that the link of knowledge/skill is stronger
with hiring and sourcing practices initially than with the age of the
engineers. Further, the presence of a higher knowledge base in lower
LOS groups indicates that longer-term employees may not be up-dating
their educational levels over time.
The unequal distribution of engineers across LOS groups may have
significant implications related to knowledge obsolescence for the
organization. The number of engineers currently in the 0-5 LOS group
who have yet to enter the transition and career stage places addition
al burden on the goal of retention of critical and limited technical
-------------------_ .. _------.- .. -.. _ ..
73
skill sets of engineers. With high turnover following the fifth and
sixth year of employment, the organization without paying special at
tention to concerns of the 0-5 LOS population could experience high
loss of critical skill sets that are less accessible in the market
place anc that are costly to replace even if available.
The marked differences in education and experience of career
employees (11+) and relatively new hires (0-5) could result in work
environment conflicts as the organization through its shift in hiring
practices is indicating a need for more formal knowledge-based engi
neering skills to maintain its competitiveness, while a percentage of
engineers who have valuable organization experience may not have the
required knowledge base. If they did, it would seem reasonable that
the organization would hire this internal, more experienced talent
rather than doing extensive external sourcing especially with a strong
organization policy of internal promotion.
This shift to greater formal background knowledge may have cost
implications. Engineers with less formal engineering knowledge but
with higher service may be rewarded more than recent hires with
current engineering knowledge. As much a problem is the potential of
rewarding new, current knowledge-based engineers more than senior,
long-term engineers. Persistence of this condition of formal
engineering knowledge and service inversion could have negative
impact: Engineering costs could be higher than necessary for
engineers with high service, but without a needed knowledge-base. The
organization also could experience higher turnover of more marketable
and recently educated engineers. Thirdly, the hiring of experienced,
-------------------~ .. ------.. - ... - ...

74
expert engineers while maintaining long-term engineers without
appropriate engineering background reduces the advantage that comes
with having the appropriate expertise and organization experience
combined. The education data show that the separateness of formal
knowledge and length of service currently exists in the company and
that the development of career engineers may lag behind business
demands.
While the shift to knowledge-based engineers is evident, a
potential liability to the organization is the nearly 20% recently
hired (0-5) and young (20-29) engineers without degrees. This poten
tial liability increases dramatically with 36% of the non-degreed
engineers in the 30-39 age group and 31%, 40 years of age or older.
Considering the number of years of continued employment for these non
degreed engineers, the presence of 30% non-degreed engineers juxta
posed with current hiring practices based on knowledge-needs seems to
present a formidable long-term liability to engineering and organiza
tional productivity and effectiveness.
The data also raise questions about the organization's pattern
of development. If the present data indeed suggest that development
lags knowledge-demand and the organization has recently positioned its
present knowledge-base in low LOS groups, one might question where the
knowledge-base for five years from now will come if the past and pre
sent development patterns continue. Without high growth in the
organization to justify and support external hiring for new knowledge
bases, the company could have an adequately-sized engineering popula
tion without the needed knowledge--a high knowledge obsolescence and
--------------------------------.- _.- -

75
low-capability factor. Alternatively, if a pattern of continuous
development were instituted especially for engineers with low and
moderate LOS, the organization could reduce the negative margin
between experience and knowledge-base and leverage engineering
capability for the future without peaked hiring for needed skills.
With the present policy of employment continuity, the second strategy
of continuous development seems critical, unless high organization
growth can be assured.
Conclusion
This part of the data analysis investigates the current
engineering-related knowledge base in the organization. It seems
evident that the organization is increasing hiring standards that
result in a more formal knowledge-based engineering population. At
the same time the strategy may be diluted by a 30% population of
engineers without degrees cutting across all age and service groups.
An examination of education shifts over time indicates that only a
small percentage of engineers develop through additional degree
programs. The development of non-degreed educational opportunities
for engineers seems imperative to limit knowledge obsolescence.
Educational Development of Engineers
In addition to present knowledge base foundations, this study
investigates motivation for development and recent educational
development activity of the engineers to assess how important learning
is to this population and to identify patterns of group differences in
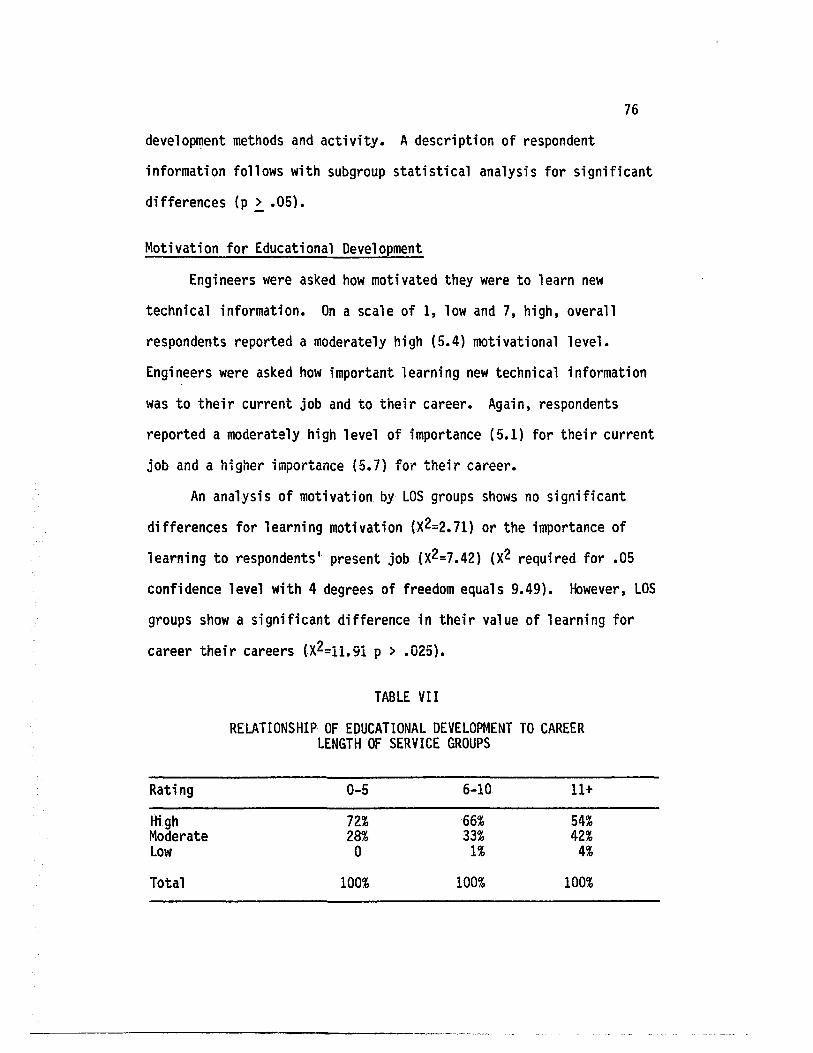
76
develop~ent methods and activity. A description of respondent
information follows with subgroup statistical analysis for significant
differences (p ~ .05).
Motivation for Educational Development
Engineers were asked how motivated they were to learn new
technical information. On a scale of 1, low and 7, high, overall
respondents reported a moderately high (5.4) motivational level.
Engineers were asked how important learning new technical information
was to their current job and to their career. Again, respondents
reported a moderately high level of importance (5.1) for their current
job and a higher importance (5.7) for their career.
An analysis of motivation by LOS groups shows no significant
differences for learning motivation (X2=2.71) or the importance of
learning to respondents' present job (X2=7.42) (X2 required for .05
confidence level with 4 degrees of freedom equals 9.49). However, LOS
groups show a significant difference in their value of learning for
career their careers (X2=11.91 p > .025).
Rating
Hi gh Moderate Low
Total
TABLE VII
RELATIONSHIP OF EDUCATIONAL DEVELOPMENT TO CAREER LENGTH OF SERVICE GROUPS
0-5
72"10 28% o
100"10
6-10
66"10 33"10
1"10
100%
11+
54% 42%
4"10
100"10

77
The data suggest that the differences lie in the declining relation
ship of development and careers by the longer-term engineers.
(Table VII) The pattern consistently declines from the more recent
hires to career engineers.
A similar analysis is completed for education groups with a
similar result. No significant differences (p ~.05) are observed for
motivation for learning (X2=5.88 p ~.10) and for importance of
learning to present job (X2=5.43 p<.10). However, education groups
also show a significant difference in importance of learning for their
career (X2=13.26 p >.01).
Further investigation (Table VIII) shows that the difference
lies primarily with the greater importance of learning for careers
reported by engineers with advanced degrees that is higher than
non-degreed and bachelor-degreed engineers. The non-degreed and
bachelo~-degreed engineers reported little difference in importance of
learning for their careers.
RATING
High Moderate Low
Total
TABLE VIII
RELATIONSHIP OF EDUCATION DEVELOPMENT TO CAREER EDUCATION GROUPS
No Degree Bachelor's Advanced
57% 41%
2%
100%
63% 35%
2%
100%
83% 17% o
100%

78
Educational Development Practices
Respondents provided information on their educational develop
ment behavior including course taking, independent reading and
networking. Additionally, respondents rated educational development
methods for their effectiveness.
Degree-related Development
Twenty-two percent reported that they were currently working on a
degree; however, 31% of the engineers without engineering degrees
reported that they were working on a degree.
TABLE IX
DEGREE DEVELOPMENT FOR LENGTH OF SERVICE AND EDUCATION GROUPS
Length of Service % (n) Education
0-5
6-10
11+
52% (36)
30% (21)
17% (12)
Non-degreed
Bachelor's
Advanced
% (n)
43% (30)
49% (34)
7% (5)
Thus 21% of the respondents currently do not have nor are they working
on engineering degrees. Currently, the highest degree development
activity is reported by engineers with bachelor degrees or 0-5 years
service to the company. The least amount of activity is reported by
engineers who already have advanced degrees and who are company career
-------------------_._-_. __ ....•. - ------

79
engineers (11+ LOS). With the low activity of engineers in earning
additional degrees to improve and update the knowledge level, the
non-degreed development behavior gains in importance.
Non-degree Development
As indicators of non-degree development engineers reported the
number of non-degree related courses and seminars taken in the past
two years and the amount of time spent reading about technical
developments, and networking with other engineers.
Courses and Seminars. The course and seminar information
indicates that engineers average one course/seminar per year
independent of whether the course/seminar is internal or external.
Engineers also report taking more courses internally than externally
(X2=21.76 p>.OOl).
TABLE X
NON-DEGREE COURSE AND SEMINAR PARTICIPATION IN PAST TWO YEARS
o % (n)
Inside Organization 36% (115)
Outside Organization 51% (164)
1-2 % (n)
38% (122)
32% (100)
3+ % (n)
26% (83)
17% (56)

80
Significant to the issue of obsolescence is the percentage of
engineers who reported taking no courses or seminars the last two
years -- 36% internally and 51% outside the organization. To further
understand this level of nonparticipation of engineers in courses and
seminars, data were examined by education and LOS groups as well as
for engineers who are currently working on degrees.
First, course and seminar nonparticipation occurs across all
education and LOS groups indicating that encouragement for continuous
development is needed independent of prior education and experience.
Engineers with bachelor degrees report the highest participation in
internal seminars and courses (Table XI).
TABLE XI
NUMBER OF COURSES/SEMINARS TAKEN BY EDUCATION GROUPS IN THE PAST 1W 0 YEARS
Education
Non-degreed
Bachelor
Advanced
Non-degreed
Bachelor
Advanced
a 1-2 % (n) % (n)
Inside Organization
38% (36) 35% (33)
30% (48) 40% (64)
48% (30) 38% (24)
Outside Organization
55% (53) 29% (28)
49% (78) 31% (23)
56% (35) 37% (23)
------------------ --_._---- -.- ..
3+ % (n)
27"10 (27)
30% (47)
14% ( 9)
15% (15)
15% ( 9)
7% ( 5)
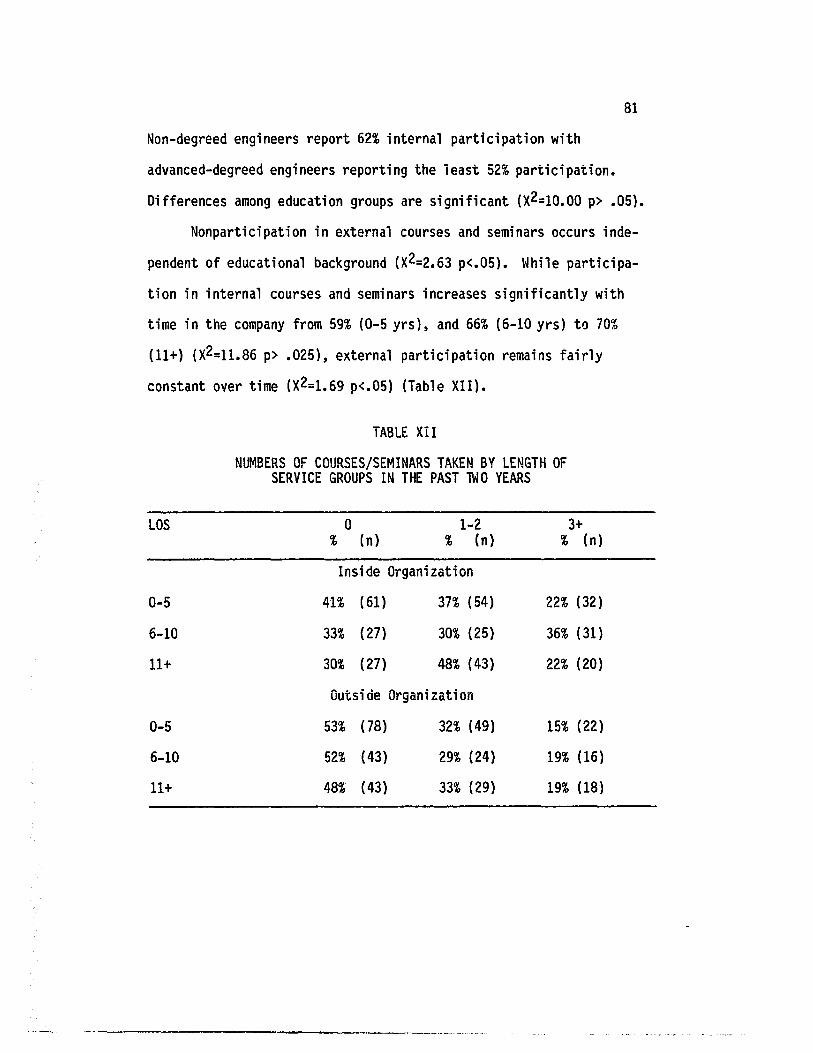
81
Non-degreed engineers report 62% internal participation with
advanced-degreed engineers reporting the least 52% participation.
Differences among education groups are significant (X2=10.00 p> .05).
Nonparticipation in external courses and seminars occurs inde
pendent of educational background (X2=2.63 p<.05). While participa-
tion in internal courses and seminars increases significantly with
time in the company from 59% (0-5 yrs), and 66% (6-10 yrs) to 70%
(11+) (X2=11.86 p> .025), external participation remains fairly
constant over time (X2=1.69 p<.05) (Table XII).
LOS
0-5
6-10
11+
0-5
6-10
11+
TABLE XII
NUMBERS OF COURSES/SEMINARS TAKEN BY LENGTH OF SERVICE GROUPS IN THE PAST TWO YEARS
0 1-2 % (n) % (n)
Inside Organization
41% ( 61) 37% (54)
33% (27) 30% (25)
30% (27) 48% (43)
Outside Organization
53% (78) 32% (49)
52% (43) 29% (24)
48% (43) 33% (29)
3+ % (n)
22% (32)
36% (31)
22% (20)
15% (22)
19% (16)
19% (18)

82
The greatest percentage of nonparticipation in courses/seminars
occurs external to the organization independent of LOS a"d education.
Overall, the external nonparticipation rate is 51% while nonparticipa
tion across LOS and education groups internally is 40%. Of those
engineers taking no courses internally, 58% are also not taking
courses externally. Of those taking no outside courses, 41% indicate
that they are not taking any courses internally.
Independent Reading. Respondents reported the number of hours
spent reading journals and textbooks per week as yet another indicator
of development behavior. Reading behavior averaged 4 hours a week
with 40% of the engineers indicating 2 hours or less. Reading be
havior remained relatively constant for non-degreed and bachelor
degreed engineers with nearly 50% reporting a reading level of 0-2
hours per week (Table XIII). However, degreed (bachelor and advanced)
Education
Non-degreed
Bachelor
Advanced
TABLE XIII
INDEPENDENT READING FOR EDUCATION GROUPS PER WEEK
0-2 % (n)
45% (43)
44% (71)
27% (17)
3-5 % (n)
43% (41)
34% (54)
48% (30)
--------------------_._-----------
6+ % (n)
12% (12)
23% (34)
25% (16)

83
engineers reported 11-13% more reading in the 6+ hour category than
non-degreed engineers. Overall advanced-degreed engineers reported
the highest levels of independent reading behavior with 48% in the 3-5
hour category and 25% in the 6+ category. Non-degreed engineers
reported the least amount of independent reading. Differences among
education groups were significant (X2=11.10 p> .025). Reading
behavior for LOS groups showed no significant differences (X2=2.54 p<
.05) •
TABLE XIV
INDEPENDENT READING FOR LENGTH OF SERVICE GROUPS
0-2 3-5 6+ Length of Service % (n) % (n) % (n)
0-5 39% (57) 39% (58) 22% (32)
6-10 42% (34) 37% (31) 21% (18)
11+ 45% (41) 40% (36) 15% (13)
Networking. Information sharing and discussion is an
established method for development especially important to innovation
(Tushman & Moore, 1982). The degree of discussion of technical issues
is probed at three levels: work group, outside the work group but
within the organization, and outside the organization. Ninety-five
percent reported weekly discussion of technical issues in their work
group at an average rate of 7 hours, with 5% reporting no discussion
of technical issues within their work group.
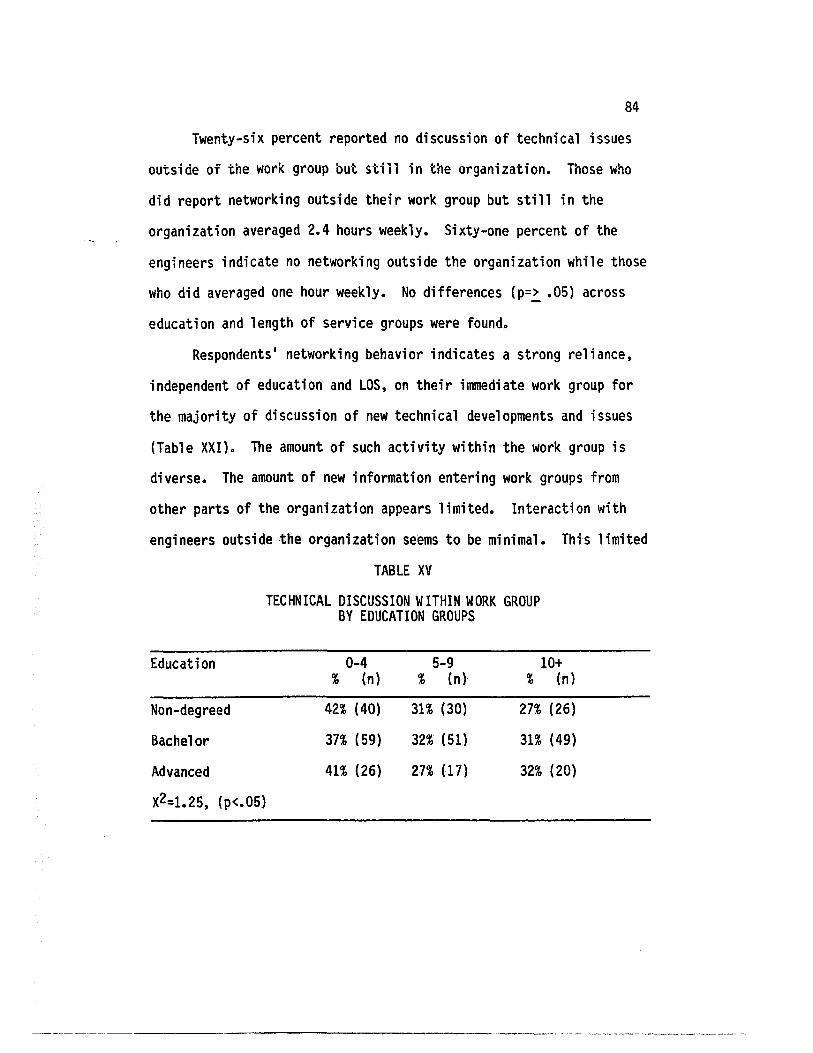
84
Twenty-six percent reported no discussion of technical issues
outside of the work group but still in the organization. Those who
did report networking outside their work group but still in the
organization averaged 2.4 hours weekly. Sixty-one percent of the
engineers indicate no networking outside the organization while those
who did averaged one hour weekly. No differences (p=~ .05) across
education and length of service groups were found.
Respondents' networking behavior indicates a strong reliance,
independent of education and LOS, on their immediate work group for
the majority of discussion of new technical developments and issues
(Table XXI). The amount of such activity within the work group is
diverse. The amount of new information entering work groups from
other parts of the organization appears limited. Interaction with
engineers outside the organization seems to be minimal. This limited
Education
Non-degreed
Bachelor
Advanced
X2=1.25, (p<.05)
TABLE XV
TECHNICAL DISCUSSION WITHIN WORK GROUP BY EDUCATION GROUPS
0-4 % (n)
42% (40)
37% (59)
41% (26)
5-9 % (n)
31% (30)
32% (51)
27% (17)
10+ % (n)
27% (26)
31% (49)
32% (20)
-----~--.---.---------------------,

85
interaction and information sharing pattern may isolate the engineers
from new developments and directions of other parts of the
organization as well as from their competitors and industry. The
isolation also may result in missed opportunities for information
exchange, innovative synergy, and critical awareness of changes
occurring within the organization, the industry and competitors.
TABLE XVI
TECHNICAL DISCUSSION WITHIN WORK GROUPS BY LENGTH OF SERVICE GROUPS
Length of Service
0-5 6-10 11+
X2=5.10, (p<.05)
Education
Non-degreed Bachelor Advanced
X2=8.20, (p<.05)
0-4 % (n)
35% (52) 35% (30) 49% (44)
5-9 % (n)
32% (47) 33% (27) 28% (25)
TABLE XVII
10+ % (n)
33% (48) 31% (26) 23% (21)
NElWORKING ACROSS GROUPS/DIVISIONS FOR EDUCATION GROUPS
o % (n)
18% (17) 29% (45) 31% (19)
1-2 % (n)
54% (51) 40% (62) 48% (30)
3+ % (n)
28% (27) 31% (49) 21% (13)
--- ---------------------

Length of Service
0-5 6-10 11+
X2=3.27, (p<.05)
Education
Non-degreed Bachelors Advanced
X2=4.50, (p<.05)
Length of Service
0-5 6-10 11+
X2=3.71, (p<.05)
TABLE XVIII
NETWORKING ACROSS GROUPS/DIVISIONS FOR LOS GROUPS
o % (n)
30% (43) 25% (21) 22% (19)
1-2 % (n)
43% (62) 43% (35) 52% (46)
TABLE XIX
3+ % (n)
27% (40) 32% (26) 26% (23)
NETWORKING OUTSIDE OF ORGANIZATION FOR EDUCATION GROUPS
o % (n)
65% (62) 60% (96) 56% (35)
1-2 % (n)
28% (27) 27% (43) 36% (23)
TABLE XX
3+ % (n)
7% ( 7) 13% (20)
8% ( 5)
NETWORKING OUTSIDE OF ORGANIZATION FOR LOS GROUPS
0 1-2 3+ % (n) % (n) % (n)
59% (87) 28% (41) 13% (19) 61% (51) 33% (27) 6% ( 5) 63% (57) 28% (25) 9% ( 8)
86
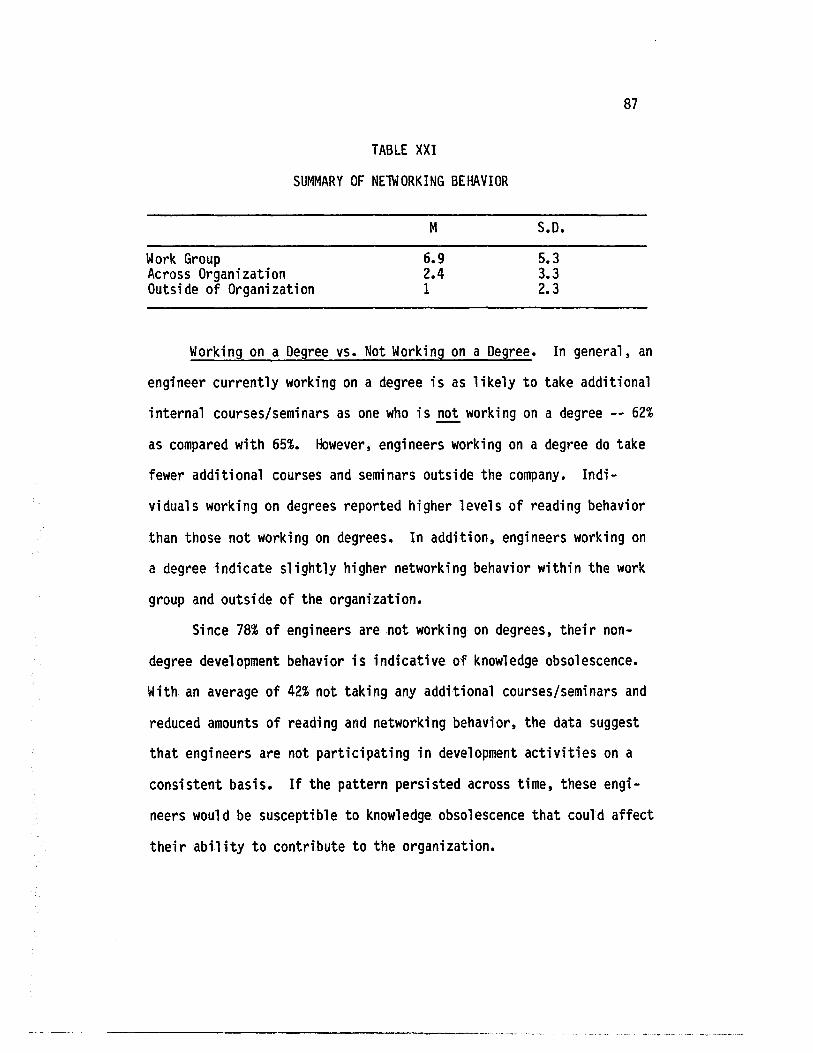
TABLE XXI
SUMMARY OF NETWORKING BEHAVIOR
Work Group Across Organization Outside of Organization
M
6.9 2.4 1
S.D.
5.3 3.3 2.3
87
Working on a Degree vs. Not Working on a Degree. In general, an
engineer currently working on a degree is as likely to take additional
internal courses/seminars as one who is not working on a degree -- 62%
as compared with 65%. However, engineers working on a degree do take
fewer additional courses and seminars outside the company. Indi
viduals working on degrees reported higher levels of reading behavior
than those not working on degrees. In addition, engineers working on
a degree indicate slightly higher networking behavior within the work
group and outside of the organization.
Since 78% of engineers are not working on degrees, their non
degree development behavior is indicative of knowledge obsolescence.
With an average of 42% not taking any additional courses/seminars and
reduced amounts of reading and networking behavior, the data suggest
that engineers are not participating in development activities on a
consistent basis. If the pattern persisted across time, these engi
neers would be susceptible to knowledge obsolescence that could affect
their ability to contribute to the organization.
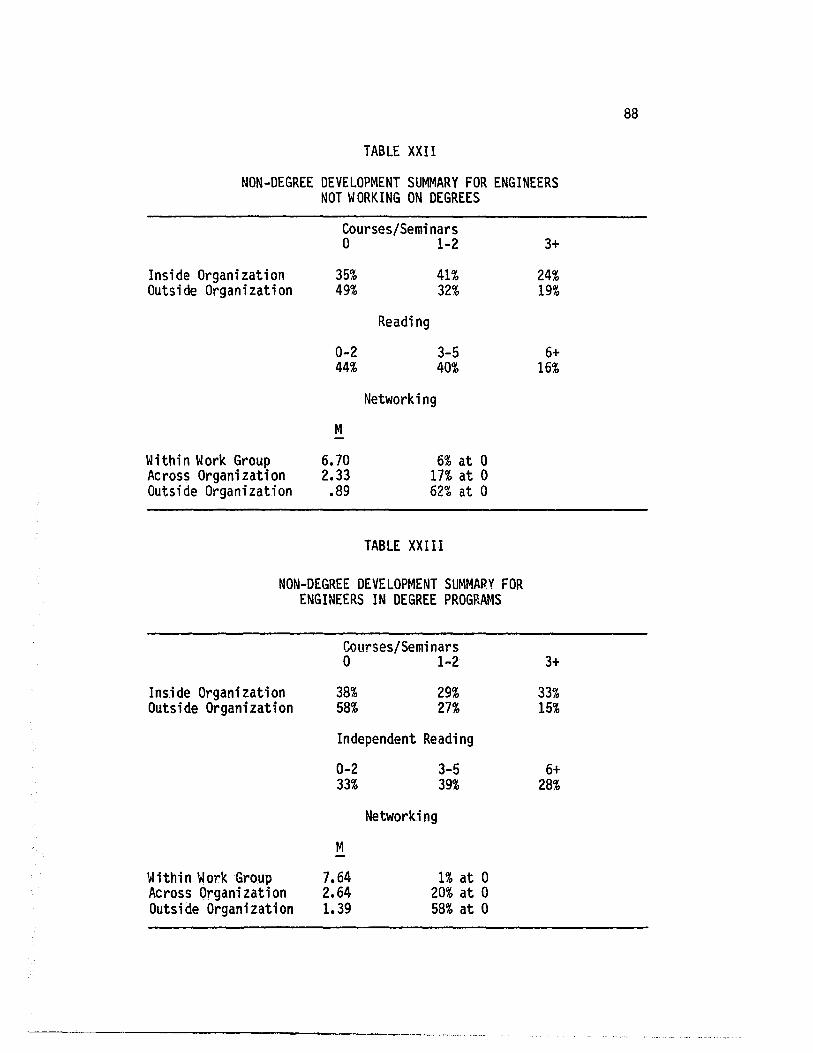
88
TABLE XXII
NON-DEGREE DEVELOPMENT SUMMARY FOR ENGINEERS NOT WORKING ON DEGREES
Courses/Seminars 0 1-2 3+
Inside Organization 35% 41% 24% Outside Organization 49% 32% 19%
Reading
0-2 3-5 6+ 44% 40% 16%
Networking
M -Within Work Group 6.70 6% at 0 Across Organization 2.33 17% at 0 Outside Organization .89 62% at 0
TABLE XXI II
NON-DEGREE DEVELOPMENT SUMMARY FOR ENGINEERS IN DEGREE PROGRAMS
Courses/Seminars 0 1-2 3+
Ins.ide Organization 38% 29% 33% Outside Organization 58% 27% 15%
Independent Reading
0-2 3-5 6+ 33% 39% 28%
Networking
M -Within Work Group 7.64 1% at 0 Across Organization 2.64 20% at 0 Outside Organization 1.39 58% at 0

89
Effective Development Methods
Engineers identified their current development methods. Respon-
dents named reading (45%) as the most effective method, with 28% valu
ing informal discussion or networking, and 15% preferring courses and
seminars. Projects, experiments, tradeshows, and conferences combined
for the remaining 12% of first choice responses.
Engineers also rated various development activities. With an
average of 4.73 (1, low; 7, high) for the listed activities, engineers
indicated that many methods of development could be useful in improv
ing their knowledge. Challenging work received the highest rating
(5.78) followed by reading technical journal s (5.48) and earning an
advanced degree (5.33). Working in an interdisciplinary project team
ranked fourth along with taking an occasional college course.
Courses/seminars (within the organization and outside the organiza
tion), networking and other reading activities also received above
average ratings for effectiveness. Moderate ratings were given to
teaching, attending national professional meetings and presenting and
publishing papers. Local professional meetings and professional
certification were rated lowest as effective methods for remaining
technically current.
Education groups showed significant differences (p~.05) in read
ing technical journals (X2=12.14 p>.025), working on interdisciplinary
project teams (X2=14.87 p>.Ol), attending national professional meet
ings (X2=16.97 p>.Ol) and publishing papers (x2=16.10 p>.Ol).
Advanced-degreed engineers followed by engineers with bachelor degrees
rated reading technical journals more effective than non-degree
90
engineers. Likewise, advanced-de greed engineers followed by engineers
with bachelor degrees responded more positively to interdisciplinary
project teams than non-degree engineers. This pattern continues with
the effectiveness for development of attending national professional
meeting and publishing papers in technical journals. Differences,
though not significant for this study (p~.05), appeared in attending
in-house technical seminars (X2=9.08 p>.10) and presenting papers at
professional meetings (X2=8.12 p>.10). Non-degreed engineers more
consistently valued in-house seminars and short courses than engineers
with bachelor degrees. Advanced-degreed engineers least valued
in-house courses. Degreed engineers also rated giving technical
presentations more favorably than the non-degreed engineer. LOS
groups reported one significant difference for teaching company
seminars (X2=11.17 p>.025).
Education groups show consistently and cumulatively more differ
ences in their rating of development activities than LOS groups. This
suggests that educational background influences choices of development
activity and behavior more than length of service. Also, these
differences indicate the importance of educational background as a
factor in studying knowledge obsolescence.
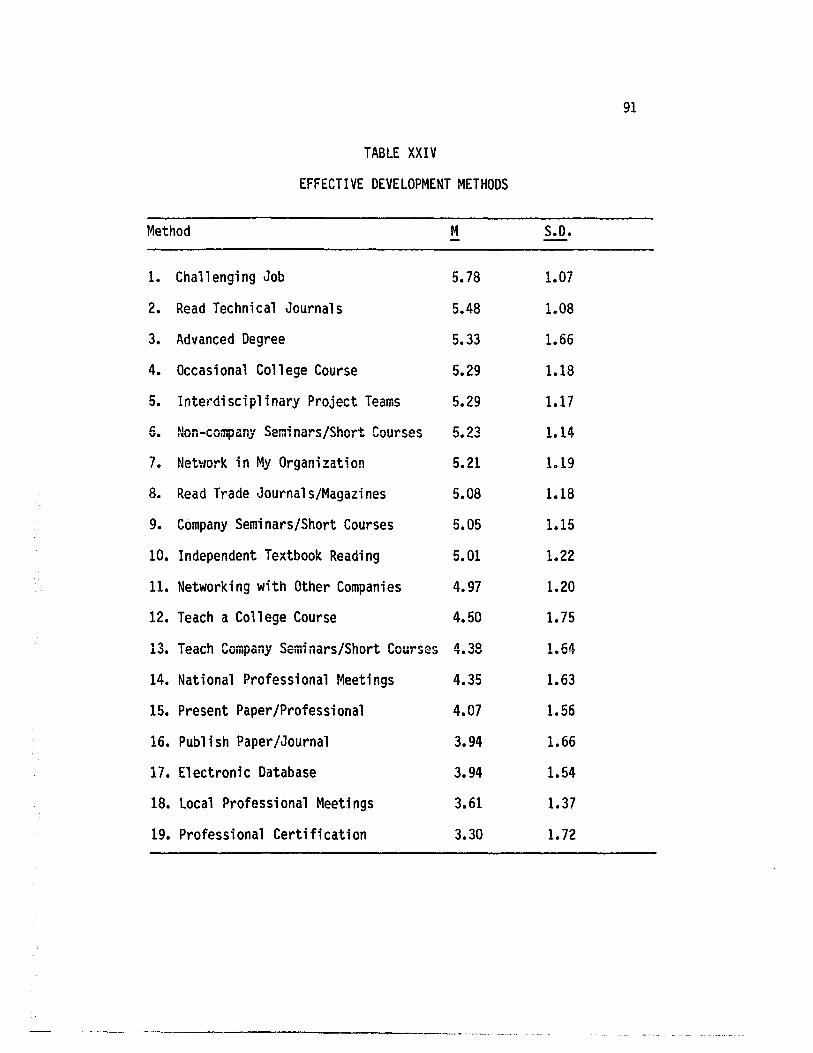
91
TABLE XXIV
EFFECTIVE DEVELOPMENT METHODS
Method M S.D.
1. Challenging Job 5.78 1.07
2. Read Technical Journals 5.48 1.08
3. Advanced Degree 5.33 1.66
4. Occasional College Course 5.29 1.18
5. Interdisciplinary Project Teams 5.29 1.17
5. Non-company Seminars/Short Courses 5.23 1.14
7. Network in My Organization 5.21 1.19
8. Read Trade Journals/Magazines 5.08 1.18
9. Company Seminars/Short Courses 5.05 1.15
10. Independent Textbook Reading 5.01 1.22
11. Networking with Other Companies 4.97 1.20
12. Teach a College Course 4.50 1.75
13. Teach Company Seminars/Short Courses 4.38 1.64
14. National Professional Meetings 4.35 1.63
15. Present Paper/Professional 4.07 1.56
16. Publish Paper/Journal 3.94 1.66
17. Electronic Database 3.94 1.54
18. Local Professional Meetings 3.61 1.37
19. Professional Certification 3.30 1.72
92
Organizational Barriers to Development
Engineers were asked to identify three barriers within the
organization to getting the information or resources to improve their
knowledge and skills. Sixty-two percent of the respondents identified
barriers. Twenty percent indicated that time was the primary barrier,
followed by cost (12%), management (9%), workload (9%), information/
equipment (8%), and library (4%). In terms of second and third
choices, time remained the primary barrier followed consistently by
cost. However, workload and tools overtook the concern about manage
ment in the second choice for barriers.
\~ork Environment for Development
The study investigated several work environment factors that
engineers and engineering managers indicate influence development
behavior (Dubin, 1977; Farr et al., 1980, 1984). Factors ~xplored
included: a) organization support for development; b) management c)
peer; d) work assignments; e) involvement/communication in decision
making; and f) overall climate.
Overall, peer support received the highest positive response
(79%) with engineer involvement and general climate following at 66%
and 62% respectively. Management support and work assignments
received moderate positive responses at 56% and 54%. Engineers gave
the lowest positive response to organization support for technical
currency at 47%.
-------------------._ ....... - ........ .

93
Organization Support for Development
Organization support for technical currency explored the degree
that the organization establishes clear technical goals, maintains a
competitive market attitude and provides opportunities for engineers
to effectively attain goals to meet business objectives. These
include job opportunities for continuous growth, tools, rewards for
performance, financial support for development opportunities, and
guidance for career planning.
Engineers rated the organization low (30%) in establishing clear
technological goals for engine~rs, but rated the organization
moderately high (76%) in having a competitive market attitude. While
the organization appears to provide tools to a majority of engineers
(67%), i.e., effective equipment and facilities, other support systems
received modest to marginal ratings at 50% or less. Only 43%
indicated that the organization's performance system rewards technical
competence; 45% thought that the organization is open to innovation
with 54% of the engineers viewing the organization as a recognized
innovator. Less than 50% of the respondents indicated that job
rotation is practiced to allow exposure to new disciplines. Just over
half (52%) indicated that budgets included funds for development.
While financial support is available to the majority for professional
meetings (69%), budgets for journals are funded at 50%. Lowest
ratings went to recognition for development (32%) and career planning
(23%).

94
TABLE XXV
ORGANIZATION SUPPORT FOR DEVELOPMENT
Agrees-No Opinion-Disagrees Percentages M S.D.
1. Competitive Market Attitude 76-12-12 5.17 1.28
2. Payment for Professional 69-13-18 4.91 1.51 Meetings
3. Tools/Current Technical Equipment/ Facilities 67-5-28 4.58 1.62
4. Recognized Innovator 54-14-32 4.25 1.38
5. Project Budgets Fund Technical Updating 52-16-32 4.48 1.93
6. 6. Payment for Journal
Subscription 50-19-31 4.20 1.86
7. Job Rotation for Exposure to New Di sci p 1i nes 47-28-25 4.35 1.45
8. Company Involved in Technical Dynamic Fields 47-24-28 4.41 1.47
9. Company Openness to Innovation 45-19-35 4.13 1.45
10. Performance System that Rewards Technical Competence 43-13-44 3.81 1.71
11. Recognition for Advanced Training/Degrees 32-35-32 3.92 1.29
12. Clear Technical Goals 30-25-45 3.69 1.51
13. Career Guidance 23-33-44 3.50 1.54
Average Totals 49-20-31 4.26 1.54
-- ---------------------- -----------._-----------------

95
Education groups reported significant differences for organiza
tional support. Advanced-degreed engineers indicate greater satisfac
tion but also the greatest variance with technical equipment and
facilities (X2=10.75, p>.05). Likewise, advanced-degreed engineers
report greater financial support for professional meetings (X2=10.80,
p>.05) than engineers of other education groups. In contrast, non
degreed engineers report the greatest amount of career guidance, with
the least amount reported by advanced-degreed engineers (X2=20.33
p>.OOl). Non-degreed engineers also indicate more opportunity for job
rotation, with the least amount available to advanced-degreed engi
neers (X2=12.72 p>.025). Education groups also indicate differences
(p>.10) in support for clear technology goals, recognition for train
ing and development, and payment for journals (X2=8.32, 8.98, 9.41
respect; vely).
LOS groups reported no significant differences (p>.05) for
organization support.
Management Support for Development
The manager support factor investigated the extent that managers
establish performance goalss actively encourage career development,
solicit ideass share information, set goals, and reward appropriate
behavior.
Engineers rated managers highest (76%) in eliciting ideas from
engineers. Engineers gave moderate positive responses to managers
involvement of engineers in establishing performance goals (65%), dis
cussion of technical problems and developments (62%), and providing
feedback for continuous improvement during performance reviews (61%).
--------------------- -----_._-....... '.'.,

96
Engineers also gave moderate positive response (64%) for salary
and promotions based on technical performance and opportunities for
attending seminars/courses (63%) and professional meetings (62%).
Engineers rated management low in encouraging technical reading and
presentations (48% and 38% respectively). Engineers also rated
managers low in recognizing and rewarding their efforts to keep
technically current (40%) and in providing career guidance (31%)
(Tabl e XXVI).
An analysis of education groups resulted in two elements of
significant differences (p ~ .05). Non-degreed and bachelor-degreed
engineers report less support for doing technical presentations
(X2=10.73 p> .05) than advanced-degreed engineers. Secondly,
advanced-de greed engineers indicate less support for independent read
ing during working hours than the other engineers (X2=19.27 p>.OOl).
Advanced-degreed engineeers, though not significant, report higher
levels of support for attending professional meetings than bachelor
degreed engineers, who in turn were more highly supported than
non-degreed engineers (X2=8.48 p >.10). Across lOS groups, however,
support for attending professional meetings showed significant
differences (X2=15.50 p> .01). Engineers with service of 5 or fewer
years reported higher levels of support than engineers with 6-10 and
11+ years of service.
--~~-~-~-~~-----------------------

97
TABLE XXVI
MANAGER SUPPORT FOR DEVELOPMENT
Agrees-No Opinion-Disagrees Percentages M S.D.
1. Elicits Ideas about Technical Problems 76-11-13 5.17 1.35
2. Current Knowledge of Manager 67-8-26 4.71 1.67
3. Sets Performanfe Goals 65-10-25 4.76 1.64
4. Provides Salary and Promotion for Technical Performance 61-22-17 4.69 1.31
5. Provides Opportunity for Attending Professional Meetings 63-19-18 4.93 1. 52
6. Provides Opportunity for Attending Courses/Seminars 62-10-28 4.53 1.65
7. Discusses Technical Issues /Developments 62-6-32 4.59 1.89
8. Does Performance Review for Continued Improvement 61-22-17 4.75 1.37
9. Encourage Technical Reading during Work i ng Hours 48-30-23 4.38 1.36
10 Recognizes/Rewards Technical Development 40-27-33 3.98 1.31
11. Encourages Technical Presentations 38-31-31 4.11 1.60
12. Provides Career Guidance 32-22-46 3.62 1.56
Average Totals 56-18-26 4.52 1.52
-- -------------------------------------------

98
Peer Support
At 79%, peer support was the most highly rated work environment
factor. Engineers rated peers as good sounding boards for new ideas
(93%), indicated that they provided reliable information (82%) and
encouraged each other in remaining technically current (85%). In
general, they share ideas (63%) and materials (78%) and provide
feedback for work improvement (78%).
TABLE XXVII
PEER SUPPORT
Agree-No Opinion-Disagree Percentage
1. Act as Sound Boards 93-4-3
2. Encourage Each Other in Remaining Technically Current 85-8-7
3. Serve as Reliable Information Source 82-9-9
4. Share Journal Articles and Papers 78-6-16
5. Provide Feedback to Improve Designs 78-9-13
6. Respond Positively to New Ideas 72-8-20
7. Share Ideas 63-25-12
Average Total s 79-10-11
M S.D.
5.84 .93
5.88 1.32
5.18 1.05
5.03 1.30
5.10 1.25
5.09 1.48
4.87 1.13
5.28 1.21

99
Education groups, however, reported a significant difference in engi
neers sharing ideas (X2=10.51 p> .05) and identifying errors in design
and ideas (X2=12.48 p>.025). Non-degreed engineers indicated a more
moderate response, followed by advanced-degreed engineers with
engineers having bachelor degrees showing the greatest peer support in
these areas. LOS groups showed no significant peer support
differences.
Work Assignments
The work assignment factor explored the extent that engineers
are assigned work that is interesting, challenging and non
repetitive. Seventy-four percent of the engineers indicated that
challenging work is given to engineers independent of length of
service to the company. However, only 53% thought that jobs stretched
the engineer1s knowledge with 48% indicating that assignments are fre
quently repetitious and formatted. Further, 57% indicated that engi
neers are often assigned to non-technical tasks with 41% reporting
that engineers are not always hired for engineering jobs. Sixty-five
percent did indicate that assignments are made in the engineer1s per
sonal interest area when possible. Also, 60% indicated that their
jobs allow time for exploring new ideas.
Both education and LOS groups report elements of significant
differences, though the elements are different for the groups.
Advanced-degreed engineers report work assignments with more state of
art technology than other education groups (X2=10.19 p>.05). Further,
advanced-degreed engineers indicate a closer relationship of

100
their job and personal interest, with non-degreed engineers reporting
the least relationship (X2=15.25 p>.Ol).
Among LOS groups longer term employees report more non-technical
tasks in their work (X2=9.58 p>.05). Engineers with less company
experience consistently report assignments where no technological
change is occurring (X2=18.34 p>.Ol).
TABLE XXVIII
WORK ASSIGNMENTS
Agrees-No Opinion-Disagrees Percentages M S.D.
1. Challenging Work Assigned Independent of LOS 74-20-8 5.28 1.29
2. Include State of Art Technology 70-6-24 4.87 1.51
3. Are of Personal Interest 65-19-16 4.72 1.27
4. Allow Time for Exploring New Ideas 60-4-36 4.30 1.69
5. Involve Technical Tasks 29-14-57 3.43 1.61
6. Stretch Technical Knowledge 53-11-36 4.24 1.52
7. Non Repetitive/Formatted 48-21-30 4.27 1.39
8. Jobs in Area of Technology Change 34-41-26 4.16 1.26
Average Totals 54-16-30 4.44 1.47
Involvement/Communication
Engineers rated the degree of open information exchange among
engineers and management and the extent that project decisions are
decentralized. Engineers gave the highest rating to involvement in
technical decisions relevant to their assignments (86%). They gave
.. - ---_. ----------------------------_._._------------_._-----

101
the lowest rating to the degree of open communication between engi
neers and company management (44%). Sixty-four percent indicated that
engineers have a sense of personal involvement in the company's
future. Seventy-four percent did not feel that competition among
engineers restricted information exchange; 58% indicated that proprie
tary information did not restrict interaction with engineers. Over
two-thirds (68%) indicated that supervisors encourage communication
and sharing of information among engineers.
TABLE XXIX
INVOLVEMENT/COMMUNICATION
Agrees-No Opinion-Disagrees Percentage M S.D.
1. Participate in Decisions Relate to Job Assignments 86-4-0
2. Information Exchange is not Restricted by Excessive Competition Among Engineers 74-12-14
3. Supervisor Shares Information Encourages Communication among the Engi neers 68-11-21
4. Sense of Personal Involvement in Future of Company 64-9-26
5. Information Exchange is not Restricted by Concern for Proprietary Information 58-25-17
6. Communication is Open between Company f4anagement and Engineers 44-15-41
Average Totals 66-13-21
._----------------------
5.37 1.15
5.22 1.38
4.82 1.51
4.57 1.47
4.75 1.34
3.91 1.58
4.77 1.41

102
The LOS groups reported more significant differences than the
education groups for engineer involvement and communication. Consis
tently longer-service employees reported declining levels of
participation in decision-making (X2=10.23 p> .05) and less total
project understanding directed by supervisor (X2=12.28 p> .025).
Additionally, though not significant for this study, engineers with
6-10 years of service had less personal involvement with the company
than engineers with less service and more service than they (X2=9.10
p> .10). Both non-degreed and engineers with bachelor degrees
reported less participation in decision-making than advaoced-degreed
engineers (X2=11.68 p> .025).
Climate
Climate examined the degree that the "atmosphere" of the
organization fosters personal and professional growth, technical
creativity and innovation, and high performance. The highest rating
(77%) went to job security followed by company concern for
professional growth (73%) and a positive attitude toward innovation
and excellence (71%). However, only 59% indicated a high value of
development of engineers. Sixty-one percent indicated that the
organization recognized the technical contribution of its engineers
with 55% reporting that rewards were given to technically competent
engineers.
LOS groups showed a significant difference (p>.05) on the
organization1s value of engineering development (X2=11.02, p>.05).
The 6-10 LOS group accounted for the majority of the difference with a

103
lower perceived value for engineering development. Although not
significant for this study, LOS groups also indicated a difference in
professional standards (X2=8.11 p>.10). Again, 0-5 and 11+ LOS groups
believed that the organization stresses high professional standards
more than the 6-10 LOS engineers.
Education groups showed no significant differences in climate at
the .05 level but showed difference (X2=8.35 p> .10) for the
organization1s
TABLE XXX
CLIMATE
Agree-No-Opinion-Disagree Percentage M SO
1. Provides Employment Continuity 77-17-6 5.27 1.16
2. Concern for Professional Growth 73-9-18 4.91 1.41
3. Encourages Innovation and Excellence 71-11-18 5.02 1.47
4. Utilizes Technical Knowledge Effectively 69-6-25 4.85 1.47
5. Stresses High Professional Standards 67-15-18 4.77 1.30
6. Encourages, Creativity and Growth 61-11-28 4.63 1.57
7. Recognizes of Technical Contribution 61-17-22 4.58 1.39
8. Values Development of Engineers 59-14-27 4.57 1.40
9. Rewards for Technical Competence 55-18-27 4.36 1.43
Total Averages 66-13-21 4.77 1.39
--------------------- ------,-- -'-.-'
104
concern for the growth of engineers. While non-degreed engineers
reported the highest level of organization concern for growth,
advanced-de greed engineers reported the greatest variance. Engineers
with bachelor degrees reported the least organization concern for
development.
Conclusion
A climate for development of engineers stresses several key elements:
1. An overall atmosphere, expectation, and fostering of
innovation, excellence and growth driven by competitive benchmarks
from the market environment. 2. Challenging work that effectively
utilizes the expertise of the individual and increases the
individual's current knowledge base. 3. Performance and reward
structures linked effectively to development and performance i.e.
overall individual competence. 4. Managew~nt and peer relationships . . .... that provide a collegial environment for growth through high
performance goals, sharing of expertise and new information, and
continuous feedback. 5. Opportunities, support and recognition for
development as an integral element of performance.
In this section the investigator examined the work environment
to gain insights about the degree that these elements exi-st. 'Nork
environment elements were examined for differences across education
and LOS groups. The work environment results in this study indicate a
moderate climate with considerable variance for development. The
variance across the factors suggests that the development climate
within the company is inconsistent. While about two-thirds of the
--c-------------_________ ._. ___ . ______ _

105
engineers indicate a positive work environment, consistently 20-30% do
not. This is particularly evident in challenging ~'1ork and re\'4ard and
recognition. Work assignments and organization support for
development show the greatest opportunity for improvement. Peer
support provides a strength in the climate not only for its high
response but for the consistency of response.
TABLE XXXI
WORK ENVIRONMENT SUMMARY
Agree No Opinion Disagree M SO
Peer Support 79 10 11 5.28 1.21
Climate 66 13 21 4.77 1.39
Involvement/Communication 66 13 21 4.77 1.41
Management Support 56 18 26 4.52 1.52
Work Assignments 54 16 30 4.44 1.47
Company Support 49 20 31 4.26 1.54
Total Averages 62 15 23 4.67 1.42

106
The greatest degree of significant differences for education
groups occurred in the organization support factor with variance
related to technical equipment and facilities, financial support for
professional meetings, career guidance and opportunity for job
rotation. Management support differences for education groups
involved opportunity for technical presentations and independent
reading during work hours. Work assignment differences focused on
state of art technology and personal interest. Peer support
differences occurred with sharing ideas and providing feedback.
For LOS groups key differences in work assignments involved the
amount of non-technical work assigned and the degree of technological
change occurring in product area. LOS groups showed differences in
climate as far as the organization value of the development of
engineers and management support for attending professional meetings.
Significant differences in supervisor sharing of information occurred
in LOS groups, with both education and LOS groups showing differences
for participation in decision making. Overall more cumulative
differences were observed across education groups than LOS groups.
Rewards
Reward Preferences
The reward environment and its relationship to development was
explored more in depth. Engineers selected ten reward preferences and
rated how important the rewards were to them. Respondents chose
salary and merit increases (87%), achievement from work (83%),
----------------------_._-----.-._--.-

107
advancement (76%), recognition (76%) and challenging work (69%) as
most important (Table XXXII). Just over 50% of the respondents
selected self-initiative (58%), supervisor relations (56%), job
security (54%), peer relations (53%), and encouragement or ability
(52%) as important rewards. All other rewards were selected by less
than 50% of the respondents. As potential rewards were selected less
often, their overall importance to respondents also declined.
By education and LOS groups the selection of some rewards dif
fered significantly. Educational group differences occurred for
customer satisfaction (X2=8.99 p>.05), challenging work assignments
(X2=8.40 p>.05), job security (X2=10.34 p>.025) and support for writ
ing technical articles (X2=8.81 p> .05). Customer satisfaction was
less important to advanced-de greed engineers, while most important to
non-degreed engineers. Engineers with bachelor degrees selected chal
lenging work more often than non-degreed and advanced-degreed engi
neers. Job security was selected more often by non-degreed engineers
than degreed engineers. Support for writing appealed to advanced
degreed engineers more than bachelor and non-degreed engineers.

108
TABLE XXXII
RANKING OF REWARD PREFERENCES
Percentage How Important Important Mean S.D.
1. Salary/Merit Increase 87 5.80 1.17 2. Achievement 83 6.13 1.03 3. Recognition 76 5.66 1.18 4. Advancement 76 5.86 .99 5. Challenging Work 69 5.79 1.18 6. Initiative in Work 58 5.57 1.19 7. Positive Supervisor
Relations 56 5.39 1.28 8. Job Security 54 5.49 1.40 9. Positive Peer Relations 53 5.61 1.21 10. Encoragement of Innovative/
Ability 52 5.60 1.73 11. Customer Satisfaction 48 5.66 1.12 12. Development Support 44 5.39 .93 13. Knowledge of Whole Project 34 5.21 1.12 14. Major Project Responsibility 33 5.26 1.34 15. Leading Edge Tech.
Assignment 32 5.29 1.31 16. Company Reputation for
Technical Excellence 24 5.13 1.13 17. Consultant Role Internal 20 4.74 1.34 18. Support for Prof.
Memberships 19 5.00 1.27 19. Technical Library 18 4.93 1.23 20. More Non-work Related Time 16 4.86 1.57 21. Mentor Rol e 14 5.00 1.30 22. Support for Publication 7 4.70 1.58
In the LOS groups career employees (11+ years) selected job security
significantly more often (X2=12.32 p>.Ol) than other LOS groups with
6-10 year service engineers selecting it least often.

109
In contrast to differences across education and LOS groups for
selecting rewards, these same groups show no significant differences
(p=~.05) in the value of the ten most preferred rewards.
Relationship of Preferred Rewards to Development
The majority of engineers indicate that they would receive
valued rewards if their knowledge and skills remained the same for the
next two years (Table XXXIII). An average of twenty-one percent
reported strong opportunity for rewards independent of development
with an average of 59% demonstrating a moderate belief of opportunity
for rewards without development. Only 20% across key rewards
indicated little opportunity for rewards without development. On the
other hand, engineers consistently believed that the opportunity for
valued rewards improved if development occurred (TABLE XXXIV).
When asked if engineers would receive their preferred rewards if
technically up-to-date, significant differences occurred for 3 of the
10 most preferred rewards in LOS groups. Consistently, longer-service
employees indicated that they had less chance of being recognized
(X2=10.86 p>.05), receiving advancement (X2=11.31 p>.05), and earning
salary and merit increases (X2=19.51 p>.OOl). Also, a sense of
achievement from work, though not significant, showed the same
declining trend over time (X2=9.07 p>.10). These data suggest that
three key rewards of engineers are less related to development as
service company increases. Education groups showed a significant
difference (X2=13.41 p>.Ol) of the relationship of development to

110
to challenging work with degreed engineers indicating that challenging
work would be available more often if they were technically current
than non-degree engineers.
TABLE XXXIII
OPPORTUNITY FOR REWARD/SAME SKILLS
Percentage Rewards High Moderate Low M SO
% % %
1. Salary/Merit Increase 17 64 19 3.94 1.58
2. Achievement 22 58 20 4.13 1.70
3. Recognition 15 61 26 3.68 1.63
4. Advancement 13 58 29 3.62 1.62
5. Cha 11 engi ng Work 17 56 25 3.72 1.59
6. Initiative 25 57 19 4.21 1.67
7. Supervisory Relations 28 56 16 4.30 1.73
8. Job Security 25 62 14 4.36 1.57
9. Peer Relations 40 53 6 4.85 1.51
10. Encouragement of Innovative Ability 11 60 29 3.52 1.60
Average Totals 21 59 20 4.04 1.46
----------------- .-.•. -- ......

111
TABLE XXXIV
OPPORTUNITY FOR REWARD/IMPROVED SKILLS
Rewards High Moderate Low M SO % % %
1. Salary/Merit Increase 55 40 6 5.41 1.49
2. Achievement 65 34 2 5.68 1.18
3. Recognition 55 39 6 5.36 1.42
4. Advancement 53 39 9 5.24 1.56
5. Cha 11 engi ng Work 56 39 4 5.43 1.31
6. Initiative 60 37 3 5.55 1.32
7. Supervisory Relations 61 34 5 5.43 1.45
8. Job Security 52 43 4 5.39 1.39
9. Peer Relations 64 33 3 5.60 1.23
10. Encouragement of Innovative Ability 49 44 7 5.01 1.53
Average Totals 57 38 5 5.41 1.39
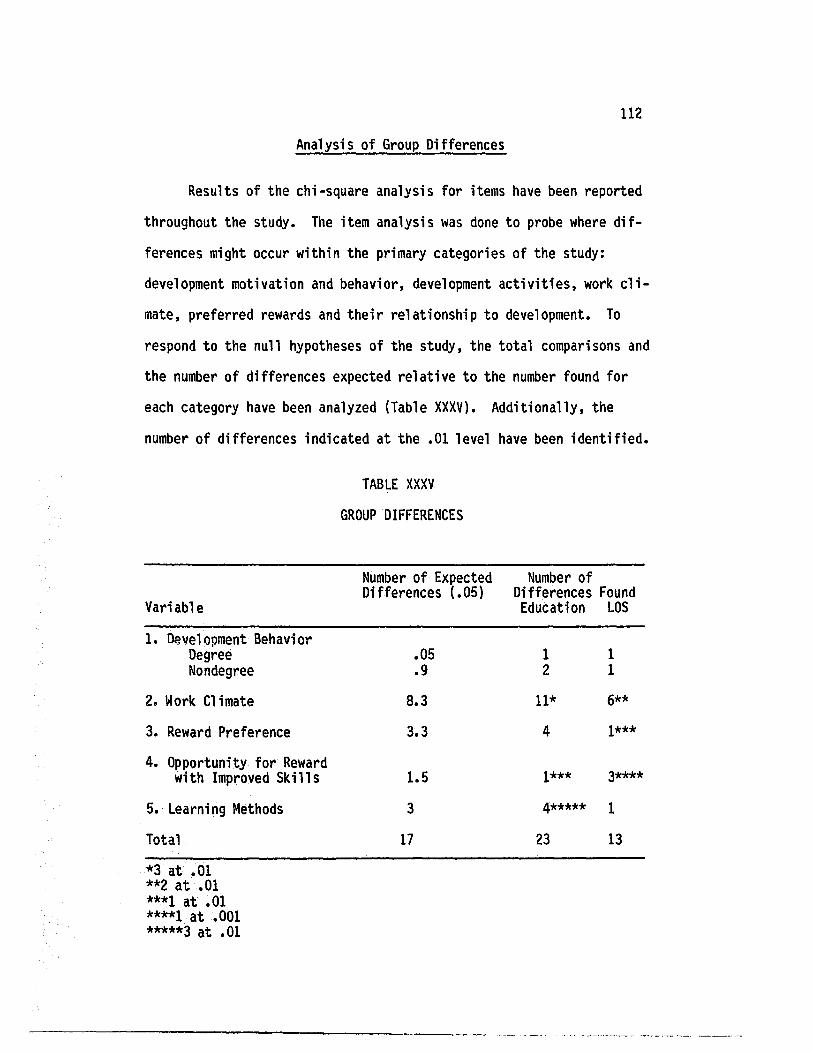
112
Analysis of Group Differences
Results of the chi-square analysis for items have been reported
throughout the study. The item analysis was done to probe where dif
ferences might occur within the primary categories of the study:
development motivation and behavior, development activities, work cli
mate, preferred rewards and their relationship to development. To
respond to the null hypotheses of the study, the total comparisons and
the number of differences expected relative to the number found for
each category have been analyzed (Table XXXV). Additionally, the
number of differences indicated at the .01 level have been identified.
Variable
1. Development Behavior Degree Nondegree
2. Work Cl imate
3. Reward Preference
4. Opportunity for Reward with Improved Skills
5. Learning Methods
Total
*3 at .01 **2 at .01 ***1 at .01 ****1 at .001 *****3 at .01
TABLE XXXV
GROUP DIFFERENCES
Number of Expected Differences (.05)
.05
.9
8.3
3.3
1.5
3
17
Number of Differences Found Education LOS
1 1 2 1
11* 6**
4 1***
1*** 3****
4***** 1
23 13

113
Development Behavior
The data show that the number of differences found for develop
ment behavior exceed what was expected for .05 significance for educa
tion and LOS groups but only modestly so. No differences occurred at
the .01 level. Therefore, the null hypotheses for development
behavior for both LOS and education groups are accepted.
1,.1 ork Cl i mate
Education groups exceed the number of expected differences for
.05 level of significance with three differences reported at the .01
level of significance. However, since the number of differences
exceeding that expected were few the null hypothesis for education
groups and work climate is accepted. Length of service groups had
fewer differences than expected; therefore, the null hypothesis is
accepted for work climate and length of service groups.
Reward Preference
The number of differences found for education groups exceed that
expected for .05 level of significance while differences for length of
service groups did not. Nevertheless the differences exceeding that
expected for education groups were few in number, the null hypotheses
for reward preferences are accepted for education groups and accepted
for both education and length of service groups.
Opportunity for Reward with Improved Skills
The number of differences found for length of service groups
exceed that expected, while the number for education groups do not •
. - -.~--.... "'--' ...... -~ ... --.-~ -.... -.- ."-',.-.- ... -.~ ..... _., .-.---.--~
114
The number exceeding that expected for length of service groups, how
ever, were insufficint to reject the null hypothesis. Therefore the
hypotheses for opportunity for reward with improved skills for educa
tion and length of service groups are accepted.
Learning Methods
The number of differences for preferred learning methods by
education groups exceed that expected with the majority of difference
occurring at the .01 level. Since only one difference exceeded that
expected, the null hypothesis is accpeted. Length of service groups
report fewer differences than expected; the null hypothesis is also
accepted for preferred learning methods of length of service groups.
---------------------------- -.-._-_.

CHAPTER V
SUMMARY, CONCLUSIONS, RECOMMENDATIONS
Introduction
Present and future organizations increasingly confronted by
dynamic, uncertain environments must develop and maintain adaptable,
responsive, and flexible structures and processes to survive in an era
of rapid, uneven change. Continuous change and renewal will determine
the survivors--those organizations that recognize and accept the chal-·
lenge of IIhuman systems in transition ll (Lippitt, 1982). Human
resource development at individual, group, and organizational levels
will provide the capability of organizations to complete the necessary
and ongoing transformation of the late 20th and early 21st century.
Knowledge obsolescence, the focus of this study, is but one of
the challenges confronting today1s organizations. Knowledge and
skills come to organizations through people--individuals whose knowl
edge and skills contribute to the achievement of organizational objec
tives. With rapid change, it is increasingly difficult to forecast,
to develop and to integrate the knowledge and skills needed to achieve
changing organizational objectives.
While development of organizations in the past has focused pri
marily on group and organizational processes to improve productivity
-------------------------- .. -.. -.. "-_.,

116
and performance, the impact of knowledge obsolescence on organization
al performance, productivity, and future capability now brings indi
vidual development to the forefront. With essential knowledge and
skills changing rapidly, the liability to the organization of not
managing knowledge development increases exponentially. Work design
and organizational programs can only motivate, optimize and synergize
the relevance and quality of knowledge and skills possessed by indi
viduals. Thus, continuous individual development forms the foundation
for subsequent group and organizational development strategies.
Organizational leaders must recognize that the degree of knowl
edge development, like performance in general, is influenced not only
by individual attitude and ability but by the nature of work and the
total organizational environment. Thus, knowledge development occurs
not in a vacuum but in concert with all other conditions and rela
tionships that the individual and organization share.
Summary
Purpose
The purpose of this study is to investigate knowledge obsoles
cence inan organization influenced by rapid change in its environ
ment. Key assumptions of the study emphasize that people are assets
to organizations and that people exert effort for the organization in
exchange for valued rewards. Therefore, the member-organization rela
tionship is mutually beneficial, requiring both organization and
member to be sensitive and responsive to demands, constraints, and op-
-------------------------------_._-_ .. _---_. __ ._--_._---

117
portunities. Finally, the study assumes that a holistic approach to
studying organizational issues captures the complexity and interde
pendence of organizational subsystems that in turn influence the
achievement of organizational objectives. (See Figure 7).
Inputs
Environment Resources History
Tranformation process
Informal organization
Individual
Feedback
Output
Organizational Group Individual
Figure 7. A systems model of organizational behavior (Nadler & Tushman, 1980).
The study has three key foci: 1) the current knowledge founda
tion of the organization that is reflected by employee educational
background and organizational experience, 2) the extent that the
knowledge is continually being improved, and 3) the extent that the
organization sustains a positive development climate for its members.
Secondarily, the study examines 1) current, as well as prefer
red, development methods, 2) reward preferences and their relationship
to development, and 3) the influence of education background and
length of service on development behavior.

118
Methods
Data were collected through a random sample of 550 nonmanager
engineers. Additional information was obtained from the Human
Resource Information System (HRIS). The questionnaire consisted of
individual background information, a modified version of the Work Des
cription Questionnaire for Engineers (WDQE), and supplemental reward
and development sections. Key work environment factors investigated
were: 1) organization support, 2) management support, 3) peer sup
port, 4) communication and involvement, 5) work assignments, and 6)
overall climate. Responses were obtained from 320 nonmanager engi
neers. A chi-square analysis tested for differences among education
and length of service groups.
Findings
The study is guided by five central questions. Each question is
presented followed by the key findings related to the question • . Question 1. What is the current knowledge base of organiza-
tional members?
The examination of knowledge foundations suggested that an
actual engineering population has not only different functional,
knowledge discipline backgrounds, but also substantially different
degrees of formal knowledge development. While 50% had bachelor
degrees in engineering and 20% had advanced degrees, 30% reported no
degree in engineering or engineering-related disciplines. Educational
differences were present across all age, length of service and sex
groups. Additionally, engineers differed significantly in their

119
experience with the organization. While organizational experience
ranged from 1 to 34 years, it averaged eight years with 46% reporting
fewer than 5 years experience with the organization. Fifty-four per
cent of the bachelor-degreed engineers and 65% of the advanced-degreed
engineers reported five or fewer years of service with the organiza
tion.
Question 2. To what degree do members update their knowledge?
The data suggest that knowledge foundations are updated on a
limited basis by degree education. Twenty-two percent of the respon
dents reported working on degrees. Those engineers with bachelor
degrees and 5 or fewer years of service reported the highest percent
age of degree development activity. Advanced degreed and career engi
neers (11+ LOS) reported the least amount of degree development
activity. Since only one-fifth of the engineers were actively
involved in degree programs, one can conclude that continuing educa
tion for engineers must come from non-degree-related development.
This would be expected for engineers with advanced degrees and perhaps
the majority of those with bachelor degrees.
Engineers reported educational development in non-degree related
courses and seminars, independent reading, and networking. Engineers
averaged ~ course per year, with more engineers taking internal
courses than external ones. Advanced-degreed engineers reported the
highest nonparticipation in internal courses and seminars. Nonparti
cipation in courses and seminars outside the company remained con
stant, independent of length of service and education. Significant to
a discussion of knowledge obsolescence is the percentage of engineers
120
who reported ~ course and seminar activity in the past two years
(20%).Even though reading is reported as the most prevalent and
effective method currently used for development, the majority reported
an average reading level of 0-2 hours weekly. Degreed engineers
reported significantly more reading behavior than non-degreed
engineers, while no differences occurred for length of service groups.
Networking results show that the immediate work group serves as
the primary basis for new information independent of education and
length of service. Information flow from other parts of the company
and from outside the company is increasingly restricted. In summary,
the non-degree development pattern of engineers in this study is char
acterized by one course or seminar a year, 2-4 hours of independent
reading per week and discussions within the work group.
Question 3. What methods do members prefer to update their
knowl edge?
Engineers gave moderately high ratings to several development
methods. The most effective methods were: 1) a challenging job, 2)
reading, 3) earning an advanced degree, 4) taking courses and semi
nars, 5) working on interdisciplinary teams and 6) internal network
ing. Education groups differed significantly on two primary methods,
reading and interdisciplinary teams. No significant differences oc
curred in selection of key development methods by length of service
groups.
Question 4. To what degree do the organization's structure and
processes (task, informal organization and formal organization) pro
vide focus and incentive for individual development?
--------------------~ .. --........ ,.", .. --.. '

121
Engineers indicated that time, cost, management and work demands
were the primary barriers to development within the organization.
Peers received the highest positive response (79%) for support, fol
lowed by engineer involvement/communication and general climate at 66%
and 62% respectively. Management and organizational support as well
as work assignments were rated modestly with 56%, 54%, 47% positive
responses. In general, the development climate was moderate.
While engineers identified challenging work as the most effec
tive development method, only 53% reported having jobs that stretched
their knowledge. Even though 66% of the engineers indicated that
managers do set performance goals, provide performance review for
continuous improvement, and reward performance, just 40% reported
being recognized and rewarded for development. Two-thirds of the
engineers responded positively to communication and involvement in
decision-making; yet, only 44% indicated that communication is open
between organizational management and engineers. Additional
inhibitors of the organization to development included lack of goal
clarity, career guidance, rewards and recognition for development and
performance, and opportunity for job rotation.
The reward climate and its relationship to development was
explored more in depth. The rationale for examining the linkage of
individual values, behavior and rewards is supported by expectancy
theory (Vroom, 1964) which hypothesizes that the motivation to engage
in a particular activity will occur when an individual·s expectancy
perception is high, when the individual believes that effort will
result in t~e desired performance, and when the performance is linked
---------------------_ .. ---_ .. ------- .. _-- -. '" -.-_ .. -- _._--- -_ ..•.. __ .... _ ... __ ._ .... -

122
to a valued reward. Though engineering groups showed differences in
preferred rewards, key rewards were equally valued by education and
length of service groups. Primary rewards selected included salary
and merit increases, achievement, advancement, recognition, and
challenging work. Secondary rewards were self-initiative, supervisor
relations, peer relations, job security and encouragement of ability.
In the primary rewards, education groups showed significant
differences for challenging work, while length of service groups did
not. Also, career- and non-degreed engineers reported higher impor
tance for job security than other education and length of service
groups.
The majority of engineers reported opportunity for valued
rewards independent of development, even though perceived opportunity
for rewards did increase with development. Twenty-one percent
reported a high opportunity for rewards independent of development
with an additional 59% reporting a moderate opportunity for rewards
independent of development. High opportunity for reward shifted from
21% if skills remained the same to 57% if skills were improved.
Longer-service engineers reported less opportunity for recognition,
advancement, and salary/merit increases even with improved skills than
other length of service groups. Degreed engineers linked opportunity
for challenging work with increased development more than non-degreed
engineers.
Question 5. To what degree are the focus and support for de
velopment provided independent of members' current education
background and experience within the organization?

123
Null hypotheses were tested examining differences for education
and length of service groups for key areas of the study. They were:
1. All education and LOS groups will report the same degree of
current development behavior. (.05)
2. All education and LOS groups will report equivalent work
climates. (.05)
3. All education and LOS groups will value the same rewards.
( .05)
4. All education and LOS groups will report the same
opportunity for valued rewards if technically current. (.05)
5. All education and LOS groups will value the same
developmental activities. (.05)
Education groups exceeded the number of differences expected for
development behavior, work climate, reward preference, and learning
methods (p > .05). However, the number of differences exceeding that
expected were few. Therefore, all null hypotheses for education
groups are accepted.
Length of service groups exceeded the number of differences
expected for development behavior and opportunity for reward with
improved skills (p > .05). Again, the number of differences beyond
that expected were few; thus, the null hypotheses for length of
service groups are also accepted.
Conclusions
An essential assumption of this study is that knowledge develop
ment occurs within and is influenced by the task, i.e., the work to be
------------------------------------- "---.-"' ---

124
done, as well as by the informal and formal structures of the organi
zation. These are, in turn, influenced by members' needs and values.
Given this dynamic context for knowledge development, the following
conclusions are made:
1. Human resource development, to be effective and value-added
for the organization, must be integrated with the ongoing
strategic planning process to ensure development of goal
clarity, optimization of development resources, and future
availability of requisite, quality knowledge and skills.
2. Challenging work is critical to continuous development,
since it is the primary focus of the individual organization
contract, an effective development method, and a primary,
intrinsic reward.
3. People in work organizations are a heterogeneous population
showing differences in educational background, organization
experience, education preferences and behavior, and reward
preferences that in turn influence continuing education.
4. A stronger link between performance, reward and development
systems would increase the incentives for individual de
velopment.
5. Increased integration of work and development could increase
focus for and participation in development activities.
6. Work climate influences educational development and should
be systematically monitored by organizations to ensure
support for development goals.
--------------------- --- .. -".--- . ----.

125
7. Degree and non-degree as well as directed and non-directed
learning opportunities are needed to meet the development
preferences and needs of a heterogeneous population.
8. Human resource information should include a database of edu
cational background and continuous development activities as
well as key transferable skills and primary technologies of
the organization to assist in determining present and future
organizational capability.
Importance of Study
HUman Resource Management
Individual development is a logical result of the human resource
planning activity within an organization. Glueck (1982) defines human
resource planning as a process by which management determines how the
organization should move from its current human resource position to
its desired position. Human resource goals must be consistent with
organizational objectives, environmental conditions, and the attitudes
and skills of employees. Thus, human resource planning works to
achieve an optimal match between employee knowledge/skills and the
work to be done.
This study supports the importance of strategic human resource
planning for development to minimize the threat of knowledge obsoles
cence. Combatting knowledge obsolescence means not only identifying
knowledge/skill requirements and shifts, targeting activities and pro
grams to ensure a bank of needed skills, but also assessing and moni
toring of policies and practices, work design, skill utilization, and

126
work climate. Effective job design, performance and reward programs
contribute strongly to long-term human resource development. These
must operate in concert to provide a strong, positive development cli
mate. Systematic monitoring and adjustments are important to ensure
ongoing effectiveness.
The study suggests that managers consider the diversity of
member needs and values when designing structures and processes to
support development. For example, while extended schooling may sup
port development for individuals in early careers, focused job-related
nonschooling methods may be preferred by longer-service employees.
The study also shows that members are motivated by different rewards.
These preferred rewards, many of which are intrinsic to the work it
self, need to be available for both performance and learning. Indeed,
continuous learning may be an essential performance indicator of
dynamic, changing organizations.
The study also has implications for hiring and integration of
new employees. Organizations must set prehire expectations for con
tinuous development as an essential element of the employment con
tract. New employees should not only be carefully selected to match
present critical skill needs, but screened for their motivation for
continuous improvement as well as for self-directed learning skills.
Also, critical to hiring and employee socialization is an orientation
to changing work roles and the understanding that work success will be
less determined by continuous upward mobility, and more by varied,
functional and crossfunctional career experiences. With dynamic job
requirements and changing work roles, continuous development of new
----------------_._---_ .•.. _-- ... -...... .

127
marketable and transferable skills may be the only assurance of career
potential within and across a dynamic organization. The importance of
extensive speciJlized experience may give way to generalized expertise
as careers are governed by the ability to add-value and to contribute
as opposed to tenure, longevity and fixed specialized career paths
within organizations.
Human Resource Information Systems
Human resource information systems playa critical role in
establishing databases necessary in assessing human resource
performance and capability. This study suggests that such a database
should include individual files for the following:
a. Educational background and specializations
b. Work experiences
c. Performance results
d. Reward patterns
e. Development behavior
(1) additional education (specializations)
(2) training including cross-functional development
Without such basic information, the organization is limited in
assessing future capability, optimally matching current capability to
near-term objectives, and targeting development for long-term objec
tives. Such a database also provides management opportunity to moni
tor the consistency of performance, development and reward systems.

128
Educational Theory and Practice
Organizational development is as critical for modern educational
institutions to become adaptive and responsive as for other organiza
tions currently undergoing dramatic change. Effectiveness must in
clude the ability of educational organizations to adapt to the envi
ronment, to set and to achieve goals, to maintain internal congruence,
and to create and maintain motivational and value systems (Hoy &
Ferguson, 1985). Culbertson (1983) states that "successful instruc
tion and goal attainment will miss the mark if the outcomes toward
which instruction is directed are societally obsolescent·· (p. 282).
Thus, one challenge for educational administrators is to assess the
degree to which educational institutions pursue objectives related to
the declining industrial society rather than the needs of the expand
ing information society.
This study suggests that today·s adaptive, responsive organiza
tions can combat knowledge obsolescence and sustain vitality through
integration of reward, performance and development systems that are
flexibly administered to accommodate individual differences and are
systematically monitored to ensure effectiveness. The study contri
butes to educational administration by increasing the awareness of
these critical elements related to knowledge obsolescence and con
tinuous individual development.
On the other hand, the study raises questions about the viabili
ty of schools and universities without ongoing improvement and inte
gration of human resource systems including selection, performance,
development, and rewards. The study provides an integrated systems
--------_ .. __ .... --.-- . --...

129
model for the study of organizational issues as well as an initial ap
proach for examining knowledge obsolescence in an organization that
could be applied to human resource management in eudcational organi
zations.
Such an approach is consistent with the product-accountability
model and the techno-structural model of organizational development
recommended by Schmuck and Miles (1971) for broader application and
research in educational environments. The product-accountability
model focuses on assessment of objectives and results that then are
used to establish development goals. The techno-structural model
involves examination of redesign, staffing patterns, student flow, and
teaching structures. A review of the state of art in organizational
development in schools (Fullan & Miles, 1978) shows that the majority
of organizational development efforts in schools focus on communica
tion, problem solving and group functioning as opposed to comprehen-,
sive school improvement and accountability.
Secondly, the criticalness of lifelong learning, the learning to
learn concept, as a goal of education has been recognized as essential
for life in modern society (Cropley, 1979; Lengrand, 1979; Gelpi,
1979; Lewis, 1983). Thus, the issue raised by knowledge obsolescence
extends beyond what is relevant curriculum to whether the methods of
schooling enable individuals to become lifelong leaners. Critical are
the processes that strengthens the individual's ability to take charge
of life situations, to manage continuous change, to create a "steady
state II when change is rampant and to remain effective even when the
environment is uncertain.
----------------------------_ .. _--- ...... -.- --.'

130
Further, as the world moves to a knowledge-based competitive
strategy, thinking and critical analysis become necessary for indi
vidual survival where innovation emerges from difference, disagree
ment, confrontation, heterogeneity and diversity of thought and
opinion. A UNESCO report (Charters, et al., 1972) on the schools
influence of students' desire to learn and to continue learning states
that a major goal of education is to produce learners who assume
responsibility for initiating and directing their own education. It
suggests that clues about motivation for continued learning could be
ascertained from studying adult participation and learning activities
that then could be translated to the school setting. The UNESCO
report chall enges the thought that educati on is cons; dered the' same as
schooling saying that lithe process of learning has become encapsulated
in institutions," with the assumption that education begins with
schools, occurs in a school isolated from the community and ends with
schooling. However, the report notes that these assumptions are less
appropriate today as new information about the formative years before
schooling emerges and the fallacy of schooling as preparation for life
is substantiated in real time with rapid changes in society.
Consistent with the thinking of the UNESCO report, one could
argue that educational administration and research should include an
investigation of the degree to which adults show patterns of continued
learning, what those patterns are, and the degree to which adults
remain dependent on "schooling" as a primary means of development. If
educational institutions, as a part of their central mission, are to
prepare youth to be lifelong learners, it appears that more informa
tion ;s needed on the persisting problem of knowledge obsolescence.
------------------------_ .. _-.... - . -_ .... - ." , .. __ .... " ..... -.' '-" ..... -.- .. _ ...... _---_._-

For lifelong learning to be optimized it has been suggested
(Cropley, 1979) that more emphasis be given to the following:
1. Recognition of a variety of learning styles.
131
2. Increased role of learner in the learning process including
initiative and control rather than dependence on the
teacher.
3. Greater recognition of the value of informal learning as
complementary to traditional classroom instruction.
4. Greater emphasis on flexible and adaptive structure, con-
tent, and operation of learning services.
5. Greater co-ordinating among various educational agencies to
which the individual is exposed.
6. Closer linkage between schools and community.
7. Greater. conviction that systematic learning is a permanent
need during the whole of a person's life as a result of
continuous new developments in technology, work, human rela-.
tionships, and institutions.
8. Increased understanding that "all educational trends and
practices ••• are not isolated, independent and without rele
vance to each other, but correspond in each case to one
aspect of the overall innovative pattern imposed by modern
conditions on the 'one' educative and learning process ••• 11
[xi].
Thus, lifelong learning is facilitated by appropriate support
aimed at increasing an individual's interest and capacity in lifelong
learning that should be supported by educational practices in

132
schools. Finally, it is suggested that the learning in schools and
universities should be closely linked with learning in non school
settings (Cropley, 1979), that the analysis of the production sector
is therefore central to a discussion of lifelong education (Gelpi,
1979), as changes in the nature of work are key to the transformation
of education, and that the evaluation of schools must include their
contribution to adult learning patterns. Thus, this study in examin
ing learning in a nonschool setting seeks to provide insight into the
contribution that educational institutions could make as infrastruc
ture to lifelong learning behavior patterns that provide the skills,
attitudes, and motives necessary for self-directed learning.
Thirdly, with an increased understanding of current work envi
ronments, educational leaders can better clarify their roles in
education-industrial partnerships that are currently being formed as a
partial response to the problem of knowledge obsolescence and scarce
resources for development .within both educational and industrial
sectors.
Electronics Industry
The electronics industry employs engineers whose knowledge and
skills are markedly affected not only by rapidly changing technol
ogies, but by shifts in market demands and opportunities. In turn,
electronic companies for innovation, design, and development of pro
ducts and services are dependent on engineers with critical technical
skills. Concern about employment of engineers has less to do with the
number of engineers available in the marketplace and increasingly more
-_. - ._-------------------. __ ... __ ............. -_._ ...... _ .. _ ... _._ .. _ .. _._---.

133
to do with engineers who have appropriate knowledge and experience in
emerging technologies. The volatile nature of technology and markets
in the electronics industry suggests that these companies could
benefit from understanding the issues and challenges of managing
knowledge obsolescence in engineers in particular, and in their
dynamic work force in general. Human resource planning and develop
ment systems that are tightly linked to strategic and operational
plans appear imperative to the management of engineers in the elec
tronics industry. Employment forecasting, human resource inventory
ing, and development form the core of ongoing activities that may
ensure availability of needed, quality skills. Since development is a
precursor to effective application, a proactive approach could
minimize knowledge obsolescence.
The issues and challenges that have been raised by this study
include:
1. The differences among engineers that influence development
and performance behavior.
2. The integration of strategic business planning with stra
tegic employee planning, including availability, skill mix,
development and motivation issues.
3. The influence of the work environment on development and
performance behavior.
4. The needed balance between near-term performance and 10ng
term capability.

134
Recommendations for Further Research
The present exploratory study of knowledge obsolescence in a
dynamic organizational context raises more questions, perhaps, than it
answers for organizational leaders whose organizations survive solely
or in part by human-intensive, knowledge technology. Thus, continued
research into the management of knowledge obsolescence, particularly
through additional case studies of organizations, could increase both
awareness and understanding of the dynamics of knowledge obsolescence
in organizations. In addition to organizational case studies, the
following research areas are recommended:
1. A study of manager attitudes toward development of engineers
as well as their current methods and incentives, could
providecritical insights to conflicting organizational
goal s.
2. Since challenging work has consistently emerged as central t
development, research defining the elements of challenging
work for engineers could add value to work design research a
well as methods to knowledge development.
3. A study of the purpose, values, and culture of the
organization in relation to employee development could
provide insights into barriers that inhibit development
within the organization.
4. Continued investigation into the influence of educational
background, length of service, as well as other individual
variables under the influence of the organization could
increase the understanding of relevant individual variables

135
in a human resource context where changing demographics,
values, and needs and preferences influence both performance
and development.
5. Similar studies could be conducted with other job families
whose work is knowledge-driven, since the numbers of
knowledge workers are increasing and therefore will have a
greater impact on the effectiveness of more organizations •
. ~---------•... -.. --.. '.--.,- ........ "-"--' .... - .... _.-._. __ . __ .- '---' .'-

BIBLIOGRAPHY
Adams, J.A. (Ed.). (1984). EEs on lifelong learning. IEEE Spectrum, ~, 92-98.
Alpander, G.G. (1982). Human resources management planning. New York: American Management Association.
Argyris, C. (1957). Personality and organization: The conflict between the system and the individual. New York: Harper and Brothers.
Arvey, R.R., & Neel, C.W. (1976). Motivation and obsolescence in engineers. Industrial Gerontology, 1, 113-120.
Avciding Obsolescence: Guidelines for engineers and managers. (1978). Design News, 34, 144-146.
Bailyn, L. (1980). Livin~ with technology: Issues at mid-career. Cambridge MA: The M T Press.
Bailyn, L. (1982). Career fulfillment strategies for mature engineers. Computer Design, ~, 73-74.
Bailyn, L. (1982). Resolving contradictions in technical careers or what if I like being an engineer? Technology Review, 85, 40-47.
Baldridge, J.V., & Deal. T. (Eds.). (1983). The dynamics of organizational change in education. Berkeley, cA: McCutchan.
Barrett, G.V. (1970). Combattin9 obsolescence using perceived discretancies in job expectatlons of research managers and scientlS s. New York: Rochester Onlverslty, Management Research Center. (ERIC Document Reproduction Service No. ED 047 250)
Benton, J~B. (1973). I~ana~nt the organizational decision process. Lexlngton, MA: D.C. a h.
Best, F. (1984). Technology and the changing world of work. The Futurist, 18, 61-66.
137
Blood, J.W. (Ed.). (1961). Optimum use of engineering talent. Cambridge, MA: Riverslde Press.
Blumberg, M., & Pringle. C.D. (1982). The missing opportunity in organizational research: Some implications for a theory of work performance. Academy of Management Review, I, 560-569.
Braddock, D. (1983). Engineers--Higher than average risk of obsolescence. Occupational Outlook Quarterly, 27, 9-11.
Brookfield, S. (1984). Self-directed learning: A critical paradigm. Adult Education Quarterly, 35, 59-71.
Burack, E.H. (1972). Meeting the threat of managerial obsolescence. California Management Review, l!, 83-90.
Burack, E.H., & Pati, G.C. (1970). Technology and managerial obsolescence. Michigan State University Business Topics, ~, 49-56.
Burack, E.H., & Smith, R. D. (1982). Personnel management: A hUman resource system approach. New York: John W,ley & Son.
Burke, R.J. (1969). Effects of aging on engineers' satisfaction and mental health: Skill obsolescence. AcademY of Management Journal, 1£, 467-486.
Burke, W.W. (Ed.). (1978). The cutting edge: Current theory and practice in organization development. La Jolla, CA: University Associ ates.
Burnet, G. (1979). Engineering education: Colleges can't do it all. Machine Design, 51, 138-45.
Charters, A. N., Blakely, R.J., Lally, J.R. Lay, M., Porter, L., & Copeland, H. (1972) •. The influence of sCl'lools on continuing education in the United States of America. In The school and continuing education: Four studies (pp. 100-168). Paris: UNESCO.
Counteracting obsolescence in employees and organizations. (1979). Training, ~, 80-82.
Criss, J.e. (1973). The out-of-date employee in an up-to-date world. Journal of Systems Management, 24, 37-41.
-------------------------
138
Cropley, A.J., (Ed.). (1979). Lifelong education: A stocktaking. Hamburg, Germany: UNESCO lnstltute for Educatlon.
Culbertson, J.A. (1983). Leadership horizons in education. Educational Administration Quarterly, 19, 273-296.
Dalton, G.W., & Thompson, P.H. (1971). Accelerating obsolescence of older engineers. Harvard Business Review, 49, 57-66.
Dalton, G.W., Thompson, P.H., & Price, R.L. (1977). The four stages of professional careers--A new look at performance by professionals. Organizational Dynamics, ~, 19-42.
Danielson, L. E. (1960). Characteristics of engineers and scientists. Ann Arbor, MI: University of Mlc~igan.
Davis, L.E. (1977). Evolving alternative organization designs: Their sociotechnical bases. Human Relations, 30, 261-273.
Di ebol d, J. (1984). _Ma~k.;,;.i.;..n~~~~~";;';";"Tr-~;...;;;;..r;~~....;;.;;;.~..;;,.;.;.;~ of innovation for e Schuster.
DiMarco, N. (1980). Worker motivation: Age difference in engineers. ISA Transactions, 19, 37-42.
Dubin, 5.5. (1972). Obsolescence or lifelong education: A choice for the professional. American Psychologist, 27, 486.
Dubin, 5.5. (1917). A learning model for updating older technicai and professional persons. ASEE Continuing Engineering Studies Division Newsletter, I, 1-7.
Dubin, S.S. (19B1). Applying motivational knowhow encourages engineers to learn. EON Design Management, 26, 165-67.
Dubin, 5.5. (1981). Managers can make it easy for engineers to keep up to date. EON Design Management, 26, 125-26.
Dubin, 5.5., & Cohen, D.M. (1970). Motivation to update from a systems approach. Journal of Engineering Education, 60, 366-368. . ---
Dubin, 5.5., Shelton, H., & McConnell, J. (Eds). (1974). Maintaining professional and technical competence of the older en~1neer-Engineering and psycholo~ical aspects. Washington, 0 : American Society for Englneering Education.
Dyer, L. (1984). Human resource planning at IBM, Human Resource Planning, £, 111-125.
Emery, F.E., & Trist, E. (1965). The causal texture of organizational environments. Human Relations, 18, 21-31.

(1984) • ineers.
139
Ferdinand, T.N. (1966). On the obsolescence of scientists and engineers. American Scientist, 54, 45-56.
Fitch, D. (1982). Increasing froductivity in the microcomputer age. Reading, MA: I Add1son:Qes eye
Flannery, W.T. (1983). Performance appraisal defines career expectations. EON Design Management, 28, 227-229.
Fluke, J.M. (1981). Training and retaining EEs. EON Design Management, 26, 254-56.
Frasher, R.D. (1969). An appraisal of the status and future of the continuin education (non-cred1t for en 1neers 1n the Un1ted States. Columbus, OH: OhlO State Un1vers1ty. ERIC Document Reproduction Service No. ED 032 466)
French, W. L., & Bell, C.H. (1984). orfan;zation development: Behavioral science interventions or organization 1mprovement. Englewood Cllffs, NJ: Prentice-Ral'.
Frohman, A.L. (1974). Critical functions for an innovative R&D organization. Business Quarterly, 39, 72-81.
Fryer, M.A., & Zimmerer, T.W. (1975). The work environment: Key to greater productivity. The Personnel Administrator, 20, 38-42.
Fullan, M., & Miles, M. (1978). 00 in schools: The state of the art. In W.W. Burke (Ed.), The cuttin~ edge: Current theory and practice in organization developmentpp. 149-175). La Jolla, cA: University Associates. •
Gailbraith, J. (1973). Designing complex organizations. Reading, MA: Addi son-Wesl ey.
------------------~--------•.. "--".'--.. - ..... _ .... --_ ......•..•. _ ... '-'--'--- .. _------- ...

Gautshi, T.F. (1978). Continuing education is not enough. Design News, 34, 137-138.
140
Gelpi, E. (1979). Lifelong education: Suggestions for an evaluation of experiences. In A.J. Cropley (Ed.), Lifelon~ education: A stocktakin~ (pp. 50-62). Hamburg, Germany: ONE CO Institute for Educat1on.
Glueck, W.F. (1982). Personnel: A diagnostic approach. Plano, TX: Business Publicat1ons.
Guest, R.H., Hersey, P., & Blanchard, K.H. (1977). oreanizational change through effective leadership. Englewood 11ffs, NJ: Prenbce-Aal'.
Gregory, G. (1984). Why Japan's engineers lead. Management Today, 50-55.
Hackman, J.R. (1983). Designing work for individuals and for groups. In J.R. Hackman, E.E. Lawler & L.W. Porter (Eds.), Perspectives on behavior in organizations (pp. 242-257). New York: McGrawHi 11.
Hackman, J.R., & Oldham, G. (1975). A new strategy for job enrichment. California Management Review, 11, 57-71.
Hall, D.T., & Mansfield, R. (1975). Relationships of age and seniority with career variables of engineers/scientists. Journal of Applied Psychology, 60, 201-210.
Heneman, H.G., & Schwab, D.P. (Eds.). (1982). Perspectives on personnel/human resources management. Homewood, IL: Richard D. Irwin.
Hersey, P., & Blanchard, K.H. (1977). Management of oreanizational behavior: Utilizing human resources. Englewood 1iffs, NJ: Prent1ce-Aa".
Herzberg, F. (1979). Herzberg on motivation for the 180s. Industry Week, 201, 59-63.
Hill, J.E., & Kerber, A. (1967). Models, methods, and analytical procedures in educational research. Oetro1t, MI: Wayne state unr; vers1ty.
Hubbard, P.H., & Storm, K. (1984). AEA status rAMort on engineering and technical education. Palo Alto, cA: er1can Electronics Associ ati on.
141
Horgan, N.J. (1971). An MBO approach to prevent technical obsolescence. Personnel Journal, 50, 687-693.
Hoy, W.K., & Ferguson, J. (1985). A theoretical framework and exploration of organizational effectiveness of schoois. Educational Administration Quarterly, ~, 117-134.
Ivancevich, J.M., Szilagy, A.D., & Wallace, M.J. (1977). Organizational behavior and performance. Santa Monica, CA: Goodyear.
Jayaram, G.K. (1976). Open systems planning. In W.G. Bennis, K.D. Benne, R. Chin & K. Corey (Eds.), The planning of change (pp. 275-283). New York: Holt, Rinehart and Winston.
Jewkes, G., Dalton, G., & Thompson, P. (1979). How to stifle a technical organization in ten easy steps. Research Management, 22, 12-16.
Jones, A.N., & Cooper, C.l. (1980). Combatting managerial obsolescence. Deddington, Oxford: Phillip Allan.
Kaufman, H.G. (1972). Relations of ability and interest to currency of professional knowledge among engineers. Journal of Applied Psychology, 56, 495-499.
Kaufman, H.G. (1973). Individual differences, early work challenge, and participation in continuing education. Journal of Applied Psychology, 60, 405-408.
Kaufman, H.G. (1974). Obsolescence and professional career development. New York: AMAcOM.
Kaufman, H.G. (Ed.). (1975). Career management: A guide to combating obsolescence. New York: IEEE Press.
Kaufman, H.G. (1978). Continuing education and job performance: A longitudinal study. Journal of Applied Psychology, 63, 248-251.
Kaufman, H.G. (1979). Technical obsolescence: Work and organizations are the key. Engineering Education, 69, 26-30.
Kemper, J.D. (1975). The engineer and his profession (Second edition). New York: HOlt, Rlnehart and Wlnston.
Kopelman, R.E. (1977). Psychological stages of careers in engineering: An expectancy theory taxonomY. Journal of Vocational Behavior, 10, 270-286.
----------------~----.--.. '-'-'-' ._ ...... .
142
Krejcie, R.V., & Morgan, D.W. (1970). Determining sample size for research activities. Educational and Psychological Measurement, 30, 607-610.
Lawler, E.E. (1973). Motivation in work organizations. Monterey, CA: Brooks/Cole.
Lawler, E.E. (1983). Strategies for improving the quality of work life. American Psychologist, 37, 486-493.
Lawler, E.E. (1984). Increasing worker involvement to enhance organizational effectiveness. In P. S. Goodman (Ed.),Change in or anizations: New perspectives on theory, research, and practlce pp. an ranC1SCO: ossey-Bass.
Lengrand, P. (1975). An introduction to lifelong education. Paris: UNESCO Press.
Lengrand, P. (1979). Prospects of lifelong education. In A.J. Cropley (Ed.), Lifelon~ education: A stocktaking (pp. 28-35). Hamburg, Germany: ONEs 0 Institute for Education.
Levering, R., Moskowitz, M., & Katz, M. (1985). The 100 best companies to work for in America. New York: Plume Printing.
Lewis, A.J. (1983). Education for the 21st century. Educational Leadership, 41, 9-10.
Likert, R. (1961). New patterns of managemente New York: McGraw-Hi 11.
Lippitt, G.L. (1982). Organization renewal: A holistic approach. to organization development. Englewood Cliffs, NJ: Prentice-Hall.
MacGregor Burns, J. (1978). Leadership. New York: Harper & Row.
Macy, B.A. (1981). Productivity and QWL: A dual imperative. The Texas Center for Productivity and Quality of work Life. Lubbock, TX: Texas Tech University.
Mack, D.R. (1986). General Electric's continuing education program. In L.P~ Grayson & J.M. Biedenback (Eds.), Proceedings of the 1986 College Industry Education Conference Proceedlngs (pp. 89-92). Washington, DC: American Society for Engineering Education.
Mali, P. (1969). Measurement of obsolescence in engineering practitioners. Manage, 21, 48-52.
Margulies, N., & Raia, A.P. (1967). Scientists, engineers, and technical obsolescence. California Management Review, 10, 43-48. --
Margulies" N. & Raia, A.P. (1978). Conceptual foundations of organizational development. New York: McGraw-Ril'.
143
Margulies, N., & Wallace, J. (1973). Organizational change: techniques and applications. Glenview, lL: Scott, Foresman.
Mas low, A. H. (1954). M~t hat i on and personal i ty • New York: Ha rper & Row.
Matti1l, J. I. (1983). High stakes in lifelong education. Technology Review, 86, 81.
McCarrey, M.W., & Edwards, S.A. (1973). Organization climate conditions for effective research scientist role performance. Organization Behavior and Human Performance, ~, 439-459.
McGregor, D. (1966). Leadership and motivation. Cambridge, MA: The MIT Press.
McKelvey, B., & Sekaran, U. (1977). Towards a career-based theory of job involvement: A study of scientists and engineers. Administrative Science Quarterly, 22, 281-305.
Mennis, D. (1981). Breaking down the data on EEs and their careers. Electron Design, 29, 251-261.
Miles, R.E. (1975). Theories of management: Implications for orfanizational behavlor and development. New York: McGrawHi 1.
Miles, R.E., & Rosenberg, H.R. (1982). The human resources approach to management: Second-generation issues. Organizational Dynamics, ~, 26-41.
Miller, D.B. (1977a). How to improve the performance and productivity of the knowledge worker. Organizational Dynamics, ~, 62-80.
Miller, D.B. (1977b). Personal Vitality. Reading, Ma: AddisonWesley.
:,'iller, D.B. (1979). Counteracting obsolescence in employees and organizations. Professional Engineer, 49, 29-31.
Miller, J.E. (1976). Eliminate your obsolescence. Journal of System Management, 27, 34-36.
Mintzberg, H. (1973). The nature of managerial work. New York: Harper & Row.

144
Mintzberg, H. (1979). The structuring of organizations. Englewood Cliffs, NJ: Prentice-Hall.
Misshauk, M.J. (1970). Importance of environmental factors in scientists-engineers. Personnel Journal, 49, 319-323.
Morris, A.J. (1978). Continuing education for engineers and on the job performance: The compensation connection. Professional Engineer, 48, 22-25.
Morris, A.J. (1980). Continuing education: Its retur'n on investment. Chemical Technology, 10, 470-73.
Moye A. (1986, February). Continuing education at Hewlett-Packard. Paper presented at the meeting of the American society for Engineering Education, New Orleans, LA.
Murdick, R.G. (1964). Business research: Concept and practice. Scranton, PA: International Textbook.
Nadler, D.A., Hackman, J.R., & Lawler, E.E. (1979). Managing organizational behavior. Boston: Little, Brown.
Nadler, D.A., & Lawler, E.E. (1983). Motivation: A diagnostic approach. In J.R. Hackman, E.E. Lawler & L.W. Porter (Eds.), Perspectives on behavior in organizations (pp. 67-73). New York: McGraw-Hill.
Nadler, D.A., & Tushman, M.L., (1980). A congruence model for organizational problem solving. New York: Columbia University.
Orth, C.D. (1975). Motivation and career development of engineers. Atlantic Economic Review, 25, 51-54.
Padilla, J.J. (1985). Meeting emerging professional needs. In L.P Grayson & J.M. Biedenback (Eds.), proCeedingS of the 1986 College Industry Education Conference (pp.9-69). Washington, DC: Amerlcan Soclety for Englneerlng Education.
Pascarella, P. (1983). Can management breakout of its box? Industry Week, 219, 53-55.
-----------------~-.--.-.-.-.. ----......

145
Pasmore, W.A. (1982). Overcoming the roadblocks in work-restructuring efforts. Organizational Dynamics, 10, 54-67.
Patton,~. (1979). The challenge of keeping current. IEEE Spectrum, .!,§., 53-59.
Peake, H.J. (1979). Combating engineer obsolescence. Machine Design, ~, 223-24.
Pelz, D.C., & Andrews, F.M. (1976). Scientists in organizations: Productive climate for research and development (Revlsed edltion). Ann Arbor, MI: The Oniverslty of Michigan.
Peters, T.J., & Waterman, Jr., R.H. (1982). In search of excellence: Lessons from America's best-run companies. New York: Warner Books.
Price, R. L., Thompson, P. H., & Dalton, G.W. (1975). Longitudinal study of technological obsolescence. Research Management, ~, 22-28.
Raitt, J. (1982). Retrain to retain: A prescription for the 1980s. Training and Development Journal, 36, 48-52.
Raudsepp, E. (1983). The ideal engineer. Machine Design, 55, 71-75.
Raudsepp, E., & Yeager, J.C. (1983). How much freedom for engineers? Machine Design, 55, 67-70.
Ritti, R.R. (1971). The engineer in the industrial corporation. New York: Columbia University Press.
Robbins, S.P. (1983). Organizational behavior: Concepts, controversies, and applications. Englewood Cliffs, NJ: PrentlceHall.
Rosow, J.M. (1981). Quality of work life issues for the 1980s. Training and Development Journal, 35,33-52.
Rothfeder, J. (1981). Job satisfaction overrides concern about low wages. Electron Design, 29, 351-57.
Sackett, W.T. (1985). Engineering obsolescence and continuing education at Honeywell. In L.P. Grayson & J.M. Biedenback (Eds.), Proceedin s of the 1986 Colle e Industry Education Conference pp. • Washlngton, DC: Amerlcan oClety for Engineer-
ing Education.
SChmuck, R.A., & Miles, M.B. (1971). Organization development in schools.' Palo Alto, CA: National Press Books.
Schwartz, H., & Davis, S.M. (1981). Matching corporate culture and business strategy. Organizational Dynamics, 10, 30-48.
------------------.----------.,~ ... ------.---.---.. ----.-

146
Scott, W.R. (1981). Organizations. Englewood Cliffs, NJ: Prentice-Hall.
Seifert, W.W. (1964). The prevention and cure of obsolescence in scientific and technical personnel. Research Management, I, 143-149.
Shafritz, J.M., & Whitbeck, P.H. (1978). Classics of organization theory. Oak Park, Il: Moore.
Shearer, R.l. & Steger, J.A. (1975). Manpower obsolescence--new definition and emperical investigation of personal variables. AcademY of Management Journal, 18,263-275.
Snyder, D.P. (1984). The strategic context of management in America 1985 to 1995. Bethesda, MD: Snyder Family Enterprise.
Soltis, l.A. & Ebisch, R. (1979). Making continuing education pay off. Machine Design, ~, 100-104.
Spear, G.E. & Mocker, D.W. (1984). The organizing circumstance: Environmental determinants in self-directed learning. Adult Education Quarterly, ~, 1-10. --
Tannenbaum, R., & Davis, S.A. (1969). Values, man and organizations. Sloan Management Review, 10, 68-85.
Thompson, P.H. & Dalton, G.W. (1976). Are R&D organizations obsolete? Harvard Business Review, 54, 105-116.
Toffler, A. (1985). The adaptive corporation. New York: McGrawHill.
Tushman, M.l., & Moore, W.l. (1982).· Readings in the management of innovation. Boston: Pitman.
Vroom, V.H. (1964). Work and motivation. New York: John Wiley & Sons.
-----------_._--------

Walton, R.E. (1979). Do supervisors thrive in participative work systems? Organizational Dynamics, 1, 25-37.
Walton, R.E. (1980). Quality of work life activities: A research agenda. Professional Psychology, j!, 484-493.
147
Walton, R.E. (1984). From control to commitment: Transforming work force management in the Onlted States. Prepared for The Harvard Business School's 75th Anniversary Colloquium on Technology and Productivity.
Warwick, D.P., & Lininger, C.A. (1975). The sample survey: Theory and practice. New York: McGraw-Hill.
Wehrenberg, S.S. (1983). Training megatrends, Personnel Journal, 62, 279-280.
Weiner, Y. (1982). Commitment in organizations: A normative view. Academy of Management Review, I, 418-428.
Westcott, J.W. (1976). Employee obsolescence--A shared responsibility. Labor Gazette, 76, 241-243.
Yankelovich, D. & Lefkowitz, B. (1982). Work and American expectations. Phi Kappa Phi, 62, 3-5.
Zelikoff,S.B. (1969). On the obsolescence and retraining of engineering personnel: A quantification of the problem and some recommendations. Training Development Journal, ~, 3-14.
Zimmerman, M.D. (1980). In what stage is your career? Machine Design, 52, 66-70.
Zukowski, R.W. (1985). Overcoming obstacles in continuing education programs. Utica, NY: General Electric.

APPENDIX A
----------------_._-_._.-_ .. __ . __ .. __ ... _-_._-- ... -.. _--_ .•.. __ .. -
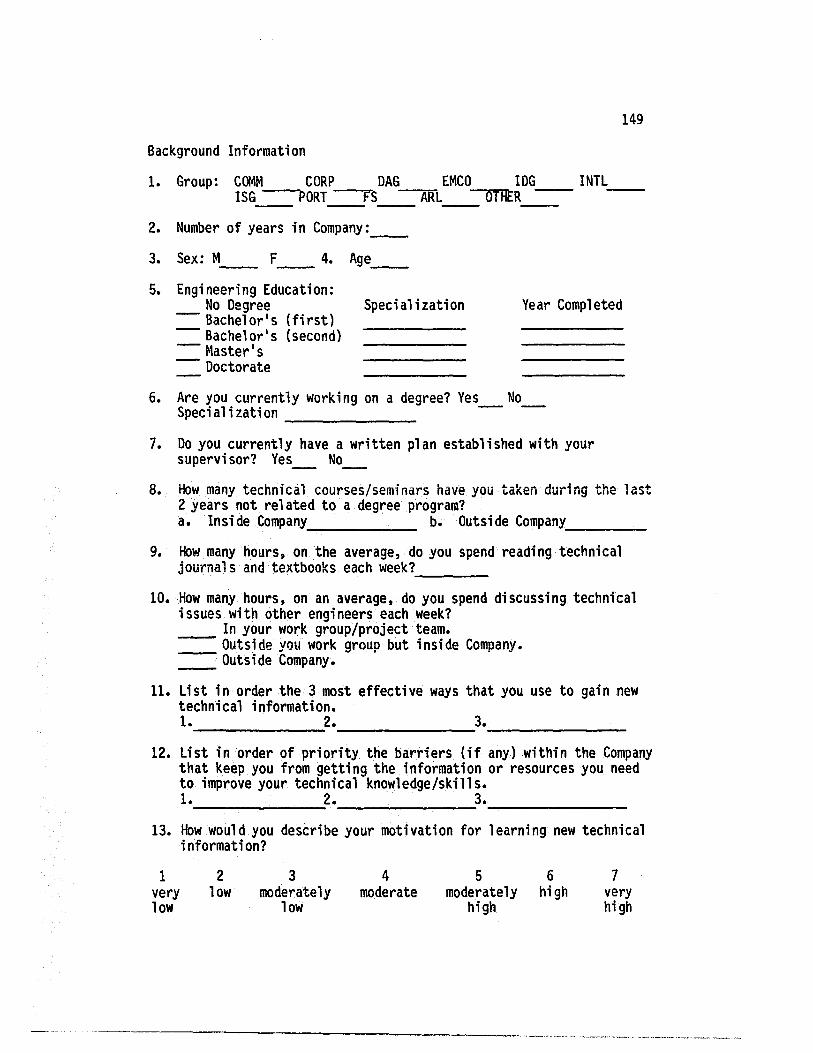
Background Information
1. Group: COMM CORP DAG EMCO lOG INTL ISG --PORT --;:S --:4ifL OTRtR-
2. Number of years in Company: _____
3. Sex: M__ F __ 4. Age __
5. Engineering Education: No Degree Specialization
- Bachelor's (first) Year Compl eted
- Bachelor's (second) - Master's
Doctorate
6. Are you currently working on a degree? Yes No Specialization - -
7. Do you currently have a written plan established with your supervi sor? Yes_ No
149
8. How many technical courses/seminars have you taken during the last 2 years not related to a degree program? a. Inside Company b. Outside Company ___ _
9. How many hours, on the average, do you spend reading technical journals and textbooks each week? ----
10. How many hours, on an average, do you spend discussing technical issues with other engineers each week?
In your work group/project team. =====: Outside yOy work group but inside Company. _ Outside Company.
11. List in order the 3 most effective ways that you use to gain new technical information. 1. 2. 3. -------
12. List in order of priority the barriers (if any) within the Company that keep you from getting the information or resources you need to improve your technical knowledge/skills. 1. 2. 3. ______ _
13. How would you describe your motivation for learning new technical information?
1 very low
2 low
3 moderately
low
4 moderate
5 6 moderately high
high
7 very high
---------------------_. -_"_- .. -_ ....... _-_ ...... __ .... -...... _ ....• - ... _.- ... _--

150
14. How important is learning new technical information to your present job?
1 2 not important
3 4 moderate important
5 6 7 very
important
15. How important is learning new technical information to your career development?
1 2 not important
3 4 moderate important
5
A. Work Description Questionnaire for Engineers
6 7 very
important
The following statements are concerned with the nature of work assignments, the actions and attitudes of peers and supervisors, and the policies and characteristics of a company. We are interested in how you think that each of these statements describes your job, company, supervisor, or peers. Use the scale below to indicate your judgment about each statement. Write the number indicating your judgment in the space to the left of each statement. Please do not omit any statements.
1 2 3 4 5 6 7 strongly disagree moderately no opinion moderately agree strongly disagree disagree agree agree
1. My supervisor involves the engineers in establishing performance goals by which they are evaluated.
2. Fellow engineers discourage attempts to remain technically current.
3. Work assignments include state-of-the art technology and advanced instrumentation.
4. All engineering time must be charged to project budgets with no allowance for general technical updating.
5. My supervisor encourages engineers to present papers at technical meetings.
6. My supervisor holds periodic staff meetings to discuss technical problems and developments.
7. The company has a performance system that ties financial gain to technical competence.
8. The company is concerned with the professiona growth of its engineers.
9. Peers are willing to act as sounding boards for new ideas. --- 10. Engineers view the company as an innovator. --- 11. Engineers lack the authority to make technical decisions about
a ·project. 12. The company provides its engineers with current technical
equipment and facilities.
-------------------------.-_ •..... _--_ ... - .-- - --... _ •....•..... _. __ ._-------_ ...

151
1 2 3 4 5 6 7 strongly disagree moderately no opinion moderately agree strongly di sagree di sagree agree agree
13. The company is involved in technically stagnant fields. ---- 14. My supervisor is technically up-to-date and abreast of recent ---- technical developments.
15. Personal creativity and growth are stifled by the company. 16. Engineers are often assigned to non-technical tasks.
---- 17. The company provides career counseling for the engineer. ---- 18. My supervisor matches the engineer·s need for professional
development with opportunities to attend courses and technical meetings.
19. Engineers are not always hired for engineering jobs. ---- 20. There is a clear statement of the company·s technological
goals available to all engineers. 21. Peers often react negatively to new technical ideas.
---- 22. My supervisor encourages the reading of technical journals and ---- trade magazines during working hours.
23. Job assignments are challenges that stretch the engineer·s technical knowledge to the limit.
24. Engineers participate in technical decisions relevant to their ---- assignments.
25. My job allows some free time to explore new, advanced ideas. ---- 26. The company attempts to be better technically than its compe
tition. 27. Peers are able to provide reliable information about current
tectmi cal developments. 28. The company recognizes the technical contribution of its engi
neers. 29. My supervisor elicits ideas from engineers about technical
problems. 30. My supervisor provides career counseling for the engineers.
---- 31. The company provides financial support for attending professional meetings.
32. Engineers have a sense of personal involvement in the com----- pany· s future.
33. My supervisor restricts the participation of the engineers in professional activities to a minimum.
34. Rewards are given to those engineers with technical competence.
35. Innovation is enthusiastically received by the company. ---- 36. Information exchange is restricted by excessive compettition
among the engineers. 37. My supervisor·s performance reviews point out the engineers·
strengths and weaknesses and offer suggestions for improvement.
38. The company stresses high professional standards ---- 39. There are open lines of communication between the engineering
staff and company management.
------------_._---_._--------
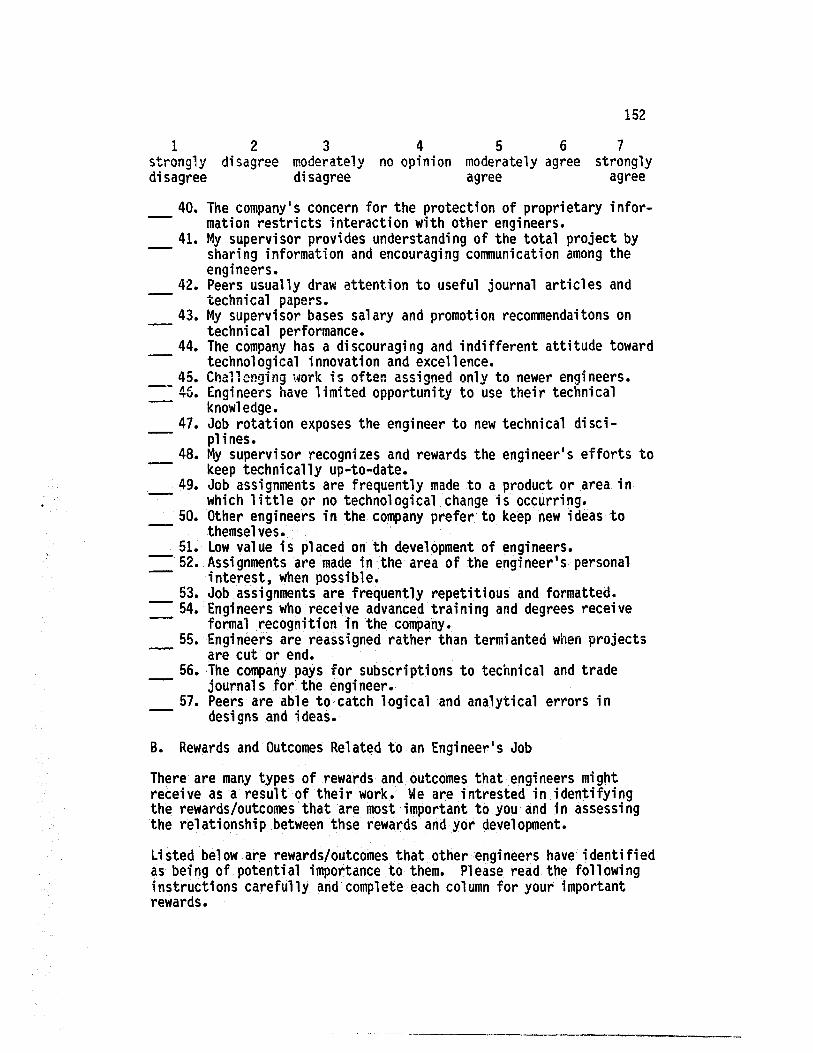
152
1 2 3 4 5 6 7 strongly disagree moderately no opinion moderately agree strongly disagree disagree agree agree
40. The company's concern for the protection of proprietary information restricts interaction with other engineers.
41. My supervisor provides understanding of the total project by sharing information and encouraging communication among the engineers.
42. Peers usually draw attention to useful journal articles and technical papers.
43. My supervisor bases salary and promotion recommendaitons on technical performance.
44. The company has a discouraging and indifferent attitude toward technological innovation and excellence.
45. Challenging work is often assigned only to newer engineers. ---- 45. Engineers have limited opportunity to use their technical
knowledge. 47. Job rotation exposes the engineer to new technical disci
plines. 48. My supervisor recognizes and rewards the engineer's efforts to
keep technically up-to-date. 49. Job assignments are frequently made to a product or area in
which little or no technological change is occurring. 50. Other engineers in the company prefer to keep new ideas to
themselves. 51. Low value is placed on th development of engineers.
--- 52. Assignments are made in the area of the engineer's personal interest, when possible.
53. Job assignments are frequently repetitious and formatted. --- 54. Engineers who receive advanced training and degrees receive
formal recognition in the company. 55. Engineers are reassigned rather than termianted when projects
are cut or end. 56. The company pays for subscriptions to technical and trade
journals for the engineer. 57. Peers are able to catch logical and analytical errors in
designs and ideas.
B. Rewards and Outcomes Related to an Engineer's Job
There are many types of rewards and outcomes that engineers might receive as a result of their work. We are intrested in identifying the rewards/outcomes that are most important to you and in assessing the relationship between thse rewards and yor development.
Listed below are rewards/outcomes that other engineers have identified as being of potential importance to them. Please read the following instructions carefully and complete each column for your important rewards.

1. In COLUMN A check the 10 rewards and outcomes that are most important to you.
153
2. In COLUMN B indicate how important each of these 10 rewards is to you using the following rating scale:
1 2 3 4 5 6 7 minimally moderately most important important important
A B Important How Rewards Important
1. Recognition for accomplishments and technical success --- 2. Advancement based on quality work performance - 3. Salary and mer; t i nCieclses --- 4. Role as technical consultant to other projects --- 5. Customer satisfaction --- 6. Sense of achievment from work assignment --- 7. Support for maintaining and expanding technical skills --- 8. Challenging work assignment --- 9. Role as mentor for younger engineers --- 10. Knowing how your assignment fits into the overall
project 11. More time for non-work related activities
--- 12. Assignment in forefront of technology ---- 13. Company reputation for technological leadership and
excellence 14. Job security
--- 15. Encouragement of mY creative and innovative ability. --- 16. Opportunity to exercise personal initiative in
assignment 17. Positive relations with supervisor
--- 18. Major responsibility for a project --- 19. Availability of technical library --- 20. Support for writing technical articles and books ---- 21. Support for professional memberships, attendance at
professional meetings, and technical presentations 22. Good relations with peers
--- 23. Other ------~~-------------------------
3. In COLUMN C rate the likelihood of receiving each of the 10 rewards you checked if your technical skills stayed at their current level during the next 2 years.
4. In COLUMN 0 rate the likelihood of receiving each of the 10 rewards if you became more technically up-to-date during the next 2 years.
_ .... _. -- ------------------- -----.-. -'~~,"... -,.". -' . . -. '". __ "" __ "--0-•. - ..•... ___ ._ .. _'" __ , ___ _

1 2 not likely
3 4 moderately
1 i kely
5 6
154
7 very
1 ikely
C Re\'lards if technically the same
D Rewards if
more technically up-to-date
1. Recognition for accomplishments and technical success ---- 2. Advancement based on quality work performance ---- 3. Salary and merit increases ---- 4. Role as technical consultant to other proje~ts ---- 5. Customer satisfaction ---- 6. Sense of achievment from work assignment ---- 7. Support for maintaining and expanding technical skills ---- 8. Challenging work assignment --- 9. Role as mentor for younger engineers --- 10. Knowing how your assignment fits into the overall
project 11. More time for non-work related activities
---- 12. Assi gnment in forefront of technology ---- 13. Company reputation for technological leadership and
excellence 14. Job security
---- 15. Encouragement of my creative and innovative ability ---- 16. Opportunity to exercise personal initiative in
assignment 17. Positive relations with supervisor
---- 18. Major responsibility for a project --- 19. Availability of technical library ---- 20. Support for writing technical articles and books ---- 21. Support for professional memberships, attendance at
professional meetings, and technical presentations 22. Good relations with peers
---- 23. Other -----------------------------------C. Value of Various Activities for Keeping Engineers Technically
Up-to-Date
There are many possible activities that might increase technical knowledge and skills. Please indicate your judgment of the value of each of the following activities as away of keeping technically up-to-date. Use the scale below to make your judgments •. Place the number indicating your judgment in the space to the left of each activity.
If I take place in IIthis activityll (see list below) it is ____ _ that I will become more technically up-to-date.

1 not likely
1. 2. 3. 4. 5. 6. 7.
8. 9.
-10. -11. -12. -13. -14. -15. -16. -17. -18.
19. -20.
21.
155
2 3 4 moderately
likely
5 6 7 very
likely
Pursue an advanced engineering degree. Get professional certification. Attend local professional society chapter meeting. Attend in-house technical seminars and short courses. Publish a paper in a technical journal. Read technical journals. Take an occasional technical course at a university or college. Attend national professional society meetings. Discuss technical matters with others in my organization. Present a paper at a professional society meeting. Attend non-company technical seminrs and short courses. Read current tehnical textbooks on own schedule. Read trade journals and magazines. Talk with engineers in other organizations. Receive a challenging technical job assignment. Work with interdisiplinary project teams. Teach a technical course at local college or university. Lead seminars and short courses for organization or professional society. Use electronic technical database.
If there are other ---------------waysof updating,
please specify these -----------------and rate them.
Send copy of survey resul ts. YES NO ___ _
I am available for a follow-up interview. YES ____ NO ____
Return to Cheryl Hubbard, Y6-047 by May 20th

APPENDIX B

May 9, 1985
Dear Engineer:
Cheryl Hubbard, as part of her doctoral studies, is conducting a study investigating the development climate for engineers in the company. Enclosed is a questionnaire designed to assist her completing the study. Your opinions are of utmost importance. I would appreciate your taking 30 minutes of your time to give your candid responses. All individual responses will be kept in strictest confidence. Please return the completed survey to Cheryl, Y6-047, by May 20.
A copy of the study results will be available to participants. Check the appropriate space on the questionnaire if you would like a copy. Also indicate whether or not you would be willing to participate in a follow-up interview.
We appreciate your cooperation.
Sincerely,
Eddie R. Ward, Director Corporate Development and Personnel Relations

APPENDIX C

May 23, 1985
Dear
Recently you received a questionnaire related to the development climate of engineers. This is just a reminder to ask again for your support by completing and returning the questionnaire.
Your responses are extremely valuable for completion of this study. If you have not yet completed the questionnaire, would you please take a few minutes to do so and return it to me by May 30.
Sincerely,
Cheryl Hubbard, Manager
CH/la