organization productivity asian ©2018 - apo-tokyo.org · in the asia-pacific, the asian...
TRANSCRIPT


©20
18 A
sian
Prod
uctiv
ity O
rgan
izat
ion

©20
18 A
sian
Prod
uctiv
ity O
rgan
izat
ion
iii
ContentsAbbreviationsForeword
1 Introduction1.1 Databook 2018 1.2 List of Contributors1.3 Map Showing Countries Covered by the Databook 2018
2 Overview2.1 Global and Regional Economic Trends 2.2 Summary Findings
3 Economic Growth3.1 Economic Scale and Growth 3.2 Catching Up in Per Capita GDP 3.3 Sources of Per Capita GDP Gap
4 Expenditure4.1 Final Demand Compositions 4.2 Expenditure-side Growth
5 Productivity5.1 Per-Worker Labor Productivity 5.2 Per-Hour Labor Productivity 5.3 Total Factor Productivity 5.4 Sources of Labor Productivity Growth 5.5 Energy Productivity
6 Industry Perspective6.1 Output and Employment 6.2 Industry Growth 6.3 Labor Productivity by Industry
7 Real Income7.1 Real Income and Terms of Trade 7.2 Trading Gain and Productivity Growth
AppendixA.11 System of National Accounts in AsiaA.12 GDP HarmonizationA.13 Capital StockA.14 Rate of Return and Capital ServicesA.15 Hours Worked and Labor CompensationA.16 Purchasing Power ParitiesA.17 Other DataA.18 Sensitivity of TFP EstimatesA.19 Supplementary TablesA.10 Industry ClassificationA.11 Data Publication and Visualization
References
iiiviii
ix
1
135
7
79
17
182328
35
3548
55
5558627683
87
8795
106
111
111120
127
127128133135137140142143145166168
169
Contents
©20
18 A
sian
Prod
uctiv
ity O
rgan
izat
ion

iv
Contents
Population and Demographic DividendSize of the Informal Sector Turning Point in China Labor Quality Changes Productivity of City Premature Deindustrialization Redefining Myanmar’s Growths Per-Worker Wage and Income Level Forecasting Asian Economic Growths
Country Groups Based on the Initial Economic Level and the Pace of Catching UpCountry Groups Based on the Current Economic Level and the Pace of Catching UpAsset Classification and Parameters in Hyperbolic Function Input-Output Tables and Supply and Use Tables in AsiaAverage Ex-Post Real Rate of Return in AsiaSources of Labor DataGDP using Exchange Rate GDP using PPP GDP Growth Population Per Capita GDP using Exchange Rate Per Capita GDP Final Demand Shares in GDP Per-Worker Labor Productivity Level Per-Worker Labor Productivity Growth Per-Hour Labor Productivity Level Per-Hour Labor Productivity Growth Output Growth and Contributions of Labor, Capital, and TFP Role of TFP and Capital Deepening in Labor Productivity Growth Energy Productivity Level Industry Shares of Value Added Industry Shares of Employment Industry Origins of Economic Growth Industry Origins of Labor Productivity Growth Real Income and Terms of Trade Industry Classification – Concordance with ISIC Rev.3 Industry Classification – Concordance with ISIC Rev.4
Box 101 Box 102 Box 103 Box 104 Box 105 Box 106 Box 107 Box 108 Box 109
Table 111
Table 112
Table 113
Table 114
Table 115
Table 116
Table 117
Table 118
Table 119
Table 110
Table 111
Table 112
Table 113
Table 114
Table 115
Table 116
Table 117
Table 118
Table 119
Table 120
Table 121
Table 122
Table 123
Table 124
Table 125
Table 126
Table 127
Boxes
Tables
3253548185
105110
1122123
2887
133133137138145146147148149150151152153154155156158160161162163164165166167
©20
18 A
sian
Prod
uctiv
ity O
rgan
izat
ion

v
GDP Growth of Asia, the EU, Japan, and the US Asia in World GDP in 2016 and Projection for 2023GDP using Exchange Rate of Japan, China, and the EU, Relative to the US Price Differentials of GDPGDP of Asia and the EU, Relative to the US GDP of China, India, and Japan, Relative to the USGDP of South Asia, ASEAN, CLMV, and GCC, Relative to the USGDP Growth by Region Country Contributions to GDP Growth of Entire AsiaCorrelation of GDP Growth in 1990–2000 Correlation of GDP Growth in 2000–2016 Asia in World Population Per Capita GDP using Exchange Rate of Japan and Australia, Relative to the US Per Capita GDP using Exchange Rate of the Asian Tigers, Relative to the US Per Capita GDP of Japan, the EU, and Australia, Relative to the US Per Capita GDP of the Asian Tigers, Relative to the US Per Capita GDP of China, India, and ASEAN, Relative to the US Per Capita Non-Mining GDP of Resource-Rich Countries and Japan Initial Level and Growth of Per Capita GDP Sources of Per Capita GDP Gap Sources of Per Capita GDP Growth Female Employment Share Employment Rate Final Demand Shares by Region Historical Final Demand Shares of China since 1952 Historical Final Demand Shares of the US since 1929 Consumption Share by Region Investment Share by Region Net Export Share by Region Final Demand Shares in GDP by Country Dependent Population Ratio and Consumption Share Household Consumption Share in GDP Household Consumption by Purpose Historical Engel Curve of Japan since 1949 and Current Level of Asia Investment Share in GDP FDI Inflows FDI Inflow Ratio and Business Environment Investment Shares by Type of Asset Net Export Share in GDP Export and Import Shares in GDP Final Demand Contributions to Economic Growth Impacts of Global Financial Crisis and Recoveries Impacts of Asian Financial Crisis Final Demand Contributions to Economic Growth (Year-over-Year) Per-Worker Labor Productivity Level Labor Productivity of China and India Labor Productivity Level Relative to the US Per-Worker and Per-Hour Labor Productivity Gap, Relative to the US Labor Productivity Trend of Japan and the Asian Tigers Labor Productivity Growth Labor Input Growth Historical Labor Productivity Trend of Japan since 1885 and Current Level of Asia
Figure 111
Figure 112
Figure 113
Figure 114
Figure 115
Figure 116
Figure 117
Figure 118 Figure 119
Figure 110
Figure 111
Figure 112
Figure 113
Figure 114
Figure 115
Figure 116
Figure 117
Figure 118
Figure 119
Figure 120
Figure 121
Figure 122
Figure 123
Figure 124
Figure 125
Figure 126
Figure 127
Figure 128
Figure 129
Figure 130
Figure 131
Figure 132
Figure 133
Figure 134
Figure 135
Figure 136
Figure 137
Figure 138
Figure 139
Figure 140
Figure 141
Figure 142
Figure 143
Figure 144
Figure 145
Figure 146
Figure 147
Figure 148
Figure 149
Figure 150
Figure 151
Figure 152
Figures17171819192020212122232424242525262627293031313536373737383839404142434444454647484949505556575959606061
©20
18 A
sian
Prod
uctiv
ity O
rgan
izat
ion

vi
Contents
Time Durations Taken to Improve Labor Productivity by Japan and the Asian Tigers TFP Growth Sources of Economic Growth in the Long Run Contribution Shares of Economic Growth in the Long Run Sources of Economic Growth in Sub-periods Contribution Shares of Economic Growth in Sub-periods Comparison of Sources of Economic Growth with OECD Countries Comparison of TFP Contribution Shares with OECD Countries Growth Accounting Decomposition by Country and Region IT Capital Contribution Shares in Japan and the US IT Capital Contribution Shares in the Asian Tigers, China, and India Growth Accounting Decomposition by Country and Region (Year-over-Year) Capital Deepening Capital Productivity Growth Capital Productivity of Japan and the Asian Tigers Capital Productivity of China and India Sources of Labor Productivity Growth in the Long Run Contribution Shares of Labor Productivity Growth in the Long Run Decomposition of Labor Productivity Growth by Country and Region Asia in World Energy Consumption and CO2 Emission Energy Productivity of Japan, China, and the EU, Relative to the US Labor Productivity and Energy Productivity Sources of CO2 Emission Growth Industry Shares of Value Added Manufacturing GDP Share and TFP Growth Industry Shares of Value Added in Manufacturing Value Added and Employment Shares of Agriculture Trend of Value-added Share in Agriculture Industry Shares of Employment Labor Surplus Historical Employment Share of Agriculture in Japan since 1885 and Current Level of Asia Trends of Employment Share in Agriculture Job Creation in Manufacturing Industry Origins of Economic Growth Industry Origins of Regional Economic Growth Contribution of Manufacturing to Economic Growth Contribution of Service Sector to Economic Growth Industry Origins of Output Growth in Manufacturing Industry Origins of Asian Economic Growth Industry Origins of Economic Growth (Year-over-Year) Industry Origins of Labor Productivity Growth Contribution of Manufacturing to Labor Productivity Growth Contribution of Service Sector to Labor Productivity Growth Trading Gain Effect of Australia, Saudi Arabia, and the UAE Effect of Net Income Transfer on GDP Crude Oil Price Trading Gain Effect Real Income and GDP Growth Decomposition of Real Income Growth Decomposition of Real Income Growth in the Periods of Economic Crises Sources of Real Income Growth (Year-over-Year) Trading Gain Effect and Labor Productivity Growth Trading Gain Effect and Value-added Share in Mining Sector
Figure 153
Figure 154
Figure 155
Figure 156
Figure 157
Figure 158
Figure 159
Figure 160
Figure 161
Figure 162
Figure 163
Figure 164
Figure 165
Figure 166
Figure 167
Figure 168
Figure 169
Figure 170
Figure 171
Figure 172
Figure 173
Figure 174
Figure 175
Figure 176
Figure 177
Figure 178
Figure 179
Figure 180 Figure 181
Figure 182
Figure 183
Figure 184
Figure 185
Figure 186
Figure 187
Figure 188
Figure 189
Figure 190
Figure 191
Figure 192
Figure 193
Figure 194 Figure 195 Figure 196 Figure 197 Figure 198 Figure 199 Figure 100 Figure 101 Figure 102 Figure 103 Figure 104 Figure 105
62636464666768697072737476767777787879838384848889899091929293949596979899
100101102107108109112113114114115116117118120121
©20
18 A
sian
Prod
uctiv
ity O
rgan
izat
ion

vii
Implementation of the 1968, 1993, and 2008 SNA Adjustment of FISIM FISIM Share in GDP Software Investment Ratio and GFCF Ratio to GDP Adjustment of R&D R&D Share in GDP Capital-Output Ratio Ex-Post Real Rate of Return in Asia Hours Worked Per Worker, Relative to the US Availability of COE Estimates Revisions of PPP for GDP by the 2011 ICP Round Labor Income Share for Employees in 2016 Sensitivity of TFP Estimates by the Change of Labor Share Visualization in Asian Economy and Productivity Map
Distribution of the World’s Population in Different Regions in 1950–2100 Asian Countries’ Population Size and Projection in 1970, 2016, and 2050 Proportion of the Dependent Population in 2016 Demographic Dividend by Country in 1950–2100 Demographic Dividend by Country Group in 1950–2100 Employee Share and Per Capita GDP Level Price of Labor Relative to Capital in China, Japan, and the Asian Tigers Contributions of Labor Quality to Growths in Japan and the US Average Schooling Years of Workers, 1970–2016 Contributions of Labor Quality to Growths in Six South Asian Countries Population by City in 2016 Per-Worker Labor Productivity Levels by City Country Peaks in Manufacturing GDP Share Manufacturing GDP Share and Per Capita GDP Official and Revised Estimates of GDP Growth in Myanmar Average Wage and Per Capita GNI in 2016 Projection of Change in Total Employment until 2030 Projection of Labor Quality Change until 2030 Historical GFCF Shares of Japan and Current Level of Asia Projection of Economic Growths until 2030 Projection of Per-Hour Labor Productivity Growths until 2030
Figure 106 Figure 107 Figure 108 Figure 109 Figure 110 Figure 111 Figure 112 Figure 113 Figure 114 Figure 115 Figure 116 Figure 117 Figure 118 Figure 119
Figure B1.1 Figure B1.2 Figure B1.3 Figure B1.4 Figure B1.5 Figure B2 Figure B3 Figure B4.1 Figure B4.2
Figure B4.3 Figure B5.1 Figure B5.2 Figure B6.1 Figure B6.2 Figure B7 Figure B8 Figure B9.1 Figure B9.2 Figure B9.3 Figure B9.4 Figure B9.5
127129129130131132134136139139141143143168
323333343453548182828586
105106110122123124124125125
©20
18 A
sian
Prod
uctiv
ity O
rgan
izat
ion
viii
ADBAPOAPO20
AEPM ASEAN
ASEAN6Asia24
Asia30CLMVCPICOEESRIEUEU15
EU28
FDIFISIMGCC
GDPGFCFGNIICPILOIMFISICIT KEO LaoPDRLDCs NPISHsOECDPPPQALIQNARCEPROCR&DSNATFPTPPUAEUNUNSDUS
Asian Development Bank Asian Productivity Organization20 member economies of the Asian Productivity Organization: Bangladesh, Cambodia, the Republic of China, Fiji, Hong Kong, India, Indonesia, Islamic Republic of Iran, Japan, the Republic of Korea, the Lao PDR, Malaysia, Mongo-lia, Nepal, Pakistan, the Philippines, Singapore, Sri Lanka, Thailand, and VietnamAsian economy and productivity map (see Appendix 11)Association of Southeast Asian Nations, which consists of 10 countries of Bru-nei, Cambodia, Indonesia, the Lao PDR, Malaysia, Myanmar, the Philippines, Singapore, Thailand, and Vietnam. The ASEAN is separated to two groups in Databook, i.e., ASEAN6 and CLMV.Brunei, Indonesia, Malaysia, the Philippines, Singapore, and ThailandAPO20 plus the People’s Republic of China, the Kingdom of Bhutan, Brunei, and MyanmarAsia24 plus GCC countriesCambodia, the Lao PDR, Myanmar, and Vietnamconsumer price indexcompensation of employeesEconomic and Social Research Institute, Cabinet Office of Japan European Union 15 member economies of the European Union prior to enlargement: Austria, Belgium, Denmark, Finland, France, Germany, Greece, Ireland, Italy, Luxembourg, Netherlands, Portugal, Spain, Sweden, and the United KingdomEuropean Union: EU15 plus Bulgaria, Republic of Croatia, Cyprus, Czech Republic, Estonia, Hungary, Latvia, Lithuania, Malta, Poland, Romania, Slovak Republic, and Sloveniaforeign direct investment financial intermediation services indirectly measured Gulf Cooperation Council: Bahrain, Kuwait, Oman, Qatar, Saudi Arabia, and the UAE gross domestic product gross fixed capital formation gross national income International Comparisons Program International Labour Organization International Monetary Fund International Standard Industry Classification of All Economic Activities information technologyKeio Economic Observatory, Keio University Lao People’s Democratic Republic less developed countries non-profit institutions serving households Organisation for Economic Co-operation and Development purchasing power parity quality adjusted labor inputs quarterly national accounts Regional Comprehensive Economic Partnership Republic of China research and development System of National Accounts total factor productivity Trans-Pacific Partnership United Arab Emirates United Nations United Nations Statistics Division United States
Abbreviations
©20
18 A
sian
Prod
uctiv
ity O
rgan
izat
ion

ix
In an age when exponential scientific advances and the rapidly evolving techno-logical revolution are drastically altering the way we live and work, as well as how society functions, raising productivity is and will continue to be one of the biggest challenges to sustaining growth. As the sole organization devoted to productivity in the Asia-Pacific, the Asian Productivity Organization (APO) has endeavored to offer innovative future-proof approaches to assist its member economies not only to enhance productivity but also to deal effectively with the uncertain global envi-ronment driven by fast-changing, disruptive emerging technologies and determine the new drivers of productivity.
Among the various forms of support to member countries, measuring productiv-ity is a core research activity. This enables them to monitor productivity gaps and then set new targets for the future productivity movement. The APO Productivity Databook and Database present detailed analytical reports on recent and long-term productivity and economic performance in the Asia-Pacific and reference economies. They also provide a useful reference on the quality of economic growth through cross-country comparisons at different development stages. The interna-tional comparisons and analyses of such detailed data enable the APO to offer evi-dence-based policy advisory service to member countries, contributing to sustainable socioeconomic development through enhanced productivity and competitiveness.
The APO is pleased to release this new edition of the APO Productivity Databook to readers. This edition includes some new elements such as future projections of economic growth and labor quality changes in APO economies by 2030. Total fac-tor productivity estimates were also expanded to more countries, and the coverage of city productivity measures in Asia was increased.
The APO is grateful to the chief expert for this project, Professor Koji Nomura of Keio University, Tokyo, for his contributions to developing the methodology for the comprehensive analyses and comparisons of productivity performance. We also value the inputs of all contributors to the database and databook. The analyses and extensive international comparisons would not have been possible without their commitment. The APO will continue working with its members and their national statistics offices to improve data quality for more precise productivity measure-ments resulting in more informed policy formulation. We hope that readers in a range of fields will find this publication and database useful references on the pro-ductivity status of countries in the APO region and elsewhere.
Dr. Santhi KanoktanapornSecretary-GeneralAsian Productivity OrganizationTokyo, September 2018
Foreword
©20
18 A
sian
Prod
uctiv
ity O
rgan
izat
ion

1
1
1.1 Databook 2012
1.1 Databook 2018
This is the eleventh edition in the APO Productivity Databook series. Productivity gains, which enable an economy to produce more for the same amount of inputs, or to consume less to produce the same amount of outputs, are the only route to sustainable economic growth in the long run. Thus, it follows that moni-toring and improving national productivity capability are important targets of public policy. The Data-book aims to provide a useful reference for the quality of economic growth and productivity, which are comparable across countries at different development stages in Asia. A significant achievement of this edition of the Databook is the projection out to 2030 of the future economic growth.
In this edition of the Databook, baseline indicators on economic growth and productivity are calculated for 30 Asian economies, representing the 20 Asian Productivity Organization member economies (APO20) and the 10 non-member economies in Asia. The APO20 consists of Bangladesh, Cambodia, the Republic of China (ROC), Fiji, Hong Kong, India, Indonesia, the Islamic Republic of Iran (Iran), Japan, the Republic of Korea (Korea), the Lao People’s Democratic Republic (Lao PDR), Malaysia, Mongolia, Nepal, Pakistan, the Philippines, Singapore, Sri Lanka, Thailand, and Vietnam. The 10 non-member economies in Asia are: the People’s Republic of China (China), the Kingdom of Bhutan (Bhutan), Brunei, Myanmar, and the Gulf Cooperation Council (GCC) that consists of Bahrain, Kuwait, Oman, Qatar, Saudi Arabia, and the United Arab Emirates (UAE). In addition, Australia, the European Union (EU), Turkey, and the United States (US) are included as reference economies. This edition covers the period from 1970 to 2016.
The productivity measures in the Databook are based on the official data and our own estimates collated for the APO Productivity Database. This is a joint research effort between the APO and the Keio Eco-nomic Observatory (KEO), at Keio University, Tokyo, since September 2007. The System of National Accounts 2008 (2008 SNA), which is the latest version of the international statistical standard for the national accounts by the United Nations (2009), has been introduced in 21 countries in Asia and is an-ticipated to be introduced in Cambodia in 2019, as presented in Appendix 1. While there are movements to upgrade the national accounts, some countries such as Cambodia, the Lao PDR, and Nepal, have yet to fully introduce the earlier version 1993 SNA. Because the varying SNA adaptions among the econo-mies can result in discrepancies between data definitions and coverage, data harmonization is necessary for comparative productivity analyses. The Databook attempts to reconcile these national account varia-tions which are based on the different concepts and definitions. This is done by following the 2008 SNA and providing harmonized estimates for better international comparison. The GDP harmonization process, including capitalization of software and research and development (R&D), is provided in Ap-pendix 2.
Based on the growth accounting framework, the sources of economic growth in each economy are further decomposed to factor inputs of capital and labor and total factor productivity (TFP) for 23 Asian econo-mies – Bangladesh, Brunei, Cambodia, the ROC, Fiji, Hong Kong, India, Indonesia, Iran, Japan, Korea, the Lao PDR, Malaysia, Mongolia, Myanmar, Nepal, Pakistan, the Philippines, Singapore, Sri Lanka, Thailand, Vietnam, and China – along with the US as a reference economy. It is a notable achievement that the estimates on TFP for Brunei and Myanmar are newly developed in this edition of the Databook. The inclusion of Brunei and Myanmar facilitated a new development of regional productivity accounts for ASEAN, which consists of 10 countries in Southeast Asia, and for CLMV, which consists of Cambodia, the Lao PDR, Myanmar, and Vietnam, in this edition.
To analyze the overall productivity performance, as well as productivity subsets (e.g., capital productivity and labor productivity), the Databook constructs the estimates of capital services, which provides an ap-propriate concept of capital as a factor of production, as recommended in the 2008 SNA. The fundamental
1 Introduction
©20
18 A
sian
Prod
uctiv
ity O
rgan
izat
ion

2
1 Introduction
assumption in measuring capital services is proportionality between the (productive) capital stock and capital services in each type of asset. Thus, the growth rates of capital services can differ from that of capital stock only at the aggregate level. The assumption and data in measuring capital stock is presented in Appendix 3. For aggregating different types of capital, the user cost of capital by type of asset is re-quired. The outline of the methodology to measure price and volume of capital service is presented in Appendix 4.
Labor share is one of the key variables to determine TFP growth. However, the estimates on the compen-sation of employees (COE) are not fully available in the official national accounts in Asian countries (i.e., Bangladesh, the Lao PDR, Myanmar, Pakistan, and Vietnam). At KEO, the comprehensive database (Asia QALI Database) on number of workers, hours worked per worker, and hourly wages (which are cross-classified by gender, education attainment, age, and employment status), has been developed for the past few years. The first report covered six South Asian countries (see Box 4). The COE are estimated based on the Asia QALI Database for the countries in which the official estimates are not available. In addition, the compensation of self-employed and contributing family workers – which tend to have a larger share in total employment in less developed countries – are estimated based on this database to determine the total labor cost with the harmonized assumption among countries. The abstract of the methodology to measure labor share is presented in Appendix 5.
Another important achievement of this edition is the development of projections of the future economic growth for 23 Asian economies. Based on the APO Productivity Database and Asia QALI Database, and future scenarios on population by gender and age in the United Nations (2017) and its components of education attainment in Wittgenstein Centre Data (Lutz, Butz, and KC, 2014), the future economic growths are projected until 2030 by country and region in Asia. The framework and results are presented in Box 9. In the whole of Asia, the recent economic growth in 2010–2016 (5.3% per year on average) is projected to slow to 5.2% in 2016–2020 and 4.0% in 2020–2030. The main source of this slowdown of Asian economic growth is the deceleration of Chinese economic growth, which is projected to decrease from 7.4% to 6.3% and 4.0%, respectively, in the same periods.
The structure of the Databook is as follows. The recent trends in global and regional economic growth and the summary of findings are presented in Chapter 2. In order to understand the dynamics of the long-term economic growth within Asia, Chapter 3 details countries’ diverse development efforts and achieve-ments through cross-country level comparisons of GDP. Decompositions of GDP, which is defined by three approaches in SNA – production by industry, expenditure on final demand, and income to factor inputs – are valuable in understanding the structure, and in turn the behavior, of an economy. Chapter 4 presents the demand side decomposition, analyzing the sources of countries’ expenditure growths.
In Chapter 5, the supply side decompositions of economic growth and labor productivity improvement are analyzed in each country and region. The country aggregations of capital and labor inputs were based on the estimates of PPP for capital and labor inputs, respectively. This chapter also provides data on en-ergy productivity performance to reflect the impending need to improve energy efficiency as a policy target for pursuing sustainable growth. The preliminary digest of our work-in-progress database on pro-ductivity of a city (PDB-City Database) is presented in Box 5. The different composition of economic activities among countries is one of the main sources of the huge gap in average labor productivity at the aggregate level. The industry structure is presented in Chapter 6. Finally, Chapter 7 analyzes the income side of GDP by measuring the growth of real income and evaluating an improvement, or deterioration, in the terms of trade.
The official national accounts and metadata information used for constructing the APO Productivity Database 2018 has been collected by the national experts in APO member economies and research
©20
18 A
sian
Prod
uctiv
ity O
rgan
izat
ion

1
3
1.2 List of Contributors
members at KEO. The names of these contributors are listed in Section 1.2. The submitted data was then examined and compiled at KEO, where further information was collected on labor, production, prices, trades, and taxes, as required. This edition effectively reflects the revisions to the official national accounts and other statistical data published through May 2018. The project was managed by Koji Nomura (Keio University), under the consultancy of Professor Dale W. Jorgenson (Harvard University) and Professor W. Erwin Diewert (University of British Columbia), and with coordination by Huong Thu Ngo (APO). The text, tables, and figures of this edition were authored by Koji Nomura and Fukunari Kimura (Keio Uni-versity), with support from the research assistants Hiroshi Shirane, Shiori Nakayama, Naoyuki Akashi, Masafumi Yamamoto, Yurika Katayama, and Motomu Nakamura. The Databook project appreciates Eu-nice Ya Ming Lau for her contribution to developing the foundation of the Databook series during her stay at KEO and Trina Ott for her review of the draft.
1.2 List of Contributors
Authors of This Report
Dr. Koji NomuraAPO Productivity Database Project Manager,Professor, KEO, Keio University, 2-15-45 Mita, Minato-ku, Tokyo, 108-8345, Japan
Dr. Fukunari KimuraProfessor, Department of Economics, Keio University
Research Members at KEO
Mr. Hiroshi Shirane
Ms. Shiori Nakayama
Mr. Naoyuki Akashi
Mr. Masafumi Yamamoto
Ms. Yurika Katayama
Mr. Motomu Nakamura
APO Officer
Ms. Huong Thu NgoProgram Officer, Research and Planning Department, Asian Productivity Organization, 1-24-1 Hongo, Bunkyo-ku, Tokyo, 113-0033, Japan
National Experts
BangladeshMr. Ziauddin Ahmed
Joint Director, Bangladesh Bureau of Statistics, Ministry of Planning, Parishankhyan Bhaban, E-27/A, Agargaon, Sher-e-Bangla Nagar, Dhaka-1207
CambodiaMr. Nor Vanndy
Deputy Director Department, Secretariat of the Committee for Productivity of Cambodia National Institute of Statistics (NIS), Ministry of Planning Building D, Ministry of Economy and Finance, Phnom Penh
Republic of ChinaMs. Ming-Chun Yu
Chief, National Accounts Section, Bureau of Statistics, Directorate-General of Budget, Accounting, and Statistics (DGBAS), Executive Yuan, No. 2, Guangzhou St., Zhongzheng District Taipei, 10065
FijiMr. Kemueli Naiqama
Deputy Government Statistician, Fiji Bureau of Statistics, PO box 2221, Government Building, Suva
©20
18 A
sian
Prod
uctiv
ity O
rgan
izat
ion

4
1 Introduction
IndiaDr. Kolathupadavil Philipose Sunny
Group Head (Economic Services), National Productivity Council, Lodhi Road, New Delhi, 110003
IndonesiaMs. Ema Tusianti
Head of Cross Sector Statistical Analysis SectionStatistics IndonesiaJl. Dr. Sutomo No.6-8, Jakarta
Islamic Republic of IranMr. Behzad Mahmoodi
Professional Expert and Secretary of Professional Committee of Productivity, Economic Statistics Department, Central Bank of I.R. Iran, Ferdousi Ave. Tehran
JapanMr. Yutaka Suga
Research Official, National Wealth Division, National Accounts Department, Economic and Social Research Institute, Cabinet Office, Government of Japan, 3-1-1 Kasumigaseki, Chiyoda-ku, Tokyo, 100-8970
Lao PDRMs. Salika Chanthalavong
Chief of National Account Division, Economic Statistics Department, Lao Statistics Bureau, Dongnasokneua Village, Sikhottabong District, Vientiane
MalaysiaMs. Siti Asiah Ahmad
Core Team Leader, Core Team Malaysia Bureau of Labour Statistics Department of Statistics Level 2, Parcel D5, Putrajaya
MongoliaMs. Bayarmaa Baatarsuren
Senior Statistician, National Accounts and Statistical Research Department, National Statistics Office of Mongolia, Government Building III, Ulaanbaatar-20a
NepalMr. Rajesh Dhital
Director, Central Bureau of Statistics, Ramshahpath, Thapathali, Kathmandu
PakistanMr. Fazil Mahmood Baig
Director, National Accounts Wing, Statistics Division, Pakistan Bureau of Statistics, 21 Mauve Area, Statistics House, G-9/1, Islamabad
Sri LankaMr. Weerasinghe Wasala Mudiyanselage Ananda Sarath Premakumara
Additional Director General (Statistics I), Department of Census and Statistics, 5th Floor, Rotunda Tower, No. 109, Galle Road, Colombo 03
ThailandMr. Wirot Nararak
Senior Advisor in Policy and Plan, Office of The National Economic and Social Development Board, 962 Krung Kasem Road, Pomprab, Bangkok 10100
VietnamMr. Duong Manh Hung
Deputy Director, National Accounts Department, General Statistic Office of Vietnam, No. 6 Hoang Dieu, Ba Dinh District, Hanoi
©20
18 A
sian
Prod
uctiv
ity O
rgan
izat
ion

1
5
1.3 Map Showing Countries Covered by the Databook 2018
1.3 Map Showing Countries Covered by the Databook 2018
APO
mem
ber e
cono
mie
sN
on-m
embe
r Asia
n ec
onom
ies i
nclu
ded
in D
atab
ook 2
018
©20
18 A
sian
Prod
uctiv
ity O
rgan
izat
ion

2
7
2.1 Global and Regional Economic Trends
2.1 Global and Regional Economic Trends
An overview of the year 2017 revealed a satisfactory year for the world economy by the end. The US economy continued to show a relatively strong growth, and the EU was on track for a slow recovery. Most of the Asian developing economies realized steady economic growth. The trade collapse resulting from the Global Financial Crisis created a period of so-called “slow trade” in which the growth of international trade became slower than the growth of production in the world. The impact of this was evident as of 2012, but the trend ended in 2016 with strong recovery of trade growth, together with some increases in resource prices from the bottom. In spite of this recovery, concerns prevail regarding the future of inter-national trade, mostly as a result of the US Trump Administration activating aggressive trade policies in the first half of 2018, which may create into a “trade war” and degrade the rule-based international trade regime.
Overall, the growth performance of Asia was favorable. In Asia 30 and East Asia, the average annual growth of GDP at constant market prices in 2010–2016 was 5.3% and 5.5%, respectively, as presented in Table 9 in Appendix 9. The growth slowdown in China was gradual with some stability. Latecomers in ASEAN, like the Lao PDR and Combodia, India, and other Asian developing countries sustained rapid growth. Moderate increases in resource prices generated some positive sentiment in resource- exporting countries.
Advanced economies showed signs of recovery. Among them, the US economy again performed better than others. The average annual growth of GDP at constant market prices in 2010–2016 in the US was 2.0%. The unemployment rate dropped to 4.1% in December 2017 from 9.8% in January 2010, and con-tinued to drop, which is very low in the US standards. Tax cuts by the Trump Administration created an optimistic atmosphere for investors, at least in the short run. The European economy also presented sig-nificant recovery. The economic growth of Northern and Eastern Europe was in particular encouraging – even Greece regained some stability. The average annual growth rate of GDP at constant market prices in 2010–2016 in EU15 and EU28 was 1.1% and 1.2%, respectively. The Japanese economy also performed well, though its potential growth rate was low. The annual growth of GDP at constant market prices in 2010–2016 in Japan was 1.0%. The unemployment was 2.8% in December 2017. The recent World Eco-nomic Outlook by the IMF (2018) shows a somewhat optimistic view on the economic growth of ad-vanced economies, higher than their potentials for the years of 2018 and 2019.
Although the growth slowdown in China continued for three years, it seems to be somewhat stabilized, achieving 7.4% in the average annual growth of GDP at constant market prices in 2010–2016. Drastic reform in the domestic economy continues. Korea, which is heavily dependent on the Chinese economy, also slowed down with the Chinese economy, having 2.9% in 2010–2016.
Latecomers in ASEAN, Cambodia, the Lao PDR, and Myanmar, have continuously grown in the past two decades, reaching $1,320, $2,350, and $820, respectively, in the per capita GDP, using a 2016 ex-change rate (Table 11). However, the end of the easy catch-up period is approaching. To achieve sustained economic growth, they must delve deeper into establishing international production networks. The “Thai plus one” program of investment from machinery parts producers who have set up fragmented satellite factories off Thailand is slowing. As Vietnam achieved deeper involvement in international production networks they experience $2,240 per capita GDP, using exchange rate in 2016. However, the ratio of manufacturing value added to GDP is still 15.9% in 2016 (Table 21), leaving hope for the growth of sup-porting industry and industrial agglomeration.
2 Overview
©20
18 A
sian
Prod
uctiv
ity O
rgan
izat
ion

8
2 Overview
The Philippines and Indonesia are also in the process of forming efficient industrial agglomeration, with $2,970 and $3,650 in the per capital GDP using exchange rate in 2016. Thailand, Malaysia, and Singapore reached $6,130, $9,370, and $55,200 in the per capita GDP using exchange rate in 2016 though they struggled with industrial upgrading and the creation of innovation hubs.
The South Asian countries have not fully taken advantage of international production networks though some have been successful in connecting with slow global value chains in labor-intensive industries. The per capita GDP using exchange rate in 2016 in Nepal, Bangladesh, Pakistan, and India is $880, $1,380, $1,410, and $1,700, respectively.
The US trade policy is now one of the major concerns in the world, threatening to upend a rule-based world trade regime that has been built up for 70 years under the General Agreement on Tariffs and Trade (GATT) and the World Trade Organization (WTO). Although having a number of limitations, the dispute settlement mechanism under WTO has worked much better than initially expected. In addition, after finding difficulties in expanding the coverage of policy modes by WTO, many countries stepped into regional trade agreements to deepen the liberalization commitments and explore new international rules. In the past two decades, the world economy has experienced novel development with widening and deep-ening de facto economic integration and the rise of newly developed economies, including China. It is time to develop an innovative world trade regime. Recent trade policy by the US – based on the notion of “not rules but deals” – is seriously out of date, going back to the 1980s or two centuries ago, which creates uncertainties on our trade regime.
The concern is not only on the direct negative effects of anti-trade policy measures, but also on the deg-radation of rule-based trade regime. Asian governments must be vigilant as existing free trade agreements (FTAs) by the US, including the South Korea-US FTA (KORUS) and the North American FTA (NAF-TA) are being re-negotiated. In the KORUS re-negotiation which concluded in March 2018, some mea-sures inconsistent with the rule-based approach were introduced, including voluntary export restraints on steel, forced import quotas for automobiles, and loosening safety regulations on imported automobiles. In the NAFTA renegotiation, the US is claiming very restrictive, asymmetric rules of origin for automobiles. The usage of Section 232 of the Trade Expansion Act of 1962, and Section 301 of the Trade Act of 1974, also poses a concern. These unilateral measures by the US, as well as possible retaliation or counterbalanc-ing measures by other countries, are likely to create inconsistencies with the WTO policy discipline. “Tariff wars” and “dirty deals” do not benefit anybody. Tying trade talks to geo-politics and security issues also creates risks.
Countries throughout the world share concern about the trade regime, and the negotiations over mega-FTAs that exclude the US seem to be accelerating. Although the US walked away from the once-signed Trans-Pacific Partnership (TPP) in January 2017, the other 11 negotiating countries continued to negoti-ate and concluded the Comprehensive and Progressive Agreement for Trans-Pacific Partnership (CPTPP) on March 2018. CPTPP keeps most of the original text of TPP, except 22 relatively minor suspended items. Currently, the negotiating countries are in the process of ratification. It is likely to be validated soon with six or more countries. Once in effect, CPTPP will set the high standard of trade and investment liberalization, as well as present a starting point of new international rule-making. A number of countries, including Colombia, Thailand, Indonesia, and the United Kingdom, formally and informally announced their interest in accession to CPTPP.
The Japan-EU Economic Partnership Agreement was also signed in July 2018. As a result, Japan and the EU are trying to validate it by March 2019, before the UK withdraws from the EU. The process is obvi-ously accelerated to counteract the rising anti-trade atmosphere. Negotiations over the Regional Compre-hensive Economic Partnership (RCEP) by ten countries in ASEAN, China, Japan, South Korea, Australia,
©20
18 A
sian
Prod
uctiv
ity O
rgan
izat
ion

2
9
2.2 Summary Findings
New Zealand, and India also have accelerated to some extent, though different levels of ambition on liberalization have made a rapid agreement difficult so far. The negotiating countries have acknowledged the importance of the agreement in order to push back the rising protectionism in the world.
Indeed, Asia cannot afford a tariff war. Asia should globalize itself more and grow. International produc-tion networks or “the second unbundling” claimed by Baldwin (2016) require the overall liberalization of trade in goods and services, as well as investment, in order to support quick and efficient value chains. Economic integration of ASEAN and ASEAN+1 has attempted to provide such an economic environ-ment beyond simplistic tariff cuts. In the “slow trade” era of 2012–2016, some claimed that the slowdown of the growth of international trade was be due to the lack of room for further expanding global value chains. This was not the case. Obashi and Kimura (2018) confirm that the slow trade mainly resulted from a drastic decrease in the trade in primary products and materials, while parts and components trade, par-ticularly within East Asia, increased steadily. There still exists untapped opportunities to widen and deep-en international production networks.
In addition, the digital economy has arrived in Asia. New ICT technology has two faces: information technology (IT) and communication technology (CT). IT, represented by artificial intelligence, industry 4.0, robots, and machine learning, accelerates the speed of data processing, reduces the number of tasks, and possibly generates the concentration of forces in specific geographical locations of economic activities. On the other hand, CT, including the internet and smartphones, further overcomes distance, reduces face-to-face costs or matching costs of business-to-consumer (B-to-C) or consumer-to-consumer (C-to-C), and possibly generates dispersion forces for further fragmenting economic activities. The introduction of IT is a factor even in newly developed and developing economies, though it may take some time to digest it as asserted by Hallward-Driemeier and Nayyar (2018) and ADB (2018). On the other hand, the impact of CT has already been realized in many countries.
In the past several years, the penetration of the internet and smartphones to newly developed and devel-oping countries has advanced, and the subscription to social media outlets has explosively increased. The reduction in matching costs of B-to-C and C-to-C is becoming apparent in old industries such as retail trade, transportation services, and lodging and tourism. E-payments and fintech are also mushrooming. Eventually, a substantial number of services will be outsourced, even across national borders, as the third unbundling suggested by Baldwin (2016). A series of new applications of CT provide many opportunities for small businesses and individual consumers to participate in wider markets, which will have profound implication on inclusive development. For some countries and regions, digital connectivity may be pro-vided earlier than sufficient physical connectivity. How to incorporate the digital economy into develop-ment strategies is now an important topic for many countries.
From the viewpoint of statisticians, it is a challenge to capture activities of the evolving digital economy in the framework of formal statistics. In addition, the free flow of data is an important necessity in the digitalized world. CPTPP has established e-commerce guidelines to provide a favorable economic envi-ronment. Countries must introduce a series of policies in order to address consumer protection, privacy issues, competition policy, taxation, and cyber-security. Such policy formation is urgently needed at the international level.
2.2 Summary Findings
Asia’s economic vitality warrants considerable attention to the rapid and spirited changes in its economic performance in the short run. To fully understand this economic dynamism, it is essential to grasp its growth performance, structural changes, and the advancement of its economic development within a
©20
18 A
sian
Prod
uctiv
ity O
rgan
izat
ion

10
2 Overview
context of its middle- and long-term performance. Asia, in particular, consists of a variety of countries at different development stages, with diversified resource endowments, under various political regimes. The APO Productivity Databook is intended to be a useful reference for the quality of economic growth. It provides authoritative estimates of productivity and its decomposition, which are comparable across coun-tries at different development stages in the middle and long run.
International comparisons of economic performance are never a precise science. Instead, they are fraught with measurement and data comparability issues. Despite best efforts in harmonizing data, some data uncertainty remains. Operating within a reality of data issues, some of the adjustments in the Databook are necessarily conjectural, while others are based on assumptions with scientific rigor. In addressing this shortcoming, findings drawn from the research are cross-referenced against other similar studies. Such a magnitude of variations in the economic indicators is often subject to a certain degree of data uncertainty.
Bearing in mind these caveats, the main findings from our analysis are as follows:
Recent economic growth of Asia
u In terms of exchange-rate-based GDP, Japan was the largest economy in Asia until 2010, when Chinaovertook Japan’s position to become the largest economy in Asia and the second-largest economy inthe world, next to the US. In this measure, the Asia30 was 38% and 47% larger than the US and theEU15 in 2016, respectively (Figure 3 and Table 7).
u Based on GDP adjusted for purchasing power parity (PPP),1 the weight of the world economy is evenmore tilted toward Asia, by correcting the international price differentials among economies (Figure4). In terms of PPP-based GDP (GDP hereafter), the Asia30 was 1.75 times and 1.99 times largerthan the US and the EU15 in 2016, respectively (Figure 5).
u China has overtaken Japan as the largest Asian economy since 1999. In 2013 China overtook the USas the largest economy in the world. Maddison (2007) evaluates China was the largest producer in theworld as of 1880. For the first time in more than 130 years, China comes back to this position (Figure6 and Table 8).
u India surpassed Japan in terms of PPP-based GDP, replacing it as the second largest economy in Asiain 2009. In 2016, the total GDP of the three largest Asian economies (China, India, and Japan), was90% larger than the US economy (Figure 6 and Table 8).
u During the period 1990–2016, the Asia30 grew at 5.4% on average per annum, compared with 2.4%and 1.6% in the US and the EU15, respectively. Japan was the slowest growing economy among theAsia30 at 1.0%, compared with 25 of the 30 Asian economies with over 4.0% of annual economicgrowth (Figures 1 and 8 and Table 9).
u China and India have emerged as the driving force propelling Asia forward since 1990. Their growthaccounts for 38% and 14%, respectively, of the growth of Asia in the 1990s. In the recent period2010–2016, the growth in China and India accounts for 86% of regional growth (65% and 21%, re-spectively) (Figure 9).
1: This Databook based on the PPP estimates of the 2011 International Comparisons Program (ICP) round published in April 2014. See Appendix 6 (p. 140) for further explanation.
©20
18 A
sian
Prod
uctiv
ity O
rgan
izat
ion

2
11
2.2 Summary Findings
u The correlation coefficients between China and other Asian economies strengthened between thetwo decades. This suggests that China has become more integrated within the Asian economy. Formost Asian countries, the correlation with the US and the EU15 has also grown stronger (Figures 10and 11).
Catching up in per capita GDP
u Our results show the outcome of the dramatic development effort of the four Asian Tigers.2 EvenSingapore has surpassed the US since 1993, and in 2016 its per capita GDP was 55% higher. HongKong holds the second place, with a per capita GDP similar to the US since the early 2010s. In 2016, the ROC’s and Korea’s per capita GDP was 84% and 66% of the US level, respectively (Figure 16 andTable 12).
u Despite their rapid growth, due to their population, per capita GDP of China and India was 27% and11% of the US in 2016, respectively. However, this represents a tenfold increase in China’s relative percapita GDP over the last four decades. Although the per capita GDP of China was only 2% of the USand 38% of India in 1970, China overtook CLMV after 1988, India after 1993, and ASEAN6 after2013, respectively. The level achieved by the Asia30 was 23% of the US, indicating that there is ampleroom for catch-up (Figure 17 and Table 12).
u Asia’s huge per capita GDP gap with the US is predominantly explained by its labor productivity gap. With the exception of the Asian Tigers, GCC, Japan, and Iran, all Asian countries have a labor pro-ductivity gap of 50% or higher in 2016 (Figure 20).
u For most countries in Asia, the majority of per capita GDP growth can be explained by improvementin labor productivity. However, the employment rate contribution relative to labor productivity wasalso highly significant in Nepal, the ROC, Singapore, Korea, and Malaysia in 2010–2016 (Figure 21).
u There is a significant variation in Asia’s employment rate from 25% to 65% (except Qatar) at present. The employment rate has been rising in most Asian countries and is more than 10 percentage pointsabove the US in Singapore, Myanmar, Cambodia, and Vietnam (Figure 23).
Changes in demand composition
u With a few exceptions, household consumption is the biggest component of final demand. In recentyears, Asia30’s consumption ratio has dropped to 50% of GDP in 2016, largely reflecting the trend inChina. This compares to 69% in the US and 56% in the EU15 (Figure 24 and Table 13).
u Overall, Asia invests more than the US/EU15 as a share of its GDP. This gap has been widening sincethe early 2000s and began to narrow from the mid-2010s. In 2016, the Asia30 invested 34% of itsGDP, compared with 20% for the US and the EU15, and 24% for Australia (Figure 28 and Table 13).
u The share of household consumption in GDP tends to be more volatile, dropping in countries that areundergoing rapid development. As countries get richer, the household consumption share tends to rise. At the other end of the spectrum, countries with low income and a high dependent population(under-15, over-65) sustain a high consumption ratio to GDP (Figures 30 and 31).
2: “Asian Tigers” refers to Hong Kong, Korea, Singapore, and the ROC.
©20
18 A
sian
Prod
uctiv
ity O
rgan
izat
ion

12
2 Overview
u China faces huge internal and external imbalances. The investment share of GDP (at 44%), as the big-gest component in final demand and the household consumption share, plummeted to 39% in 2016 (Figure 30). In contrast, the weight of net exports has been rising in the past decade, although it is declining in recent years due to weak foreign demand (Figure 25).
u GCC economies are unusually skewed towards net exports because of their oil. Net exports recorded for 28% of final demand in 2005, compared with 5% of China. Only South Asia run trade deficits of a more significant nature, which accounted for –3% of final demand in 2016 (Figures 24 and 39 and Table 13).
Labor productivity
u For most Asian countries, the per capita GDP gap with the US is largely explained by labor productiv-ity shortfalls of 75% or more against the US level of per-worker labor productivity. Only Singapore and Hong Kong have effectively closed that gap. The relative labor productivity of the Asia30 was 23% of the US in 2016 (Figure 45 and Table 14).
u Growth of per-worker GDP in Asia has outstripped that in the US, allowing catch-up. In particular, the low-income countries appeared to experience a labor productivity growth spurt in 2010–2016. China achieved the fastest labor productivity growth of 7.1% on average per year in this period, fol-lowed by Mongolia’s 6.6%, India’s 5.5%, and the Lao PDR’s 5.3%; this compares with 1.2–1.4% in the Asian Tigers, 0.7% in Japan, and 0.6% in the US and EU15 (Figure 47 and Table 15).
u The productivity gap based on GDP per hour is generally wider between Asian countries and the US. While the adjustments are negligible for most Asian countries, the productivity gap significantly wid-ened by 10–26 percentage points for the Asian Tigers, suggesting that people work much longer hours than in the US (Figures 48 and 114).
u Most Asian countries experience faster growth in GDP per hour than the US. Among them, China’s performance is the most outstanding, with average annual productivity growth doubling from 4.5% to 8.3% between 1970–1990 and 1990–2016, respectively, compared to the US at 1.5% and 1.6% over the same periods. South Asia also improved the per-hour labor productivity growth from 2.1% to 4.4% in the same periods, although ASEAN’s acceleration is minor from 2.8% to 3.1% (Figure 50).
u Mapped onto Japan’s historical trajectory of GDP per hour, most Asian countries cluster around Ja-pan’s level between the late 1950s and early 1970s, with the Asian Tigers being the clear front-runners (Figure 52).
Total factor productivity
u Of the 23 Asian countries compared, 12 experienced faster TFP growth than the US over the period 1970–2016, with China in a league of its own. Its TFP growth was at 2.9% on average per year, com-pared with those of Pakistan at 1.9% in second place and the US at 0.8%. Singapore’s productivity performance has been weak relative to its economic counterparts, with TFP growing at 0.4% on aver-age per year (Figure 54).
u Over the past four decades, economic growth in Asia has been predominantly explained by the contri-bution of capital input, but the role of TFP growth should not be underestimated. Its contribution accounted for over 25% of economic growth in seven of the 23 Asian countries compared. As illustrated
©20
18 A
sian
Prod
uctiv
ity O
rgan
izat
ion

2
13
2.2 Summary Findings
in Figure 56. Economic growth was most prominent in Pakistan (36%), India (35%), China (34%), Sri Lanka (31%), and Japan (29%) (Figure 56).
u The composition of economic growth is shifting over time. In the past two decades, the contribution of capital input (especially of non-IT capital) has been progressively declining in Asia, falling to a share of below 52% (48% for non-IT and 4% for IT capital) on average, while the contribution of TFP is progressively increasing, rising to a share of above 40% on average in 2000–2016 (Figures 58 and 64).
u Over the past decades, economic growth has decelerated in the early starters ( Japan and the Asian Tigers). This observation lends support to the likelihood of an eventual slowdown in China. In 2010–2016, the slowdown in Chinese economic growth (7.4% from 10.7% in 2005–2010) was explained mainly by the lower TFP growth per year (2.0% from 4.2%), as shown in Figure 61.
Capital deepening and capital productivity
u Capital deepening appears to accompany rapid economic development. The early starters ( Japan and the Asian Tigers) initially underwent more rapid capital deepening, whereas the reverse is true for the currently emerging Asian economies. For example, in Korea the rise in capital–labor ratio decelerated from 10.9% on average per year to 6.5% between 1970–1990 and 1990–2016, whereas it doubled in China from 5.5% to 10.5% (Figure 65).
u Capital deepening tends to go hand in hand with deterioration in capital productivity. Although rates of capital deepening in Korea and the ROC were outstanding at 8.4% and 6.9%, respectively, per year on average in 1970–2010, their capital productivity experienced the sharp decline of 3.2% and 2.1% per year, respectively. China’s performance over the past quarter of a century is particularly impressive as its acceleration in capital deepening did not considerably compromise its capital productivity, as much as the early starters in the early period (Figure 66).
Industry structure
u Evidence supports the view that a country’s industry structure transforms with its economic develop-ment. There is a significant negative correlation between the share of agriculture in total GDP and per capita GDP. Finance, real estate, and business activities increase in weight as countries move up in-come levels, whereas mining is the sector that defines the oil-exporting countries (Figure 76).
u Manufacturing is a significant sector, accounting for over 20% of total value added in seven Asian countries in 2016. It is particularly prominent in China and Thailand, where over 2.4% of annual TFP growth is measured in 2000–2016 (Figure 77). Asian manufacturing is dominated by machinery and equipment in the richer Asian economies, while their poorer counterparts concentrate on light manu-facturing, such as textiles and the food industry (Figure 78).
u While Asian countries are diversifying away from agriculture, the sector still dominates employment, accounting for 33% of total employment in 2016 for the Asia30, down from 61% in 1980. Its share in total value added decreased more moderately, from 14% to 9% over the same period. Shifting out of agriculture into more efficient sectors will boost economy-wide productivity (Figures 79 and 83 and Tables 21 and 22).
u Manufacturing is a main absorption sector for workers who have been displaced from the agriculture sector, especially in the initial stages of economic development. In Korea and the ROC, expansions to manufacturing output could account for the increase of employment in the 1970s and the 1980s. In
©20
18 A
sian
Prod
uctiv
ity O
rgan
izat
ion
14
2 Overview
the 1990s and 2000s, however, the manufacturing sector was no longer an absorption sector of em-ployment, regardless of the sound expansion of production in this sector (Figure 85).
Industry origins of economic growth
u Our results support the observation that China and India have taken different development paths, with the former relying more on the traditional growth engine of manufacturing and the latter on services. In the past two and a half decades China has been undergoing a slight transition, with its growth shifting away from manufacturing-driven to more services-driven. In the period 2000–2016, the contributions to economic growth by manufacturing and services were 34% and 46%, respectively, compared with 42% and 35% in the 1990s (Figures 88 and 89).
u In contrast, growth in India has always been more driven by services, the contributions of which are 61% in the 1990s and 64% in 2000–2016, while manufacturing usually contributes one-fifth or less (Figures 88 and 89).
u A total of 28% of Asia30’s regional growth originated from the expansion of manufacturing in 2000–2016, 77% of which was accounted for by China. China’s manufacturing alone contributed 22% to regional growth (Figure 91).
u The importance of manufacturing as a contributor to overall labor productivity growth has never waned in Korea and the ROC. However, manufacturing has never been a major contributor in India in its recent development process, or in Hong Kong and Sri Lanka in 2000–2016 (Figure 94 and Table 24).
Real income and terms of trade
u Real GDP could systematically underestimate (or overestimate) growth in real income if terms of trade improve (or deteriorate). It is generally observed that the trading gain effect is more significant in the short term than in the long term. Our findings confirm this observation, with the exceptions in some oil-exporting countries such as Kuwait and Brunei, where trading gain has made it possible to sustain a rise in purchasing power with little real GDP growth in countries (Figure 100 and Table 25).
u Positive net primary income from abroad also bolsters a country’s real income. In Japan and the Philip-pines, net primary income from abroad has been rising steadily, albeit at different magnitudes. In Ja-pan, it rose from 0.8% of GDP in 1990 to 3.2% in 2016, compared with 1.5% in 1990 and 33.0% in 2016 in the Philippines. Singapore’s historical margin fluctuates within a broad range when compared with other rich economies – from +2.0% in 1997 to –7.0% in 2004. But, on the whole, it has been more negative than positive (Figure 97).
u Our results show that for most countries studied, the difference between growth of real GDP and real income (reflecting the combined effect of trading gain and net primary income from abroad) was within the margin of ±20% over the long period from 1970–2016. Kuwait and Brunei appear to be the outliers, with real income growth being 4.7 times and 4.0 times their respective long-term dismal real GDP growth of 0.9% and 0.7%, respectively (Figure 100).
u The nine countries that have been enjoying a trading gain over 0.5% per annum in the past four de-cades are all resource-rich countries. Among them, only Indonesia, Myanmar, Iran, and Vietnam man-aged to achieve a positive growth in labor productivity. In contrast, export-oriented, high productivity
©20
18 A
sian
Prod
uctiv
ity O
rgan
izat
ion

2
15
2.2 Summary Findings
Asian countries have been facing a deteriorating trading gain position as a price of their own success (Figure 104).
Asia is a diverse regional economy in which countries have embarked on their own journey of economic development at different times and different paces. As shown by our analysis, nearly all countries are mak-ing concerted efforts to move away from agriculture and accumulate capital in order to improve their growth potential and catch up with the West. Their efforts are yielding results beyond just impressive growth rates. The evidence gained from our research confirms that countries’ capital accumulation is ac-companied by strong productivity improvements. Through the statistics and data presented in this report, one manages to catch a glimpse of the current unparalleled economic dynamics inherent in the region.
©20
18 A
sian
Prod
uctiv
ity O
rgan
izat
ion

3
17
3.1 Economic Scale and Growth
In the past quarter of a century, the story of the world economy belonged to Asia, featuring its steady rise in economic prowess. Before the mid-1980s, the fortune of Asia closely followed that of Japan, but 1988 marked the start of their paths decoupling, as shown in Figure 1. Since the early 1990s, Asian growth has been outperforming the West consistently, with the exception of 1997–1999. During that time, the econ-omy was adversely affected by the Asian financial crisis.3 The Asia30 has been growing faster than the US and the EU15 by 3 to 4 percentage points on average per year.4
3 Economic Growth
Figure 1 GDP Growth of Asia, the EU, Japan, and the US_Annual growth rate of GDP at constant market prices in 1970–2016
Sources: Official national accounts in each country, including author adjustments.
1975 1980 1985 1990 1995 2000 2005 2010 20151970
10%
8
6
4
2
−2
−4
−6
0Japan
US
Asia30
EU15
3: The impacts of Asian financial crisis are presented in Figure 43 in Section 4.2 (p. 49) on countries’ expenditure-side GDP; and in Figure 102 in Section 7.1 (p. 117) on countries’ real income growth.
4: The data used in the Databook series includes author adjustments made to better harmonize GDP coverage across countries. See Appendix 1 (p. 127) for the SNA implementations in Asian countries and Appendix 2 (p. 128) for the GDP harmonization in this Databook.
In 2009, at the height of the global financial storm, the growth differentials were 6.6 and 8.3 percentage points with the US and the EU15, respectively. In 2010, simultaneous large-scale fiscal stimulus packages helped major economies rebound strongly, before growth slowed again in 2011. The Asian growth rate thereafter decreased to 5.3% on average per year during 2013–2016, from 7.0% before the global financial crisis (2002–2007). This is mainly due to the onset of deceleration in China’s growth to 6.9% from 11.0% on average in the same periods.5 Plagued by the euro crisis, the EU15 saw their economy shrink by 0.6% from 2011 to 2012 and their recovery to 1.8% in 2013–2016, whereas the US economy sustained a steady growth of 2.3% in the period 2013–2016.
It is therefore no surprise that the center of gravity in the global econo-my is gradually shifting towards Asia. In 2016, the Asian economy contrib-uted 47% (43% for Asia30) of world output, compared with the US and the EU28, each accounting for 15% and 17%, respectively, as shown in Figure 2. The IMF (2018) projects the Asian share in world output will continue to rise, reaching 52% (48%
Asia47 %
Asia52 %
2016 2023
EU2817 %
EU2815 %
Others21 %
Others19 %
US15 %
US14 %
EU1515 %
Asia3043 %
APO2023 %
EU1513 % Asia30
48 %
APO2025 %
Other Asia4 %
Other Asia4 %
Figure 2 Asia in World GDP in 2016 and Projection for 2023_Share of GDP using constant PPP
Source: IMF, World Economic Outlook Database, May 2018.
©20
18 A
sian
Prod
uctiv
ity O
rgan
izat
ion

18
3 Economic Growth
for Asia30) by 2023.6 In contrast, the output shares of each of the US and the EU28 will shrink by a similar extent to 14–15%.
To better understand the dynamics of the long-term economic growth within the region, the remainder of this chapter details countries’ diverse development efforts and achievements since 1970, through cross-country level comparisons of GDP and other related performance indicators. To facilitate international level comparisons, harmonized GDP for each of the individual countries is expressed in its equivalent, in a common currency unit, customarily in the US dollar, using a set of conversion rates between the indi-vidual national currencies. The choices for conversion rates are exchange rate and PPP.
3.1 Economic Scale and Growth
Figure 3 presents the time-series level comparison of Japan, China, and the EU, based on GDP at current market prices using exchange rates,7 relative to the US. A snapshot-level comparison of all Asian coun-tries for the six separate years of 1970, 1980, 1990, 2000, 2010, and 2016 are provided in Table 7 in Ap-pendix 9 (p. 145). By this measure, Japan was the largest economy in Asia until 2010 when China finally overtook Japan’s position to become the second-largest economy in the world, next to the US. Japan clearly surged ahead; dwarfing the relative size of all other Asian economies from 55% in 1970 to 37% of the economy of Asia30, in 1994. The turn of Ja-pan’s fortune came in the mid-1990s. Thereafter, stagnation in Japan, combined with vibrant growth in developing Asia, resulted in the rapid erosion of Japan’s prominence in the regional economy. On this measure, in 2016 the Asia30 was 38% and 47% larger than the US and the EU15, respectively.
Comparisons based on exchange rates, however, appear arbitrary as movements in exchange rates can be volatile and subject to short-term or sub-stantial fluctuations of speculative capital flows and government intervention. Furthermore, comparisons based on exchange rates typically underestimate the size of a developing economy and, in turn, the perceived welfare of its residents. The scale of economy ranking changes dramati-cally when international price differences are properly taken into account.8
Figure 3 GDP using Exchange Rate of Japan, China, and the EU, Relative to the US_Index of GDP at current market prices in 1970–2016, using annual exchange rate
Sources: Official national accounts in each country, including au-thor adjustments.
0
20
40
60
80
100
140
120
US=100
Asia30
US
EU15
1970 1975 1980 1985 1990 1995 2000 2005 2010 2015
Japan
China
5: According to the preliminary estimation by the National Bureau of Statistics of China, the growth rate of the Chinese GDP is estimated as 6.9% in 2017 (reported on January 25, 2018). This growth is slightly elevated from 6.7% in 2016, which is the weakest in a quarter century for China. The annualized growth for the first quarter of 2018 is 6.8% to the same quarter in 2017 (reported on April 17, 2018). OECD (2018b) forecasts the Chinese growth is set to edge down further, from 6.7% in 2018 to 6.4% by 2019.
6: This edition of the Databook newly introduces the forecast of economic growth in Asian countries (see Box 9, p. 123). Based on our baseline projection, the Asia24 will increase its GDP by 5.0% per year in 2016–2023, lower than the IMF forecast of 5.6% per year in the same period.
7: The exchange rates used in this Databook are the adjusted rates, which are called the Analysis of Main Aggregate (UNSD data-base) rates in the UN Statistics Division’s National Accounts Main Aggregate Database. The AMA rates coincide with the IMF rates (which are mostly the annual average of market, or official exchange rates) except for some periods in countries with official fixed exchange rates and high inflation, when there could be a serious disparity between real GDP growth and growth converted to US dollars based on IMF rates. In such cases, the AMA adjusts the IMF-based rates by multiplying the growth rate of the GDP deflator relative to the US.
©20
18 A
sian
Prod
uctiv
ity O
rgan
izat
ion

3
19
3.1 Economic Scale and Growth
Figure 4 shows the extent to which the exchange rates have failed to reflect countries’ price differentials properly, relative to the US, based on the PPP esti-mates of the 2011 International Comparisons Program (ICP) round, published in April 2014. With the exception of Japan and Australia, exchange rates sys-tematically under-represent the relative purchasing power for all the countries covered in this re-port. The underestimation is substantial for some, ranging from 23% for Korea to 72% for Pakistan. Thus, the exchange-rate-based GDP considerably underestimates the economic scales in real terms for those countries. By taking into account the international price differentials, PPP rectifies the trade sector bias, and in turn the relative size of economies can be more adequate-ly measured.9
By correcting international price differentials, the Asia30 has been expanding rapidly. Figure 5 pres-ents the level comparisons on real GDP for Asian countries, using PPP as conversion rates. Table 8 in Appendix 9 (p. 146) repeats the same snapshot. The size of Asia30 is 175% in terms of PPP-based GDP, instead of 38% in terms of exchange-rate-based GDP, larger than the US economy in 2016, having overtaken it in 1975.10 East Asia (China, the ROC, Hong Kong, Japan, Korea, and Mongo-lia) caught up with the US in 2006 from a low base of 43% in 1970. In contrast, the EU15 has been experiencing a gradual relative decline in economic size, from 124% of the US economy in 1970 to a low of 92% in 2016. Based on GDP using constant PPP, the weight of the world economy is even more tilted toward Asia in Figure 5 than portrayed by GDP using exchange rates in Figure 3. This reflects the fact that nearly all Asian countries increase in relative size after international price differentials have been properly taken into account.
8: This is because exchange rates embody the trade sector bias (i.e., it is more influenced by the prices of traded than non-traded goods and services) and thus do not necessarily succeed in correcting the price differentials among countries. As developing economies tend to have relatively lower wages and, in turn, lower prices for non-traded goods and services, a unit of local cur-rency has greater purchasing power in the local economy than reflected in its exchange rate.
9: It is therefore important to note that any international GDP comparisons are sensitive not only to revisions in national accounts but also to revisions in multilateral PPPs, which are currently benchmarked every six years. PPPs for most Asian countries have been revised downward, compared with what they would have been, by extrapolating the 2005 benchmark PPP (see Appendix 6, p. 140). This has the effect of raising the relative sizes of these economies against the base economy.
10: This compares with the findings in Databook 2013, which were based on the 2005 benchmark PPP, that the economic size of the Asia30 overtook the US in 1988. The revisions of PPPs in Asian countries at the 2011 ICP round, in comparison with the 2005 ICP round, are presented in Figure 116 in Appendix 6 (p. 141).
Paki
stan
Mya
nmar
Lao
PDR
Bang
lade
shIn
dia
Viet
nam
Cam
bodi
aN
epal
Sri L
anka
Bhut
anTh
aila
ndIn
done
siaPh
ilipp
ines
Mon
golia
Iran
Mal
aysia
Saud
i Ara
bia
Om
anRO
CCh
ina
Bahr
ain
Brun
eiFi
jiTu
rkey
Kuw
ait
Qat
arU
AEH
ong
Kong
Sing
apor
eKo
rea
Japa
nAu
stra
lia
0
−30
−60
60
30
−90
%
2011 2016
−72 −71
−73−83
−69 −69 −68 −67 −67 −67 −65 −64 −59 −59 −59 −58 −56 −52 −51 −50−49 −46 −44 −43 −42 −41 −38 −34 −31 −30 −29 −23
3556
−64−62−74
−66−67−71 −69−69−65−69−62
−70−71−66 −63 −64
−53−48 −52
−66
−43
−58 −63−53
−48
−25−38
−27
−68
Figure 4 Price Differentials of GDP_Price Level Index for GDP defined as the ratio of PPP for GDP to exchange rate (reference country=US) in 2011 and 2016
Sources: PPP by World Bank (2014) and AMA rates by United Nations Statistics Division (UNSD).
Figure 5 GDP of Asia and the EU, Relative to the US_Index of GDP at constant market prices in 1970–2016, using 2011 PPP
Sources: Official national accounts in each country, including au-thor adjustments.
40
70
100
130
160
190
220
280
250
US=100
Asia30
US
East AsiaAPO20
EU15
1970 1975 1980 1985 1990 1995 2000 2005 2010 2015
©20
18 A
sian
Prod
uctiv
ity O
rgan
izat
ion

20
3 Economic Growth
The relative size of China’s economy in 2016 was 4.1 times that of Japan, compared with 2.3 times when exchange rates are used in Figure 3. Considering that the Chinese economy was only 26% that of Japan and 57% that of India in 1970, it represents remarkable growth. China overtook Japan after 1999 to be-come the leading economy in Asia, as shown in Figure 6.11 On this measure, Figure 6 also demonstrates that Chinese GDP overtook the US as the world’s largest economy in 2013, although it was only 8% that of the US in 1970. The level and the timing to overcome should not be taken as precise numbers, but they provide a good basis for assessing the relative production size of these two economies. Maddison (2007) evaluates China was the largest producer in the world as of 1880.12 For the first time in more than 130 years, China comes back to this position.
Given that PPP for India has been revised by –24% in the 2011 ICP round (see Appendix 6, p. 140), the effects have been to raise the relative size of India. Compared to Japan, the Indian economy has been in-creasing from 45% in 1970 to 165% in 2016, surpassing Japan and replacing it as the second largest economy in Asia in 2009. In 2016, the total GDP of the three countries, which are counted as the largest economies in Asia, was larger than the US economy by 90%.
Figure 7 shows the rapid expansion of the relative size of the South Asian economy (consisting of Ban-gladesh, Bhutan, India, Nepal, Pakistan, and Sri Lanka), 82% of which was accounted for by India in 2016. The ASEAN also showed vigor in their catch-up effort. They were on par with the South Asian economy in 1996–1997 before the setback, caused by the Asian financial crisis of 1997–1998, took hold, setting them on a lower growth path and once again opening up a divergence. In contrast, the progress of GCC13 countries lagged for more than two decades. Only in the past decade has it picked up and brought the relative size of the country group back to its previous peak of the early 1980s.14
11: The shift of the benchmark year PPP estimates from 2005 to 2011 has the effect of bringing forward the year when China over-took Japan in relative GDP to 1999, from 2002 in Databook 2013.
12: BBC News: “Is China’s economy really the largest in the world?” 16 December 2014.13: GCC consists of Bahrain, Kuwait, Oman, Qatar, Saudi Arabia, and the UAE. These GCC countries display economic charac-
teristics very different from those of other Asian economies due to their profound reliance on the oil and energy sector. In 2015, these countries account for about 33% of the world’s crude oil reserves and possess at least 21% of the global natural gas reserves (GCC Secretariat General, 2017).
India
China
US=100
0
20
40
60
80
120
100 US
Japan
1970 1975 1980 1985 1990 1995 2000 2005 2010 2015
Figure 6 GDP of China, India, and Japan, Relative to the US_Index of GDP at constant market prices in 1970–2016, using 2011 PPP
Sources: Official national accounts in each country, including au-thor adjustments.
US=100
South Asia
ASEAN
GCC
ASEAN6
CLMV0
10
20
30
40
50
60
1970 1975 1980 1985 1990 1995 2000 2005 2010 2015
Figure 7 GDP of South Asia, ASEAN, CLMV, and GCC, Relative to the US_Index of GDP at constant market prices in 1970–2016, using 2011 PPP
Sources: Official national accounts in each country, including au-thor adjustments.
©20
18 A
sian
Prod
uctiv
ity O
rgan
izat
ion

3
21
3.1 Economic Scale and Growth
Performance of each country is also trans-formed when economic growth is used as a measure. Figure 8 shows regional com-parisons of real GDP growth, while Table 9 in Appendix 9 (p. 147) presents cross-country comparisons. The country ranking in Table 9 varies from period to period, and the economic giants no longer take precedence in the ranking. In fact, small developing Asian countries are equally capable of exhibiting exuberant growth.15 As labor costs are edging up in China (see Box 3, p. 54), the “workshop of the world” has started shifting its location to the neighboring countries such as Cambodia, the Lao PDR, Myanmar, and Vietnam,
14: In interpreting the results in this report, one must bear in mind that conventional GDP tends to overstate the income of these oil-exporting countries since it does not account for the depletion of natural resource stock, and in turn a large part of their GDP may not be sustainable. Besides, GDP growth can underestimate the growth of real income available to the country brought about by a favorable change in terms of trade, and vice versa. For an oil-exporting country, the growth wedge of the two measures could be significant in the face of volatile oil prices. See Chapter 7 (p. 111).
15: In comparison of economic growths among Asian countries, Myanmar was ranked as the top position (12.1%) and the second position (10.7%) in the periods of the first and the second half of the 2000s, respectively, in Databook 2016. However, some questions have been raised about the reliability of Myanmar’s official system of national accounts since the late 1990s. This edi-tion of Databook attempts to revise the past economic performance based on the industry-level examinations in Nomura and Shirane (2016). See Box 7 (p. 110) for the details of this revision.
−4
−2
0
2
4
6
8
10
1970−19751975−19801980−1985 1985−1990 1990−19951995−2000 2000−2005 2005−2010 2010−2016
%
ASEAN6
East Asia
GCC
South AsiaCLMV
Figure 8 GDP Growth by Region_Annual growth rate of GDP at constant market prices in 1970–2016, using 2011 PPP
Sources: Official national accounts in each country, including author adjust-ments.
Figure 9 Country Contributions to GDP Growth of Entire Asia_Contribution share to the growth of gross regional products (growth rate of Asia30=100) in 1970–1990, 1990–2000, 2000–2010, and 2010–2016
Sources: Official national accounts in each country, including author adjustments.Note: The starting period for Cambodia is 1987.
Japan
KuwaitBhutan
FijiLao PDR
CambodiaMongolia
BahrainNepal
BruneiQatar
Sri LankaMyanmar
BangladeshVietnam
OmanSingapore
Hong KongMalaysia
PhilippinesPakistan
UAEROC
ThailandIran
KoreaSaudi Arabia
IndonesiaIndia
China
−10 0 10 20 30
1970–1990
0 10 20 30 40
1990–2000
Fiji
Mongolia
BruneiLao PDR
CambodiaBahrain
Nepal
Oman
Sri LankaMyanmar
Qatar
KuwaitHong KongBangladesh
Singapore
PhilippinesVietnam
UAE
MalaysiaPakistan
ROC
ThailandSaudi Arabia
Iran
JapanKorea
Indonesia
IndiaChina
Bhutan
0 10 20 30 40 50
2000–2010 2010–2016
Fiji
MongoliaBrunei
Lao PDR
CambodiaBahrain
Nepal
OmanSri Lanka
Myanmar
Qatar
KuwaitHong Kong
BangladeshSingapore
PhilippinesVietnam
UAE
MalaysiaPakistan
ROC
ThailandSaudi Arabia
Iran
Japan
Korea
IndonesiaIndia
China
Bhutan
% %
Japan
Kuwait
BhutanFiji
Lao PDR
CambodiaMongolia
BahrainNepal
MyanmarBrunei
QatarSri Lanka
Bangladesh
Vietnam
Oman
Singapore
Hong Kong
MalaysiaPhilippines
Pakistan
UAE
ROC
Thailand
Iran
KoreaSaudi Arabia
IndonesiaIndia
China
0 20 40 60 %%
0.0 0.0 0.0 0.1 0.1 0.1 0.1 0.1 0.2 0.4 0.5 0.6 0.70.9 1.01.01.11.2 1.3 1.5 1.81.92.02.22.23.43.95.1
17.249.3
0.0 0.0 0.0 0.1 0.1 0.1 0.1 0.2 0.4 0.50.5 0.5 0.9 1.0 1.1 1.2 1.3 1.4 1.6 2.3 2.4 2.9 3.0 3.1 3.8
6.16.3 7.1
14.038.2
−0.70.0 0.0 0.1 0.1 0.1 0.2 0.2 0.2 0.3 0.4 0.4 0.5 0.6 0.7 1.0 1.5 1.7 1.8 2.3 3.0 3.3 3.3 3.8 5.0 6.97.8
10.6 16.0
29.0
0.0 0.0 0.0 0.1 0.1 0.1 0.2 0.2 0.3 0.6 0.6 0.7 0.9 0.9 1.4 1.5 1.5 1.5 1.6 1.8 1.9 1.9 2.5 2.7 4.1 7.0
21.1 65.4
−0.4−0.2
©20
18 A
sian
Prod
uctiv
ity O
rgan
izat
ion

22
3 Economic Growth
called CLMV. They are clearly the faster growing group among the ASEAN countries, at 6.6% on average per year compared with 4.8% managed by the ASEAN6 in the period 1990–2016.
The change of guards in Asia is clearly illustrated in Figure 9, which presents the country contributions to gross regional products in Asia30. While Japan was the standard-bearer in yesteryears in the left chart of Figure 9, Japan has been struggling consistently at the bottom with an average growth of 1.0% per year over the past quarter of a century (1990–2016), compared with EU15’s 1.6% and the US’s 2.4%, as shown in Table 9. China and India have emerged as the driving force, propelling Asia forward since 1990. Their growth accounts for 38% and 14% of regional growth, respectively, in the 1990s. In the recent period 2010–2016, the growth in China and India accounts for 86% of regional growth (65% and 21%, respec-tively).16 Indonesia became the third engine of Asian growth (7.0%), followed by Saudi Arabia (4.1%).
It has been a subject of much debate whether the Asian economy has decoupled from the US and the EU15. If it has, the world economy would be substantially less volatile. Figures 10 and 11 compare the correlation coefficients of growth rates among countries in the 1990s and the period from 2000 to 2016, respectively. Countries are grouped by region. Overall, the fortunes of the reference countries have become
Figure 10 Correlation of GDP Growth in 1990–2000_Correlation of GDP growth at constant market prices
Sources: Official national accounts in each country, including author adjustments.
CHN
HKG
JPN
KOR
MG
L
ROC
BAN
BTN
IND
IRN
NEP
PAK
SRI
BRN
CAM
FIJ
IDN
LAO
MAL
MYA
PHL
SIN
THA
VIE
BHR
KWT
OM
N
QAT
SAU
UAE
AUS
TUR
EU15
US
Group 1 Group 2 Group 3 Group 4 Group 5
China (CHN)Hong Kong (HKG)Japan (JPN)Korea (KOR)Mongolia (MGL)ROC (ROC)
Australia (AUS)Turkey (TUR)EU15US
Bahrain (BHR)Kuwait (KWT)Oman (OMN)Qatar (QAT)Saudi Arabia (SAU)UAE (UAE)
Brunei (BRN)Cambodia (CAM)Fiji (FIJ)Indonesia (IDN)Lao PDR (LAO)Malaysia (MAL)Myanmar (MYA)Philippines (PHL)Singapore (SIN)Thailand (THA)Vietnam (VIE)
Bangladesh (BAN)Bhutan (BTN)India (IND)Iran (IRN)Nepal (NEP)Pakistan (PAK)Sri Lanka (SRI)
If greater than 0.55 If less than −0.55
1.00.5 1.0
−0.1 0.5 1.00.2 0.8 0.6 1.0
−0.6 −0.5 −0.2 −0.2 1.00.5 0.8 0.4 0.7−0.7 1.00.4 −0.0 0.1 −0.1 0.1 −0.2 1.0
−0.3 −0.3 −0.3 −0.1 0.8 −0.5 0.3 1.00.1 −0.4 −0.3 −0.1 0.6 −0.4 0.6 0.8 1.00.0 0.1 0.4 −0.1 −0.4 0.0 0.5 −0.4 −0.1 1.00.1 0.1 −0.1 0.2 −0.2 −0.1 0.3 −0.1 0.2 0.4 1.00.4 0.4 0.4 0.4 −0.5 0.7 0.4 −0.0 0.1 0.4 −0.1 1.00.3 0.3 −0.1 0.1 −0.1 −0.0 −0.3 −0.2 −0.3 −0.3 0.2 −0.5 1.00.3 0.4 0.5 0.6 −0.3 0.6 0.3 0.0 0.2 0.3 0.0 0.9 −0.5 1.0
−0.2 0.4 0.2 0.7 0.2 0.4 −0.3 0.3 0.0 −0.1 −0.0 0.3 −0.1 0.5 1.00.3 −0.1 −0.4 0.1 0.1 0.1 0.4 0.5 0.8 −0.0 0.2 0.4 −0.5 0.4 0.3 1.00.5 0.9 0.7 0.9 −0.4 0.8 0.1 −0.3 −0.2 0.0 0.1 0.5 0.2 0.5 0.3 −0.0 1.00.2 0.4 0.1 0.6 0.5 0.1 0.2 0.6 0.6 −0.4 0.0 0.1 0.1 0.2 0.4 0.5 0.5 1.00.5 0.9 0.7 0.9 −0.4 0.7 0.1 −0.3 −0.2 0.1 0.1 0.5 0.2 0.5 0.3 0.0 1.0 0.5 1.00.2 0.3 −0.1 0.1 0.1 −0.0 0.5 0.5 0.3 0.3 0.2 0.3 0.1 0.3 0.4 0.3 0.1 0.3 0.1 1.00.1 0.4 0.3 0.4 0.5 −0.1 0.3 0.3 0.4 −0.1 0.2 −0.2 0.3 −0.1 0.1 0.1 0.4 0.8 0.5 0.3 1.00.6 0.9 0.4 0.8 −0.3 0.6 0.0 −0.2 −0.1 −0.0 0.2 0.2 0.5 0.2 0.3 0.0 0.9 0.6 0.9 0.3 0.6 1.00.6 0.7 0.5 0.8 −0.6 0.8 0.2 −0.3 −0.0 0.2 0.3 0.7 −0.0 0.8 0.3 0.3 0.8 0.3 0.8 0.1 0.1 0.7 1.00.5 0.3 0.4 0.1 0.1 0.0 0.7 0.2 0.4 −0.0 −0.1 0.2 0.2 0.2 −0.3 0.1 0.5 0.5 0.4 0.2 0.7 0.4 0.3 1.00.3 0.1 −0.2 −0.1 −0.6 0.0 0.3 −0.3 −0.2 0.4 0.8 0.0 0.3 −0.2 −0.4 −0.0 0.0 −0.4 0.1 0.1 −0.2 0.1 0.2 −0.1 1.00.6 0.1 −0.4 −0.2 −0.1 0.0 0.6 0.4 0.4 0.0 0.1 0.3 0.1 0.1 −0.2 0.5 −0.0 0.2 0.0 0.7 0.1 0.2 0.1 0.4 0.4 1.00.5 0.5 0.3 0.1 −0.7 0.5 0.1 −0.4 −0.6 0.1 −0.2 0.3 0.4 0.1 −0.2 −0.5 0.4 −0.3 0.4 0.3 −0.1 0.4 0.3 0.3 0.3 0.3 1.0
−0.3 −0.1 −0.2 −0.4 0.4 −0.4 −0.1 0.4 −0.0 −0.4 −0.5 −0.3 0.1 −0.5 −0.1 −0.3 −0.3 0.0 −0.2 0.2 0.1 −0.2 −0.7 0.1 −0.2 0.2 0.2 1.0−0.2 0.2 0.5 −0.0 −0.5 0.3 −0.3 −0.6 −0.8 0.5 −0.4 0.3 −0.2 0.1 −0.1 −0.6 0.1 −0.7 0.1 −0.2 −0.5 −0.2 0.0 −0.3 −0.0 −0.4 0.5 0.0 1.0−0.2 0.3 0.4 0.3 0.6 −0.2 0.1 0.5 0.3 −0.1 −0.3 −0.0 0.2 0.1 0.5 −0.1 0.2 0.6 0.3 0.5 0.6 0.3 −0.1 0.4 −0.6 0.0 0.0 0.4 −0.2 1.00.1 −0.5 −0.7 −0.5 0.5 −0.6 0.4 0.7 0.7 −0.4 −0.0 −0.3 0.0 −0.4 −0.4 0.5 −0.4 0.3 −0.4 0.2 0.3 −0.3 −0.4 0.4 0.0 0.6 −0.3 0.4 −0.7 0.0 1.00.1 0.1 0.3 −0.2 −0.2 −0.2 0.5 −0.1 −0.1 0.3 0.2 0.0 0.3 −0.2 −0.5 −0.4 0.1 −0.2 0.1 0.2 0.2 0.0 −0.1 0.5 0.6 0.3 0.6 0.3 0.1 0.0 0.1 1.0
−0.7 −0.2 0.1 −0.0 0.7 −0.3 −0.3 0.5 0.1 −0.2 −0.5 −0.2 −0.1 −0.0 0.5 −0.2 −0.3 0.1 −0.3 0.2 0.0 −0.3 −0.5 −0.3 −0.7 −0.4 −0.3 0.4 0.1 0.7 −0.1 −0.3 1.0−0.2 −0.3 −0.5 −0.3 0.7 −0.6 0.3 0.8 0.6 −0.2 −0.1 −0.3 −0.0 −0.3 0.1 0.4 −0.4 0.4 −0.4 0.6 0.4 −0.2 −0.5 0.1 −0.2 0.5 −0.4 0.5 −0.6 0.5 0.7 −0.1 0.4 1.0
16: The growth in the Chinese manufacturing sector explains about one-third of China’s contribution to regional growth (22 per-centage points of 64%) in the period 2000–2016. See Figure 91 in Section 6.2 (p. 101) for the industry origins of regional growth.
©20
18 A
sian
Prod
uctiv
ity O
rgan
izat
ion

3
23
3.2 Catching Up in Per Capita GDP
increasingly tied to Asia in a pro-cyclical manner. It is interesting to note that China’s correlation with the US and the EU15 has moved from negative to positive. Correlation among the East Asian countries (Group 1) has been strengthened over time and their correlation with the US, the EU15, and the ASEAN countries (Group 3) has strengthened as well. In the South Asian countries (Group 2), their correlation with the US and the EU15 has weakened, although the correlation with ASEAN has grown stronger. Therefore, comparisons of the correlation coefficients of growth between the two periods lend support to an increase in business cycle synchronicity, but in the South Asian countries.
3.2 Catching Up in Per Capita GDP
Figure 12 presents the share of the current world population, illustrating that Asia is the most populous region in the world. In 2016, the population of Asia accounted for 60% of the world’s population (56% for Asia30), with China and India alone accounting for more than one-third. In addition, there is a sig-nificant difference in the population among Asian economies, as shown in Table 10 in Appendix 9 (p. 148). Seven countries’ populations were over 100 million in 2016 (the Philippine population reached 100 million in 2015), but the populations are less than 10 million in 12 economies of the Asia30.17 Perfor-mance comparisons based on the whole-economy GDP in Section 3.1 do not take into account the popula-tion and can in turn exaggerate the wellbeing of countries with large populations. Based on per capita
Figure 11 Correlation of GDP Growth in 2000–2016_Correlation of GDP growth at constant market prices
Sources: Official national accounts in each country, including author adjustments.
China (CHN)Hong Kong (HKG)Japan (JPN)Korea (KOR)Mongolia (MGL)ROC (ROC)
Australia (AUS)Turkey (TUR) EU15US
Bahrain (BHR)Kuwait (KWT)Oman (OMN)Qatar (QAT)Saudi Arabia (SAU)UAE (UAE)
Brunei (BRN)Cambodia (CAM)Fiji (FIJ)Indonesia (IDN)Lao PDR (LAO)Malaysia (MAL)Myanmar (MYA)Philippines (PHL)Singapore (SIN)Thailand (THA)Vietnam (VIE)
Bangladesh (BAN)Bhutan (BTN)India (IND)Iran (IRN)Nepal (NEP)Pakistan (PAK)Sri Lanka (SRI)
CHN
HKG
JPN
KOR
MG
L
ROC
BAN
BTN
IND
IRN
NEP
PAK
SRI
BRN
CAM
FIJ
IDN
LAO
MAL
MYA
PHL
SIN
THA
VIE
BHR
KWT
OM
N
QAT
SAU
UAE
AUS
TUR
EU15
US
Group 1 Group 2 Group 3 Group 4 Group 5
If greater than 0.55 If less than −0.55
0.10.4 0.60.3 0.6 0.4 0.20.6 0.40.1 0.3 0.2 0.3 0.0
0.3 0.2 0.5 0.00.4 0.4 0.4 0.0 0.4 0.3 0.2
0.4 0.1 0.4 0.20.1 0.0 0.1 0.1 0.3 0.1 −0.0 0.10.2 0.3 −0.0 0.1 0.2 0.3 0.5 0.30.3 0.5 0.3 0.0 0.6 0.5 0.4 0.1 0.2 0.3 0.00.4 0.3 0.3 0.3 0.4 0.4 −0.1 0.20.5 0.4 0.5 0.5 0.3 0.3 0.0 0.4 0.2 0.4
0.2 0.4 0.2 0.4 0.2 0.0 0.00.4 0.5 0.3 0.1 0.5 0.2 0.1 0.3
0.0 0.0 0.2 0.5 0.1 0.3 0.1 −0.2 0.40.3 0.5 0.1 0.3 0.3 0.2 0.1 0.1 0.3 0.3 0.1
−0.0 0.2 0.2 0.3 0.2 0.2 0.3 0.0 −0.0 0.2 0.2 0.2−0.0 0.2 0.3 0.5 0.0 0.4 0.2 0.3 0.5 0.2 0.4 0.5 0.2 0.1
0.5 0.2 0.4 0.5 0.3 0.1 0.2 0.4 0.5 0.2 0.1 0.10.3 0.2 0.3 0.3 0.3 −0.1 0.2 0.4 0.5 0.2 0.1 0.1 0.50.4 0.5
0.50.3 0.5 0.4 0.3 0.3 0.4 0.3 0.3 0.3 0.4
0.5 0.4 0.4 0.2 0.4 0.0 0.2 0.4 0.4 0.1 0.1 0.1 0.2 0.4 0.0 0.2 0.4 0.40.3 0.5 0.4 0.1 0.3 0.1 0.1 0.2 0.2 0.4 0.4 0.2 0.4 0.2 0.3 0.5 0.5
0.6 −0.0 0.1 0.3 0.1 0.00.6 0.0 0.4 0.4 0.5 0.1 0.3 0.2 0.3 0.1 −0.0 0.4 0.3 0.3 0.5 −0.1 0.2 −0.0 −0.0 0.1 0.1 0.3 0.1 0.1
0.1 0.5 0.4 0.3 0.2 0.1 0.3 0.5 0.1 0.5 0.2 0.5 −0.0 0.5 0.3 0.4 0.2 0.2 0.1 0.10.2 0.3 0.4 0.2 0.1 0.1 0.0 0.4 0.4 0.4 0.2 0.5 0.5 0.4 0.5 0.4 0.4 0.20.4 0.3 0.3 0.4 0.4 0.2 0.4 −0.0 0.3 0.6 0.1 0.0 0.2 0.3 0.5 0.3 0.2 0.2 0.50.2 0.4 0.2 0.0 0.2 0.1 0.2 0.3 0.2 0.4 0.0 0.1 0.4 0.3 0.2 0.5 0.2 0.20.3 0.3 0.3 0.4 0.2 0.4 0.4 0.1 0.4 0.3 0.1 0.4 0.5 0.5 0.5 0.5 0.4 0.5 0.2 0.3 0.50.1 0.5 0.4 0.2 0.1 0.3 0.2 0.3 0.3 0.4 0.2 0.2 0.4 0.5 0.4
−0.3−0.2−0.2−0.3 −0.2
−0.1 −0.2−0.1 0.0
−0.2−0.3 −0.1 −0.3
−0.1−0.4 −0.2 −0.4 −0.2 −0.2 −0.3 −0.1 0.0
−0.2 −0.2 −0.0 −0.10.2 0.0 −0.1 0.1 −0.0 −0.2 −0.3 −0.0
−0.4 −0.0 −0.5 −0.2 −0.2 0.0−0.1 −0.2
−0.2 −0.0 −0.1−0.0 −0.2 −0.3 −0.1 −0.2 −0.2 −0.1 −0.0
−0.2 0.1−0.1 −0.1 −0.1 −0.2
−0.1 −0.3 −0.3 −0.5 0.0 −0.5 −0.3 0.1 −0.3 −0.4 −0.3 −0.3 −0.4 −0.3 −0.3 −0.3−0.6 −0.2 −0.4−0.1
−0.1 −0.2 −0.0 −0.1 −0.0 −0.2−0.2 −0.3 −0.1 −0.3
−0.1 −0.3 −0.1 0.0 −0.1 −0.1 −0.1−0.4
−0.2 −0.0 −0.3−0.2 −0.1 −0.4 −0.0
1.00.6 1.0
0.7 1.00.6 1.0
1.00.8 0.7 0.7 1.0
1.00.6 0.6 1.0
1.00.5 0.6 0.6 1.0
1.00.5 1.0
1.00.6 0.4 1.0
0.8 0.5 0.5 1.01.0
0.6 0.6 0.4 0.8 1.01.0
0.8 0.8 0.6 0.9 0.6 0.5 0.6 1.00.3 1.0
0.6 0.8 0.5 0.7 1.00.6 0.9 0.7 0.6 0.9 0.6 0.6 0.8 0.6 1.0
0.7 0.6 0.6 0.6 0.6 1.00.6 0.6 0.7 1.0
0.7 0.4 0.4 0.6 1.00.6 0.5 0.7 0.5 1.0
1.00.8 0.6 1.0
0.6 0.7 1.00.7 0.6 0.7 0.6 0.7 0.8 0.7 1.0
0.4 0.8 0.6 1.00.8 0.6 0.7 0.7 0.6 0.6 0.6 0.8 0.6 0.7 0.6 0.7 1.00.7 0.8 0.7 0.5 0.8 0.6 0.6 0.5 1.00.7 0.9 0.6 0.6 0.6 0.8 0.7 0.6 0.6 0.6 0.6 0.8 0.7 0.8 1.0
−0.6
−0.4
©20
18 A
sian
Prod
uctiv
ity O
rgan
izat
ion

24
3 Economic Growth
GDP, which adjusts for the differences in population, China and India, two rising giants in the Asian econo-my, remain substantially less well-off in light of the US standard. Conversely, the Asian Tigers proliferate.
Figures 13 and 14 show comparisons of per capita current-price GDP, using exchange rates as conversion rates, among Japan and the Asian Tigers, relative to the US. A snapshot-level comparison is also presented in Table 11 in Appendix 9 (p. 149), although snapshot comparisons can appear arbitrary due to the volatile nature of ex-change rates. Rather, long-term trends of nominal per capita GDP provide a better guide of relative move-ments. Based on this measure, Japan closed in on the US level in the late 1980s and peaked in 1995, reflecting the strong yen of 94.1 yen per dollar, as shown in Figure 13. However, it is 32% below the US level in 2016, in which the average annual exchange rate is 108.8 yen per dollar.
Singapore and Hong Kong moved closely with one another for three and a half decades until the mid-2000s, when Singapore overtook Hong Kong, as shown in Figure 14.18 Hong Kong’s per capita GDP peaked in 1997, the year when Hong Kong was returned to China, and subsequently plummeted until 2004. Singapore followed a similar path to that of Hong Kong – peaking in 1996, and falling to an all-time low in 2002 – before the surge from the late 2000s. The ROC and Korea moved together but at a lower level than Singapore and Hong Kong.
17: In Myanmar, the first census in three decades was conducted between March 30 and April 10, 2014. This showed that the total population was 51 million, which was considerably below the official estimate of 61 million.
18: Singapore’s population comprises not only Singaporean citizens but also non-citizens who have been granted permanent resi-dence in Singapore, as well as non-permanent residents such as employment pass holders, work permit holders, and student pass holders. It is known that many workers and students commute to Singapore from outside the country every day. According to the economic census in 2000, the share of Singaporean citizens with respect to total population was 74%, the share of permanent residents who are not Singaporean citizens was 7%, and the share of non-permanent residents was 19%.
Figure 12 Asia in World Population_Share of number of population in 2016
Source: IMF, World Economic Outlook Database, May 2018.
Asia60 %
2016
EU287 %
Others29 %
US4 %
EU156 % Asia30
56 %
APO2035 %
Other Asia 4 %
Figure 13 Per Capita GDP using Exchange Rate of Japan and Australia, Relative to the US_Index of GDP at current market prices per person in 1970–2016, using annual average exchange rate
Sources: Official national accounts in each country, including au-thor adjustments.
20
40
60
80
100
120
140
160
1970 1975 1980 1985 1990 1995 2000 2005 2010 2015
Japan
Australia
US
US=100 in each year
Figure 14 Per Capita GDP using Exchange Rate of the Asian Tigers, Relative to the US_Index of GDP at current market prices per person in 1970–2016, using annual average exchange rate
Sources: Official national accounts in each country, including au-thor adjustments.
0
20
40
60
80
100
120
1970 1975 1980 1985 1990 1995 2000 2005 2010 2015
US=100 in each year
ROC Korea
US Singapore
Hong Kong
©20
18 A
sian
Prod
uctiv
ity O
rgan
izat
ion

3
25
3.2 Catching Up in Per Capita GDP
The views found in Table 11 are considerably revised if focusing on production or real income per capita, using PPP as the conversion rates. In terms of per capita GDP at constant prices using PPP in Figure 15 and Table 12 in Appendix 9 (p. 150), Japan was the first country in Asia to start catching up with the US. By 1970, its per capita GDP was 61% of the US, quite a distance ahead of other Asian countries. Japan had been closing the gap with the US steadily until 1991 (86%), but the gap widened again when the impact of the long recession of the 1990s started to manifest itself.19 In recent years, Japan’s level has sta-bilized to around 70–73% of the US, as shown in Figure 15.
Japan’s per capita GDP was the highest among Asian countries until it was overtaken by Singapore in 1980.20 The result highlights the outcome of the dramatic development effort made by the Asian Tigers, as shown in Figure 16. Not only were they inching to the top, they were constantly closing the gap with the US. Starting from a level of 42% the US in 1970, Singapore surpassed the US in 1993.21 In 2016, Singapore had a per capita GDP which was 55% above the US. It became the richest economy in Asia, representing a remarkable achievement. Hong Kong holds the second place, with a per capita GDP similar to the US since the early 2010s. The ROC and Korea trail behind the other two Asian Tigers at 84% and 66% of the US, respectively.
The relative performance of China and India, the two most populous countries in the world (1.38 billion and 1.32 billion in 2016, respectively, as presented in Table 10 in Appendix 9, p. 148), is diminished in this
19: Jorgenson, Nomura, and Samuels (2016) indicated that the manufacturing sector was the main contributor to the catching-up process of the Japanese economy in the 1960s, and that, by 1980, the US–Japan TFP gap for the manufacturing sector had almost disappeared. Japanese manufacturing productivity relative to the U.S. peaked at 103.8 in 1991 and deteriorated afterward, leaving a current gap that is almost negligible.
20: Among the mature economies in Asia, Singapore is a unique country, in which the PPP was downwardly revised from the 2005 ICP to the 2011 ICP (see Figure 116 in Appendix 6, p. 141). This shift has the significant effect of bringing forward the year when Singapore overtook Japan (or US) in relative per capita GDP to 1980 (1993 for the US), from 1993 (2004 for the US) as estimated in the Databook 2013, based on the 2005 ICP. Although this edition follows the 2011 ICP results, it may require a further examination if this time-series level comparison, based on the constant PPP approach, can provide an appropriate picture, especially for Singapore.
21: Generally, Singapore’s GNI is lower than its GDP, and over the past four decades, the divergence was the largest in 2004 with GNI equivalent to 93% of GDP (see Figure 97 in Section 7.1, p. 113). On the other hand, the US GNI never goes outside +2% of GDP. However, Singapore’s lead of 55% over the US in 2016 was large enough that their relative positions would be indepen-dent of whether GNI or GDP was used. Based on the comparison among cities in Box 5 (p. 85), the per capita GDP in Singa-pore was 18% below New York but 44% above Tokyo in 2016.
Figure 15 Per Capita GDP of Japan, the EU, and Australia, Relative to the US_Index of GDP at constant market prices per person in 1970–2016, using 2011 PPP
Sources: Official national accounts in each country, including au-thor adjustments.
50
60
70
80
90
100
1970
US=100 in each year
1975 1980 1985 1990 1995 2000 2005 2010 2015
US
EU15
Japan
Australia
Figure 16 Per Capita GDP of the Asian Tigers, Relative to the US_Index of GDP at constant market prices per person in 1970–2016, using 2011 PPP
Sources: Official national accounts in each country, including au-thor adjustments.
0
20
40
60
80
100
120
140
160US=100 in each year
1970 1975 1980 1985 1990 1995 2000 2005 2010 2015
US
Singapore
ROC
Korea
Hong Kong
©20
18 A
sian
Prod
uctiv
ity O
rgan
izat
ion

26
3 Economic Growth
measure due to their population. Their per capita GDP is 27% and 11% of the US in 2016, respec-tively, as shown in Figure 17. However, this should not taint the remarkable progress made over the past decades, especially by China, where the per capita GDP was only 2% of the US and 38% of India in 1970. China’s relative per capita GDP has increased more than tenfold in these four decades. China overtook CLMV after 1988, India after 1993, and ASEAN6 after 2013. The income gap between the US and the majority of Asian coun-tries is still sizable (the level achieved by the Asia30 was 23% of the US),22 indicating a signifi-cant opportunity for catch-up. Table 12 in Appendix 9 (p. 150) also presents indi-vidual figures for seven oil-rich economies (the six GCC countries and Brunei). At first glance, fig-ures in 1970, and those to a lesser extent in 1990, suggest these economies had remarkably higher per capita GDP than those of Japan and the US. For example, in 1970, Kuwait, Qatar, and Brunei had a per capita GDP 13.1 times, 10.9 times, and 6.1 times that of Japan, respectively. However, the measurement of GDP as an indicator of production is misleading for these countries, as it erroneously includes proceeds from the liquidation of a natural resource stock as part of the income flow. In other words, GDP overestimates income from the oil-exporting economies because it does not account for depletion of their natural resource assets. To give a rough indication of the extent of distortion, Figure 18 provides comparisons of per capita GDP excluding production of the min-ing sector (e.g., crude oil and natural gas). The non-mining GDP per person in GCC economies, such as the UAE, Bahrain, and Kuwait, is almost simi-lar to Japan’s level, although total GDP per capita is much larger. In Iran and Malaysia, the dependence on mining sector is more moderate than those in GCC in this period. In Myanmar, however, the mining sector explains more than half of the current GDP. According to the re-cent findings in Global Witness (2015a and 2015b), the total transaction value of jade is es-timated at 48% of Myanmar’s GDP in 2014 (see Box 7, p. 110).
Catching up with the per capita GDP level of advanced economies is a long-term process that could take several decades to accomplish. Empirical evidence suggests there may be a negative correlation between per capita GDP level and the speed of catching up, with some exceptions. With the possibility of adopting
22: Per capita GDP may have underestimated the welfare of people in some countries. In the ROC, Hong Kong, and Japan, for ex-ample, GNI is consistently higher than GDP although the fluctuations are within +6%. The Philippines is the exception where the divergence between GNI and GDP has been increasing and has become significant for the past two decades, and GNI was more than 30% higher than GDP in the 2010s (See Figure 97 in Section 7.1, p. 113).
Figure 18 Per Capita Non-Mining GDP of Resource-Rich Countries and Japan_GDP at constant market prices per person in 2016, using 2011 PPP, reference year 2016
Sources: Official national accounts in each country, including author adjustments.
0 30 60 90 120 150
Thousands of US dollars (as of 2016)
Non-mining GDP
Mining GDP
Myanmar
Iran
Oman
Malaysia
Saudi Arabia
Bahrain
Kuwait
Japan
Brunei
UAE
Qatar
2.2
23.2
23.6
29.2
34.5
37.4
39.5
42.4
44.1
66.7
16.4
41.718.5
47.112.6
1.8 41.3
75.332.9
74.530.4
84.0 46.6
54.925.7
3.7 27.3
2.6 4.8
2.8 19.2
136.369.6
Figure 17 Per Capita GDP of China, India, and ASEAN, Relative to the US_Index of GDP at constant market prices per person in 1970–2016, using 2011 PPP
Sources: Official national accounts in each country, including au-thor adjustments.
0
5
10
15
20
25US=100 in each year
1970 1975 1980 1985 1990 1995 2000 2005 2010 2015
ASEAN6
India CLMV
China
©20
18 A
sian
Prod
uctiv
ity O
rgan
izat
ion

3
27
3.2 Catching Up in Per Capita GDP
successful practices and technologies from the more advanced economies, less advanced economies are poised to experience faster growth in per capita GDP, enabling themselves to catch up to average income levels. However, as their income levels approach those of the more advanced countries, their economic growth rates are expected to gradually decline over time.23
Figure 19 plots countries’ initial per capita GDP levels against their respective average growth rates per year between 1970 (or the initial year data first became available for the country in question) and 2016. If the two variables have a correlation coefficient of –0.5 (i.e., a negative relationship of medium strength), the higher the initial income level becomes, the more slowly the average growth rate per year is expected to move. However, this is not always true. Low-income countries like Bangladesh, Nepal, the Philippines, and Fiji have failed to catch up, while Thailand and Malaysia could be expected to have grown even faster, given their initial income levels. The Asian Tigers have experienced robust growth in the past four de-cades, but Korea and the ROC, with their lower initial per capita GDP, have sustained higher growth rates than Singapore and Hong Kong. Relative to the Asian Tigers, China appears to be at the start of the catch-up process. Mature economies like the US, the EU15, and Japan, shared similar growth experi-ences (around 2% on average per year, in the past four decades).
Table 1 summarizes Figure 19 by grouping countries. Four levels of per capita income groups are defined: Group-B1, with per capita GDP at or above 60% of the US in 1970; B2, from 20% to under 60%; B3, from 10% to under 20%; and B4, below 10%. Likewise, countries are also grouped according to the aver-age speed of their catch-up with the US from 1970 to 2016: Group-A1, at 3% per annum or above; A2, from 2% to under 3%; A3, from 1% to under 2%; A4, from 0% to under 1%; A5, from –1% to under 0%; and A6, under –1%. The speed of catch-up with the US is defined as the difference in the average annual
23: The OECD (2018b) observes that GDP per capita has broadly converged in the OECD countries since the 1970s. However, more advanced economies that started with high income levels in the 1970s have had lower rates of catch-up, stagnated or re-cently diverged vis-à-vis the US.
Figure 19 Initial Level and Growth of Per Capita GDP_Level and average annual growth rate of GDP at constant market prices in 1970–2016, using 2011 PPP, reference year 2016
Sources: Official national accounts in each country, including author adjustments.Note: The starting period for Cambodia is 1987.
Bangladesh
0
5
1
2
3
4
6
0 2 4 6 8 10 12 14
Growth rate of per capita GDP during 1970−2016
Per capita GDP at constant prices
Thousands of US dollars (as of 2016)
1970 1990 2016
%
0
1
2
3
4
5
6
7
8
0 10 20 30 40 50 60 70 80 90
Growth rate of per capita GDP during 1970−2016
Per capita GDP at constant prices
Thousands of US dollars (as of 2016)
%
1970 1990 2016
ROC
China
Cambodia
BhutanIndonesia
Lao PDR
Vietnam
Sri Lanka
Mongolia
NepalPhilippines
Fiji
Singapore
Hong Kong
Turkey
Japan
USAustralia
EU15Iran
Myanmar
India
Pakistan
Malaysia
Thailand
Korea
©20
18 A
sian
Prod
uctiv
ity O
rgan
izat
ion

28
3 Economic Growth
growth rate of per capita real GDP between each country and the US. Table 1 shows that many Asian countries (not belonging to Group-A5 and Group-A6) have managed to close the gap in per capita real GDP with the US over the last four decades, although some are more successful than others.
From Table 1 one can see the initial economic level does not fully explain the catch-up process. If it did, the table would have been populated diagonally from the bottom left corner to top right corner. Of the Asia30 countries, four achieved a very fast catch-up (over 3% per year on average) between the respective starting years of their data series and 2016. Their initial per capita GDP level classifies them into the two groups: the ROC and Korea from Group-B3 and Cambodia and China from Group-B4. Ten countries in Group-A5 and Group-A6 experienced deterioration in their relative income level against the US with low-income countries like Fiji failing to take off. The six high-income Asian countries in Group-A5 and Group-A6 are all oil exporting countries, which had an exceptionally high GDP (a distortion, as afore-mentioned) at the beginning of the period. Japan was the only Asian non-oil-exporting country with a high-income level in 1970. But, like the EU15, it has since failed to achieve further parity with the US.
3.3 Sources of Per Capita GDP Gap
To further understand the diverse performance in the Asian group, per capita GDP can be simply broken into two components: labor productivity (defined as real GDP per worker in this section) and the employment rate.24 Figure 20 shows the percentage point differences in per capita GDP decomposed into the contributions by the labor productivity gap and the employment rate gap, relative to the US in 1990 and 2016.25 Most of the Asian countries display a huge per capita GDP gap with the US. This is pre-dominantly explained by their relative labor productivity performance.
With the exception of the Asian Tigers, GCC, Japan, and Iran, all the other Asian countries had labor productivity gaps of more than 50% against the US in 2016. At the top end of performance, estimates show Singapore was 16% above while Hong Kong was 7% below the US labor productivity level. In
24: Employment rate (or employment-population rate) is defined as the ratio of workers relative to the population, to ensure consis-tency with the definition of labor productivity (i.e., GDP per worker). Further details in productivity performances are provided in Chapter 5. In Section 5.2 (p. 58), labor productivity measures are provided based on hours worked, which are based on the Asia QALI Database (see Box 4, p. 81). In TFP measurement in Section 5.3, hours worked are used as labor inputs in this edi-tion of Databook.
Table 1 Country Groups Based on the Initial Economic Level and the Pace of Catching Up_Level and average annual growth rate of per capita GDP at constant market prices, using 2011 PPP
Sources: Official national accounts in each country, including author adjustments.Note: The annual catch-up rates are based on the difference in the growths of per capita GDP at constant prices be-tween each country and the US during 1970–2016. The starting year for Cambodia is 1987.
Per capita GDP level in 1970,
relative to the US
Average annual rate of catch-up to the US during 1970–2016
(A6) <–1%
(A5) –1% <–<–< 0%
(A4) 0% <–<–< 1%
(A3) 1% <–<–< 2%
(A2) 2% <–<–< 3%
(A1)3% <–
(B1) 60% <–
Bahrain, Brunei, Kuwait, Qatar, Saudi Arabia
Australia, EU15, UAE
Japan, Oman
(B2) 20% <–<–< 60%
Iran TurkeyHong Kong, Singapore
(B3) 10% <–<–< 20% Fiji Philippines Mongolia
Malaysia,Thailand
ROC, Korea
(B4) 0% <–<–< 10%
Bangladesh, Nepal, Pakistan
India, Lao PDR, Myanmar,Sri Lanka
Bhutan,Indonesia,Vietnam
Cambodia,China
©20
18 A
sian
Prod
uctiv
ity O
rgan
izat
ion

3
29
3.3 Sources of Per Capita GDP Gap
25: The gap of country x’s per capita GDP relative to the US is decomposed into the sum of the gap of labor productivity and em-ployment rate with respect to the US, as in:ln (GDPx
t / POPxt ) − ln (GDPU S
t / POPU St ) = ln (GDPx
t / EMPxt ) − ln (GDPU S
t / EMPU St ) + ln (EMPx
t / POPxt ) − ln (EMPU S
t / POPU St )
Gap of per capita GDP Gap of labor productivity Gap of employment rate
where POPxt is population of country x in period t and EMPx
t is the number of employment of country x in period t.
Singapore, its employment rate was 38 percentage points higher, giving an overall per capita GDP which was 55% higher than the US in 2016. The labor productivity gaps of the other two Asian Tigers are still sizable against the US, at 21% and 44% for the ROC and Korea, respectively. In most countries, the effect of the employment rate widened the per capita GDP gap in 1990. However, in recent years, more Asian countries have employment rates higher than the US, with the effect of narrowing the gap.
Figure 21 focuses on explaining a country’s per capita GDP growth by its components: namely labor productivity growth and the change in the employment rate for the periods 1990–2010 and 2010–2016, respectively.26 For most countries, labor productivity explains a larger share of per capita GDP growth than employment. China’s improvement was the most impressive, achieving per capita GDP growth of 9.2% and 6.9% per year on average in the two periods, respectively. Improvement in labor productivity explains almost all of that growth. However, this should not lead us to underestimate the role of changes in the employment rate. The employment rate contribution, relative to labor productivity, was also highly
Figure 20 Sources of Per Capita GDP Gap_Percentage point differentials in per capita GDP at constant prices in 1990 and 2016, relative to the US
Sources: Official national accounts in each country, including author adjustments.
1990
2016
% Bang
lade
shCL
MV
Viet
nam
Mya
nmar
Nep
alCh
ina
Lao
PDR
Indi
aSo
uth
Asia
Bhut
anPa
kist
anSr
i Lan
kaAs
ia24
Phili
ppin
esAs
ia30
ASEA
NIn
done
siaEa
st A
siaM
ongo
liaAP
O20
ASEA
N6
Fiji
Thai
land
Iran
Mal
aysia
Turk
eyKo
rea
ROC
Hon
g Ko
ngEU
15Au
stra
liaJa
pan
Sing
apor
eG
CC
−100
−80
−60
−40
−20
0
20
40
60
%
−100
−80
−60
−40
−20
0
20
40
60
Employment rateLabor productivity Per capita GDP
Nep
alBa
ngla
desh
Cam
bodi
aM
yanm
arPa
kist
anCL
MV
Sout
h As
iaVi
etna
mIn
dia
Lao
PDR
Phili
ppin
esFi
jiBh
utan
APO
20AS
EAN
Indo
nesia
Mon
golia
Sri L
anka
Asia
24Ai
sa30
ASEA
N6
Chin
aTh
aila
ndEa
st A
siaIra
nTu
rkey
Mal
aysia
Kore
aJa
pan
EU15
ROC
Aust
ralia
Hon
g Ko
ngG
CCSi
ngap
ore
−87 −91 −96 −86
−96
−91 −101
−96
−93 −90 −88
−7
−95
−83−75 −76
−89−79
−88 −83 −83 −93
−87
−77 −79−81
−66−89
−82
−37
−61 −51−64 −50
−26
−27
−14 −19 −22
−18
−14−7
70
29
−10 −10
−97 −96 −96
−6 0 −5
−96
5
−3
−95
−5
−95
−10
−94
−19
−93
−14
−90
−1
−90
−10
−90
−1 −5 −5
−89 −88 −88
6
−10
−87
−7
−86
−4
−85
−18
−84
8
−39
−76
−13
−74
−20
−71
−8−58
−1 −8−22
−3
−22
4 6
−41
−5
−69
−95 −87−102
−89
−92
−75−95
−90
−80 −97 −80
−9
−89
−93 −79 −72−90 −81 −79
−67 −67−78
−79
−76 −76 −83 −80 −77
−67
−36 −33−52 −44
−34−25
−27
−21 −18−72
199
16
55
0
−3
−95 −94 −93
−7
8
−16
−91
5
−9
−89
9
−89
4
−89
−7
−86
−12
−84
6
−84
−74
−7
−81
2
−80
0 −12 −11
−79 −79 −79
−1 −1
−77
0
−76
10
−73
10
−70
10
−31
−67
−23
−56
−1
−53
6
−28
−2
4
−16
5
−13
9
−10
38
9
−34
©20
18 A
sian
Prod
uctiv
ity O
rgan
izat
ion

30
3 Economic Growth
significant in Asian Tigers, i.e., the ROC (43%), Singapore (43%), and Korea (41%), Nepal (47%), and Malaysia (40%) in 2010–2016.
In Muslim countries like Iran, Pakistan, and Turkey, the employment rate is significantly less than the US, further reinforcing the poor economic performances of these countries (Figure 20). It is no coincidence they are among the countries with the lowest shares of female workers in total employment, at 15%, 22% and 31% in 2016, respectively, as shown in Figure 22. Although the participation of females in labor markets is stable at a very low rate, below 15% in most GCC countries, in many Asian countries the shares of female employment has increased over the four decades. In 2016, some countries such as the Lao PDR, Thailand, Vietnam, and Cambodia had higher employment rates than the US, counteracting the negative impact of their productivity performances.
Figure 23 shows cross-country comparisons of employment rates in 1970, 2000, and 2016, based on the labor statistics of each country. Employment consists of employees, own-account workers, and contributing
26: Country x’s per capita GDP is decomposed into the product of its labor productivity and employment rate, as in: ln (GDPx
t / POPxt) = ln (GDPx
t / EMPxt) + ln (EMPx
t / POPxt)
Per capita GDP Labor productivity Employment rate where POPx
t is population of country x in period t and EMPxt is the
number of employment of country x in period t.
Employment rateLabor productivity Per capita GDP
101990–2010%
−2
0
2
4
6
8
2010–2016%
−2−1
012345678
ChinaVietnamCLM
VCam
bodiaBhutanEast AsiaM
yanmar
KoreaRO
CIndiaLao PD
RAsia24South AsiaAisa30Sri LankaM
alaysiaBangladeshSingaporeThailandASEANIranASEAN
6IndonesiaH
ong KongPakistanAPO
20TurkeyN
epalM
ongoliaAustraliaPhilippinesU
SEU
15FijiJapanG
CC
ChinaM
ongoliaLao PD
RCam
bodiaSri LankaIndiaEast AsiaTurkeyBangladeshVietnamSouth AsiaCLM
VAsia24Aisa30BhutanPhilippinesIndonesiaASEANASEAN
6M
yanmar
Malaysia
Nepal
APO20
ThailandKoreaFijiSingaporePakistanRO
CH
ong KongU
SG
CCJapanAustraliaEU
15Iran
9.2
5.14.1 4.0 3.4
4.93.8 4.2 4.2 4.8
3.9 4.3 4.3 4.2 3.7 3.2 3.1 2.9 3.3 2.9 2.5 2.9 2.8 2.7 2.1 2.4 2.92.0 2.2 1.6 1.6 1.7
1.1 0.5 0.9−0.2
0.0
0.91.4 2.0
1.7 0.0 1.1 0.60.5
−0.3
0.6
0.0 −0.1 0.0
0.4 0.6 0.7 0.8 0.2 0.6 0.9 0.3 0.4 0.20.4 0.1
−0.5
0.4
0.0
0.4 0.3
−0.3
0.2 0.6
−0.10.8
9.2
6.0 5.5 5.55.1 4.9 4.9 4.8 4.6 4.5 4.5 4.3 4.2 4.1 4.1 3.8 3.7 3.7 3.5 3.5 3.4 3.2 3.2 2.9 2.5 2.5 2.4 2.4 2.2 2.0 1.9
1.4 1.3 1.1 0.8 0.6
7.1 6.65.3 4.9 4.7
5.5 5.2
3.54.8 4.5 5.0
4.0 4.6 4.53.0
3.8 3.6 3.4 3.32.6 2.0 1.7
2.9 3.5
1.42.3
1.32.0
1.2 1.40.6
−0.10.7 1.3 0.6
−0.3−0.2−0.1
0.6
0.4 0.6
−0.4−0.1
1.4 0.1 0.3
−0.3
0.5
−0.2−0.1
1.2 0.3 0.4 0.3 0.2 0.8 1.3 1.5
−0.1−0.8
1.0 0.1 1.0 0.1 0.9 0.60.7 1.4 0.4
−0.2
0.10.3
6.96.5
5.95.3 5.3 5.1 5.1 4.9 4.9 4.8 4.7
4.5 4.4 4.3 4.2 4.2 4.13.6 3.5 3.4 3.3 3.3
2.8 2.6 2.4 2.4 2.3 2.1 2.1 2.11.3 1.2 1.1 1.1 0.7
0.0
Figure 21 Sources of Per Capita GDP Growth_Average annual growth rate of per capita GDP at constant prices in 1990–2010 and 2010–2016
Sources: Official national accounts in each country, including author adjustments.Note: The starting period for Cambodia is 1993.
©20
18 A
sian
Prod
uctiv
ity O
rgan
izat
ion

3
31
3.3 Sources of Per Capita GDP Gap
27: Qatar has an exceptionally high rate of employment of 84% in 2016. This is due to a much heavier dependence on foreign work-ers. In the 2010 Population Census, non-Qatari workers represented 94% of total employment.
28: Japan is one of the exceptional countries where the employment rate in 2016 did not increase from that in 1970. This reflects, among other things, its aging population. US employment rates indicate weakening in the recent period, with levels in 2016 lower than in 2000 (47% compared with 48%).
family workers. Singapore and Cambodia lead the Asian group with employment rates of around 60%, more than 10 percentage points higher than the US in 2016.27 The employment rate has increased in EU15, but decreased in the U.S., despite these countries also facing a similar headwind of an aging population. Furman and Powell (2018) indicates the big-gest driver of this difference was employment among women, which stagnated in the US, while increas-ing in most of the other advanced economies. It is clear that employ-ment rates have been rising in most Asian countries, in particular in Singapore and many GCC countries.28 The fast-est catch-up countries (those in Group-A1 in Table 1) are also countries with the largest surge in employ-ment rates over the past four decades: China, Korea, Cambodia and the ROC. However, China seems to have exhausted its capacity for further improvement as its employment rate changed little between 2000 and 2016 at 56%. Some of the countries in Group-A2 also experi-enced significant improve-ments in employment rates (for example, Indonesia and Vietnam). While there are exceptions, generally countries that have failed to catch up also tend to make less vigorous improvements over the period, and in turn continue to have lower employment rates.
Figure 22 Female Employment Share_Ratio of female workers to total employment in 1970, 2000, and 2016
Sources: Population census and labor force survey in each country, including author adjustments; ILOSTAT database for GCC countries, Australia, Brunei, and Turkey; The EU Labour Force Survey (Eurostat) for EU 15.
Om
anU
AEQ
atarSaudi ArabiaIranBahrainPakistanIndiaKuw
aitBangladeshTurkeyFijiSri LankaM
alaysiaIndonesiaPhilippinesM
yanmar
BhutanKoreaBruneiRO
CJapanChinaN
epalAustraliaEU
15U
SM
ongoliaCam
bodiaSingaporeVietnamThailandLao PD
RH
ong Kong
5
15
25
35
45
55%
2016 2000 1970
Figure 23 Employment Rate_Ratio of employment to total population in 1970, 2000, and 2016
Sources: Employment and population data by national statistical offices in each country, includ-ing author adjustments. Note: The starting periods for Cambodia and Turkey are 1993 and 1988, respectively.
5
15
25
35
45
55
65
75
85%
Iran
Turkey
Saudi Arabia
Mongolia
India
Philippines
UAE
Myanm
ar
Asia30
Malaysia
ASEAN6
US
ASEAN
Australia
Hong Kong
Lao PDR
CLMV
East Asia
Bahrain
Kuwait
Cambodia
Qatar
Pakistan
Fiji
South Asia
Sri Lanka
Bangladesh
APO20
GCC
EU15
Asia24
Brunei
Indonesia
Nepal
ROC
Japan
Om
an
Korea
Bhutan
Thailand
China
Vietnam
Singapore
2016 2000 1970
©20
18 A
sian
Prod
uctiv
ity O
rgan
izat
ion

32
3 Economic Growth
continued on next page >
According to the United Nations (2017), the world’s population is estimated to reach 7.5 billion in 2016, of which Asian countries account for 59%. The region is by far the most populous in the world. China and India each account for 18% of the world’s population, respectively. It has been observed that falling fertility rates and rising living standards go hand in hand, although the direction of causality is less certain. The evolution of the demographic structure implies dynamics in a society that are not captured by the overall population size or growth. As people’s economic behavior, aspirations, and needs vary at different stages of life, changes in a country’s age structure can have a significant impact on its economic growth via supply-side and demand-side impacts (see Cooley and Henriksen, 2018).
The world’s fertility rate is converging to the replacement level (the level at which a country’s population sta-bilizes). According to the UN, the number of children a woman is expected to have in her reproductive years has dropped by more than half, from about 5.0 to 2.5 in the last 60 years, compared to the replacement level of 2.2 children, one of them a girl. There is regional divergence in this trend. In the last 60 years, the total fertil-ity rate dropped from about 6.8 children to 2.4 in Central America, and from about 5.6 children to 1.6 (below the replacement level), in East Asia. In comparison, some parts of Africa have seen only a modest drop in total fertility, which today remains at more than five children per woman. What is even more staggering is the pace of change. For example, it took Britain over 130 years (1800–1930) to halve its fertility rate, while it took Ko-rea only 20 years to achieve it. This is echoed around the world. This widespread social revolution has been heralded by a complex mix of economic and social development. Economic growth, greater access for women to education, income-earning opportunities, and sexual and reproductive health services, all have been contrib-uting factors to this trend. Coupled with changes in the mortality rate, such a trend can dramatically alter the age profile of a country’s population, bringing with it economic implications.
The growth rate of the world’s population has slowed from its peak of around 2.0% in the 1970s to today’s 1.2% per year. With falling fertility rates, the UN projects the world’s popula-tion growth rate will decelerate to 0.53% per year by 2050 and further to 0.09% by 2100. Even so, the world population will still increase by one-third from to-day’s 7.4 billion to 9.8 billion in 2050 and a further 14% to 11.2 billion by 2100. These estimates are based on the medium-fertili-ty variant, but with only a small variation in fertility, particularly in the more populous countries, the total could be higher (10.9 billion by 2050 and 16.5 billion in 2100) or lower (8.8 billion in 2050 and 7.3 billion in 2100). Figure B1.1 depicts this shift in the distribution of the world population with the share from the more developed regions grad-ually declining from 17% in 2015 to 13% in 2050 and 11% in 2100, compared with 32% in 1950. Conversely, the share of the least developed countries is de-picted as rising from today’s 13%
Box 1 Population and Demographic Dividend
continued on next page >
0
2
4
6
8
10
12
1950 1975 2000 2025 2050 2075 2100
Billion
0
2
4
6
8
10
12
1950 1975 2000 2025 2050 2075 2100
Billion
OceaniaNorthern AmericaLatin America and the CaribbeanEurope
Africa
Other Asia
ASEAN
China
India
Least developed countries
More developed regions
Less developed regions, excluding least developed countries
0.60.90.60.30.40.70.3
0.5
0.40.60.3
0.3
0.4
0.4
0.50.80.7
0.50.70.7
3.6 4.5
0.7
1.5
1.0
1.5
0.7
1.6
1.2
1.6
0.80.7
2.5
0.7
1.4
1.7
1.5
0.70.7
1.5
0.6
1.4
1.5
1.3
0.50.70.80.41.0
1.3
1.0
0.2
0.3
0.7
1.2
2.6 3.2
2.7
1.0
4.3
5.7 6.6 6.8 6.7
1.2 1.3 1.3 1.3
1.5
0.8 1.3
1.9
Figure B1.1 Distribution of the World’s Population in Differ-ent Regions in 1950–2100
Source: UN (Department of Economic and Social Affairs), World Population Prospects: The 2017 Revision.
©20
18 A
sian
Prod
uctiv
ity O
rgan
izat
ion

3
33
3.3 Sources of Per Capita GDP Gap
to a projected 20% in 2050 and 29% in 2100, up from 8% in 1950.
According to the projection, Asia’s share will decline from its 60% to-day to 54% in 2050 and 43% in 2100, while Africa’s share will rise from today’s 16% to 26% and 40%, respectively. Figure B1.2 shows the current population size of individual Asian countries com-pared with the 1970 level and its 2050 projection. As can be seen from the chart, China’s popula-tion is expected to more or less stabilize around the current level. China has socially engineered the change with its one-child policy, which has made its current popu-lation 300–400 million lower than it would have been otherwise. In less than two decades, India is pro-jected to overtake China as the most populous country in the world.
Figure B1.3 shows the demo-graphic make-up of countries in 2016 (the population proportions of the under-15 and over-65 age groups, which together make up the dependent population). Ranking the countries by the share of old-age popu-lation filters the rich economies to the top end. These economies also have a relatively low share of the young-age group compared to less developed coun-tries. This suggests that demographic transition tends to run parallel with eco-nomic progress, although the direction of causation is not certain. As countries move from high to low mortality and fertility rates, the demographic transi-tion produces a “boom” generation that is larger than those immediately before and after it. As this boom generation gradually works through a nation’s age structure, it produces a demographic dividend of economic growth as people reach their prime.
Using demographic data since 1950 and UN projections up to 2100, Figures B1.4 and B1.5 track changes in the ratio of the working population (aged 15–64) to dependent population (aged under 14 and over 65) by country and by country group, respectively. The higher the ratio,
> continued from previous page
continued on next page >
Figure B1.2 Asian Countries’ Population Size and Projection in 1970, 2016, and 2050
Source: World Bank, World Development Indicators 2017.
scale by 200 millions
scale by 50 millions
scale by 5 millions
2016 1970 2050
0
800
1000
1200
1400
1600
1800Million
50
150
100
200
250
300
350
400
600
5
10
15
20
25
30
ChinaIndiaEU
28
IndonesiaPakistanBangladeshJapanPhilippinesVietnamIranTurkeyThailand
KoreaM
yanmar
Malaysia
Saudi Arabia
Nepal
ROC
Australia
Sri LankaCam
bodiaU
AEH
ong KongLao PD
RSingaporeO
man
Kuwait
Mongolia
Qatar
Bahrain
BhutanBrunei
US
Fiji
Figure B1.3 Proportion of the Dependent Population in 2016
Sources: Population census and official national accounts in each country.
20 25%
Age over 65Age 0–14
40 % 0102030 0 5 10 15
Qatar
Kuwait
Bahrain
Mongolia
Pakistan
Bhutan
Indonesia
Philippines
Brunei
Malaysia
Sri Lanka
China
Singapore
Korea
US
JapanHong Kong
Australia
ROC
Thailand
Vietnam
Turkey
NepalFijiIran
Myanmar
India
Cambodia
Bangladesh
Lao PDR
Saudi Arabia
Oman
UAE0.9 1.0
2.2 2.3 2.4 3.2 3.9 4.1 4.5 4.7 4.8 5.1 5.2 5.2 5.5 5.8 5.9 6.0 6.0 6.1 6.1 6.9
7.9 8.3
10.9 11.0
12.3 13.2 13.2
15.2 15.2 15.9
27.3
14.5 14.8
21.0 22.0 20.9
25.5 29.0
35.2 34.9
30.8 29.6 28.9
27.7 25.9
30.6 28.2
22.3 30.5
28.6 23.7
24.7 23.1
25.2 23.7
16.6 17.7
15.2 13.3 13.4
18.9 18.7
11.3 12.4
©20
18 A
sian
Prod
uctiv
ity O
rgan
izat
ion

34
3 Economic Growth
> continued from previous page
the more favorable its demography for eco-nomic growth. Japan could have capitalized on the demographic dividend in the 1960s, when its GDP growth was over 10% on average per year for ten years. Similarly, China, Hong Kong, Korea, Singapore, and Thailand are poised for the prospect of such demographic dividend in the 2000s and 2010s, whereas, based on projec-tions, some ASEAN countries, such as Myan-mar and Indonesia will have to wait for such opportunity until the 2020s and 2030s, and South Asian countries (except Sri Lanka) until the late 2030s and 2040s.
The reaping of this dividend, however, is far from automatic. A favorable demography can work wonders to produce a virtuous cycle of wealth creation only if it is combined with ap-propriate health, labor, financial, human capital, and growth-enhancing economic policies. The presence of these complementary factors cannot be taken for granted, but needs to be cultivated in order to earn the de-mographic dividend. As the analysis of the Databook shows, the contribution of labor to economic growth has been smaller than those of capital and TFP for most countries (Figure 58 in Section 5.3, p. 67). This means that countries should not be afraid of aging too much as long as fairly high growth rates of capital and TFP are maintained. Nevertheless, understanding the demographic shift and its implications is highly relevant for economic projections, providing valuable foresight for economic policy making. In our projection of economic growths by 2030 (Box 9, p. 123), the changes in demographic structure play an important role to forecast not only hours worked for the whole economy, but also quality changes in labor inputs.
Figure B1.5 Demographic Dividend by Country Group in 1950–2100
Source: UN (Department of Economic and Social Affairs), World Popu-lation Prospects: The 2017 Revision.
1950 1960 1970 1980 1990 2000 2010 2020 2030 2040 2050 2060 2070 2080 2090 21001.0
1.5
2.0
2.5
3.0Dependent population (age under 14 and over 65)=1.0
East Asia
South Asia
CLMV
ASEAN6
Figure B1.4 Demographic Dividend by Country in 1950–2100
Source: UN (Department of Economic and Social Affairs), World Population Prospects: The 2017 Revision.
(East Asia)(East Asia)
(ASEAN6)(ASEAN6)
1950 1960 1970 1980 1990 2000 2010 2020 2030 2040 2050 2060 2070 2080 2090 21001.0
1.5
2.0
2.5
3.0Dependent population (age under 14 and over 65)=1.0
Hong Kong
Japan
Mongolia
China
Korea
1950 1960 1970 1980 1990 2000 2010 2020 2030 2040 2050 2060 2070 2080 2090 21001.0
1.5
2.0
2.5
3.0Dependent population (age under 14 and over 65)=1.0
(South Asia)(South Asia)
Sri Lanka
BhutanNepal
Pakistan
India
Bangladesh
1950 1960 1970 1980 1990 2000 2010 2020 2030 2040 2050 2060 2070 2080 2090 21001.0
1.5
2.0
2.5
3.0Dependent population (age under 14 and over 65)=1.0
1950 1960 1970 1980 1990 2000 2010 2020 2030 2040 2050 2060 2070 2080 2090 21001.0
1.5
2.0
2.5
3.0Dependent population (age under 14 and over 65)=1.0
(CLMV)(CLMV)
Brunei
Singapore
Malaysia
Philippines
Indonesia Cambodia
Lao PDR Myanmar
Vietnam
Thailand
©20
18 A
sian
Prod
uctiv
ity O
rgan
izat
ion

4
35
4.1 Final Demand Compositions
GDP is defined by three approaches in SNA: production by industry; expenditure on final demand; and income to factor inputs. In this chapter, the economic insights are drawn from analyzing the expenditure side of GDP. Section 4.1 presents the composition of countries’ expenditure and the long-term trends in Asian countries. The expenditure-side decomposition of GDP growth is provided in Section 4.2.
4.1 Final Demand Compositions
Figure 24 shows comparisons of final demand shares of nominal GDP among country groups, covering (1) household consumption, including consumption of non-profit institutions serving households (NPISHs), (2) government consumption, (3) investment or, in national accounts terminology, gross fixed capital formation (GFCF) plus changes in inventories, and (4) net exports (exports minus imports).29 The country comparisons are presented in Table 13 in Appendix 9 (p. 151). One can see that country groups display distinctive features in their final demand composition, reflecting their development stage and economic makeup. With the differences in emphasis and vulnerabilities, their behavior and reaction to economic shocks are obviously quite diverse.
Over the past four decades, the share of household consumption has been stable for mature economies. In EU15, it has remained fairly stable at around 57% (Figures 24 and 27). In economies undergoing rapid transformation, however, it is more volatile and largely trends downward. Within Asia, all regions except GCC display a decline in household consumption ratios. South Asia maintains the highest share, despite its fall from 76% in 1970 down to 63% in 2016. The Asian average has hovered around the 50% range until recently when the gap with the EU15 widened, largely reflecting the trend in China.
4 Expenditure
29: In theory, three approaches to measure GDP are accounting identities and should yield the same result, but in practice, they dif-fer by statistical discrepancies. Based on our Metadata Survey 2018 on national accounts for APO member economies, Japan is an exceptional country that determines GDP from its expenditure-side measurement (the expenditure-side estimate is based on the commodity flow data, in which the data on production/shipment in the detail product classification are used as the controlled totals.). In other countries, GDP is estimated from the production side (value added in industries). Some countries record sta-tistical discrepancy as the difference in the estimates between production-based GDP and the sum of final expenditures. In this Databook, statistical discrepancy is mainly attributed to household consumption when data is recorded. Readers should keep in mind that it can have some impact on the share of final demand.
57 50
76 6982
35
60 5754 5167
5775
41
66 5850 44
6355 60
45
6956
1211
910
22
15
181614 16
12
10
5
21
1419
1415
1112 7
23
1420
29 38
16 23
17
19
21 2827 3123
23
23
19
24 2334 38
2929 29 31
2020
3 1
−2 −20
31
−1
4 2
−2
10
−3
20
−4
2 3
−3
5 4 2
−3
3
−20
0
20
40
60
80
100
120
Asia30 East Asia South Asia ASEAN6 CLMV GCC US EU15
Household consumption Government consumption Investment Net exports%
1970 2000 2016 1970 2000 20161970 2000 20161970 2000 20161970 2000 20161970 2000 20161970 2000 20161970 2000 2016
Figure 24 Final Demand Shares by Region_Share of final demands with respect to GDP at current market prices in 1970, 2000, and 2016
Sources: Official national accounts in each country, including author adjustments.Note: Final demand shares in country groups are computed by using the PPPs for GDP. Household consumption includes consumption of NPISHs. Investment includes GFCF plus changes in inventories.
©20
18 A
sian
Prod
uctiv
ity O
rgan
izat
ion

36
4 Expenditure
China’s household consumption has been trending downward as a share of GDP. It fell from 56% in 1970 to 36% in 2010 (Table 13 in Appendix 9, p. 151). This compares with the early communist era when household consumption was more volatile and at a higher level of over 60% of GDP. China was less well-off then. Figure 25 shows the historical trend of final demand share in China since 1952, depicting how household consumption share and investment share mirror each other.30 As the decline in house-hold consumption share accelerated in the 2000s, the investment share rose rapidly to 48% of GDP in 2010, from 34% in 2000. Investment has overtaken household consumption as the largest component in GDP expenditure since 2004, although recently it shows a considerable sign of narrowing. The falling share of household consumption may partially reflect the falling labor income share of GDP and/or an un-even distribution of economic gain between the rich and the poor in these countries. There also is a notably rapid rise in exports as a share of GDP since the 1980s, when China began to open its economy, from around 5% or below in the 1950s and 1960s to its peak of 36% in 2006, before softening to 16% in 2016.
With a low consumption ratio, coupled with an unsustainable rise in investment and an overdependence on exports, China faces huge internal and external imbalances. If not addressed, this could jeopardize its medium-term growth prospects. A low consumption share of GDP is not merely a reflection of con-sumer behavior or preference, but a manifestation of an array of underlying distortions in the economy. An undervalued currency, which favors the production of tradables over non-tradables, may result in an unusually low consumption ratio and a heavy reliance on exports. Lax corporate governance of state-owned enterprises is not conducive to distribution of dividends and therefore, in effect, may act to subsi-dize investment. Additionally, in the absence of a social safety net, well-developed domestic financial markets may provide a strong incentive for precautionary saving on the part of households (Eichengreen, Park, and Shin, 2012). The share of investment in China is the biggest final demand component of GDP since 2004. At 44% in 2016, it is likely unsustainable in the long term. All of these factors suggest that there are policy levers available to the government to impede or rebalance the economy. In recent years, even labor-abundant China faced a tightened supply of surplus labor at its coasts, putting an upward pres-sure on wages (see Box 3, p. 54). This could be a good news for the world, as a higher labor share of GDP will bring about higher household consumption, helping the domestic market fulfill its potential. This will make China less dependent on foreign demand; at the same time, China will generate demand for foreign products. Early signs that the Chinese economy may have started moving in the right direction were evi-dent when the decline in the consumption ratio halted (even turning up slightly since its recent trough in 2009) and external imbalances narrowed to 2% in 2016, decreasing from the peak of 9% in 2007.
30: The Chinese official statistics on household consumption could be misleading. Zhang and Tian (2013), for example, point out three potential sources of a significant downward bias in Chinese consumption data. Firstly, the method used to impute rents for owner-occupiers does not take into account land costs, and in turn greatly underestimates the market values of housing. Secondly, private consumption on company accounts is misclassified as business costs (i.e., intermediate consumption), or investment ex-penditure. Thirdly, sample selection bias (under-representation of high income households) and reporting errors also contribute to the underestimation of household consumption. The authors suggest that taking into account these factors could add 10–15 percentage points to China’s consumption, which would bring it to a level more comparable with other East Asian countries.
1952 1962 1972 1982 1992 2002 20120
10
20
30
40
50
60
70%
Imports (−)
Exports
Investment
Household consumption
Figure 25 Historical Final Demand Shares of China since 1952_Share of final demands with respect to GDP at current market prices in 1952–2016
Sources: National accounts by National Bureau Statistics of China, including author interpolation.
©20
18 A
sian
Prod
uctiv
ity O
rgan
izat
ion

4
37
4.1 Final Demand Compositions
Figure 26 shows the US’s historical trend of final de-mand shares since 1929. In contrast to China, the share of household consumption was relatively stable in the US at around 60–64% for three decades from the 1950s before edging up to 69% of GDP in 2016. From a historical perspective as shown in Figure 26, the current level is below the share of household con-sumption that the US experienced during the Great Depression, when it was over 75%, even as high as 82% in 1932.
Figure 27 illustrates the observations of plotting Asian group averages. The US household consump-tion share has been climbing from a level of around 62% of GDP in the mid-1980s to the level close to 70% in the recent period, more than 12 percentage points higher than that of the EU15.31 In contrast, the consumption share for the Asia30 declined rap-idly from 55% in the beginning of the 2000s to below 50% in 2016. Although this largely reflects China’s recent household consumption behavior as it gained gravity in the regional economy (Figure 25), the rapid decreasing trends are also found in South Asia and CLMV.
Overall, Asian countries invest significantly more than the US and the EU15 as a share of GDP, as shown in Figure 28. In the 1970s the EU15 was investing on average 3.5 percentage points higher of their GDP than the US. Historically, the gap in the investment share between the Asia30 and the EU15 never ex-ceeded 10 percentage points. However, since the beginning of the 1990s, it has started to widen (except for the period of the Asian financial crisis). In 2012 the difference was 17 percentage points. In 2016
10
0
20
30
40
50
60
70
80
1939 1949 1959 1969 1979 1989 1999 20091929
%
Exports
Imports (−)
Investment
Household consumption
Figure 26 Historical Final Demand Shares of the US since 1929_Share of final demands with respect to GDP at current market prices in 1929–2016
Sources: National Income and Production Accounts (NIPA), Bureau of Economic Analysis, US.
31: It is worth noting that the GDP share of government consumption in the EU15 was higher than the average of the Asia30 by 6.3 percentage points in 2016 (Table 13 in Appendix 9, p. 151). In fact, when it comes to welfare measurement, actual individual consumption, as opposed to household consumption, is preferred because the former takes into account expenditures by NPISHs and government expenditures on individual consumption goods and services (such as education and health) in addition to house-hold consumption.
Figure 27 Consumption Share by Region_Share of consumption with respect to GDP at current market prices in 1970–2016
Sources: Official national accounts in each country, including author adjustments.
40
50
60
70
80
1970 1975 1980 1985 1990 1995 2000 2005 2010 2015
%90
Asia30
East Asia
South Asia
ASEAN6
CLMV
US
EU15
Figure 28 Investment Share by Region_Share of investment with respect to GDP at current market prices in 1970–2016
Sources: Official national accounts in each country, including author adjustments.
0
10
20
30
1970 1975 1980 1985 1990 1995 2000 2005 2010 2015
%40
Asia30East Asia
South AsiaASEAN6
CLMV
US
EU15©
2018
Asia
n Pr
oduc
tivity
Org
aniz
atio
n

38
4 Expenditure
investment accounted for 20% of final demand in both of the US and the EU15, compared with 34% for the Asia30. East Asia has the highest investment ratio among the Asian regions in the whole period of our observation. While South Asia caught up with them in 2007, since then the paths of the two regions diverged. The investment share fell sharply in ASEAN6 to the level below 20% due to the Asian financial crisis. The recovery process is slow. The speed of capital accumulation in ASEAN6 has halved in the 2000s.32
Compared to other components of final demand, the contribution of net exports to the Asian economy has always been more volatile. Figure 29 shows the trend of net export share in GDP by region. Both the US and the EU15 faced a trade deficit at the beginning of
Figure 29 Net Export Share by Region_Share of net export with respect to GDP at current market prices in 1970–2016
Sources: Official national accounts in each country, including author adjustments.
−20
−15
−5
−10
0
5
1970 1975 1980 1985 1990 1995 2000 2005 2010 2015
%10
Asia30
East Asia
South Asia
ASEAN6
CLMV
US
EU15
−25
0
25
50
75
100
125%
−25
0
25
50
75
100
125%
Household consumption Government consumption Investment Net exports
89 85 83 80 76 75 75 73 72 72 68 67 67 66 66 64 61 59 59 59 59 58 58 57 56 56 55 54 54 54 54 51 51 49 47 44 42 42 41 37 35 19 16
5 4 7 8 5 8 5 8 14 11
6 12 12 17 14 13 6 9 18 13 9 19
9 10 14 14 16 14 17 13 11 22 16 17 17 10
21 11
21 26 21
30 19
18 11
25 22 24 18 23 28 24
18 29 24 23 22 24 24 22 23
23 26 28 23
21 23 22 28 27 27 27 25 33
46
31
10
34
27 11 35 19 19
16 23
21
−12 −14 −11 −5 −1 −3 −9 −11 −2 −2 −3 −2 −5 −4 −1
10 9 3 4
12 10 8 3 2 4 1
82
−19
2
24
2
19 26 12 20 18
28 29 44
Cambodia
Myanm
arLao PD
RN
epalBangladeshPakistanCLM
VSri LankaM
ongoliaPhilippinesVietnamTurkeySouth AsiaFijiU
SIndiaIndonesiaASEANAustraliaAPO
20H
ong KongEU
15U
AEASEAN
6ThailandAsia24RO
CAsia30JapanIranKoreaBhutanEast AsiaBahrainChinaM
alaysiaKuw
aitSingaporeG
CCSaudi ArabiaO
man
BruneiQ
atar
2000
78 76 74 69 69 69 66 66 64 64 63 61 60 60 59 58 57 56 56 56 55 55 55 53 53 53 52 50 50 49 48 47 47 45 45 44 43 43 39 36 27 23
11 5 11 12 6 14
10 20
9 6 11 11 7 15 14 13 18 20 10 20 11 13 12 17 12 14 14 14 14 15 9
25 17 17 23 15 28 26 14
11 22 28
42
23 24 29
30 20 22
22 34 27
29 30 29
28 25 27
24 20 34
24 29 26 29
53
24 21 29 35 34 29
32
26
22 30 31
38 29 31
44
27
45 37
−7
−32
−4 −9 −10
−5 −3
2
−8 −7
3
−3 −2
4
−3
2 2 1 3 1 1 5 7 5
−23
11 12
4 2 2 7 11
2
15 8 2 3 2
26
6 13
PakistanN
epalCam
bodiaPhilippinesLao PD
RBangladeshU
SH
ong KongFijiSri LankaVietnamSouth AsiaIndiaCLM
VTurkeyU
AEAPO
20AustraliaEU
15IndonesiaJapanASEANM
alaysiaASEAN
6BhutanIranRO
CM
ongoliaAsia24Asia30KoreaM
yanmar
Kuwait
ThailandBahrainG
CCEast AsiaO
man
Saudi ArabiaChinaSingaporeQ
atarBrunei
2016
16
11
80
Figure 30 Final Demand Shares in GDP by Country_Shares of final demands with respect to GDP at current market prices in 2000 and 2016
Sources: Official national accounts in each country, including author adjustments.Note: Household consumption includes consumption of NPISHs. Investment includes GFCF plus changes in inventories.
©20
18 A
sian
Prod
uctiv
ity O
rgan
izat
ion

4
39
4.1 Final Demand Compositions
this period. While the EU15 managed to recover, being in surplus since the early 1990s (within a range of 0–3% of GDP), the US position has significantly deteriorated since the middle of the 1990s, despite a tremendous effort to restore its trade balance in the late 1980s. In the US, the trade deficit ratio to GDP expanded considerably from zero in the mid-1970s to 5.6% in 2006, before narrowing to 2.8% in 2016. In contrast, Asia30’s trade has been in surplus continuously and a near mirror-image of the US since the 1990s. Having increased in East Asia between 1993 and 2007 from 0.8% to 6.2%, the contribution of net exports decreased to 1.9% in 2011 after the global financial crisis. The time series of ASEAN6’s trade balance has a clear structural break which is marked by the Asian financial crisis of 1997. The impact was a trade balance spike in 1998 at 11.3%, up from 0.4% in the previous year. Trade balance moderated over time to the more normal level of 4.9% in 2016. In recent years the trade balance of CLMV is in surplus for the first time during these four decades. Its improvement has been rapid, from a deficit of 5.0% in 2008 to a surplus of 8.4% in 2014. This should not be a surprise when CLMV is picking up the slack from China as the “workshop of the world.” If the time series of China’s net exports is any guide, CLMV’s trade surplus could continue to expand for a decade to come. South Asia is the only Asian region that consis-tently has run a fluctuating trade deficit over the years. Lately, it is historically sizable at 7.4% of GDP in 2012, narrowing to 2.8% in 2016.
The regional averages disguise the great variation displayed by indi-vidual countries. Figure 30 shows the cross-country comparisons of final demand shares in current-price GDP in 2000 and 2016. Coun-tries are arranged in descending order of their household consump-tion shares. Although most countries fall to the right of the US, there are a handful of Asian countries that have a higher consumption ratio than the US. Bangladesh, Cambodia, the Lao PDR, Nepal, Pakistan, and the Philippines fell to the left of the US in both years of comparisons, regardless of much lower per capita GDP level in these countries.
The high consumption rate in these countries could be partly ex-plained by the difference in demo-graphic structure. Figure 31 shows that countries with a high propor-tion of dependent population (aged under 14 and over 65) tend to have a high household con-sumption share in their GDP, by reflecting higher propensity to consume by individuals in the
15 20 25 30 35 40Dependent population ratio
45 %10
20
30
40
50
60
70
80
90% Household consumption share in GDP
Brunei
Bangladesh
FijiHong Kong
IranJapan
Korea
Nepal
Pakistan
Sri LankaVietnam
China
Turkey
Myanmar
Oman
Qatar
UAE
Bhutan
India
Cambodia
ROC
IndonesiaMalaysia
Philippines
Singapore
Thailand
US
Australia
BahrainKuwait
Saudi Arabia
Mongolia
Figure 31 Dependent Population Ratio and Consumption Share_Share of dependent population to total population and consumption share in GDP at current market prices in 2016
Sources: Population data by national statistical office in each country; World Bank, World Development Indicators 2017; official national accounts in each country with au-thor estimates.Note: Dependent population is defined as persons aged under 14 and over 65.
32: See Figure 61 in Section 5.3 (p. 70) for comparison of contributions of capital inputs to economic growths among regions.
©20
18 A
sian
Prod
uctiv
ity O
rgan
izat
ion

40
4 Expenditure
dependent population, in their savings-consumption choices. The aforementioned countries, i.e., Bangla-desh, Cambodia, Nepal, Pakistan, and the Philippines, have higher shares of dependent population with over 34% in 2016. On the other hand, the variation of consumption rates is also related to the income level. Countries with a low income will struggle to defer consumption. It is no coincidence that countries clustered on the left of Figure 30 tend to be those in the bottom income groups in terms of per capita GDP in Figure 20 in Section 3.3 (p. 29).
Figure 32 Household Consumption Share in GDP_Share of household consumption with respect to GDP at current market prices in 1970–2016
Sources: Official national accounts in each country, including author adjustments.Note: Countries are grouped according to the levels of per capita income in 2016, relative to the US, defined in Table 2 in Section 6.1 (p. 87).
Figure 32.1: Group-D1 (100%≤) Figure 32.2: Group-D2 (70%≤...<100%)
Figure 32.3: Group-D3 (40%≤...<70%) Figure 32.4: Group-D4 (20%≤...<40%)
Figure 32.5: Group-D5 (10%≤...<20%) Figure 32.6: Group-D6 (<10%)
1975 1980 1985 1990 1995 2000 2005 2010 2015197030
40
50
60
70
80
100
90
%
1990 1995 2000 2005197030
40
50
60
70
80
100
90
%
1975 1980 1985 2010 2015
1990 1995 2000 20051970 1975 1980 1985 2010 20151990 1995 2000 20051970 1975 1980 1985 2010 2015
Malaysia TurkeyKorea
40
20
30
10
50
60
70
80
100
90
%
Saudi ArabiaOman
AustraliaROC
BahrainJapan
20
10
30
40
50
60
70
80
100
90
%
KuwaitSingapore UAE
Qatar
Indonesia IranChina
Sri Lanka ThailandMongolia
Brunei Hong Kong
30
40
50
60
70
80
100
90
%
1975 1980 1985 1990 1995 2000 2005 2010 20151970 1975 1980 1985 1990 1995 2000 2005 2010 2015197030
40
50
60
70
80
100
90
%
VietnamPhilippines
Bhutan Fiji
Pakistan
Bangladesh CambodiaIndia Lao PDR Myanmar Nepal
©20
18 A
sian
Prod
uctiv
ity O
rgan
izat
ion

4
41
4.1 Final Demand Compositions
Figure 32 shows the long-term trends of household consumption share of GDP for Asian economies. Coun-tries are grouped according to the levels of per capita income in 2016, defined in Table 2 in Section 6.1 (p. 87). The Asian Tigers have been the consistent high performers, coming at the top for most of the level in-dicators presented in Figure 16 in Section 3.2 (p. 25). As seen, Singapore and Korea showed the most rapid rela-tive retrenchment in house-hold consumption as a share of GDP in their initial stage of development of the 1970s and 1980s. Between 1970 and 2016 the house-hold consumption share of GDP fell from 69% of GDP to 36%, and from 74% to 49% in Singapore and Ko-rea, respectively. In contrast, household consumption as a share of GDP, at 66% in 2016, has been rising in Hong Kong since the mid-2000s. It did fall from 66% in 1970 to nearly 55% in the late 1980s, but it was subsequently reversed. Similarly, the relative household consumption in the ROC fell from 56% in 1970 to under 50% in the mid-1980s. Since then, it has been on an upward climb until the 2000s when it stabilized at around 55%. The consumption share in Japan has been rising slowly since 1970, from just under 50% in 1970 to 56% in 2016. With a rapidly aging population, this rising trend can be expected to continue. Japan’s share of dependent population stood at 40% in 2016 (Figure 31), nearly 60% of which was accounted for by the over-65 age group.
The decomposition of household consumption reveals a huge diversity of consumption patterns among individual countries, partly reflecting their income levels and partly the idiosyncratic characteristics of the society. Figure 33 illustrates the cross-country version of Engel’s Law, which states that basic neces-sities will account for a high proportion of household consumption for a lower per capita income group, and vice versa. More specifically, countries where food and non-alcoholic beverages account for a large proportion of consumption tend to have low income (i.e., in Group-D5 or Group-D6 in Table 2 in Section 6.1, p. 87). The other end of the spectrum is occupied by the rich Asian countries, namely, the Asian Tigers and Japan. Besides food and non-alcoholic beverages, housing/utilities and transportation are the other two large spending categories. In rich economies, these two categories account for bigger shares in household consumption than food and non-alcoholic beverages. Idiosyncratic spending, such as education in Korea, Mongolia, and Vietnam accounting for 5% of household consumption, and health
Miscellaneous goods andservices
Restaurants and hotels
Education
Recreation and culture
Communication
Transport
Health
Furnishings, householdequipment, and routinehousehold maintenance
Housing, water, electricity, gas and other fuels
Clothing and footwear
Alcoholic beverages,tobacco and narcotics
Food and non-alcoholicbeverages
0
10
20
30
40
50
60
70
80
90
100%
FijiBangladeshVietnamLao PD
RPhilippinesBhutanIndonesiaM
ongoliaChinaCam
bodiaSriLankaIndiaIranThailandM
alaysiaJapanRO
CKoreaH
ong KongAustraliaSingaporeU
S
5753 50 49
4237
34 33 30 29 29 28 27 24 2216 15 14 13
9 7 6
2
22 4
36 8
3 2 3
32
2 2 3
42
36
4 3
74
7
7 3 58
5 4
3
3 4 614
4
3 3
12 17
713
12
23
9
15
2220
1112
32
915 25
17 18
16
23
17 19
53
7
3
4
3
4
2 6
4
4
4 5
4
5 3
8
5
5 4
23
53
3
2
4
38
8
3
5
8
4 3
4
4 5
8
6
8
22
64
14 11
12
6
14
12
14
11
18
16
8
13 12
10
12 12
8
10
14
9
3 5
4
2
3
28 4
3 3 2
2
2
3
24
4
11
2
2
2
5
6 8
8 8
6
10
11
9
45 3
4
33
5
23
2
2 24 5 3
5
4
2
2
2 3
44
103
7
4
2
3
1710 8
98 7
107
84 4 3
139
5 52
12
22 19
4
12 12 14 15 14
2215 17 15
Figure 33 Household Consumption by Purpose_Shares of household consumption at current prices by purpose in 2016
Sources: Official national accounts in each country.Note: For data of Hong Kong, transportation includes communication; recreation and culture includes hotels; miscellaneous goods and services include restaurants. For data of China, food and non-alcoholic beverages includes alcoholic beverages, tobacco and narcotics; transporta-tion includes communication; recreation and culture includes education. For data of Vietnam, transportation includes communication. For Fiji, the Lao PDR, and Vietnam, the observation periods are 2009, 2005, and 2014, respectively.
©20
18 A
sian
Prod
uctiv
ity O
rgan
izat
ion

42
4 Expenditure
33: Japan’s current share of gross investment is almost equivalent to the share of consumption of fixed capital (CFC) in GDP. Thus the net investment is close to zero.
34: Although Singapore’s investment ratio in 2016 is higher than that of Japan, it is of note that Singapore has succeeded in sustain-ing a higher ex-post rate of return on capital (14.1% for the period 2010–2016, based on our estimates in Table 5 in Appendix 4, p. 137) than that of Japan (6.0% for the same period). Korea is another country which confronts the decreases in the ex-post rate of return on capital. In 2010–2016, Korea’s rate of return reached 7.6%, which is similar to that of Japan in the early 1990s.
35: In Mongolia the two world-class large mines (coal and copper) started production in 2010, sparking a resources boom. The coun-try’s capital investment ratio jumped from 30% of GDP in 2009 to 58% in 2011 (Figure 35.4). In Bhutan the investment booms shown in Figure 35.5 reflect the construction of large-scale hydropower plants, i.e., Tala hydropower plant (1020 MW) has oper-ated since 2006 and other plants to be commissioned by 2017–2019.
in the US, accounting for 22% of consumption, are not reflected in other countries.
Figure 34 traces the decreasing long-term path of Japan’s Engel’s Curve during the period 1949–2016. The countries’ levels in 2016 are mapped against Japan’s experi-ence (as circles). Among the se-lected countries, it is staggering to note that in 2016, 57% of Fiji’s household consumption was spent on food and non-alcoholic bever-ages at one end of the spectrum, compared with only 6% in the US at the other end. This suggests the fact that low-income countries spend 25–50% of their GDP on food and non-alcoholic bever-ages, which corresponds to Japan’s experience in the 1950s and the 1960s.
Figure 35 compares the long-term trend of investment share (includ-ing R&D investment) in GDP among countries. Historically, an investment share in the region of 40% or above seems to be unsustainable in the long run. We see that Japan’s investment share of GDP steadily declined over the past decades from 41% in 1970 to 24% in 2016 (Figure 35.2).33 In the initial period of our observation, Singapore also sustained an investment share of 40% or above. Since the mid-1980s, however, it has seen a downward trend, in spite of its fluctuations (Figure 35.1). In 2016 it was 27%.34 The investment share hit around 40% in the ROC and Korea at different times but these were nothing more than temporary spikes (Figure 35.2 and Figure 35.3). In contrast, the investment share in China and India has been rising. India in particular has been investing very aggressively since 2000, ap-proaching China’s 41% share in 2007, with the gap of 4 percentage points. Since then, the gap has wid-ened to 14 percentage points in 2016 as investment in India softened (Figure 35.4 and Figure 35.5). At 44% in 2016, China’s investment share reached a level previously unseen in Asia, except short-lived achievements in small countries.35 If history is any guide, the contribution of investment to final demand
0
10
20
30
40
50
60
1940 1950 1960 1970 1980 1990 2000 2010 2020
Food consumption share in 2016
Japan (1949–2016)Bangladesh
Cambodia
Fiji
India
Indonesia
Iran
Korea
Malaysia
Sri Lanka
US
Thailand
ROC
Philippines
HongKong
Japan
Lao PDR
Mongolia
Singapore
Bhutan
China
Vietnam
%
Figure 34 Historical Engel Curve of Japan since 1949 and Current Level of Asia_Share of food in household consumption at current prices for Japan in 1949–2016 and for Asian countries in 2016
Sources: Official national accounts in each country. The historical data of Japan is based on JSNA by ESRI, Cabinet Office of Japan.Note: Food is defined as food and non-alcoholic beverages. For Fiji, the Lao PDR, and Vietnam, the observation periods are 2009, 2005, and 2014, respectively.
©20
18 A
sian
Prod
uctiv
ity O
rgan
izat
ion

4
43
4.1 Final Demand Compositions
Figure 35 Investment Share in GDP_Share of investment with respect to GDP at current market prices in 1970–2016
Sources: Official national accounts in each country, including author adjustments.Note: Countries are grouped according to the levels of per capita income in 2016, relative to the US, defined in Table 2 in Section 6.1 (p. 87).
%
0
10
20
30
40
50
60
1970 1975 1980 1985 1990 1995 2000 2005 2010 2015
1970 1975 1980 1985 1990 1995 2000 2005 2010 2015
1970 1975 1980 1985 1990 1995 2000 2005 2010 2015
Figure 35.3: Group-D3 (40%≤...<70%) Figure 35.4: Group-D4 (20%≤...<40%)
Figure 35.1: Group-D1 (100%≤)
10
20
30
40
60
0
50
%
%
0
10
20
30
40
60
50
%
Figure 35.2: Group-D2 (70%≤...<100%)
Brunei KuwaitHong KongSingapore UAEQatar
1970 1975 1980 1985 1990 1995 2000 2005 2010 2015
Saudi ArabiaOman
AustraliaROC
BahrainJapan
Malaysia TurkeyKorea
10
20
30
40
60
0
50
Indonesia IranChina
Sri Lanka ThailandMongolia
1970 1975 1980 1985 1990 1995 2000 2005 2010 2015 1970 1975 1980 1985 1990 1995 2000 2005 2010 2015
%
Figure 35.6: Group-D6 (<10%)Figure 35.5: Group-D5 (10%≤...<20%)
%
10
20
30
40
60
0
50VietnamPhilippines
BhutanIndia
FijiLao PDR
10
20
30
40
60
0
50Pakistan
BangladeshMyanmar
CambodiaNepal
in China will drop eventually, as seen in 2014–2016. The investment share in GCC countries has fluctu-ated between 15–40% of GDP (Figure 35.1 and Figure 35.2).
The role of foreign direct investment (FDI) differs considerably among Asian countries. Figure 36 shows the FDI inflows as a percentage of GFCF during 2000–2016, for the Asian economies with the US and
©20
18 A
sian
Prod
uctiv
ity O
rgan
izat
ion

44
4 Expenditure
some EU countries for compari-son. In almost half of the Asia30 (13 countries), the FDI inflows are over a 10% share of GFCF. In par-ticular, they are outstanding in the two global cities of the Asian Ti-gers, Hong Kong (117% of GFCF) and Singapore (71%), both record-ing a remarkable achievement in economic growth in the 2000s. Ja-pan and Nepal, whose FDI inflows are extremely low in this period (0.6% and 0.9%, respectively), should consider a domestic reform for lowering barriers to entry, therefore encouraging interna-tional investment.
It is an important policy target for low-income countries to create a business-enabling environment, just as it is important for middle-income countries to improve vari-ous business environments. Based on the EIU’s (Economist Intelli-gence Unit, The Economist) rank-ing 2014–2018 (covering 82 countries in the world),36 Singapore (1st) and Hong Kong (3rd) are in the top 10% of the covered countries. In contrast, Bangladesh (69th), Pakistan (74th), and Iran (81th) are in
FDI in�ows as a percentage to GFCF, an average in the period 2000–2016
Business environment rankings score 2014–18
0
5
10
15
20
25%
2 4 6 8 10
Bangladesh ROC
India
IndonesiaIran
Japan
Korea
Malaysia
Pakistan Philippines
Sri Lanka
Thailand
Vietnam
China
Bahrain
Kuwait
Qatar
Saudi Arabia
UAE
Australia
Turkey
Canada
France
Germany
Italy
Spain
UK
US
Figure 37 FDI Inflow Ratio and Business Environment_FDI inflows as a percentage of GFCF and business environment score in 2000–2016
Sources: United Nations Conference on Trade and Development (UNCTAD), World In-vestment Report 2017; The Economist Intelligence Unit (2014).
36: The EIU’s business rankings model examines 10 separate criteria or categories, covering the political environment, the macro-economic environment, market opportunities, policy towards free enterprise and competition, policy towards foreign investment, foreign trade and exchange controls, taxes, financing, the labor market and infrastructure. Each category contains a number of indicators that are assessed by the EIU for the last five years and the next five years. The number of indicators in each category varies from 5 (foreign trade and exchange regimes) to 16 (infrastructure), and there are 91 indicators in total. Each of the 91 in-dicators is scored on a scale from 1 (very bad for business) to 5 (very good for business).
0
20
40
60
100
80
120% FDI in�ows as a percentage to GFCF, an average in the period 2000–2016
Hong Kong
Singapore
Cambodia
Netherlands
Myanm
arM
ongolia
VietnamBruneiBahrainCanadaU
AEM
alaysiaSaudi ArabiaSpainAustraliaThailandPakistanG
ermany
Qatar
Om
an
PhilippinesTurkeyChina
IndiaFranceSri LankaRO
CKoreaBhutanBangladesh
Kuwait
IndonesiaN
epalJapan
Fiji
UK
US
Italy
Iran
117.5
71.1
41.4 39.4
23.7 21.9 20.5 19.1 17.4 17.3 14.6 13.4 12.8 11.9 11.6 11.0 11.0 7.9 7.9 7.8 7.2 6.9 6.8 6.1 5.8 5.6 5.5 5.1 4.7 3.7 3.3 3.3 3.3 3.3 3.1 3.0 0.9 0.6
29.4
Figure 36 FDI Inflows_FDI inflows as a percentage of GFCF, an average of the ratios in 2000–2016
Source: United Nations Conference on Trade and Development (UNCTAD), World Investment Report 2017.
©20
18 A
sian
Prod
uctiv
ity O
rgan
izat
ion

4
45
4.1 Final Demand Compositions
the bottom 10%. Figure 37 plots this business environment score and the FDI inflows ratio in the coun-tries presented in Figure 36, excluding the countries in which the FDI inflows ratio is over 25%. There is a positive correlation between these two. Nepal is not covered in The Economist Intelligence Unit (EIU) (2014). In World Bank (2018), Nepal is evaluated inferior to India and superior to Sri Lanka for conduct-ing business. Iran, Pakistan, Bangladesh, Sri Lanka, and Nepal, improving business environment is a necessary condition for attracting FDI. Problems in Japan, with the lowest FDI ratio in Figure 36, seem to be not appropriately captured in rankings in business environment.
Figure 38 focuses on investment components, showing the nominal investment share of seven types of assets for some selected countries.37 For most countries, investment is still very much construction-based (i.e., in dwellings, non-residential buildings, and other structures). However, the expansion of IT capital in the past four decades is significant in the US, Japan, the Asian Tigers, Brunei, and Malaysia – even at the current price comparisons. The real-term comparisons are conducted at the flow and stock levels in Chapter 5 (p. 55). The ROC, Japan, Korea, the US, and Singapore invested in R&D activities by more than 10% of total investment in 2016. Among the Asian Tigers, however, Hong Kong has a smaller share of R&D in GFCF (4%) in 2016.
Figure 39 plots the long-term trend of net export share in GDP from 1970 to 2016. Net exports, which were previously a huge drag on the Asian Tigers, Singapore, and Korea in the 1970s, have improved their position rapidly. In recent years, net exports are making a positive contribution to GDP for all of the Asian Tigers. The share of net exports in Singapore is particularly large, at 26.1% in 2016, compared with 6.9%, 12.2%, and 2.3% for Korea, the ROC, and Hong Kong, respectively. China is another country that
37: The investment data by type of assets includes our own estimates for the countries where data is not available. Although our es-timates are constructed based on 11 classifications of assets (see Table 3 in Appendix 3, p. 133), including the R&D investment, they have been aggregated into seven assets for the purposes of this table. The IT capital is defined as IT hardware, communica-tions equipment, and computer software.
Figure 38 Investment Shares by Type of Asset_Shares of GFCF at current purchaser’s prices by type of assets in 1970 and 2016
Sources: Official national accounts in each country, including author adjustments based on input–output tables and trade data.
Dwellings Non-residential buildings Other structures
Transport equipment IT capitalR&D Other non-IT capital
% 2016% 1970
0
20
40
60
80
100
0
20
40
60
80
100
BangladeshM
ongoliaIndiaN
epalIranVietnamKoreaH
ongKongFijiLaoPD
RU
SSingaporeJapanIndonesiaPakistanM
alaysiaM
yanmar
ThailandSriLankaRO
CPhilippinesBruneiChina
BangladeshM
ongoliaN
epalVietnamSriLankaSingaporeM
yanmar
US
KoreaPakistanLaoPD
RFijiJapanM
alaysiaChinaCam
bodiaH
ongKongRO
CThailandIranBruneiIndiaIndonesiaPhilippines
46 4338
29 26 25 23 23 22 22 19 19 19 18 16 15 15 11 9 9 5 4 3
1126
819
8 1120 21
34 33
15 13 15 13 1318 23
1727
14 19
5
26
10
9
16
28
2427
23
8
12
35
159
2032
54
18
24
18
23
14
25
7
21
17
7
10
4
11
13 12
12
12
5
8
11
11
8
4
11
12
215
14
16
30
5
2
124
63
2 2
5
4
6
5
52
2
4
5
11
15 1525
16
2923
18
32
165
24
43
25 28
11
3525
3035 40
30
43 41
3326 25 24 23 20 20 19 19 17 16 16 14 13 13 12 12 9 9 8 7 7 6 5
24
25 23
119
18 1611
19
713
31
10
23 28 27
11 18
7 416
2421
18
1316
36
27 34
9
36
10
12
19
30
15
20
20
23 30
118
1612
18
24
54
28
9 12
3
16 9
9
10
9
9
9
1521
6
10
9 4
7 624
21
11
7
3
20
2
2
11
2
13
14
2
15
3
4
4
17
3
3
3
43
3
73 19
3
167
5
7
10
13 7
44
12
8 11
6
21
4
4
7
18 168
1522
13 1321 21
42
177
23 24 19 22
4333 31
46
28 30
1221
©20
18 A
sian
Prod
uctiv
ity O
rgan
izat
ion

46
4 Expenditure
has changed its net export position, transforming it into a significant positive contribution to final de-mand. The net export share of GDP peaked at 8.7% in 2007. Since then, it has lagged to 2.2% in 2016.
Japan had enjoyed a trade surplus for most of the period compared, but recently its trade balance has turned negative amounting to –0.5% in 2011 deepening to –2.5% in 2014 (Figure 39.2). In the aftermath of the triple disaster (earthquake, tsunami, and nuclear power plant accident) in 2011, Japan had to
Figure 39 Net Export Share in GDP_Share of net exports with respect to GDP at current market prices in 1970–2016
Sources: Official national accounts in each country, including author adjustments.Note: Countries are grouped according to the levels of per capita income in 2016, relative to the US, defined in Table 2 in Section 6.1 (p. 87).
Figure 39.1: Group-D1 (100%≤)
−20
−10
0
10
20
30
40
50
60
Figure 39.4: Group-D4 (20%≤...<40%)
−30
−20
−10
0
10
20
30
%
1975 1980 1985 1990 1995 2000 2005 2010 20151970
1975 1980 1985 1990 1995 2000 2005 2010 20151970
%
Figure 39.2: Group-D2 (70%≤...<100%)1975 1980 1985 1990 1995 2000 2005 2010 20151970
1975 1980 1985 1990 1995 2000 2005 2010 20151970
Figure 39.3: Group-D3 (40%≤...<70%)
0
−10
−20
10
20
30
Figure 39.5: Group-D5 (10%≤...<20%)1975 1980 1985 1990 1995 2000 2005 2010 20151970 1975 1980 1985 1990 1995 2000 2005 2010 20151970
%
Figure 39.6: Group-D6 (<10%)
−30
−40
−20
−10
0
20
30
10
40
−20
−30
−40
−10
0
10%
%
−20
−10
0
10
20
30
40
50
60%
BruneiKuwait
Hong Kong
Singapore UAEQatar
Indonesia IranChinaSri Lanka ThailandMongolia
Malaysia TurkeyKorea
Saudi ArabiaOman
AustraliaROC
BahrainJapan
VietnamPhilippines
BhutanIndia
FijiLao PDR
Pakistan
BangladeshMyanmar
CambodiaNepal
©20
18 A
sian
Prod
uctiv
ity O
rgan
izat
ion
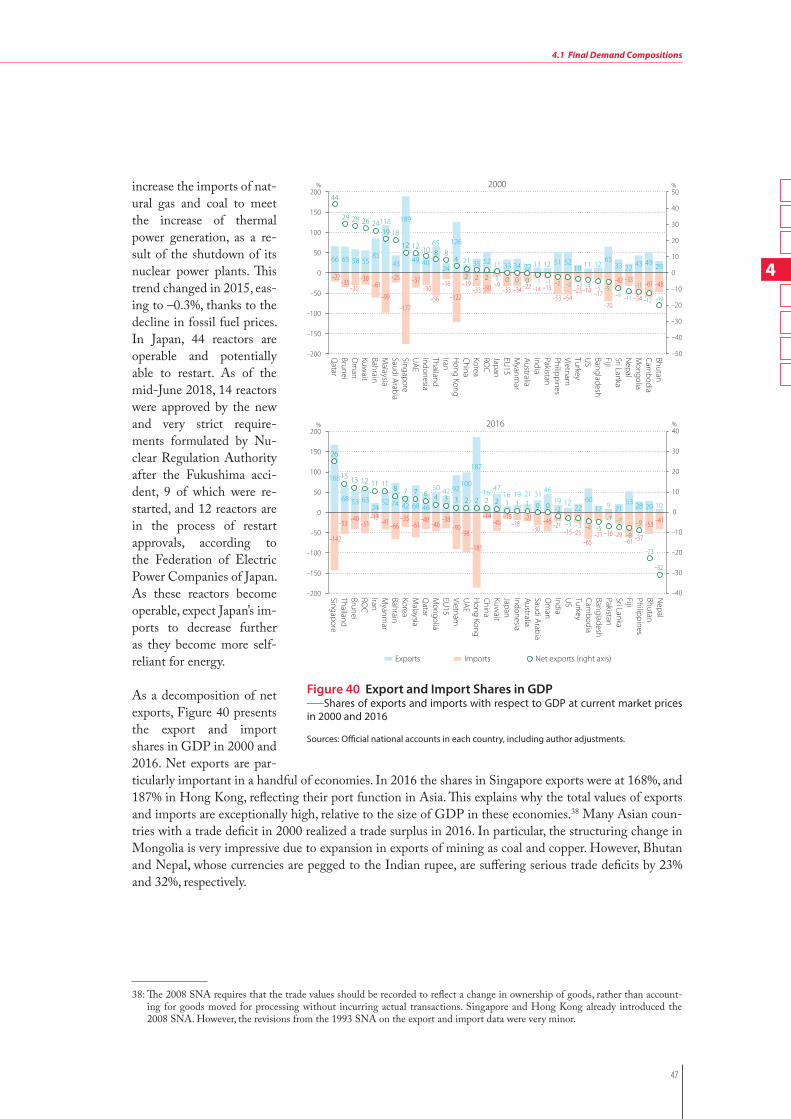
4
47
4.1 Final Demand Compositions
increase the imports of nat-ural gas and coal to meet the increase of thermal power generation, as a re-sult of the shutdown of its nuclear power plants. This trend changed in 2015, eas-ing to –0.3%, thanks to the decline in fossil fuel prices. In Japan, 44 reactors are operable and potentially able to restart. As of the mid-June 2018, 14 reactors were approved by the new and very strict require-ments formulated by Nu-clear Regulation Authority after the Fukushima acci-dent, 9 of which were re-started, and 12 reactors are in the process of restart approvals, according to the Federation of Electric Power Companies of Japan. As these reactors become operable, expect Japan’s im-ports to decrease further as they become more self-reliant for energy.
As a decomposition of net exports, Figure 40 presents the export and import shares in GDP in 2000 and 2016. Net exports are par-ticularly important in a handful of economies. In 2016 the shares in Singapore exports were at 168%, and 187% in Hong Kong, reflecting their port function in Asia. This explains why the total values of exports and imports are exceptionally high, relative to the size of GDP in these economies.38 Many Asian coun-tries with a trade deficit in 2000 realized a trade surplus in 2016. In particular, the structuring change in Mongolia is very impressive due to expansion in exports of mining as coal and copper. However, Bhutan and Nepal, whose currencies are pegged to the Indian rupee, are suffering serious trade deficits by 23% and 32%, respectively.
Figure 40 Export and Import Shares in GDP_Shares of exports and imports with respect to GDP at current market prices in 2000 and 2016
Sources: Official national accounts in each country, including author adjustments.
0
−200
−150
−100
−50
50
100
150
200%
0
−200
−150
−100
−50
50
100
150
200%
%
%
0
−10
−50
−40
−30
−20
20
10
30
40
50
0
−40
−30
−20
−10
10
20
40
30
2016
2000
Qatar
BruneiO
man
Kuwait
BahrainM
alaysiaSaudi ArabiaSingaporeU
AEIndonesiaThailandIranH
ong KongChinaKoreaRO
CJapanEU
15M
yanmar
AustraliaIndiaPakistanPhilippinesVietnamTurkeyU
SBangladeshFijiSri LankaN
epalM
ongoliaCam
bodiaBhutan
SingaporeThailandBruneiRO
CIranM
yanmar
BahrainKoreaM
alaysiaQ
atarM
ongoliaEU
15VietnamU
AEH
ong KongChinaKuw
aitJapanIndonesiaAustraliaSaudi ArabiaO
man
IndiaU
STurkeyCam
bodiaBangladeshPakistanSri LankaFijiPhilippinesBhutanN
epal
−22 −35
−30 −30
−61
−99
−25
−177
−37 −30
−56
−16
−122
−19 −33 −50 −9
−33 −34 −22 −14 −13 −53 −54
−23 −14 −17
−70
−42 −33
−54
−61 −48
66 65 58 55 85
118
43
189
49
65
24
126
21 35 52 11 33 34 22 13 12 51 52 19 11 12
65 33 22 43 49 29
44
29 28 24 19 18
12 12 10 8 8 4
2 1 −1 000 −1 −2 −2 −3 −5 −9 −11
−11
−12
−142
−53−40
−51−13
−41 −66−35
−61−40
−46−38
−90−98
−185
−14−45
−15−18
−21−30 −21
−15−25−65
−21 −16−61
−53 −41
168
68 53 6324
52 74 42 68 46
50 42100
187
1647
16 19 21 3119
2260
17 9 2153 28 29 10
15 13 12 11 11 7 7 6 4 3 3 2 2 2 2
−2
−3 −3 −4 −5 −7
−8
−9
−23
−32
−7
−4 −5
2 2
40
26
92
26
8
1 1 1 0 0
46
12
−46
−29 −37
−19
Exports Imports Net exports (right axis)
38: The 2008 SNA requires that the trade values should be recorded to reflect a change in ownership of goods, rather than account-ing for goods moved for processing without incurring actual transactions. Singapore and Hong Kong already introduced the 2008 SNA. However, the revisions from the 1993 SNA on the export and import data were very minor.
©20
18 A
sian
Prod
uctiv
ity O
rgan
izat
ion

48
4 Expenditure
4.2 Expenditure-side Growth
Figure 41 shows the decomposition of the average annual economic growth by final demand for the pe-riods 1990–2010 and 2010–2016, respectively. Here, the Asia30 grew stably in latter periods at 5.3% on average per annum compared with 5.4%,39 though the earlier period embodied the economically atypical event of the Asian financial crisis. In 1990–2010, China experienced the fastest economic growth among the countries studied, averaging 10.1% per year, 50% of which was driven by investment, compared with 34% by household consumption. The large contribution of investment has been sustained in China as 48%
39: The Törnqvist quantity index is adopted for calculating the growth of real GDP. Using this index, the growth of real GDP into the products of contributions by final demands can be decomposed:ln (GDP t / GDP t−1) = ∑ i (1/2) (si
t + sit−1) ln (Qi
t / Qit−1)
Real GDP growth Contribution of final demand i where Qi
t is quantity of final demand i in period t and sit is expenditure share of
final demand i in period t. Thus, the real GDP growth may diverge from the official estimates or those presented in Table 9 (Ap-pendix 9, p. 147)
Figure 41 Final Demand Contributions to Economic Growth_Average annual growth rate of constant-price GDP and contributions of final demands in 1990–2010 and 2010–2016Sources: Official national accounts in each country, including author adjustments. Note: The starting periods are 1993 for Cambodia and 2000 for Nepal and Mongolia.
1990–2010
2010–2016
Household consumption Government consumption
Investment Real GDPNet exports
−2
0
2
4
6
8
10%
−4
−4
−2
0
2
4
6
8
10%
ChinaQ
atarCam
bodiaVietnamM
ongoliaSingaporeIndiaCLM
VM
alaysiaBhutanSouth AsiaEast AsiaAsia24Asia30BahrainKoreaSri LankaRO
CASEANIranASEAN
6IndonesiaBangladeshPakistanU
AEKuw
aitM
yanmar
ThailandAPO
20TurkeyG
CCO
man
Hong Kong
PhilippinesN
epalSaudi ArabiaAustraliaU
SFijiEU
15BruneiJapan
3.4
1.4
5.7 4.5 4.0
2.1 3.7 3.9
3.0 3.1 3.6 2.1 2.6 2.5 2.4 2.4
3.5 2.4 2.9 3.4 2.8 3.1 2.8
3.5 2.5
0.6
2.9 2.3 2.4 2.3 1.7 2.5 2.1
3.1 2.8 1.3
2.1 1.9 1.9 1.0 0.6 0.6
1.5
1.0
0.6
0.4 1.1
0.7
0.7 0.3 0.8 0.8
0.6
0.9 0.7 0.7 0.7 0.6
0.5
0.4 0.5
0.4 0.5 0.3 0.3
0.3 0.4
1.8
0.2 0.7 0.5 0.5 0.7
0.9 0.3
0.2 0.6
0.7 0.5
0.2 0.2 0.4 0.8 0.4
5.0
4.6
1.9 3.6
4.0
1.7
2.4 2.9
1.9
4.6
2.1
2.4 2.1 2.1 2.3 1.5
2.1
1.1 1.2
1.8 1.0 1.0 1.8 0.7 1.6
1.5 1.8
0.5 1.0 1.4 2.1
1.7
1.0 0.6
2.2
2.3 1.4 0.6 0.3
0.3
0.6
−0.3
0.2
2.1
−0.5 −0.9 −2.4
2.1
−0.3 −0.7
0.6
−2.3 −0.3
0.3 0.2 0.2 0.1 1.0
−0.7
1.4 0.5
−0.7
0.6 0.4
−0.1
0.3 0.1 0.7
−0.4
0.8 0.3
−0.2 −0.5 −1.2
0.5
−0.2 −2.1
−1.0 −0.7 −0.2 −0.4
0.1
−0.6
0.3
10.1
9.2
7.7 7.6
6.7 6.6 6.4 6.3 6.3 6.1 6.0 5.7 5.7 5.5 5.5 5.5 5.4 5.3 5.1 4.9 4.9 4.8 4.8 4.8 4.6 4.5 4.3 4.3 4.1 4.0 4.0 4.0 3.9 3.73.4 3.3 3.3
2.52.1
1.81.4 1.0
Mongolia
ChinaBhutanCam
bodiaIndiaTurkeyPhilippinesSouth AsiaM
yanmar
BangladeshCLM
VVietnamEast AsiaQ
atarAsia24Asia30IndonesiaM
alaysiaASEANASEAN
6U
AESri LankaPakistanG
CCN
epalSingaporeAPO
20O
man
Saudi ArabiaBahrainKuw
aitThailandAustraliaH
ong Kong
KoreaRO
CIran
EU15
JapanBrunei
Fiji
US
4.1 3.0 3.7
4.8 3.8 3.5
4.4 3.8 2.1
3.4 2.8 3.2 2.2
1.3 2.6 2.5 2.8 3.4 2.7 2.7
1.0
3.0 3.6
1.4
3.4
1.3 2.3 2.0 1.6 1.2 1.5 1.3 1.4
2.9
0.6 1.1 1.4 0.7
1.6
0.4 0.3 0.5
1.4
1.1 0.2
0.3 0.5 0.7
0.7 0.5
0.7
0.3 0.5 0.4
0.9
0.8
0.7 0.7 0.3 0.7
0.5 0.5
0.7
0.3 0.6
0.7
0.6
0.3
0.4 1.0 0.6 0.9 0.7 0.5 0.5
0.3
1.4 0.5 0.3 0.3
-
−0.1
0.1
0.3 -
−0.1
2.7
3.6 3.5 2.2 1.6 1.8
2.3 1.6
2.9 2.3
1.8 1.3 2.6 2.9
2.0 1.9 1.8 0.0 1.6
1.5 1.5
0.3
2.6 0.5
0.8
3.8
1.0
0.9 1.3
0.5 1.3 0.9
0.2 0.2 0.3 1.1 0.5
−2.8
0.7
0.2
0.6
0.8
−0.1 −0.1 −0.4 −0.5
0.4 0.1
−1.1
0.3 0.4
−0.1
0.8 0.7
−0.1
0.5 0.2 0.2
−0.7
0.2 0.1 2.5
−1.5 −0.4
1.3
−3.7
1.6 0.4
−0.3
1.4 0.6
0.5 1.0
0.7
−0.6 −0.5
0.4 0.7
4.0
−0.1
0.3
−0.2
−2.5
8.1 7.6
7.0 6.9 6.4 6.2 6.2 6.1 6.1 5.9 5.8 5.6 5.6 5.5 5.5 5.4 5.0 5.0 4.9 4.7 4.5 4.4 4.3 4.2 4.2 4.1 4.1 4.1 4.1 4.1
3.6 3.1
2.8 2.7 2.7 2.5 2.3 2.3 2.0
1.0 1.0
−1.3
©20
18 A
sian
Prod
uctiv
ity O
rgan
izat
ion

4
49
4.2 Expenditure-side Growth
in the recent period 2010–2016, although the average growth rate decreased to 7.6% per year. Bhutan is another country to have a strong driver of investment (50% of 7.0% of average annual growth in 2010–2016). This is due to massive investment in hydropower plants, mainly financed by India. With the excep-tions of China, Bhutan, and some GCC countries, the engine of growth for most countries in Asia was household consumption, while investment growth was more subdued.
Figure 42 shows the impacts of the global financial crisis and countries’ path of recovery from the view-point of final demand between 2007 and 2012. The adverse impact of the crisis was felt through invest-ment in most countries, and to a lesser extent, through net exports. Drastic contraction in investment became commonplace in countries from 2008–2009. China’s robust growth in investment was a result of prompt active policy intervention in the face of the potential detrimental effects of the crisis on the economy, and shrinking net exports. Hong Kong and Japan also suffered from the negative impact of net exports on growth. Investment rebounded strongly in 2009–2010 with favor-able policy levers, but moderated in the subsequent years when the ef-fects of policy faded out. Only China and Singapore sustained their robust investment growth.
In comparison, the impact of the Asian financial crisis was more
Figure 42 Impacts of Global Financial Crisis and Recoveries_Annual growth rate of constant-price GDP and contributions of final demands in 2007–2012
Sources: Official national accounts in each country, including author adjustments.
2007–2008
−10
−5
5
10
15% 2008–2009
−10
−5
0
5
10
15%
0
0
4
12
%
−4
8
16
2010–2011%2009–2010
−4
−2
0
2
4
6
8
12
10
−4
−2
0
2
4
6
8
10% 2011–2012
Household consumption Government consumption Investment Net exports GDP
SingaporeKoreaRO
CH
ong KongChinaIndiaJapanU
SEU
15
SingaporeKoreaRO
CH
ong KongChinaIndiaJapanU
SEU
15
SingaporeKoreaRO
CH
ong KongChinaIndiaJapanU
SEU
15
SingaporeKoreaRO
CH
ong KongChinaIndiaJapanU
SEU
15
SingaporeKoreaRO
CH
ong KongChinaIndiaJapanU
SEU
15
Figure 43 Impacts of Asian Financial Crisis_Annual growth rate of constant-price GDP and contributions of final demands in 1997–1998
Sources: Official national accounts in each country, including author adjustments.
Household consumption Government consumption
Investment Net exports GDP
%
−25
−20
−15
−10
−5
0
5
10
15
25
20
IndonesiaThailandH
ong KongPhilippinesKoreaSingaporeBruneiM
alaysiaJapanIranU
AEKuw
aitPakistanBhutanQ
atarRO
CTurkeyBangladeshFijiIndiaSaudi ArabiaSri LankaO
man
Cambodia
Myanm
arBahrainVietnamChinaU
SEU
15Australia
©20
18 A
sian
Prod
uctiv
ity O
rgan
izat
ion

50
4 Expenditure
Bahrain
1971 1976 1981 1986 1991 1996 2001 2006 2011 2016
%
Brunei
Indonesia
−24
−18
−12
−6
0
6
12
18%
%
−12
−6
0
6
12
18
ROC
Korea
−24
−18
−12
−6
0
6
12
18%
Mongolia
−20
−10
0
10
20
30
40%
−20
−10
0
10
20
30%
60
45
30
15
0
−15
−30
Household consumption Net exports Government consumption Investment Real GDP
Bangladesh %
−10
0
5
−20
−5
15
−15
10
Fiji%
−5
5
10
20
15
0
−15
−10
1971 1976 1981 1986 1991 1996 2001 2006 2011 2016 1971 1976 1981 1986 1991 1996 2001 2006 2011 2016
Hong Kong%
−5
5
10
15
0
−10
16
−8
−4
0
4
12
8
%Cambodia
Iran
−32
−24
−16
−8
0
8
16
24%
Kuwait
0
−200
−150
−100
−50
50
100
150
200%
−30
−20
−10
0
10
30
20
% Myanmar
Bhutan
−20
−10
0
10
20
30%
China
−8
−4
0
4
8
12
16
20%
%
−24
−18
−12
−6
0
6
12
18
Malaysia
Japan%
−2
−4
0
2
4
6
8
−6
10
India
−6
3
0
3
6
9
12%
1971 1976 1981 1986 1991 1996 2001 2006 2011 2016 1971 1976 1981 1986 1991 1996 2001 2006 2011 2016 1971 1976 1981 1986 1991 1996 2001 2006 2011 2016
1971 1976 1981 1986 1991 1996 2001 2006 2011 20161971 1976 1981 1986 1991 1996 2001 2006 2011 20161971 1976 1981 1986 1991 1996 2001 2006 2011 2016
1971 1976 1981 1986 1991 1996 2001 2006 2011 2016 1971 1976 1981 1986 1991 1996 2001 2006 2011 2016 1971 1976 1981 1986 1991 1996 2001 2006 2011 2016
1971 1976 1981 1986 1991 1996 2001 2006 2011 2016
1971 1976 1981 1986 1991 1996 2001 2006 2011 2016
1971 1976 1981 1986 1991 1996 2001 2006 2011 2016
1971 1976 1981 1986 1991 1996 2001 2006 2011 2016
1971 1976 1981 1986 1991 1996 2001 2006 2011 2016
1971 1976 1981 1986 1991 1996 2001 2006 2011 2016
©20
18 A
sian
Prod
uctiv
ity O
rgan
izat
ion

4
51
4.2 Expenditure-side Growth
US
−30
−20
−10
0
10
20
30
40
Oman%
−30
−20
−10
0
10
20
30% Qatar
−12
−6
0
6
12
18Sri Lanka%
−20
−10
0
10
20
30% Vietnam
−6
−4
−2
0
2
4
6
8Australia%
−4
−2
0
2
4
6
8
10
12Asia30%
−16
−12
−8
−4
0
4
8
12ASEAN%
−6
−3
0
3
6
9
15
12
Pakistan%
−40
−20
0
20
40
60
Saudi Arabia%
−30
−20
−10
0
10
20Thailand%
−6
−3
0
6
3
9%
Turkey
−15
−10
−5
0
5
10
15%
−6
−4
−2
0
2
4
6
8
10% APO20
−6
−4
−2
0
2
4
6EU15%
−30
0
30
60
90UAE%
−12
−6
0
6
12
18
Singapore%
Philippines
−15
−10
−5
0
5
10
15%
1971 1976 1981 1986 1991 1996 2001 2006 2011 2016
%
−10
−5
0
5
10
15Nepal
Household consumption Net exports Government consumption Investment Real GDP
1971 1976 1981 1986 1991 1996 2001 2006 2011 2016
1971 1976 1981 1986 1991 1996 2001 2006 2011 2016 1971 1976 1981 1986 1991 1996 2001 2006 2011 2016
1971 1976 1981 1986 1991 1996 2001 2006 2011 2016
1971 1976 1981 1986 1991 1996 2001 2006 2011 2016
1971 1976 1981 1986 1991 1996 2001 2006 2011 2016
1971 1976 1981 1986 1991 1996 2001 2006 2011 2016
1971 1976 1981 1986 1991 1996 2001 2006 2011 2016
1971 1976 1981 1986 1991 1996 2001 2006 2011 2016
1971 1976 1981 1986 1991 1996 2001 2006 2011 2016
1971 1976 1981 1986 1991 1996 2001 2006 2011 2016
1971 1976 1981 1986 1991 1996 2001 2006 2011 2016
1971 1976 1981 1986 1991 1996 2001 2006 2011 2016
1971 1976 1981 1986 1991 1996 2001 2006 2011 2016
1971 1976 1981 1986 1991 1996 2001 2006 2011 2016
1971 1976 1981 1986 1991 1996 2001 2006 2011 2016
1971 1976 1981 1986 1991 1996 2001 2006 2011 2016
Figure 44 Final Demand Contributions to Economic Growth (Year-over-Year)_Annual growth rate of constant-price GDP and contributions of final demands in 1970–2016
Sources: Official national accounts in each country, including author adjustments.
©20
18 A
sian
Prod
uctiv
ity O
rgan
izat
ion

52
4 Expenditure
contained. Figure 43 suggests that the impact was contained within Asia, except for the handful of coun-tries affected, it marked an exceptional time. In 1998, investment took a nosedive in Indonesia, Korea, Malaysia, Singapore, and Thailand. Household consumption also fell, albeit to a lesser extent. The crisis however, greatly boosted these countries’ net exports, likely to have benefitted from the rapid devaluation of the Asian currencies, except the Japanese yen at the time of the crisis. This helped bolster the impacted economies against the retrenchment in other components of final demand.
Figure 44 shows how the contribution of economic growth by final demand varies across countries and over time for the period 1970–2016. The immediate impact of the global financial crisis in 2007–2008 is represented in the data. Most countries felt an adverse impact in 2008 and 2009, with the exception of India, where in 2009 growth rebounded strongly from a slowdown in the previous year. The impact on the Asian countries varied both in magnitude and nature. Japan’s recession was particularly deep with the economy falling by 1.2% and 5.6% in 2008 and 2009, respectively, compared with 1.6% growth in 2007. The economic retrenchment in Japan was deeper than the –2.9% in the US and –4.8% in the EU15 in 2009. Besides Japan, other Asian countries either experienced a mild recession or a growth slowdown. Moreover, relative to their rapid growth, the magnitude of the impact could still be substantial. For ex-ample, the growth in the ROC slowed from 6.7% in 2007 to 0.8% in 2008 before moving into the nega-tive zone of –2.2% in 2009.
The channels through which economic growth was adversely impacted also varied across countries. Japan’s recession in 2009 was largely accounted for by a sharp fall in investment (4.0 percentage points) and, to a lesser extent, a fall in net exports (1.5 percentage points). Meanwhile the 0.4% growth of government spending canceled out the 0.4% fall in household consumption. Similarly, in the ROC, investment fell by 5.2% in 2009, while household consumption and net exports grew, albeit more slowly than previously. Hong Kong took a hard hit in terms of net exports in 2009, which fell by 3.0 percentage points. House-hold consumption growth slowed considerably in 2009 to 0.1 percentage points before bouncing back to its normal range of 3–5%.
It is difficult to understand the oil-exporting economies fully without analyzing the oil market in parallel. Its volatility can be observed clearly from Figure 44, with huge peaks and valleys, particularly in the 1970s. The oil booms of the 1970s brought benefits, but the downturn was a detriment. Net exports remain er-ratic, but overall volatility seems to have reduced in the past two decades. Qatar experienced the fastest GDP growth among the oil-exporting countries in recent years with very strong investment growth. However, its economy remains very dependent on oil and gas and related industries, which accounted for 29% of its GDP in 2016 (Figure 76 in Section 6.1, p. 88) – roughly 80% of its export earnings, and 70% of government revenues in the 2000s.40 In contrast, Bahrain has diversified into a regional banking and financial center and benefited from the regional boom in recent years. Petroleum production and process-ing accounted for 12% of its GDP in 2016 (Figure 76) – about 60% of export earnings, and 75% of gov-ernment revenues in the 2000s.41
40: Data from the series of Annual Statistical Abstract, State of Qatar. 41: Data from the Ministry of Finance, Kingdom of Bahrain.
©20
18 A
sian
Prod
uctiv
ity O
rgan
izat
ion

4
53
4.2 Expenditure-side Growth
The definition of the “informal sector” varies depending on the purposes and the context of discussion. One statistical definition of the informal sector is provided by the 15th ICLS resolution of the International Labour Organization (ILO) in 1993 as follows:
The informal sector units are divided into two subsets:(a) Informal own-account enterprises. These are household enterprises owned and operated by own-account work-ers, either alone or in partnership with members of the same or other households, which may employ contributing family workers and employees on occasional basis but do not employ employees on a continuous basis.(b) Enterprises of informal employers. These are household enterprises owned and operated by employers, either alone or in partnership with member of the same or other households, which employ one or more employees on a continuous basis. Enterprises may be considered informal if they meet one of the following criteria: (a) small size of the enterprise in terms of employment, (b) non-registration of the enterprise, and (c) non-registration of its employ-ees (ILO, 2013, pp. 249–250).
Examples of the informal sector include unpaid work in a family enterprise, casual wage labor, home-based work, and street vending.
The informal sector in less developed countries (LDCs) is vast. Compared with workers in the formal sector, those in the informal sector are typically paid poorly and supply labor in low-quality working conditions with-out legal protection or official social protection. Some part of the informal sector exists for the purpose of tax evasion, but the dominant portion in LDCs provides “the only opportunity for many poor people to secure their basic needs for survival” (ILO, 2013, p.3). Encouraging labor movements from the informal sector to the formal sector is one of the most important developmental issues in many LDCs.
How far the informal sector is counted in the national accounts depends on the country. The size of the infor-mal sector is not directly comparable across countries. However, we can loosely grasp the significance of the informal sector by looking at “the number of employment” and “the number of employees.”
The number of employment is esti-mated to be consistent with the na-tional accounts, which tries to capture economic activities of the whole econ-omy, though some part of workers in the informal sector would be missing. On the other hand, the data for the number of employees seems to be drawn from official labor surveys and thus is likely to exclude most of the employment in the informal sector. Therefore, a difference between the number of employment and the num-ber of employees is loosely regarded as employers/self-employed workers in the formal sector and workers in the informal sector. Although statistical problems are evident, particularly for the treatment of the employment data in the agricultural sector, we can still clearly see that the number of em-ployees is substantially lower than the number of employment in LDCs.
Figure B2 plots the ratio of the num-ber of employees to the number of employment (the vertical axis) against
Box 2 Size of the Informal Sector
continued on next page >
Figure B2 Employee Share and Per Capita GDP Level_Share of employee and per capita GDP level in 2016
Sources: Official national accounts in each country, including author adjustments; APO Productivity Database 2018.
10
20
30
40
50
60
70
80
90
100Share of employee to employment in 2016%
Per capita GDP in 2016 (using 2011 PPP, reference year 2016)
Thousands of US dollars (as of 2016)
00
2010 30 40 50 60 70 9080
Bangaldesh
Cambodia
ROC
Fiji
Hong Kong
India
Indonesia
Iran
Japan
KoreaMalaysia
Mongolia
NepalPakistan
Philippines
Singapore
Sri Lanka
Thailand
Vietnam
China
US
EU15
Australia
Turkey
Bhutan
©20
18 A
sian
Prod
uctiv
ity O
rgan
izat
ion

54
4 Expenditure
> continued from previous page
PPP-adjusted per capita GDP (the horizontal axis) in 2016 for a number of countries. Employee ratios tend to be higher as countries have higher income. However, even among LDCs, employee ratios have substantial variation; low in most of the South Asian countries while relatively high in ASEAN Member States.
The policy implication is profound. First, LDCs with low employee ratios are likely facing difficulties in en-couraging labor movements from informal to formal sectors. The reasons could be on the demand side, the supply side, or the combination of both. The growth of the formal sector, particularly the manufacturing sector and modern services sectors, may not create enough jobs. The gap of human capital between informal and formal sectors may be too large. Urban living conditions may be too harsh and expensive to attract rural people to urban areas. Governments must find and resolve bottlenecks to make labor movements smoother.
Second, raising minimum wage is recently a popular policy in many countries including Thailand, Indonesia, and Cambodia, but may deter labor movements from informal to formal sectors. Minimum wages are typi-cally enforced only in the formal sector, and wage levels in the informal sector remain low. Raising minimum wages too high may reduce the labor demand in the formal sector, make labor movements more difficult, and in the end negatively impact people in the informal sector. Although the betterment of labor conditions is certainly important, raising minimum wages too high may cause adverse effects for economic development.
The Lewis model (Lewis, 1954) or the Fei-Ranis model (Fei and Ranis, 1964), which established development economics as a respectable academic discipline in the late 1950s and 1960s, proposed the concept of a turning point, where a developing economy transforms itself from an unskilled-labor-abundant economy with seem-ingly unlimited supply of labor, to a labor-scarce industrial economy. The Chinese economy seems to have reached its turning point in the latter half of the 2000s, based on the APO Productivity Database 2018.
Figure B3 presents the price of labor, relative to capital in China, Japan, and the Asian Tigers. The price of labor is defined as the average wage (total labor compensation, including our estimates of wages for self- employed and family workers) over total hours worked. The price of capital is estimated by the ex-post ap-proach for measuring user cost of capital (see Appendix 4, p. 135). The relative price index of labor on capital is normalized as 1.0 in 1970 in each country.
In Japan the price of labor increased at the begin-ning of the 1970s. The price of labor increased for Korea and the ROC in the late 1980s and the be-ginning of the 1990s, respectively. In these peri-ods, China’s low price of labor could be a main source of superior price competitiveness in labor-intensive manufacturing. The turning point was around 2008, when the price of labor started to increase very sharply, relative to capital. Such a turning point emerges when a country makes ef-fective movements on labor from agricultural/ru-ral/informal sectors to industrial/urban/formal sectors. This turn was a great achievement for China, addressing the serious concern of income disparity and working toward alleviation of pov-erty. The Chinese economy has overcome its first-round of economic development issues and now faces new challenges to move beyond the upper middle-income plateau.
Box 3 Turning Point in China
10
20
30
40
50
70
60
0
1970=1.0
1970 1975 1980 1985 1990 1995 2000 2005 2010 2015
China
ROC
Hong Kong
Korea
SingaporeJapan
Figure B3 Price of Labor Relative to Capital in China, Japan, and the Asian Tigers_Index of relative price between labor and capital inputs in 1970–2016
Source: APO Productivity Database 2018.
©20
18 A
sian
Prod
uctiv
ity O
rgan
izat
ion

5
55
5.1 Per-Worker Labor Productivity
Labor productivity can be measured in a number of ways, depending on the definitions of output and labor input measures. In this chapter Section 5.1 presents the labor productivity measure in terms of GDP per worker.42 As workers in high-performing Asian countries tend to work longer hours on average than those in the US, as shown in Figure 114 in Appendix 5 (p. 139), the worker-based labor productivity gaps in this instance cast the Asian countries in a particularly favorable light. Section 5.2 shifts the focus to alternative estimates of labor productivity measure, namely GDP per hour worked.
The sources of economic growth in each economy are further decomposed to factor inputs of labor, capi-tal, and total factor productivity (TFP), based on the growth accounting framework.43 In Sections 5.3 and 5.4, capital input is included as another key factor of production; and the TFP estimates are presented for the 23 Asian countries and the US, based on the estimates of capital services. The measurement of capital stock and services are presented in Appendix 3 (p. 133) and Appendix 4 (p. 135), respectively.44 Section 5.5 presents the estimates of energy productivity, which is becoming an important policy target for pursu-ing sustainable growth of the Asian countries.
5.1 Per-Worker Labor Productivity
Figure 45 presents the cross-country comparisons of per-worker labor productivity levels in 2016, mea-sured as GDP per worker in US dollars. The Asian economies naturally bundle into groups. On this measure, Singapore is the leading economy, 10% larg-er than the US level.45 Hong Kong and the ROC fol-low at some distance. Japan took the fourth place, with productivity levels at 34% below the US. Iran, Korea, and Malaysia followed.46 It is worth noting that Iran has the lowest employment rate in Asia, as presented in Figure 23 in Section 3.3 (p. 31), bringing about higher performance in labor productivity. Thereafter, a number of countries from among the Asia group followed with labor productivity levels at less than 25% of the US, pulling down the aver-age performance of the group to 23% for the Asia30, 24% for the ASEAN6, and 9% for CLMV. Bringing up the rear were China and India, with pro-ductivity levels that were 20% and 13% of the US level, respectively. 47
Table 14 in Appendix 9 (p. 152) presents the compari-son of the per-worker labor productivity levels from 1970 to 2016, evaluated at the US price as of 2016. The figures for GCC countries and Brunei, which are excluded from Figure 45, are uncharacteristically high. There are noticeable variations within this
5 Productivity
42: GDP is valued at basic prices in this chapter, as opposed to GDP at market prices used in the previous chapters. GDP at basic prices is defined as GDP at market prices, minus net indirect taxes on products. As most Asian countries do not provide official estimates for GDP at basic prices in their national accounts, they are calculated based on available tax data. See Appendix 2 (p. 128) for the methods employed for our calculations.
0 20 40 60 80 100 140120
Thousands of US dollars (as of 2016),US=100 in parenthesesNepal
CambodiaBangladesh
VietnamCLMV
MyanmarLao PDR
IndiaSouth Asia
PakistanBhutan
PhilippinesFiji
ASEANChina
IndonesiaAPO20Asia24Asia30
ThailandMongolia
ASEAN6Sri LankaEast AsiaMalaysia
KoreaTurkey
IranEU28
JapanEU15
AustraliaROC
Hong KongUS
Singapore
5.7 (5)
8.6 (7)6.2 (5)
10.2 (9)10.4 (9)10.6 (9)11.5 (10)
16 (13)16 (13)16.4 (14)16.5 (14)18.7 (16)
21.9 (18)23.4 (20)24 (20)24.9 (21)25.8 (22)26.1 (22)27.5 (23)28.3 (24)28.4 (24)28.8 (24)30.7 (26)33.3 (28)
56.4 (47)65.2 (55)67.4 (56)67.5 (56)
77.1 (65)78.7 (66)
82.9 (69)94.5 (79)95.5 (80)
110.5 (92)119.6 (100)
131.9 (110)
Figure 45 Per-Worker Labor Productivity Level_GDP at constant basic prices per worker in 2016, using 2011 PPP, reference year 2016
Source: APO Productivity Database 2018.
©20
18 A
sian
Prod
uctiv
ity O
rgan
izat
ion

56
5 Productivity
region. The atypically high figures in the early period reflect the natural resource rents (the value of the resource over and above the cost of extraction) which are erroneously included in the GDP of these coun-tries. The extent of exaggeration appears to be proportional to their oil production. Saudi Arabia has the largest proven oil reserves in the world and is the largest world oil exporter. Kuwait has the fourth-largest oil reserves in the world. In addition, Qatar has become the fourth-largest exporter of liquefied natural gas. In contrast, Bahrain has the smallest oil reserves in the group and its dependence on oil is therefore lower. Consequently, it has worked to diversify its economy over the past decade, as shown in Figure 92 in Section 6.2 (p. 102).48
China and India are the two giant and fast-emerging economies in Asia. China began with one-third of India’s productivity levels in 1970. Four decades later it shows signs of pulling ahead of India, as shown in Figure 46. In this measure of per-worker labor productivity China overtook India after 2002, about one decade after the parity in per capita GDP measure, as presented in Figure 17 in Section 3.2 (p. 26). China’s relative performance against the US moved up from 2% in 1970 to 6% in 2000 and 20% in 2016, com-pared with the corresponding figures of 5%, 6%, and 13% for India.49
When labor productivity growth is compared, the ranking of countries is substantially reshuffled. The growth comparison of per-worker labor productivity is presented in Table 15 in Appendix 9 (p. 153). In the 2000s there was a surge in labor productivity growth among low-income countries. In the latest period 2010–2016, eight out of the top ten countries with the fastest labor productivity growth were from Group-B4, in which the per capita GDP level in 1970 was less than 10% of the US level, and two from Group-B3, in which it was from 10% to 20% of the
0
5
25
20
10
15
Thousands of US dollars (as of 2016)
1970 1975 1980 1985 1990 1995 2000 2005 20152010
China
India
Figure 46 Labor Productivity of China and India_GDP at constant basic prices per worker in 1970–2016, using 2011 PPP, reference year 2016
Source: APO Productivity Database 2018.
43: The growth accounting approach is based on the microeconomic production theory and the nominal accounting balance of input and output of production. See OECD (2001) for a presentation of definitions, theoretical foundations, and a number of practical issues in measuring productivity.
44: In this edition of Databook, the growth accountings are newly developed for Brunei and Myanmar. Another important improve-ment in this edition is that the estimates of labor input and its compensation were revised in some countries, reflecting our Asia QALI Database on number of workers, hours worked per worker, and hourly wages, cross-classified by gender, education attain-ment, age, and employment status. In some Asian countries like Bangladesh, the Lao PDR, Myanmar, Pakistan, and Vietnam, the COE (compensation of employees) data is not fully available in their national accounts. These were interpolated/extrapolated based on our estimates of COE. See Appendix 5 (p. 137) for the details on hours worked and labor income data.
45: Cross-country level productivity comparisons are notoriously difficult to make and hence subject to much data uncertainty. Es-timates should therefore be taken as indicative for broad groupings rather than precise ranking. For Example, the level of labor productivity in Singapore was slightly lower than the US level in 2011, in the Databook 2013, which was based on the 2005 benchmark PPP. However, in this Databook, it was upwardly revised by 15.3% due to the use of the new 2011 benchmark PPP (See Appendix 6, p. 140).
46: In last year’s edition of Databook, the workers aged over 65 are excluded from labor input in Malaysia, following the definition in labor survey of Malaysia. This edition of the Databook is based on the definition in the Asia QALI Database, in which the dif-ference in coverage of workers is adjusted for better comparison.
47: Comparing productivity among cities sometimes provides a better picture for understanding a productivity gap among countries, which consists of a number of cities with different scales (See Box 5, p. 85).
48: The GCC countries have also been experiencing high population growth, especially in the late 1970s and the early 1980s. In 2000–2016, this has somewhat stabilized at around 3.8% per year, except in the Qatar and the UAE where the population grew at 8.7% and 7.1%, respectively. The working-age population has been expanding accordingly. Employment is erratic from one year to another, and this will be reflected in the labor productivity figures.
49: If the comparisons were with the region’s leader at different times, India’s relative labor productivity has actually fallen, while China has managed to make a substantial leap to close in on the leader, albeit from a very low level.
©20
18 A
sian
Prod
uctiv
ity O
rgan
izat
ion

5
57
5.1 Per-Worker Labor Productivity
US level, as defined in Table 1 in Section 3.2 (p. 28). Among these countries, China has sustained rapid productivity growth in the past two decades. Its growth accelerated to an average of 10.3% per year in 2005–2010 from 7.1% per year in 1995–2000 and 8.6% per year in 2000–2005, and slowed to 7.1% in 2010–2016. This compares with India at 7.0%, 4.2%, 4.7%, and 5.5% over the same periods. Labor pro-ductivity growth among the Asian Tigers was steady, ranging from 3.2% to 3.3% on average per year in
Figure 47 Labor Productivity Level Relative to the US_Index of GDP at constant basic prices per worker in 1970–2016, using 2011 PPP
Source: APO Productivity Database 2018. Note: Countries are grouped based on Table 1 in Section 3.2 (p. 28). The catch-up is defined as average annual rate of catch-up to the US dur-ing 1970–2016.
Figure 47.1: Group-A1 (catch-up≥3%) Figure 47.2: Group-A2 (2%≤catch-up<3%)
Figure 47.3: Group-A3 (1%≤catch-up<2%) Figure 47.4: Group-A4 (0%≤catch-up<1%)
Figure 47.5: Group-A5 (–1%≤catch-up<0%) Figure 47.6: Group-A6 (catch-up<–1%)
1990 1995 2000 20051970 1975 1980 1985 2010 2015
20
10
0
30
40
50
60
70
80US=100
ROC ChinaKorea Cambodia
1990 1995 2000 20051970 1975 1980 1985 2010 2015
40
20
0
60
80
120
100
US=100
Bhutan Hong KongIndonesia MalaysiaSingapore ThailandVietnam
1990 1995 2000 200519700
10
30
20
US=100
1975 1980 1985 2010 2015
India Lao PDRMongolia MyanmarSri Lanka
1975 1980 1985 1990 1995 2000 2005 2010 201519700
40
20
60
80
100US=100
Bangladesh JapanNepal PakistanPhilippines Turkey
1975 1980 1985 1990 1995 2000 2005 2010 201519700
60
40
20
80
100US=100
Australia FijiIran PhilippinesVietnam
0
200
400
600
800
1200
1000
US=100
1975 1980 1985 1990 1995 2000 2005 2010 20151970
Bahrain BruneiKuwait Qatar
©20
18 A
sian
Prod
uctiv
ity O
rgan
izat
ion

58
5 Productivity
2000–2005. This performance was sustained in the late 2000s, except in Singapore, where the average an-nual productivity growth slowed significantly to 0.6%. In 2010–2016 labor productivity growth in the Asian Tigers slowed to 1.2–1.4% per year. The exception is Japan, where the labor productivity growth improved to 0.7% in 2010–2016, from 0.2% in 2005–2010.
Figure 47 shows labor productivity levels relative to the US (=100) for Asian countries. The same group-ing, as in Table 1 in Section 3.2 (p. 28), based on the speed of catch-up with the US in per capita GDP, is used here. Broadly speaking, countries that are catching up faster with the US in per capita GDP (Group-A1) are also faster catching up in labor productivity (Figure 47.1). Similarly, countries with declining relative per capita GDP (Group-A5 and Group-A6) also show signs of deterioration of, or little change against, the US in terms of labor productivity (Figures 47.5 and 47.6).
Among the countries that are catching up with the US in per capita GDP (Group-A1 and Group-A2), the Asian Tigers have made tremendous headway in improving their relative labor productivity over the past four decades. Singapore passed the US in the middle of the 1990s and Hong Kong closed the gap from 64% in 1970 to 8% in 2016 (Figure 47.2). Similarly, the ROC and Korea reduced a gap of 80–90% initially to 20% and 45% by 2016, respectively (Figure 47.1). Malaysia is making steady progress, raising its relative productivity level from 20% of the US in 1970 to 47% in 2016 (Figure 47.2). The rest of the countries in these two groups all display an initial relative labor productivity level of below 15%, but have shown signs of a strong and promising start in their catch-up process in the past decade.
Countries that have managed a modest catch-up with the US (Group-A3 and Group-A4) or have a de-clining per capita GDP against the US (Group-A5 and Group-A6) are also those with stagnant or dete-riorating relative labor productivity. Japan showed strong catch-up behaviors in the earlier period, with relative labor productivity peaking at 78% of the US in 1991. Since then, the gap has widened again to over 30% in 2016. Iran experienced a drastic decline in its relative labor productivity from its former peak of 91% in 1976 to 44% in 1988, before recovering to 61% in 2011. As a result of the strengthened sanc-tions against Iran, however, labor productivity to date declined drastically.
5.2 Per-Hour Labor Productivity
The per-worker based labor productivity gaps presented in Section 5.1 are most likely conservative esti-mates, since workers in high-performing Asian countries tend to work longer hours than those in the US, on average. To adjust for this discrepancy, total hours worked are constructed in our Asia QALI Database for the 24 Asian countries, although the quality of the estimates may vary considerably across countries.50 Figure 48 shows how the productivity gap against the US in 2016 varies depending on which measure of labor productivity is used.51 The productivity gap with the US widens for all Asian countries except Japan when the differences in working hours are taken into account. However, for 16 of these countries, the adjustments are within 1–5 percentage points, and hence are not deemed statistically significant. In con-trast, the choice of labor productivity measure makes a significant difference for the previously
50: Cross-country comparisons of hours worked are notoriously difficult, not least because harmonized data is rarely readily available. In the countries studied, three published their total hours worked as part of their official statistics, but not for the whole period studied in this report, and the publications may have been constructed based on different methodologies. Some countries only published estimates for average weekly hours worked, which required estimates of number of weeks worked to derive the total average hours worked per worker. Others may have only estimated benchmark hours worked available, which are then extrapo-lated to form a series. Consequently, growth of employment and growth of total hours worked become identical, as in the case of China and Thailand. In reading the results, it is therefore important to bear in mind the data limitations. This edition of the Databook uses new and improved time-series estimates of average hours worked, considering the changes in the compositions of workforces. See Appendix 5 (p. 137) for an explanation of the estimation procedure of total hours worked.
51: The labor productivity gap for country x is country x’s labor productivity divided by the US’s labor productivity in Figure 48.
©20
18 A
sian
Prod
uctiv
ity O
rgan
izat
ion
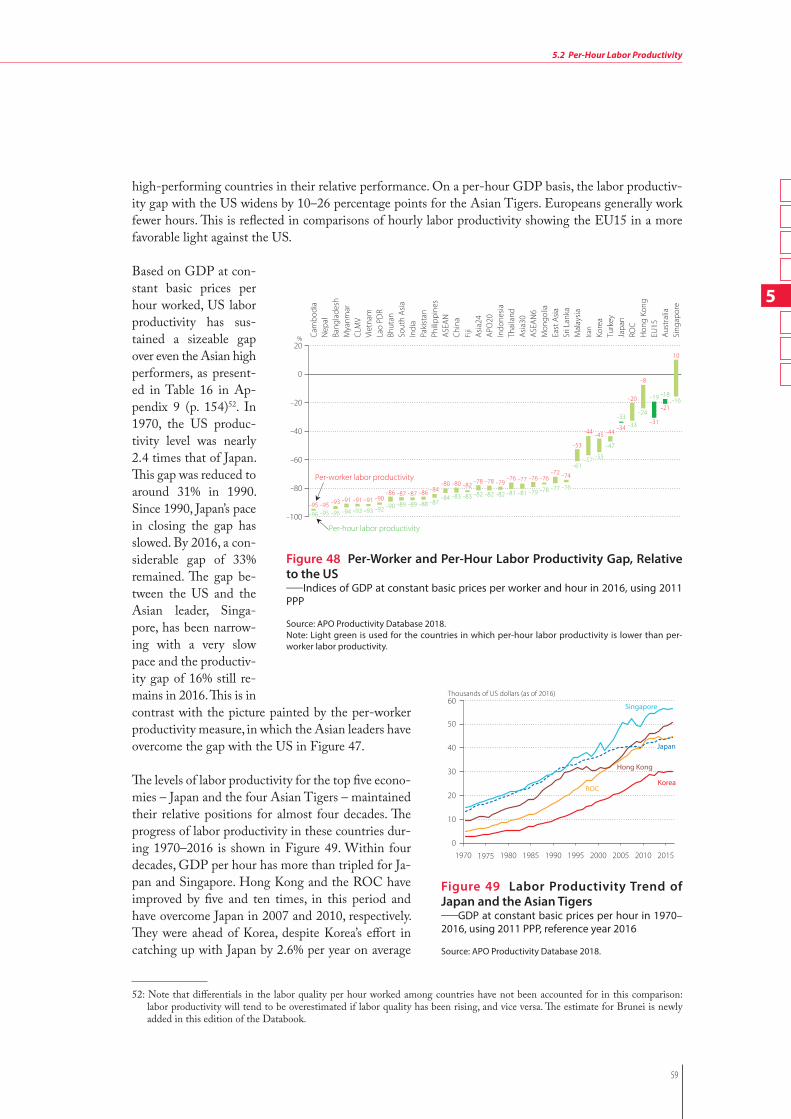
5
59
5.2 Per-Hour Labor Productivity
high-performing countries in their relative performance. On a per-hour GDP basis, the labor productiv-ity gap with the US widens by 10–26 percentage points for the Asian Tigers. Europeans generally work fewer hours. This is reflected in comparisons of hourly labor productivity showing the EU15 in a more favorable light against the US. Based on GDP at con-stant basic prices per hour worked, US labor productivity has sus-tained a sizeable gap over even the Asian high performers, as present-ed in Table 16 in Ap-pendix 9 (p. 154)52. In 1970, the US produc-tivity level was nearly 2.4 times that of Japan. This gap was reduced to around 31% in 1990. Since 1990, Japan’s pace in closing the gap has slowed. By 2016, a con-siderable gap of 33% remained. The gap be-tween the US and the Asian leader, Singa-pore, has been narrow-ing with a very slow pace and the productiv-ity gap of 16% still re-mains in 2016. This is in contrast with the picture painted by the per-worker productivity measure, in which the Asian leaders have overcome the gap with the US in Figure 47.
The levels of labor productivity for the top five econo-mies – Japan and the four Asian Tigers – maintained their relative positions for almost four decades. The progress of labor productivity in these countries dur-ing 1970–2016 is shown in Figure 49. Within four decades, GDP per hour has more than tripled for Ja-pan and Singapore. Hong Kong and the ROC have improved by five and ten times, in this period and have overcome Japan in 2007 and 2010, respectively. They were ahead of Korea, despite Korea’s effort in catching up with Japan by 2.6% per year on average
52: Note that differentials in the labor quality per hour worked among countries have not been accounted for in this comparison: labor productivity will tend to be overestimated if labor quality has been rising, and vice versa. The estimate for Brunei is newly added in this edition of the Databook.
Figure 48 Per-Worker and Per-Hour Labor Productivity Gap, Relative to the US_Indices of GDP at constant basic prices per worker and hour in 2016, using 2011 PPP
Source: APO Productivity Database 2018.Note: Light green is used for the countries in which per-hour labor productivity is lower than per-worker labor productivity.
−100
−80
−60
−40
−20
0
20%
Per-worker labor productivity
Per-hour labor productivity
Cam
bodi
aN
epal
Bang
lade
shM
yanm
arCL
MV
Viet
nam
Lao
PDR
Bhut
anSo
uth
Asia
Indi
aPa
kist
anPh
ilipp
ines
ASEA
NCh
ina
Fiji Asia
24AP
O20
Indo
nesia
Thai
land
Asia
30AS
EAN
6M
ongo
liaEa
st A
siaSr
i Lan
kaM
alay
siaIra
n
Kore
aTu
rkey
Japa
nRO
CH
ong
Kong
EU15
Aust
ralia
Sing
apor
e
−16
−96 −95 −95 −94 −93 −93 −92 −90 −89 −89 −88 −87−84 −83 −83 −82 −82 −82 −81 −81 −79 −78 −77 −76
−61−57 −55
−47
−33−33
−24
−19 −18
−95 −95 −93 −91 −91 −91 −90−86 −87 −87 −86 −84
−80 −80 −82 −78 −78 −79−76 −77 −76 −76
−72 −74
−53
−44 −45 −44−34
−8
−20
−31
−21
10
Figure 49 Labor Productivity Trend of Japan and the Asian Tigers_GDP at constant basic prices per hour in 1970–2016, using 2011 PPP, reference year 2016
Source: APO Productivity Database 2018.
1970 1975 1980 1985 1990 1995 2000 2005 2010 20150
10
20
30
50
60
40
Thousands of US dollars (as of 2016)
ROC
Hong Kong
Japan
Korea
Singapore
©20
18 A
sian
Prod
uctiv
ity O
rgan
izat
ion

60
5 Productivity
over the past four decades (1970–2016). If Korea can maintain this effort at the same pace, it would take 15 years to finally draw level with Japan. However, the labor productivity growth in Korea has stagnated since 2013. Over the entire observation period 1970–2016, hourly labor productivity growth ranged from 0.7% (Fiji) to 6.7% (China) on average per year, compared with the US at 1.6%, as shown in Figure 50. Among the 24 Asian countries compared, only Brunei, Fiji, Iran, and the Philippines grew slow-er than the US. Between the two sub-periods (1970–1990 and 1990–2016), there is a notable deceleration in the hourly productivity growth for 9 of 23 Asian countries (excluding Cam-bodia). For example, about 2.5 percentage points were shaved off productivity growth in the earlier period in both Hong Kong and Japan. A total of 14 Asian countries managed to ac-celerate their productivity improvement after 1990. Among these, the perfor-mances in China and Viet-nam are outstanding, with a productivity acceleration from 4.5% to 8.3% in China and from 0.7% to 5.2% in Vietnam, respectively, between the two sub-periods. The deceleration of labor productivity growth between the two sub-periods reflects weaknesses in output growth in most countries. Figure 51 shows all countries except two South Asian countries (Bangladesh and Nepal) and the Lao PDR experienced a slowdown in hours-worked growth between the sub-periods. This should have worked to boost labor productivity growth, all other things being equal.53 For labor productivity growth to slow implies that output growth must have been decelerating more than labor input in percentage points. In China, output growth was reinforced by the slower pace of labor input growth to result in an extraordinary surge in labor productivity growth in Figure 50. Labor input growth
Figure 50 Labor Productivity Growth_Average annual growth rate of GDP at constant basic prices per hour in 1970–2016, 1970–1990, and 1990–2016
Source: APO Productivity Database 2018. Note: The starting periods for Australia, Cambodia, and Turkey are 1978, 1993, and 1988, respec-tively. Cambodia is not included in CLMV and ASEAN before 1993.
−2
0
2
4
6
8%
ChinaKoreaRO
CEast AsiaBhutanH
ong KongThailandCam
bodiaIndiaAsia24Lao PD
RSouth AsiaSri LankaM
alaysiaVietnamIndonesiaM
ongoliaASEAN
6ASEANSingaporePakistanTurkeyCLM
VJapanAPO
20BangladeshM
yanmar
Nepal
US
AustraliaIranPhilippinesFijiBrunei
6.75.2 4.8
4.0 4.0 3.7 3.7 3.63.6
3.6 3.53.4
3.3 3.3 3.3 3.2 3.1 3.0 2.9 2.9 2.8 2.7 2.62.6
2.6 2.2 2.11.7 1.6 1.4
1.4 1.40.7 −1.5
4.5
6.5 6.3
3.1
4.0
5.1
3.4
2.0
2.7 2.52.1
2.4
3.7
0.7
3.6
2.9 2.9 2.8
3.6 3.5
0.3 0.6
4.1
2.7
0.70.3
1.5 1.5 0.9
0.4 0.3
0.8
−1.9
8.3
4.33.7
4.7
4.0
2.6
3.9 3.6
4.94.2 4.2 4.4
4.0
3.0
5.2
2.8
3.2 3.1 3.12.4 2.2
2.9
4.2
1.5
2.53.3 3.5
1.8 1.6 1.72.2 2.2
0.7
−1.3
1970−2016 1970−1990 1990−2016
Figure 51 Labor Input Growth_Average annual growth rate of total hours worked in 1970–2016, 1970–1990, and 1990–2016
Source: APO Productivity Database 2018.Note: The starting period for Cambodia is 1993 and Cambodia is not included in CLMV and ASEAN before 1993.
−1
0
2
1
3
4
5%
1970−2016 1970−1990 1990−2016
Singapore
Cambodia
Brunei
Malaysia
Philippines
Indonesia
ASEAN6
Bhutan
ASEAN
Vietnam
Pakistan
CLMV
Lao PDR
Nepal
Iran
Myanm
ar
Mongolia
Bangladesh
Fiji
China
South Asia
India
Aisa24
Thailand
Hong Kong
ROC
East Asia
APO20
Korea
Sri Lanka
US
Japan
3.8 3.7 3.63.0 2.8 2.6 2.6 2.5 2.5 2.5 2.4 2.4 2.4 2.3 2.2 2.2 2.0 2.0 2.0
1.9 1.8 1.7 1.7 1.7 1.71.7 1.6 1.6
1.41.4 1.2
−0.1
4.5
4.9
3.33.5 3.4 3.5
2.8
3.4 3.3
2.6
3.0
2.1 2.2
2.62.3
2.7
1.7
2.72.9
2.2 2.22.5
3.7
2.42.6 2.5
2.12.4
1.7 1.7
0.5
3.3
3.7
2.52.8
2.32.0
1.8 2.3
1.9 1.8
2.3
2.0
2.62.4
1.92.1
1.5
2.2
1.41.1 1.6 1.4
1.1
0.2
1.10.9 0.9
1.2 0.7 1.2 0.8
−0.5
©20
18 A
sian
Prod
uctiv
ity O
rgan
izat
ion

5
61
5.2 Per-Hour Labor Productivity
53: By definition, positive labor productivity growth occurs when output grows faster than labor input. Figures 50 and 51 therefore tend to have an inverse relationship, namely that the higher the labor input growth, the lower the labor productivity growth, other things being equal.
54: For Brunei, both measures give the same productivity growth. This is a result of a statistical construct in our current Asia QALI Database rather than the underlying trend.
slowed to 1.1% per year on av-erage in the latter period, from 2.9% in the previous period. Japan was the only economy in Asia to experience an actual fall in labor input in the period from 1990 to 2016. This served to compensate for a sluggish output growth during this pe-riod; and sustain a positive la-bor productivity growth of 1.5% per year on average.
Table 17 in Appendix 9 (p. 155) more closely examines the sub-period from 1990–2016, providing the growth rates of per-hour-based labor productivity since 1990. The growth patterns of individual countries generally follow their counterparts closely in per-worker productivity growth, as illustrated in Table 15 (p. 153). In some countries the two mea-sures diverge greatly and are not at all consistent through the periods compared.54 This contrast was particularly stark in the first half of the 1990s, when Japan’s hourly productiv-ity growth was 1.9% compared with 0.7% in per-worker pro-ductivity growth. However, the divergence narrowed to 0.3 percentage points in the period 2010–2016. Korea is another country in which hourly productivity growth was consistently higher than its per-worker counterpart. Although the divergence widened to 1.2 percentage points in 2005–2010, it narrowed to 0.2 percentage points in 2010–2016. Hours worked in the ROC have also grown at a slower rate than number of workers.
One can identify where countries are today in terms of their hourly productivity performance against a backdrop of Japan’s historical experience. Figure 52 traces the long-term path of Japan’s per-hour labor productivity for the period 1885–2016 along the green line, expressed as relative to Japan’s 2016 level (set equal to 1.0).55 A structural break is observed during World War II when output collapsed. Countries’ relative hourly productivity levels against Japan in 2016 are then mapped against Japan’s growth experience
0.1
0.0
0.2
0.3
0.4
0.5
0.6
0.7
0.8
0.9
1.0
1.2
1.3
1.1
1880 1890 1900 1910 1920 1930 1940 1950 1960 1970 1980 1990 2000 2010 2020
Labor productivity gap in 2016 relative to Japan(Japan's level in 2016=1.0)
Japan (1885−2016)
Bangladesh
Cambodia
ROC
Hong Kong
India
Indonesia
Korea
Malaysia
ThailandChina
Vietnam
Singapore
Pakistan
Philippines
Fiji
Iran
Mongolia
Nepal
Sri Lanka
BhutanLao PDRMyanmar
Figure 52 Historical Labor Productivity Trend of Japan since 1885 and Current Level of Asia_Index of GDP at constant basic prices per hour worked for Japan in 1885–2016 and for Asian countries in 2016, using 2011 PPP
Sources: For historical data of Japan, the sources of GDP are Ohkawa, Takamatsu, and Yama-moto (1974) during 1885–1954 and the JSNA by ESRI, Cabinet Office of Japan, during 1955–2016 (including author adjustments). Hours worked data is based on KEO Database, Keio University, during 1955–2016. During 1885–1954, the average hours worked per person are assumed to be constant. For the labor productivity level of Asian countries in 2016, it is based on the APO Productivity Database 2018.
©20
18 A
sian
Prod
uctiv
ity O
rgan
izat
ion
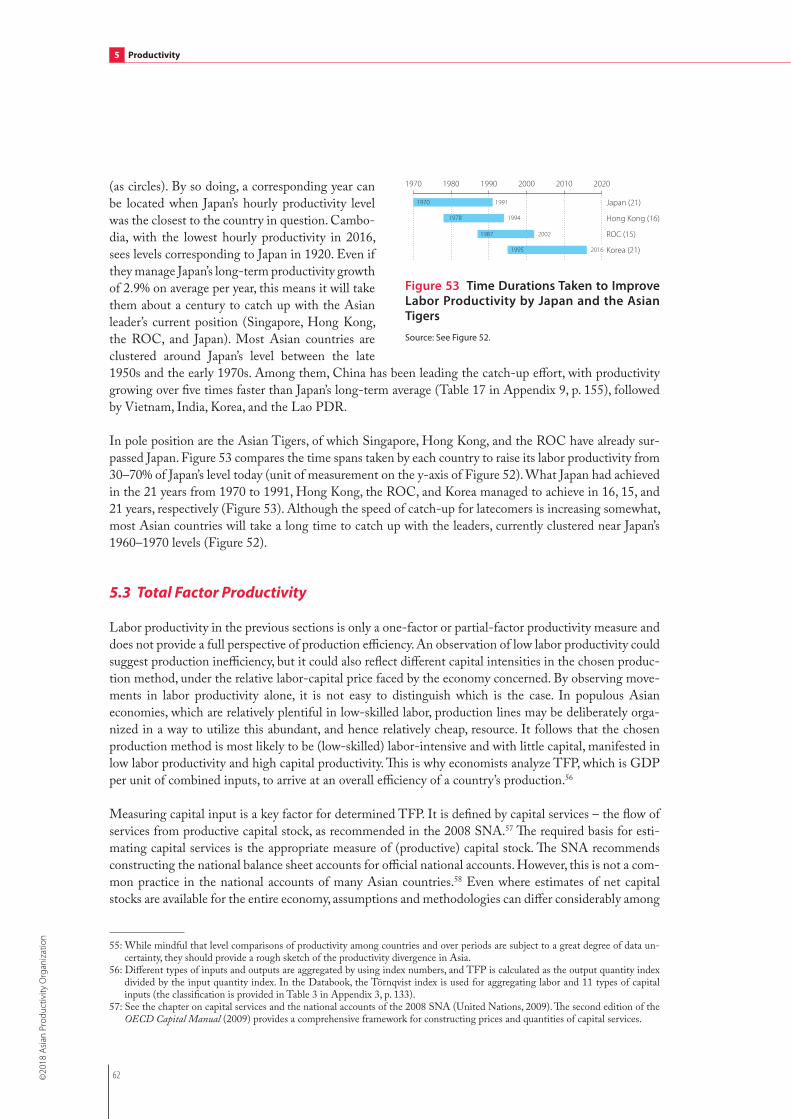
62
5 Productivity
(as circles). By so doing, a corresponding year can be located when Japan’s hourly productivity level was the closest to the country in question. Cambo-dia, with the lowest hourly productivity in 2016, sees levels corresponding to Japan in 1920. Even if they manage Japan’s long-term productivity growth of 2.9% on average per year, this means it will take them about a century to catch up with the Asian leader’s current position (Singapore, Hong Kong, the ROC, and Japan). Most Asian countries are clustered around Japan’s level between the late 1950s and the early 1970s. Among them, China has been leading the catch-up effort, with productivity growing over five times faster than Japan’s long-term average (Table 17 in Appendix 9, p. 155), followed by Vietnam, India, Korea, and the Lao PDR.
In pole position are the Asian Tigers, of which Singapore, Hong Kong, and the ROC have already sur-passed Japan. Figure 53 compares the time spans taken by each country to raise its labor productivity from 30–70% of Japan’s level today (unit of measurement on the y-axis of Figure 52). What Japan had achieved in the 21 years from 1970 to 1991, Hong Kong, the ROC, and Korea managed to achieve in 16, 15, and 21 years, respectively (Figure 53). Although the speed of catch-up for latecomers is increasing somewhat, most Asian countries will take a long time to catch up with the leaders, currently clustered near Japan’s 1960–1970 levels (Figure 52).
5.3 Total Factor Productivity
Labor productivity in the previous sections is only a one-factor or partial-factor productivity measure and does not provide a full perspective of production efficiency. An observation of low labor productivity could suggest production inefficiency, but it could also reflect different capital intensities in the chosen produc-tion method, under the relative labor-capital price faced by the economy concerned. By observing move-ments in labor productivity alone, it is not easy to distinguish which is the case. In populous Asian economies, which are relatively plentiful in low-skilled labor, production lines may be deliberately orga-nized in a way to utilize this abundant, and hence relatively cheap, resource. It follows that the chosen production method is most likely to be (low-skilled) labor-intensive and with little capital, manifested in low labor productivity and high capital productivity. This is why economists analyze TFP, which is GDP per unit of combined inputs, to arrive at an overall efficiency of a country’s production.56
Measuring capital input is a key factor for determined TFP. It is defined by capital services – the flow of services from productive capital stock, as recommended in the 2008 SNA.57 The required basis for esti-mating capital services is the appropriate measure of (productive) capital stock. The SNA recommends constructing the national balance sheet accounts for official national accounts. However, this is not a com-mon practice in the national accounts of many Asian countries.58 Even where estimates of net capital stocks are available for the entire economy, assumptions and methodologies can differ considerably among
55: While mindful that level comparisons of productivity among countries and over periods are subject to a great degree of data un-certainty, they should provide a rough sketch of the productivity divergence in Asia.
56: Different types of inputs and outputs are aggregated by using index numbers, and TFP is calculated as the output quantity index divided by the input quantity index. In the Databook, the Törnqvist index is used for aggregating labor and 11 types of capital inputs (the classification is provided in Table 3 in Appendix 3, p. 133).
57: See the chapter on capital services and the national accounts of the 2008 SNA (United Nations, 2009). The second edition of the OECD Capital Manual (2009) provides a comprehensive framework for constructing prices and quantities of capital services.
Figure 53 Time Durations Taken to Improve Labor Productivity by Japan and the Asian Tigers
Source: See Figure 52.
1970 1980 1990 2000 2010 2020
Japan (21)
Hong Kong (16)
Korea (21)
ROC (15)
1991
1994
2002
2016
1970
1978
1987
1995
©20
18 A
sian
Prod
uctiv
ity O
rgan
izat
ion

5
63
5.3 Total Factor Productivity
countries. In response to this challenge, harmonized estimates for productive capital stocks and capital services have been con-structed and compiled within the APO Produc-tivity Database, built on the same methodology and assumptions.59 In this meth-odology, changes in the quality of capital are incor-porated into the measure-ment of capital services in two ways: Changes in the composition are captured by explicitly differentiating assets into 11 types and; an appropriate and harmo-nized deflator is used for IT capital to reflect the rapid quality change embodied in IT-related assets (see Appendix 3, p. 133).
The APO Productivity Database 2018 estimates capital services and TFP for the 23 Asian economies for which long-time investment data by type of asset are available or estimated.60 Their economic growth is decomposed into sources from factor inputs and TFP, based on the methodology developed by Jorgenson and Griliches (1967). The Databook defines output as GDP at constant basic prices, and factor inputs as labor, IT capital, and non-IT capital.61 Labor input is measured by total hours worked, without adjust-ments for changes in labor quality.62
Cross-country comparisons of TFP growth for the 23 Asian countries and the US are shown in Figure 54 for the period 1970–2016, and the two sub-periods 1970–1990 and 1990–2016. In addition, the re-gional growth accounts are developed for some country groups: the Asia24, the APO20, East Asia, South Asia, CLMV, and the ASEAN6.63 The average annual growth rate of TFP during the entire observation period ranges from almost 0–2%, with the exception of China which has achieved considerably high
58: Based on our metadata survey, half of APO member economies do not estimate the balance sheet accounts within the official national accounts; these countries are Bangladesh, the ROC, Indonesia, Korea, the Lao PDR, Mongolia, Nepal, Sri Lanka, and Vietnam (but the National Wealth Survey is available in the ROC and Korea for some selected years).
59: The Department of Statistics Malaysia developed a new set of comprehensive capital stock statistics in April 2011 following the OECD Capital Manual (2009). The correlations between these official estimates (Department of Statistics Malaysia, 2017) and our estimates for the period of 1970–2016 are high; they are 89.2 % and 99.7% for the growth rates of net and productive capital stock, respectively. In the Databook, capital input is defined as capital services computed from our estimates of productive capital stock, so as to ensure that the same methodology and same asset classification are applied for the 23 Asian countries compared.
60: In measuring TFP, income generated from domestic production should be separated into labor and capital compensations. The national accounts readily provide the estimates of compensation of employees as a component of value added in many countries; compensation for the self-employed is not separately estimated but is combined with returns to capital in mixed income, except China, where labor remuneration in the national accounts includes labor income for the self-employed (Holz, 2006). The as-sumption on wages for self-employed and contributing family workers is presented in Appendix 5 (p. 137). See Appendix 8 (p. 143) for sensitivity of our assumptions to the TFP results.
61: IT capital is defined as a composite asset of IT hardware (computers and copying machines), communications equipment, and computer software.
62: The hours worked were newly estimated for Brunei in this edition of Databook. The failure to take into account improvements in labor quality leads to TFP overestimation. The harmonized estimates of labor quality changes are planned to be incorporated in the next edition of Databook (See Box 4, p. 81).
Figure 54 TFP Growth_Average annual growth rate of total factor productivity in 1970–2016, 1970–1990, and 1990–2016
Source: APO Productivity Database 2018.Note: The starting period for Cambodia is 1993 and Cambodia is not included in CLMV and ASEAN before 1993.
−4
0
2
−1
−2
−3
1
3
4%
1970−2016 1970−1990 1990−2016
China
Pakistan
India
South Asia
East Asia
ROC
Sri Lanka
Hong Kong
Asia24
Thailand
Cambodia
APO20
Mongolia
Korea
Vietnam
Lao PDR
US
Japan
Singapore
ASEAN6
Malaysia
ASEAN
Fiji
Bangladesh
Philippines
Indonesia
CLMV
Iran
Nepal
Myanm
ar
Brunei
2.91.9
1.9 1.7
1.71.6
1.5
1.41.3
1.3 1.00.9
0.9 0.90.9 0.8 0.8 0.7 0.4
0.3
0.3 0.30.3
0.2 0.1 0.1
0.0 −0.1 −0.2−2.4
−2.7
1.9
2.3
1.1 1.10.6
1.9
0.7
2.4
0.4
1.7
0.5
−0.7
0.7
1.0
0.5 0.7
0.9
0.0
0.4
0.1 0.3−0.2
0.2
−1.0
0.5
−0.1
−2.3
−1.0
−3.1
−1.7
3.8
1.6
2.52.1
2.4
1.3
2.1
0.7
2.0
1.0
1.01.3
2.1
1.1
0.8
1.00.8
0.6
0.80.3
0.40.3 0.6 0.2
1.0
−0.2
0.0
1.5
0.3
−1.8
−3.5
©20
18 A
sian
Prod
uctiv
ity O
rgan
izat
ion

64
5 Productivity
growth of TFP of around 3%. Taking the US as the reference economy, with TFP growth of 0.8% on av-erage per year, 12 Asian economies achieved higher TFP growth than the US.
Looking at the sub-periods (1970–1990 and 1990–2016), one can discern that the two were not identical and, in fact, had quite sig-nificant differences in terms of the magnitude of growth and countries’ rela-tive performance. Eleven of the 23 Asian countries ex-perienced acceleration in TFP growth. In particular Iran, Mongolia, and the Philippines achieved con-siderable recoveries from negative TFP growths: from –2.3% to 1.5%, from –0.7% to 2.1%, and from –1.0% to 1.0%, respective-ly.64 In China and India TFP growth improved to double, from 1.9% on aver-age per year in the earlier period to 3.8% since 1990 and from 1.1% to 2.5%, respectively. The six coun-tries that saw their TFP growth decline by more than 0.5 percentage points are Brunei, Hong Kong, In-donesia, ROC, Pakistan, and Thailand.
63: In this edition of Databook, the country aggregations of capital and labor inputs are newly based on the estimates of PPP for capital and labor inputs, respectively, which are developed in Nomura (2018). He indicates that the PPP for output underesti-mates the PPP for capital input, indicating the capital prices are higher than the output prices, in most Asian countries and over-estimates the PPP for labor inputs, indicating the labor prices are lower than the output prices, in all Asian countries. Note that, in Sections 5.3 and 5.4, Bhutan is not included in the country groups: the Asia24 and South Asia.
64: In Iran and Mongolia, subsoil assets may have a significant impact on the TFP growth. Note that they are omitted in our mea-sures of capital inputs.
Figure 55 Sources of Economic Growth in the Long Run_Average annual growth rate of constant-price GDP and contributions of labor, capital, and TFP in 1970–2016
Source: APO Productivity Database 2018.Note: The starting period for Cambodia is 1993 and Cambodia is not included in CLMV and ASEAN before 1993.
10%
−4
−2
0
2
4
6
8Labor
Non-IT Capital IT CapitalTFPOutput
ChinaCam
bodiaSingaporeKoreaRO
CM
alaysiaLao PD
RIndonesiaVietnamEast AsiaASEAN
6ASEANAsia24ThailandH
ong KongIndiaCLM
VSouth AsiaPakistanM
ongoliaSri LankaAPO
20M
yanmar
PhilippinesBangladeshN
epalIranU
SFijiJapanBrunei
1.0 1.2 1.70.7 0.9 1.1 0.7 1.0 0.9 0.9 1.0 1.0 0.9 0.8 0.9 1.2 0.8 1.1 1.1 0.6 0.7 0.8 0.7 1.1 1.0 1.3
0.6 0.7 0.9
0.0
0.8
0.2 0.20.6
0.4 0.40.3
0.2 0.2 0.2 0.3 0.3 0.3 0.2 0.3 0.40.1 0.2 0.1 0.1
0.2 0.1 0.2 0.20.3 0.1
0.10.1 0.4
0.1
0.3
0.8
4.45.1
4.0
4.73.7
4.6
4.14.5
3.72.8
3.9 3.93.0 3.0 2.7 2.2
4.2
2.3 2.1 3.42.5 2.5
5.8
2.7 2.9 2.83.0
0.9 1.41.5
3.2
2.9 1.0
0.4 0.91.6 0.3
0.8 0.1 0.91.7 0.3 0.3 1.3 1.3 1.4 1.9
−0.0
1.7 1.90.9
1.5 0.9
−2.4
0.1 0.2
−0.2 −0.1
0.8 0.3 0.7
−2.7
8.5
7.46.7 6.7 6.5 6.3
5.9 5.8 5.7 5.6 5.5 5.5 5.4 5.4 5.4 5.4 5.2 5.2 5.2 5.14.8
4.4 4.3 4.2 4.2 4.03.6
2.7 2.7 2.52.0
Figure 56 Contribution Shares of Economic Growth in the Long Run_Average contribution shares of labor, capital, and TFP in 1970–2016
Source: APO Productivity Database 2018.Note: The starting period for Cambodia is 1993 and Cambodia is not included in CLMV and ASEAN before 1993.
120%
−20
0
100
20
40
60
80
LaborNon-IT Capital IT CapitalTFP
ChinaCam
bodiaSingaporeKoreaRO
CM
alaysiaLao PD
RIndonesiaVietnamEast AsiaASEAN
6ASEANAsia24ThailandH
ong KongIndiaCLM
VSouth AsiaPakistanM
ongoliaSri LankaAPO
20M
yanmar
PhilippinesBangladeshN
epalIranU
SFijiJapanBrunei
12 1625
10 13 17 12 17 17 15 18 18 17 15 16 22 16 22 2212 14 18 16
26 2333
1725
35
−2
413
2
10
6 65
4
3 35 5 5 4 6 8
23
2 1
42 5 5
6 3
2
3
154
12
37
51
69
59
7056
73
71
7965
50
71 72
54 55 5041
81
44 4167
53
55
13465
69
71
8333
51
60
156
34
13 614
24
514
1
1629
6 5
25 25 2735
−0
32 36
1831
21
−55
34
−6 −4
28
10
29
−134
©20
18 A
sian
Prod
uctiv
ity O
rgan
izat
ion

5
65
5.3 Total Factor Productivity
65: Compared to preceding studies on measuring TFP in Korea, it should be noted that economic growth in Korea has been revised upward considerably in the Korean System of National Accounts (KSNA) published in 2010. The main revisions stem from the introduction of a chain index in KSNA. As a result, Korea’s GDP growth at constant market prices has been revised up from 7.0% to 8.6% on average in the 1970s, from 8.4% to 9.3% in the 1980s, and from 5.9% to 6.3% in the 1990s. In addition, by the KSNA revision based on the 2008 SNA, these are further revised to 8.8%, 9.4%, and 6.7%, respectively.
66: In the same period 1960–1973, the average annual contribution rate of labor quality improvement to growth is measured as 0.54% in Jorgenson and Nomura (2005). As a measure of the TFP contribution that is comparable with the estimates in this Databook, their estimate can be recognized as 3.6% per year during the same period.
67: Negative TFP growth for these countries is also observed in other studies. Baier, Dwyer, and Tamura (2006) estimate the average annual growth rate of TFP of Fiji at –0.75% during 1960–2000. Cororaton (2002) shows that the average annual TFP growth of the Philippines was –1.09% during 1970–2000.
In terms of its contribution to economic growth, TFP has played a significant role in some fast-growing Asian economies over the past decades. Figures 55 and 56 present the sources of economic growth and those contribution shares, respectively, for the entire observation period 1970–2016. Countries are ar-ranged according to their long-run economic growth. In this period, China achieved the fastest output growth of 8.5% on average per year. This is followed by Cambodia, Singapore, Korea, the ROC, and Ma-laysia, growing at over 6% on average per year. From these GDP growth rates, the TFP contribution ac-counted for over 25% of economic growth in six of the 23 Asian economies compared. Among them, TFP contribution was the largest in Pakistan (36%), India (35%), China (34%), and Sri Lanka (31%), all with over 30%, followed by Japan (29%), Hong Kong (27%), and Thailand (25%). In contrast, TFP perfor-mance was very modest in Singapore, resulting in its relatively small contribution (only 6%) to economic growth over the same period (0.4% on average per year as the TFP growth rate). In Korea the TFP con-tribution in GDP growth was 14% (0.9% on average per year), which was surpassed by the Asia24 at 25% (1.3% on average per year).65
China’s productivity performance was outstanding. The average TFP growth was 2.9% per year in 1970–2016 and 3.8% in 1990–2016 (Figure 54). This compares with the long-run estimates of 3.8% during 1978–2005 in Holz (2006) and also 3.8% during 1978–2004 in Bosworth and Collins (2008). The Chinese experience of long-term TFP growth of about 3.0% is not unprecedented in Asia. According to Jorgenson and Nomura (2005), Japan achieved an annual TFP growth of 3.1% during 1960–1973, even after im-provements in labor quality had been taken into account in the estimation of labor growth (and, as such, eliminating overestimation in TFP).66
Looking at the breakdown of the period in Figure 57, one can see Iran, Myanmar, and Nepal in the 1970s and the Philippines in the 1980s were running an overall negative TFP.67 Negative TFP growth can be caused by many things, including a rapid, temporary decline in demand or the inefficient use of resources by political interventions to the economy. This is unlikely to be sustainable in the long run. As shown in the year-over-year changes of growth decomposition in each country (Figure 64), the Philippine’s TFP fell severely in the early 1980s, in which the economy declined by 15.6% for two years, from 1983–1985, under the regime of Ferdinand Marcos. In Mongolia, negative TFP growths are observed before the transition to a market economy in 1992 in Figure 64, as shown in the center chart of Figure 57. Brunei has experienced negative TFP growth constantly since the beginning of the 1980s. Brunei’s industry structure is highly skewed to the mining sector, which contributes to 42% of GDP in 2016 and is higher than those in GCC countries, as shown in Figure 76 in Section 6.1 (p. 88). The negative TFP growth for more than three decades may be a reflection of the peak of oil production in 1979, which since then has been intentionally reduced in order to extend the life of oil reserves.
It is obvious in the long run that economic growth was predominantly explained by the contribution of capital input in all Asian countries with positive TFP growth, which ranged from 42% in Pakistan to 82% in Indonesia, as illustrated in Figure 56. Among the Asian Tigers, the contribution of capital services ranged from 57% in Hong Kong to 76% in Korea, whereas in China and India, it accounted for 54% and
©20
18 A
sian
Prod
uctiv
ity O
rgan
izat
ion

66
5 Productivity
43% of economic growth, respectively. This compares with 48% in the US, of which 15 percentage points were contributed by IT capital, a share unmatched by the Asian countries. Japan and Singapore have been leading Asian countries in terms of contribution from IT capital (12% and 10% of economic growth, re-spectively) whereas in other Asian countries it has been 1–8%, with China and India trailing behind.
One prevalent characteristic of the Asian countries is their investment intensity as a share of GDP (Fig-ure 35 in Section 4.1, p. 43), and in turn its contribution to economic growth (Figures 56 and 58). There is policy significance in identifying the drivers behind the rapid economic growth in the Asian countries. If growth has been driven by capital accumulation more than assimilation of existing technologies from the advanced economies, the Asian model may prove to be too expensive for many less well-off countries to emulate. According to our findings (Figures 57 and 58), it is true that, historically, capital accumulation has played a much more significant role in the Asian countries than in the US. However, the relative
Figure 57 Sources of Economic Growth in Sub-periods_Average annual growth rate of constant-price GDP and contributions of labor, capital, and TFP in 1970–1980, 1980–1990, 1990–2000, and 2000–2016
Source: APO Productivity Database 2018. Note: The starting period for Cambodia is 1993 and Cambodia is not included in CLMV and ASEAN before 1993.
LaborNon-IT Capital IT CapitalTFP Output
−3
0
3
6
9
ROC
BruneiSingaporeH
ong KongKoreaIndonesiaM
alaysiaASEAN
6ASEANThailandChinaM
ongoliaPhilippinesEast AsiaAsia24APO
20PakistanFijiJapanSri LankaM
yanmar
Lao PDR
CLMV
IranU
SSouth AsiaN
epalIndiaVietnamBangladesh
%
1970−1980
−3
0
3
6
9%
1980−1990
KoreaChinaRO
CThailandSingaporePakistanH
ong KongEast AsiaIndonesiaM
alaysiaLao PD
RAsia24ASEAN
6South AsiaASEANIndiaVietnamAPO
20M
ongoliaJapanN
epalSri LankaBangladeshCLM
VU
SIranFijiPhilippinesM
yanmar
Brunei
−3
0
3
6
9%
1990−2000
−3
0
3
6
9%
2000−2016
ChinaCam
bodiaLao PD
RM
ongoliaIndiaVietnamCLM
VSouth AsiaEast AsiaAsia24BangladeshM
yanmar
Sri LankaIndonesiaPhilippinesM
alaysiaASEANSingaporeASEAN
6APO
20PakistanIranThailandKoreaN
epalH
ong KongRO
CFijiU
SJapanBrunei
ChinaVietnamCam
bodiaM
alaysiaSingaporeCLM
VKoreaRO
CLao PD
RM
yanmar
IndiaSouth AsiaPakistanSri LankaEast AsiaBangladeshAsia24N
epalASEANASEAN
6ThailandIndonesiaIranH
ong KongAPO
20U
SPhilippinesFijiBruneiJapanM
ongolia
1.71.0
2.4 2.00.8 1.2 1.2 1.5 1.4 2.0
1.40.7
1.7 1.3 1.3 1.1 1.1 1.6
0.10.8 0.7 0.4
1.2 0.9 1.0 1.5 1.7 1.7 1.70.7
0.50.9
0.5 0.3
0.40.1 0.1
0.2 0.20.2
0.00.1
0.2 0.3 0.2 0.2 0.00.1
0.4
0.1 0.10.0
0.00.1
0.2 0.0 0.1 0.0 0.0 0.0
6.5
0.9
6.3
3.6
8.1
5.05.7 4.5 4.3 3.3
4.1 5.44.1 4.3 4.0 4.0
2.2
3.14.1 3.0
4.7
3.2 1.8
6.7
1.31.6 3.5 1.4 0.9 0.5
1.3
6.1
−0.5
2.7
−0.9
1.7 1.01.1
1.01.0
0.5
−0.3−0.1−0.6−0.6
−0.5
1.4
−0.10.0
0.3
−1.4−0.1
0.3
−4.4
0.5
−0.1−2.3
−0.2
0.1
−0.4
9.9
8.8 8.78.6 8.5
8.0 8.07.3
6.96.5
6.0 6.0 5.8 5.34.9 4.8
4.7 4.7 4.64.1 4.1
3.5 3.3 3.3 3.1 3.0 3.0 3.0 2.7
0.8
1.4 1.6 1.1 1.4 1.7 1.50.5
1.5 1.2 1.3 0.9 1.4 1.2 1.3 1.2 1.4 1.0 1.1 1.20.4 0.8 0.8 1.1 0.9 0.9 0.8 1.1 1.2 0.6 1.0
0.50.1
0.40.3 0.7
0.0
0.4
0.30.2 0.1 0.1
0.3 0.3 0.0 0.2 0.0 0.1 0.3 0.1
0.40.1 0.0 0.1 0.1 0.5 0.1 0.1 0.2 0.1
0.6
5.2
3.9 3.9 3.5
4.5
2.8 3.52.5
5.4 5.3
3.7 2.6
4.4
1.7
4.4
1.5 2.12.4
5.0
1.93.3
2.1 2.23.1
1.0 1.8 1.3
2.55.3
5.2
2.2
3.32.6 2.4
0.5
3.12.0
1.8
−0.7−0.7
1.11.5
−0.4
2.4
−0.4
2.5 2.0 1.4
−1.1
1.8 0.31.1 0.7
−0.4
0.9
−0.1−0.3−1.9
−4.8
9.38.9
7.97.6 7.4 7.4
6.56.1 6.1 6.0 5.8 5.7 5.6 5.5 5.4 5.4 5.3 5.2 5.2
4.6 4.54.2 4.0 3.7
3.32.6 2.2
2.01.3
−2.8
1.0 0.8 1.2 1.1 1.60.8 0.5 0.6 1.1 0.9 1.1 1.1 1.1 1.2 0.8
1.40.8 1.4
0.8 0.7 0.3 0.7 0.6 1.0 0.7 0.7 0.7 0.9 1.0
−0.4 0.0
0.2 0.20.1 0.4
0.8
0.20.5 0.5
0.2 0.2 0.1 0.1 0.10.1
0.3 0.2 0.20.1
0.30.4 0.5
0.2 0.10.6 0.3 0.6 0.3 0.1 0.9
0.30.1
3.95.3
2.8
6.13.8
5.0 4.63.7
5.34.7
1.9 2.0 2.7
0.72.2
3.4
2.52.7
4.7 4.7 4.8 4.9
0.6
3.1
2.30.8
2.71.4
5.0
1.20.6
4.91.5
3.2
−0.6
0.7 0.9 1.11.7
−0.5−0.3
2.2 2.0 1.4
3.21.9
0.1 1.5 0.7
−1.0−1.1−1.2
−1.7
2.6
−0.9
0.51.3
−0.3−0.1
−4.7
0.10.2
9.9
7.77.3 7.1
6.9 6.9 6.7 6.5 6.0
5.5 5.3 5.3 5.2 5.1 5.1 5.1 5.0 4.8 4.8 4.6 4.44.1 3.9 3.9 3.8
3.4 3.4
2.4 2.21.3
0.9
0.41.2
0.5 0.6 0.7 0.5 0.6 0.80.3
0.5 0.8 0.60.1
0.8 0.9 0.9 0.71.4
0.7 0.6 1.0
0.3−0.10.3
1.3
0.30.4 0.5
0.3−0.2
0.50.5
0.2
0.40.3 0.2 0.3 0.3 0.2
0.2 0.2 0.2 0.30.2
0.2 0.4 0.6 0.30.6
0.30.2
0.10.2 0.3 0.3
0.1
0.40.2 0.1 0.4 0.2
0.7
5.1
6.0
4.3
2.9 3.3
5.56.0
3.32.6 2.8
4.5
7.4
3.63.5
2.12.5 2.9
2.22.7
1.61.3 2.8
1.22.2
2.2
1.2 1.70.4 0.7
−0.1
2.2
3.10.0
2.0
3.4 2.60.3
−0.5
2.2
2.8 2.40.3
−2.7
1.4 0.71.8 1.1 1.2 0.8 1.2
1.8 1.80.8
2.41.1 0.1
1.7 1.1
1.00.5
1.0
−2.8
9.0
7.4 7.2 7.1 6.8 6.6 6.4 6.46.0 5.8 5.7 5.6 5.3 5.2 5.1 5.0 5.0 5.0 4.9
4.2 4.2 4.1 3.9 3.9 3.7 3.5 3.4
2.0 1.8
0.80.7
−9.5
©20
18 A
sian
Prod
uctiv
ity O
rgan
izat
ion

5
67
5.3 Total Factor Productivity
contribution shares are not constant across countries and over periods. There have been periods when (and in some countries where) assimilation as reflected in TFP growth also contributed significantly to driving growth.
As shown in Figure 58, capital accumulation was the dominant factor in the 1970s, typically explaining two-thirds to three-quarters of economic growth achieved. In Brunei, Pakistan, and Hong Kong, how-ever, the contribution of TFP growth was still significant, accounting for more than 25% of their respec-tive economic growth. In the subsequent periods, the contribution of capital input became progressively smaller, falling to a share of below 52% on average in 2000–2016 from 86% in 1970–1980 in the whole Asia (Asia24). Meanwhile the contribution of TFP became progressively more significant, rising to a share of above 40% from –12%. In 2000–2016, TFP growth became the dominant driver even in the middle-growth countries with 3–5% of annual economic growth. Reflecting on these results, capital ac-cumulation appears to be a necessary step to economic growth, especially in the early period of development. Although a prerequisite, capital accumulation does not guarantee TFP growth. Some countries may be more capable than others of reaping the benefits through assimilation of technologies.
Figure 58 Contribution Shares of Economic Growth in Sub-periods_Average contribution shares of labor, capital, and TFP in 1970–1980, 1980–1990, 1990–2000, and 2000–2016
Source: APO Productivity Database 2018. Note: The starting period for Cambodia is 1993 and Cambodia is not included in CLMV and ASEAN before 1993.
LaborNon-IT Capital IT CapitalTFP
−20
0
40
20
80
60
100
120%
−20
0
40
20
80
60
100
120%
−20
0
40
20
80
60
100
120%
−20
0
40
20
80
60
100
120%
1970−1980 1980−1990
1990−2000 2000−2016
ROC
BruneiSingaporeH
ong KongKoreaIndonesiaM
alaysiaASEAN
6ASEANThailandChinaM
ongoliaPhilippinesEast AsiaAsia24APO
20PakistanFijiJapanSri LankaM
yanmar
Lao PDR
CLMV
IranU
SSouth AsiaN
epalIndiaVietnamBangladesh
KoreaChinaRO
CThailandSingaporePakistanH
ong KongEast AsiaIndonesiaM
alaysiaLao PD
RAsia24ASEAN
6South AsiaASEANIndiaVietnamAPO
20M
ongoliaJapanN
epalSri LankaBangladeshCLM
VU
SIranFijiPhilippinesM
yanmar
ChinaVietnamCam
bodiaM
alaysiaSingaporeCLM
VKoreaRO
CLao PD
RM
yanmar
IndiaSouth AsiaPakistanSri LankaEast AsiaBangladeshAsia24N
epalASEANASEAN
6ThailandIndonesiaIranH
ong KongAPO
20U
SPhilippinesFijiBruneiJapanM
ongolia
ChinaCam
bodiaLao PD
RM
ongoliaIndiaVietnamCLM
VSouth AsiaEast AsiaAsia24BangladeshM
yanmar
Sri LankaIndonesiaPhilippinesM
alaysiaASEANSingaporeASEAN
6APO
20PakistanIranThailandKoreaN
epalH
ong KongRO
CFijiU
SJapanBrunei
17 1228 23
10 15 15 20 2131
2312
29 24 26 23 2334
320 17 11
3727 33
51 57 5865
86
5 10
6 3
41 1
2 2
2
1
2
36 4 5 0
2
9
1 21
1
28
1
3 11
4
66
10
73
42
96
6272 62 63
52 69 9270
81 8283
48
66
90 71
115
91
53
204
42
53
116
48 33
56
13
69
−6
32
−10
2112 16 14 15
8
−5 −2 −11 −12 −11
29
−2 −1
7
−35
−3
8
−133
17
−5
−76
−7
2
−45
10 10 16 1623
12 7 918 16 21 21 21 23
1528
1629
16 157
17 1526
18 22 21
39 44
−30
5
2 22 6
11
38 8
34
2 2 1 2
5
3
4
1
7 811
6 2
16
7
178
4
39
27 12
40
68
39
86 55
72 6957
88 86
36 3952
13
43
68
5055
98 102109 228118
15
81
6022
7961
95
64
49
20
44
−8
10 13 1626
−9 −6
41 3826
62
37
1
2915
−21−25−26−41
67
−23
14
38
−8 −3
−210
19
416
7 8 11 8 9 126 8 13 11
2
15 17 17 1327
14 1325
8
−17
36
9 1124
14
−29
81
5
3
6 43
4 53
4 4
35
4
47 11
6
12
7 4
2
49
7
3
10 7
6 20
20
109
56
81
59
4048
8394
51
4348
78
132
68
6741
50 58
44
55
3930
68
31
57
59
3550 19
38
34
0
28
4738
5
−7
3447
40
5
−48
2613
3422 23 16
24
44 42
20
62
29
2
47
32
51
28
126
−411
15 18 14 18 23 208
24 20 21 1624 22 24 22 25 20 21 22
918 20
27 24 28 32
5062
456
15
4
101
7
6 3 21
4 5 1 51
2 53
92 1
2 314 2
4
9
115644 49 46
61
37 5440
89 89
64 46
79
32
81
28
4046
96
42
74
52
54
84
31
71
57
124423
2437 33 32
6
4231 30
−12 −12
19 26
−7
44
−8
46 3828
−20
39
7
2717
−12
26
−5 −12
−95−378
©20
18 A
sian
Prod
uctiv
ity O
rgan
izat
ion

68
5 Productivity
Figure 59 places our estimates among those of OECD (2018a) for 17 other OECD countries to give readers a wider perspective.68 Countries are arranged according to their average economic growth per an-num for the period 2000–2016, in descending order. In so doing, the wedge in economic growth is clearly displayed, with all Asian countries (barring Fiji, Japan, and Brunei) filtered out to occupy the top end. Asian countries are also among those that experienced the fastest TFP growth in 2000–2016: 3.4% in Mongolia, 3.1% in China, 2.6% in India, 2.4% in Thailand,69 2.0% in the Lao PDR, and 1.8% in the Philippines and Pakistan.
Though growing at a more subdued pace, the contribution made by TFP in the slower-growing, mature economies should not be underestimated. Figure 60 plots per capita GDP levels in 2016 and the TFP contribution shares in the period 2000–2016, for the 23 Asian countries (as dots) with comparison of OECD countries (as white circles). There are no significant differences in the roles of TFP contribution to economic growth between the mature OECD economies and the middle-income Asian countries.
68: The multi-factor productivity in the OECD Productivity Database (OECD, 2018a), referred to as TFP in this report, defines total input as the weighted average of the growth rates of total hours worked and capital services. Comparing OECD’s TFP estimates for the whole economy with ours, there are mainly two differences in assumptions. Firstly, capital services of residential buildings are included in our estimates of capital input in order to be consistent with output that includes the imputed cost of owner-occupied housing. Secondly, the compensation of capital is defined in our estimates as the residual of the value added and the compensation of labor (compensations for employees, self-employed persons, and contributing family workers), whereas the OECD defines it as the imputed value of capital services based on the assumptions of an ex-ante rate of returns on capital. Thus, although both apply the same Törnqvist index, the weights to aggregate labor and capital can differ. Other than these, our meth-odology and assumptions in measuring capital services are designed to be largely consistent with the OECD methodology, and the impact of the differences in assumptions on the volume estimates of capital services is judged to be limited.
69: Warr (2006) shows that the average annual TFP growth of Thailand was 2.0% in the period of economic boom (1986–1996), –9.0% during the Asian financial crisis (1996–1998), and 1.6% in the period of recovery (1998–2002). These compare with our estimates of 2.0%, –10.0%, and 3.7%, respectively. The contribution rates of TFP and labor quality (to economic growth) in Vu (2013) are estimated as 0.7% and 0.3%, respectively, on average per year during 1990–2010. The sum of both (1.0%) is compa-rable with our estimate of TFP growth of 0.8% in 1990–2010.
Figure 59 Comparison of Sources of Economic Growth with OECD Countries_Average annual growth rate of constant-price GDP and contributions of labor, capital, and TFP in 2000–2016
Sources: APO Productivity Database 2018 for APO member economies and China and the US. OECD Stat (Dataset: Multi-Factor Productivity) and OECD (2018a) for OECD countries (except Japan and Korea). Note: The ending year for Ireland is 2014 and the ending year for Portugal, Spain, and Sweden are 2015.
0.41.2
0.5 0.6 0.7 0.5 0.6 0.8
0.30.5 0.8 0.6
0.1
0.8 0.9 0.9 0.71.4
0.7 0.61.0
0.3 −0.1 0.3
1.3
0.30.4
0.2
1.1 1.30.4 0.5 0.8
0.3
0.7 0.6 0.4 0.40.2 0.3 0.1 0.1 0.2 0.0
−0.2
0.5
0.0
5.6
6.2
4.7
3.23.5
5.86.3
3.5
2.8 3.0
4.7
7.7
3.8
3.72.5
3.1 3.22.8
3.0
1.81.4 3.0
1.6
2.5
2.3
1.61.9
1.7
1.3 1.2
0.9 0.50.8
1.00.7 0.5 1.0 0.9
0.7 0.60.4 0.4 0.6 0.7
0.0
2.9
0.4
3.1
0.0
2.0
3.4 2.60.3
−0.5
2.2
2.8 2.40.3
−2.7
1.4 0.71.8
1.1 1.2 0.8 1.2
1.8 1.80.8
2.41.1
0.1
1.7 1.11.2 0.5
0.4
0.8 1.0
0.4
0.5
0.4
0.6
−0.1
0.1
0.5
0.3
0.7 0.6
0.3 0.2
1.0
−2.8−0.4
9.0
7.4 7.2 7.1 6.8 6.6 6.46.4
6.0 5.8 5.7 5.6 5.3 5.2 5.1 5.0 5.0 5.0 4.9
4.2 4.2 4.1 3.9 3.9 3.73.5 3.4
3.1 2.92.8
2.1 2.01.9
1.81.7
1.71.4
1.41.4
1.21.2 1.2
1.11.0
0.8 0.7 0.1
0
−2
−4
6
8
4
2
10%
ChinaCam
bodiaLao PD
RM
ongoliaIndiaVietnamCLM
VSouth AsiaEast AsiaAsia24BangladeshM
yanmar
Sri LankaIndonesiaPhilippinesM
alaysiaASEANSingaporeASEAN
6APO
20PakistanIranThailandKoreaN
epalH
ong KongRO
CIrelandAustraliaN
ew Zealand
Sweden
FijiCanadaU
SSw
itzerlandU
KSpainBelgiumAustriaN
etherlandsG
ermany
FinlandFranceD
enmark
JapanBruneiItaly
TFP Capital Labor Output
©20
18 A
sian
Prod
uctiv
ity O
rgan
izat
ion

5
69
5.3 Total Factor Productivity
TFP accounted for more than one-third of economic growth in Japan, Germany, Finland, Austria, Swe-den, and the UK in this period.
Figure 61 shows the growth ac-counting decomposition for indi-vidual countries in five-year intervals covering the period 1970–2016.70 Over time, the relative importance of drivers behind economic growth changes. It is common in most countries that a large part of the vibrant growth in the initial period is driven by input growth. TFP growth becomes more prominent and makes a steady contribution in the later periods. Hong Kong’s TFP growth peaked at 4.8% in 1975–1980, and was robust at 3.8% in 1985–1990, when TFP growth also peaked in the ROC,71 Korea, Singapore, and Japan, at 4.1%, 2.3%, 2.2%, and 2.0%, re-spectively. Thereafter, TFP growth slowed until the second half of the 2000s when countries experienced productivity growth resurgence. TFP growth in Mongolia has been particularly strong since 1995. It also has bounced back in Indonesia72 and Thailand73 from a negative standing, following the Asian financial crisis of the late 1990s.
Looking at the decomposition of economic growth in China and India, the two key drivers have been non-IT capital input growth and TFP growth. While the contribution from non-IT capital has been relatively stable in terms of percentage points, it is TFP performance that has had more bearing in deter-mining the overall economic growth over time. For example, the low economic growth that China expe-rienced in 1985–1990 was explained largely by the moderate TFP growth. Similarly, when output growth slowed from its peak in the latter half of the 1990s, it was due to the slowdown in TFP growth from 7.1% on average per annum to 2.6%. In the recent period 2010–2016, the slowdown in Chinese economic growth was mainly explained by the lower TFP growth (2.0%). In India, TFP growth was a drag in the 1970s. Since then, it has accelerated and has increasingly accounted for a greater proportion of economic
70: The numbers in Figure 61 are provided in Table 18 in Appendix 9 (p. 156).71: The National Statistics, Republic of China, published the TFP estimates for the period 1982–1999, although it is not updated
(http://eng.stat.gov.tw/). The correlation of TFP growth rates between their estimates and ours is 0.81 for this period. For 1985–1999, our estimate is 2.6%, compared to their estimate of 3.6%.
72: Van der Eng (2008) provides estimates of capital stock for Indonesia and Van der Eng (2009) shows that annual average TFP growth increased from –4.4% during 1995–2000 to 1.7% during 2000–2007 in Indonesia. Warr (2006) also finds that TFP growth increased from –8.4% during 1996–1998 to 1.5% during 1998–2002.
73: Bosworth (2005) shows that annual average TFP growth increased from –4.6% during 1996–1999 to 2.1% during 1999–2004 in Thailand. Warr (2006) also finds that TFP growth increased from –9.0% during 1996–1998 to 1.6% during 1998–2002.
Figure 60 Comparison of TFP Contribution Shares with OECD Countries_Average contribution share of TFP in economic growth in 2000–2016
Sources: APO Productivity Database 2018 for APO member economies and China and the US. OECD Stat (Dataset: Multi-Factor Productivity) and OECD (2018a) for OECD countries (except Japan and Korea). Note: The ending year for Ireland is 2014 and the ending year for Spain and Sweden are 2015.
0 10Per capita GDP, 2016
−10
0
10
20
30
40
50
60
70
80
130
120
110
100
90
% TFP contribution share, 2000–2016
20 30 40 50 60 70 80 90
Thousands of US dollars (as of 2016)
ROC
Hong Kong
Japan
Malaysia
New ZealandDenmark
Australia
Belgium
NetherlandsCanada
FranceSweden
US
UK Austria
Finland
Singapore
Germany
Korea
Ireland
Switzerland
Spain
Bangladesh
Nepal
Vietnam
Iran
Cambodia
Indonesia
Sri LankaLao PDR
Pakistan
PhilippinesIndiaChina
Fiji
Thailand
Mongolia
©20
18 A
sian
Prod
uctiv
ity O
rgan
izat
ion

70
5 Productivity
Iran
Brunei
%
–1
0
1
2
3
4
5
6
%
–3
0
3
6
9
12Fiji
Lao PDR
China%
0
4
6
2
8
10
12
India
%
–2
0
2
4
8
6
10
Indonesia
Bangladesh
ROC %
–4
–2
0
4
2
6
%
–12
–9
–6
–3
0
6
9
3
12
%
–4
–2
0
2
4
6
8
Japan
Cambodia
Hong Kong %
–2
0
2
4
6
8
%
–3
0
3
9
6
12
1970–1975
1975–1980
1980–1985
1985–1990
1990–1995
1995–2000
2000–2005
2010–2016
2005–2010
%
–12
–9
–6
–3
0
3
6
9
12
1970–1975
1975–1980
1980–1985
1985–1990
1990–1995
1995–2000
2000–2005
2010–2016
2005–2010
2000–2005
2010–2016
2005–2010
2000–2005
2010–2016
2005–2010
1970–1975
1975–1980
1980–1985
1985–1990
1990–1995
1995–2000
1970–1975
1975–1980
1980–1985
1985–1990
1990–1995
1995–2000
1970–1975
1975–1980
1980–1985
1985–1990
1990–1995
1995–2000
2000–2005
2010–2016
2005–2010
1970–1975
1975–1980
1980–1985
1985–1990
1990–1995
1995–2000
2000–2005
2010–2016
2005–2010
2000–2005
2010–2016
2005–2010
2000–2005
2010–2016
2005–2010
1970–1975
1975–1980
1980–1985
1985–1990
1990–1995
1995–2000
1970–1975
1975–1980
1980–1985
1985–1990
1990–1995
1995–2000
1970–1975
1975–1980
1980–1985
1985–1990
1990–1995
1995–2000
2000–2005
2010–2016
2005–2010
1970–1975
1975–1980
1980–1985
1985–1990
1990–1995
1995–2000
2000–2005
2010–2016
2005–2010
2000–2005
2010–2016
2005–2010
2000–2005
2010–2016
2005–2010
1970–1975
1975–1980
1980–1985
1985–1990
1990–1995
1995–2000
1970–1975
1975–1980
1980–1985
1985–1990
1990–1995
1995–2000
1970–1975
1975–1980
1980–1985
1985–1990
1990–1995
1995–2000
2000–2005
2010–2016
2005–2010
1970–1975
1975–1980
1980–1985
1985–1990
1990–1995
1995–2000
2000–2005
2010–2016
2005–2010
2000–2005
2010–2016
2005–2010
1970–1975
1975–1980
1980–1985
1985–1990
1990–1995
1995–2000
MongoliaMalaysia%
–4
–2
0
4
6
8
2
10%
–4
–2
0
4
6
8
2
10Myanmar
Non-IT capital Output IT capital Labor TFP
Korea
2000–2005
2010–2016
2005–2010
1970–1975
1975–1980
1980–1985
1985–1990
1990–1995
1995–2000
%
–4
–2
0
2
4
8
6
10
%
–6
–3
0
6
9
3
%
–2
0
4
6
2
8
10
12
%
–6
–3
0
6
9
3
0.1 0.1 0.1 0.2 0.2 0.2 0.20.2
0.71.6 2.7 3.0
3.9 4.3 4.6 4.6
0.2 1.21.5
0.71.8
1.0 0.91.0 0.5
–2.5–2.5
1.71.70.5
0.90.1
0.1
–0.4
0.11.0
–2.0
3.7 3.74.4
5.05.1 5.0
5.9 6.3
1.7 1.1 1.0 0.70.4 0.5
1.21.10.6
6.04.3
6.53.6
1.71.71.7 2.9
1.20.8
0.7
1.2
0.8
1.10.8 0.6 0.35.6 6.5
–11.5
–7.4–5.2 –4.1 –0.8 –2.2
–4.9
7.99.7
–3.7–1.8
3.11.3 2.12.1
0.70.7
–0.5
0.1 0.1 0.2 0.2 0.21.4
3.45.2
7.25.7
0.7
1.3
1.5
1.2
0.95.4
2.3
1.9
–2.2
0.2
7.6 7.28.8
6.5
7.0
0.1 0.1 0.2 0.7 0.6 0.3
4.2 4.1 3.44.4 3.6 4.2
4.55.9
4.9
1.4 1.4 1.91.3
0.71.2
0.9
0.1
0.20.1 0.8
4.8
1.8
7.1
2.63.2
4.2
2.05.76.3
10.1
7.6
11.6
8.3
9.3
10.7
7.4
0.5 0.4 0.4 0.3 0.3 0.7 0.6 0.1 0.1
7.35.7
4.3 3.5 3.9 3.52.3
1.8 1.1
1.7
1.7
1.21.0 0.9
0.3
0.1 0.2 0.8
–0.3
2.8
1.04.1
2.1
1.3
0.9 2.1 0.40.4
9.310.6
6.9
8.9
7.2
5.8
4.0 4.2
2.40.1 0.1
0.10.1 0.2 0.1 0.2 0.1
3.2 2.92.3
0.3 1.5 1.4 0.8 0.4
1.8
1.41.41.3
0.9
1.40.4 1.1
–0.4
0.7
0.50.5
–0.7
–3.0
2.4
–0.4
0.2 0.62.3
5.6
3.7
0.70.7
3.72.7
2.0 2.00.7
3.1
0.3 0.3 0.3 0.5 0.5 0.8 0.5 0.3 0.2
3.3 3.9 4.1 3.0 3.4 2.91.5 1.3 0.9
2.11.9
0.90.2
0.61.5
0.5 0.2 0.2
0.7
4.8
0.3 3.8
0.80.8
–2.5
1.6 2.01.4
6.3
10.9
5.67.4
5.2
2.64.1 3.8
2.8
0.1 0.1 0.1 0.2 0.21.4 1.5 1.5 1.6 1.8 2.1 2.1
3.6 4.01.7 1.7 1.4 1.3 1.2 1.0 1.2
0.50.5
–0.2 –0.2
2.12.9 1.9
2.53.1
3.51.5
2.8 3.1
5.05.8
5.05.7
6.5
7.8
6.3
0.2 0.2 0.1 0.1 0.3 0.4 0.3 0.33.0
6.4
7.87.8 2.8 2.9
6.5 6.6 7.87.70.6
0.8
0.7
0.4 0.70.7
1.0 0.70.5 0.7
–1.2 –1.7–4.0
–5.5
1.21.2
–1.9 –1.3 –2.2–4.3
2.4
5.84.7
–2.1
4.96.0 6.4 6.3
4.3
0.1 0.1 0.1 0.1
0.1
0.10.3 0.4 0.3
5.2 5.7 6.0
3.9
0.9
0.20.2
3.6 4.5
0.5
0.90.8
1.5
–0.1–0.1 0.20.8
0.30.6
0.7
–1.3 –0.4 –1.7
–2.7
3.03.0
5.1
2.0
3.06.5
5.46.6
3.8
–1.8
3.6
6.3 6.4
8.4
0.1 0.1 0.1 0.2 0.3 0.5 0.7 0.7 0.4
5.6 5.8 7.1
3.5
6.5 5.7
2.3 2.1 3.0
1.2 1.2
1.2
1.3
1.0 1.3
0.7 0.91.0
0.8 1.11.1
–3.4
2.0
1.41.4
–2.6
1.5 1.2 0.6
7.7 8.2
5.1
6.9
9.3
4.95.2 5.0 5.0
0.1 0.2 0.2 0.3 0.4 0.6
3.4
3.0
3.5 4.04.9 5.6
3.2 3.5
5.70.7 0.1 0.6
1.21.2 1.1
1.0
0.40.7
0.5
1.21.2
–1.3
3.3
–1.1 –0.2 –0.8
2.53.2
0.6
5.3
1.8
7.4
4.2
6.0
6.0
6.4
7.8 7.5
0.2 0.5 0.4 0.7 0.5 0.6 0.6 0.2 0.1
7.58.7
5.3 5.2 5.43.8
2.62.2 1.9
1.2
0.5
1.1 1.61.0
0.3
–0.2
0.7
0.40.4
–2.2
2.12.3
1.21.2
0.9 1.22.0
0.2
9.47.5
8.99.8
8.1
5.34.7 4.2
2.9
0.5 0.3 0.3 0.5 0.3 0.4 0.30.1
0.1
5.4
2.71.9 1.9
1.70.8 0.1
–0.1 –0.4–0.4
0.6
0.4 0.4
–0.2 –0.5 –0.3–0.4–1.1
1.1
1.6 2.0
–0.3
0.51.11.1 0.4 1.4
4.44.7
4.34.9
1.5 1.11.2
0.1 1.0
0.1 0.10.1 0.1 0.1 0.1
0.3 0.20.1
6.2 7.3
2.9 0.8 0.4 0.83.0 3.8
1.8
0.60.61.2
0.60.6 1.10.5 0.7
0.8
–0.2
0.4
2.62.6
–11.4
0.3
–0.6
2.7 2.6
2.71.11.1
–1.0
9.5
–2.8
3.81.3 3.7 4.1
6.85.0
1.2
0.2 0.2 0.2 0.3 0.2 0.2 0.3 0.2
4.25.8 6.1 4.8 5.2
4.6
2.7 3.5 4.1
1.5 1.0
1.4
1.0 0.5 0.9
0.5
1.4 0.5
2.60.80.8
–3.0
1.51.5 1.51.5
–5.0
1.21.2
0.5 0.4
8.3 7.8
4.7
7.5 7.5
0.7
4.65.6 5.3
©20
18 A
sian
Prod
uctiv
ity O
rgan
izat
ion

5
71
5.3 Total Factor Productivity
Figure 61 Growth Accounting Decomposition by Country and Region_Average Annual growth rate of constant-price GDP and contributions of labor, capital, and TFP in 1970–2016
Source: APO Productivity Database 2018. Note: Cambodia is not included in CLMV and ASEAN before 1993.
Asia24
Thailand
1970–1975
1975–1980
1980–1985
1985–1990
1990–1995
1995–2000
1970–1975
1975–1980
1980–1985
1985–1990
1990–1995
1995–2000
2000–2005
2005–2010
2010–2016
2005–2010
2010–2016
2005–2010
2010–2016
2005–2010
2010–2016
2005–2010
2010–2016
2005–2010
2010–2016
%
–1
0
1
2
4
3
5
%
–2
0
2
4
6
8
1970–1975
1975–1980
1980–1985
1985–1990
1990–1995
1995–2000
%
–2
0
2
4
6
10
8
12Pakistan
East Asia
Vietnam
2000–2005
2000–20052000–2005
2000–2005
2000–2005
Philippines
1970–1975
1975–1980
1980–1985
1985–1990
1990–1995
1995–2000
%
–1
0
2
1
3
4
5
7
6
US
Singapore
1970–1975
1975–1980
1980–1985
1985–1990
1990–1995
1995–2000
%
–4
–2
0
10
8
6
4
2
2005–2010
2010–2016
2000–2005
South Asia
1970–1975
1975–1980
1980–1985
1985–1990
1990–1995
1995–2000
–2
0
2
4
6
8%
Sri Lanka1970–1975
1975–1980
1980–1985
1985–1990
1990–1995
1995–2000
%
–2
0
2
4
10
6
8
2000–2005
2010–2016
2005–2010
1970–1975
1975–1980
1980–1985
1985–1990
1990–1995
1995–2000
2000–2005
2010–2016
2005–2010
1970–1975
1975–1980
1980–1985
1985–1990
1990–1995
1995–2000
2000–2005
2010–2016
2005–2010
1970–1975
1975–1980
1980–1985
1985–1990
1990–1995
1995–2000
Nepal %
–8
–6
–2
–4
0
4
2
8
6
%
0
2
6
4
8%
–4
–2
0
2
4
6
ASEAN ASEAN6
Non-IT capital Output IT capital Labor TFP
2005–2010
2010–2016
1970–1975
1975–1980
1980–1985
1985–1990
1990–1995
1995–2000
2000–2005
%
–3
0
3
6
9CLMV%%
2005–2010
2010–2016
2000–2005
1970–1975
1975–1980
1980–1985
1985–1990
1990–1995
1995–2000
–2
0
2
4
10
6
8
2005–2010
2010–2016
2000–2005
1970–1975
1975–1980
1980–1985
1985–1990
1990–1995
1995–2000
–2
0
2
4
10
6
8
2005–2010
2010–2016
2000–2005
0
2
4
6
8%
–2 1970–1975
1975–1980
1980–1985
1985–1990
1990–1995
1995–2000
APO20
2005–2010
2010–2016
1970–1975
1975–1980
1980–1985
1985–1990
1990–1995
1995–2000
2000–2005
%
–2
0
2
4
6
0.1 0.1 0.1 0.1 0.1 0.1 0.1 0.1
3.03.9 3.6 3.0 2.9 2.4 2.1 2.3 2.2
1.6
1.8
1.01.0 0.6 1.61.2
1.41.1 1.5
–1.8–2.8
–0.6
1.2 0.41.1
–0.5
0.5 0.22.9
3.14.1
4.9 4.9 4.8
3.04.1 4.0
0.1 0.1 0.1 0.1 0.1
2.2 2.3 2.63.0 2.8 2.6
2.0 1.60.4
1.3 0.81.4
1.51.2
1.01.1 1.3
0.8
0.1
2.7
3.9 2.4
1.9
0.8 1.9
0.22.9
3.6
5.8
7.9
7.0
6.0
4.55.0
3.34.2 0.2 0.1
0.20.20.2 0.1 0.5 0.7 0.3 0.2
3.34.8 3.8
1.1 2.33.0 2.1 1.8 2.4
2.0
1.41.4
1.4
1.0 0.90.5 0.8 0.8 1.0
0.3
–0.5
–6.8
3.0
–0.5 –0.1
1.0 1.92.4
5.75.9
–1.4
5.3
2.83.9 4.5 4.8
5.9
0.5 0.4 0.6 0.9 0.9 0.7 0.7 0.5 0.6
7.35.3 5.9
3.1 3.5 4.22.1 2.1 2.4
2.51.4
2.1 2.11.1
0.52.4 1.2
–1.3
0.3
–1.3
2.2 1.9
–0.5
1.41.5
–0.3
9.18.3
6.6
8.3 8.3
5.54.8
6.5
3.9
0.1 0.1 0.1 0.1 0.3 0.3 0.1
2.1
3.83.0
1.3 0.9 0.51.8
3.75.20.8
0.8
0.1
1.5
0.41.9
–0.5
0.2
0.5
–0.1
0.70.7
1.8
0.5 4.02.4
2.4
1.90.3
2.9
5.45.0
3.3
5.34.9
4.0
6.2 6.1
0.1 0.2 0.2 0.4 0.6 0.3 0.2 0.4 0.3
3.4 3.3 3.4 3.6
6.4 3.3
0.8 1.4 1.4
1.03.0
1.11.6
0.80.8
–0.2
0.10.5
–0.6
1.0
0.9
0.5
4.2 0.30.3
–2.7
4.2 1.31.9
5.5
7.4
5.3
9.8
8.1
0.70.7
5.3
3.73.0
0.1 0.1 0.1 0.2 0.2 0.3 0.30.4 1.3 1.7 2.64.0
6.5 6.2 6.34.4
2.11.3 1.4
0.7
0.7
0.80.2
1.2
0.2
–0.8
0.9
3.10.9
3.3
–0.2
1.4
–1.6
1.0
1.8
3.5
6.2
4.4
8.17.3
8.0
6.25.9
0.2 0.3 0.4 0.5 0.4 0.7 0.6 0.3 0.2
1.4 1.2 1.0 1.00.7
0.9 0.90.8 0.4
0.61.5
0.8 1.0
0.5
1.00.2
–0.4
0.8
0.4
0.71.0 0.7
1.0
1.6
0.90.6
2.6
3.63.3 3.3
2.6
4.2
2.5
0.8
2.0
0.3 0.2 0.2 0.3 0.2 0.3 0.2 0.1 0.1
4.6
3.32.5 2.3 2.5 2.0
1.3 1.6 1.9
0.9
1.2
1.1 1.0 0.8
0.60.7 0.6 0.5
–0.8 –0.2
0.82.1
0.8
0.32.0 2.0 1.5
5.04.5 4.7
5.8
4.4
3.1
4.2 4.44.0
0.3 0.2 0.2 0.3 0.2 0.2 0.3 0.2 0.2
4.63.4 2.6 2.5 2.7 2.4 2.0
2.9 3.3
1.2
1.41.5 1.2 0.7 0.9 0.8
0.3 0.3
–1.0 –0.2
1.0 1.9 2.10.9
2.63.1
1.65.1 4.8
5.46.0 5.7
4.4
5.76.6
5.4
0.4 0.2 0.3 0.4 0.2 0.3 0.3 0.2 0.2
5.4
3.22.4 2.6 2.4 2.0 1.9 2.7 3.1
1.1
1.41.7 1.2
0.6 0.9 0.70.1 0.2
–1.9
0.7 1.7 2.02.3
1.42.7
3.82.1
5.15.5
6.0 6.25.6
4.65.6
6.8
5.5
0.1 0.1 0.1 0.1 0.2 0.21.5 1.7 1.7 1.8 1.9 2.2 2.2
3.5 3.91.51.6 1.4 1.2 1.3 1.0 1.1
0.7 0.6
–0.5
0.20.2
2.1 2.7 1.9 2.1 2.6
2.7 1.3
2.53.5
5.35.8
5.15.4
6.17.1
6.1
0.1 0.2 0.2 0.3 0.4 0.3 0.3 0.4 0.3
3.84.8 5.1 3.7
5.14.3
2.3 2.9 3.4
1.41.4 1.3
1.1
0.80.80.7
0.51.0 0.5
1.20.80.8
–2.8
1.9
0.90.9
–3.0
1.90.9 0.7
6.67.2
3.9
7.0 7.2
2.4
5.1 5.2 4.9
0.1 0.2 0.2 0.3 0.4 0.3 0.3 0.4 0.3
4.14.9
5.1 3.75.2
4.2
2.1 2.6 3.2
1.51.5 1.3
1.2
0.80.8
0.6
0.61.0 0.5
1.50.80.8
–3.0
2.30.90.9
–3.2
1.81.0 0.8
7.2 7.57.5
3.7
7.5 7.3
1.9
4.8 5.0 4.7
0.1 0.1 0.1 0.1 0.2 0.2 0.3 0.31.02.5
3.42.82.8
3.6
6.3 6.1 6.65.6
1.4
1.11.1
0.70.7
0.9 0.4
1.0
0.3
–0.3
0.80.8
1.01.0
–1.9
2.4
–0.6
0.8
–1.6 –0.6
2.2
4.55.6
1.8
6.9 6.97.5
6.35.6
©20
18 A
sian
Prod
uctiv
ity O
rgan
izat
ion
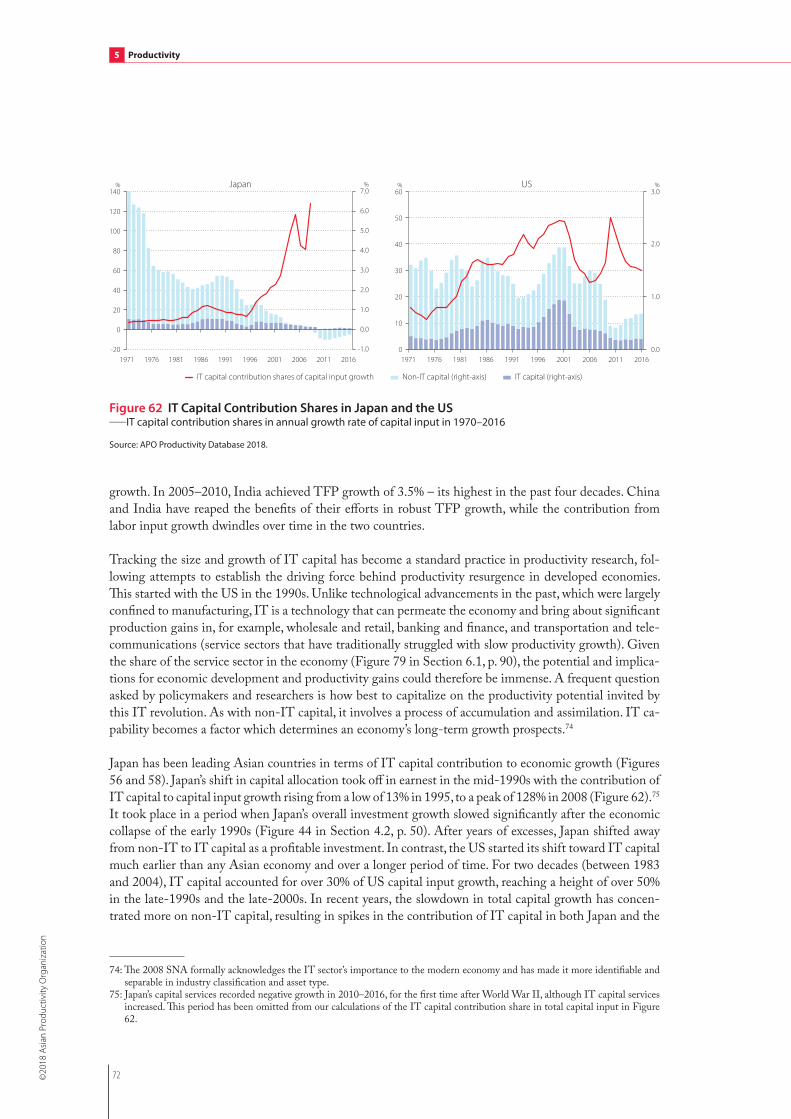
72
5 Productivity
growth. In 2005–2010, India achieved TFP growth of 3.5% – its highest in the past four decades. China and India have reaped the benefits of their efforts in robust TFP growth, while the contribution from labor input growth dwindles over time in the two countries.
Tracking the size and growth of IT capital has become a standard practice in productivity research, fol-lowing attempts to establish the driving force behind productivity resurgence in developed economies. This started with the US in the 1990s. Unlike technological advancements in the past, which were largely confined to manufacturing, IT is a technology that can permeate the economy and bring about significant production gains in, for example, wholesale and retail, banking and finance, and transportation and tele-communications (service sectors that have traditionally struggled with slow productivity growth). Given the share of the service sector in the economy (Figure 79 in Section 6.1, p. 90), the potential and implica-tions for economic development and productivity gains could therefore be immense. A frequent question asked by policymakers and researchers is how best to capitalize on the productivity potential invited by this IT revolution. As with non-IT capital, it involves a process of accumulation and assimilation. IT ca-pability becomes a factor which determines an economy’s long-term growth prospects.74
Japan has been leading Asian countries in terms of IT capital contribution to economic growth (Figures 56 and 58). Japan’s shift in capital allocation took off in earnest in the mid-1990s with the contribution of IT capital to capital input growth rising from a low of 13% in 1995, to a peak of 128% in 2008 (Figure 62).75 It took place in a period when Japan’s overall investment growth slowed significantly after the economic collapse of the early 1990s (Figure 44 in Section 4.2, p. 50). After years of excesses, Japan shifted away from non-IT to IT capital as a profitable investment. In contrast, the US started its shift toward IT capital much earlier than any Asian economy and over a longer period of time. For two decades (between 1983 and 2004), IT capital accounted for over 30% of US capital input growth, reaching a height of over 50% in the late-1990s and the late-2000s. In recent years, the slowdown in total capital growth has concen-trated more on non-IT capital, resulting in spikes in the contribution of IT capital in both Japan and the
74: The 2008 SNA formally acknowledges the IT sector’s importance to the modern economy and has made it more identifiable and separable in industry classification and asset type.
75: Japan’s capital services recorded negative growth in 2010–2016, for the first time after World War II, although IT capital services increased. This period has been omitted from our calculations of the IT capital contribution share in total capital input in Figure 62.
Figure 62 IT Capital Contribution Shares in Japan and the US_IT capital contribution shares in annual growth rate of capital input in 1970–2016
Source: APO Productivity Database 2018.
–1.0
0.0
2.0
1.0
3.0
4.0
5.0
6.0
7.0Japan
0
20
40
–20
60
80
100
120
140
1971 1976 1981 1986 1991 1996 2001 2006 2011
% %
Non-IT capital (right-axis) IT capital (right-axis)IT capital contribution shares of capital input growth
1971 1976 1981 1986 1991 1996 2001 2006 2011 2016
US
0
10
20
30
40
50
60
0.0
1.0
2.0
3.0% %
2016
©20
18 A
sian
Prod
uctiv
ity O
rgan
izat
ion
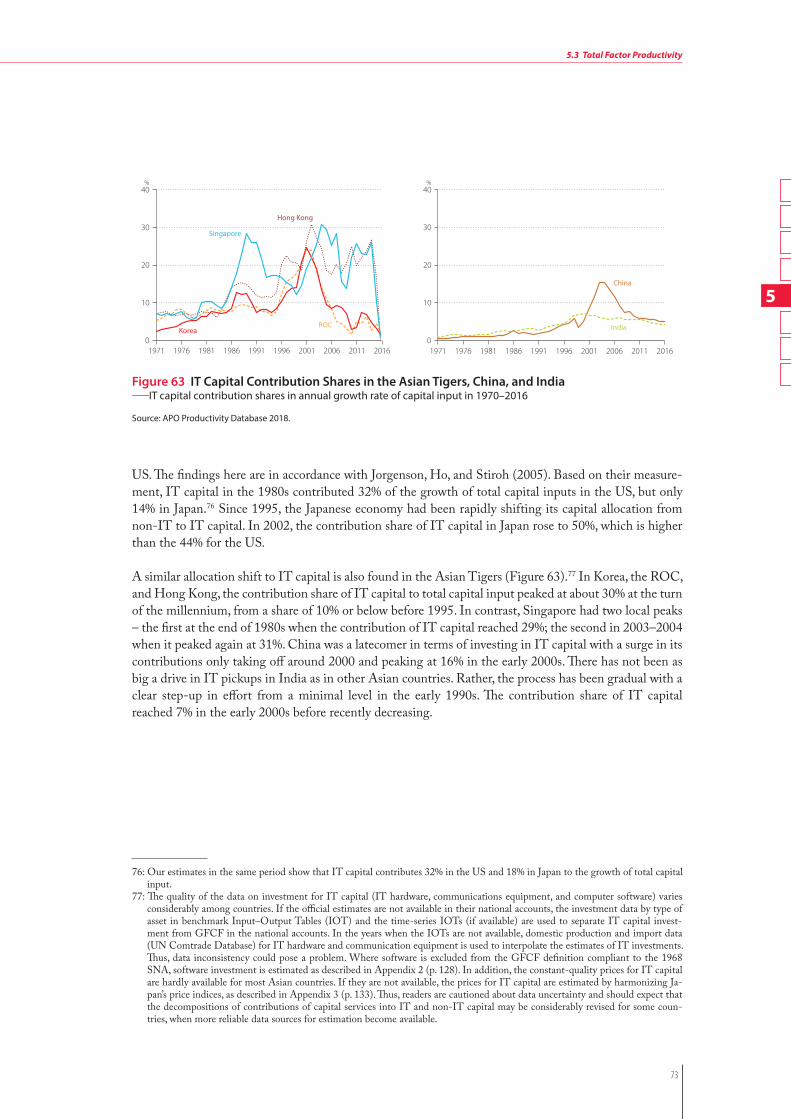
5
73
5.3 Total Factor Productivity
76: Our estimates in the same period show that IT capital contributes 32% in the US and 18% in Japan to the growth of total capital input.
77: The quality of the data on investment for IT capital (IT hardware, communications equipment, and computer software) varies considerably among countries. If the official estimates are not available in their national accounts, the investment data by type of asset in benchmark Input–Output Tables (IOT) and the time-series IOTs (if available) are used to separate IT capital invest-ment from GFCF in the national accounts. In the years when the IOTs are not available, domestic production and import data (UN Comtrade Database) for IT hardware and communication equipment is used to interpolate the estimates of IT investments. Thus, data inconsistency could pose a problem. Where software is excluded from the GFCF definition compliant to the 1968 SNA, software investment is estimated as described in Appendix 2 (p. 128). In addition, the constant-quality prices for IT capital are hardly available for most Asian countries. If they are not available, the prices for IT capital are estimated by harmonizing Ja-pan’s price indices, as described in Appendix 3 (p. 133). Thus, readers are cautioned about data uncertainty and should expect that the decompositions of contributions of capital services into IT and non-IT capital may be considerably revised for some coun-tries, when more reliable data sources for estimation become available.
Figure 63 IT Capital Contribution Shares in the Asian Tigers, China, and India_IT capital contribution shares in annual growth rate of capital input in 1970–2016
Source: APO Productivity Database 2018.
01971 1976 1981 1986 1991 1996 2001 2006 2011 2016
0
10
20
30
40%
1971 1976 1981 1986 1991 1996 2001 2006 2011 2016
10
20
30
40%
ROC
Hong Kong
Korea
Singapore
China
India
US. The findings here are in accordance with Jorgenson, Ho, and Stiroh (2005). Based on their measure-ment, IT capital in the 1980s contributed 32% of the growth of total capital inputs in the US, but only 14% in Japan.76 Since 1995, the Japanese economy had been rapidly shifting its capital allocation from non-IT to IT capital. In 2002, the contribution share of IT capital in Japan rose to 50%, which is higher than the 44% for the US.
A similar allocation shift to IT capital is also found in the Asian Tigers (Figure 63).77 In Korea, the ROC, and Hong Kong, the contribution share of IT capital to total capital input peaked at about 30% at the turn of the millennium, from a share of 10% or below before 1995. In contrast, Singapore had two local peaks – the first at the end of 1980s when the contribution of IT capital reached 29%; the second in 2003–2004 when it peaked again at 31%. China was a latecomer in terms of investing in IT capital with a surge in its contributions only taking off around 2000 and peaking at 16% in the early 2000s. There has not been as big a drive in IT pickups in India as in other Asian countries. Rather, the process has been gradual with a clear step-up in effort from a minimal level in the early 1990s. The contribution share of IT capital reached 7% in the early 2000s before recently decreasing.
©20
18 A
sian
Prod
uctiv
ity O
rgan
izat
ion

74
5 Productivity
Bangladesh
ROC Fiji
India
Japan Korea
Indonesia
–9
–6
–3
0
3
6
9
12
15
–12
–8
–4
0
4
8
12
–8
–6
–4
–2
0
2
4
6
8
10
–16
–12
–8
–4
0
4
8
12
–9
–6
–3
0
3
6
9
12
15
–12
–8
–4
0
4
8
12
16
–20
–15
–10
–5
0
5
10
15
1971 1976 1981 1986 1991 1996 2001 2006 2011 2016
–6
–30
–18
–24
–12
0
12
6
18
24Brunei
Mongolia
–9
–6
–3
0
6
3
15
12
9
18
IT capitalNon–IT capital LaborTFP Output
% %
% %
% %
% %
%
–4
–2
0
4
2
6
8
10Pakistan%
Malaysia
–16
–12
–4
–8
0
4
8
16
12
%
1971 1976 1981 1986 1991 1996 2001 2006 2011 2016
1971 1976 1981 1986 1991 1996 2001 2006 2011 2016
1971 1976 1981 1986 1991 1996 2001 2006 2011 2016
0
–9
–6
–3
3
9
6
12
15Cambodia%
1971 1976 1981 1986 1991 1996 2001 2006 2011 2016
1971 1976 1981 1986 1991 1996 2001 2006 2011 2016
1971 1976 1981 1986 1991 1996 2001 2006 2011 2016
1971 1976 1981 1986 1991 1996 2001 2006 2011 2016
1971 1976 1981 1986 1991 1996 2001 2006 2011 2016
1971 1976 1981 1986 1991 1996 2001 2006 2011 2016
1971 1976 1981 1986 1991 1996 2001 2006 2011 2016
1971 1976 1981 1986 1991 1996 2001 2006 2011 2016
China
–9
–6
–3
0
3
6
9
12
15%
1971 1976 1981 1986 1991 1996 2001 2006 2011 2016
Hong Kong
–12
–8
–4
0
4
8
12
16
20%
1971 1976 1981 1986 1991 1996 2001 2006 2011 2016
Iran
–21
–14
–7
0
7
14
21%
1971 1976 1981 1986 1991 1996 2001 2006 2011 2016
Lao PDR
–8
–4
0
4
8
12
16%
1971 1976 1981 1986 1991 1996 2001 2006 2011 2016
–9
–6
–3
0
6
3
9Nepal%
1971 1976 1981 1986 1991 1996 2001 2006 2011 2016–30
–20
–10
0
20
10
40
30
Myanmar%
1971 1976 1981 1986 1991 1996 2001 2006 2011 2016
©20
18 A
sian
Prod
uctiv
ity O
rgan
izat
ion

5
75
5.3 Total Factor Productivity
Figure 64 Growth Accounting Decomposition by Country and Region (Year-over-Year)_Annual growth rate of constant-price GDP and contributions of labor, capital, and TFP in 1970–2016
Source: APO Productivity Database 2018. Note: Cambodia is not included in CLMV and ASEAN before 1993.
Non–IT capital OutputIT capital LaborTFP
–4
–2
0
2
4
8
6
10
Thailand
–8
–12
–4
0
4
8
16
12
Vietnam
–12
–8
–4
0
4
8
12
16
APO20
–6
–4
–2
0
2
4
6
8
–8
–6
–4
–2
0
2
4
6
8
10
–15
–12
–6
–9
–3
0
3
6
9
12
Asia24
South Asia ASEAN6
%
% %
%
% %
–12
–6
–9
–3
0
3
6
9
12ASEAN%
CLMV
–9
–6
–3
0
3
6
9
12
15
18%
–15
–12
–9
–6
–3
0
3
6
12
9
Philippines
–9
–6
–3
0
3
6
9
12
15Singapore% %
1971 1976 1981 1986 1991 1996 2001 2006 2011 2016 1971 1976 1981 1986 1991 1996 2001 2006 2011 2016
Sri Lanka
–4
–2
0
2
4
8
6
10%
US
–4
–2
0
2
4
6
8%
East Asia
–8
–6
–4
–2
0
2
4
6
8
10%
1971 1976 1981 1986 1991 1996 2001 2006 2011 2016 1971 1976 1981 1986 1991 1996 2001 2006 2011 2016
1971 1976 1981 1986 1991 1996 2001 2006 2011 2016
1971 1976 1981 1986 1991 1996 2001 2006 2011 2016
1971 1976 1981 1986 1991 1996 2001 2006 2011 2016
1971 1976 1981 1986 1991 1996 2001 2006 2011 20161971 1976 1981 1986 1991 1996 2001 2006 2011 2016
1971 1976 1981 1986 1991 1996 2001 2006 2011 20161971 1976 1981 1986 1991 1996 2001 2006 2011 2016
1971 1976 1981 1986 1991 1996 2001 2006 2011 2016
1971 1976 1981 1986 1991 1996 2001 2006 2011 2016
©20
18 A
sian
Prod
uctiv
ity O
rgan
izat
ion

76
5 Productivity
5.4 Sources of Labor Productivity Growth
Although TFP more accurately measures how efficiently an economy utilizes its factor inputs, labor pro-ductivity and its drivers are of interest because of the close link to GDP per capita. Within the same growth accounting framework, average labor productivity growth at the aggregate level can be broken down into effects of capital deepening (as measured by capital input per hour worked), which reflects the capital–labor substitution, and TFP. In other words, these factors are key in fostering labor productivity. Figure 65 shows the average annual growth rate of capital deepening in Asian countries.
Capital deepening has been taking place – albeit to various degrees – in all of the countries compared, as presented in Figure 65. Experience of countries suggests that capital deepening is an accompanying pro-cess of rapid economic de-velopment. The relatively early starters ( Japan and the Asian Tigers) under-went more rapid capital deepening than the other countries compared; and in the earlier rather than the latter period. The reverse is true for the emerging Asian economies, where concert-ed efforts were made to in-crease capital intensity in the latter period. In 1990–2016, China, Myanmar, Vietnam, India, Bangla-desh, Indonesia, and Thai-land moved up to occupy the top spots among the Asian Tigers, while Singa-pore and Japan stepped down in the rankings. In 1970–1990, the capital deepening ratio was rising by 10.9% and 9.3% on av-erage per year in Korea and the ROC, respectively. Over the subsequent two decades it slowed to 6.5% and 5.1% respectively. Meanwhile, China’s pace doubled between the two periods, from 5.5% to 10.5% on average per year. In Vietnam, it has acceler-ated to 6.8% since 1990, a contrast to capital shallow-ing (–0.7%) in 1970–1990.
−2
0
2
4
6
8
10
12%
1970−2016 1970−1990 1990−2016
Korea
China
ROC
Myanm
ar
East Asia
Asia24
Indonesia
Malaysia
India
Singapore
Hong Kong
Nepal
ASEAN
ASEAN6
South Asia
CLMV
Japan
Thailand
Cambodia
APO20
Lao PDR
Bangladesh
Vietnam
Mongolia
Sri Lanka
Iran
Philippines
US
Pakistan
Brunei
Fiji
8.4 8.3 6.9 6.5
5.3 4.9 4.9 4.7 4.7 4.7 4.7 4.5 4.3 4.3 4.3 4.2
4.2 4.1 4.1 4.0 3.7
3.7
3.5
3.4 3.2 2.1
2.0 2.0 1.9 1.6 1.0
10.9
5.5
9.3
4.75.5
4.9 4.8
5.6
2.9
6.9
5.7 5.8
4.0 4.1 2.8
0.7
7.1
3.1
0.0
5.3
2.9
1.1
−0.7
5.6
3.23.8
2.3 2.12.6
−0.2
1.9
6.5
10.5
5.1
7.9
5.2
5.0 5.0
3.9
6.1
3.03.9
3.5
4.5 4.4
5.4
6.9
1.9
4.94.1
3.0
4.4
5.7
6.8
1.6 3.1
0.8
1.8 1.91.3
3.0
0.3
Figure 65 Capital Deepening_Average annual growth rate of capital input per hour worked in 1970–2016, 1970–1990, and 1990–2016
Source: APO Productivity Database 2018.Note: The starting period for Cambodia is 1993 and Cambodia is not included in CLMV and ASEAN before 1993.
−5
−4
−3
−2
−1
0
1
2%
1970−2016 1970−1990 1990−2016
Pakistan Sri Lanka Lao PDR
Vietnam
Mongolia
Cambodia
Thailand Philippines
South Asia Hong KongIndia APO
20 Asia24 East Asia ASEAN6
ASEAN
M
alaysia CLM
VJapan BangladeshChina Indonesia Singapore RO
C
Nepal Brunei Korea M
yanmar
Fiji US Iran
0.9 0.1 −0.3
−0.3 −0.3 −0.3
−0.4 −0.4
−0.5 −0.6 −0.7 −0.9
−1.0 −1.1
−1.1
−1.3 −1.3
−1.3 −1.4
−1.4 −1.4 −1.5 −1.5
−1.7 −1.8
−1.8 −2.1 −2.8
−3.2 −3.2
−4.4
0.9
−0.8−0.4
−1.1
1.5
−2.7
−0.5
0.0 0.2
−1.9
−3.4
−0.7−0.5 −0.9
−2.3−2.1
−2.3
−1.2 −1.3
−2.0
−0.3
−3.0
−0.4
−0.9−1.2
−3.4−3.0
−4.3
−1.7
−4.4
−4.3
0.90.9
−0.20.4
−1.6
1.6
−0.3
−0.4
−1.0
0.41.3
−1.0 −1.3 −1.2
−0.2−0.6 −0.5
−1.4 −1.4
−0.9
−2.3
−0.4
−2.4−2.2 −2.2
−0.6 −1.4−1.7
−4.3
−2.3
−4.5
Figure 66 Capital Productivity Growth_Average annual growth rate of constant-price GDP per capital input in 1970–2016, 1970–1990, and 1990–2016
Source: APO Productivity Database 2018. Note: The starting period for Cambodia is 1993 and Cambodia is not included in CLMV and ASEAN before 1993.
©20
18 A
sian
Prod
uctiv
ity O
rgan
izat
ion
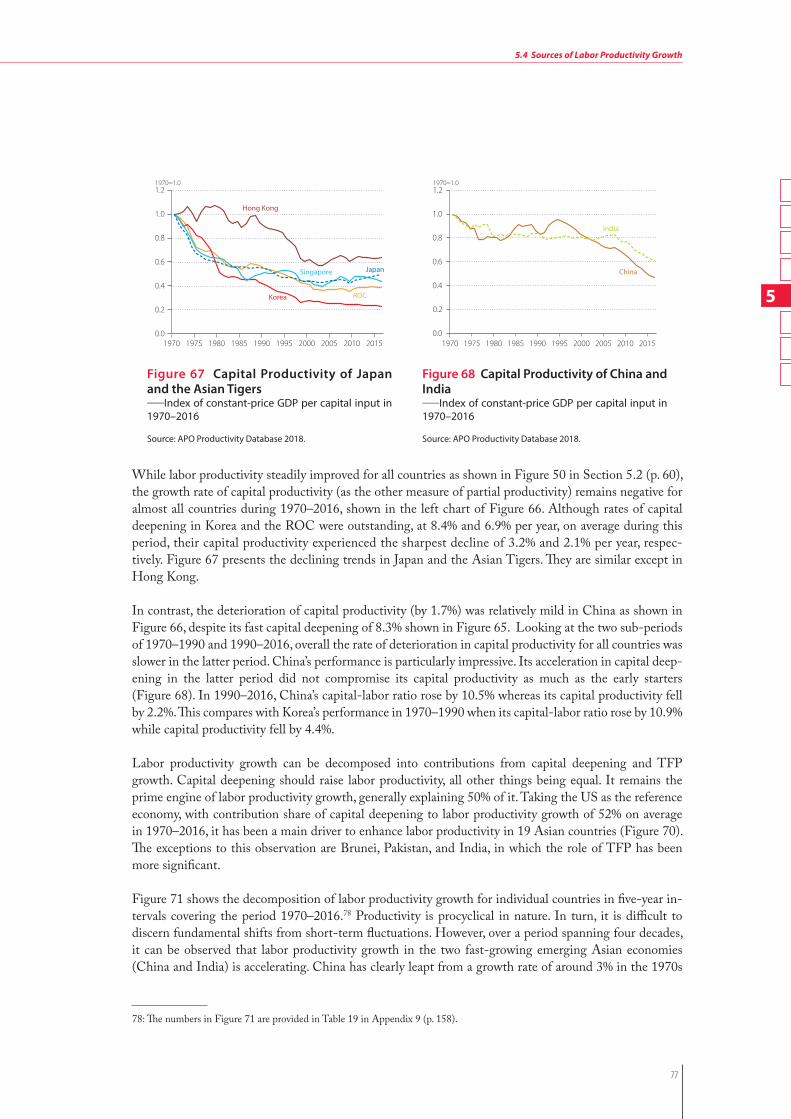
5
77
5.4 Sources of Labor Productivity Growth
While labor productivity steadily improved for all countries as shown in Figure 50 in Section 5.2 (p. 60), the growth rate of capital productivity (as the other measure of partial productivity) remains negative for almost all countries during 1970–2016, shown in the left chart of Figure 66. Although rates of capital deepening in Korea and the ROC were outstanding, at 8.4% and 6.9% per year, on average during this period, their capital productivity experienced the sharpest decline of 3.2% and 2.1% per year, respec-tively. Figure 67 presents the declining trends in Japan and the Asian Tigers. They are similar except in Hong Kong.
In contrast, the deterioration of capital productivity (by 1.7%) was relatively mild in China as shown in Figure 66, despite its fast capital deepening of 8.3% shown in Figure 65. Looking at the two sub-periods of 1970–1990 and 1990–2016, overall the rate of deterioration in capital productivity for all countries was slower in the latter period. China’s performance is particularly impressive. Its acceleration in capital deep-ening in the latter period did not compromise its capital productivity as much as the early starters (Figure 68). In 1990–2016, China’s capital-labor ratio rose by 10.5% whereas its capital productivity fell by 2.2%. This compares with Korea’s performance in 1970–1990 when its capital-labor ratio rose by 10.9% while capital productivity fell by 4.4%.
Labor productivity growth can be decomposed into contributions from capital deepening and TFP growth. Capital deepening should raise labor productivity, all other things being equal. It remains the prime engine of labor productivity growth, generally explaining 50% of it. Taking the US as the reference economy, with contribution share of capital deepening to labor productivity growth of 52% on average in 1970–2016, it has been a main driver to enhance labor productivity in 19 Asian countries (Figure 70). The exceptions to this observation are Brunei, Pakistan, and India, in which the role of TFP has been more significant.
Figure 71 shows the decomposition of labor productivity growth for individual countries in five-year in-tervals covering the period 1970–2016.78 Productivity is procyclical in nature. In turn, it is difficult to discern fundamental shifts from short-term fluctuations. However, over a period spanning four decades, it can be observed that labor productivity growth in the two fast-growing emerging Asian economies (China and India) is accelerating. China has clearly leapt from a growth rate of around 3% in the 1970s
Figure 67 Capital Productivity of Japan and the Asian Tigers_Index of constant-price GDP per capital input in 1970–2016
Source: APO Productivity Database 2018.
1970 1975 1980 1985 1990 1995 2000 2005 2010 20150.0
0.2
0.4
0.6
0.8
1.0
1.21970=1.0
Singapore
ROC
Hong Kong
Korea
Japan
Figure 68 Capital Productivity of China and India_Index of constant-price GDP per capital input in 1970–2016
Source: APO Productivity Database 2018.
1975 1980 1985 1990 1995 2000 2005 2010 20150.0
0.2
0.4
0.6
0.8
1.0
1.21970=1.0
1970
China
India
78: The numbers in Figure 71 are provided in Table 19 in Appendix 9 (p. 158).
©20
18 A
sian
Prod
uctiv
ity O
rgan
izat
ion

78
5 Productivity
to a rate of 8–10% in the 2000s, with its transition period in the early 1990s. India’s passage to ac-celerating labor productivity growth is more gradual than Chi-na’s, from almost zero in the 1970s to 6.9% in 2005–2010. In contrast, the early starters ( Japan and the Asian Tigers) have been experi-encing a slowdown in labor pro-ductivity growth since their height in the late 1980s. In both Hong Kong and Korea, labor productiv-ity growth appeared to stabilize in the 2000s, but at a lower rate than previously. Singapore’s productiv-ity performance, albeit robust, compared with other mature economies like the US, has been very modest against its Asian counterparts. A recent peak of 3.7% in the early 2000s is com-pared with over 6% in Hong Kong, the ROC, and Korea in the late 1980s. The US clearly enjoyed a labor productivity growth spurt in the late 1990s (2.5%) and early 2000s (2.2%), the origin of which attracted much research attention at the time. In recent years, it has returned to its long-term average of under 2%.
Figure 69 Sources of Labor Productivity Growth in the Long Run_Average annual growth rate of constant-price GDP per hour, contributions of capital deepening, and TFP in 1970–2016
Source: APO Productivity Database 2018. Note: The starting period for Cambodia is 1993 and Cambodia is not included in CLMV and ASEAN before 1993
7%
−3
−2
−1
0
2
4
3
1
5
6Non-IT capital deepening
IT capital deepening
TFPLabor productivity
ChinaKoreaRO
CEast AsiaAsia24H
ong KongThailandCam
bodiaIndiaLao PD
RSouth AsiaSri LankaM
alaysiaVietnamIndonesiaM
ongoliaASEANASEAN
6SingaporeAPO
20CLM
VPakistanJapanBangladeshM
yanmar
Nepal
US
IranPhilippinesFijiBrunei
0.20.4
0.3 0.3 0.2 0.40.3 0.1 0.1 0.2 0.1 0.1 0.3 0.1 0.2 0.2 0.2 0.2 0.5 0.2 0.2 0.0
0.3 0.1 0.2 0.1 0.4 0.10.2 0.1
0.4
3.53.9
2.92.2 2.2 1.9 2.1 2.5
1.6
2.5
1.6 1.7
2.72.2
2.92.0
2.4 2.4 2.01.7
2.7
0.8
1.6 1.9
4.3
1.80.5
1.4 1.10.4
0.8
2.90.9
1.6
1.71.3 1.4 1.3 1.0
1.90.8
1.7 1.50.3 0.9 0.1
0.9 0.3 0.3 0.40.9
0.0
1.90.7
0.2
−2.4
−0.2
0.8
−0.1
0.1 0.3
−2.7
6.7
5.24.8
4.13.7 3.7 3.7 3.6 3.6 3.5 3.4 3.3 3.3 3.3 3.2 3.1 2.9 2.9 2.9 2.9 2.8 2.8
2.62.2 2.1
1.7 1.61.4 1.4
0.7
−1.5
Figure 70 Contribution Shares of Labor Productivity Growth in the Long Run_Average contribution shares of capital deepening and TFP in 1970–2016
Source: APO Productivity Database 2018. Note: The starting period for Cambodia is 1993 and Cambodia is not included in CLMV and ASEAN before 1993.The countries with a negative growth of labor productivity are excluded.
120%
−20
0
100
20
40
60
80
Non-IT capital deepening IT capital deepeningTFP
ChinaKoreaRO
CEast AsiaAsia24H
ong KongThailandCam
bodiaIndiaLao PD
RSouth AsiaSri LankaM
alaysiaVietnamIndonesiaM
ongoliaASEANASEAN
6SingaporeAPO
20CLM
VPakistanJapanBangladeshM
yanmar
Nepal
US
IranPhilippinesFiji
3 7 7 6 5 10 8 4 3 5 3 3 9 45 5 8 8
177 5 2 12
5 8 423
714 10
53
75
6053 58 51 56 69
45
71
48 52
82
68
93
65
82 81 69
60
95
30
6087
203
111
29
10377
54
44
1733
41 36 39 3627
52
23
49 44
9
27
2
29
10 11 15
33
−0
68
28
8
−112
−15
48
−9
9
37
©20
18 A
sian
Prod
uctiv
ity O
rgan
izat
ion

5
79
5.4 Sources of Labor Productivity Growth
Non-IT capital deepening IT capital deepeningTFP Labor productivity
Japan
Cambodia%
%
–2
–1
0
1
2
3
4
5
7
6
%
–3
0
3
6
9
–3
–2
–1
0
1
2
4
3
5
6
Hong Kong
%
0
4
6
2
8
10
12
Iran
Bangladesh
Fiji%
–3
–2
–1
0
1
2
3
%
–12
–9
–6
–3
0
6
3
9
%
–3
–2
–1
0
1
2
3
4
6
5
1970–1975
1975–1980
1980–1985
1985–1990
1990–1995
1995–2000
2000–2005
2010–2016
2005–2010
1970–1975
1975–1980
1980–1985
1985–1990
1990–1995
1995–2000
2000–2005
2010–2016
2005–2010
Brunei%
–15
–10
–5
0
5
10
1970–1975
1975–1980
1980–1985
1985–1990
1990–1995
1995–2000
2000–2005
2010–2016
2005–2010
1970–1975
1975–1980
1980–1985
1985–1990
1990–1995
1995–2000
2000–2005
2010–2016
2005–2010
1970–1975
1975–1980
1980–1985
1985–1990
1990–1995
1995–2000
2000–2005
2010–2016
2005–2010
1970–1975
1975–1980
1980–1985
1985–1990
1990–1995
1995–2000
2000–2005
2010–2016
2005–2010
1970–1975
1975–1980
1980–1985
1985–1990
1990–1995
1995–2000
2000–2005
2010–2016
2005–2010
1970–1975
1975–1980
1980–1985
1985–1990
1990–1995
1995–2000
2000–2005
2010–2016
2005–2010
1970–1975
1975–1980
1980–1985
1985–1990
1990–1995
1995–2000
2000–2005
2010–2016
2005–2010
1970–1975
1975–1980
1980–1985
1985–1990
1990–1995
1995–2000
2000–2005
2010–2016
2005–2010
Korea
China
India%
–2
–0
2
4
6
8
%
–4
–2
0
2
4
6
10
8
Myanmar%
–6
–4
–2
0
2
4
8
6
Mongolia%
–4
–2
0
2
4
8
6
1970–1975
1975–1980
1980–1985
1985–1990
1990–1995
1995–2000
2000–2005
2010–2016
2005–2010
1970–1975
1975–1980
1980–1985
1985–1990
1990–1995
1995–2000
2000–2005
2010–2016
2005–2010
Malaysia%
–4
–2
0
2
4
6
8
1970–1975
1975–1980
1980–1985
1985–1990
1990–1995
1995–2000
2000–2005
2010–2016
2005–2010
ROC%
–2
4
6
2
0
8
1970–1975
1975–1980
1980–1985
1985–1990
1990–1995
1995–2000
2000–2005
2010–2016
2005–2010
%
–6
–4
–2
0
6
8
4
2
Indonesia
1970–1975
1975–1980
1980–1985
1985–1990
1990–1995
1995–2000
2000–2005
2010–2016
2005–2010
Lao PDR%
–2
0
2
4
6
1970–1975
1975–1980
1980–1985
1985–1990
1990–1995
1995–2000
2000–2005
2010–2016
2005–2010
0.1 0.1 0.10.1 0.2 0.20.1
–0.5
0.42.0
1.1
2.9 3.4 3.3 3.9
–2.5
1.70.5
0.9
0.1
0.1
–0.4
0.1
1.0
–2.4
1.3 1.0
3.0
1.3 3.1
3.13.6
5.0
–0.6
1.0 0.5–0.4
0.9 0.40.2
0.3 1.1
–2.0–3.4
2.81.3
4.7
1.20.1
2.1
5.66.5
–11.5
–7.4
–5.2–4.1
–0.8 –2.2
–4.9
3.0
4.2
–8.2–6.4
0.3–2.5
–0.7–1.8
-
–1.7
0.1 0.1 0.1 0.2 0.1
–0.5–0.1
2.0
5.1
4.0
5.4
2.3
1.9
–2.2
0.2
5.0 2.4
4.13.1 4.4
0.1 0.1 0.20.6 0.5 0.3
2.8 2.71.8
3.3 3.13.4
3.85.8
4.80.10.8
4.8 1.8
7.1
2.6
3.2
4.2
2.0
2.93.5
6.65.1
10.3
6.3
7.7
10.5
7.1
0.5 0.4 0.3 0.3 0.3 0.7 0.50.1
5.74.3
3.42.7 3.2
3.32.2
1.6
0.3–0.3
2.8
1.04.1
2.1 1.3
0.92.1
0.4
5.9
7.4
4.7
7.1
5.65.2
3.7 3.8
0.7
0.1 0.1 0.1 0.1 0.21.3
1.6
1.2
–0.6–0.2
1.0
–0.4
0.9
–1.0
0.5
–0.7
–3.0
2.4
–0.4
0.2
0.62.3
1.9
1.0
–1.7
1.9
–0.4
1.2
–0.3
1.71.3
0.2 0.2 0.3 0.5 0.4 0.5 0.3 0.21.5 2.1 3.3 2.9 2.8
1.6
1.0 1.2 0.8
0.7
4.8
0.3
3.8
0.8
–2.5
1.62.0
1.4
2.4
7.1
3.9
7.1
4.0
–0.2
3.1 3.52.4
0.6
0.1 0.1 0.1 0.2 0.2
0.6
0.8 0.8 1.0 1.2 1.5 1.4
3.3 3.7
–0.2 –0.2
2.12.9 1.9
2.5 3.1
3.51.5
0.4 0.6
3.0
3.93.2
4.14.6
6.9
5.4
0.10.1
0.2 0.3 0.2 0.20.2 0.2
1.6
3.9
3.4
3.14.4
3.41.9
1.13.3
2.6
0.8
–3.0
1.5
1.5
–5.0
1.20.5
0.44.2
4.9
0.6
4.8
6.3
–1.4
3.31.8
4.0
0.10.1 0.1
0.2 0.2–0.1
4.7 5.1
1.8–1.3 –1.2–1.8
0.1
4.5 0.9
2.6
–11.4
0.3
–0.6
2.7 2.62.7
1.1
–1.0
7.3
–6.2
2.1
–1.8
1.6 0.9
3.0
5.9
0.1
0.5 0.3 0.3 0.5 0.3 0.4 0.30.2
0.1
5.8
2.3 1.6 1.6 1.9 1.2 0.4
0.2 –0.4–1.1
1.11.6
2.0
–0.3
0.51.1
0.4 1.4
5.1
3.6 3.54.2
1.9 2.1 1.8
0.81.0
0.2 0.5 0.4 0.6 0.4 0.6 0.6 0.20.1
5.9
8.0
4.2 3.6 4.6 3.82.4 2.4
1.2
0.4
–2.2
2.1 2.3 1.20.9
1.2 2.00.2
6.5 6.3 6.6 6.5 6.25.4
4.2 4.6
1.5
–0.1
0.2 0.1 0.3 0.3 0.61.8 2.8 1.9
1.4
2.53.3
2.4 1.7
4.11.2
–1.3
3.3
–1.1
–0.2–0.8
2.53.2
0.6
3.0 1.5
5.2
0.4
2.5
2.6
5.1 5.2 5.3
0.1 0.1 0.1 0.1 0.3 0.4 0.7 0.6 0.2
3.6 3.75.0
1.5
4.8
3.2
1.0 0.4 1.4
0.8
1.1
–3.4
2.0
1.4
–2.6
1.51.2 0.6
4.54.9
1.7
3.6
6.5
1.1
3.12.2 2.3
0.1 0.1 0.1 0.1 0.1 0.1 0.2 0.4 0.2
4.3 4.4 4.30.9 1.1
–0.5 –2.4
2.5 3.3
0.7
–1.3 –0.4
–1.7–2.7
3.0
5.1
2.0
3.05.1
3.24.1
–0.8
–1.5
2.6
2.8
4.9
6.6
0.1 0.2 0.1 0.1 0.3 0.3 0.2 0.21.4
4.25.8
1.91.5
4.8 5.16.8 6.7
–1.2 –1.7–4.0
–5.5
1.2
–1.9 –1.3 –2.2–4.3
0.2
2.72.0
–3.5
2.8 3.24.1
4.8
2.6
©20
18 A
sian
Prod
uctiv
ity O
rgan
izat
ion

80
5 Productivity
Figure 71 Decomposition of Labor Productivity Growth by Country and Region_Average annual growth rate of constant-price GDP per hour worked and contributions in 1970–2016
Source: APO Productivity Database 2018. Note: Cambodia is not included in CLMV and ASEAN before 1993.
Non-IT capital deepening IT capital deepeningTFP Labor productivity
APO20%
–1
0
1
2
3
4East Aisa%
–2
–1
1
0
2
3
4
5
6
7
US
Singapore%
–2
0
2
4
6
%
–1
0
2
1
3
1970–1975
1975–1980
1980–1985
1985–1990
1990–1995
1995–2000
2000–2005
2010–2016
2005–2010
1970–1975
1975–1980
1980–1985
1985–1990
1990–1995
1995–2000
2000–2005
2010–2016
2005–2010
1970–1975
1975–1980
1980–1985
1985–1990
1990–1995
1995–2000
2000–2005
2010–2016
2005–2010
1970–1975
1975–1980
1980–1985
1985–1990
1990–1995
1995–2000
2000–2005
2010–2016
2005–2010
1970–1975
1975–1980
1980–1985
1985–1990
1990–1995
1995–2000
2000–2005
2010–2016
2005–2010
Asia 24%
–1
0
2
1
3
4
5
6
ASEAN6%
–4
–2
0
2
4
6
South Asia%
–1
0
2
1
3
5
4
6
1970–1975
1975–1980
1980–1985
1985–1990
1990–1995
1995–2000
2000–2005
2010–2016
2005–2010
1970–1975
1975–1980
1980–1985
1985–1990
1990–1995
1995–2000
2000–2005
2010–2016
2005–2010
Philippines%
–8
–6
–4
–2
0
2
4
1970–1975
1975–1980
1980–1985
1985–1990
1990–1995
1995–2000
2000–2005
2010–2016
2005–2010
%
–2
0
6
8
4
2
Vietnam
1970–1975
1975–1980
1980–1985
1985–1990
1990–1995
1995–2000
2000–2005
2010–2016
2005–2010
Nepal%
–3
–2
–1
0
1
2
3
4
1970–1975
1975–1980
1980–1985
1985–1990
1990–1995
1995–2000
2000–2005
2010–2016
2005–2010
1970–1975
1975–1980
1980–1985
1985–1990
1990–1995
1995–2000
2000–2005
2010–2016
2005–2010
Pakistan%
–1
0
3
2
1
4
6
5
%
–2
–1
0
1
2
3
4
6
5
Sri Lanka
1970–1975
1975–1980
1980–1985
1985–1990
1990–1995
1995–2000
2000–2005
2010–2016
2005–2010
1970–1975
1975–1980
1980–1985
1985–1990
1990–1995
1995–2000
2000–2005
2010–2016
2005–2010
Thailand%
–4
–2
0
2
4
6
8
ASEAN%
–4
–2
0
2
4
6CLMV%
–2
0
2
4
6
8
1970–1975
1975–1980
1980–1985
1985–1990
1990–1995
1995–2000
2000–2005
2010–2016
2005–2010
1970–1975
1975–1980
1980–1985
1985–1990
1990–1995
1995–2000
2000–2005
2010–2016
2005–2010
–0.1
0.1 0.1 0.1 0.1 0.1 0.1
1.72.5 2.9 2.6
1.8 1.7
1.1
1.3 1.1
–1.8–2.8
–0.6
1.2
0.4 1.1
–0.5
0.5 0.2
0.1
–0.2
2.4
3.8
2.22.8
0.7
1.91.4
0.1 0.1 0.1 0.10.41.4 1.3 1.8 1.9 1.7
0.5
–0.3 –0.8
0.1
2.73.9
2.4 1.9
0.8
1.9
0.22.90.5
4.1
5.2
4.23.8
2.62.5
2.2
0.0
0.10.1 0.1 0.1 0.4
0.5 0.2 0.10.8
2.8
1.7
–0.3
1.0 1.90.3 0.4 1.1
0.3
–0.5
–6.8
3.0
–0.5 0.1
1.0 1.92.41.2 2.4
–5.0
2.8
0.5
2.3 1.82.4
3.6
0.4 0.3 0.5 0.6 0.6 0.6 0.6 0.2 0.4
5.1
2.7
4.1
0.5 1.1
2.91.6
–0.9
1.0
–1.3
0.3
–1.3
2.21.9
–0.5
1.4
1.5
–0.3
4.3
3.2 3.3 3.4 3.63.1
3.7
0.81.1
0.1 0.1 0.1 0.1 0.3 0.3 0.11.2
2.9 2.8
–0.2
0.5
–1.4
2.13.3 4.2
-–0.1
0.71.8
0.5
4.0 2.4
2.4
1.9 0.3
1.1
3.6
4.7
0.2
4.5
1.1
4.85.5
4.5
0.10.1
0.2 0.3 0.6 0.4 0.2 0.4 0.42.0
–0.1
2.4 1.8
5.3 3.5
0.7 0.72.2
1.0
0.9
0.5
4.2
0.3
–2.7
4.2
1.3
1.93.1
0.9
3.1
6.36.2
1.2
5.2
2.4
4.5
0.1 0.1 0.1 0.2 0.2 0.3 0.3
–1.1 –0.3 –0.5
0.42.3
4.85.8
4.2 4.1
–0.8
0.9
3.10.9
3.3
–0.2
1.4
–1.6
1.0
–1.9
0.6
2.7
1.4
5.74.7
7.3
2.8
5.5
0.20.2 0.4 0.4 0.4 0.7 0.5 0.4 0.1
1.0
0.30.4 0.3 0.3
0.2 0.8 1.0
–0.2
0.4
0.7
1.00.7 1.0
1.6 0.9
0.6
1.61.1
1.81.5 1.7
2.52.2
1.4
0.5
0.3 0.2 0.2 0.3 0.2 0.2 0.2 0.1 0.1
3.8
2.21.6 1.4 1.8
1.40.7 1.0
1.4
–0.8 –0.2
0.8
2.10.8
0.3
2.02.0
1.5
3.2
2.2
2.6
3.8
2.8
2.0
2.9 3.2 3.0
0.2 0.1 0.2 0.3 0.2 0.2 0.2 0.2 0.2
3.5
2.21.3 1.5
2.1 1.6 1.32.6 3.0
–1.0 –0.2
1.0
1.92.1
0.92.6
3.11.6
2.72.12.5
3.74.3
2.7
4.1
5.9
4.8
0.4 0.2 0.2 0.4 0.2 0.2 0.3 0.2 0.2
4.4
2.11.1 1.5 1.9 1.3 1.3
2.7 2.9
–1.9
0.71.7
2.02.3
1.42.7
3.82.1
2.8 3.0 3.0
3.94.5
3.0
4.2
6.7
5.2
0.1 0.1 0.1 0.2 0.20.7
0.9 1.0 1.2 1.2 1.5 1.4
3.03.5
–0.5
0.2
2.12.7
1.92.1 2.6
2.71.3
0.2
1.1
3.1
3.9
3.1
3.84.2
5.9
5.0
0.1 0.1 0.2 0.2 0.3 0.3 0.3 0.3 0.31.7 2.5
3.1
2.0
4.03.2
1.5 1.12.7
1.20.8
–2.8
1.9
0.9
–3.0
1.90.9
0.73.03.4
0.5
4.1
5.2
0.5
3.7
2.3
3.7
0.1 0.20.2
0.2 0.3
0.30.3 0.3 0.3
1.9 2.4
3.1
2.0
4.1 3.3
1.2 0.92.4
1.5 0.8
–3.0
2.3
0.9
–3.2
1.81.0
0.83.4 3.4
0.3
4.55.3
0.4
3.32.2
3.5
0.1 0.10.1 0.1 0.2 0.2 0.3 0.3–0.8 0.7 1.20.9 2.0
4.55.2
4.75.1
–0.3
0.81.0
–1.9
2.4
–0.6
0.8
–1.6–0.6
–1.1
1.62.3
–0.9
4.5 4.1
6.3
3.3
4.8
©20
18 A
sian
Prod
uctiv
ity O
rgan
izat
ion

5
81
5.4 Sources of Labor Productivity Growth
This edition of the Databook defines labor inputs as the simple sum of the economy-wide hours worked. The estimates of number of workers and average hours per worker have improved in this edition (see Appendix 5 for the details, p. 137). In productivity analysis, however, labor inputs are expected to be quality adjusted in order to reflect workforce heterogeneity, as recommended in the SNA 2008 (United Nations, 2009). In the stage of high economic growth, labor quality growth can be a significant factor as well as the increase in hours worked, improvement in education attainment of workers, and a shift from the self-employed (e.g., in agricul-ture or informal service sectors) to the employees (e.g. in manufacturing or formal service sectors).
Figure B4.1 shows the contributions of labor quality and hours worked, to economic growth in Japan and the US from 1955 to 2012, by Jorgenson, Nomura, and Samuels (2016). Although the US sustained a steady pace of labor quality contribution of 0.1–0.3% on average per year to economic growth over a half century, the con-tributions of labor quality were substantially changed in the catching up process of the Japanese economy to the US. The labor quality improvement had a significant contribution to growth by 0.7–1.1% on average per year during 1955–1980. These impacts have decreased, but labor quality changes remain factors that enhanced the growths by 0.3–0.4% for two decades after 1990, even when Japan’s hours worked began to decrease.
The TFP growth measured in Chapter 5 includes the contributions of labor quality improvements by defini-tion. On the analogy of the experiences of the Japanese economy, it may be reasonable that the current esti-mates of TFP growth include the contributions of labor quality improvements, about 0.5–1.0% per year in the Asian countries. Although it is a very data-demanding exercise, our project has spent several years collecting the official data on employment and wage/incomes by type of labor categories for the Asian countries. This data was necessary to develop harmonized measures of quality adjusted labor input (QALI) and to identify an impact of labor quality improvement in TFP growth. The comprehensive database we are developing is called as Asia QALI. The number of workers, hours worked per worker, and hourly wages are cross-classified by gender, education attainment, age, and employment status in Asia QALI Database.
Figure B4.2 presents the time-series comparisons of the average schooling years observed in terms of workers since 1970, based on Asia QALI Database. Japan is the leading country (13.2 years), followed by Korea (13.1 years), the ROC (13.0 years), Hong Kong (12.3 years) and Mongolia (12.0 years). The reverse reflects the dif-ferences in employment rate of highly educated persons, e.g. higher rate of unemployment of educated persons in Korea. Although there is a significant range in 2016 from 4.1 years (Bhutan) to 13.2 years ( Japan), the aver-age years have been increased since 1970 in almost all economies in Asia.
Although we are still examining the data quality of the Asia QALI Database, Nomura and Akashi (2017) provides the first report on analyzing labor inputs in six South Asian countries. Figure B4.3 shows the estimated
Box 4 Labor Quality Changes
Figure B4.1 Contributions of Labor Quality to Growths in Japan and the US _Average annual growth rates of labor quality and hours worked, 1955–2012
Source: Jorgenson, Nomura, and Samuels (2016).
0.0
−0.6
0.6
1.2
1.8
2.4
1955–60 1960–65 1965–70 1970–75 1975–80 1980–85 1985–90 1990–95 1995–2000 2000–05 2005–10 2010–12
%
0.9
0.3
1.0
0.20.7
0.0
1.1
0.2
0.8
0.20.6
0.20.1
0.4
0.50.2
0.4
0.40.1
0.3 0.2 0.3 0.3
1.7
0.0
0.6
0.7
1.3
0.6
−0.4
0.2
0.6
1.2 0.40.6
−0.3
0.4
−0.6
1.01.0
−0.3−0.1
−0.3
0.00.30.2
0.8
Labor qualityHours worked
−0.4JapanU
S
continued on next page >
©20
18 A
sian
Prod
uctiv
ity O
rgan
izat
ion
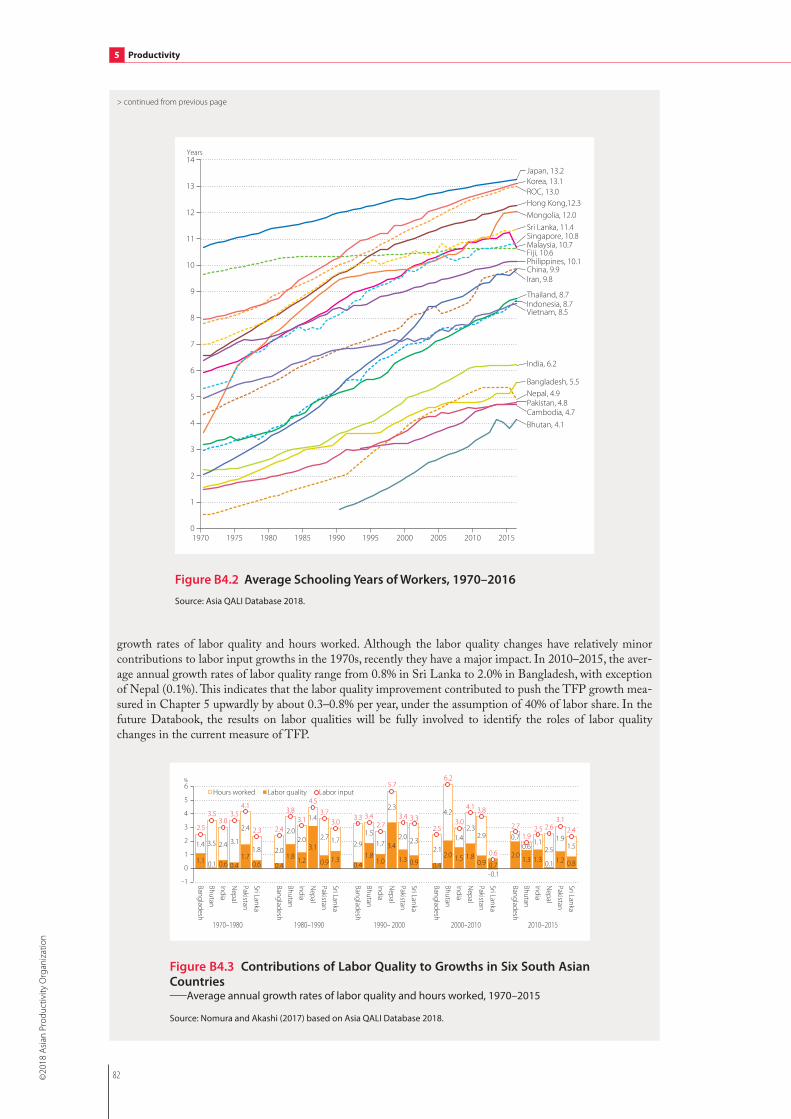
82
5 Productivity
growth rates of labor quality and hours worked. Although the labor quality changes have relatively minor contributions to labor input growths in the 1970s, recently they have a major impact. In 2010–2015, the aver-age annual growth rates of labor quality range from 0.8% in Sri Lanka to 2.0% in Bangladesh, with exception of Nepal (0.1%). This indicates that the labor quality improvement contributed to push the TFP growth mea-sured in Chapter 5 upwardly by about 0.3–0.8% per year, under the assumption of 40% of labor share. In the future Databook, the results on labor qualities will be fully involved to identify the roles of labor quality changes in the current measure of TFP.
> continued from previous page
Figure B4.2 Average Schooling Years of Workers, 1970–2016
Source: Asia QALI Database 2018.
0
1
2
3
4
5
6
7
8
9
10
11
12
13
14
1970 1975 1980 1985 1990 1995 2000 2005 2010
Years
2015
Bangladesh, 5.5
Bhutan, 4.1Cambodia, 4.7
China, 9.9
Fiji, 10.6
ROC, 13.0Hong Kong,12.3
India, 6.2
Indonesia, 8.7
Iran, 9.8
Japan, 13.2Korea, 13.1
Malaysia, 10.7
Mongolia, 12.0
Nepal, 4.9Pakistan, 4.8
Philippines, 10.1
Singapore, 10.8Sri Lanka, 11.4
Thailand, 8.7
Vietnam, 8.5
Figure B4.3 Contributions of Labor Quality to Growths in Six South Asian Countries _Average annual growth rates of labor quality and hours worked, 1970–2015
Source: Nomura and Akashi (2017) based on Asia QALI Database 2018.
−1
0
1
2
3
5
4
6
1970–1980 1990– 20001980–1990 2010–2015
%
2000–2010
Bangladesh
Bhutan
India
Nepal
Pakistan
Sri Lanka
Bangladesh
Bhutan
India
Nepal
Pakistan
Sri Lanka
Bangladesh
Bhutan
India
Nepal
Pakistan
Sri Lanka
Bangladesh
Bhutan
India
Nepal
Pakistan
Sri Lanka
Bangladesh
Bhutan
India
Nepal
Pakistan
Sri Lanka
Hours worked Labor quality Labor input
1.10.4 0.4 0.4
2.01.4
2.02.9
2.1
0.7
0.11.8 1.8 2.0
1.3
3.5
2.0 1.5
4.2
0.6
0.6 1.2 1.0 1.5 1.3
2.42.0 1.7
1.4 1.1
0.4
3.1 3.41.8
0.1
3.1
1.42.3
2.3
2.51.7
0.9 1.3 0.9 1.2
2.42.7 2.0 2.9 1.9
0.61.3 0.9 0.7 0.8
1.81.7 2.3
−0.1
1.5
2.5
3.53.0
3.54.1
2.3 2.4
3.83.1
4.5
3.73.0
3.3 3.42.7
5.7
3.4 3.32.5
6.2
3.0
4.1 3.8
0.6
2.71.9
2.5 2.63.1
2.4
©20
18 A
sian
Prod
uctiv
ity O
rgan
izat
ion

5
83
5.5 Energy Productivity
5.5 Energy Productivity
In the Asia30, in order to produce 43% of the world output in 2015, 43% of world energy was consumed and 50% of world CO2 was emitted (Figure 72), compared to 17%, 12%, and 10% in the EU28. This implies that Asia has lower energy productivity (defined as a ratio of output per energy consumption) and higher carbon intensity of energy at the aggregate level, compared to the EU28. It is key to improve en-ergy productivity and carbon intensity in the growing econ-omies of Asia in order to re-duce CO2 emissions in the world in the long run.
The average level of energy pro-ductivity in Asia30 is almost equivalent to the US level and inferior to the EU15 by 25% in 2015. There is considerable di-versity in energy productivity among countries. Figure 73 compares energy productivity trends of Japan, China, Asia30, and EU15 in 2015, relative to the US. Although Japan’s en-ergy productivity level is con-stantly higher in the whole periods of our observation, it is almost equivalent to the EU15 from the late 2000s. The level of Chinese energy productivity was only 20% of that of the US in 1970. However, China succeeded to improve en-ergy productivity along with the economic growth since the 1990s, closing the gap to the US as 22% in 2015.
Table 20 in Appendix 9 (p. 160) presents the snapshot level comparisons of energy productivity since 1980. The energy productivity measure reflects not only the difference in energy efficiencies of industries and households, but also the difference in industry and production structure of the economy. Thus, the energy productivity at the aggregate level is highly dependent on the development stage of the econo-my. Figure 74 placed countries on the two partial productivity indicators of labor and energy, measured in 2015. Less-developed countries with lower labor productivity (such as the Philippines, Sri Lanka, and Bangladesh) tend to have higher energy productiv-ity. One of the effective strategies to improve labor productivity in such countries is to expand the manu-facturing sector (as shown in Figure 77 in Section 6.1, there is a positive correlation between the TFP growth and the manufacturing share). This frequently follows the deterioration in energy productivity. As a next stage of economic growth, well-developed countries will be able to pay more attention to improving energy productivity by abolishing implicit or explicit subsidies on energy prices, especially in electricity prices, and levying heavier taxes on energy consumptions. The C-shape dynamics found between labor
Figure 72 Asia in World Energy Consumption and CO2 Emission_Share of final energy consumption and CO2 emission in 2015
Sources: IEA, CO2 Emissions from Fuel Combustion 2017; IEA, Energy Balances of OECD Coun-tries 2017; IEA, Energy Balances of Non-OECD Countries 2017.
Japan
APO2019%
Asia3050 %
OtherAsia3 %
EU158 %
Others21 %
Japan
Energy Consumption CO2 Emission
APO2020 %
Asia3043%
Asia46 %
EU1510 %EU28
12 %
Others26 %
OtherAsia3 %
EU2810 %
India
Asia53 %
India
China ChinaUS
16 %US16 %
0
25
50
75
100
125
150
175
225
200
US=100
1970 1975 1980 1985 1990 1995 2000 2005 2010 2015
EU15
Aisa30
US
Japan
China
Figure 73 Energy Productivity of Japan, China, and the EU, Relative to the US_Index of GDP at constant market prices, using 2011 PPP, per energy consumption in 1970–2015
Sources: Official national accounts in each country, including author adjustments; IEA, Energy Balances of OECD Countries 2017; IEA, Energy Balances of Non-OECD Countries 2017.
©20
18 A
sian
Prod
uctiv
ity O
rgan
izat
ion

84
5 Productivity
and energy productivities corresponds to the so-called Environmental Kuznets curve, as an inversed U-shape relationship between environmental quality (at the y-axis) and economic development (at the x-axis).
Figure 75 decomposes the sources of CO2 emission growth (from fuel combustion) in the Asian countries during 2000–2015, based on the so-called Kaya identity. The growth in CO2 emissions is decomposed to three components: changes in real GDP; carbon intensity of energy; and en-ergy intensity of GDP (the inverse of en-ergy productivity). In many countries, the production expansion (real GDP growth) is the most significant factor to explain the growth of CO2 emissions. With an exception of Thailand and Iran, energy productivity has been improved in many Asian countries in this period. However, these improvements are not enough to offset an expansion of energy consump-tion (except in Hong Kong and Japan).
On the other hand, in many Asian economies, the carbon intensity of energy has increased, mainly due to an expansion of coal consump-tion. Japan achieved some im-provement in energy efficiency in this period, but the carbon intensity of energy had to be in-creased due to a very low opera-tion rate of nuclear power plants after the Fukushima Daiichi nuclear disaster in March 2011.79 Singapore realized a significant improvement in car-bon intensity of energy by the shift from oil to LNG in elec-tricity power generation.80 This helped to offset the increases in CO2 emission accompanied by strong economic growth, re-gardless of very minor improve-ment in energy productivity. In this period, a decoupling in the growths of GDP and CO2 emission is apparent in a few developed countries, especially
10
20
30
40
50
60
70
0
Labor productivityUS dollar (as of 2015) per hour worked
0 5 10 15 20Energy productivity
Thousands of US dollars (as of 2015) per toe
3025
BangladeshCambodia
ROC
India
Indonesia
Iran
Japan
Korea
Malaysia
PakistanPhilippines
Singapore
Sri Lanka
Thailand
Vietnam
China
US
EU15
Nepal
Australia
Turkey
Mongolia
Figure 74 Labor Productivity and Energy Productivity_Per-hour labor productivity level and energy productivity level in 2015
Sources: Official national accounts in each country, including author adjust-ments; IEA, Energy Balances of OECD Countries 2017; IEA, Energy Balances of Non-OECD Countries 2017; APO Productivity Database 2018.
GDP Carbon intensity of energy Energy intensity of GDP CO2
−6
−4
−2
0
2
4
6
8
10
12%
Cambodia
VietnamBangladeshChinaM
yanmar
IndiaM
alaysiaM
ongoliaSri LankaN
epalIranIndonesiaThailandTurkeyPakistanPhilippinesKoreaRO
CAustraliaH
ong KongCanadaSingaporeJapanU
SG
ermany
EU28
EU15
FranceU
KItaly
7.4 6.7
5.7
9.2
5.8 6.9
5.1
7.5
5.4 3.5 3.9
5.2 4.0
4.9 4.1 5.0
3.9 3.6 3.0
3.6 2.0
5.2
0.8 1.8 1.1 1.3 1.1 1.1
1.7
−0.1
4.6
3.3 4.0
1.2
3.5 1.6
0.7
−0.7
2.1
1.5
−0.3
1.6
−1.2 −0.2
0.1
1.4
−0.1 −1.3 −0.2
0.9
0.2
−4.5
0.8
−0.7 −0.3 −0.7 −0.7 −1.0 −0.3 −1.2
−2.8 −1.1 −1.6
−3.3 −2.9 −2.8 −1.4
−2.5 −3.4
−1.1
0.2
−3.2
0.4
−1.7 −1.3
−3.6 −1.8
−1.3 −1.9
−3.9
−1.7
−0.4
−1.6
−1.9 −1.6
−1.7 −1.7
−1.8
−3.1
−0.7
9.2
8.9
8.1
7.2
6.4
5.6
4.3 4.3
4.1
3.9
3.8
3.7
3.2
3.0
2.9
2.8
2.0
1.0
0.9
0.6
0.5
0.4
0.0
−0.8
−0.8
−1.1 −1.2
−1.7 −1.8 −2.0
Figure 75 Sources of CO2 Emission Growth_Average annual growth rate of CO2 emission in 2000–2015
Sources: Official national accounts in each country, including author adjustments; IEA, En-ergy Balances of OECD Countries 2017; IEA, Energy Balances of Non-OECD Countries 2017; IEA, CO2 Emissions from Fuel Combustion 2017.
©20
18 A
sian
Prod
uctiv
ity O
rgan
izat
ion

5
85
5.5 Energy Productivity
in the EU. However, this may be due mainly to the shift in energy-consuming production to the Asian countries, in which more energy is required and more CO2 is emitted to produce the same output. For sustainable growth of the world economy, improvements in energy productivity and carbon intensity of energy are recognized as one of the important policy targets in Asia.
79: According to the FEPC (The Federation of Electric Power Companies of Japan), the rate of utilized capacity of nuclear power plants was 67% in the fiscal year 2010 (the share of nuclear in power generation was 29%), but after the disaster, 24% in 2011, 3.9% in 2012, 2.3% in 2013, 0.0% in 2014. A few plants were reactivated in 2015 and the utilization rate was recovered slightly to 2.5%.
80: In Singapore, the share of natural gas in electricity power generation reached to 95% in 2014 from 19% in 2000, compared to the decrease in the share of oil in power generation from 80% in 2000 to 0.7% in 2014 (IEA, Energy Balances of Non-OECD Coun-tries 2016).
Box 5 Productivity of City
continued on next page >
International comparison provided in the Databook is based on an economic territory of each country. Al-though the two global cities in Asia, Singapore and Hong Kong, achieved much higher per capita GDP (Table 12 in Appendix 9, p. 150) and per-worker labor productivity (Figure 45 in Section 5.1, p. 55), this may be a result of the cities fully incorporating benefits of an urban environment, e.g., economies of agglomeration. Singa-pore’s population is 5.5 million, which is only 4.4% of that in Japan, 10.8% of Korea, and 0.4% of China. It may be more comparable to Tokyo metropolitan (13.7 million), Seoul city (9.9 million), Beijing (北京) (21.7 mil-lion) and Shanghai (上海) (24.2 million). Comparing productivity among cities may provide a better picture for understanding a productivity gap among countries, which consist of a number of cities with different scales.
The KEO started to develop a database on productivity of city in Asia (PDB-City Database). The PDB-City Database 2018 covers 54 cities in total, increased by 3 cities from last year version of the database. The sizes of
Figure B5.1 Population by City in 2016
Source: Population census in each country; PDB-City Database 2018.
Peshawar
Kuwait cityAbu Dhabi
Riyadh
Lahore
PeshawarDoihi
Karachi
Mumbai
ChennaiBangalore
Colombo
Bangkok
Jakarta
Kuala LumpurSingapore
Kolkata
Ho Chi Minh
Hanoi
ChengduHangzhou
GuangzhouShanghai
Taipei CityTaichungKaohsiung
Shenzhen
Manila
Ulaanbaatar Haerbin
Beiiing
QingdaoDaegu
Seoul
Wunan Fukuoka
Busan
Sapporo
SendaiYokohama
TokyoNagoya
Osaka
Tianjin
Hong Kong
©20
18 A
sian
Prod
uctiv
ity O
rgan
izat
ion

86
5 Productivity
> continued from previous page
0
5
10
15
20
25
30
0
20
40
60
80
100
120
140
180
160
Thousands of US dollars (as of 2016) Miliions of persons
Labor productivity Per capita GDP Population
New
York (US)
Los Angeles (US)
Singapore (SIN)
Tokyo ( 東京
)(JPN)
Paris (FRA)H
ong Kong (HKG
)Taipei City (台
北)(RO
C)Sendai (仙
台)(JPN
)N
agoya ( 名古屋
)(JPN)
Kaohsiung ( 高雄
)(ROC)
Taichung ( 台中
)(ROC)
Kobe ( 神戸
)(JPN)
Osaka (大
阪)(JPN
)Toronto (CAN
)Yokoham
a (横浜
)(JPN)
Moscow
(RUS)
Fukuoka (福岡
)(JPN)
Kuwait City (KW
T)Seoul (KO
R)G
uangzhou ( 広州
)(CHN
)Istanbul (TU
R)Sapporo ( 札
幌)(JPN
)Bangkok (TH
A)U
laanbaatar (MG
L)W
uhan (武漢
)(CHN
)Riyadh (SAU
)Kuala Lum
pur (MAL)
Shenzhen (深圳
)(CHN
)Beijing ( 北
京)(CH
N)
Shanghai (上海
)(CHN
)Tianjin (天
津)(CH
N)
Ankara (TUR)
Busan (KOR)
Delhi (IN
D)
Hangzhou ( 杭
州)(CH
N)
Qingdao ( 青
島)(CH
N)
Daegu (KO
R)Chengdu (成
都)(CH
N)
Manila (PH
L)H
aerbin (哈爾濱
)(CHN
)Colom
bo (SRI)H
o Chi Minh (VIE)
Jakarta (IDN
)M
umbai (IN
D)
Chennai (IND
)H
anoi (VIE)Bangalore (IN
D)
Kolkata (IND
)Peshaw
ar (PAK)Lahore (PAK)H
yderabad (PAK)Faisalabad (PAK)Raw
alpindi (PAK)Karachi (PAK)
10.1
5.5
15.9
12.5
7.3
2.7
1.1 2.6 2.8 2.7
1.6
3.5 6.1
3.4
12.1
1.7
3.0
9.9
14.0 14.4
2.0
15.6
1.4
10.8
5.5
1.7
11.9
21.7
24.2
15.6
5.2
3.5
17.9
9.2
9.2
2.5
14.0 12.9
9.6
2.0
8.2
10.1
19.1
9.5
7.4
14.4
1.8
10.3
1.7 3.1
2.0
14.4
14.2
140
128
112
104 98 95
86 85 84 83 82 81 80 77
74 69 69
66 64 62 61 59 56 54 53 53 52 52 51 49 48 45
41 41 41 38 34 31 30 28 26
21 17 17 15
12 11
8 5 4 4 3 3
87.4 81.2
56.3
51.3
50.3 45.2
39.6 43.2
39.5
40.6 35.2
44.2 41.0
31.4
41.2
32.5
54.1
34.0 37.9
21.9 26.6
20.0 18.1
27.4
28.3 26.4
40.5
29.3
28.8 28.4
16.6
21.6
13.9
30.5 26.9
19.0 21.5
11.6 15.7
12.6
13.1 9.8 6.3
4.1 7.6
3.3
148
99.2
Figure B5.2 Per-Worker Labor Productivity Levels by City_GDP at constant basic prices per worker in 2015/2016, using 2011 PPP
Unit: Thousands of US dollars (as of 2016).Sources: Official national accounts, Population census and Labor force survey in each country, including author adjustments; The Brook-ings Institution, Global Metro Monitor 2014: PDB-City Database 2018. Note: The observation periods are 2011 for Colombo, 2014 for Ankara, Bangalore, Bangkok, Chennai, Istanbul, Jakarta, Kaohsiung, Kol-kata, Kuala Lumpur, Kuwait City, Manila, Moscow, Mumbai, Paris, Riyadh, Taichung, and Toronto, and 2015 for Busan, Daegu, Delhi, Fais-alabad, Fukuoka, Hanoi, Ho Chi Minh, Hyderabad, Karachi, Kobe, Lahore, Nagoya, Osaka, Peshawar, Rawalpindi, Sapporo, Sendai, Seoul, Singapore, Tokyo, and Yokohama.
cities are presented Figure B5.1. Figure B5.2 gives the preliminary estimates on per-worker labor productivi-ties in 2015/2016 among Asian cities with populations of more than 3 million, compared to some large cities in non-Asian countries.
The average per-worker labor productivity level in Tokyo (東京), which is defined as Tokyo metropolitan with population of 15.9 million (not as the greater metropolitan area with 37.0 million), is 112,000 US dollars. This is 42% higher than the country average of Japan (78,700) shown in Figure 45 in Section 5.1. This indicates that Tokyo’s productivity is 13% lower than that in Singapore (128,000). This productivity gap between these two cities is smaller than that in terms of the per capita GDP gap (31% lower), reflecting higher employment rate in Singapore. Tokyo is followed by Hong Kong (香港) and Taipei (台北), whose productivities are 13% and 15% lower than Tokyo. The productivity in Osaka (大阪), which is the largest city of West Japan, is behind those in Sendai (仙台) and Nagoya (名古屋) in terms of labor productivity. Seoul, which is defined as Seoul city with a population of 9.9 million (not as the greater metro area with 24.6 million), is in the 14th position in Asia on this chart.
In this ranking, a number of Chinese cities emerged to the middle class of the chart. Compared to the country average of Chinese per-worker labor productivity which is only 20% of the Singapore level (Figure 45), the productivities in Guangzhou (広州) as the top position, Wuhan (武漢), Shenzhen (深圳), Beijing (北京), Shanghai (上海), and Tianjin (天津) are twice larger than the country average of China and reached to 38–50% of the Singapore level, regardless of these cities’ larger populations, which are 14.0, 10.8, 11.9, 21.7, 24.2, and 15.6 million, respectively. These Chinese cities are followed by Busan (Korea), Delhi (India), Manila (Philip-pines), Colombo (Sri Lanka), Ho Chi Minh (Vietnam), Jakarta (Indonesia), and Peshawar (Pakistan). The current PDB-City Database is still work-in-progress, it is planned to be further revised and expanded to cover smaller cities in Asia.
©20
18 A
sian
Prod
uctiv
ity O
rgan
izat
ion

6
87
6.1 Output and Employment
Industry decomposition gives insight into the source of a country’s economic dynamics which, in turn, determines its overall performance and characteristics, its strengths, and its vulnerabilities. On one hand, a broad industry base reflects diversification and sophistication in the economy, and in turn is more re-sourceful in weathering economic shocks. On the other hand, reliance on a narrow industry base leaves an economy more vulnerable to shocks and more susceptible to volatility. The different composition of eco-nomic activities among countries is also one of the main sources of the huge gap in average labor produc-tivity at the aggregate level, as observed in Chapter 5. By analyzing the industry structure of the Asian economies, one can clearly trace the path of economic development and identify countries’ respective stages based on their characteristics.81
6.1 Output and Employment
Table 1 in Section 3.2 (p. 28) introduced a country grouping according to stages of development from the point of the view of the long run economic growth from 1970 (as measured by per capita GDP relative to the US). Table 2 regroups countries based on the same set of criteria as in Table 1, but applies it to 2016 income levels and focuses on more recent catch up to the US from 2000.
Countries at the lower rungs of the development ladder tend to have a greater agriculture sector as a share of value added.82 Figure 76 shows the industry composition of the Asian economies and regions in 2016,83
6 Industry Perspective
81: Constructing the industry origins of labor productivity growth requires confronting a large volume of data from different sources. Issues of data inconsistency arising from fragmentation of national statistical frameworks can present enormous hurdles to researchers in this field. The industry data in this chapter is mainly based on official national accounts. Where back data is not available, series are spliced together using different benchmarks and growth rates. Data inconsistencies in terms of concepts, cov-erage, and data sources have not been fully treated although levels of breakdown are deliberately chosen to minimize the poten-tial impact of these data inconsistencies. In this sense, the industry data in the APO Productivity Database should be treated as a work in progress and it is difficult to advise on data uncertainty. These data will be further developed and examined in the near future. Readers should bear these caveats in mind in interpreting the results.
Table 2 Country Groups Based on the Current Economic Level and the Pace of Catching Up_Level and average annual growth rate of per capita GDP at constant market prices, using 2011 PPP
Sources: Official national accounts in each country, including author adjustments.Note: The annual catch-up rates are based on the data during 2000–2016.
Per capita GDP level in 2016,
relative to the US
Average annual rate of catch-up to the US during 2000–2016
(C6)<–1%
(C5) –1% <–<–< 0%
(C4) 0% <–<–< 1%
(C3) 1% <–<–< 2%
(C2) 2% <–<–< 3%
(C1) 3% <–<
(D1) 100% <–
Brunei, Kuwait,
UAEQatar Singapore Hong Kong
(D2) 70% <–< - <100%
Bahrain, Oman
EU15, JapanAustralia,
Saudi ArabiaROC
(D3) 40% <–< - < 70% EU28
Korea, Malaysia,
Turkey
(D4) 20% <–< - < 40% Iran
Indonesia, Thailand
China, Mongolia, Sri Lanka
(D5) 10% <–< - < 20% Fiji Philippines
Bhutan, India,
Lao PDR, Vietnam
(D6) < 10%
Nepal, Pakistan
Bangladesh, Cambodia, Myanmar
©20
18 A
sian
Prod
uctiv
ity O
rgan
izat
ion

88
6 Industry Perspective
and indicates a broad, negative correla-tion between the share of the agriculture sector and the relative per capita GDP against the US.84 The changes in the in-dustry shares of value added are present-ed Table 21 in Appendix 9 (p. 161) from 1970. Ten of the Asian countries com-pared have an agriculture sector ac-counting for over 15% of total value added. They all have a relative per capita GDP that is below 20% of the US level, grouped in D5 and D6 in Table 2. Note also how finance, real estate, and busi-ness activities grow in importance as one moves up income levels. The finance sec-tor is especially prominent in Hong Kong (39%), Singapore (33%), and the US (33%). Mining appears to be what defines oil-exporting countries, typically accounting for over 20% of total value added, except in Bahrain (12%), Iran (9%), and the UAE (17%), which are countries that have managed to diver-sify mining. Finance is the biggest sector in Bahrain and the UAE, ac-counting for 23% and 20% of total value added, respectively.
To foster productivity in the less- developed countries, it is important to adopt existing technologies from the advanced economies. In this view of as-similation, manufacturing is a key sector in driving countries to make a leap in economic development. It accounts for 20% more of total value added in eight of the 30 Asian countries compared in Figure 76. Among these, manufacturing is the largest sector in the ROC, Korea, China, and Thailand equivalent to around 30% of total value added, while in Malaysia and Indonesia it accounts for one-fifth or more. Figure 77 shows a positive correlation between our estimates of TFP growth during 2000–2016 in Chapter 5 and the shares of manufacturing in 2016. Outlier countries are Hong Kong and Mongolia85
82: In Chapter 5, GDP is adjusted to be valued at basic prices (if the official estimates at basic prices are not available, they are our estimates). However, the definition of GDP by industry differs among countries in this chapter due to data availability. GDP is valued at factor cost for Fiji and Pakistan; at basic prices for Bangladesh, Cambodia, Hong Kong, India, Korea, the Lao PDR, Mongolia, Nepal, Singapore and Vietnam; at producers’ prices for Iran, the ROC and the Philippines; and at market prices for Indonesia, Japan, Malaysia, Sri Lanka, and Thailand.
83: The nine industries are 1–agriculture; 2–mining; 3–manufacturing; 4–electricity, gas, and water supply; 5–construction; 6–whole-sale and retail trade, hotels, and restaurants; 7–transport, storage, and communications; 8–finance, real estate, and business activi-ties; and 9–community, social, and personal services. See Appendix 10 (p. 166) for the concordance with the ISIC, Revisions 3 and 4.
84: The regional averages as industry share of value added are based on a country’s industry GDP, using the PPPs for GDP for the whole economy without consideration of the differences in relative prices of industry GDP among countries.
1. Agriculture 2. Mining3. Manufacturing 4. Electricity, gas, and water supply5. Construction6. Wholesale and retail trade, hotels, and restaurants7. Transport, storage, and communications8. Finance, real estate, and business activities9. Community, social, and personal services
10 20 30 40 50 60 70 80 90 1000 %
SingaporeHong KongQatarBahrainKuwaitUAE
JapanBruneiGCCROCOmanKoreaSaudi ArabiaAustraliaEast AsiaTurkeySri LankaThailandMalaysiaChinaAsia30PhilippinesAsia24ASEAN6APO20ASEANIranIndonesiaMongoliaBangladesh
IndiaBhutanSouth AsiaVietnamCLMVMyanmarPakistanLao PDRCambodiaNepal
US
Fiji
1
1 1 1 1 2 2 2 2 3 3
7 7 8 9 9 9 9 10 10 10 11 11
13 13 13
15 15 17 17 17 18 20
21 25 25
26 29
29 12
34 17
1
42 23
27
22 8
2 1
3 3
9 3 4
1 3
5 3
6 9
7 22
2 1
2
5 2
9 15
33
2 12
2 1
19
9 18
6 9
12 21
11 11
32 9
29 13
6 27
19 17
27 23
28 22
20 23
22 19
21 14 20
7 18
14 14 8 14
16 13
8 13
8 17
6
1 1
1 1
3 4
2 3
1 2
2 2
3 2
3 2
2 1
3 3 2
2 3
2 2
3 2 7 1
2
1 2
2
14 2
5 4
2 2
8
1 1
5 5
11 8
3 10
4 6
2 8
2 9
6 7
8 6
10 9
3 5 7
6 7
6 7
6 7
3 10 4
8 3
7
17 6
6 8
10 2
8
12 7
19 25
11 7
5 15
12 16
7 11
19 9
11 11
11 13
16 13
20 19
11 14
18 14
18 17
17 16
16 13
14 20
18
10 18
16 14
10 19
14
15 16
11 10
5 8
7 10
8 10
4 7 4 6
8 7
8 8
11 14
8 9
7 8
6 8
10 9
9 9
12 8
10 17
7
9 8
4 5
7 13
4
9 8
33 39
19 23 19
20 33
23 10
16 17
11 21 13
29 17 15
13 12
11 15 16 21 16
14 17
13 14
10 15
11 15
18
8 16
13 9
7 8
9 15
12 18
15 22
23 13
28 20
22 20 21
26 20
23 24
18 19
22 16
13 18 17
14 17
12 16
12
15 10
14 21
15 15
12 16
13 12
9 17
12 9
17
Figure 76 Industry Shares of Value Added_Shares of industry GDP in aggregate GDP at current prices in 2016
Sources: Official national accounts in each country, including author adjust-ments.
©20
18 A
sian
Prod
uctiv
ity O
rgan
izat
ion

6
89
6.1 Output and Employment
who have a higher share of services and mining, respectively.
Figure 78 shows the breakdown of the manufacturing sector, comprising nine sub-industries, for 17 selected Asian countries and the US in 2016.86 Countries are sorted based on the size of the share of machinery and equipment in manufacturing GDP. The dominance of machinery and equipment in Asian manufacturing is apparent, particularly in the ROC (65% of manufacturing GDP), Korea (51%), Japan (49%), Singapore (48%), and Malaysia (42%). These compare with 43% in the US. At the other end are countries dominated by light manufacturing; e.g., the food products, beverages, and tobacco products sector in Mongolia (55%), the Philippines (52%), Fiji (49%), and Sri Lanka (46%); and the tex-tiles, wearing apparel, and leather products sector in Cambodia (66%) and Bangladesh (49%). Coke, refined petroleum products, chemicals, rub-ber, and plastic products are also a prominent subsector. They account for two-thirds of Kuwait’s manufac-turing value added (61%).
Comparisons of the value added and employment shares reveal some in-teresting facts, as presented in Figure 79. Agriculture is the only industry sector that consistently has a dispro-portionately higher employment share than justified by its share in value added across all economies in Asia, except Fiji. This suggests that agri-culture is still highly labor-intensive and/or there may be a high level of underemployment in the sector, both of which imply that the labor pro-ductivity level is low compared to other industry sectors.87 Thus, countries
TFP growth during 2000–2016
0.5
1.0
1.5
2.0
2.5
3.0
3.5%
Manufacturing share, 2016
0.00 5 10 15 20 25 30 35 %
China
ROCFiji
Hong Kong
India
IndonesiaIran
Japan
KoreaMalaysia
Mongolia
Pakistan Philippines
Singapore
Sri Lanka
Thailand
USBangladesh
Vietnam
Cambodia
Lao PDR
Nepal
Figure 77 Manufacturing GDP Share and TFP Growth_GDP share of manufacturing in 2016 and average annual TFP growth rate in 2000–2016
Sources: Official national accounts in each country, including author adjustments; APO Productivity Database 2018.Note: Countries with negative TFP growths are excluded.
85: In Mongolia the two world-class large mines of Tavan Tolgoi (coal mine) and Oyu Tolgoi (copper and gold mine) started pro-ducing concentrate from the mine as of the beginning of the 2010s.
3-1. Food products, beverages, and tobacco products3-2. Textiles, wearing apparel, and leather products3-3. Wood and wood products3-4. Paper, paper products, printing, and publishing3-5. Coke, petroleum, chemicals, rubber, and plastic products3-6. Other non-metallic mineral products 3-7. Basic metals3-8. Machinery and equipment 3-9. Other manufacturing
100806040200 %
MongoliaSri LankaCambodia
KuwaitIndonesiaBangladesh
Philippines
Hong KongThailandMalaysia
SingaporeJapanKoreaROC
Fiji
Iran
India
US
55 46
14 49
10 38
10 15
52 10
31 24
13 13
5 12
5 4
16 21
66 11
3 8
49 3
5 14
5 6
2 1
1 5
3
3 1
1 6
4 2
2 1
2
1 4
3
2
2 2
2 7
4 4
1 1
2 3
11 2
2 4
2 4
2 2
4 10
3 7
61 26
3 41
18 22
14 26
29 27
37 15
17 17
5 5
3 4 8
4 9
9 2
6 3
4 4
2 1
3 3
2
10 3
2 1
2 4
3 14
3 10
2 3
2
8 15
4
5 7
8 9
10 12
13 15
15 27
29 32
42 43
48 49
51 65
1 3
6 2 1
10 1
2 6 6
4 1
4 6 6
2 3
Figure 78 Industry Shares of Value Added in Manufacturing_Shares of sub-industry GDP in aggregate GDP at current prices in 2016
Sources: Official national accounts in each country, including author adjustments.
©20
18 A
sian
Prod
uctiv
ity O
rgan
izat
ion

90
6 Industry Perspective
with a sizeable agriculture sector often have low per capita GDP. In these cases, shifting out of agriculture will help boost economy-wide labor productivity. The US is an exception, where its agricultural value-added share and employment share are similar as 1%, as shown in Figure 79; suggesting that labor pro-ductivity in this sector is higher than that experienced in Asian countries.88 The reverse is true for the sector of finance, real estate, and business activities, which often generate a much greater value-added share than suggested by its employment share. In 2016, the sector accounted for 33% of total value added generated by 21% of employment in the US, and 16% and 2%, respectively, in the Asia30 (see Figures 76 and 81).
Figure 80 shows how the share of the agriculture industry in total value added dropped over time in the Asian economies.89 This could reflect the actual decline in agricultural output and/or the relatively rapid expansion in other sectors. Despite the broad spread, the downward trend is unmistakable. The share of the agriculture sector displays a long-term declining trend in all countries, albeit at different paces and at different starting times. Looking at the available data, the share of agriculture in most Asian countries (excluding the oil-exporting countries) clustered around the 30–50% band in the 1970s, trending down to the 10–20% band by 2016. Vietnam and Mongolia are two countries where the agriculture sector ex-perienced similar declines but within a much shorter period (from the late 1980s and mid-1990s, respec-tively). The relative decline of agriculture was most rapid in Korea, from 29% of total value added in 1970 to 2% in 2016. In many countries, the share of the agriculture sector more than halved between 1970 and 2016 – from 39% to 13% in Indonesia, from 42% to 17% in India, and from 43% in 1972 to 15% in Ban-gladesh. In China, the share of this sector also declined significantly, from 36% in 1970 to 9% in 2016.
Figure 79 Value Added and Employment Shares of Agriculture_Shares of industry GDP in aggregate GDP at current prices and employment in 2016
Sources: Official national accounts, population census and labor force survey in each country, including author adjustments.
0
10
20
30
40
50
60
70
80%
Nepal
Cambodia
Pakistan M
yanmar
CLMV
Vietnam South Asia Bhutan India
Bangladesh M
ongolia Indonesia
ASEAN APO
20 ASEAN
6 Asia24 Philippines Asia30 China M
alaysia Thailand Sri Lanka Turkey East Asia Australia Saudi Arabia Korea O
man
Brunei Japan
Kuwait
Bahrain Q
atar H
ong Kong Singapore
Fiji
Iran
ROC
GCC
US
UAE
2926 25
21 20 18 17 17 1715
15 13 13 13 11 11 10 10 10 9 9 9 9 8 7 7
3 3 2 2 2 2 1 1 1 1 0 0 0 0 0
Value added share
70
42 42
52
4542
46
54
47
8
41
30 33
18
3437
2933
26
3327
11
3227
2024
3 5 5 4 5 4 3 41 3 1 1 1 0 0
Employment share
86: Manufacturing consists of nine sub-industries: 3.1–food products, beverages, and tobacco products; 3.2–textiles, wearing apparel, and leather products; 3.3–wood and wood products; 3.4–paper, paper products, printing, and publishing; 3.5–coke, refined petro-leum products, chemicals, rubber, and plastic products; 3.6–other non-metallic mineral products; 3.7–basic metals; 3.8–machin-ery and equipment; and 3.9–other manufacturing. See Appendix 10 (p. 166) for the concordance with ISIC, Revisions 3 and 4.
87: Gollin, Parente, and Rogerson (2004) and Caselli (2005) demonstrate the negative correlation between employment share of ag-riculture and GDP per worker. They show that the agriculture sector was relatively large in less well-off countries and agricultural labor productivity was lower than that in other sectors.
88: Jorgenson, Nomura, and Samuels (2016) indicates agriculture sector is one of the industries, which realized a high TFP growth constantly in the US (1.0% on average per year in 1970–2012), compared to its stagnation in Japan’s agriculture (–0.1%), reflect-ing differences in the scale of individual production units, as well as massive public investments (including research and develop-ment) in new agricultural technology in the US.
89: The estimate for Brunei is added in this edition of Databook.
©20
18 A
sian
Prod
uctiv
ity O
rgan
izat
ion

6
91
6.1 Output and Employment
Despite the relative decline of agriculture’s share in total value added, employment in the sector for Asia as a whole still accounted for 33% of total employment in 2016. Figure 81 shows industry shares in total employment by country and region and ranks them by size of employment in the agriculture sector. The changes in the industry shares of employment is presented in Table 22 in Appendix 9 (p. 162) from 1970. It is noteworthy that Asia30 remains a region dominated by agriculture as far as employment is con-cerned, despite its downward trend.
Figure 80 Trend of Value-added Share in Agriculture_Share of agriculture sector GDP in aggregate GDP at current prices in 1970–2016
Sources: Population census and labor force survey in each country, including author adjustments. Note: Countries are grouped according to the levels of per capita income in 2016, relative to the US, defined in Table 2 (p. 87).
Figure 80.1: Group-D1 (100%≤) Figure 80.2: Group-D2 (70%≤...<100%)
Figure 80.3: Group-D3 (40%≤...<70%) Figure 80.4: Group-D4 (20%≤...<40%)
Figure 80.5: Group-D5 (10%≤...<20%) Figure 80.6: Group-D6 (<10%)
1990 1995 2000 20051970 1975 1980 1985 2010 2015
1
0
2
3%
KuwaitSingapore UAE
QatarBrunei Hong Kong
1990 1995 2000 20051970 1975 1980 1985 2010 20150
5
10
20
15
%
Saudi ArabiaOman
AustraliaROC
BahrainJapan
1990 1995 2000 200519700
10
20
40
30
%
1975 1980 1985 2010 2015
Malaysia TurkeyKorea
1975 1980 1985 1990 1995 2000 2005 2010 201519700
10
20
40
30
%
Indonesia IranChinaSri Lanka ThailandMongolia
1975 1980 1985 1990 1995 2000 2005 2010 201519700
10
20
30
40
50
80
70
60
%
VietnamPhilippines
Bhutan FijiIndia Lao PDR
0
10
20
30
40
60
50
80
70
%
1975 1980 1985 1990 1995 2000 2005 2010 20151970
Pakistan
Bangladesh CambodiaMyanmar Nepal
©20
18 A
sian
Prod
uctiv
ity O
rgan
izat
ion

92
6 Industry Perspective
Figure 82 Labor Surplus_Number and ratio of labor surplus in 2016
Sources: Our estimates.
0
20
40
60
80
100
120
140
160Million
0
5
10
15
20
25
30
35
40
45% Million
0
50
100
150
200
250
300
350
400
IndiaChinaIndonesiaBangladeshVietnamPakistanThailandM
yanmar
PhilippinesN
epalTurkeyJapanSri LankaCam
bodiaIranU
SKoreaRO
CM
alaysiaSaudi ArabiaM
ongoliaBhutanU
AEO
man
Qatar
Kuwait
SingaporeH
ong KongBahrainBrunei
Asia30
Asia24
APO20
South Asia
East Asia
ASEAN
ASEAN6
CLMV
GCC
147.4 139.7
22.1 16.2
11.8 10.1 8.6 4.8 6.8 5.3 3.3
1.7
1.5 1.4 0.9 0.7
0.7
0.4 0.2 0.2
0.2 0.1 0.1 0.0 0.0 0.0 0.0 0.0 0.0 0.0
Number of labor surplus (total=384 million)Labor surplus ratio to total employment (center axis)
380 380
235
181
143
56 38
18 0
Number of labor surplus by region (right axis)
When the number of workers under-employed (known as labor surplus) in each country are estimated based on the simple assumption that the employ-ment share would be equivalent to the value-added share of agriculture in the status of zero labor surplus,90 the num-ber of labor surplus reaches to about 380 million persons for the whole Asia (Asia30) in 2016. Figure 82 presents the country contributions and regional to-tals (right chart) of the estimated labor surplus. The country with the largest labor surplus is India (147 million), closely followed by China (140 million), beyond that, a huge gap exists with In-donesia (22 million) in the third posi-tion, followed by Bangladesh (16 million), Vietnam (12 million), and Pakistan (10 million). In this measure ASEAN6 has more than double the labor surplus of CLMV.
Figure 83 traces the historical trajectory of Japan’s employment share of agricul-ture for the period 1885–2016 and the countries’ levels in 2016, mapped against Japan’s experience (as circles). Large shares of agriculture employment – over 30% in 11 countries – correspond to Ja-pan’s level at the end of the 1950s and the onset of high economic growth. This may indicate room for improving labor
Figure 81 Industry Shares of Employment_Shares of number of employment by industry in 2016
Sources: Population census and labor force survey in each country, including author adjustments.
1. Agriculture3. Manufacturing5. Construction
7. Transport, storage, and communications8. Finance, real estate, and business activities
2. Mining4. Electricity, gas, and water supply
6. Wholesale and retail trade, hotels, and restaurants
9. Community, social, and personal services
10 20 30 40 50 60 70 80 90 1000 %
Hong KongSingaporeBahrainKuwaitQatarUSUAEBruneiAustraliaGCCJapanOmanKoreaROCSaudi ArabiaFijiMalaysiaIranTurkeyEast AsiaPhilippinesChinaSri LankaASEAN6MongoliaThailandIndonesiaAsia30ASEANAsia23APO20BangladeshCambodiaVietnamPakistanCLMVSouth AsiaIndiaMyanmarBhutanNepal
1 1 1 1 3 3 3 4 4 4 5 5 5
8 11
18 20
24 26 27 27 29 30 32 33 33 33 33
37 41 42 42 42
43 46 47
52 54
70
2 4
2 3 3 2
2
1 1
1 1
1 1 1 1
1 3
1 1 1 1
1
1 1 1
1 1
3 14 12
4 5
9 8 6 7 8
15 11
17 27
8 16
16 17
18 18
8 18 18 13
8 17 14 16 13 16
14 15
9 17
15 14 13 13
11 5
7
1 1
1 2 1 1
1
1 1
7 1
1 1
1
1
2 1
1 1
1 1
9 13
21 12
48 6
10 22
8 18 7
31 7
8 14
6 9
13 7
9 7
10 7
7 6
6 7
9 7
9 8
6 6
7 8
6 9 9 3
12 4
29 20
13 9
12 14
19 20
21 15
17 18
23 26
14 20
27 16
20 14
23 13
16 24
18 24
24 15 22 15
17 15
22 17
16 16 14 13
14 9
9
12 10
9 3
5 5
8 4
7 5 9
4 8
6 4
16 5
10 5 5 8
4 7
5 7
4 4
5 5
5 6
8 4
4 6 4 6 5
4 3
2
20 8
3 10
1 21
9 5
5 4
4 6
14 8
2 2
10 5
9 2
6 1
3 3
2 3
2 2
3 2
3 2
1 1
1 3
3 3 8
2 1
27 34
41 58
23 43
40 34
44 44 43
23 25
20 50
23 20 18 19
26 20
25 20
17 23
14 15
19 15
18 14 12
15 11 12 10
9 9
6 15
7
©20
18 A
sian
Prod
uctiv
ity O
rgan
izat
ion

6
93
6.1 Output and Employment
productivity and per capita income, if more productive industries are developed and jobs are created.
The trend of employment share over time (Figure 84) suggests that the relative de-cline in the share of agricul-ture in total value added has been accompanied by a down-ward trend in its share in to-tal employment.91 This trend is unmistakable in most of the countries plotted in Fig-ure 84.92 Between 1970 and 2016, the employment share in agriculture dropped from 50% to 5% in Korea and from 21% to 4% in Japan. Employment share in agri-culture also fell rapidly in the ROC, from 25% in 1978 to 5% in 2016. In China, the share has declined from 71% in 1978 to 27% in 2016.
It is the manufacturing sec-tor that largely absorbs workers who have been displaced from the agriculture sector, especially in the initial stages of economic development. Figure 85 traces the trajectory of growth rates of GDP and em-ployment in combination with manufacturing for Asian countries and the reference countries like the US, Australia, and Turkey over the past four decades. Each dot represents the average annual growth rate in the 1970s, 1980s, 1990s, 2000s, and 2010s (2010–2016). The growth rate in the 2010s is illustrated by an arrow. If manufacturing GDP and employment grow at the same rate, a dot will be on a 45-degree line through the origin running from the lower left to upper right quadrants. In Japan, despite positive gains in manufacturing GDP, the overall growth in manufacturing employment was negative – except during the 1980s.
In Korea and the ROC, expansions of manufacturing output could allow for increases of employment in the 1970s and the 1980s (Figure 85.1). However, since the 1990s manufacturing has not been an absorption sector of employment, regardless of the sound expansion of production in this sector. The experiences of
90: In this calculation the mining sector is excluded in the totals in both of employment and value added.91: Nepal’s employment-by-industry figures are constructed by interpolating benchmark data taken from its labor force survey as
well as its population census. Figure 84 indicates that its share of agriculture has increased since 2001. This reflects the employ-ment share of agriculture at 61% in the population census of 2001 and its share of 70% in the labor force survey of 2008.
92: However, the decline in a share does not always reflect an actual fall in employment for the agriculture sector; rather, it could reflect total employment rising faster than employment in agriculture. Countries that have been experiencing a consistent fall in actual employment in the agriculture sector are, for example, the ROC, Hong Kong, Japan, and Korea, whereas in Cambodia, India, Iran, Nepal, and Pakistan, actual employment has been rising. Other countries such as Thailand, Indonesia, Singapore, Ma-laysia, and Vietnam have no established trend in employment growth. China, however, has seen actual employment in agriculture falling since the turn of the millennium.
Figure 83 Historical Employment Share of Agriculture in Japan since 1885 and Current Level of Asia_Shares of number of employment in agriculture for Japan in 1885–2016 and for Asian countries in 2016
Sources: Population census and labor force survey in each country, including author adjust-ments. The sources of historical data of Japan are Ohkawa, Takamatsu, and Yamamoto (1974) during 1885–1954 and population censuses since 1920.
Hong Kong
Singapore
Nepal
Brunei
Vietnam Cambodia Pakistan
Thailand Mongolia Sri Lanka
Malaysia
Korea Fiji
India
Bangladesh
Indonesia
China
ROC
Iran
Bhutan
Philippines
Myanmar
1880 1890 1900 1910 1920 1930 1940 1950 1960 1970 1980 1990 2000 2010 2020
10
0
20
30
40
50
60
70
80Agriculture share in total employment
Japan (1885–2016)
%
©20
18 A
sian
Prod
uctiv
ity O
rgan
izat
ion

94
6 Industry Perspective
Figure 84 Trends of Employment Share in Agriculture_Share of number of employment in agriculture in 1970–2016
Sources: Population census and labor force survey in each country, including author adjustments. Note: Countries are grouped according to the levels of per capita income in 2016, relative to the US, defined in Table 2 (p. 87).
Figure 84.1: Group-D1 (100%≤) Figure 84.2: Group-D2 (70%≤...<100%)
Figure 84.3: Group-D3 (40%≤...<70%) Figure 84.4: Group-D4 (20%≤...<40%)
Figure 84.5: Group-D5 (10%≤...<20%) Figure 84.6: Group-D6 (<10%)
1990 1995 2000 20051970 1975 1980 1985 2010 2015
5
0
10
15%
KuwaitSingapore UAE
QatarBrunei Hong Kong
1990 1995 2000 20051970 1975 1980 1985 2010 20150
5
10
30
15
20
25
%
Saudi ArabiaOman
AustraliaROC
BahrainJapan
1990 1995 2000 200519700
10
20
60
50
40
30
%
1975 1980 1985 2010 2015
Malaysia TurkeyKorea
1975 1980 1985 1990 1995 2000 2005 2010 201519700
20
80
60
40
%
Indonesia IranChinaSri Lanka ThailandMongolia
1975 1980 1985 1990 1995 2000 2005 2010 201519700
20
40
100
80
60
%
VietnamPhilippines
Bhutan FijiIndia
0
20
40
60
100
80
%
1975 1980 1985 1990 1995 2000 2005 2010 20151970
Pakistan
Bangladesh CambodiaMyanmar Nepal
Singapore, Indonesia, and Thailand are closer to the 45-degree line through the origin, which implies well-balanced growth of output and employment in the manufacturing sector. The job creation role of manufac-turing has remained effectively in these countries, but it is diminishing rapidly (Figure 85.3).
©20
18 A
sian
Prod
uctiv
ity O
rgan
izat
ion

6
95
6.2 Industry Growth
6.2 Industry Growth
Growth in the Asia30 region accelerated in the period 2000–2016, averaging 5.4% per annum, up from 4.9% in 1900–2000. China and India have been the two main drivers among the Asian economies, accounting for 49% and 17% of the region’s growth during 2000–2010, and 65% and 21% during 2010–2016, respectively, as shown in Figure 9 in Section 3.1 (p. 21). However, looking at the industry composi-tion, the origins of economic growth in China and India are quite different. Bosworth and Collins (2008) indicate that China’s economic growth has been fueled by industry sector expansion;93 whereas India’s economic growth has been led by service sector expansion, based on their observation during 1978–2004. Although the findings broadly support their conclusion, it also indicates that the nature of growth in China may have started shifting more toward services in recent years. Figure 86 shows industry origins of economic growth by country and region for the periods 1990–2000 and 2000–2016.
Figure 87 contrasts industry contributions to economic growth among regions.94 Even within such a short period, one can see that the industry structure of growth is changing. The first striking feature is the
93: The industry sector in Bosworth and Collins (2008) is equivalent to industry groups 2–5 in this report.94: Asian averages are calculated using the Törnqvist index to aggregate the growth rates of industry GDP of each country based on
the two-period average of each country’s shares of industry GDP to the gross regional products as weights.
Figure 85 Job Creation in Manufacturing_Average annual growth rates of constant-price GDP and number of employment in 1970–2016
Sources: Population census and labor force survey and official national accounts in each country, including author adjustments.Note: Each dot represents the average annual growth rate in manufacturing (mnf) in the 1970s, 1980s, 1990s, 2000s, and 2010s (2010–2016). The arrows indicate the rate in the latest decade. The starting period for Cambodia is 1993.
Figure 85.1: East Asia Figure 85.2: South Asia Figure 85.3: ASEAN6
Figure 85.4: CLMV and Other Asia Figure 85.5: Reference Countries
−8 −4 0 4 8 12 16
−10
−8
−6
−4
−2
0
2
4
6
8
10
−2
−1
0
1
2
3
4
5
6
0 2 4 6 8 10 %
−2
0
2
4
6
8
10%
0 4 8 12 16 20 %
-4
-2
0
2
4
6
-2 0 2 4 6 8
%
%
0
−3
3
6
9
12
15
0 3 6 9 12 15 18
18%
%
1970s
1980s
1990s
2000s
2010s
ROC
Hong Kong
Japan Korea
Growth ofEmployment in Mnf
Growth of GDP in Mnf
China
Growth ofEmployment in Mnf
%
%
Growth of GDP in Mnf
1970s
1980s
1990s
2000s2010s
India
Pakistan
Sri Lanka
Bangladesh
Growth ofEmployment in Mnf
Growth of GDP in Mnf
1970s
1980s1990s
2000s
2010s
Malaysia
Philippines
Singapore
Thailand
Indonesia
Australia
2010s
1980s
2000s
Turkey
US
Growth ofEmployment in Mnf
Growth of GDP in Mnf
1990s
1970s
Cambodia
1990s
2000s
2010s
Vietnam
Fiji
Iran
Growth ofEmployment in Mnf
Growth of GDP in Mnf
%
©20
18 A
sian
Prod
uctiv
ity O
rgan
izat
ion

96
6 Industry Perspective
Figure 86 Industry Origins of Economic Growth_Industry decomposition of average annual growth rate of constant-price GDP in 1990–2000 and 2000–2016
Sources: Official national accounts in each country, including author adjustments. Note: The starting period for Cambodia is 1993 and Cambodia is not included in CLMV and ASEAN before 1993.
5. Construction8. Finance, real estate, and business activities
3. Manufacturing6. Wholesale and retail trade, hotels, and restaurants
9. Community, social, and personal services
1. Agriculture4. Electricity, gas, and water supply
7. Transport, storage, and communicationsReal GDP growth
2. Mining
0.4
−0.5−0.3−0.3
−0.8
2.5
1.9
0.6
1.2
0.5
1.2
2.4
10.2
1.0
0.7
0.8
0.9
0.6
0.4
4.2
0.6
0.7
9.9
0.8
1.1
0.6
1.3
0.30.3
2.4
7.2
0.9
1.4
0.3
0.7
0.6
0.9
0.8
1.3
7.2
0.6
1.2
0.8
1.9
0.6
1.2
0.3
7.1
1.0
0.30.5
0.8
0.4
2.1
1.7
6.8
0.7
1.5
1.0
1.2
0.6
1.8
6.8
0.8
1.4
0.9
0.7
2.4
6.7
0.6
0.9
0.3
0.8
0.5
0.8
0.6
1.8
6.5
1.2
1.4
0.6
1.3
1.7
6.4
0.5
0.5
0.40.5
0.4
4.0
6.3
0.3
0.9
0.6
0.5
0.8
2.2
5.7
0.3
1.0
0.5
0.4
2.8
5.4
0.9
1.0
0.5
1.0
0.3
0.8
0.7
5.4
0.8
0.7
0.5
1.0
0.3
1.5
0.3
5.2
0.8
0.8
0.5
0.9
0.3
0.8
0.8
5.2
0.7
0.6
0.5
0.6
1.8
0.3
5.1
0.7
0.6
0.5
0.7
1.5
0.4
5.0
0.7
0.6
0.5
0.7
1.5
0.4
5.0
0.6
1.1
0.6
0.7
0.5
1.0
0.5
5.0
0.6
0.7
0.6
0.3
1.3
0.7
0.5
4.9
0.6
0.5
0.4
1.0
0.3
0.7
1.0
4.7
0.4
0.6
0.6
0.7
1.4
0.4
4.6
0.8
0.4
0.7
0.5
1.0
0.9
4.6
0.4
0.5
0.6
0.7
1.4
0.3
4.4
0.6
0.5
0.5
0.6
0.3
1.5
0.3
4.4
0.5
1.0
0.30.5
0.7
0.9
4.4
0.7
0.50.3
0.6
0.3
0.6
1.1
4.4
0.7
0.5
0.4
0.5
0.5
1.5
4.3
0.6
0.4
0.5
0.7
0.4
1.3
4.2
0.3
0.7
0.7
1.3
0.3
3.9
0.6
0.6
0.5
0.7
0.9
0.3
3.7
0.8
1.0
0.5
0.6
0.3
3.6
0.3
0.6
0.6
1.1
3.4
0.4
1.0
0.3
0.7
0.7
3.3
1.0
0.7
0.6
0.7
−0.4
3.0
0.40.4
0.6
0.60.3
2.9
0.6
0.3
0.8
2.7
0.6
0.5
0.5
0.9
2.5
−0.3
0.6
0.4
0.5
1.8
0.4
0.30.4
1.4
−1.5
0.9
1.5
0.6
0.8
1.1
0.8
3.8
9.6
1.4
1.0
0.7
1.1
0.6
3.1
0.40.4
9.1
0.7
0.7
0.8
0.8
1.3
1.4
0.6
0.30.5
7.1
0.7
0.5
0.4
1.6
0.6
0.4
0.7
1.2
1.0
7.1
0.9
1.5
0.8
1.4
0.5
1.1
0.6
7.1
0.9
1.3
0.8
1.3
0.5
1.1
0.6
6.6
0.9
1.1
1.7
0.6
1.3
0.5
6.5
0.8
0.6
0.5
0.9
0.7
1.5
1.3
6.4
0.8
0.8
0.3
1.0
0.50.4
1.5
0.7
6.2
1.0
0.8
0.5
0.7
0.4
2.1
0.30.3
6.1
0.7
0.6
0.3
0.8
0.60.3
1.2
0.8
0.8
6.1
0.9
0.9
0.6
0.9
0.4
1.7
0.3
5.9
1.0
0.3
0.7
1.0
0.6
1.4
0.7
5.9
0.8
0.9
0.6
0.8
0.4
1.6
0.3
5.8
0.5
0.30.3
0.7
0.5
2.3
0.8
5.6
0.5
0.6
1.3
0.9
0.5
1.0
0.5
5.5
0.9
0.8
0.9
0.8
0.5
0.8
0.3
5.3
1.3
1.5
0.50.3
0.6
0.9
5.2
0.7
1.2
0.4
0.9
0.3
1.0
0.3
5.1
0.5
1.6
0.6
1.2
1.0
5.1
0.6
0.8
0.8
0.9
0.4
1.0
0.4
5.1
0.5
0.8
0.8
0.9
0.3
1.0
0.3
4.9
0.7
0.7
0.6
0.9
0.6
1.0
4.8
0.7
0.7
0.5
1.0
1.0
4.6
0.6
0.8
0.6
0.9
0.5
0.30.5
4.5
0.7
0.7
0.5
0.6
0.4
0.5
0.8
4.5
0.9
0.5
0.6
0.4
0.7
0.7
4.3
0.5
0.8
0.5
0.7
0.9
0.3
4.2
0.9
0.4
0.5
0.7
0.7
0.6
4.1
0.8
1.0
0.5
1.0
4.0
0.7
1.4
0.4
1.4
3.9
0.6
0.5
0.5
0.6
0.3
0.6
0.7
3.9
0.6
0.6
0.5
0.7
1.1
3.9
0.6
0.8
0.40.3
1.5
3.9
0.8
0.6
0.5
0.4
1.0
3.8
0.4
0.7
0.6
0.6
0.70.4
3.5
0.4
0.5
0.6
1.7
3.4
0.7
0.8
0.30.40.30.4
2.9
0.30.3
0.5
0.4
1.9
0.3
0.7
0.3
1.6
0.3
0.30.6
0.40.3
−1.2
−0.2
−2
0
2
4
6
8
10%
−2
0
2
4
6
8
10%
1990−2000
2000−2016
Kuwait
ChinaM
alaysiaVietnamU
AECam
bodiaSingaporeKoreaCLM
VRO
CQ
atarLao PD
RM
yanmar
IndiaSri LankaSouth AsiaEast AsiaAsia24Asia30IranBhutanN
epalASEANBangladeshASEAN
6ThailandBahrainG
CCO
man
PakistanIndonesiaAPO
20AustraliaTurkeyU
SH
ong KongPhilippinesSaudi ArabiaBruneiFijiJapanM
ongolia
Qatar
ChinaBhutanLao PD
RIndiaSouth AsiaM
ongoliaCam
bodiaVietnamEast AsiaCLM
VAsia24BangladeshAsia30M
yanmar
IndonesiaSri LankaBahrainPhilippinesSingaporeASEANASEAN
6TurkeyM
alaysiaU
AEG
CCO
man
APO20
PakistanKuw
aitH
ong KongSaudi ArabiaThailandKoreaN
epalIranRO
CAustraliaFijiU
SJapanBrunei
©20
18 A
sian
Prod
uctiv
ity O
rgan
izat
ion

6
97
6.2 Industry Growth
dominance of manufacturing in Asian countries. Between 1990 and 2000, its contribution to eco-nomic growth in the Asia24 was 30% compared to 21% in the US. Although its significance has fallen in recent years, it still accounted for 28% of economic growth in the Asia30 between 2000 and 2016, compared with 10% in the US. This, however, masks a divergence within Asia. In the earlier period, manufacturing accounted for 36% of growth in East Asia but only 15% in South Asia. The corresponding figures were 34% and 17% in 2000–2016. The differential is somewhat narrowing in East Asia and expanding in South Asia. In the ASEAN, manufacturing’s contribu-tion was reduced to 21% in 2000–2016 from 30% in the 1990s in ASEAN6, but expanded to 19% from 13% in CLMV. In the US, the finance, real estate, and business activities sub-sector made the biggest contribution in both periods, accounting for 30% of economic growth in 1990–2000 and rising to 43% in 2000–2016. In contrast, its con-tribution in the Asia30 was only 15% in the same period. Mining in GCC countries took a hit in 2008–2009 due to the downturn in the world economy. Consequently, the contribution of min-ing fell from 26% to 19% between the two peri-ods while construction’s share increased from 6% to 9%. Finance, real estate, and business activities became the biggest contributors of economic growth in GCC countries, with its share rising from 12% to 16% between the two periods.
Our results show that manufacturing was the biggest contributor to economic growth in China until the 2000s when the service sector overtook man-ufacturing in this respect (Figure 86).95 The gap between contributions of manufacturing and services was the widest in the late 1990s until a correction in 2000–2016, with manufacturing and services accounting for 34% (Figure 88) and 46% (Figure 89) of economic growth, respectively.96 In contrast, economic growth in India always has been dominated by services. Its growth has only become more pronounced over time. The contributions of manufacturing and services to economic growth were 16% (Figure 88) versus 64% (Figure 89) in 2000–2016, compared with 15% and 61% in 1990–2000.
Figure 87 Industry Origins of Regional Eco-nomic Growth _Contribution shares of industry GDP growth in aggregate GDP by region in 1990–2000 and 2000–2016
Sources: Official national accounts in each country, including au-thor adjustments. Note: Cambodia is not included in CLMV and ASEAN before 1993.
9. Community, social, and personal services8. Finance, real estate, and business activities7. Transport, storage, and communications6. Wholesale and retail trade, hotels, and restaurants5. Construction
4. Electricity, gas, and water supply3. Manufacturing2. Mining1. Agriculture
1990−2000 2000−2016
0
20
40
60
80
100%
APO20
Asia24Asia30East AsiaSouth AsiaASEANASEAN
6CLM
VG
CCU
S
APO20
Asia24Asia30East AsiaSouth AsiaASEANASEAN
6CLM
VG
CCU
S
8 8 7 5
15 9 6
29
3 1 7 6 6 4
9 7 6 13
1 2
1 3 5 4
1
5 4
9
26
0
1 3 4 4 2 3 2
13
19
4
23
31 29 36 15
30 32
13
14
21
22 28 28
34
17 21 21
19
12
10
4
4 4 4
3
3 3
3
3
1
2
2 2
2
2 2
2
4
3
0
2
4 4 3
5
4 3
7
6
3
5
6 6
6
7 7
7
9
9
−5
18
14 14 12
18
16 17
13
14
23
18
14 14 12
19 18
18
14
14
12
13
11 11 10
10
13 14 4
6
10
13
10 10 8
12 16 17
6
12
17
16 12 12 11
16
12 12 13
12
30 20 15 15 13 19
15 16 9
16
43
16 13 14 14 16 9 9 10
16 12 13 14 15 16 13 11 11 11 15
18
95: The Törnqvist quantity index is adopted for calculating the growth of real GDP. Using this index, the growth of real GDP into the products of contributions by industries can be decomposed:
=∑ j(1/2) (sjt+sj
t−1)ln(Qjt/Qj
t−1)Real GDP growth Contribution of an industry j
ln(GDP t/GDP t−1) where Qj
t is real GDP of an industry j in period t and sjt is the nominal GDP
share of an industry j in period t.96: The service sector is defined in this Databook as 6–wholesale and retail trade, hotels, and restaurants; 7–transport, storage, and
communications; 8–finance, real estate, and business activities; and 9–community, social, and personal services.
©20
18 A
sian
Prod
uctiv
ity O
rgan
izat
ion

98
6 Industry Perspective
Manufacturing has sustained its significance in Thailand, Korea, and the ROC, contributing 29%, 39%, and 49% to economic growth in 2000–2016, respectively. Its contribution is modest in Singapore at 20% (Figure 88). In Hong Kong, it has been a drag on economic growth in the past decade or so. During the Asian crisis, the most impaired economies were Thailand and Indonesia, and the sectors which bore the brunt were construction, wholesale and retail trade, hotels, and restaurants, and finance, real estate, and business activities. In contrast, manufacturing played a significant role in bolstering the economy at the time (Figure 88).
The service sector plays an equal, if not more important, role in Asian economic growth. Services made the substantial contribution to economic growth in all Asian countries except Myanmar and Qatar (Fig-ure 89). The story behind India’s recent growth has been one of services. Modern information and com-munication technology have allowed India to take an unusual path in its economic development, bypassing a stage when manufacturing steers growth.97 Within the service sector, contribution is quite evenly spread
Figure 88 Contribution of Manufacturing to Economic Growth _Average annual contributions and contribution shares in 1990–2000 and 2000–2016
Sources: Official national accounts in each country, including author adjustments. Note: The starting period for Cambodia is 1993 and Cambodia is not included in CLMV and ASEAN before 1993.
4.2 2.4 2.4
2.1 1.8 1.8 1.7 1.5 1.5 1.5 1.5 1.4 1.4 1.3 1.2 1.2 1.1 1.0 1.0 0.9 0.9 0.8 0.8 0.8 0.8 0.7 0.7 0.7 0.7 0.6 0.6 0.5 0.5 0.5 0.5 0.4 0.3 0.3 0.2 0.1
−0.4 −0.8
42 34 36
30 36
26 26
31 29
34 29 32
30 33
18 12
34 21
19 13
23 13 15 15
14 17 15 14
21 21
14 12
9 28
20 10 13
7 17
1 -14
54
34 34
28 49
28 39
23 24 23
19 16
29 17
20 21 21 22 21
18 20 22
17 14
8 11
18 21
17 16
9 8 12
9 8
46 6
10 6
2 1
−2 −2
3.1 2.1
1.7 1.7 1.6 1.5 1.5 1.5 1.4
1.2 1.1 1.1 1.1 1.0 1.0 1.0 1.0 1.0 1.0 1.0 0.9 0.9 0.8 0.8 0.7 0.7 0.7 0.7 0.6 0.6 0.6 0.5 0.5 0.3 0.3 0.2 0.2 0.1 0.1 0.0 0.0
−0.1
1990−2000 2000−2016
5 01234 −1 % 60300−30 % 60 %300−304 0123 −1 %
Contribution ContributionContribution share Contribution share
ChinaMalaysia
KoreaCambodiaEast Asia
SingaporeROC
Asia24Sri LankaThailandAsia30
ASEAN6ASEAN
IndonesiaUAE
KuwaitTurkey
BangladeshIran
VietnamAPO20CLMVIndia
South AsiaLao PDRBahrainNepal
BhutanUS
PhilippinesGCC
OmanMyanmar
FijiBrunei
PakistanSaudi Arabia
AustraliaJapanQatar
Hong KongMongolia
ChinaEast AsiaAsia24ROC
Asia30Korea
CambodiaVietnam
BangladeshCLMVIndia
ThailandSouth AsiaPhilippines
ASEANASEAN6MalaysiaTurkey
IndonesiaSingapore
APO20Bahrain
Sri LankaQatar
Lao PDRPakistan
IranOman
Saudi ArabiaBhutan
MongoliaGCC
MyanmarUAE
JapanKuwait
USFiji
NepalAustraliaBrunei
Hong Kong
97: The computer software industry in India depends considerably on export demands. According to India’s Input–Output Table 2006–2007 and 2007–2008, 82% and 89% of the outputs in computer and related activities are exported, respectively. These ex-ports are equivalent to 14.4% and 15.5% of total exports in India, respectively, as the second-largest export product (among 130 products in these tables).
©20
18 A
sian
Prod
uctiv
ity O
rgan
izat
ion

6
99
6.2 Industry Growth
among the sub-sectors, more recently the iron/steel and motor vehicle sectors have been intensively de-veloped.98 For further improvement in per capita GDP and to capitalize on the demographic dividend (see Box 1, p. 32), expansion of labor-intensive manufacturing may be required in India for greater job creation.99
Economic growth in the Asian Tigers was also dominated by the service sector, albeit more so in Singa-pore and Hong Kong than in the ROC and Korea, where manufacturing remained a significant force. The service sector accounted for 50% of growth in the ROC for the period 2000–2016, 55% in Korea, 75% in Singapore, and 100% in Hong Kong, counterbalancing the negative contribution of 2% by manufacturing (Figures 88 and 89). These compare with 90% in the US, to counterbalance the negative contribution of
Figure 89 Contribution of Service Sector to Economic Growth_Average annual contributions and contribution shares in 1990–2000 and 2000–2016
Sources: Official national accounts in each country, including author adjustments. Note: The starting period for Cambodia is 1993 and Cambodia is not included in CLMV and ASEAN before 1993.
012346 5 −1 % 0 30 60 90 % 12345 0 % 0−30 30 60 90 %
1990−2000 2000−2016
Contribution shareContribution Contribution shareContribution
Bahrain
ROCSingaporeMalaysia
KoreaChinaIndia
VietnamHong Kong
East AsiaIran
Sri LankaBhutan
GCCAPO20Asia24
CambodiaNepal
USAsia30
MyanmarSouth AsiaThailand
UAECLMV
ASEAN6PakistanASEANKuwait
BangladeshIndonesia
OmanAustralia
PhilippinesLao PDRBruneiJapanQatar
FijiTurkey
Mongolia
IndiaChina
South AsiaMongolia
Hong KongQatar
SingaporeBahrain
Sri LankaIndonesiaLao PDR
PhilippinesAsia24Asia30
ASEAN6Bangladesh
BhutanASEAN
East AsiaMalaysiaTurkey
UAEVietnam
CambodiaAPO20
GCCPakistanKuwaitCLMVOmanNepal
ThailandIran
Saudi ArabiaAustralia
KoreaROCFijiUS
MyanmarBruneiJapan
Saudi Arabia61 64
69 64
54 57
35 61
46 103
59 59
57 78
40 51 51
37 53
75 48
53 50 52
62 52
45 53
49 49
45 47
29 52
57 29
27 91
40 52
37 19
6.2 4.6 4.4 4.3
3.9 3.8
3.4 3.3 3.3 3.1 3.1 2.9 2.9 2.8 2.6 2.6 2.5 2.5 2.5 2.5 2.4 2.3 2.3 2.3 2.3 2.3 2.2 2.2 2.1 2.1 2.1 1.9 1.8 1.8 1.7 1.7 1.5
1.3 1.1 1.0 0.9
−0.3
64 46
63 61
100 41
75 70
65 60
46 63
54 54
62 51
42 59
49 65
61 64
46 44
63 57
61 62
40 57
61 58
65 56
73 55
50 84
90 22
−485 84
4.5 4.2 4.2
4.0 3.9 3.9 3.8
3.6 3.5 3.3 3.3 3.2 3.2 3.2 3.1 3.0 3.0 3.0 3.0 2.9 2.9 2.9 2.9 2.8
2.6 2.5 2.5 2.5 2.4 2.4 2.3 2.3 2.3 2.2 2.2 2.1
1.7 1.6
1.4 1.2
0.9 0.5
98: Of the total motor vehicles produced in the world in 2017 (97.3 million), India overtook Korea (4.1) and became the 5th largest producer (4.7), following Germany (5.6), Japan (9.7), the US (11.2), and China (29.0), based on a survey by the International Organization of Motor Vehicle Manufacturers (OICA). India moved up in the rankings from 15th (0.8) in 2000 to 12th (1.6) in 2005, 7th (3.5) in 2010, and 6th (4.2) in 2015.
99: The Indian government established the National Manufacturing Competitiveness Council (NMCC) in September 2004 to en-hance manufacturing competitiveness. By developing this policy direction, the Prime Minister, Shri Narendra Modi, launched the “Make in India” initiative in September 2014 with an aim to give the Indian economy global recognition.
©20
18 A
sian
Prod
uctiv
ity O
rgan
izat
ion

100
6 Industry Perspective
1% by construction. In 2000–2016, growth in Hong Kong was highly skewed toward wholesale and retail trade, hotels, and restaurants, accounting for 35% of growth. This compares with 23% in Singapore and 17% in the ROC. In contrast, the sector contributed only 8% to Korea’s growth over the same period. Finance, real estate, and business activities also played an important role, contributing 37% to growth in Hong Kong, 32% in Singapore, and 15% in the ROC.
The oil-exporting countries have different industry structures from other countries, with a reliance on mining for growth. The sector is volatile in nature and could in turn give rise to big swings in its economies from one period to another. In 2000–2016, mining accounted for 39% of economic growth in Qatar, 26% in Kuwait, and 17% in Saudi Arabia (Figure 86). Still, it has been a drain on growth, in some cases a quite significant one. Its contribution was negative in Iran. Bahrain has been successful in branching into fi-nance, real estate, and business activities, which accounted for 28% of the 5.2% overall growth over the same period. Oman also sustained growth of 4.3% on average per year, 57% of which originated from the service sector. Brunei has not managed as well, with a negative growth of –0.2% on average per year between 2000 and 2016. Mining production activities are also reflected in Myanmar, Mongolia, and the Lao PDR, where mining accounted for 40%, 19%, and 17% of overall economic growth, respectively, in this period.
For some Asian countries, agriculture is still the principal sector. The six countries in which the agriculture sector has the largest share in total value added are Nepal, Cambodia, the Lao PDR, Pak-istan, Vietnam, and Bhutan, as shown in Figure 76. For the period 2000–2016, agriculture in Nepal had the highest con-tribution to economic growth among all Asian countries, ac-counting for 28% of growth (Figure 86). In the latest peri-od, agricultural output contin-ued expanding in the majority of Asian countries, suggesting that the reduction in its value-added share (Figure 80) over the recent period is more a re-sult of rapid growth in other sectors than any actual decline of the sector.
Comparisons across the coun-try groups reveal that Asia achieved more vibrant growth than the US in all sectors. It is notable that the US was more directly affected by the global financial crisis of 2008–2009 than Asia. Overall, con-struction slowed in the US in 2000–2016, while growth was
Figure 90 Industry Origins of Output Growth in Manufacturing___Sub-industry contributions in average annual growth rate of constant-price manufacturing GDP in 1990–2000 and 2000–2016
Sources: Official national accounts in each country, including author adjustments. Note: The starting period for Cambodia is 1993.
3-1. Food products, beverages, and tabacco products
3-3. Wood and wood products
3-5. Coke, petroleum, chemicals, rubber, and plastic products
3-7. Basic metals3-9. Other manufacturing
3-2. Textiles, wearing apparel, and leather products
3-4. Paper, paper products, printing, and publishing
3-6. Other non-metallic mineral products3-8. Machinery and equipment3. Manufacturing GDP growth
% %
0
2
6
10
−2 −1
4
8
12
14
16
20
18
0
2
1
4
6
8
9
3
5
7
101990–2000 2000–2016
Cambodia
Malaysia
KoreaBangladeshIranThailandIndiaRO
CIndonesiaPhilippinesU
SJapan
Cambodia
BangladeshIndiaIranRO
CKoreaPhilippinesM
alaysiaIndonesiaThailandSingaporeKuw
aitJapanU
S
1.3
5.6 5.6
1.01.8
1.33.0
−1.0
1.2 1.4 0.5
0.9
0.50.9 0.6
0.4
0.4
0.6 0.30.6
2.01.5
0.4
1.7 1.61.5
1.2
0.7
0.40.7
1.7
0.30.4
0.4
0.4
−0.3
12.6
3.60.5 0.9
−0.4
0.3
−0.3
1.3
0.6
1.01.7 0.8 0.7
2.3 1.0
18.1
9.5
8.5
6.76.0
5.4 5.34.5
2.6
2.6 2.5
0.10.7 0.5 0.30.5
1.0
2.3
1.9
4.6
3.8
1.1 1.6 1.42.0 1.2
0.61.1 0.9
0.6
0.7
0.4
0.3
0.7
0.4
0.50.4
1.7
2.1
0.7
0.7
0.8
1.3
0.5
0.7 1.9
2.2
7.63.9
0.9
0.6
0.9
0.7
0.5
2.2 0.61.5
0.8
9.4
8.1
7.5
5.95.6
5.1
4.5
4.0 4.0 3.83.3
3.2
1.0 0.90.3
©20
18 A
sian
Prod
uctiv
ity O
rgan
izat
ion

6
101
6.2 Industry Growth
strongest in CLMV and the GCC countries at 9.8% and 7.2% per year on average, respectively, as pre-sented in Table 23 in Appendix 9 (p. 163). Apart from construction, the other fast-growing sectors in CLMV were electricity, gas, and water supply (at 10.2% per year on average), presumably reflecting their effort in building industry infrastructure for their development needs.100 Finance, real estate, and business activities also experienced robust expansion at 8.7% per year on average in South Asia. Manufacturing has been growing at 9.3% per year on average in CLMV, compared with 4.3% in the ASEAN6.
Figure 90 illustrates the sub-industry origins of average annual growth of manufacturing GDP for se-lected Asian countries for the periods 1990–2000 and 2000–2016.101 Manufacturing in Asia has been dominated by 3-8 (machinery and equipment) accounting for 35% or more of overall manufacturing growth in half of the Asian countries compared. In the ROC and Korea, it was about 80%. The sub-sector
100: See Chapter 8 in last year’s edition of Databook for the details on the recent national development strategies in each Asian country.
101: The Törnqvist quantity index is adopted for calculating the growth of real GDP of manufacturing. Using this index, the growth of real GDP of manufacturing into the products of contributions by sub-industries of manufacturing can be decomposed:
=∑ j(1/2) (sjt+sj
t−1)ln(Qjt/Qj
t−1)Real GDP growth of manufacturing Contribution of a suv-industry j
ln(GDP t/GDP t−1) where Qj
t is real GDP of a sub-industry j in period t and sjt is the
nominal GDP share of a sub-industry j in period t.
Figure 91 Industry Origins of Asian Economic Growth_Contributions of industry growth in constant-price GDP for the whole Asia (Asia30) in 2000–2016, using 2011 PPP
Sources: Official national accounts in each country, including author adjustments.
0 5 10 15 20 25 30
China India KoreaIndonesia ROC Rest of the world
%
6. Wholesale and retail trade, hotels, and restaurants (14.1%)
0 3 6 9 12 15
China India Indonesia Iran Saudi Arabia Rest of the world
%
7. Transport, storage, and communications (9.3%)
0 2 4 6 8
China India Indonesia Iran Saudi Arabia Rest of the world
10 %
1. Agriculture (5.7%)
0 1 2 3 4 5 6
China India Indonesia PakistanIran Rest of the world
%
0 0.5 1 1.5 2 2.5 3
China India Iran Vietnam Indonesia Rest of the world
%
3. Manufacturing (28.3%)
4. Electricity, gas, and water supply (2.4%)
9. Community, social, and personal services (14.6%)
2 6 10 140 4 8 12 16
China India Indonesia PakistanKorea Rest of the world
%
8. Finance, real estate, and business activities (14.1%)
14 %0 2 4 6 8 10 12
China India IranIndonesia Korea Rest of the world
5. Construction (7.0%)
7 %0 1 2 3 4 5 6
China India Indonesia Qatar Saudi Arabia Rest of the world
2. Mining (4.6%)
0 1 2 3 4 5
China Qatar India MyanmarSaudi Arabia Rest of the world
%
21.7 2.7 0.70.6
0.4 2.3
7.6 3.4 0.70.20.2 2.0
4.8 2.0 0.9 0.20.2 1.3
3.2 1.4 0.3 0.10.1 0.5
1.7 0.3 0.10.10.1 0.3
10.1 2.0 0.30.3
0.2 1.7
7.2 3.5 0.50.3
0.2 2.1
3.1 0.5 0.3 0.2 0.1 0.4
4.5 1.3 0.40.10.1 0.6
©20
18 A
sian
Prod
uctiv
ity O
rgan
izat
ion

102
6 Industry Perspective
1. Agriculture 2. Mining 3. Manufacturing5. Construction 6. Wholesale and retail trade, hotels, and restaurants 7. Transport, storage, and communications9. Community, social, and personal services Real GDP growth
4. Electricity, gas, and water supply8. Finance, real estate, and business activities
Bangladesh
Brunei Cambodia China
ROC Fiji
India Indonesia Iran
Japan Korea
Lao PDR Malaysia
Kuwait
−6
−3
9
6
3
0
12
0
−30
−20
−10
10
20%
−3
0
3
6
9
15
12
%
−3
0
3
6
9
12
%
−3
0
3
6
9
12
15%
−9
−6
−3
0
3
6
9
12%
−8
−4
0
4
8
12%
−18
−12
−6
0
6
12%
−30
−20
−10
0
10
20%
−6
−4
−2
0
2
6
4
8
10%
0
3
6
9
−6
−3
12
15%
−10
−5
0
5
10
15%
0
4
8
−8
−4
20
16
12
% %
−60
−40
−20
0
20
40
80
60
%
15
Hong Kong
−8
−4
0
4
8
12%
Bahrain
−10
0
10
20
30
40% % %
1971 1976 1981 1986 1991 1996 2001 2006 2011 2016 1971 1976 1981 1986 1991 1996 2001 2006 2011 2016 1971 1976 1981 1986 1991 1996 2001 2006 2011 2016
1971 1976 1981 1986 1991 1996 2001 2006 2011 2016 1971 1976 1981 1986 1991 1996 2001 2006 2011 2016 1971 1976 1981 1986 1991 1996 2001 2006 2011 2016
1971 1976 1981 1986 1991 1996 2001 2006 2011 2016 1971 1976 1981 1986 1991 1996 2001 2006 2011 2016 1971 1976 1981 1986 1991 1996 2001 2006 2011 2016
1971 1976 1981 1986 1991 1996 2001 2006 2011 2016 1971 1976 1981 1986 1991 1996 2001 2006 2011 2016 1971 1976 1981 1986 1991 1996 2001 2006 2011 2016
1971 1976 1981 1986 1991 1996 2001 2006 2011 2016 1971 1976 1981 1986 1991 1996 2001 2006 2011 2016 1971 1976 1981 1986 1991 1996 2001 2006 2011 2016
1971 1976 1981 1986 1991 1996 2001 2006 2011 2016 1971 1976 1981 1986 1991 1996 2001 2006 2011 2016 1971 1976 1981 1986 1991 1996 2001 2006 2011 2016−16
−12
−8
−4
0
4
8
12
Mongollia
Bhutan
−10
−5
0
5
20
15
10
©20
18 A
sian
Prod
uctiv
ity O
rgan
izat
ion
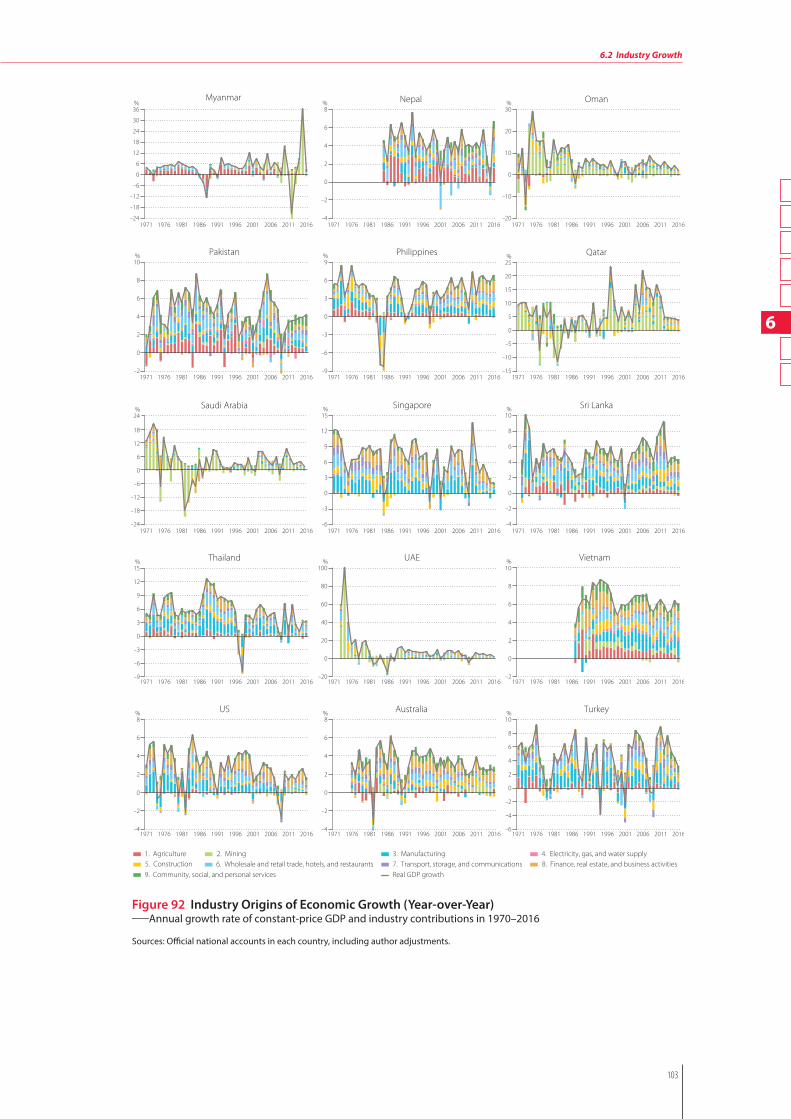
6
103
6.2 Industry Growth
Figure 92 Industry Origins of Economic Growth (Year-over-Year)_Annual growth rate of constant-price GDP and industry contributions in 1970–2016
Sources: Official national accounts in each country, including author adjustments.
1. Agriculture 2. Mining 3. Manufacturing5. Construction 6. Wholesale and retail trade, hotels, and restaurants 7. Transport, storage, and communications9. Community, social, and personal services Real GDP growth
4. Electricity, gas, and water supply8. Finance, real estate, and business activities
Myanmar
−24
−18
0
−6
−12
12
36
24
18
30
6
%30
Oman%
10Pakistan%
Nepal 8
%
9Philippines%
−15
−10
−5
0
5
10
15
20
25Qatar%
24
Saudi Arabia%
−20
−10
0
10
20
−4
−2
0
2
6
8
4
10%
−2
0
2
4
6
8
−24
−18
−12
−6
0
6
12
18
−9
−6
−3
0
3
6
12
9
15%
−9
−6
−3
0
3
6
−6
−3
0
3
6
9
12
15%
−4
−2
0
2
4
6
Singapore Sri Lanka
Thailand UAE% Vietnam%
US
−20
0
20
40
60
80
100
−4
−2
0
2
4
6
8%
−2
0
2
4
8
6
10
−6
−4
−2
0
2
4
6
8
10%Australia Turkey
−4
−2
0
2
4
6
8%
1971 1976 1981 1986 1991 1996 2001 2006 2011 2016 1971 1976 1981 1986 1991 1996 2001 2006 2011 2016 1971 1976 1981 1986 1991 1996 2001 2006 2011 2016
1971 1976 1981 1986 1991 1996 2001 2006 2011 2016 1971 1976 1981 1986 1991 1996 2001 2006 2011 2016 1971 1976 1981 1986 1991 1996 2001 2006 2011 2016
1971 1976 1981 1986 1991 1996 2001 2006 2011 2016 1971 1976 1981 1986 1991 1996 2001 2006 2011 2016 1971 1976 1981 1986 1991 1996 2001 2006 2011 2016
1971 1976 1981 1986 1991 1996 2001 2006 2011 2016 1971 1976 1981 1986 1991 1996 2001 2006 2011 2016 1971 1976 1981 1986 1991 1996 2001 2006 2011 2016
1971 1976 1981 1986 1991 1996 2001 2006 2011 2016 1971 1976 1981 1986 1991 1996 2001 2006 2011 2016 1971 1976 1981 1986 1991 1996 2001 2006 2011 2016
©20
18 A
sian
Prod
uctiv
ity O
rgan
izat
ion

104
6 Industry Perspective
3-1 (food products, beverages, and tobacco products) is the largest contributor in the Philippines and Indonesia for 2000–2016, accounting for 48% and 38% of manufacturing output growth. In Cambodia and Bangladesh, manufacturing growth has been dominated by the sub-sector of 3-2 (textiles, wearing apparel, and leather products), whereas in Kuwait, and to a lesser extent Singapore and Iran, it is 3-5 (coke, petroleum, chemicals, rubber, and plastic products).
Figure 91 presents industry contributions to regional economic growth in the Asia30 during 2000–2016, decomposing Figure 9 in Section 3.1 (p. 21) into countries’ industry origins.102 In each industry contribu-tion, the top five countries are presented. The top four industries in terms of contributions to regional growth were manufacturing (28%), community, social, and personal services (15%), wholesale and retail trade (14%), and finance, real estate, and business activities (14%). A total of 28% of Asian economic growth originated from the expansion of its manufacturing sector, more than two-thirds of which was accounted for by China. In other words, China’s manufacturing sector alone accounted for 22% of the region’s economic growth. This was followed by China’s community, social, and personal services (10%) and wholesale and retail trade, hotels, and restaurants (8%).
Over a period of four decades there has been a noticeable shift in the industry origins of economic growth (Figure 92). For the ROC and Korea, manufacturing has been a clear driving force behind economic growth as a whole. In the decade between the mid-1980s and the mid-1990s, however, the importance of manufacturing in the ROC retreated temporarily while the economy developed its service sector. Since the mid-1990s, the role of manufacturing in the ROC has increased again, although compared to its heyday of the 1970s and 1980s its impact in terms of percentage points is much reduced. In Singapore, finance, real estate, and business activities, as well as wholesale and retail trade, hotels, and restaurants are important drivers alongside the manufacturing sector. Working within the data constraints, Hong Kong appears a clear service-driven economy in recent years. While the lack of diversification of the oil-exporting countries cannot be missed; historically, the dominance of the mining sector influenced the economic volatility of these countries. In recent years the GCC countries have been making efforts in diversifying, especially into the service sector, with different degrees of success. Bahrain and Oman are leading the way and have yielded results. The largely agricultural countries are Myanmar, the Lao PDR, Cambodia, Nepal, and Pakistan, and, to a lesser extent, Vietnam and Bangladesh. In the Philippines, construction was driving economic growth in the first half of the period, but it never recovered its domi-nance after its crash in the mid-1980s. In the second half, economic growth was better balanced, with the development of finance, real estate, and business activities in particular.
102: The average growth rate of the Asian economy for 2000–2016 is set at 100%. Asian economic growth is calculated as the sum of the contributions over countries and industries:∑ x(1/2)(sx
t+sxt−1)∑ j(1/2)(sx, j
t +sx, jt−1)ln(Qx, j
t /Qx, jt−1)
Contribution of an industry j in a country x where Qx, j
t is real GDP of an industry j in a country x in period t, sx, jt is GDP share of
an industry j in a country x with respect to GDP of a country x in period t and sxt is GDP share of a country x with respect to the
regional GDP in period t.
©20
18 A
sian
Prod
uctiv
ity O
rgan
izat
ion

6
105
6.2 Industry Growth
Box 6 Premature Deindustrialization
Deindustrialization, or the shrinkage of the manufacturing sector, has been a major concern in advanced economies for reasons, Rodrik (2016) calls “premature deindustrialization.” He claims that many developing economies in recent periods are starting to have a declining share of the manufacturing sector without experi-encing full industrialization. Premature deindustrialization may harm developing economies in the course of its economic development because the manufacturing is a dynamic sector typically at the center of sustained economic growth and technological progress (Figure 77). The sector also has created massive jobs for rela-tively poor people (Figure 85). Additionally, it generates flows of labor from rural to urban, and from informal to formal sectors, as well as nurturing human capital. Early servicification of the economy without a mature manufacturing sector may jeopardize a smooth transition from developing to developed economies.
Rodrik points out that premature deindustrialization is serious particularly in Latin America and Sub-Saharan Africa. How about in Asia? Figure B6.1 plots GDP shares of the manufacturing sector in Asian economies, placing the peak of each country’s inverse U shape at the center. A typical image of the up and down is drawn by the US and Japan with peaks above 30% in 1946 and 1961 respectively. The peaks in manufacturing GDP are faster than those in manufacturing employment shares, which are 1970 in the US and 1976 in Japan. China, the ROC, and Korea also reach their peaks above 30% in 1978, 1986, and 2011, respectively, and
continued on next page >
Figure B6.1 Country Peaks in Manufacturing GDP Share_GDP share of manufacturing in 1970–2016
Sources: Official national accounts in each country, including author adjustments; APO Productivity Database 2018. Note: The lines presents the trends based on the three-year moving averages.
−50 −40 −30 −20 −10 peak +10 +20 +30 +40 +50
Elapsed years from the peak year in which each country
0
5
10
15
20
25
30
35
40% Manufacturing share in value added
Bangladesh, 2009 (1972–2016)
Bhutan, 1996 (1970–2016)
Cambodia, 2004 (1993–2016)
China, 1978 (1952–2016)
Fiji, 2011 (1977–2016)
Hong Kong, 1984 (1980–2016)
India, 1979 (1950–2016)
Indonesia, 2001 (1960–2016)
Iran, 1991 (1970–2016)
Japan, 1961 (1955–2016)
Korea, 2011 (1953–2016)
Lao PDR, 2009 (1970–2016)
Malaysia, 2000 (1970–2016)
Mongolia, 1992 (1970–2016)
Myanmar, 1977 (1970–2016)
Nepal, 1995 (1974–2016)
Pakistan, 2008 (1970–2016)
Philippines, 1973 (1970–2016)
ROC, 1986 (1951–2016)
Singapore, 2004 (1960–2016)Sri Lanka, 1976 (1971–2016)
Thailand, 2010 (1970–2016)
US, 1946 (1929–2016)
Vietnam, 1986 (1986–2016)
©20
18 A
sian
Prod
uctiv
ity O
rgan
izat
ion

106
6 Industry Perspective
remain high. Thailand, Malaysia, and Singapore show a similar pattern with the peaks in 2001, 2000, and 2004, respectively. The Philippines somehow reached its peak in 1973 and recently holds around 20%. Indone-sia is also just above 20%. Although these are respectable figures, some more room for industrialization may be suggested. However, Cambodia, Bangladesh, India, Pakistan, and Vietnam are struggling somewhere below 20%. Obviously these countries are not fully industrialized yet, needing further effort to promote the sector.
On the other hand, the recent IMF (2018, Chapter 3) suggests that service sectors can potentially drive economy-wide productivity growth, and that the decline in manufacturing jobs has contributed little to the rise in labor income inequality in advanced economies. Figure B6.2 indicates that less and middle income Asian countries with low and stagnated share of manufacturing GDP seem to have succeeded to improving their per capita income level. However, it is quite uncertain if these countries could continue to grow by skipping the intermediate stage of mature industrialization.
> continued from previous page
Figure B6.2 Manufacturing GDP Share and Per Capita GDP_Five-year moving averages of shares of manufacturing GDP and per capita GDP in 1970–2016
Sources: Official national accounts in each country, including author adjustments; APO Productivity Database 2018.
0 40 80 120 160
5
0
10
15
20
25
30%
40 500 10 20 30 60
5
0
10
15
20
25
30
35
40%
20 25 30 350 5 10 15 40
5
0
10
15
20
25
30
35%
4 5 60 1 2 3 7
5
0
10
15
20
25%
80 2 4 6 10
5
0
10
15
20
30
25
%
0 5 10 15 200
5
10
15
20
25
30
40
35
%
Manufacturing share in value added Manufacturing share in value added Manufacturing share in value added
Manufacturing share in value addedManufacturing share in value addedManufacturing share in value added
Thousands of US dollars (as of 2016)
Per capita GDP at constant prices
Thousands of US dollars (as of 2016)
Thousands of US dollars (as of 2016)
Thousands of US dollars (as of 2016)
Thousands of US dollars (as of 2016)
Thousands of US dollars (as of 2016)
Per capita GDP at constant prices Per capita GDP at constant prices
Per capita GDP at constant pricesPer capita GDP at constant pricesPer capita GDP at constant prices
Brunei Hong Kong
Singapore
Australia Japan
ROC USA
Korea Malaysia
Turkey
China Indonesia Iran
Mongolia Sri Lanka
Bhutan Fiji
India Lao PDR
Philippines
Bangladesh Cambodia Myanmar
Nepal Pakistan Vietnam
6.3 Labor Productivity by Industry
Section 5.1 (p. 55) discusses per-worker measures of labor productivity performance in level terms, and iden-tifies a large gap between Asia as a whole and the US. In 2016, Singapore and Hong Kong were the countries that had labor productivity levels comparable to the US, as shown in Figure 45 (p. 55). Besides these two, the best performers in Asia achieved productivity levels that were about two-thirds of the US. However, Asia collectively was dragged down by a long tail of countries with labor productivity of less than 30% of the US level. This pulled down the average performance to 22% of the US for the Asia24 (Table 14 in Ap-pendix 9, p. 152). In growth terms, however, Asia’s performance far exceeded the US, allowing the countries to gradually close the gap with the US over time. Labor productivity growth in the Asia24 was 4.6% per year on average between 2010 and 2016, compared to 0.6% in the US (Table 15 in Appendix 9, p. 153).
©20
18 A
sian
Prod
uctiv
ity O
rgan
izat
ion

6
107
6.3 Labor Productivity by Industry
Figure 93 Industry Origins of Labor Productivity Growth_Average annual growth rate of constant-price GDP per worker and industry contributions in 1990–2000 and 2000–2016
Source: APO Productivity Database 2018.
5. Construction8. Finance, real estate, and business activities
3. Manufacturing6. Wholesale and retail trade, hotels, and restaurants
9. Community, social, and personal services
1. Agriculture4. Electricity, gas, and water supply
7. Transport, storage, and communicationsPer-worker labor productivity growth
2. Mining
−0.5 −0.4 −0.3 −0.5−1.4
0.4
−0.4 −0.3 −0.4
−0.3
−0.6
−0.3 −0.4
−0.9
−0.5
1.0
0.30.30.5
−1.3
0.3
0.7
0.7
0.50.30.4
4.1
0.6
1.1
8.9
0.9
0.6
2.7
0.6
5.1
0.7
1.2
0.4
0.7
1.7
0.3
5.1
0.7
1.4
0.5
0.7
0.8
0.5
5.1
0.5
0.40.3
1.8
0.7
4.1
0.9
0.4
0.60.3
1.4
0.3
4.0
0.6
0.8
0.4
0.7
0.3
0.6
3.8
1.0
0.50.40.5
1.7
3.6
0.6
0.40.3
1.3
0.5
3.6
0.4
0.6
0.60.30.6
0.60.3
3.6
0.6
0.40.3
1.2
0.30.5
3.5
0.5
0.7
0.4
0.6
0.3
0.5
3.5
0.6
0.30.40.50.4
1.4
3.5
0.3
0.8
0.4
0.5
0.50.3
3.4
0.50.4
0.8
1.7
3.2
0.50.30.4
0.8
0.5
2.6
0.50.4
0.9
0.7
2.6
0.50.4
0.9
0.3
2.5
1.0
0.3
0.3
2.3
0.5
0.4
0.8
2.3
0.5
0.40.3
1.2
2.3
0.5
0.9
0.3
0.42.2
0.40.40.3
0.30.3
2.1
0.30.4
0.8
0.52.1
0.5
1.9
2.1
0.50.3
0.5
2.0
0.5
0.6
0.7
1.9
0.5
0.7
0.51.8
0.3
0.61.1
0.5
0.8
0.8
0.30.4
0.8
−1.4−1.6
−0.3−0.9
−0.5 −0.3 −0.4
0.6
−0.3 −0.3 −0.7−0.4 −0.3
−1.2
−1.2
−1.1 −1.0 −0.3
0.8
1.0
0.6
0.7
0.40.3
2.7
0.5
1.6
8.6
0.9
1.4
0.7
1.0
1.1
0.6
5.9
0.3
0.8
0.40.4
1.8
0.3
1.3
5.6
0.8
1.2
0.6
0.9
0.9
0.4
5.2
0.5
0.8
0.50.5
1.5
0.8
4.9
0.4
0.8
0.50.4
1.4
0.8
4.8
0.5
0.5
3.0
0.44.5
0.8
0.9
1.0
0.5
1.1
0.64.3
0.6
0.8
0.7
0.40.3
0.60.30.6
4.3
0.30.4
0.30.30.6
1.0
0.9
4.2
0.9
0.5
0.7
0.3
0.8
0.4
4.0
0.30.70.30.30.3
0.7
1.0
4.0
0.7
0.30.4
1.3
1.4
3.9
0.5
1.2
0.3
0.7
0.5
3.6
0.5
0.40.4
0.7
0.9
3.5
0.6
0.7
0.7
1.6
0.40.3
3.4
0.6
0.7
0.3
0.7
0.5
3.2
0.50.4
0.9
0.6
3.2
0.6
0.7
0.3
0.8
0.4
3.1
0.3
0.7
0.40.3
0.7
2.7
0.9
1.1
2.6
0.9
1.0
2.6
0.4
0.3
1.4
0.32.5
0.3
1.5
2.4
0.30.5
0.30.4
1.8
1.3
0.5
0.81.8
0.3
1.0
1.8
0.8
0.6
0.40.3
1.4
0.60.40.3
1.2
0.30.30.3
0.31.1
0.7
1.0
0.4
0.30.9
0.3
0.50.6
−2.5
−4
−3
−2
−1
0
2
4
6
8
1
3
5
7
9%
−4
−3
−2
−1
0
2
4
6
8
9
1
3
5
7
%
1990−2000
2000−2016
China
Korea
ROC
Vietnam
East Asia
Malaysia
India
Singapore
Asia24
Bhutan
Asia30
South Asia
Cambodia
CLMV
Thailand
Sri Lanka
ASEAN6
ASEAN
Australia
Bangladesh
Nepal
Iran
Pakistan
Indonesia
Myanm
ar
APO20
US
Turkey
Japan
Hong Kong
Philippines
Fiji
Mongolia
Brunei
China
India
East Asia
South Asia
Asia24
Asia30
Myanm
ar
Mongolia
Sri Lanka
CLMV
Bangladesh
Vietnam
Cambodia
Indonesia
Turkey
Bhutan
ASEAN
Thailand
ASEAN6
APO20
Hong Kong
Philippines
Korea
ROC
Iran
Singapore
Malaysia
Nepal
Pakistan
Fiji
Australia
US
Japan
Brunei
©20
18 A
sian
Prod
uctiv
ity O
rgan
izat
ion
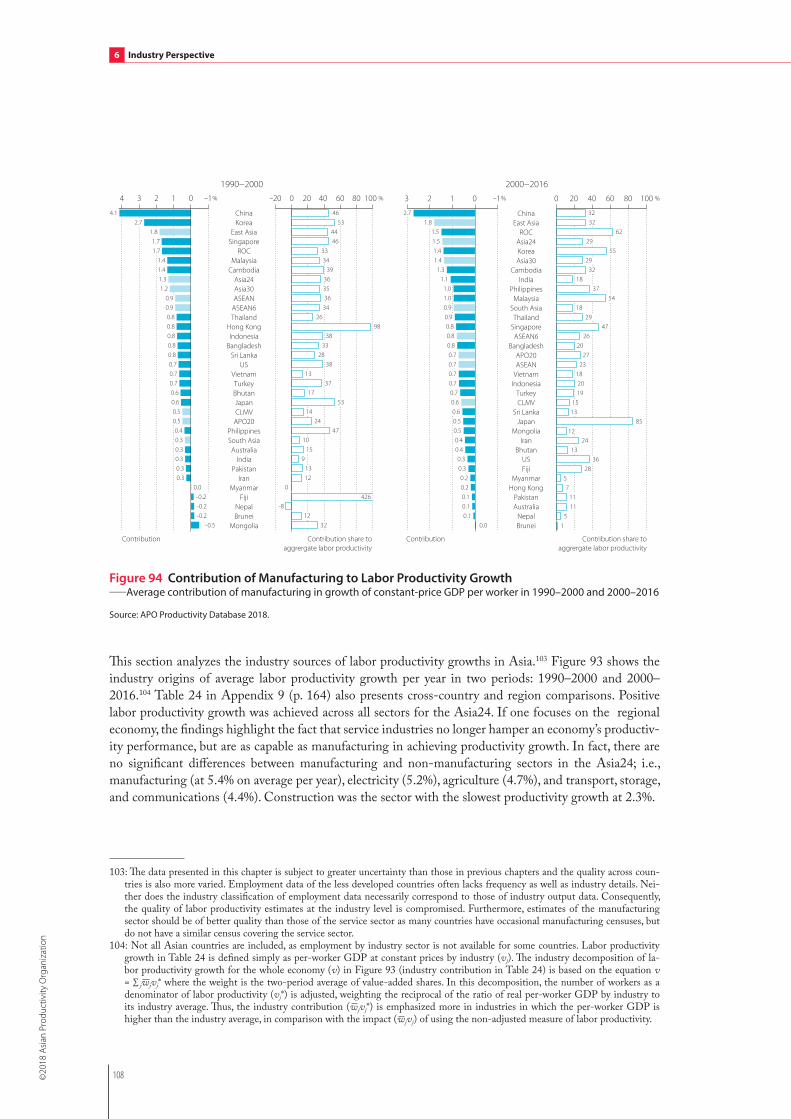
108
6 Industry Perspective
103: The data presented in this chapter is subject to greater uncertainty than those in previous chapters and the quality across coun-tries is also more varied. Employment data of the less developed countries often lacks frequency as well as industry details. Nei-ther does the industry classification of employment data necessarily correspond to those of industry output data. Consequently, the quality of labor productivity estimates at the industry level is compromised. Furthermore, estimates of the manufacturing sector should be of better quality than those of the service sector as many countries have occasional manufacturing censuses, but do not have a similar census covering the service sector.
104: Not all Asian countries are included, as employment by industry sector is not available for some countries. Labor productivity growth in Table 24 is defined simply as per-worker GDP at constant prices by industry (vj). The industry decomposition of la-bor productivity growth for the whole economy (v) in Figure 93 (industry contribution in Table 24) is based on the equation v = ∑ jwjvj* where the weight is the two-period average of value-added shares. In this decomposition, the number of workers as a denominator of labor productivity (vj*) is adjusted, weighting the reciprocal of the ratio of real per-worker GDP by industry to its industry average. Thus, the industry contribution (wjvj*) is emphasized more in industries in which the per-worker GDP is higher than the industry average, in comparison with the impact (wjvj) of using the non-adjusted measure of labor productivity.
This section analyzes the industry sources of labor productivity growths in Asia.103 Figure 93 shows the industry origins of average labor productivity growth per year in two periods: 1990–2000 and 2000–2016.104 Table 24 in Appendix 9 (p. 164) also presents cross-country and region comparisons. Positive labor productivity growth was achieved across all sectors for the Asia24. If one focuses on the regional economy, the findings highlight the fact that service industries no longer hamper an economy’s productiv-ity performance, but are as capable as manufacturing in achieving productivity growth. In fact, there are no significant differences between manufacturing and non-manufacturing sectors in the Asia24; i.e., manufacturing (at 5.4% on average per year), electricity (5.2%), agriculture (4.7%), and transport, storage, and communications (4.4%). Construction was the sector with the slowest productivity growth at 2.3%.
Figure 94 Contribution of Manufacturing to Labor Productivity Growth_Average contribution of manufacturing in growth of constant-price GDP per worker in 1990–2000 and 2000–2016
Source: APO Productivity Database 2018.
−1 −160 80 100 % % 10080 %% 0−20 40 20 01234 1 023 4020 600
Contribution share toaggrergate labor productivity
Contribution Contribution share toaggrergate labor productivity
Contribution
2000−20161990−2000
ChinaKorea
East AsiaSingapore
ROCMalaysia
CambodiaAsia24Asia30ASEAN
ASEAN6Thailand
Hong KongIndonesia
BangladeshSri Lanka
USVietnamTurkeyBhutanJapanCLMVAPO20
PhilippinesSouth AsiaAustralia
IndiaPakistan
IranMyanmar
FijiNepalBrunei
Mongolia
ChinaEast Asia
ROCAsia24KoreaAsia30
CambodiaIndia
PhilippinesMalaysia
South AsiaThailand
SingaporeASEAN6
BangladeshAPO20ASEAN
VietnamIndonesia
TurkeyCLMV
Sri LankaJapan
MongoliaIran
BhutanUSFiji
MyanmarHong Kong
PakistanAustralia
NepalBrunei
46 53
44 46
33 34
39 36 35 36
34 26
98 38
33 28
38 13
37 17
53 14
24 47
10 15
9 13 12
0 426
−8 12
32
4.1 2.7
1.8 1.7 1.7
1.4 1.4 1.3 1.2
0.9 0.9 0.8 0.8 0.8 0.8 0.8 0.7 0.7 0.7 0.6 0.6 0.5 0.5 0.4 0.3 0.3 0.3 0.3 0.3
0.0 −0.2 −0.2 −0.2
−0.5
32 32
62 29
55 29
32 18
37 54
18 29
47 26
20 27
23 18 20 19
15 13
85 12
24 13
36 28
5 7
11 11
5 1
2.7 1.8
1.5 1.5 1.4 1.4 1.3
1.1 1.0 1.0 0.9 0.9 0.8 0.8 0.8 0.7 0.7 0.7 0.7 0.7 0.6 0.6 0.5 0.5 0.4 0.4 0.3 0.3 0.2 0.2 0.1 0.1 0.1
0.0
©20
18 A
sian
Prod
uctiv
ity O
rgan
izat
ion

6
109
6.3 Labor Productivity by Industry
The manufacturing sector has been a major driving force behind productivity growth in most Asian coun-tries, as shown in Figure 94. In the 1990s, manufacturing accounted for a significant part of labor produc-tivity growth in Hong Kong (98%), Indonesia (38%), and China (46%). Nevertheless, its role has lessened in 2000–2016 to 7%, 20%, and 32%, respectively. In contrast, contributions from manufacturing strength-ened from 33% to 62% in the ROC and from 53% to 85% in Japan between the two periods. In other economies, like Brunei, Nepal, and Myanmar, manufacturing played a negligible role in the 2000s.
Traditionally, it has been difficult for the service sector to realize productivity growth, but modern ad-vancements in information and communication technology have changed this. Many IT-intensive users are located in this sector, which is capable of capturing the productivity benefits arising from IT utilization. The growing importance of these services has been observed in explaining the productivity growth in Western economies of recent decades. In Asia, the contribution from services matches that of manufac-turing. Among the four industries in the service sector, three are potentially IT-employing industries: wholesale and retail trade, hotels, and restaurants; transport, storage, and communications; and finance, real estate, and business activities.
Figure 95 presents the contribution of services in labor productivity growth by country. In 2000–2016, services were contributing at least one-third or more to labor productivity growth in most Asian countries. The contribution was predominant in Hong Kong and India, accounting for 91% and 67% of labor pro-ductivity growth, respectively. It also accounted for around two-thirds or more of labor productivity growth in Fiji and other South Asian countries like Bangladesh, Nepal, and Pakistan. There is an expan-sion of the role played by services in China between these two periods, from 26% to 36%.
Figure 95 Contribution of Service Sector to Labor Productivity Growth_Average contribution of service sector in growth of constant-price GDP per worker in 1990–2000 and 2000–2016
Source: APO Productivity Database 2018.
024 %−2 −20 0 4020 60 80 100 % −2024 % 0 20 40 60 80 100 %
Contribution Contribution share toaggrergate labor produtcivity
Contribution Contribution share toaggrergate labor productivity
1990−2000 2000−2016−20
ROCIndia
VietnamChina
South AsiaBhutan
MalaysiaCambodia
CLMVKoreaAsia24
AustraliaSingapore
Asia30Sri Lanka
IranPakistanEast AsiaAPO20Nepal
USBangladesh
ASEANASEAN6ThailandTurkey
IndonesiaJapan
Hong KongMongolia
PhilippinesMyanmar
FijiBrunei
IndiaSouth Asia
ChinaSri Lanka
Hong KongMongolia
BangladeshAsia24Asia30Nepal
IndonesiaEast AsiaAPO20
ASEAN6ASEAN
VietnamBhutanPakistanThailandTurkey
IranPhilippines
CLMVSingapore
FijiROC
KoreaCambodiaMalaysia
USAustraliaMyanmar
BruneiJapan
58 66
46 26
64 53
48 52
44 30
40 62
39 40
51 61 61
31 62
54 59
44 39
31 21
33 26
39 19
−11 13
4 1831 100
3.0 2.5 2.3 2.3 2.2
1.9 1.9 1.8
1.5 1.5 1.5 1.4 1.4 1.4 1.4 1.4 1.3 1.3 1.3 1.2 1.1 1.0 1.0 0.8 0.7 0.6 0.6 0.4
0.2 0.2 0.1 0.1
−0.7 −1.6
67 68
36 57
91 55 58
45 45
151 56
33 64
53 52
39 43
114 44
40 71
49 29
59 88
34 28
18 34
58 44
5 −3
0
3.9 3.5
3.1 2.5 2.4 2.4 2.3 2.2 2.2 2.1 2.0 1.9 1.8 1.7 1.6 1.6 1.5 1.4 1.4 1.4 1.3 1.3 1.2 1.1 0.9 0.8 0.7 0.7 0.6 0.5 0.5
0.2 0.1
0.0
©20
18 A
sian
Prod
uctiv
ity O
rgan
izat
ion

110
6 Industry Perspective
Box 7 Redefining Myanmar’s Growths
The economic potential of Myanmar is attracting significant attention. However, some questions have been raised about the reliability of Myanmar’s official system of national accounts (MMSNA). First, it is suspected that under the military regime, economic growth might have been significantly overstated since the latter half of the 1990s, by The Economist Intelligence Unit (EIU) (2010) and the ADB (2017). The second problem is that until the shift to the managed floating exchange rate system in April 2012, the official exchange rate had been used in the MMSNA in converting international trade into the national currency. Under the official ex-change rate, which set the value of the Myanmar kyat at a level far above the market exchange rate, the amounts of exports and imports were significantly undervalued, resulting in a significant underestimation of GDP. The third problem is extensive illegal trade. In recent years, Global Witness (2015a and 2015b) and Dapice et al. (2010) pointed out that illegal exports of jade, whose prices began to surge in the latter half of the 2000s, have not been properly reflected in the MMSNA. According to those recent research findings, the total transaction value of jade is estimated at 48% of Myanmar’s GDP in 2014.
In a bid to respond to those problems, Nomura and Shirane (2016) developed new estimates of GDP based on industry-level estimates for Myanmar. Figure B7 presents the revised estimates in comparison with the official estimates and the revised estimates in EIU and ADB, which do not include the jade trade. The revised esti-mates show that Myanmar’s real GDP growth turned negative twice; first in 2003–2004, reflecting the impact of the economic sanctions by the U.S. and Europe, and second in 2007–2008, reflecting the impacts of the Cyclone Nargis that hit Myanmar in May 2008, the damage of which was estimated as more than 15% of GDP, and the fallouts of the global financial crisis. In terms of the average growth rate for the period 1998–2010, the revised estimate of 4.9% represents a downward revision of 7.0 percentage points compared with the MMSNA estimate of 11.9%. Although Myanmar’s productivity performance seemed superior to those of other Asian countries in the past Databook series, the downward revision to economic growth in 1998–2010 brings Myanmar’s GDP growth and labor productivity growth closer to those of Thailand and Bangladesh.
Meanwhile, the impact of revaluing jade transactions on macroeconomic growth is observed from the mid-2000s, for instance, turning negative growth estimated for 2004 before reflecting the reassessed values of jade transactions to positive growth. The impact of revaluation of jade is even more noticeable in 2008 and thereaf-ter with jade production accounting for more than 10% of Myanmar’s GDP. Notably, the revaluation of jade results in a significant upward revision in 2009–2010, from 3.2% to 16.5%. On the other hand, real GDP dropped 22.6% in 2012 as jade production decreased by half following the transfer of power to the civilian government. Although subject to a certain degree of data uncertainty, this edition of the Databook follows the updated estimates based on the revisions in Nomura and Shirane (2016).
Figure B7 Official and Revised Estimates of GDP Growth in Myanmar
Source: Official system of national accounts in Myanmar; The Economist Intelligence Unit (EIU) (2010); ADB (2017); Nomura and Shi-rane (2016); APO Productivity Database 2018.
average annual growth rate
1991 1990−1998 1998−2010 2010−20161995 1999 2003 2007 2011 2015
annual growth rate
−15
−10
−5
05
20
15
10
35
30
25
−25
−200
2
4
8
6
12
10
−2
O�cial estimate in MMSNAADB estimateEIU estimateDatabook (without jade trades)Databook (with jade trades)
O�cial estimate in MMSNAADB estimateEIU estimateDatabook (without jade trades)Databook (with jade trades)
5.9
11.9
7.0
4.7
7.0
5.9
3.0
5.7
4.6 4.9 5.3
4.6
6.8
4.2
% %
©20
18 A
sian
Prod
uctiv
ity O
rgan
izat
ion

7
111
The constant-price GDP captures real production, not real income. An improvement in the terms of trade, which is defined as the relative price of a country’s exports to imports, explicitly raises real income and, in turn, welfare.105 In many ways, a favorable change in the terms of trade is synonymous with tech-nological progress, making it possible to get more for less. That is, for a given trade balance position, a country can either import more for what it exports, or export less for what it imports.
7.1 Real Income and Terms of Trade
By focusing on production, the real GDP concept does not capture the beneficial effect of the improve-ment in the terms of trade.106 In contrast, real income focuses on an economy’s consumption possibilities, and in turn captures the impact of a change in the relative price of exports to imports. Real income growth attributed to changes in the terms of trade can be significant when there are large fluctuations in import and export prices and the economy under concern is highly exposed to international trade, as is the case with many Asian economies (shown in Figure 40 in Section 4.1, p. 47). For example, in recent years real income growth for resource-rich countries was more than double that of real GDP growth in Oman, Saudi Arabia, and Brunei during 2000–2005 (due to oil price hikes) and in Myanmar during 2005–2010 (due to price hike of jade). In the 2000s, the trading gain also drove a significant wedge between real in-come and real GDP in Australia. That is partly due to a fall in import prices, but owes more to the rising prices of its commodity exports.
The distinction between real income and real GDP lies in the differences between the corresponding deflators. Real GDP is calculated from a GDP deflator aggregating prices of household consumption, government consumption, investment, exports, and imports,107 while real income is calculated from the prices of domestic expenditure, consisting of household consumption, government consumption, and in-vestment. Therefore, real income can be understood as the amount of domestic expenditure that can be purchased with the current income flow.108 As such, real income captures the purchasing power of the income flow. Furthermore, the Databook adopts the concept of gross national income (GNI) instead of GDP in its estimation of real income, to take into account net income transfer from abroad. Applying the method proposed by Diewert and Morrison (1986), the annual growth rate of real income can be fully attrib-uted to three components: annual growth rate of real GDP, real income growth attributed to changes in prices of exports and imports (referred to as the trading gain),109 and the effect of net income transfer.110
A general observation is that over a long period of time the trading gain effect is, on average, small, but over a shorter period could be very significant.111 The findings presented in Table 25 in Appendix 9 (p. 165) confirm this observation. Excluding the oil-exporting countries, the trading gain effect in 16 out of 22
7 Real Income
105: See Diewert and Morrison (1986) and Kohli (2004).106: Kohli (2004) elaborates: “If real GDP is measured by a Laspeyres quantity index, as it is still the case in most countries, an im-
provement in the terms of trade will actually lead to a fall in real GDP.”107: The weight for import price changes is negative. Thus, if import prices decrease, this tends to raise the GDP deflator.108: This definition of real income is the same as in Kohli (2004 and 2006). An alternative definition is nominal GDP deflated by the
price of household consumption; this is adopted by Diewert, Mizobuchi, and Nomura (2005) and Diewert and Lawrence (2006).109: The term “trading gain” is used by some authors (Kohli, 2006). This term is adopted in this report.110: Real income growth can be decomposed into two components as follows:
ln ( GNI t
GNI t−1) − ln ( PDt
PDt−1) = ln ( GNI t/GDP t
GNI t−1/GDP t−1) + ln (GDP t/GDP t−1)−(1/2) ∑ i(sit + si
t−1) ln(Pit/Pi
t−1) +
(1/2) (sXt + sX
t−1) ( ln(PXt / PX
t−1)−ln( PDt /PD
t−1 ))−(1/2) (sMt +sM
t−1) (ln(PMt / PM
t−1)−ln(PDt / PD
t−1 )) Real income growth Income transfer effect Real GDP growth
Real income growth attributed to changes in the terms of trade (=trading gain)where Pi
t is price of final demand i in period t and sit is expenditure share of final demand i in period t. D is domestic expenditure,
X is export, and M is import. Note that the real GDP growth based on this formulation may differ from that used in other chap-ters, since the implicit Törnqvist quantity index is adopted for calculating it.
©20
18 A
sian
Prod
uctiv
ity O
rgan
izat
ion

112
7 Real Income
economies compared fell within the margin of ±10% of real GDP growth on average for the long pe-riod of 1970–2016. In the short term, the spread of the trading gain effect is wider across coun-tries. Australia has benefitted from the continual surge in commodity prices since the early 2000s, as such, its terms of trade have been turning strongly in its favor. The trading gain effect in Australia has therefore been rising from 3% on average per year in 1995–2000, to 36% in 2000–2005, and 52% in 2005–2010 of its real GDP growth. In terms of percentage points, the trading gain added 0.1, 1.2, and 1.4 percentage points to real GDP growth in the three consecutive peri-ods, as shown in Figure 96. In the oil-exporting countries like Saudi Arabia and UAE, the trading gain effect was significant since the late 1990s until the middle of 2014.
Over the past four decades, net primary income from abroad has not moved outside the margin of ±10% of real GDP growth on average for all 28 countries compared, except for the Philippines, Kuwait, and Saudi Arabia. Figure 97 plots the time series of net primary income from abroad as a percentage of GDP. The role of net primary income from abroad has been shifting from negative to positive in Hong Kong, with the transition taking place in the mid-1990s leading up to the handover of Hong Kong from British rule to China in 1997. Since then, net primary income from abroad has been positive. A shift in the role of net primary income from abroad has also taken place in Korea from negative to a more or less neutral position in the 2000s. It has held positive in the ROC, oscillating around +2% of GDP, since the early 1980s. Singapore’s net primary income from abroad displayed the largest fluctuations, ranging from +2.0% in 1997 to –7.0% in 2004, but on the whole, it has been more negative than positive. Net primary income from abroad has risen strongly in Japan and the Philippines, albeit at different magnitudes. In Japan, it rose from 0.8% of GDP in 1990 to 3.2% in 2016, compared with 1.5% in 1990 and 33.0% in 2016 in the Philippines, providing a long-term significant contribution to the purchasing power of Filipinos, with remittances from a large number of overseas workers.
Unlike the oil-exporting countries, at any one time roughly half of the Asian countries compared sus-tained a negative trading gain effect, albeit to variable extents, whereas the impact from net primary in-come from abroad was relatively less pronounced. The period of 1995–2000 reflects the impact of the Asian financial crisis. For Thailand, the trading gain effect more than outweighed the small positive aver-age real GDP growth per year (0.4%), giving rise to a marginal fall in real income of –0.8%. In Korea, the negative trading gain also shaved 37% off real GDP growth of 5.2%, producing real income growth of 3.2%. At the start of the 2000s, the Asian economy recovered from the financial crisis, but the trading gain effect ran counter to welfare for some countries, with a negative impact that only intensified after 2005. For example, in the ROC, the trading gain effect caused real income growth to be 32% lower than real GDP growth in the period 2000–2005. However, in the period 2005–2010 it wiped out 54% of the at-tractive 4.2% real GDP growth on average per year, leaving real income to grow at 1.9%.
111: Short-term trends in export and import prices cannot continue indefinitely. Negative and positive trading gain effects in shorter periods cancel each other out. In the end, the accumulated effect over a long period of time often becomes negligible.
Figure 96 Trading Gain Effect of Australia, Saudi Arabia, and the UAE_Average annual contribution to real income growth in 1970–2016
Sources: Official national accounts in each country, including author adjustments.
%
−6
−4
−2
0
2
4
6
1970−1975 2010−20162005−20102000−20051995−20001990−19951985−19901980−19851975−1980
Australia
Saudi Arabia
UAE
©20
18 A
sian
Prod
uctiv
ity O
rgan
izat
ion

7
113
7.1 Real Income and Terms of Trade
Figure 97 Effect of Net Income Transfer on GDP_Share of net income transfer in GDP at current market prices in 1970–2016
Sources: Official national accounts in each country, including author adjustments. Note: Countries are grouped according to the levels of per capita income in 2016, relative to the US, defined in Table 2 in Section 6.1 (p. 87), except GCC countries, which is separately treated in Figure 97.7.
Figure 97.1: Group-D1 (100%≤)
−8
−6
−2
−4
0
2
4
6
8
10%
1975 1980 1985 1990 1995 2000 2005 2010 20151970
Figure 97.2: Group-D2 (70%≤...<100%) and the US
−5
−4
−2
−3
−1
0
2
4
1
3
5
1975 1980 1985 1990 1995 2000 2005 2010 20151970
%
1975 1980 1985 1990 1995 2000 2005 2010 20151970
Figure 97.3: Group-D3 (40%≤...<70%)
−4
−6
−8
−10
−2
0
6
4
2
8%
Figure 97.4: Group-D4 (20%≤...<40%)
−14
−12
−10
−6
−8
0
−4
−2
4
2
1975 1980 1985 1990 1995 2000 2005 2010 20151970
%
Figure 97.5: Group-D5 (10%≤...<20%)
−20
−30
−10
0
10
20
30
40
1975 1980 1985 1990 1995 2000 2005 2010 20151970
%
1975 1980 1985 1990 1995 2000 2005 2010 20151970
Figure 97.6: Group-D6 (<10%)
−4
−8
4
0
8
12%
Figure 97.7: GCC-countries
−40
−20
0
20
60
40
1975 1980 1985 1990 1995 2000 2005 2010 20151970
%
BruneiSingapore
Hong Kong ROC JapanUSAustralia
EU15
Korea TurkeyMalaysia IndonesiaMongolia Sri Lanka
IranThailand
China
FijiLao PDR
Philippines VietnamIndiaBhutan Cambodia
NepalMyanmarPakistan
Bangladesh
KuwaitOmanSaudi Arabia UAE
QatarBahrain
©20
18 A
sian
Prod
uctiv
ity O
rgan
izat
ion

114
7 Real Income
In contrast, the trading gain worked to counterbalance falling real GDP in Brunei, leaving it with a ro-bust, real income growth of 4.6%, despite its contracting real GDP of –1.8% in the period 2005–2010 (Table 25 in Appendix 9, p. 165). In Saudi Arabia, real income growth increased more than 109% faster than its real GDP growth in the same period. This takes place against the backdrop of strong oil prices, which spiked in mid-July 2008 to USD 145 per barrel. Figure 98 presents the prices of crude oil from January 1986 to May 2018. After drop-ping sharply to USD 30 per barrel by the end of 2008 (reflecting the fall in demand during the global financial cri-sis), oil has steadily risen to, and held, at over USD 100 per barrel since 2010 through the middle of 2014, and dropped to USD 40–60 per barrel until rising again in April 2018.
The price changes of crude oil in the re-cent decade have a great impact in trad-ing gains in Asian countries. Figure 99 compares the trading gain effects from the 2000s and the period 2010–2016. The trading gain effects in Thailand, the ROC and Korea turned positive as 0.7, 0.4, and 0.3 percentage points per year, respectively. In contrast, the positive trading gain effects which oil-rich coun-tries experienced in the 2000s were neg-ative in the period 2010–2016: e.g., –5.8 percentage points in Kuwait and –3.3 percentage points in Saudi Arabia. Myanmar expanded a production of natural gas since the late 1990s and has exported it mainly to Thailand. The positive trading gains have been brought about not only by the price hike in
Figure 98 Crude Oil Price_Dollars per barrel of West Texas intermediate crude oil (WTI) in 1986 January–2018 May
Source: US Energy Information Administration, WTI spot prices FOB (Cushing, Oklahoma).
0
25
50
75
100
125
150Dollars per barrel
Jan 02,1986 1988
Jan 02,1990
Jan 02,1992
Jan 02,1994
Jan 02,1996
Jan 02,1998
Jan 02,2000
Jan 02,2002
Jan 02,2004
Jan 02,2006
Jan 02,2008
Jan 02,2010
Jan 02,2012
Jan 02,2014
Jan 02,2016
Jan 02,2018
Jan 02,
41.1
10.8
77.1
145.3
30.3
68.0
113.4
109.4
75.4
110.2
106.8
43.4
59.2
26.2
Figure 99 Trading Gain Effect_Average annual contribution to real income growth in 2000–2010 and 2010–2016
Sources: Official national accounts in each country, including author adjustments.
53 4210−2 −1 6 %
2000−201020−6 −2−4 %
2010−2016
ROCPakistan
Hong KongIndonesia
KoreaJapan
SingaporeBangladeshPhilippines
USTurkeyIndia
ThailandEU15EU28
FijiNepal
BhutanUAE
Sri LankaCambodia
ChinaVietnamMalaysiaAustralia
IranMongoliaBahrainQatar
Saudi ArabiaKuwaitOman
MyanmarBrunei
0.40.0
0.1−0.2
0.30.1
−0.7−0.1
−0.30.2
−0.1−0.2
0.70.20.20.1
0.9−0.4
−1.71.0
0.30.1
1.1−0.3
−0.7−3.3
0.9−1.9
−4.3−3.3
−5.8−3.1
−3.9−2.2
−1.9−0.9−0.9−0.8
−0.7−0.4−0.3−0.3
−0.2−0.10.00.00.00.0
0.00.10.10.2
0.40.40.50.6
0.80.9
1.31.9
2.32.4
2.83.93.9
4.45.1
5.6
©20
18 A
sian
Prod
uctiv
ity O
rgan
izat
ion

7
115
7.1 Real Income and Terms of Trade
112: According to Kohli (2004) study on real income of 26 OECD countries during 1980–1996, the trading gain on average over the entire period varies across countries, from the smallest effect of –0.8% (–30.9% of real income growth) per year in Norway to the largest of 0.63% (29.4% of real income growth) per year in Switzerland.
113: Following Kohli (2006), trading gain can be decomposed into two components as follows: (1/2) (sX
t + sXt−1)(ln ( PX
t / PXt−1)−ln (PD
t / PDt−1)) − (1/2) (sM
t +sMt−1) (ln(PM
t / PMt−1)− ln(PD
t / PDt−1)) =
Real income growth attributed to changes in the terms of trade (=trading gain)
(1/4) (sXt + sX
t−1 + sMt + sM
t−1)(ln(PXt / PX
t−1)−ln(PMt / PM
t−1)) + Terms-of-trade effect
(1/2) (sXt + sX
t−1 − sMt − sM
t−1)((1/2) ln(PXt / PX
t−1)+(1/2) ln(PMt / PM
t−1)− ln(PDt / PD
t−1 )).Real exchange rate effect
natural gas in the 2000s, but also by the price hike in jade since the middle 2000s (see Box 7, p. 110). In particular the impact of the rapid price jump in jade in 2013–2014 was large enough to offset the price decline in natural gas in the early 2010s. However, the jade price fell to one-sixth from 2014 to 2016. As a result, a trading gain effect was negative in Myanmar, as well as in the GCC countries.
Combining both the trading gain effect and net primary income from abroad, real in-come growth for most of the countries compared fell with-in the margin of ±20% of real GDP growth in the long run, as shown in Figure 100. In particular in larger econo-mies, as the US, the EU15, China, India, and Japan, the real income growths were al-most equivalent to the real GDP growth on average over the past four decades. Kuwait and Brunei appear to be the outliers, with real income growth being 4.7 times and 4.0 times their respective long-term dismal real GDP growth of 0.9% and 0.7%, respectively.112
Figure 101 provides the re-sults of further decomposi-tion of the trading gain into the terms-of-trade effect and the real exchange rate effect in Asian countries for the period 1970–2016.113 The terms-of-trade effect is the part of real income growth attributed to the change in the relative price between exports and imports. The real exchange rate effect refers to the part of real income growth attributed to changes in the relative prices of traded goods and domestically consumed goods. By applying this result, real income growth can be decomposed into
Figure 100 Real Income and GDP Growth_Average annual growth rate of constant-price GDP and real income in 1970–2016
Sources: Official national accounts in each country, including author adjustments.Note: The starting years for some countries are different due to data availability during 1970–2016: Brunei (1989–), Cambodia (1993–), Mongolia (2000–), Nepal (2000–), and Vietnam (1989–).
0
2
4
6
8
1
3
5
7
10
9
0 2 4 6 81 3 5 7 9 10
Real income growth
Real GDP growth
%
%
Bangladesh
Cambodia
ROC
Fiji
Hong Kong
India
Indonesia
Iran
Japan
Korea
Malaysia
Mongolia
Nepal
PakistanPhilippines
Singapore
Sri Lanka
Thailand
Vietnam
Brunei
China
Myanmar
Bahrain
Kuwait
Oman
Qatar
Saudi Arabia
UAE
Australia
Turkey
US
EU15
Bhutan
(+20%)
(−20%)
©20
18 A
sian
Prod
uctiv
ity O
rgan
izat
ion

116
7 Real Income
real GDP growth, terms-of-trade effect, real ex-change rate effect, and net primary income from abroad. The first chart in Figure 101 applies this break-down to Asian coun-tries for the period 1970–2016. It shows that the real exchange rate effect is gen-erally much smaller than the terms-of-trade effect, implying that the relative prices of traded versus do-mestically consumed goods have been largely stable in most countries. The excep-tion is Kuwait where the real exchange rate effect ac-counted for 33% of real in-come growth. This might have reflected the weight of oil in the composition of their traded goods. The sec-ond chart shows the de-composition for the 2000s. It shows that the trading gain, particularly the terms-of-trade effect, is highly significant and favorable for the oil-exporting coun-tries, but is significant and negative in a handful of Asian economies such as the ROC, Hong Kong, Pakistan, Indonesia, the Philippines, Korea, and Japan.
Figure 102 shows the decomposition of average annual real income growth covering two periods of major economic crises faced by the Asian economies: during 1973–1979, which includes the two oil price hikes in 1974 and 1979; and 1996–1998 to capture the impact of the Asian financial crisis. High oil prices improved the terms for oil-exporting countries, such as Iran and Indonesia, and worsened the terms of trade for oil-importing countries. During the Asian financial crisis, the terms-of-trade effect was still the predominant factor in determining the difference between real income growth and real GDP growth. In Brunei, the terms-of-trade effect further reinforced the negative real GDP growth of –7.5%, reducing its real income growth another 7.2 percentage points. In Iran, the negative terms-of-trade effect counter-acted the 1.0% real GDP growth, giving real income growth of –1.5%. In Indonesia, the trading gain ef-fect worked to counterbalance the contraction in real GDP, whereas in Thailand, it reinforced the negative real GDP growth. In the Philippines, although the strong favorable terms-of-trade effect was moderated by the negative real exchange rate effect, the resulting real income growth more than tripled the real GDP growth.114
Figure 101 Decomposition of Real Income Growth_Average annual growth rate of real income and contributions in 1970–2016 and 2000–2010
Sources: Official national accounts in each country, including author adjustments.
Real exchange rate e�ect Terms-of-trade e�ect Real GDPNet primary income from abroad Real income
1970–2016
2000–2010
−2
0
4
6
12
2
8
10
%
−2
0
4
8
2
6
10
16
14
12
%
UAE
China
Om
an
Singapore
Malaysia
Korea
Bhutan
ROC
Qatar
Indonesia
Bahrain
India
Hong Kong
Thailand
Pakistan
Sri Lanka
Saudi Arabia
Iran
Myanm
ar
Philippines
Turkey
Kuwait
Bangladesh
Australia
Fiji
US
Japan
EU15
Qatar
ChinaM
yanmar
Cambodia
BahrainM
ongoliaIndiaVietnamSaudi ArabiaBhutanO
man
IranKuw
aitM
alaysiaBruneiBangladeshSri LankaPhilippinesSingaporeIndonesiaAustraliaThailandU
AEPakistanTurkeyKoreaN
epalH
ong KongRO
CU
SFijiEU
15Japan
9.58.4
6.17.1 6.4 6.7
6.06.8
6.05.1 4.8 5.5 5.4 5.5 5.2 5.1
4.1 3.5 4.0 3.9 4.5
0.9
3.5 3.2 2.7 2.7 2.6 2.1
−0.7
0.81.3
1.6
1.40.7
9.2
8.3
7.1 6.7 6.7 6.4 6.3 6.15.9 5.6 5.5 5.4 5.4 5.1 5.1 5.1 4.9 4.8 4.8 4.6 4.4 4.4
3.4 3.4 3.22.7 2.4 2.1
11.610.9
5.6
8.66.5 6.7
7.8 7.2
3.3
7.7
3.05.3
3.85.1 5.7 5.3 4.5
5.9 5.13.1
4.5 3.9 4.3 4.2 4.3 3.4 3.94.0
1.6 1.6 1.2
2.4
5.22.7 1.7 0.8
3.2 3.92.5
3.0 1.1
4.11.3
−0.9 −0.7 −1.0−2.0
−0.9 −0.7 −0.8 −0.8
1.3
13.5
11.510.7
9.0 8.28.1 7.8 7.7 7.3 7.3 7.3 7.1 6.9
6.5 6.2 5.8 5.8 5.6 5.54.6
4.2 4.2 4.0 3.93.9 3.7 3.5 3.2
2.31.7 1.4 1.3
0.4
0.6
0.6
0.60.5
0.5
−0.6
1.0
1.6
−0.6
©20
18 A
sian
Prod
uctiv
ity O
rgan
izat
ion

7
117
7.1 Real Income and Terms of Trade
114: Kohli (2006) calculated the trading gain, the terms-of-trade effect, and the real exchange rate effect of Canada during 1982–2005. The average annual trading gain over the entire period is very low, at 0.1%. This is small by the standard of the Asian econ-omies. However, the trading gain later became significant, especially for the three years 2002–2005. Over these years, the average trading gain is 1.6% per year. This effect is decomposed into a terms-of-trade effect of 1.4% and a real exchange rate effect of –0.1%.
115: There are several studies on the decomposition of real income growth for other countries: Kohli (2004) for 26 OECD countries during 1980–1996, Kohli (2006) for Canada during 1981–2005, and Diewert and Lawrence (2006) for Australia during 1960–2004.
Figure 103 shows this decomposition of real income in each Asian country and region, along with the US, the EU15, Australia, and Turkey115 from 1970, or the year of first data collection for the country in ques-tion. The trading gain can be positive or negative, depending on the direction of change in the terms of trade. Its impact is modest for most countries, adding less than ±1 percentage point to annual real GDP growth, except for some oil-rich countries. In the short term, one sees extreme spikes in trading gain. For instance, as a consequence of the first oil price shock, the improvement in the terms of trade was respon-sible for around 80% of the 40% increase in real income in Iran in 1974. The opposite was true in the EU15, where the negative trading gain effect counterbalanced real GDP growth, leaving virtually no growth to real income in the period 1974–1975. The effect of the second oil spike can be seen in the early 1980s. Sri Lanka, Malaysia, and Indonesia also experienced volatile variations in trading gains in the 1970s. The trading gain has been working against Singapore and the ROC’s welfare for most of the pe-riod covered.
Figure 102 Decomposition of Real Income Growth in the Periods of Economic Crises_Average annual growth rate of real income and contributions in 1973–1979 and 1996–1998
Sources: Official national accounts in each country, including author adjustments.
Real exchange rate e�ect Terms-of-trade e�ect Real GDP Net primary income from abroad Real income
1973–1979 1996–1998
−15
−10
−5
0
5
10%
−3
0
6
3
9
12%
KoreaIndonesiaM
alaysiaIranH
ong KongRO
CSingaporeThailandPakistanFijiSri LankaChinaM
yanmar
BhutanPhilippinesIndiaAustraliaTurkeyU
SJapanEU
15Bangladesh
Sri LankaVietnamTurkeyChinaM
yanmar
ROC
IndiaBhutanCam
bodiaU
SAustraliaPakistanPhilippinesBangladeshSingaporeEU
15H
ong KongM
alaysiaJapanIranFijiKoreaIndonesiaThailandBrunei
9.8
6.17.5
1.5
7.98.7 8.6
7.3
4.1 4.25.3 5.2 5.0 5.1 4.4
3.5 3.7 3.6 2.9 3.4 2.8 2.7
3.7 1.2
5.7
−0.9 −1.3 −1.1
0.72.2
−0.7 −0.8
1.2
1.1
9.9 9.5
8.6 8.38.0
7.9
7.3
6.0 5.8 5.75.5
5.2 5.1 5.04.1
3.3 3.0 2.72.7 2.6
2.5 2.3
5.27.3
5.9 6.7 5.7 5.1 4.6
8.35.9
4.4 4.73.0
1.52.9 2.1 2.9
−0.91.3 1.0
−5.3−4.9−7.2
2.9
1.4
−1.3
1.1 1.0
−0.8
1.4 3.0
1.3−0.7 −2.6
−2.2
2.2
−0.9−0.7
−7.5
3.2
−1.7
1.0 1.2
−0.7−1.4
−2.5
1.21.1
1.4
−1.1
−1.4
8.3 7.8
7.06.4 6.0 5.9 5.6 5.6 5.1
4.6 4.3 4.14.0
3.33.0
3.0 1.91.3
0.0
−1.7−1.5−2.4
−3.6
−6.5
−14.5
−0.5−0.6
©20
18 A
sian
Prod
uctiv
ity O
rgan
izat
ion

118
7 Real Income
Real GDP Trading gain Net primary income from abroad Real income
Bahrain
Cambodia
Hong Kong
Iran
Kuwait
Myanmar
−60
−40
−20
0
20
40
60
−6
−3
0
3
6
9
12
18
15
−8
−4
0
4
8
12
16
−27
−18
−9
0
9
18
27
36
45
−60
−30
0
30
60
90
−40
−30
−20
−10
0
10
20
30
50
%
%
%
%
%
%
Bangladesh
China
India
Japan
Malaysia
1971 1976 1981 1986 1991 1996 2001 2006 2011 2016 1971 1976 1981 1986 1991 1996 2001 2006 2011 2016 1971 1976 1981 1986 1991 1996 2001 2006 2011 2016
1971 1976 1981 1986 1991 1996 2001 2006 2011 2016
−20
−15
−10
−5
0
5
10
−6
−3
0
3
6
9
12
18
15
−6
−3
0
3
6
9
12
−6
−4
−2
0
2
4
6
10
8
−10
−5
0
5
10
15
20
%
%
%
%
%
Bhutan
ROC
Indonesia
−12
−6
0
12
6
18
24
30
−6
−3
0
3
6
9
12
15
18
−20
−15
−10
−5
0
5
10
15
20
%
%
%
Mongolia
−15
−10
−5
5
0
10
15
20
30%
Korea
Brunei
−24
−18
−12
−6
0
6
12
18
24%
−10
−5
0
5
10
15
20%
Fiji
−10
−5
0
5
10
15
20%
25 40
1971 1976 1981 1986 1991 1996 2001 2006 2011 2016 1971 1976 1981 1986 1991 1996 2001 2006 2011 2016
1971 1976 1981 1986 1991 1996 2001 2006 2011 20161971 1976 1981 1986 1991 1996 2001 2006 2011 20161971 1976 1981 1986 1991 1996 2001 2006 2011 2016
1971 1976 1981 1986 1991 1996 2001 2006 2011 2016 1971 1976 1981 1986 1991 1996 2001 2006 2011 2016 1971 1976 1981 1986 1991 1996 2001 2006 2011 2016
1971 1976 1981 1986 1991 1996 2001 2006 2011 2016
1971 1976 1981 1986 1991 1996 2001 2006 2011 20161971 1976 1981 1986 1991 1996 2001 2006 2011 20161971 1976 1981 1986 1991 1996 2001 2006 2011 2016
1971 1976 1981 1986 1991 1996 2001 2006 2011 2016 1971 1976 1981 1986 1991 1996 2001 2006 2011 2016
©20
18 A
sian
Prod
uctiv
ity O
rgan
izat
ion

7
119
7.1 Real Income and Terms of Trade
Figure 103 Sources of Real Income Growth (Year-over-Year)_Annual growth rate of real income and contributions in 1970–2016
Unit: Percentage. Sources: Official national accounts in each country, including author adjustments.
Real GDP Trading gain Net primary income from abroad Real income
−30
−20
−10
0
20
10
30
40
50%
%
%
%
%
−6
−3
0
3
6
9
12%
%
%
%
−20
−10
−15
−5
0
5
10
15%
%
%
%
%
Philippines
Singapore
UAE
EU15
Qatar
Sri Lanka
Vietnam
Australia
Pakistan
Saudi Arabia
Thailand
US
Turkey
Oman
−30
−20
−10
10
20
30
40
0
−30
−15
15
30
45
0
−8
−4
0
4
8
12
16
24
20
−15
−10
−5
0
5
10
15
20
−10
−5
0
5
10
15
−40
−20
0
20
40
60
80
100%
−6
−3
0
3
6
9
12
−4
−2
0
2
4
6
8
−6
−4
−2
0
2
4
6
−4
−2
0
2
4
6
8
−4
−12
−8
0
4
8
12
1971 1976 1981 1986 1991 1996 2001 2006 2011 2016 1971 1976 1981 1986 1991 1996 2001 2006 2011 2016
Nepal
1971 1976 1981 1986 1991 1996 2001 2006 2011 2016−6
−2
0
2
4
8
6
10%
−4
1971 1976 1981 1986 1991 1996 2001 2006 2011 2016 1971 1976 1981 1986 1991 1996 2001 2006 2011 2016 1971 1976 1981 1986 1991 1996 2001 2006 2011 2016
1971 1976 1981 1986 1991 1996 2001 2006 2011 20161971 1976 1981 1986 1991 1996 2001 2006 2011 20161971 1976 1981 1986 1991 1996 2001 2006 2011 2016
1971 1976 1981 1986 1991 1996 2001 2006 2011 2016 1971 1976 1981 1986 1991 1996 2001 2006 2011 2016 1971 1976 1981 1986 1991 1996 2001 2006 2011 2016
1971 1976 1981 1986 1991 1996 2001 2006 2011 20161971 1976 1981 1986 1991 1996 2001 2006 2011 20161971 1976 1981 1986 1991 1996 2001 2006 2011 2016
©20
18 A
sian
Prod
uctiv
ity O
rgan
izat
ion

120
7 Real Income
116: The term was originated by The Economist in 1977 (The Economist, 26 November 1977, “The Dutch Disease.”) to describe the overall decline of the manufacturing and the subsequent economic crisis in the 1960s in the Netherlands after the discovery of the large natural gas field in the North Sea in 1959.
7.2 Trading Gain and Productivity Growth
When the trading gain is highly favorable, it can breed a sense of complacency with productivity perfor-mances suffering as a result. Resource-rich economies are susceptible to this pitfall because they are poised to reap some extremely positive trading gains when commodity prices turn in their favor over a sustained period of time. Just as commodity prices can rise, so too can they fall. This is when countries’ real income growth could suffer if fundamentals for real GDP growth are weak.
Figure 104 plots the labor productivity growth and the trading gain effect for the whole observation pe-riod. Over the past four decades, four countries have enjoyed a favorable trading gain effect of over 0.7% per year. They are Kuwait, Brunei, Iran, and Bahrain. Only Iran among them could achieve a significant positive growth in labor productivity. In general, a resource-rich country can suffer from “Dutch disease,” which is a phenomenon in where a country’s currency is pushed up by the commodity boom, making other parts of its economy less competitive and potentially increasing the country’s dependence on nat-ural resources.116 This is how resource abundance can easily lead to resource dependence.
Figure 105 illustrates trading gain effects and value-added shares of the mining sector in 1970 and 2016 in some se-lected countries. It indicates that large trade gainers typi-cally have dominant mining sectors, petroleum and natu-ral gas in particular. Provided resource prices continually rise, these countries continue to gain from the positive terms-of-trade effects. How-ever, if resource prices fall, or natural reserves are depleted, then the story of the Dutch disease may appear. Richness in natural resources may become a curse if they do not have competitive industries other than mining. A way to counteract Dutch disease is broad-based, robust productivity growth and industry diversification. Figure 105 shows some of the trading gainers (i.e., Brunei and the GCC countries) actively reduced their share of the mining sector over time, which could reflect the intention
−4.5 −3.0 −1.5 0.0 1.5 3.0 4.5 6.0 7.5 %Labor productivity growth
−1.0
0.0
1.0
0.5
−0.5
1.5
2.0% Trading gain e�ect
ROC
Cambodia Hong Kong
China
Iran
Oman
Qatar
Fiji
UAE
Kuwait
Brunei
Korea
Myanmar
BangladeshPhilippines
US
Pakistan
Japan
Sri Lanka
Thailand
Indonesia
Malaysia
Vietnam
Turkey
Bhutan
India
Singapore
Bahrain
Australia
EU15
Saudi Arabia
Figure 104 Trading Gain Effect and Labor Productivity Growth_Average annual rates of trading gain and the growth of constant-price GDP per hour worked in 1970–2016
Sources: Official national accounts in each country, including author adjustments; APO Pro-ductivity Database 2018.Note: The starting years for some countries are different due to data availability during 1970–2016: Brunei (1989–), Cambodia (1993–), and Turkey (1988–).
©20
18 A
sian
Prod
uctiv
ity O
rgan
izat
ion

7
121
7.2 Trading Gain and Productivity Growth
of developing industries other than mining. However, Figure 104 shows that labor produc-tivity growth rates in these countries after 1990 remained low, or even negative. Even if they wanted to start industrial-ization, their high income and strong local currency would not allow them to easily de-velop a manufacturing sector or an internationally competi-tive service industry. Another concern is their heavy depen-dence on foreign workers, both skilled and unskilled.
On the other side of coin are the resource/energy-importing economies. Most of these suf-fered from negative trading gain effects, losing a part of their economic growth due to resource price hikes, particu-larly in the 2000s (Table 25 in Appendix 9, p. 165). However, it has actually strengthened their competitiveness in manufac-turing and other productive activities for the future. Figure 104 also shows that many Asian countries have succeed-ed in achieving high growth of labor productivity while having to accept a deteriorating trading gain over the long run. These countries are typically resource importers whose voracious demand for commodities pushes up their import prices. Meanwhile, export prices tend to fall as a result of their achievement in productivity improvement, resulting in unfavorable movements in terms of trade. This is particularly the case in countries where economic growth is highly dependent on export promotion. In such instances, a negative trading gain is partially a side-effect of productivity success. Although the trading gain effect partly negates their real GDP growth, they are better positioned than before their development took off, and without productivity improvements.
Figure 105 Trading Gain Effect and Value-added Share in Mining Sector_Average annual rates of trading gain in 1970–2016 and the changes of mining GDP share from 1970 to 2016
Sources: Official national accounts in each country, including author adjustments; APO Pro-ductivity Database 2018.Note: The starting years for some countries are different due to data availability during 1970–2016: Brunei (1989–) for trading gain effect, Bahrain (1975–), Brunei (1974–), Vietnam (1986–), and UAE (1972–) for value-added share of mining sector.
−1
0
1
3
2
4%
0 10 20 30 40 50 60 70 %80
Trading gain e�ect, 1970−2016
Value-added shares in Mining, 1970 and 2016
Qatar
Brunei
Oman
Kuwait
Saudi Arabia
UAE
Malaysia
Iran
Bahrain
Vietnam
Indonesia
Australia
19702016
©20
18 A
sian
Prod
uctiv
ity O
rgan
izat
ion

122
7 Real Income
Figure B8 plots per-worker average wages for employees against per capita GNI, using annual average ex-change rates for selected countries in 2016 (taking the logarithms). The overall trend is a positive association; the higher average wages, the higher the per capita income. Of course, average wages are not equal to GNI per capita. First, some adjustments are needed for the number of workers in one family. Second, income from capital must be counted. If you inspect Figure B8, some countries are off the simple regression line. One out-lier is Singapore, which is below the regression line. This likely reflects a large proportion of foreign workers out of total labor force who are paid lower than local workers.
Other off-lines are the ASEAN member states including Cambodia, the Lao PDR, Vietnam, the Philippines, Thailand, and Malaysia. They have relatively low wages vis-à-vis income levels. Is it because they set unfairly low wages? Probably not. Rather, in these countries, labor movements from the informal to formal sectors or from rural to urban are relatively smooth, which pushes down average wages of employees. These countries indeed gain competitiveness in the manufacturing sector and achieve rapid decreases in the population below the poverty line.
In contrast, the South Asian countries including India, Pakistan, and Nepal are above the regression line per-haps because they face a difficulty in labor movements from informal to formal or from rural to urban. The reasons may reside in both labor supply and demand. Presumably, education gaps between rural and urban are too big, or stunted modernization is too serious in rural areas. Perhaps too, poor urban infrastructure may cause high living costs and poor security conditions in urban areas. In either case, these countries suffer from an unfavorable position for the smooth growth of the manufacturing sector.
Box 8 Per-Worker Wage and Income Level
Figure B8 Average Wage and Per Capita GNI in 2016
Sources: Official national accounts in each country, including author adjustments; APO Pro-ductivity Database 2018; Asia QALI Database 2018.
0.0
0.4
0.8
1.2
1.6
2.0
–0.4 0.0 0.4 0.8 1.2 1.6 2.0
Log of per-worker average wage in 2016 (using 2016 exchange rate)
Log of per capita GNI in 2016 (using 2016 exchage rate)
Bangaldesh
Cambodia
ROC
Fiji
Hong Kong
IndiaIndonesia
Iran
Japan
Korea
Lao PDR
Malaysia
Mongolia
Nepal
PakistanPhilippines
Singapore
Sri Lanka
Thailand
Vietnam
China
USEU15
Australia
Turkey
Myanmar
©20
18 A
sian
Prod
uctiv
ity O
rgan
izat
ion

7
123
7.2 Trading Gain and Productivity Growth
The growth accounting has been developed in the Databook to evaluate the quality of economic growth in each country and region in Asia. The same framework can be used to forecast the economic growth, based on future scenarios on population and technology. This edition of Databook newly develops the mid-term projections on labor input and economic growth for 23 Asian countries until 2030.
Our scenario on population is based on the projection in United Nations (2017), in which the annual projec-tions are provided by gender and age, as presented in Box 1. This is divided to the estimates in different catego-ries of education attainment, based on the projections developed in Wittgenstein Centre Data (Lutz, Butz, and KC, 2014), in each class of gender and age. The employment rate in each class of population by gender, age, and, education are developed in our Asia QALI Database (Appendix 5). The employment rates in the recent period 2015–2016 are assumed to be constant for the future in each class of population. Using these population and the employment rates, the employment by gender, age, and, education is estimated for the period 2017–2030.
The number of employment in each class is divided into the estimates in different categories of employment status, i.e., own-account workers, contributing family workers, and employees, based on the current composi-tion in 2016, which is provided in the Asia QALI Database. As the future scenario on employee share, it is assumed to be gradually increased by 1–3% per year until 2030, based on the past trend in each country. Based on these scenarios, the projections on the number of employment cross-classified by gender, age, education, and employment status are developed until 2030 in each country. The estimated average growth rates of total em-ployment per year are presented in Figure B9.1 for the two periods 2016–2020 and 2020–2030.
Based on this future scenario on employment, hours worked and labor quality are projected until 2030. In each country, the average hours worked per worker are benchmarked at the elementary level of employment by the recent estimates in 2016, which is developed in the Asia QALI Database, and assumed to be slightly decreased based the past trend. The relative wage structure cross-classified by gender, age, education, and status is also provided in 2016 by the Asia QALI Database. Based on these data, labor quality changes are estimated until 2030. The estimates of average annual growth rates of labor quality in each country are presented in Figure B9.2. In some countries like Indonesia and Cambodia, the quality changes are expected to decrease consider-ably from 2010–2016 (in Asia QALI Database). However, the estimates of labor quality in 2010–2016 are exceptionally high reflecting the rapid changes in employment status and education attainment and our esti-mates until 2020 and 2030 are getting close to the long-term trends in these countries. In Asia24, the labor quality changes are estimated to improve to 1.0% in 2016–2020 and 0.7% in 2020–2030, compared to our estimates (0.5%) in 2010–2016, reflecting the expansions of middle-educated and experienced workers in many Asian countries.
Box 9 Forecasting Asian Economic Growths
Figure B9.1 Projection of Change in Total Employment until 2030
Source: Our estimates based on United Nations (2017), Lutz, Butz, and KC (2014), and Asia QALI Database 2018. Note: Bhutan is excluded in Asia24.
−1
0
3
2
1
%
Malaysia
Singapore
Nepal
Pakistan
Lao PDR
Philippines
Cambodia
Mongolia
Indonesia
Myanm
ar
Korea
Iran
Bangladesh
US
Vietnam
Hong Kong
ROC
Brunei
Sri Lanka
India
Fiji
China
Japan
Thailand
APO20
Asia24
East Asia
South Asia
ASEAN
ASEAN6
CLMV
2010−2016 2016−2020 2020−2030average annual growth rate
3.0
2.6 2.6
2.2 2.2 2.1 2.01.7 1.7 1.7 1.5
1.5 1.51.4 1.4 1.3
1.2 1.1 1.10.8 0.8
0.3 0.3
−0.4
1.1
0.8
0.4
1.1
1.5 1.51.5
2.2
−1.1
1.61.9
3.1
1.9
2.0
1.5
0.7 0.7
0.0
2.12.3
0.9
1.6
0.6
−0.3
1.4
2.2
1.8
1.20.8
−0.4
1.4 1.51.2
0.7
1.9
1.3 1.21.51.5
−0.8
1.41.9
2.2
1.91.4 1.3
0.9
0.6
−0.4
1.6 1.6
1.0 1.4
−0.2
−0.7
0.9
1.9
1.3
0.8
0.1
−0.6
0.6
1.2
0.7
0.0
1.4
1.11.1
1.2
continued on next page >
©20
18 A
sian
Prod
uctiv
ity O
rgan
izat
ion

124
7 Real Income
There is a significant uncertainty in future capital accumulation. As a baseline scenario, GFCF shares are as-sumed to follow the long-term trend of Japan. The dotted line in Figure B9.3 presents the past GFCF share since 1885 and the line presents the ten-year moving average. The current levels of GFCF shares in Asian counties are plotted in the years, in which the per hour labor productivities are equivalent between them and Japan (see Figure 52 in Section 5.2, p. 61). Based on these historical trends, the future GFCF rates are assumed in each country. The investment this year is estimated by depending on GDP and determines the beginning-of-the-period capital stock level next year, which provides capital services to be used in next year’s production.
Another uncertain source of economic growth is TFP growth. As a base line scenario, the TFP growth in 2010–2016 estimated in APO Productivity Database 2018 is used to provide a benchmark estimates at present. In some countries, however, the past achievements reflect the events that will not be repeated in the future in some countries, e.g., in Myanmar. In these cases the benchmark estimates of TFP growths are set to be zero in the baseline scenario. In each Asian country, the future change in TFP is assumed to follow the long-term
> continued from previous page
Figure B9.3 Historical GFCF Shares of Japan and Current Level of Asia_Shares of GFCF in GDP at market prices for Japan in 1885–2016 and for Asian countries in 2016
Source: Our estimates based on APO Productivity Database 2018.
%
5
10
15
20
25
30
35
40
45
50
1885 1895 1905 1915 1925 1935 1945 1955 1965 1975 1985 1995 2005 2015 2025
BangladeshBrunei
Cambodia
China
ROCFiji
Hong Kong
India Indonesia
Iran
KoreaLao PDR
Malaysia
Mongolia
Myanmar
Nepal
Pakistan
Philippines
SingaporeSri Lanka
ThailandVietnam
US
GFCF share in JapanMoving average GFCF share in Japan
GFCF shares for Asian Countries in 2016
continued on next page >
Figure B9.2 Projection of Labor Quality Change until 2030
Source: Our estimates based on Asia QALI Database 2018. Note: Bhutan is excluded in Asia24.
0
5
6
3
4
1
2
%
2010−2016 2016−2020 2020−2030
Indonesia
Cambodia
Mongolia
Thailand
Vietnam
Bangladesh
Philippines
Fiji
India
Korea
Iran
Sri Lanka
Pakistan
ROC
Hong Kong
Singapore
Malaysia
Myanm
ar
Lao PDR
Japan
US
Nepal
China
APO20
Asia24
ASEAN
ASEAN6
CLMV
East Asia
South Asia
−1
average annual growth rate
5.4 5.2 5.0
3.5
2.2 1.9
1.6
1.6 1.4 1.3 1.2 1.2 1.1 1.1 1.0
1.0 0.9 0.5 0.4 0.3
0.3 0.1
−0.1
1.6
0.5
3.0
3.6
1.7
0.0
1.4
3.1 2.8
1.6
1.1
1.5 1.7
1.4
0.0
1.7
0.6
1.5
−0.2
2.1
1.1
0.7
1.9 2.4
1.4
0.3
0.4
0.2
2.6
1.0 1.3 1.0
2.1
2.2
1.6
0.9
1.7
2.6
2.2 1.7 1.2
1.5 1.6
1.5
0.6
1.5
0.8
1.5
0.3
1.6
1.0 0.6
1.1
2.0
1.4
0.4
0.3 0.2
2.3
0.5
1.3
0.7
1.9
2.1
1.5
0.5
1.5
©20
18 A
sian
Prod
uctiv
ity O
rgan
izat
ion

7
125
7.2 Trading Gain and Productivity Growth
> continued from previous page
trend of Japan. In 2016–2017, the actual GDP growths are observed in the quarterly national accounts (QNA) in Asia countries (see Appendix 7). The TFP growth in 2016–2017 is adjusted so that the projection of eco-nomic growth is to be equivalent to the actual GDP estimates in QNA. The benchmark estimate of labor share is provided in the APO Productivity Database 2018 (see Appendix 5) and is assume to be time-invariant in each country.
The baseline estimates of economic growths and per-hour labor productivity growth are presented in Figures B9.4 and B9.5. In Asia24, the recent economic growth in 2010–2016 (5.3% per year on average) is projected to be slightly decreased to 5.2% in 2016–2020, and to 4.0% in 2020–2030. The main source of this slowdown of Asian growth is the deceleration of Chinese economic growths, which are projected to be decreased from 7.4% to 6.3% and 4.0%, respectively. The Indian growth is expected to be somewhat increased from the recent performance (6.3%) to 6.7% in 2016–2020. However, in the following decade it is expected to slow down again to 5.5%. Although other South Asian countries like Bangladesh, Pakistan, and Nepal are expected to improve their economic performances until 2030, the regional growth of South Asia is projected to decelerate from 6.6% in 2016–2020 to 5.7% in 2020–2030. In ASEAN, although CLMV is projected to sustain the current pace to grow until 2030, as the ASEAN’s regional growth is projected to slow down to 4.3% in the 2020s.
Figure B9.4 Projection of Economic Growths until 2030
Source: Our estimates based on APO Productivity Database 2018 and Asia QALI Database 2018. Note: Bhutan is excluded in Asia24.
0
2
8
6
4
%
2010−2016 2016−2020 2020−2030
Mongolia
Lao PDR
China
Cambodia
India
Bangladesh
Philippines
Vietnam
Sri Lanka
Indonesia
Malaysia
Myanm
ar
Pakistan
Nepal
Singapore
Fiji
Thailand
Korea
Hong Kong
ROC
US
Iran
Japan
Brunei
APO20
Asia24
East Asia
South Asia
ASEAN
ASEAN6
CLMV
average annual growth rate
7.6
5.8 6.3 5.5
6.7 6.6 6.5
5.1
2.9
5.2
4.5
6.1
7.0
5.7
2.1
4.8
3.3
2.2 2.5 1.9 1.9
2.4 1.4
0.3
4.5
5.2 5.0
6.6
4.8 4.7 5.4
7.3 6.5
4.0
5.4 5.5
7.6
5.9 4.8
2.6
4.7
3.4
6.7 6.5 6.2
1.3
4.2
2.6
0.8
1.8
1.0 1.7 1.4 1.2 1.0
4.0 4.0
3.3
5.7
4.3 4.2
5.5
8.4
7.5 7.4 7.0
6.3 6.3 5.9 5.9 5.7 5.3
5.0 4.3 4.2 4.0 3.9
3.1 3.0 2.9 2.8 2.4 2.0
1.2 1.0
−0.5
4.0
5.3 5.4
6.0
4.9 4.8 5.6
Figure B9.5 Projection of Per-Hour Labor Productivity Growths until 2030
Source: Our estimates based on APO Productivity Database 2018 and Asia QALI Database 2018. Note: Bhutan is excluded in Asia24.
−4
−2
0
2
4
6
8%
China
Mongolia
Vietnam
India
Lao PDR
Bangladesh
Thailand
Cambodia
Sri Lanka
Indonesia
Philippines
Myanm
ar
Hong Kong
Malaysia
Pakistan
Korea
Nepal
Fiji
Singapore
Japan
ROC
US
Iran
Brunei
APO20
Asia24
East Asia
South Asia
ASEAN
ASEAN6
CLMV
average annual growth rate
4.3
6.3 3.6 4.3 4.5
6.1
2.3
3.9
0.9
3.9 4.1
6.3
2.4 2.2
4.7
1.4
4.8
3.3
2.3 2.1 2.0
0.9 0.1
−0.4
2.9
3.5 3.6 4.4
3.4 3.2
4.4
7.1 6.6
5.5 5.4 5.3 5.0 4.5 4.4
4.0 3.6
2.6 2.4 2.3 2.2 1.5 1.4 1.3 1.1 1.0 0.7 0.5
−0.1
−2.5
3.0
4.6 5.1 5.0
3.8 3.7 4.5
2010-2016 2016−2020 2020−2030
5.9 6.4
3.6
4.9
2.9
4.8
2.2
3.5
1.0
4.5 4.7 5.7
2.3 2.6
5.2
2.5
4.1 3.8 3.5
2.1 2.4
1.2 0.6
−1.9
3.0 4.2 4.6
4.8
3.7 3.7 4.1
4.2
©20
18 A
sian
Prod
uctiv
ity O
rgan
izat
ion

127
App.
System of National Accounts in AsiaA.1
Understanding data comparability is essential for the construction of an international database, and requires continuous effort and expert knowledge. Between December 2017 and March 2018, the APO Pro-ductivity Database project conducted the Metadata Survey 2018 on the national accounts and other statis-tical data required for international comparisons of productivity among the APO member economies.
Broadly speaking, cross-country data inconsistency can arise from variations in one or more of the three aspects of a statistic: definition, coverage, and methodology. The international definitions and guidelines work to standardize countries’ measurement efforts. However, country data can deviate from the interna-tional best practice and vary in terms of omissions and coverage achieved. Countries can also vary in their estimation methodology and assumptions in benchmark and/or annual revisions. This may account for part of the differences observable in the data, as well as interfere with comparisons of countries’ underly-ing economic performance.
Most of the economic performance indicators in this report are GDP-related. The surveys therefore put much emphasis on discerning countries’ GDP compilation practices. In the Databook 2018, the 2008 SNA is used as the standard, noting how countries’ practices deviate from it. Since there are differences between the 2008 SNA and its predecessors (1993 SNA or 1968 SNA) in some concepts and coverage, it
Appendix
Figure 106 Implementation of the 1968, 1993, and 2008 SNA
Source: APO Metadata Survey 2018.
Introduction year Backward estimates and implementation
1945 1950 1955 1960 1965 1970 1975 1980 1985 1990 1995 2000 2005 2010 2016
Iran
Bangladesh
Cambodia
ROC
Fiji
India
Indonesia
Philippines
Japan
Korea
Sri Lanka
Thailand
Vietnam
Lao PDR
Malaysia
Mongolia
Nepal
Pakistan
689308689308689308689308689308689308689368930868930868936893086893086893689308689308689308689308689308
19731980 2000
1996 20141993
1993 20092019
1951 19881951 20051951 2014
1968 19741995 2003
2005 20081950 1978
1999 20072004 2010
1960 19702000
2010 20151959 1981
1991 20061955 1978
1980 20001994 2016
1953 19861970 2004
1953 20141990
2002 2005
1960(mixture of 1953 SNA until 1968)1975
2000 20072005 2012
1980 19952010 2015
19752000 2006
1981 19882000 20042000 2013
1946 19721998 20111998 2011
19751998 2001
2010 20161972 1975
1990 20122018
1986 19891986 1993
2018
N.A.(Before 1993 SNA is introduced, Material Product System was used.)
©20
18 A
sian
Prod
uctiv
ity O
rgan
izat
ion

128
Appendix
is important to know in which year the data series definitions and classification started to switch over. This allows identification in breaks in the time series. Figure 106 presents the current situation in compilations and data availability of the backward estimates based on the 1968 SNA, the 1993 SNA, and the 2008 SNA (including the future plan for introducing the 2008 SNA), based on our Metadata Survey 2018. For example, this chart indicates that Japan started to publish national accounts based on the 1968 SNA in 1978 (at present, backward estimates based on the 1968 SNA are available from 1955), national accounts based on the 1993 SNA in 2000 (backward estimates based on the 1993 SNA are available from 1980 at present), and national accounts based on the 2008 SNA in 2016 (backward estimates based on the 2008 SNA are available from 1994 at present).
As Figure 106 suggests, countries differ in their year of introduction, the extent of implementation, and the availability of backward estimates. According to the survey response and our investigation, 15 coun-tries of Asia24 are currently 2008 SNA compliant (partially or fully). While there are movements toward upgrading the SNA, Cambodia, the Lao PDR, and Nepal have yet to fully introduce the 1993 SNA. The starting year of the official 2008 or 1993 SNA compliant time series varies a great deal across countries, reflecting the differences in the availability of backward estimates. Countries may have adopted the 2008/1993 SNA as the framework for their national accounts, but the extent of compliance in terms of coverage may also vary. The APO Productivity Database tries to reconcile the national accounts variations based on the metadata information and our investigation at KEO, in order to provide harmonized esti-mates for international comparison. See Appendix 2 for details of the adjustments.
GDP HarmonizationA.2
The Databook incorporates some significant revisions to the national accounts. Recent developments for upgrading their national accounts based on the 2008 SNA have resulted in Sri Lanka as of March 2016 and Japan and Turkey as of December 2016. Based on our Metadata Survey 2018 for the APO member economies in Appendix 1, 15 economies are already 2008 SNA-compliant in Asia and others are 1993 SNA-compliant, although it should be noted that the extent of compliance in terms of coverage may vary. The different statuses of SNA adaptions among economies explain the huge variations of data definitions and coverage in national accounts, calling for data harmonization to better perform comparative produc-tivity analyses.
This edition largely follows the concepts and definitions of the 2008 SNA and tries to reconcile the na-tional accounts variations, in particular on the difference in the treatment of research and development (R&D), military weapon systems, software investment, and financial intermediation services indirectly measured (FISIM).117 In order to create long-time series data for the Databook, it is necessary to use the past estimates based on the 1968/1993 SNA, with exceptions in the ROC, Korea, and Singapore, who already published the backward estimates based on the 2008 SNA from the 1950s or 1960. In addition, some additional adjustments are necessary to harmonize the long-term estimates of GDP. Procedures for these adjustments are explained below.
117: The introductions of the 2008 SNA are usually conducted with the benchmark revisions. Thus in some countries there are large revisions in data due to the uses of the newly available survey (e.g., a new survey on services) or of the new benchmark data (e.g., a new development of the supply and use table), not largely due to the revisions from the 1993 SNA. The information required to reconcile the different benchmark-year series is collected for the APO member countries through our questionnaire to the na-tional experts in our project.
©20
18 A
sian
Prod
uctiv
ity O
rgan
izat
ion

129
A.2 GDP Harmonization
App.
1) FISIMFISIM is an indirect measure of the value of financial intermediation ser-vices provided, although financial insti-tutions do not charge explicitly (United Nations, 1993: para. 6.124). It repre-sents a significant part of the income of the finance sector. The 1993 SNA rec-ommends that FISIM should be allo-cated to users (to individual industries and final demands). This is in contrast to the 1968 SNA, where the imputed banking services were allocated exclu-sively to the business sector. The com-mon practice was to create a notional industry that buys the entire service as an intermediate expense and generates an equivalent negative value added. As such, the imputed banking services have no impact on GDP. Therefore, the 1993/2008 SNA recommendation, if fully implemented, will impact indus-try GDP and the overall GDP for the total economy (by the part of FISIM allocated to final demands).
Among the 20 APO member economies, four countries – Cambodia, the Lao PDR, and Nepal – do not allocate FISIM to final demands in their official national accounts, as a result of them not following the 1993/2008 SNA recommendation. Thus, the GDP values in these countries are smaller than others by definition. In addition, in the countries whose national accounts follow the 1993/ 2008 SNA’s recommendation on FISIM, the available data sometimes does not cover the entire periods of our observations. To harmonize the GDP concept among countries and over periods, final demands of FISIM are estimated for those countries in the APO Productivity Database, using available estimates of value added in Im-puted Bank Service Charge (IBSC) or fi-nancial intermediation (in instances where IBSC data is not available). The ratios of value added of IBSC or financial interme-diation on FISIM allocated to final de-mand are assumed to be identical with the average ratios observed in the countries in which data is available. Figure 107 de-scribes the countries, years, and methods to adjust FISIM in the official national
Figure 107 Adjustment of FISIM
Source: APO Productivity Database 2018.
1945
Adjustment using value added of imputed bank service chargeAdjustment using value added of �nancial intermediationAdjustment using the average trend of FISIM share in GDP
1950 1955 1960 1965 1970 1975 1980 1985 1990 1995 2000 2005 2010 2016
BangladeshCambodia
FijiIndia
IndonesiaIran
JapanLao PDRMalaysia
MongoliaNepal
PakistanPhilippines
Sri LankaThailandVietnam
BhutanBrunei
MyanmarBahrainKuwaitOmanQatar
Saudi ArabiaUAE
Turkey
1970 19801970 19931970 1977
1950 19701951 1960
19591955
1981 19851955 1970
19601964 1974
19601946 1967
1959 19721951 1970
1955 19861970 19801970 1974
1958 19901970 1975
1962 198219701970 197519701970 1975
1960
Figure 108 FISIM Share in GDP_Average share of FISIM Production in GDP at current market prices in 2000–2016
Sources: Official national accounts in each country and author estimates.
O�cal national accounts in each country, including author adjustment
Our estimates using value added in imputed bank service chargeOur estimates using value added in �nancial intermediation
Thailand
Bangladesh
Cambodia
ROC
Fiji
Hong Kong
India
Indonesia
Iran
Japan
Korea
Lao PDR
Malaysia
Mongolia
Nepal Pakistan
Philippines
Singapore
Sri Lanka
VietnamBrunei
China
Myanmar
US
Australia
Turkey
Bhutan
Per capita GDP in 2016 (using 2011 PPP, reference year 2016)
FISIM share in GDP (average in the 2000−2016)
0.0
0.5
1.0
1.5
2.0
2.5
3.0
3.5%
0 10 20 30 40 50 60 70 9080
Thousands of US dollars (as of 2016)
©20
18 A
sian
Prod
uctiv
ity O
rgan
izat
ion

130
Appendix
accounts. As described, in instances where both value added data are not available, the trend of the FISIM share on GDP is applied to extrapolate past estimates (although the impacts on GDP are minor).
Figure 108 plots per capita GDP levels in 2016 and the FISIM share in GDP in 2000–2016 (including both of the original estimates in the official national accounts and our estimates). In countries where GDPs are adjusted, the proportions by which author adjustments for FISIM increases GDP stand at 0.6–1.2% for Nepal and the Lao PDR and less than 0.4% GDP in others.
2) SoftwareThe 2008 SNA recommends the capitalization of intellectual property products (IPP), which changes not only the size of GDP but also the size of capital input. One of the IPP capitalized in the Databook is computer software, which includes pre-packaged software, custom software, and own-account software. Among APO member economies, 13 economies have capitalized all three types of software. Another three countries exclude own-account software in their capitalization, and in one country only custom software is capitalized. For the APO Productivity Database, tentative adjustments have been made to harmonize data to include all software.
Among the countries studied, the data for software investment is available for Bangladesh, the ROC, Japan, Korea, Malaysia, Mongolia, Pakistan, the Philippines, Singapore, Thailand, and China. To harmo-nize data, a country’s GDP is adjusted to include software investment (through its software industry) by using the ratio between software investment and GDP (software ratio) and the tangible GFCF to GDP ratio (GFCF ratio). Data from the OECD Productivity Database and the APO Productivity Database suggest an inverse relationship between these two ratios (Figure 109). Countries with a low GFCF ratio tend to be those with high per capita GDP, and the observed data suggest that IT tends to play a more important role in these countries than in less-developed countries.
The Databook applies the inverse relation-ship between these two ratios observed from the OECD countries and national accounts in Asian non-OECD countries to estimate the software ratio in 2006 for those APO member economies that do not capitalize software investment. The esti-mated ratios for individual countries in 2006 gradually taper off as one moves back in time. However, there is an exception. Countries at the very early stage of eco-nomic growth are found to have a GFCF ratio as low as countries with high per cap-ita GDP, but for a different reason. The low GFCF ratio is explained by the fact that these countries have not experienced eco-nomic development yet, and in turn this does not play an important role for soft-ware investment. In this report, Cambodia, the Lao PDR, and Nepal are regarded as countries at the very early stage of econom-ic development, and are assigned Vietnam’s software ratio accordingly, which is the lowest of all APO member economies.
Figure 109 Software Investment Ratio and GFCF Ratio to GDP_Share of software and aggregate GFCF current purchaser’s prices in GDP current market prices in 2005
Sources: OECD Productivity Database, including author adjustments.
Countries in which software is included Countries in which software is excluded Countries in which pre-package and own account software are excludedCountries in which own account is excluded
0.0
0.5
1.0
1.5
2.0
2.5 Software Investment/GDP%
13 18 23 28 33 38 43 Tangible GFCF/GDP
%
Austria
Canada
DenmarkFinland
France
Germany
Ireland
Italy
Netherlands
New Zealand
Portugal
Spain
Sweden
UK SwitzerlandROC
Hong Kong
Japan
Korea
Mongolia
Pakistan
Philippines
Singapore
Thailand
China
US
BangladeshMalaysia
Sri Lanka
VietnamLao PDR
CambodiaFiji Indonesia
India
Iran
Nepal
©20
18 A
sian
Prod
uctiv
ity O
rgan
izat
ion

131
A.2 GDP Harmonization
App.
Another challenge arises from partial software capitalization. There are three types of software: pre-packaged software, custom software, and own-account software. Countries may have capitalized one or two types of software, but software investment data is often not available separately. The Databook at-tempts to adjust for the varied level of capitalization across countries by adding the type of software not capitalized to countries’ GDP.
3) ValuablesValuables are defined as “goods of considerable value that are not used primarily for purposes of produc-tion or consumption but are held as stores of value over time” (United Nations, 1993: para. 10.7). They are held under the expectation that their prices will not deteriorate and will rise in the long run. Valuables consist of precious stones and metals such as diamonds; artwork such as paintings and sculptures; and other valuables such as jewelry made from stones and metals. In a small number of countries, such as In-dia, Iran, Mongolia, Sri Lanka, Vietnam, and Bhutan, net acquisitions of valuables are recorded as a part of gross capital formation. For example, the SNA in India has included it since 1999, accounting for 1.4% of GDP for India on average during 1999–2016. The current decision is to harmonize the data by exclud-ing net acquisition of valuables from GDP in the Databook.
4) Consumption of Fixed Capital of Assets Owned by GovernmentAt the end of 2011, Thailand officially switched to the 1993 SNA, and its national accounts became com-patible with the 1993 framework for the first time. In this series, government consumption includes the consumption of fixed capital (CFC) owned by the government since 1990. In order to construct the long time-series data in the Databook series, the past data based on the 1968 SNA has been adjusted to be consistent with the new series. In the Databook, government capital stock and its CFC for the period 1970–1989 are estimated and the past government consumption and GDP are adjusted accordingly. A similar adjustment on the CFC of the assets owned by government was conducted for Bangladesh (for the period 1970–1995), Malaysia (1970–1999), and Mongolia (1970–2004).
5) R&DThe Databook capitalizes the R&D by following the 2008 SNA recom-mendations. In the countries that still do not follow the 2008 SNA, the R&D expenditures are not allocated to GFCF (but to intermediate uses). As a result the GDP values in these countries are smaller than others by definition. To harmonize the GDP concept among countries and over periods, the R&D investment is esti-mated for those countries in the APO Productivity Database. As a preferable approach, the data on the R&D expenditure are collected based on the official surveys in each coun-try, in order to estimate the R&D in-vestment. Figure 110 describes the countries, years, and methods to esti-mate R&D investment and adds it to GFCF in the official national
Adjustment using R&D expenditureAdjustment using the average trend of R&D share in GFCFAdjustment using the average trend of R&D share in GDP
1945 1950 1955 1960 1965 1970 1975 1980 1985 1990 1995 2000 2005 2010 2016
BangladeshCambodia
FijiIndia
IndonesiaIran
JapanLao PDRMalaysia
MongoliaNepal
PakistanPhilippines
Sri LankaThailandVietnam
BhutanBruneiChina
MyanmarBahrainKuwaitOmanQatar
Saudi ArabiaUAE
Turkey
19701970 1993 20021970 2010
1950 19581951 1970 2000
1959 2001 20091955
1981 20021955 1996
1960 1970 19971964 1974 2009
1960 19901946 1950
1959 19961951 1990
1955 2002 201119701970 1989 2002 2005
19521952 1958 1997 2003
19701962 1997
1970 201119701970 20031970 2011
1960 1970
Figure 110 Adjustment of R&D
Source: APO Productivity Database 2018.
©20
18 A
sian
Prod
uctiv
ity O
rgan
izat
ion

132
Appendix
accounts. If the data on R&D expenditures are not available, as a crude estimate, the trend of R&D investment shares on GFCF or GDP are applied to extrapolate past estimates. Fig-ure 111 plots the per capita GDP and the R&D investment share in GDP in 2016. The im-pacts on GDP by our adjust-ment of the additional R&D investment are less than 1.0% of GDP for all countries in 2016.
6) GDP at basic pricesGDP can be valued using dif-ferent price concepts: factor cost, basic prices, and market prices. If the price concept is not standardized across coun-tries, it will interfere with the international comparisons. All the countries covered in this Databook officially report GDP at market prices (or at purchas-ers’ prices), but this is not true for GDP at factor cost and GDP at basic prices. International comparisons in Chapter 3 (on economic scale and growth) and Chap-ter 4 (on final demand) are based on GDP at market prices. However, by valuing output and input at the prices that producers actually pay and receive, GDP at basic prices is a more appropriate measure of coun-tries’ output than GDP at market prices for international comparisons of TFP and industry performance, as it is a measure from the producers’ perspective. Hence, Chapter 5 on whole-economy productivity per-formance is based on GDP at basic prices, including our estimates.
These concepts of GDP differ in the treatment of indirect tax and subsidies (and import duties). The dif-ference between GDP at basic prices and GDP at market prices is “taxes on products” minus “subsidies on products.” “Taxes on products” are the indirect taxes payable on goods and services mainly when they are produced, sold, and imported, and “subsidies on products” are subsidies payable on goods and services mainly when they are produced, sold, and imported. Since GDP at basic prices is available for some economies, such as Hong Kong, India, Korea, Mongolia, Nepal, Singapore, and Sri Lanka, a GDP at basic prices calculation, needs to be constructed for all other countries. In order to obtain GDP at basic prices, “taxes on products” and “duties on imports” are subtracted from GDP at market prices, which are available for all the countries studied, and “subsidies on products” is added. The main data sources for es-timating “taxes on products” and “subsidies on products” are tax data in national accounts, the IMF’s Government Finance Statistics, and the input-output tables in each country.
Readers should bear these caveats in mind when interpreting the results in Chapter 6, since the definition of GDP by industry differs among countries due to data availability. GDP is valued at: factor cost for Fiji, and Pakistan; basic prices for Bangladesh, Cambodia, Hong Kong, India, Korea, the Lao PDR, Mongolia, Nepal, Singapore, and Vietnam; producers’ prices for Iran, the ROC, and the Philippines; and market
Figure 111 R&D Share in GDP_Share of R&D investment in GDP at current prices in 2016
Sources: Official national accounts, including author adjustments; Surveys on R&D in each country; World Bank (2017).
O�cal estimates of R&D investmentOur estimates based on o�cial data of R&D expenditure, including author adjustmentsOur estimates using the average trend of R&D share in GFCFOur estimates using the average trend of R&D share in GDP
Bangladesh
Cambodia
ROC
Fiji
Hong Kong
India
Indondsia
Iran
Japan
Korea
Lao PDR
Malaysia
MongoliaNepalPakistan
Philippines
Singapore
Sri Lanka
Thailand
Vietnam
China
Brunei
Myanmar
US
Australia
Turkey
Bhutan
Per capita GDP in 2016 (using 2011 PPP, reference year 2016)
R&D share in GDP, 2016
0.0
0.5
1.0
1.5
2.0
2.5
3.5
3.0
4.5
4.0
%
0 10 20 30 40 50 60 70 9080
Thousands of US dollars (as of 2016)
©20
18 A
sian
Prod
uctiv
ity O
rgan
izat
ion
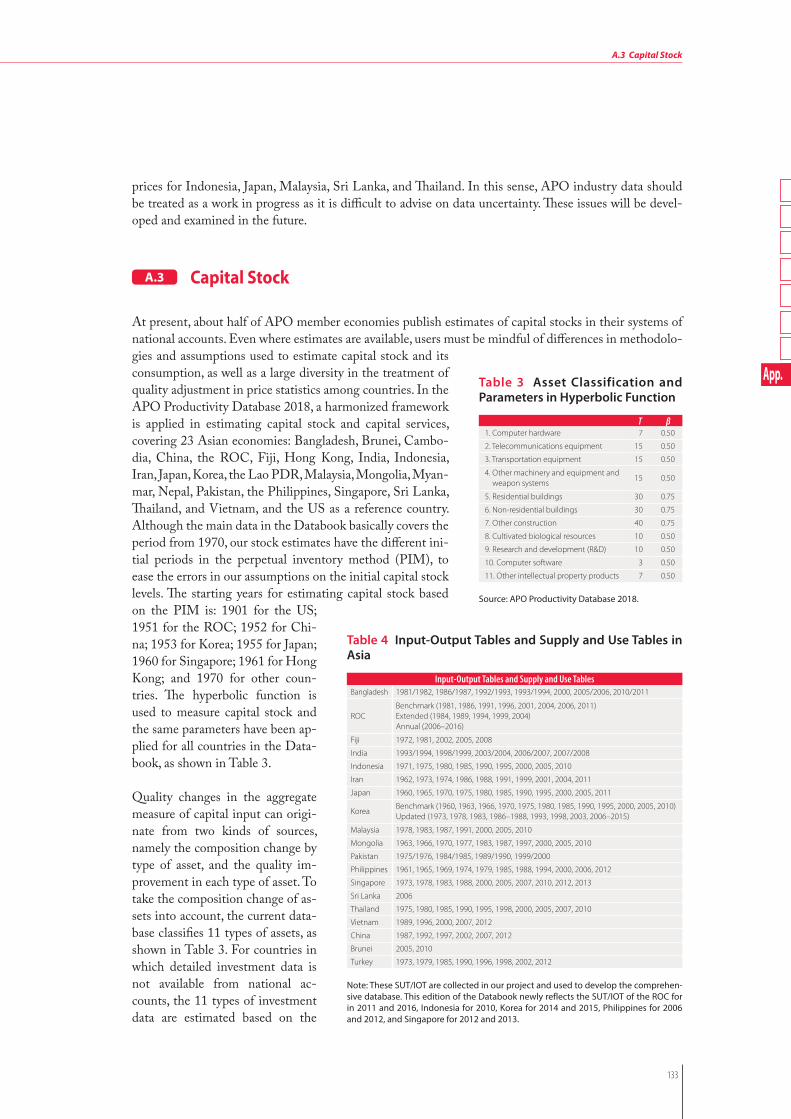
133
A.3 Capital Stock
App.
prices for Indonesia, Japan, Malaysia, Sri Lanka, and Thailand. In this sense, APO industry data should be treated as a work in progress as it is difficult to advise on data uncertainty. These issues will be devel-oped and examined in the future.
Capital Stock A.3
At present, about half of APO member economies publish estimates of capital stocks in their systems of national accounts. Even where estimates are available, users must be mindful of differences in methodolo-gies and assumptions used to estimate capital stock and its consumption, as well as a large diversity in the treatment of quality adjustment in price statistics among countries. In the APO Productivity Database 2018, a harmonized framework is applied in estimating capital stock and capital services, covering 23 Asian economies: Bangladesh, Brunei, Cambo-dia, China, the ROC, Fiji, Hong Kong, India, Indonesia, Iran, Japan, Korea, the Lao PDR, Malaysia, Mongolia, Myan-mar, Nepal, Pakistan, the Philippines, Singapore, Sri Lanka, Thailand, and Vietnam, and the US as a reference country. Although the main data in the Databook basically covers the period from 1970, our stock estimates have the different ini-tial periods in the perpetual inventory method (PIM), to ease the errors in our assumptions on the initial capital stock levels. The starting years for estimating capital stock based on the PIM is: 1901 for the US; 1951 for the ROC; 1952 for Chi-na; 1953 for Korea; 1955 for Japan; 1960 for Singapore; 1961 for Hong Kong; and 1970 for other coun-tries. The hyperbolic function is used to measure capital stock and the same parameters have been ap-plied for all countries in the Data-book, as shown in Table 3.
Quality changes in the aggregate measure of capital input can origi-nate from two kinds of sources, namely the composition change by type of asset, and the quality im-provement in each type of asset. To take the composition change of as-sets into account, the current data-base classifies 11 types of assets, as shown in Table 3. For countries in which detailed investment data is not available from national ac-counts, the 11 types of investment data are estimated based on the
Table 3 Asset Classification and Parameters in Hyperbolic Function
Source: APO Productivity Database 2018.
T β1. Computer hardware 7 0.50
2. Telecommunications equipment 15 0.50
3. Transportation equipment 15 0.50
4. Other machinery and equipment and weapon systems
15 0.50
5. Residential buildings 30 0.75
6. Non-residential buildings 30 0.75
7. Other construction 40 0.75
8. Cultivated biological resources 10 0.50
9. Research and development (R&D) 10 0.50
10. Computer software 3 0.50
11. Other intellectual property products 7 0.50
Table 4 Input-Output Tables and Supply and Use Tables in Asia
Input-Output Tables and Supply and Use TablesBangladesh 1981/1982, 1986/1987, 1992/1993, 1993/1994, 2000, 2005/2006, 2010/2011
ROCBenchmark (1981, 1986, 1991, 1996, 2001, 2004, 2006, 2011) Extended (1984, 1989, 1994, 1999, 2004) Annual (2006–2016)
Fiji 1972, 1981, 2002, 2005, 2008
India 1993/1994, 1998/1999, 2003/2004, 2006/2007, 2007/2008
Indonesia 1971, 1975, 1980, 1985, 1990, 1995, 2000, 2005, 2010
Iran 1962, 1973, 1974, 1986, 1988, 1991, 1999, 2001, 2004, 2011
Japan 1960, 1965, 1970, 1975, 1980, 1985, 1990, 1995, 2000, 2005, 2011
KoreaBenchmark (1960, 1963, 1966, 1970, 1975, 1980, 1985, 1990, 1995, 2000, 2005, 2010) Updated (1973, 1978, 1983, 1986–1988, 1993, 1998, 2003, 2006–2015)
Malaysia 1978, 1983, 1987, 1991, 2000, 2005, 2010
Mongolia 1963, 1966, 1970, 1977, 1983, 1987, 1997, 2000, 2005, 2010
Pakistan 1975/1976, 1984/1985, 1989/1990, 1999/2000
Philippines 1961, 1965, 1969, 1974, 1979, 1985, 1988, 1994, 2000, 2006, 2012
Singapore 1973, 1978, 1983, 1988, 2000, 2005, 2007, 2010, 2012, 2013
Sri Lanka 2006
Thailand 1975, 1980, 1985, 1990, 1995, 1998, 2000, 2005, 2007, 2010
Vietnam 1989, 1996, 2000, 2007, 2012
China 1987, 1992, 1997, 2002, 2007, 2012
Brunei 2005, 2010
Turkey 1973, 1979, 1985, 1990, 1996, 1998, 2002, 2012
Note: These SUT/IOT are collected in our project and used to develop the comprehen-sive database. This edition of the Databook newly reflects the SUT/IOT of the ROC for in 2011 and 2016, Indonesia for 2010, Korea for 2014 and 2015, Philippines for 2006 and 2012, and Singapore for 2012 and 2013.
©20
18 A
sian
Prod
uctiv
ity O
rgan
izat
ion

134
Appendix
benchmark and/or annual input–output tables (IOT) or supply-use table (SUT) and our own estimates on the commodity flow of domestic production and export/import of assets. The SUT/IOT used in our measurement are listed in Table 4. In our estimates on investment by type of asset, this edition of the Databook newly reflects the SUT/IOT of the ROC for in 2011 and 2016, Indonesia for 2010, Korea for 2014 and 2015, Philippines for 2006 and 2012, and Singapore for 2012 and 2013.
It is well known that prices of constant-quality IT capital have been falling rapidly. For cross-country comparisons, it has been noted that there is great diversity in the treatment of quality adjustment in price statistics among countries. Cross-country comparisons will be significantly biased if some countries adjust their deflators for quality change while others do not. Price harmonization is sometimes used in an at-tempt to control for methodological differences in the compilation of price indexes, under the assumption that individual countries’ price data fails to capture quality improvements. Assuming that the relative price of IT to non-IT capital in the countries compared is set equal to the IT to non-IT prices relative in the reference country, the harmonized price is formulated as: ∆ ln P̃ IT
X = ∆ ln PnITX + (∆ ln PIT
ref − ∆ ln PnITref ), where
the superscript X denotes the country included in the comparisons, PIT is the price of IT capital, and PnIT is the price of non-IT capital. The price of IT capital in country X, P̃ IT
X, is computed by the observed prices PIT
ref and PnITref in the reference country and PnIT
X in X. Schreyer (2002) and Schreyer, Bignon, and Dupont (2003) applied price harmonization to OECD capital services, with the US as a reference coun-try, since the possible error due to using a harmonized price index would be smaller than the bias arising from comparing capital services based on national deflators.
In this Databook, the same price harmonization method is applied to adjust the quality improvement for IT hardware and communications equipment in countries where the appropriate quality-adjusted price data is not available, with Japan’s prices as a reference country. A similar procedure was applied in cases where the prices for some assets were not available, to estimate missing data based on the relative price of these assets to total GFCF. In measuring capital services, this Databook largely follows the framework of the OECD Productivity Database.118 The OECD assumes the truncated normal distribution as profiles for asset discarding (retirement) and the hyperbolic distribution as profiles for asset decaying. The age-efficiency profile is defined as a combined distribution of discard and decay of assets. The age-efficiency profile in each asset is based on the two parameters in the hyperbolic function: T (average service life) and ß (–∞<ß≤1) The hy-perbolic function becomes one-hoss shay (no decay un-til T) when ß=1 and linear when ß=0. These two param-eters are set, as shown in Table 3. The estimates of productive capital stock by type of asset are used in mea-suring capital services (see Appendix 4).
118: See OECD (2018a) and the website of the OECD productivity statistics (http://www.oecd.org/std/productivity-stats/). The project appreciates Maria Belen Zinni (Statistics Directorate, OECD) for her supports.
4.5
3.5 3.3
3.0 2.9 2.9 2.9 2.8 2.7 2.7 2.7 2.7 2.7 2.6 2.6 2.6 2.5 2.5 2.4 2.2 2.2
2.1
1.9 1.7
0.6
1.7
2.3
1.3 1.2
2.1
2.8
4.0
2.1 1.8
2.2
1.7 1.6
0.9
2.9
1.9 1.9 2.1 2.4
1.8
0.8
2.3 1.9
0
1
2
3
4
519802016
GDP=1.0
Brunei
Korea
China
Nepal
Indonesia
Thailand
Japan
Mongolia
Sri Lanka
Hong Kong
Singapore
Bangladesh
ROC
Lao PDR
Iran
Fiji
Malaysia
Vietnam
US
India
Myanm
ar
Philippines
Cambodia
Pakistan
Figure 112 Capital-Output Ratio___Ratio of the beginning-of-period net capital stock to basic-price GDP at current prices in 1980 and 2016
Source: APO Productivity Database 2018. Note: The estimate for Cambodia is not available for 1980.
©20
18 A
sian
Prod
uctiv
ity O
rgan
izat
ion

135
A.4 Rate of Return and Capital Services
App.
Figure 112 presents the estimated capital-output ratio (stock coefficient) that is defined by the ratio of the beginning-of-period net capital stock (all types of produced fixed assets owned by private and public in-stitutions) to the basic-price GDP at current prices. Brunei has the highest capital-output ratio among Asian countries, at 4.5. However, the ratio may not work well for cross-country comparisons since the price differential between that for GDP and fixed assets in each country is not calculated. Compared to the 1980 level in each country, all Asian countries except Mongolia, Iran, Pakistan, and the Philippines have an increasing trend of capital-output ratio, unlike the ratio in the US, which is stable.
Rate of Return and Capital ServicesA.4
In the analysis of production and productivity, capital service provides an appropriate concept of capital as a factor of production. The fundamental assumption in measuring capital services is proportionality between the (productive) capital stock and capital services in each type of asset. Thus, the growth rates of capital services can differ from that of capital stock only at the aggregate level. For aggregating different types of capital, the user costs of capital by type of asset are required. This Appendix outlines the method-ology of the user cost of capital estimation and presents the estimated results of endogenous rate of return for Asian countries in the APO Productivity Database 2018.
The user cost of capital of a new asset (with type of asset denoted as k of the period t), ukt,0, is defined as
qkt−1,0 {rt + (1 + π kt ) kP,t,0 − π kt }, where rt, kP,t,0, and qk
t,0 are the expected nominal rate of return, cross-section depreciation rate, and asset price, respectively. The asset-specific inflation rate π kt is defined as (qk
t,0 / qkt−1,0 −1).
The OECD assumes the country-specific ex-ante real rate of return r * that is constant for the whole pe-riod, and defines the nominal rate of return as rt = (1 + r *)(1 + tt) − 1, where tt represents the expected overall inflation rate, defined by a five-year centered moving average of the rate of change of the CPI (see Schreyer, Bignon, and Dupont, 2003).
One of the main difficulties in applying the ex-ante approach for measuring user cost of capital is obtain-ing proper estimates for real rates of return, which can differ considerably among countries and over time. On the other hand, the ex-post approach originated by Jorgenson and Griliches (1967) allows an estima-tion based on observed data. Assuming constant returns to scale and competitive markets, capital com-pensation can be derived from the summation of the capital service cost V k
t for each asset, which is defined as the product of the user cost of capital and the productive capital stock (i.e., Vt = ∑k V kt = ∑k u kt,0 S kt ). Based on this identity and the n-equations of user cost of capital, the n+1 variables of u kt,0 and rt are simultane-ously determined, using the observed capital compensation Vt as the total sum of V kt that is not observable in each asset. Note that the depreciation rate kP,t,0 is not independent of the estimated rt.
The estimated results of the ex-post real rate of return based on rt* = (1 + rt) / (1 + tt)−1 for 23 Asian coun-tries and the US are shown in Figure 113. Although there are large fluctuations in countries like the Lao PDR, Mongolia, and Vietnam, many Asian countries may exhibit decreasing trends in the (endogenous) real rate of return, while the US holds a stable rate of around 10%. Table 5 presents the five-year averages of the estimated rates for ex-post real rate of return during 1970–2016. In 2010–2016, the real rate of return ranged from 6.0% for Japan and 7.6% for Korea to 21.1% in Malaysia and 42.5% for Cambodia. Using these ex-post estimates, the aggregate capital services are measured in this report. The difference caused by the ex-ante and ex-post approaches may provide a modest difference in the growth measure of capital services, regardless of the substantial differences in the rates of return and capital compensations.
©20
18 A
sian
Prod
uctiv
ity O
rgan
izat
ion

136
Appendix
Figure 113 Ex-Post Real Rate of Return in Asia___Nominal rate of return in 1970–2016
Source: APO Productivity Database 2018. Note: Countries are grouped according to the levels of per capita income in 2016, relative to the US, defined in Table 2 in Section 6.1 (p. 87).
Figure 113.1: Group-D1 (100%≤) Figure 113.2: Group-D2 (70%≤...<100%) and the US
Figure 113.3: Group-D3 (40%≤...<70%) Figure 113.4: Group-D4 (20%≤...<40%)
Figure 113.5: Group-D5 (10%≤...<20%) Figure 113.6: Group-D6 (<10%)
1990 1995 2000 20051970 1975 1980 1985 2010 2015
10
0
40
30
20
%
1990 1995 2000 20051970 1975 1980 1985 2010 20150
10
20
40
30
%
1990 1995 2000 200519700
10
20
50
40
30
%
1975 1980 1985 2010 2015 1975 1980 1985 1990 1995 2000 2005 2010 201519700
10
20
50
40
30
%
1975 1980 1985 1990 1995 2000 2005 2010 201519700
10
20
50
40
30
%
0
20
40
60
100
80
%
1975 1980 1985 1990 1995 2000 2005 2010 20151970
SingaporeBrunei Hong Kong
USROC Japan
MalaysiaKoreaIndonesiaIran
China
Sri LankaThailand
Mongolia
VietnamPhilippinesLao PDR
FijiIndia
Pakistan
Bangladesh CambodiaMyanmar Nepal
©20
18 A
sian
Prod
uctiv
ity O
rgan
izat
ion

137
A.5 Hours Worked and Labor Compensation
App.
Hours Worked and Labor CompensationA.5
Labor volume can be measured in three units: number of persons in employment; number of filled jobs; and hours actually worked. Given the variations in working patterns and employment legislation both over time and across countries, hours worked, if accurately measured, offers the most time-consistent and somewhat internationally comparable unit measuring the volume in each of different types of labor. This is the primary underlying reason for the importance of choosing hours actually worked in productivity analysis, but in reality, due to the difficulty in accurately estimating average hours actually worked, it is not always available or comparable across countries. The variety of data sources, definitions, and methodolo-gies available in estimating these labor market variables often leads to a fragmentation of labor market statistics of an individual country concerned, dubious data quality, and incomparability across countries. Here follows an attempt to outline some of these intricate measuring issues.
Data on labor volume comes from two main statistical surveys on establishment and household, with re-spective strengths and weaknesses. Establishment surveys are surveys of firms with stratified sample frames by the size of establishments. The concentration of total employment in a relatively small number of establishments means that this sampling strategy is cost-effective in delivering high precision labor market estimates with a fairly small sampling error. Questionnaires are designed to be close to the con-cepts used in company administration. This has both strengths and weaknesses. On the one hand, data collected is of high quality and accuracy. On the other hand, changes in legislation and regulation could be a source of instability to the definitions, and in turn of the data collected. Furthermore data that com-panies do not collect for administrative purpose, such as unpaid hours and worker characteristics, are unavailable. This greatly limits the varieties of labor market data that can be collected through establish-ments. Employment as measured is necessarily based on jobs rather than on persons employed, as persons holding multiple jobs with different establishments cannot be identified and will be counted more than once. Information on hours is on paid hours rather than hours actually worked. Certain categories of
Table 5 Average Ex-Post Real Rate of Return in Asia
Unit: Percentage.Source: APO Productivity Database 2018. Note: The starting year is 1993 for Cambodia.
1970–1974 1975–1979 1980–1984 1985–1989 1990–1994 1995–1999 2000–2004 2005–2009 2010–2016Bangladesh 21.8 19.2 13.4 21.9 23.5 19.2 19.1 17.8 18.8Brunei 34.0 63.8 95.3 44.5 29.8 19.1 18.9 23.3 19.3Cambodia 29.9 44.9 39.8 33.8 42.5China 18.5 15.3 13.7 13.0 15.0 10.6 13.2 15.0 7.9ROC 33.8 22.5 16.4 21.5 18.3 16.2 17.6 15.4 11.5Fiji 21.0 19.9 12.9 10.2 22.3 15.8 13.0 13.7 13.5Hong Kong 24.6 26.0 16.8 22.0 13.2 11.4 10.2 13.9 10.2India 10.0 13.7 10.3 9.5 8.0 7.9 11.4 11.9 5.9Indonesia 41.5 43.0 44.7 29.6 24.3 27.0 24.4 28.7 12.9Iran 32.0 30.1 12.3 12.7 26.7 12.8 24.1 28.0 21.1Japan 15.9 7.7 6.3 8.7 7.1 5.3 6.0 6.5 6.0Korea 38.5 30.7 17.4 19.7 15.8 11.9 11.0 9.9 7.6Lao PDR 24.2 23.2 24.5 24.3 22.9 9.2 25.4 28.7 29.9Malaysia 32.4 32.7 21.4 17.1 17.9 18.7 18.6 21.7 21.1Mongolia 13.0 11.0 10.6 13.7 −2.0 26.6 5.7 18.6 19.0Myanmar 56.1 86.4 71.5 54.8 57.2 66.1 65.1 49.8 45.3Nepal 48.4 32.7 22.3 20.7 17.3 10.0 14.8 17.4 10.3Pakistan 24.2 23.8 18.1 23.5 19.8 22.3 30.3 24.8 25.1Philippines 19.5 21.3 16.2 14.9 13.5 17.1 22.7 21.2 19.7Singapore 24.7 18.7 15.7 13.8 15.1 12.8 11.3 17.2 14.1Sri Lanka 24.7 35.5 17.2 13.1 11.1 9.7 12.1 17.0 20.4Thailand 21.1 18.2 13.3 17.5 16.5 13.1 12.0 12.9 13.0Vietnam 6.9 11.9 44.3 29.4 44.8 32.7 29.3 19.5 16.8US 12.0 10.3 8.0 9.4 9.0 11.2 12.0 11.1 10.9
©20
18 A
sian
Prod
uctiv
ity O
rgan
izat
ion

138
Appendix
employment, most notably the self-employed, are not covered. Sometimes small firms, informal employ-ment (occupies more than 50% in some developing Asian countries) or the public sector is also excluded. As a result of these limitations, labor market data from establishment surveys often requires a raft of ad-justments for omissions and definition modifications during the compilation process.
Household-based labor force surveys (LFS), in contrast, have full coverage of the economy, although they sometimes incorporate age or geographic exclusions and may have imperfect coverage of the armed forc-es and other institutional households. Nonetheless, they provide valuable data on certain employment groups such as the self-employed and unpaid family workers, and on the rate of multiple job holding. Employment status in LFS is independently determined and is not subject to the criteria used in com-pany records. Most countries follow the International Labour Organization (ILO) definitions. As LFS are surveys from the socio-economic perspective, they also provide rich data on worker characteristics that are relevant to productivity analysis. The major weakness of the LFS, however, is data precision. By relying on the recollection of the respondents, their response also depends on perception. Response errors could, therefore, arise from confusion of concepts and imprecise recollection of the respondents concerning work patterns and pay during the reference week. Another source of error origi-nates from proxy response, which re-lies on the proxy’s perception and knowledge of another household’s member. A high level of proxy re-sponses could, therefore, reduce the reliability of data collected.
The common practice of statistical of-fices has been to combine informa-tion from both establishment and household surveys, with a view of making use of the most reliable as-pects of each of the surveys. This seems to be the most promising ave-nue forward in improving the quality and consistency of data on labor in-put. However, statistical offices could still differ a great deal in their meth-odologies, especially in estimating the annual average hours worked per job/person, depending on their starting points, namely LFS data or enterprise data. All these have to be taken into account in international comparisons of productivity.
In productivity analysis, ideally labor volume should be quality adjusted in order to reflect workforce heteroge-neity, as recommended in the SNA 2008. To adjust total hours worked for quality would require information on worker characteristics in order to
Sources of Labor DataBangladesh Population and Housing Census, Labour Force Survey
Bhutan Population and Housing Census, Labour Force Survey
CambodiaGeneral Population Census, Inter-Censal Population Survey, Labor Force Survey, Socio-Economic Survey, Survey on Business Conditions of Japanese Companies in Asia and Oceania
ChinaChina Statistical Yearbook, China Labor Statistical Yearbook, Population Census, 1% National Population Sample Survey
ROCPopulation and Housing Census, Yearbook of Manpower Survey Statistics in Taiwan Area, Manpower Utilization Survey
FijiCensus of Population and Housing, Employment and Unemployment Survey, Annual Employment Survey
Hong KongPopulation Census, Population By-Census, General Household Survey, Annual Earnings and Hours Survey
IndiaCensus of India, Employment and Unemployment Survey, National Sample Survey
IndonesiaPopulation and Housing Census, Labor Force Situation in Indonesia, Laborer Situation in Indonesia
IranNational Population and Housing Census, Labour Force Survey, Iran Salary Report
JapanPopulation Census, Labor Force Survey, Basic Survey on Wage Structure, Japan's System of National Accounts
KoreaPopulation and Housing Census, Economically Active Population Survey, Employment Structure Survey, Wage Structure Survey
Lao PDRPopulation Census, Labour Force Survey, Urban Labour Force Survey, ADB Key Indicators for Asia and the Pacific, Survey on Business Conditions of Japanese Companies in Asia and Oceania
Malaysia Population and Housing Census, Labour Force Survey, Salaries & Wages Survey
MongoliaPopulation and Housing Census, Labour Force Survey, Survey on Wages and Salaries, A Pilot Time Use Survey
MyanmarPopulation and Housing Census, Labour Force Survey, Salary Survey Report, Survey on Business Conditions of Japanese Companies in Asia and Oceania
Nepal Population and Housing Census, Labor Force Survey
Pakistan Population Census, Labour Force Survey, Census of Manufacturing Industries
Philippines Labor Force Survey
SingaporePopulation Census, Labor Force Survey, Singapore Yearbook of Manpower Statistics, General Household Survey
Sri Lanka Census of Population and Housing, Labour Force Survey
Thailand Population and Housing Census, Labor Force Survey
VietnamPopulation and Housing Census, Labour Force and Employment Survey, Living Stabdards Survey, Vietnam Statistical Data in the 20th Century, Vietnam Economy 1986–1991
Table 6 Sources of Labor Data
Source: Asia QALI Database 2018.
©20
18 A
sian
Prod
uctiv
ity O
rgan
izat
ion
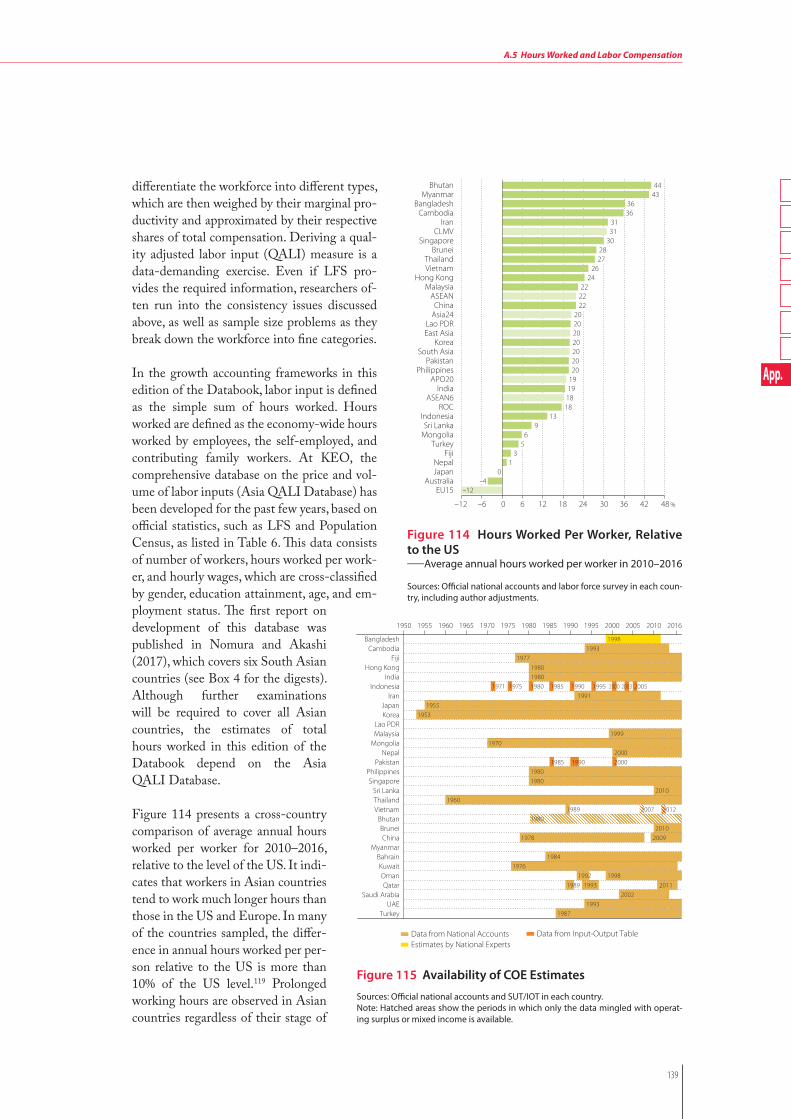
139
A.5 Hours Worked and Labor Compensation
App.
differentiate the workforce into different types, which are then weighed by their marginal pro-ductivity and approximated by their respective shares of total compensation. Deriving a qual-ity adjusted labor input (QALI) measure is a data-demanding exercise. Even if LFS pro-vides the required information, researchers of-ten run into the consistency issues discussed above, as well as sample size problems as they break down the workforce into fine categories.
In the growth accounting frameworks in this edition of the Databook, labor input is defined as the simple sum of hours worked. Hours worked are defined as the economy-wide hours worked by employees, the self-employed, and contributing family workers. At KEO, the comprehensive database on the price and vol-ume of labor inputs (Asia QALI Database) has been developed for the past few years, based on official statistics, such as LFS and Population Census, as listed in Table 6. This data consists of number of workers, hours worked per work-er, and hourly wages, which are cross-classified by gender, education attainment, age, and em-ployment status. The first report on development of this database was published in Nomura and Akashi (2017), which covers six South Asian countries (see Box 4 for the digests). Although further examinations will be required to cover all Asian countries, the estimates of total hours worked in this edition of the Databook depend on the Asia QALI Database.
Figure 114 presents a cross-country comparison of average annual hours worked per worker for 2010–2016, relative to the level of the US. It indi-cates that workers in Asian countries tend to work much longer hours than those in the US and Europe. In many of the countries sampled, the differ-ence in annual hours worked per per-son relative to the US is more than 10% of the US level.119 Prolonged working hours are observed in Asian countries regardless of their stage of
Figure 114 Hours Worked Per Worker, Relative to the US_Average annual hours worked per worker in 2010–2016
Sources: Official national accounts and labor force survey in each coun-try, including author adjustments.
48 %−6 0 6 12 18 24 36 4230−12
EU15Australia
JapanNepal
FijiTurkey
MongoliaSri Lanka
IndonesiaROC
ASEAN6India
APO20Philippines
PakistanSouth Asia
KoreaEast AsiaLao PDR
Asia24China
ASEANMalaysia
Hong KongVietnamThailand
BruneiSingapore
CLMVIran
CambodiaBangladesh
MyanmarBhutan
−12 −4
0 1
3 5 6
9 13
18 18 19 19 20 20 20 20 20 20 20
22 22 22
24 26
27 28
30 31 31
36 36
43 44
Figure 115 Availability of COE Estimates
Sources: Official national accounts and SUT/IOT in each country. Note: Hatched areas show the periods in which only the data mingled with operat-ing surplus or mixed income is available.
1950
Data from National Accounts Data from Input-Output TableEstimates by National Experts
1955 1960 1965 1970 1975 1980 1985 1990 1995 2000 2005 2010 2016
BangladeshCambodia
FijiHong Kong
IndiaIndonesia
IranJapanKorea
Lao PDRMalaysia
MongoliaNepal
PakistanPhilippinesSingapore
Sri LankaThailandVietnam
BhutanBruneiChina
MyanmarBahrainKuwaitOmanQatar
Saudi ArabiaUAE
Turkey
19981993
1977
19801980
1971 1975 1980 1985 1990 1995 2000 2003 20051991
19551953
19991970
20001985 1990 2000
19801980
20101960
1989 2007 20121980
20101978 2009
19841976
1992 19981989 1993 2011
20021993
1987
©20
18 A
sian
Prod
uctiv
ity O
rgan
izat
ion

140
Appendix
development, spanning low-income countries such as Bangladesh and Cambodia to high-income coun-tries such as the ROC and Singapore. An exception is Japan. Workers in Japan are likely to work much shorter hours than those in other Asian countries. However, compared with the EU15, hours worked by workers in Japan are still about 12% greater.
The labor share, which is defined as the ratio of labor compensation of total employment to GDP at basic prices, is one of the key factors to determine TFP growth. The estimates on the compensation of employ-ees (COE), however, are not fully available in the official national accounts in Asian countries. Figure 115 summarizes the availability of the COE estimates in the official national accounts and the input-output tables in each country. Currently the national accounts in Bangladesh, the Lao PDR, Myanmar, Pakistan, and Vietnam do not fully publish the COE estimates. In addition, in some countries like Cambodia and Iran, the estimates are not fully available for the entire period of our observation (1970–2016). In such cases, the COE is estimated or extrapolated by the estimates based on the Asia QALI Database, which is described above.
The compensation for the self-employed and contributing family workers is not separately estimated in the national accounts, but is combined with returns to capital in mixed income. This edition of the Data-book follows the assumption used in the Asia QALI Database, which a country-common assumption is applied for all countries, with the exceptions for countries where reliable data are available. The assump-tion used in Asia QALI Database is that the wage differential ratio in hourly wages of non-employees to employees in each elementary group of labor inputs is set as 0.2 in the standard case.
Purchasing Power ParitiesA.6
Purchasing power parities (PPPs) are indispensable inputs into economic research and policy analysis involving cross-country comparisons of macroeconomic aggregates. They affect a double conversion of macro-economic measures, estimated in national currencies and price levels, into comparable cross-country volume measures. These are expressed in a common currency and at a uniform price level. PPPs are price relatives that show the ratio of the prices in national currencies of single or composite goods and services in different countries. They are compiled within the International Comparisons Program (ICP). Comparisons are made from the expenditure side of GDP. To this end, the ICP compiles PPPs by holding worldwide surveys at regular intervals (currently, every six years) to collect comparable price and expendi-ture data for the entire range of final goods and services that make up the final expenditures on GDP. In April 2014, the new benchmark PPP estimates were published by the ICP 2011 round. For a number of methodological improvements, see Eurostat-OECD (2012) and World Bank (2014).
Chapter 3 mainly provides the cross-country comparison of economic volumes. To obtain comparable volume measures, the Databook uses the constant PPP approach, which relies not on a time series of PPPs, but on one of the benchmark estimates. The Databook has used the new benchmark estimates by the ICP 2011 round since the 2015 publication. The use of this approach creates national series for vol-umes at the prices of a common reference year (i.e., 2016), and deflates these by the PPP for a fixed year (i.e., 2011).
119: Shorter hours worked in Nepal is due to frequent general strikes called “Banda”, which are mainly lead by some political par-ties. According to the Nepal Human Rights Commission, Banda were called 821 times in various regions in 2009, and economic activities were closed during Banda.
©20
18 A
sian
Prod
uctiv
ity O
rgan
izat
ion

141
A.6 Purchasing Power Parities
App.
It is inevitable that they will be compared with the results of the previous round in 2005, which has provided the benchmark estimate for the past Databook series in 2009–2013. Figure 116 shows the revisions of PPPs in Asian countries at the 2011 ICP round, in comparison with the 2005 ICP round. The 2011 benchmark PPP for most of the Asian countries is lower than suggested by their ex-trapolated equivalents from the 2005 benchmark, with a difference ranging from +3% for Korea to –47% for Myan-mar. With the exception of Singapore, it is observed that revisions for the more mature economies are much smaller (ranging within ±4%) than those for the rapidly developing economies (with downward revisions greater than 10%). Therefore, the impact of the PPP revisions is to raise the relative size of Asian economies, moving them closer to the level of the more mature economies. More specifically, the PPP revisions for India and China are –24% and –16%, respectively. As a result, the relative positions of India and China have improved considerably in cross-country level comparisons after PPP revisions at the 2011 ICP round.
These revisions by the 2005 ICP round have a property to partly offset the past upward revisions by the 2005 ICP round for many Asian countries. The 2005 benchmark PPP for most of the Asian countries were upwardly revised compared to their extrapolated equivalents from the 1993 benchmark estimates that had been used in the Databook 2008. For example, the PPP estimates were upwardly revised by 55% and 65% (thus the internationally comparable measures of GDP in 2005 were reduced by 36% and 40%) for India and China, respectively.
Singapore is an exceptional country, in which the PPP has been downwardly revised (thus the relative size of the economy has been upwardly revised) by both of the revisions of the ICP 2005 and 2011 rounds. The PPP for Singaporean GDP was revised by –29% and by –16% in the ICP 2005 and 2011 rounds, respec-tively. Based on the constant PPP approach, the revision by the ICP 2011 round advanced the years when the Singapore economy has surpassed Japan and the US to 1980 (from 1993) and 1992 (from 2004), re-spectively, as a measure of per capita GDP. It may require further examination if this revision provides an appropriate view. Generally speaking, the cross-country level comparison has to face a much larger op-portunity to be revised, compared to the cross-country growth comparison. The readers should bear in mind these circumstances.
Figure 116 Revisions of PPP for GDP by the 2011 ICP Round_Ratio of the 2011 ICP PPP to the 2005 ICP PPP (extrapolated for 2011)
Source: World Bank, World Development Indicators 2014.
−50 −40 −30 −20 −10 0 10 %
311
−1−4−4
−13−14
−16−16
−18−21−22
−23−24
−27−28−28
−29−31−31
−34−35
−36−37
−39−39
−40−41
−45−45
−47
KoreaAustraliaHong KongJapanROCTurkeyCambodiaBhutanSingaporeChinaIranVietnamBangladeshMalaysiaIndiaBruneiUAEPhilippinesThailandSri LankaNepalPakistanLao PDRMongoliaFijiSaudi ArabiaQatarBahrainOmanKuwaitIndonesiaMyanmar
©20
18 A
sian
Prod
uctiv
ity O
rgan
izat
ion

142
Appendix
Other DataA.7
For China, multiple data sources have been used; GDP for the whole economy, industry GDP, final demands, employment, and income data are taken from China Statistical Yearbook and China National Income 1952–1995; time-series data of GFCF during 1952–2016 at current and constant prices are con-structed at KEO; the main references for GFCF construction are drawn from Statistics on Investment in Fixed Assets of China 1950–2000, China Statistical Yearbook, and 1987, 1992, 1997, 2002, 2007, and 2012 Input–Output Tables of China; and multiple data sources for manufacturing, electrics, and trade data from China’s Customs Statistics are also utilized.120
The data source for the EU15 and the EU28 is the OECD.Stat (http://stats.oecd.org/) and the Eurostat (http://ec.europa.eu/). The data for the US, Australia, Bhutan, and Turkey are taken from the website of the US Bureau of Economic Analysis (http://www.bea.gov), the Australian Bureau of Statistics (http://www.abs.gov.au/), the National Statistics Bureau of Bhutan (http://www.nsb.gov.bt/) and UNDESA (2016),121 and the Turkish Statistical Institute (http://www.turkstat.gov.tr), respectively.
The exchange rates used in this edition are adjusted rates, called the Analysis of Main Aggregate (UNSD database) rates, in the UNSD National Accounts Main Aggregate Database. The AMA rates coincide with IMF rates except for some periods in countries with official fixed exchange rates and high inflation, when there could be a serious disparity between real GDP growth and growth converted to US dollars based on IMF rates. In such cases, the AMA adjusts the IMF-based rates by multiplying the growth rate of the GDP deflator relative to the US.
Tax data of member economies are supplemented by the IMF’s Government Finance Statistics. From its tax revenue data, “taxes on goods and services” and “taxes on imports” are used for calculating taxes on products. From its expenditure data, “subsidies” are taken. Data taken from Government Finance Statis-tics play a key role in adjusting GDP at market prices to GDP at basic prices. The data for energy con-sumptions and CO2 emissions is based on IEA’s CO2 Emissions from Fuel Combustion, Energy Balances of OECD Countries, and Energy Balances of non-OECD Countries.
120: Holz (2006) provides a useful reference on Chinese official statistics. The project appreciates Meng Ruoyan (Keio University) for her supports on Chinese data.
121: The UNDESA project for developing the industry-level growth accounting framework for Bhutan was led by Koji Nomura (Keio University) and Hamid Rashid (UNDESA), supported by Mr. Nyingtob Pema Norbu (Gross National Happiness Commission, Royal Government of Bhutan), Mr. Sonam Tshering (Bhutan Interdisciplinary Research & Development), Mr. Sonam Laendup (National Statistics Bureau), Mr. Tandin Dorji and Ms. Dechen Dema (Ministry of Labour and Human Resources).
©20
18 A
sian
Prod
uctiv
ity O
rgan
izat
ion

143
A.8 Sensitivity of TFP Estimates
App.
Sensitivity of TFP EstimatesA.8
TFP computations, based on the growth accounting framework, depends on data that is sometimes dif-ficult to observe. One difficulty is calculating the compensation for the self-employed and unpaid family workers. Appendix 5 presents the assumption on measuring the labor compensation for total employ-ment. The future review on this assumption affects TFP estimates directly through the revision of factor income shares and indirectly through the estimates of the ex-post rate of return and thus the aggregate measure of capital services.
The right panel of Figure 117 presents the labor income share (the ratio of compensation of employees to the basic-price GDP) based on the official national accounts (in-cluding author adjustments in ba-sic-price GDP for some countries) in 24 Asian countries and the US in 2016. The left panel of the fig-ure illustrates the employee share to total employment. There is a significant divergence in labor in-come share for employees among the Asian countries. This does not necessarily reflect differences in the number of employees in total employment. Although Malaysia and the Philippines have a high employee share of 76% and 65%, the labor income share is only 37% and 38% in 2016, respectively.
Figure 118 illustrates the sensitiv-ity of TFP estimates by changing
Figure 117 Labor Income Share for Employees in 2016
Sources: Official national accounts in each country, including author adjustments; Asia QALI Database 2018.
020406080100 % 0 2010 4030 6050 %
Share of employees to total employment Labor income share for employees
ChinaUS
Hong KongJapan
MyanmarKorea
SingaporeROC
NepalIndonesia
PhilippinesMalaysiaBhutanPakistanVietnamThailand
FijiIndia
Sri LankaBrunei
MongoliaBangladesh
IranCambodiaLao PDR
83 94 92
88 44
81 95
83 29
49 65
76 38
41 45
49 66
21 60
95 53
42 56
26 19
58 55
54 53
52 49
46 45
44 42
38 37 37 37 36
36 35 34
33 32
30 30
25 24
13
Figure 118 Sensitivity of TFP Estimates by the Change of Labor Share_Average annual growth rates of total factor productivity in 1970–2016
Source: APO Productivity Database 2018.
−1
0
1
2
3
4%
TFP(vL−10%)TFPTFP(vL+10%)
China
Pakistan
India
ROC
Sri Lanka
Hong Kong
Thailand
Cambodia
Mongolia
Korea
Vietnam
Lao PDR
US
Japan
Singapore
Malaysia
Fiji
Bhutan
Bangladesh
Philippines
Indonesia
Iran
Nepal
Myanm
ar
2.9
1.9 1.91.6 1.5 1.4 1.3
1.0 0.9 0.9 0.9 0.8 0.8 0.70.4 0.3 0.3 0.2 0.2 0.1 0.1
3.8
2.1 2.3 2.3
1.8 1.9 1.71.4
1.2
1.7
1.2 1.2 1.0 1.20.9 0.8
0.4 0.6 0.30.6
0.2 0.0
2.1
1.7 1.4
0.91.2
1.0 0.90.6 0.6
0.1
0.5 0.4 0.6 0.3
0.0 0.0 0.0−0.1 −0.2
−0.7−0.7
−0.2 0.2 −0.2 −0.1−0.4 −0.3
−0.7
0.1
©20
18 A
sian
Prod
uctiv
ity O
rgan
izat
ion

144
Appendix
the factor income share during the period from 1970 to 2016. In general, the growth rate of capital input is higher than that of labor input, therefore the higher income share of labor results in higher estimates of TFP growth. In other words, labor productivity (Figure 50 in Section 5.2, p. 60) is improved much faster over a given period than capital productivity (Figure 66 in Section 5.4, p. 76), the growth of which tends to be frequently negative. The TFP estimate reflects the improvement of labor productivity more when the labor share increases. In Malaysia, with TFP growth of 0.3% on average during the period 1970–2016, the true estimate could be 0.8% if the current labor share were underestimated by 10%.
©20
18 A
sian
Prod
uctiv
ity O
rgan
izat
ion

145
A.9 Supplementary Tables
App.
Supplementary TablesA.9
Table 7 GDP using Exchange Rate_GDP at current market prices, using annual average exchange rate
Unit: Billions of US dollars. Sources: Official national accounts in each country, including author adjustments.Note: See Appendix 2 for the adjustments made to harmonize GDP coverage across countries.
1970 1980 1990 2000 2010 2016Japan 208 100.0 Japan 1,087 100.0 Japan 3,128 100.0 Japan 4,888 100.0 China 6,101 100.0 China 11,191 100.0China 93 44.7 China 306 28.2 China 395 12.6 China 1,211 24.8 Japan 5,700 93.4 Japan 4,949 44.2India 64 30.5 India 190 17.5 India 335 10.7 Korea 562 11.5 India 1,671 27.4 India 2,251 20.1Iran 11 5.4 Saudi Arabia 165 15.2 Korea 279 8.9 India 482 9.9 Korea 1,094 17.9 Korea 1,415 12.6Pakistan 10 4.9 Iran 97 9.0 ROC 167 5.3 ROC 331 6.8 Indonesia 756 12.4 Indonesia 933 8.3Indonesia 10 4.8 Indonesia 80 7.3 Indonesia 127 4.1 Saudi Arabia 191 3.9 Saudi Arabia 533 8.7 Saudi Arabia 653 5.8Bangladesh 10 4.7 Korea 65 6.0 Saudi Arabia 119 3.8 Hong Kong 172 3.5 Iran 477 7.8 ROC 531 4.7Korea 9.0 4.3 UAE 44 4.1 Iran 95 3.0 Indonesia 168 3.4 ROC 446 7.3 Iran 443 4.0Thailand 7.3 3.5 ROC 42 3.9 Thailand 89 2.8 Thailand 127 2.6 Thailand 342 5.6 Thailand 414 3.7Philippines 6.8 3.3 Thailand 33 3.1 Hong Kong 77 2.5 Iran 110 2.3 UAE 298 4.9 UAE 362 3.2ROC 5.8 2.8 Philippines 33 3.0 UAE 51 1.6 UAE 106 2.2 Malaysia 255 4.2 Hong Kong 321 2.9Saudi Arabia 5.4 2.6 Kuwait 30 2.7 Philippines 47 1.5 Singapore 96 2.0 Singapore 236 3.9 Singapore 310 2.8Malaysia 3.9 1.9 Hong Kong 29 2.7 Pakistan 46 1.5 Malaysia 95 1.9 Hong Kong 229 3.7 Philippines 305 2.7Hong Kong 3.8 1.8 Malaysia 25 2.3 Malaysia 45 1.4 Philippines 81 1.7 Philippines 200 3.3 Malaysia 297 2.6Kuwait 3.0 1.4 Pakistan 24 2.2 Singapore 39 1.2 Pakistan 79 1.6 Pakistan 175 2.9 Pakistan 278 2.5Sri Lanka 2.8 1.4 Bangladesh 19 1.7 Bangladesh 31 1.0 Bangladesh 51 1.1 Qatar 128 2.1 Bangladesh 221 2.0Myanmar 2.7 1.3 Singapore 12 1.1 Kuwait 19 0.6 Kuwait 38 0.8 Kuwait 118 1.9 Vietnam 208 1.9Singapore 1.9 0.9 Qatar 7.9 0.7 Oman 11.7 0.4 Vietnam 33 0.7 Vietnam 117 1.9 Qatar 157 1.4Vietnam 1.2 0.6 Oman 6.3 0.6 Sri Lanka 9.4 0.3 Oman 20 0.4 Bangladesh 115 1.9 Kuwait 114 1.0Nepal 1.1 0.5 Myanmar 5.9 0.5 Qatar 7.5 0.2 Sri Lanka 19 0.4 Oman 58 0.9 Sri Lanka 81 0.7UAE 1.1 0.5 Brunei 5.0 0.5 Vietnam 6.5 0.2 Qatar 18 0.4 Sri Lanka 56 0.9 Oman 68 0.6Cambodia 0.8 0.4 Sri Lanka 4.9 0.5 Myanmar 5.6 0.2 Bahrain 8.4 0.2 Myanmar 37 0.6 Myanmar 43 0.4Qatar 0.5 0.3 Bahrain 3.5 0.3 Bahrain 4.5 0.1 Myanmar 7.8 0.2 Bahrain 26 0.4 Bahrain 32 0.3Bahrain 0.4 0.2 Nepal 2.6 0.2 Nepal 4.4 0.1 Nepal 6.3 0.1 Nepal 19 0.3 Nepal 25 0.2Oman 0.3 0.1 Fiji 1.2 0.1 Brunei 3.4 0.1 Brunei 5.7 0.1 Brunei 14 0.2 Cambodia 20 0.2Fiji 0.2 0.1 Vietnam 1.0 0.1 Cambodia 1.8 0.1 Cambodia 3.7 0.1 Cambodia 11 0.2 Lao PDR 16 0.1Brunei 0.2 0.1 Cambodia 0.7 0.1 Mongolia 1.6 0.1 Lao PDR 1.8 0.0 Lao PDR 7.4 0.1 Mongolia 11 0.1Lao PDR 0.1 0.1 Mongolia 0.5 0.0 Fiji 1.4 0.0 Fiji 1.7 0.0 Mongolia 7.2 0.1 Brunei 11 0.1Mongolia 0.1 0.1 Lao PDR 0.3 0.0 Lao PDR 0.9 0.0 Mongolia 1.4 0.0 Fiji 3.2 0.1 Fiji 4.7 0.0Bhutan 0.1 0.0 Bhutan 0.1 0.0 Bhutan 0.3 0.0 Bhutan 0.4 0.0 Bhutan 1.6 0.0 Bhutan 2.2 0.0(region) (region) (region) (region) (region) (region)APO20 358 171.9 APO20 1,748 160.8 APO20 4,531 144.8 APO20 7,309 149.5 APO20 11,916 195.3 APO20 13,033 116.5Asia24 454 218.0 Asia24 2,065 190.0 Asia24 4,935 157.8 Asia24 8,534 174.6 Asia24 18,069 296.2 Asia24 24,281 217.0Asia30 464 223.1 Asia30 2,322 213.6 Asia30 5,148 164.6 Asia30 8,916 182.4 Asia30 19,230 315.2 Asia30 25,667 229.4East Asia 320 153.7 East Asia 1,530 140.7 East Asia 4,047 129.4 East Asia 7,165 146.6 East Asia 13,577 222.6 East Asia 18,418 164.6South Asia 88 42.1 South Asia 241 22.2 South Asia 425 13.6 South Asia 638 13.1 South Asia 2,036 33.4 South Asia 2,858 25.5ASEAN 35 16.7 ASEAN 196 18.0 ASEAN 365 11.7 ASEAN 619 12.7 ASEAN 1,975 32.4 ASEAN 2,557 22.8ASEAN6 30 14.4 ASEAN6 188 17.3 ASEAN6 350 11.2 ASEAN6 572 11.7 ASEAN6 1,802 29.5 ASEAN6 2,269 20.3CLMV 4.8 2.3 CLMV 8.0 0.7 CLMV 15 0.5 CLMV 46 0.9 CLMV 173 2.8 CLMV 288 2.6GCC 11 5.1 GCC 257 23.6 GCC 213 6.8 GCC 382 7.8 GCC 1,161 19.0 GCC 1,387 12.4(reference) (reference) (reference) (reference) (reference) (reference)US 1,076 517.0 US 2,863 263.3 US 5,980 191.1 US 10,285 210.4 US 14,964 245.3 US 18,625 166.4EU15 1,249 600.3 EU15 3,330 306.3 EU15 6,403 204.7 EU15 9,913 202.8 EU15 14,588 239.1 EU15 17,522 156.6
EU28 11,023 225.5 EU28 16,800 275.4 EU28 20,376 182.1Australia 45 21.7 Australia 173 15.9 Australia 324 10.3 Australia 409 8.4 Australia 1,297 21.3 Australia 1,307 11.7Turkey 24 11.7 Turkey 92 8.5 Turkey 204 6.5 Turkey 273 5.6 Turkey 772 12.7 Turkey 864 7.7
(%) (%) (%) (%) (%)(%)
©20
18 A
sian
Prod
uctiv
ity O
rgan
izat
ion

146
Appendix
Table 8 GDP using PPP_GDP at constant market prices, using 2011 PPP, reference year 2016
Unit: Billions of US dollars (as of 2016). Sources: Official national accounts in each country, including author adjustments.Note: See Appendix 2 for the adjustments made to harmonize GDP coverage across countries.
1970 1980 1990 2000 2010 2016Japan 1,636 100.0 Japan 2,580 100.0 Japan 4,071 100.0 China 5,048 100.0 China 13,747 100.0 China 21,429 100.0India 736 45.0 India 989 38.3 China 1,873 46.0 Japan 4,633 91.8 India 5,918 43.0 India 8,637 40.3China 422 25.8 Saudi Arabia 786 30.5 India 1,698 41.7 India 2,890 57.2 Japan 4,938 35.9 Japan 5,243 24.5Saudi Arabia 297 18.2 China 771 29.9 Indonesia 877 21.5 Indonesia 1,325 26.3 Indonesia 2,207 16.1 Indonesia 3,034 14.2Iran 296 18.1 Indonesia 478 18.5 Saudi Arabia 739 18.2 Korea 1,052 20.8 Korea 1,622 11.8 Korea 1,935 9.0Indonesia 214 13.1 Iran 413 16.0 Korea 538 13.2 Saudi Arabia 969 19.2 Iran 1,428 10.4 Saudi Arabia 1,770 8.3Kuwait 151 9.2 UAE 211 8.2 Iran 535 13.1 Iran 791 15.7 Saudi Arabia 1,354 9.8 Iran 1,535 7.2Philippines 117 7.1 Korea 209 8.1 Thailand 402 9.9 ROC 654 13.0 ROC 984 7.2 Thailand 1,174 5.5Thailand 99 6.0 Philippines 208 8.1 ROC 342 8.4 Thailand 626 12.4 Thailand 980 7.1 ROC 1,133 5.3Pakistan 91 5.6 Thailand 189 7.3 Pakistan 308 7.6 Pakistan 519 10.3 Pakistan 788 5.7 Pakistan 1,012 4.7Korea 87 5.3 ROC 155 6.0 Philippines 254 6.2 Malaysia 385 7.6 Malaysia 640 4.7 Malaysia 863 4.0Bangladesh 86 5.3 Pakistan 146 5.7 UAE 216 5.3 Philippines 355 7.0 Philippines 566 4.1 Philippines 806 3.8ROC 58 3.5 Kuwait 122 4.7 Malaysia 189 4.7 UAE 354 7.0 UAE 526 3.8 UAE 690 3.2Malaysia 47 2.9 Malaysia 104 4.0 Hong Kong 166 4.1 Hong Kong 245 4.8 Vietnam 424 3.1 Vietnam 604 2.8Vietnam 43 2.7 Bangladesh 94 3.6 Bangladesh 140 3.5 Bangladesh 233 4.6 Bangladesh 401 2.9 Bangladesh 583 2.7Hong Kong 37 2.2 Hong Kong 87 3.4 Singapore 113 2.8 Singapore 225 4.4 Singapore 395 2.9 Singapore 500 2.3Myanmar 35 2.1 Vietnam 57 2.2 Vietnam 96 2.4 Vietnam 209 4.1 Hong Kong 364 2.7 Hong Kong 431 2.0Sri Lanka 29 1.8 Singapore 54 2.1 Kuwait 93 2.3 Kuwait 164 3.2 Kuwait 249 1.8 Qatar 334 1.6Singapore 23 1.4 Myanmar 53 2.0 Oman 67 1.6 Sri Lanka 111 2.2 Qatar 245 1.8 Kuwait 307 1.4Qatar 19 1.1 Sri Lanka 44 1.7 Sri Lanka 66 1.6 Oman 107 2.1 Myanmar 194 1.4 Sri Lanka 260 1.2Nepal 13 0.8 Qatar 32 1.3 Myanmar 60 1.5 Myanmar 103 2.0 Sri Lanka 184 1.3 Myanmar 251 1.2Brunei 13 0.8 Brunei 30 1.2 Qatar 38 0.9 Qatar 72 1.4 Oman 145 1.1 Oman 192 0.9UAE 11 0.7 Oman 30 1.2 Nepal 27 0.7 Nepal 45 0.9 Nepal 65 0.5 Nepal 84 0.4Oman 11 0.7 Nepal 18 0.7 Brunei 23 0.6 Bahrain 31 0.6 Bahrain 54 0.4 Bahrain 67 0.3Bahrain 8.0 0.5 Bahrain 16 0.6 Bahrain 19 0.5 Brunei 29 0.6 Cambodia 40 0.3 Cambodia 61 0.3Mongolia 3.6 0.2 Mongolia 6.5 0.3 Mongolia 11 0.3 Cambodia 19 0.4 Brunei 33 0.2 Lao PDR 45 0.2Lao PDR 3.1 0.2 Lao PDR 4.3 0.2 Cambodia 9.3 0.2 Lao PDR 14 0.3 Lao PDR 29 0.2 Mongolia 37 0.2Fiji 2.4 0.1 Fiji 3.8 0.1 Lao PDR 7.8 0.2 Mongolia 12 0.2 Mongolia 23 0.2 Brunei 32 0.1Bhutan 0.4 0.0 Bhutan 0.5 0.0 Fiji 4.7 0.1 Fiji 6.0 0.1 Fiji 6.9 0.0 Fiji 8.3 0.0
Bhutan 1.4 0.0 Bhutan 2.2 0.0 Bhutan 5.0 0.0 Bhutan 7.2 0.0(region) (region) (region) (region) (region) (region)APO20 3,625 221.5 APO20 5,844 226.5 APO20 9,856 242.1 APO20 14,348 284.2 APO20 22,002 160.0 APO20 26,753 124.8Asia24 4,095 250.2 Asia24 6,699 259.7 Asia24 11,813 290.1 Asia24 19,530 386.9 Asia24 35,981 261.7 Asia24 47,122 219.9Asia30 4,588 280.4 Asia30 7,898 306.1 Asia30 12,985 318.9 Asia30 21,227 420.5 Asia30 38,555 280.5 Asia30 50,405 235.2East Asia 2,243 137.0 East Asia 3,808 147.6 East Asia 7,001 172.0 East Asia 11,645 230.7 East Asia 21,678 157.7 East Asia 28,734 134.1South Asia 956 58.4 South Asia 1,292 50.1 South Asia 2,242 55.1 South Asia 3,800 75.3 South Asia 7,361 53.5 South Asia 9,924 46.3ASEAN 596 36.4 ASEAN 1,182 45.8 ASEAN 2,030 49.9 ASEAN 3,289 65.1 ASEAN 5,508 40.1 ASEAN 7,041 32.9ASEAN6 511 31.3 ASEAN6 1,063 41.2 ASEAN6 1,857 45.6 ASEAN6 2,945 58.3 ASEAN6 4,820 35.1 ASEAN6 6,128 28.6CLMV 86 5.2 CLMV 120 4.6 CLMV 173 4.2 CLMV 344 6.8 CLMV 687 5.0 CLMV 913 4.3GCC 494 30.2 GCC 1,198 46.5 GCC 1,172 28.8 GCC 1,697 33.6 GCC 2,574 18.7 GCC 3,283 15.3(reference) (reference) (reference) (reference) (reference) (reference)US 5,261 321.5 US 7,187 278.6 US 9,977 245.1 US 13,993 277.2 US 16,471 119.8 US 18,352 85.6EU15 6,507 397.6 EU15 8,905 345.2 EU15 11,377 279.4 EU15 14,241 282.1 EU15 16,101 117.1 EU15 16,880 78.8
EU28 16,184 320.6 EU28 18,561 135.0 EU28 19,620 91.6Australia 298 18.2 Australia 398 15.4 Australia 535 13.1 Australia 759 15.0 Australia 1,028 7.5 Australia 1,184 5.5Turkey 267 16.3 Turkey 397 15.4 Turkey 661 16.2 Turkey 945 18.7 Turkey 1,401 10.2 Turkey 1,974 9.2
(%) (%) (%) (%) (%)(%)
©20
18 A
sian
Prod
uctiv
ity O
rgan
izat
ion

147
A.9 Supplementary Tables
App.
Table 9 GDP Growth_Average annual growth rate of GDP at constant market prices
1990–1995 1995–2000 2000–2005 2005–2010 2010–2016 1990–2016China 11.6 Qatar 10.6 China 9.3 Qatar 16.6 Mongolia 8.4 China 9.4Malaysia 9.3 China 8.3 Cambodia 8.8 China 10.7 Lao PDR 7.5 Qatar 8.4Kuwait 9.2 Vietnam 7.3 Vietnam 8.0 Bhutan 9.1 China 7.4 Cambodia 7.2Singapore 8.3 Cambodia 7.2 Qatar 8.0 Lao PDR 7.8 Cambodia 6.9 Vietnam 7.1Vietnam 8.1 UAE 6.3 Bhutan 7.5 India 7.8 India 6.3 Lao PDR 6.8Thailand 8.1 Lao PDR 6.0 Kuwait 7.2 Cambodia 6.5 Bangladesh 6.3 Bhutan 6.3Korea 8.1 Myanmar 6.0 Iran 6.8 Singapore 6.5 Philippines 5.9 India 6.3Indonesia 7.5 ROC 5.8 India 6.5 Mongolia 6.4 Vietnam 5.9 Malaysia 5.8ROC 7.2 Bhutan 5.7 Myanmar 6.4 Myanmar 6.3 Bhutan 5.9 Singapore 5.7Cambodia 6.6 India 5.7 Lao PDR 6.4 Sri Lanka 6.2 Sri Lanka 5.7 Myanmar 5.5Lao PDR 6.0 Singapore 5.5 Mongolia 6.3 Vietnam 6.2 Indonesia 5.3 Bangladesh 5.5Pakistan 6.0 Korea 5.3 Bahrain 5.9 Bangladesh 5.9 Qatar 5.2 Sri Lanka 5.2Oman 5.7 Bangladesh 5.1 UAE 5.4 Indonesia 5.6 Malaysia 5.0 Korea 4.9Sri Lanka 5.3 Malaysia 4.9 Thailand 5.3 Bahrain 5.4 Oman 4.6 Bahrain 4.8Bahrain 5.3 Sri Lanka 4.9 Malaysia 5.2 Oman 5.2 UAE 4.5 Indonesia 4.8Hong Kong 5.2 Nepal 4.8 Pakistan 5.0 Malaysia 5.0 Saudi Arabia 4.5 Mongolia 4.7Bangladesh 5.0 Pakistan 4.5 Bangladesh 5.0 Iran 5.0 Nepal 4.3 ROC 4.6India 5.0 Bahrain 4.2 Singapore 4.8 Philippines 4.8 Myanmar 4.3 Kuwait 4.6Myanmar 4.9 Iran 4.1 Korea 4.6 Nepal 4.4 Pakistan 4.2 Pakistan 4.6Nepal 4.9 Philippines 3.9 Indonesia 4.6 ROC 4.2 Singapore 3.9 UAE 4.5Iran 3.7 Oman 3.7 Philippines 4.5 Korea 4.0 Bahrain 3.5 Philippines 4.4UAE 3.6 Mongolia 3.6 Hong Kong 4.1 Hong Kong 3.8 Kuwait 3.5 Nepal 4.3Bhutan 3.4 Hong Kong 2.6 Saudi Arabia 4.0 Thailand 3.7 Fiji 3.1 Thailand 4.1Brunei 3.1 Saudi Arabia 2.6 Sri Lanka 4.0 Pakistan 3.3 Thailand 3.0 Oman 4.1Philippines 2.8 Kuwait 2.1 ROC 4.0 Saudi Arabia 2.7 Korea 2.9 Iran 4.1Saudi Arabia 2.8 Fiji 2.0 Nepal 3.1 UAE 2.5 Hong Kong 2.8 Hong Kong 3.7Fiji 2.7 Brunei 1.3 Brunei 2.1 Kuwait 1.2 ROC 2.4 Saudi Arabia 3.4Qatar 2.3 Japan 1.1 Fiji 2.0 Fiji 0.7 Iran 1.2 Fiji 2.1Japan 1.5 Thailand 0.7 Japan 1.2 Brunei 0.7 Japan 1.0 Brunei 1.3Mongolia −1.8 Indonesia 0.7 Oman 1.0 Japan 0.1 Brunei −0.5 Japan 1.0(region) (region) (region) (region) (region) (region)APO20 4.4 APO20 3.1 APO20 4.2 APO20 4.3 APO20 4.0 APO20 4.0Asia24 5.7 Asia24 4.4 Asia24 5.7 Asia24 6.6 Asia24 5.4 Asia24 5.5Asia30 5.5 Asia30 4.3 Asia30 5.6 Asia30 6.3 Asia30 5.3 Asia30 5.4East Asia 5.6 East Asia 4.6 East Asia 5.6 East Asia 6.8 East Asia 5.5 East Asia 5.6South Asia 5.1 South Asia 5.4 South Asia 6.1 South Asia 7.1 South Asia 6.1 South Asia 6.0ASEAN 7.2 ASEAN 2.4 ASEAN 5.1 ASEAN 5.2 ASEAN 4.9 ASEAN 5.0ASEAN6 7.3 ASEAN6 1.9 ASEAN6 4.8 ASEAN6 5.0 ASEAN6 4.7 ASEAN6 4.8CLMV 6.9 CLMV 6.9 CLMV 7.5 CLMV 6.3 CLMV 5.6 CLMV 6.6GCC 3.8 GCC 3.6 GCC 4.6 GCC 3.7 GCC 4.4 GCC 4.1(reference) (reference) (reference) (reference) (reference) (reference)US 2.6 US 4.2 US 2.5 US 0.8 US 2.0 US 2.4EU15 1.6 EU15 2.9 EU15 1.7 EU15 0.7 EU15 1.1 EU15 1.6
EU28 2.9 EU28 1.9 EU28 0.9 EU28 1.2 EU28 1.7Australia 3.2 Australia 3.8 Australia 3.3 Australia 2.7 Australia 2.7 Australia 3.1Turkey 3.2 Turkey 4.0 Turkey 4.7 Turkey 3.2 Turkey 6.2 Turkey 4.3
Unit: Percentage. Sources: Official national accounts in each country, including author adjustments.Note: See Appendix 2 for the adjustments made to harmonize GDP coverage across countries.
©20
18 A
sian
Prod
uctiv
ity O
rgan
izat
ion
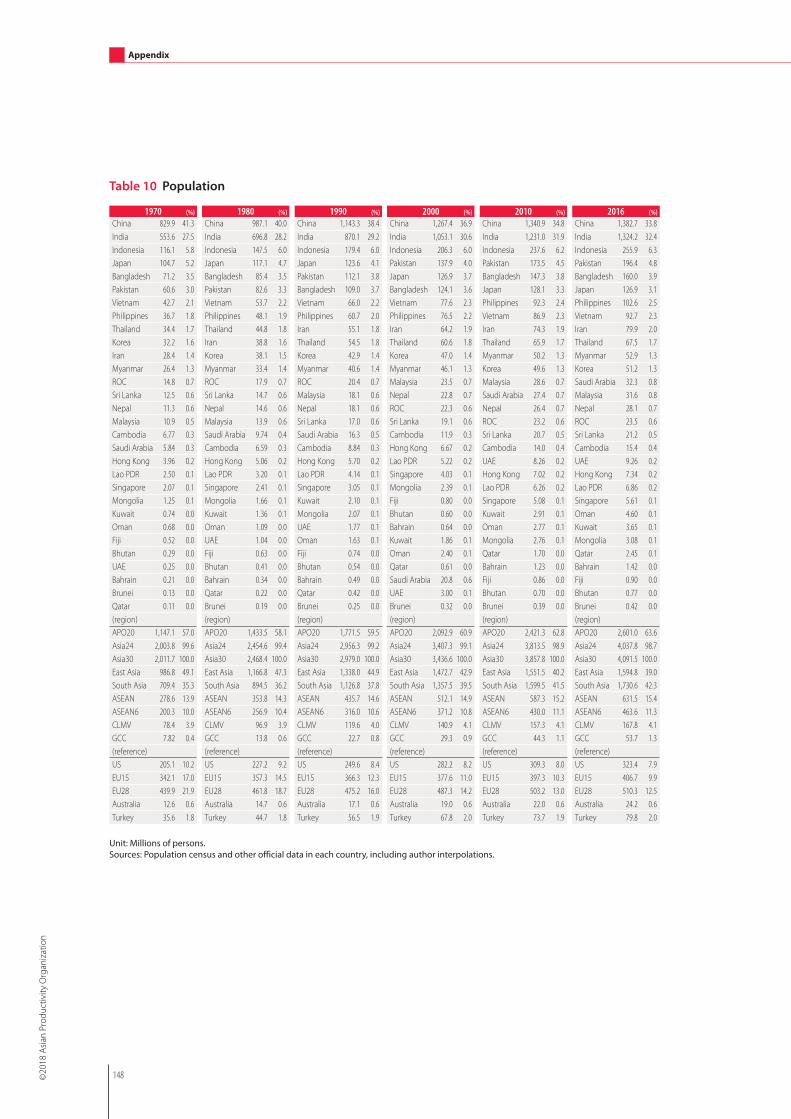
148
Appendix
Table 10 Population
Unit: Millions of persons.Sources: Population census and other official data in each country, including author interpolations.
1970 1980 1990 2000 2010 2016China 829.9 41.3 China 987.1 40.0 China 1,143.3 38.4 China 1,267.4 36.9 China 1,340.9 34.8 China 1,382.7 33.8India 553.6 27.5 India 696.8 28.2 India 870.1 29.2 India 1,053.1 30.6 India 1,231.0 31.9 India 1,324.2 32.4Indonesia 116.1 5.8 Indonesia 147.5 6.0 Indonesia 179.4 6.0 Indonesia 206.3 6.0 Indonesia 237.6 6.2 Indonesia 255.9 6.3Japan 104.7 5.2 Japan 117.1 4.7 Japan 123.6 4.1 Pakistan 137.9 4.0 Pakistan 173.5 4.5 Pakistan 196.4 4.8Bangladesh 71.2 3.5 Bangladesh 85.4 3.5 Pakistan 112.1 3.8 Japan 126.9 3.7 Bangladesh 147.3 3.8 Bangladesh 160.0 3.9Pakistan 60.6 3.0 Pakistan 82.6 3.3 Bangladesh 109.0 3.7 Bangladesh 124.1 3.6 Japan 128.1 3.3 Japan 126.9 3.1Vietnam 42.7 2.1 Vietnam 53.7 2.2 Vietnam 66.0 2.2 Vietnam 77.6 2.3 Philippines 92.3 2.4 Philippines 102.6 2.5Philippines 36.7 1.8 Philippines 48.1 1.9 Philippines 60.7 2.0 Philippines 76.5 2.2 Vietnam 86.9 2.3 Vietnam 92.7 2.3Thailand 34.4 1.7 Thailand 44.8 1.8 Iran 55.1 1.8 Iran 64.2 1.9 Iran 74.3 1.9 Iran 79.9 2.0Korea 32.2 1.6 Iran 38.8 1.6 Thailand 54.5 1.8 Thailand 60.6 1.8 Thailand 65.9 1.7 Thailand 67.5 1.7Iran 28.4 1.4 Korea 38.1 1.5 Korea 42.9 1.4 Korea 47.0 1.4 Myanmar 50.2 1.3 Myanmar 52.9 1.3Myanmar 26.4 1.3 Myanmar 33.4 1.4 Myanmar 40.6 1.4 Myanmar 46.1 1.3 Korea 49.6 1.3 Korea 51.2 1.3ROC 14.8 0.7 ROC 17.9 0.7 ROC 20.4 0.7 Malaysia 23.5 0.7 Malaysia 28.6 0.7 Saudi Arabia 32.3 0.8Sri Lanka 12.5 0.6 Sri Lanka 14.7 0.6 Malaysia 18.1 0.6 Nepal 22.8 0.7 Saudi Arabia 27.4 0.7 Malaysia 31.6 0.8Nepal 11.3 0.6 Nepal 14.6 0.6 Nepal 18.1 0.6 ROC 22.3 0.6 Nepal 26.4 0.7 Nepal 28.1 0.7Malaysia 10.9 0.5 Malaysia 13.9 0.6 Sri Lanka 17.0 0.6 Sri Lanka 19.1 0.6 ROC 23.2 0.6 ROC 23.5 0.6Cambodia 6.77 0.3 Saudi Arabia 9.74 0.4 Saudi Arabia 16.3 0.5 Cambodia 11.9 0.3 Sri Lanka 20.7 0.5 Sri Lanka 21.2 0.5Saudi Arabia 5.84 0.3 Cambodia 6.59 0.3 Cambodia 8.84 0.3 Hong Kong 6.67 0.2 Cambodia 14.0 0.4 Cambodia 15.4 0.4Hong Kong 3.96 0.2 Hong Kong 5.06 0.2 Hong Kong 5.70 0.2 Lao PDR 5.22 0.2 UAE 8.26 0.2 UAE 9.26 0.2Lao PDR 2.50 0.1 Lao PDR 3.20 0.1 Lao PDR 4.14 0.1 Singapore 4.03 0.1 Hong Kong 7.02 0.2 Hong Kong 7.34 0.2Singapore 2.07 0.1 Singapore 2.41 0.1 Singapore 3.05 0.1 Mongolia 2.39 0.1 Lao PDR 6.26 0.2 Lao PDR 6.86 0.2Mongolia 1.25 0.1 Mongolia 1.66 0.1 Kuwait 2.10 0.1 Fiji 0.80 0.0 Singapore 5.08 0.1 Singapore 5.61 0.1Kuwait 0.74 0.0 Kuwait 1.36 0.1 Mongolia 2.07 0.1 Bhutan 0.60 0.0 Kuwait 2.91 0.1 Oman 4.60 0.1Oman 0.68 0.0 Oman 1.09 0.0 UAE 1.77 0.1 Bahrain 0.64 0.0 Oman 2.77 0.1 Kuwait 3.65 0.1Fiji 0.52 0.0 UAE 1.04 0.0 Oman 1.63 0.1 Kuwait 1.86 0.1 Mongolia 2.76 0.1 Mongolia 3.08 0.1Bhutan 0.29 0.0 Fiji 0.63 0.0 Fiji 0.74 0.0 Oman 2.40 0.1 Qatar 1.70 0.0 Qatar 2.45 0.1UAE 0.25 0.0 Bhutan 0.41 0.0 Bhutan 0.54 0.0 Qatar 0.61 0.0 Bahrain 1.23 0.0 Bahrain 1.42 0.0Bahrain 0.21 0.0 Bahrain 0.34 0.0 Bahrain 0.49 0.0 Saudi Arabia 20.8 0.6 Fiji 0.86 0.0 Fiji 0.90 0.0Brunei 0.13 0.0 Qatar 0.22 0.0 Qatar 0.42 0.0 UAE 3.00 0.1 Bhutan 0.70 0.0 Bhutan 0.77 0.0Qatar 0.11 0.0 Brunei 0.19 0.0 Brunei 0.25 0.0 Brunei 0.32 0.0 Brunei 0.39 0.0 Brunei 0.42 0.0(region) (region) (region) (region) (region) (region)APO20 1,147.1 57.0 APO20 1,433.5 58.1 APO20 1,771.5 59.5 APO20 2,092.9 60.9 APO20 2,421.3 62.8 APO20 2,601.0 63.6Asia24 2,003.8 99.6 Asia24 2,454.6 99.4 Asia24 2,956.3 99.2 Asia24 3,407.3 99.1 Asia24 3,813.5 98.9 Asia24 4,037.8 98.7Asia30 2,011.7 100.0 Asia30 2,468.4 100.0 Asia30 2,979.0 100.0 Asia30 3,436.6 100.0 Asia30 3,857.8 100.0 Asia30 4,091.5 100.0East Asia 986.8 49.1 East Asia 1,166.8 47.3 East Asia 1,338.0 44.9 East Asia 1,472.7 42.9 East Asia 1,551.5 40.2 East Asia 1,594.8 39.0South Asia 709.4 35.3 South Asia 894.5 36.2 South Asia 1,126.8 37.8 South Asia 1,357.5 39.5 South Asia 1,599.5 41.5 South Asia 1,730.6 42.3ASEAN 278.6 13.9 ASEAN 353.8 14.3 ASEAN 435.7 14.6 ASEAN 512.1 14.9 ASEAN 587.3 15.2 ASEAN 631.5 15.4ASEAN6 200.3 10.0 ASEAN6 256.9 10.4 ASEAN6 316.0 10.6 ASEAN6 371.2 10.8 ASEAN6 430.0 11.1 ASEAN6 463.6 11.3CLMV 78.4 3.9 CLMV 96.9 3.9 CLMV 119.6 4.0 CLMV 140.9 4.1 CLMV 157.3 4.1 CLMV 167.8 4.1GCC 7.82 0.4 GCC 13.8 0.6 GCC 22.7 0.8 GCC 29.3 0.9 GCC 44.3 1.1 GCC 53.7 1.3(reference) (reference) (reference) (reference) (reference) (reference)US 205.1 10.2 US 227.2 9.2 US 249.6 8.4 US 282.2 8.2 US 309.3 8.0 US 323.4 7.9EU15 342.1 17.0 EU15 357.3 14.5 EU15 366.3 12.3 EU15 377.6 11.0 EU15 397.3 10.3 EU15 406.7 9.9EU28 439.9 21.9 EU28 461.8 18.7 EU28 475.2 16.0 EU28 487.3 14.2 EU28 503.2 13.0 EU28 510.3 12.5Australia 12.6 0.6 Australia 14.7 0.6 Australia 17.1 0.6 Australia 19.0 0.6 Australia 22.0 0.6 Australia 24.2 0.6Turkey 35.6 1.8 Turkey 44.7 1.8 Turkey 56.5 1.9 Turkey 67.8 2.0 Turkey 73.7 1.9 Turkey 79.8 2.0
(%) (%) (%) (%) (%)(%)
©20
18 A
sian
Prod
uctiv
ity O
rgan
izat
ion

149
A.9 Supplementary Tables
App.
Table 11 Per Capita GDP using Exchange Rate_GDP at current market prices per person, using annual average exchange rate
Unit: Thousands of US dollars.Sources: Official national accounts in each country, including author adjustments.Note: See Appendix 2 for the adjustments made to harmonize GDP coverage across countries.
1970 1980 1990 2000 2010 2016Japan 1.99 100.0 Japan 9.29 100.0 Japan 25.3 100.0 Japan 38.5 100.0 Singapore 46.6 100.0 Singapore 55.2 100.0Hong Kong 0.96 48.4 Hong Kong 5.70 61.4 Hong Kong 13.5 53.3 Hong Kong 25.8 66.9 Japan 44.5 95.6 Hong Kong 43.7 79.2Singapore 0.93 46.5 Singapore 5.00 53.9 Singapore 12.8 50.4 Singapore 23.8 61.8 Hong Kong 32.6 69.9 Japan 39.0 70.6Fiji 0.43 21.5 Iran 2.51 27.0 ROC 8.17 32.3 ROC 14.9 38.6 Korea 22.1 47.4 Korea 27.6 50.0Iran 0.40 19.9 ROC 2.37 25.5 Korea 6.52 25.7 Korea 11.9 31.0 ROC 19.3 41.4 ROC 22.5 40.8ROC 0.39 19.7 Fiji 1.92 20.7 Malaysia 2.50 9.9 Malaysia 4.04 10.5 Malaysia 8.92 19.2 Malaysia 9.37 17.0Malaysia 0.36 17.9 Malaysia 1.78 19.1 Fiji 1.86 7.3 Fiji 2.11 5.5 Iran 6.42 13.8 China 8.09 14.7Korea 0.28 14.0 Korea 1.70 18.4 Iran 1.72 6.8 Thailand 2.09 5.4 Thailand 5.18 11.1 Thailand 6.13 11.1Bhutan 0.23 11.5 Thailand 0.74 8.0 Thailand 1.63 6.4 Iran 1.72 4.5 China 4.55 9.8 Iran 5.54 10.0Sri Lanka 0.23 11.4 Philippines 0.69 7.4 Philippines 0.77 3.0 Philippines 1.06 2.8 Fiji 3.68 7.9 Fiji 5.25 9.5Thailand 0.21 10.7 Indonesia 0.54 5.8 Mongolia 0.77 3.0 Sri Lanka 1.01 2.6 Indonesia 3.18 6.8 Sri Lanka 3.83 6.9Philippines 0.18 9.3 Bhutan 0.34 3.6 Indonesia 0.71 2.8 China 0.96 2.5 Sri Lanka 2.72 5.8 Mongolia 3.68 6.7Pakistan 0.17 8.4 Sri Lanka 0.33 3.6 Bhutan 0.58 2.3 Indonesia 0.82 2.1 Mongolia 2.61 5.6 Indonesia 3.65 6.6Bangladesh 0.14 7.0 China 0.31 3.3 Sri Lanka 0.55 2.2 Bhutan 0.74 1.9 Bhutan 2.28 4.9 Philippines 2.97 5.4Cambodia 0.12 6.0 Pakistan 0.29 3.1 Pakistan 0.41 1.6 Mongolia 0.60 1.6 Philippines 2.16 4.6 Bhutan 2.90 5.3India 0.11 5.8 Mongolia 0.29 3.1 India 0.39 1.5 Pakistan 0.57 1.5 India 1.36 2.9 Lao PDR 2.35 4.2China 0.11 5.6 India 0.27 2.9 China 0.35 1.4 India 0.46 1.2 Vietnam 1.35 2.9 Vietnam 2.24 4.1Myanmar 0.10 5.1 Bangladesh 0.22 2.4 Bangladesh 0.29 1.1 Vietnam 0.42 1.1 Lao PDR 1.19 2.6 India 1.70 3.1Nepal 0.10 5.0 Myanmar 0.18 1.9 Nepal 0.25 1.0 Bangladesh 0.42 1.1 Pakistan 1.01 2.2 Pakistan 1.41 2.6Mongolia 0.09 4.7 Nepal 0.18 1.9 Lao PDR 0.22 0.9 Lao PDR 0.35 0.9 Cambodia 0.81 1.7 Bangladesh 1.38 2.5Indonesia 0.09 4.3 Cambodia 0.11 1.2 Cambodia 0.20 0.8 Cambodia 0.31 0.8 Bangladesh 0.78 1.7 Cambodia 1.32 2.4Lao PDR 0.05 2.4 Lao PDR 0.10 1.1 Myanmar 0.14 0.5 Nepal 0.28 0.7 Myanmar 0.75 1.6 Nepal 0.88 1.6Vietnam 0.03 1.4 Vietnam 0.02 0.2 Vietnam 0.10 0.4 Myanmar 0.17 0.4 Nepal 0.72 1.5 Myanmar 0.82 1.5
Bahrain 1.88 94.7 Bahrain 10.3 110.9 Bahrain 9.25 36.5 Bahrain 13.2 34.2 Bahrain 20.8 44.7 Bahrain 22.6 40.9Kuwait 4.00 201.2 Kuwait 21.8 234.9 Kuwait 9.10 35.9 Kuwait 20.6 53.5 Kuwait 40.7 87.4 Kuwait 31.3 56.7Oman 0.40 19.9 Oman 5.79 62.4 Oman 7.21 28.5 Oman 8.22 21.3 Oman 20.9 44.8 Oman 14.9 26.9Qatar 4.97 250.0 Qatar 35.4 381.4 Qatar 17.8 70.4 Qatar 29.5 76.7 Qatar 75.2 161.6 Qatar 64.1 116.0Saudi Arabia 0.92 46.4 Saudi Arabia 17.0 182.7 Saudi Arabia 7.26 28.7 Saudi Arabia 9.21 23.9 Saudi Arabia 19.4 41.7 Saudi Arabia 20.2 36.6UAE 4.28 215.4 UAE 42.3 455.3 UAE 28.9 114.4 UAE 35.3 91.8 UAE 36.0 77.4 UAE 39.0 70.7Brunei 1.42 71.6 Brunei 26.7 287.2 Brunei 13.3 52.5 Brunei 17.6 45.8 Brunei 35.5 76.1 Brunei 25.3 45.8(region) (region) (region) (region) (region) (region)APO20 0.31 15.7 APO20 1.22 13.1 APO20 2.56 10.1 APO20 3.49 9.1 APO20 4.92 10.6 APO20 5.01 9.1Asia24 0.23 11.4 Asia24 0.84 9.1 Asia24 1.67 6.6 Asia24 2.50 6.5 Asia24 4.74 10.2 Asia24 6.01 10.9Asia30 0.23 11.6 Asia30 0.94 10.1 Asia30 1.73 6.8 Asia30 2.59 6.7 Asia30 4.98 10.7 Asia30 6.27 11.4East Asia 0.32 16.3 East Asia 1.31 14.1 East Asia 3.02 12.0 East Asia 4.87 12.6 East Asia 8.75 18.8 East Asia 11.5 20.9South Asia 0.12 6.2 South Asia 0.27 2.9 South Asia 0.38 1.5 South Asia 0.47 1.2 South Asia 1.27 2.7 South Asia 1.65 3.0ASEAN 0.12 6.3 ASEAN 0.55 6.0 ASEAN 0.84 3.3 ASEAN 1.21 3.1 ASEAN 3.36 7.2 ASEAN 4.05 7.3ASEAN6 0.15 7.5 ASEAN6 0.73 7.9 ASEAN6 1.11 4.4 ASEAN6 1.54 4.0 ASEAN6 4.19 9.0 ASEAN6 4.89 8.9CLMV 0.06 3.1 CLMV 0.08 0.9 CLMV 0.12 0.5 CLMV 0.33 0.9 CLMV 1.10 2.4 CLMV 1.71 3.1GCC 1.36 68.2 GCC 18.6 200.4 GCC 9.35 37.0 GCC 13.0 33.9 GCC 26.2 56.2 GCC 25.8 46.8(reference) (reference) (reference) (reference) (reference) (reference)US 5.25 263.9 US 12.6 135.7 US 24.0 94.7 US 36.4 94.7 US 48.4 103.9 US 57.6 104.3EU15 3.65 183.7 EU15 9.32 100.3 EU15 17.5 69.1 EU15 26.3 68.2 EU15 36.7 78.8 EU15 43.1 78.0
EU28 22.6 58.7 EU28 33.4 71.7 EU28 39.9 72.3Australia 3.57 179.8 Australia 11.8 127.0 Australia 19.0 74.9 Australia 21.5 55.8 Australia 58.9 126.4 Australia 54.0 97.7Turkey 0.68 34.4 Turkey 2.07 22.2 Turkey 3.61 14.3 Turkey 4.03 10.5 Turkey 10.5 22.5 Turkey 10.8 19.6
(%) (%) (%) (%) (%)(%)
©20
18 A
sian
Prod
uctiv
ity O
rgan
izat
ion

150
Appendix
Table 12 Per Capita GDP_GDP at constant market prices per person, using 2011 PPP, reference year 2016
Unit: Thousands of US dollars (as of 2016).Sources: Official national accounts in each country, including author adjustments.Note: See Appendix 2 for the adjustments made to harmonize GDP coverage across countries.
1970 1980 1990 2000 2010 2016Japan 15.6 100.0 Singapore 22.2 100.0 Singapore 37.0 100.0 Singapore 55.8 100.0 Singapore 77.8 100.0 Singapore 89.1 100.0Singapore 10.9 69.5 Japan 22.0 99.2 Japan 32.9 88.9 Hong Kong 36.7 65.8 Hong Kong 51.9 66.7 Hong Kong 58.7 65.9Iran 10.4 66.6 Hong Kong 17.1 76.9 Hong Kong 29.1 78.5 Japan 36.5 65.5 ROC 42.5 54.6 ROC 48.1 54.0Hong Kong 9.24 59.1 Iran 10.6 47.8 ROC 16.8 45.3 ROC 29.4 52.7 Japan 38.6 49.6 Japan 41.3 46.4Fiji 4.57 29.2 ROC 8.70 39.1 Korea 12.5 33.9 Korea 22.4 40.1 Korea 32.7 42.1 Korea 37.8 42.4Malaysia 4.30 27.5 Malaysia 7.49 33.7 Malaysia 10.5 28.2 Malaysia 16.4 29.4 Malaysia 22.4 28.8 Malaysia 27.3 30.6ROC 3.90 24.9 Fiji 5.98 26.9 Iran 9.71 26.2 Iran 12.3 22.1 Iran 19.2 24.7 Iran 19.2 21.6Philippines 3.18 20.3 Korea 5.48 24.7 Thailand 7.37 19.9 Thailand 10.3 18.5 Thailand 14.9 19.1 Thailand 17.4 19.5Mongolia 2.87 18.4 Philippines 4.33 19.5 Fiji 6.43 17.3 Fiji 7.47 13.4 China 10.3 13.2 China 15.5 17.4Thailand 2.87 18.4 Thailand 4.21 18.9 Mongolia 5.28 14.3 Indonesia 6.43 11.5 Indonesia 9.29 11.9 Sri Lanka 12.3 13.8Korea 2.69 17.2 Mongolia 3.92 17.6 Indonesia 4.89 13.2 Sri Lanka 5.81 10.4 Sri Lanka 8.92 11.5 Mongolia 12.1 13.6Sri Lanka 2.32 14.8 Indonesia 3.24 14.6 Philippines 4.18 11.3 Mongolia 5.01 9.0 Mongolia 8.18 10.5 Indonesia 11.9 13.3Indonesia 1.84 11.8 Sri Lanka 2.97 13.4 Sri Lanka 3.91 10.5 Philippines 4.64 8.3 Fiji 7.98 10.3 Bhutan 9.31 10.4Pakistan 1.51 9.7 Pakistan 1.77 8.0 Pakistan 2.75 7.4 China 3.98 7.1 Bhutan 7.23 9.3 Fiji 9.20 10.3India 1.33 8.5 Myanmar 1.58 7.1 Bhutan 2.59 7.0 Pakistan 3.76 6.8 Philippines 6.13 7.9 Philippines 7.86 8.8Myanmar 1.33 8.5 India 1.42 6.4 India 1.95 5.3 Bhutan 3.68 6.6 Vietnam 4.88 6.3 Lao PDR 6.58 7.4Bhutan 1.24 7.9 Lao PDR 1.36 6.1 Lao PDR 1.88 5.1 India 2.74 4.9 India 4.81 6.2 India 6.52 7.3Lao PDR 1.22 7.8 Bhutan 1.31 5.9 China 1.64 4.4 Lao PDR 2.72 4.9 Lao PDR 4.61 5.9 Vietnam 6.51 7.3Bangladesh 1.21 7.8 Nepal 1.20 5.4 Nepal 1.52 4.1 Vietnam 2.69 4.8 Pakistan 4.54 5.8 Pakistan 5.15 5.8Nepal 1.15 7.4 Bangladesh 1.10 5.0 Myanmar 1.47 4.0 Myanmar 2.23 4.0 Myanmar 3.87 5.0 Myanmar 4.75 5.3Vietnam 1.02 6.5 Vietnam 1.05 4.7 Vietnam 1.46 3.9 Nepal 1.96 3.5 Cambodia 2.87 3.7 Cambodia 3.94 4.4China 0.51 3.3 China 0.78 3.5 Bangladesh 1.29 3.5 Bangladesh 1.88 3.4 Bangladesh 2.72 3.5 Bangladesh 3.65 4.1
Cambodia 1.05 2.8 Cambodia 1.56 2.8 Nepal 2.46 3.2 Nepal 2.99 3.4
Bahrain 38.2 244.6 Bahrain 48.6 218.6 Bahrain 38.8 104.8 Bahrain 48.3 86.5 Bahrain 44.0 56.6 Bahrain 47.1 52.9Kuwait 204.7 1,309.1 Kuwait 90.0 405.0 Kuwait 44.4 120.0 Kuwait 88.0 157.8 Kuwait 85.5 109.9 Kuwait 84.0 94.3Oman 15.7 100.5 Oman 27.5 123.8 Oman 41.1 110.9 Oman 44.6 79.9 Oman 52.4 67.4 Oman 41.7 46.8Qatar 170.3 1,089.2 Qatar 144.7 651.0 Qatar 89.2 240.8 Qatar 117.0 209.8 Qatar 144.4 185.6 Qatar 136.3 153.0Saudi Arabia 50.9 325.7 Saudi Arabia 80.7 362.9 Saudi Arabia 45.3 122.3 Saudi Arabia 46.7 83.7 Saudi Arabia 49.4 63.5 Saudi Arabia 54.9 61.6UAE 44.2 282.7 UAE 202.6 911.4 UAE 121.8 328.8 UAE 118.3 212.2 UAE 63.7 81.9 UAE 74.5 83.6Brunei 96.0 614.1 Brunei 161.0 724.3 Brunei 90.7 244.9 Brunei 88.1 157.9 Brunei 84.7 108.9 Brunei 75.3 84.5(region) (region) (region) (region) (region) (region)APO20 3.16 20.2 APO20 4.08 18.3 APO20 5.56 15.0 APO20 6.86 12.3 APO20 9.09 11.7 APO20 10.8 12.1Asia24 2.04 13.1 Asia24 2.73 12.3 Asia24 4.00 10.8 Asia24 5.73 10.3 Asia24 9.44 12.1 Asia24 12.3 13.8Asia30 2.28 14.6 Asia30 3.20 14.4 Asia30 4.36 11.8 Asia30 6.18 11.1 Asia30 9.99 12.9 Asia30 13.0 14.6East Asia 2.27 14.5 East Asia 3.26 14.7 East Asia 5.23 14.1 East Asia 7.91 14.2 East Asia 13.97 18.0 East Asia 18.9 21.3South Asia 1.35 8.6 South Asia 1.44 6.5 South Asia 1.99 5.4 South Asia 2.80 5.0 South Asia 4.60 5.9 South Asia 6.12 6.9ASEAN 2.14 13.7 ASEAN 3.34 15.0 ASEAN 4.66 12.6 ASEAN 6.42 11.5 ASEAN 9.38 12.1 ASEAN 11.7 13.1ASEAN6 2.55 16.3 ASEAN6 4.14 18.6 ASEAN6 5.88 15.9 ASEAN6 7.93 14.2 ASEAN6 11.21 14.4 ASEAN6 13.8 15.5CLMV 1.09 7.0 CLMV 1.23 5.6 CLMV 1.45 3.9 CLMV 2.44 4.4 CLMV 4.37 5.6 CLMV 5.72 6.4GCC 63.2 403.9 GCC 86.9 390.9 GCC 51.5 139.2 GCC 58.0 103.9 GCC 58.1 74.7 GCC 62.6 70.3(reference) (reference) (reference) (reference) (reference) (reference)US 25.7 164.1 US 31.6 142.3 US 40.0 107.9 US 49.6 88.9 US 53.2 68.5 US 57.6 64.6EU15 19.0 121.7 EU15 24.9 112.1 EU15 31.1 83.9 EU15 37.7 67.6 EU15 40.5 52.1 EU15 42.3 47.4
EU28 33.2 59.6 EU28 36.9 47.4 EU28 39.2 44.0Australia 23.6 150.8 Australia 27.1 121.9 Australia 31.4 84.7 Australia 39.9 71.5 Australia 46.7 60.0 Australia 49.9 56.0
Turkey 7.49 47.9 Turkey 8.89 40.0 Turkey 11.7 31.6 Turkey 13.9 25.0 Turkey 19.0 24.4 Turkey 25.5 28.6
(%) (%) (%) (%) (%)(%)
©20
18 A
sian
Prod
uctiv
ity O
rgan
izat
ion
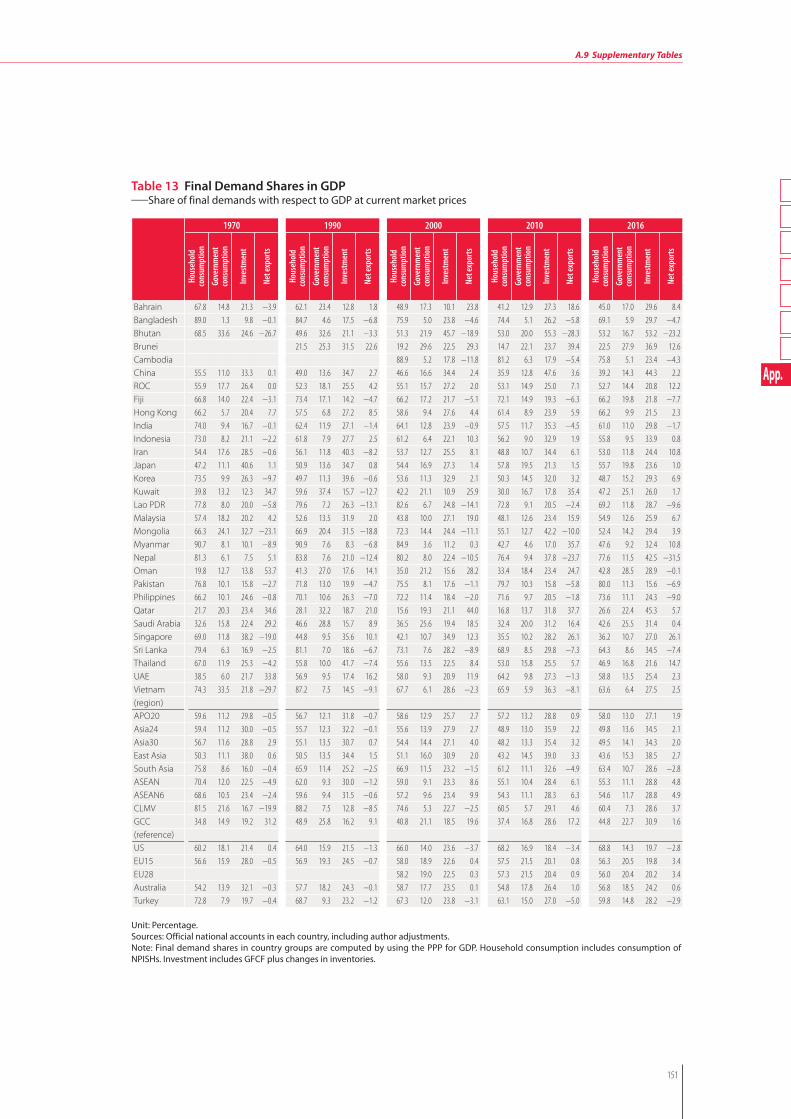
151
A.9 Supplementary Tables
App.
Unit: Percentage.Sources: Official national accounts in each country, including author adjustments.Note: Final demand shares in country groups are computed by using the PPP for GDP. Household consumption includes consumption of NPISHs. Investment includes GFCF plus changes in inventories.
Table 13 Final Demand Shares in GDP_Share of final demands with respect to GDP at current market prices
1970 1990 2000 2010 2016
Hous
ehol
d co
nsum
ptio
nGo
vern
men
t co
nsum
ptio
n
Inve
stmen
t
Net e
xpor
ts
Hous
ehol
d co
nsum
ptio
n
Gove
rnm
ent
cons
umpt
ion
Inve
stmen
t
Net e
xpor
ts
Hous
ehol
d co
nsum
ptio
n
Gove
rnm
ent
cons
umpt
ion
Inve
stmen
t
Net e
xpor
ts
Hous
ehol
d co
nsum
ptio
n
Gove
rnm
ent
cons
umpt
ion
Inve
stmen
t
Net e
xpor
ts
Hous
ehol
d co
nsum
ptio
n
Gove
rnm
ent
cons
umpt
ion
Inve
stmen
t
Net e
xpor
ts
Bahrain 67.8 14.8 21.3 −3.9 62.1 23.4 12.8 1.8 48.9 17.3 10.1 23.8 41.2 12.9 27.3 18.6 45.0 17.0 29.6 8.4Bangladesh 89.0 1.3 9.8 −0.1 84.7 4.6 17.5 −6.8 75.9 5.0 23.8 −4.6 74.4 5.1 26.2 −5.8 69.1 5.9 29.7 −4.7Bhutan 68.5 33.6 24.6 −26.7 49.6 32.6 21.1 −3.3 51.3 21.9 45.7 −18.9 53.0 20.0 55.3 −28.3 53.2 16.7 53.2 −23.2Brunei 21.5 25.3 31.5 22.6 19.2 29.6 22.5 29.3 14.7 22.1 23.7 39.4 22.5 27.9 36.9 12.6Cambodia 88.9 5.2 17.8 −11.8 81.2 6.3 17.9 −5.4 75.8 5.1 23.4 −4.3China 55.5 11.0 33.3 0.1 49.0 13.6 34.7 2.7 46.6 16.6 34.4 2.4 35.9 12.8 47.6 3.6 39.2 14.3 44.3 2.2ROC 55.9 17.7 26.4 0.0 52.3 18.1 25.5 4.2 55.1 15.7 27.2 2.0 53.1 14.9 25.0 7.1 52.7 14.4 20.8 12.2Fiji 66.8 14.0 22.4 −3.1 73.4 17.1 14.2 −4.7 66.2 17.2 21.7 −5.1 72.1 14.9 19.3 −6.3 66.2 19.8 21.8 −7.7Hong Kong 66.2 5.7 20.4 7.7 57.5 6.8 27.2 8.5 58.6 9.4 27.6 4.4 61.4 8.9 23.9 5.9 66.2 9.9 21.5 2.3India 74.0 9.4 16.7 −0.1 62.4 11.9 27.1 −1.4 64.1 12.8 23.9 −0.9 57.5 11.7 35.3 −4.5 61.0 11.0 29.8 −1.7Indonesia 73.0 8.2 21.1 −2.2 61.8 7.9 27.7 2.5 61.2 6.4 22.1 10.3 56.2 9.0 32.9 1.9 55.8 9.5 33.9 0.8Iran 54.4 17.6 28.5 −0.6 56.1 11.8 40.3 −8.2 53.7 12.7 25.5 8.1 48.8 10.7 34.4 6.1 53.0 11.8 24.4 10.8Japan 47.2 11.1 40.6 1.1 50.9 13.6 34.7 0.8 54.4 16.9 27.3 1.4 57.8 19.5 21.3 1.5 55.7 19.8 23.6 1.0Korea 73.5 9.9 26.3 −9.7 49.7 11.3 39.6 −0.6 53.6 11.3 32.9 2.1 50.3 14.5 32.0 3.2 48.7 15.2 29.3 6.9Kuwait 39.8 13.2 12.3 34.7 59.6 37.4 15.7 −12.7 42.2 21.1 10.9 25.9 30.0 16.7 17.8 35.4 47.2 25.1 26.0 1.7Lao PDR 77.8 8.0 20.0 −5.8 79.6 7.2 26.3 −13.1 82.6 6.7 24.8 −14.1 72.8 9.1 20.5 −2.4 69.2 11.8 28.7 −9.6Malaysia 57.4 18.2 20.2 4.2 52.6 13.5 31.9 2.0 43.8 10.0 27.1 19.0 48.1 12.6 23.4 15.9 54.9 12.6 25.9 6.7Mongolia 66.3 24.1 32.7 −23.1 66.9 20.4 31.5 −18.8 72.3 14.4 24.4 −11.1 55.1 12.7 42.2 −10.0 52.4 14.2 29.4 3.9Myanmar 90.7 8.1 10.1 −8.9 90.9 7.6 8.3 −6.8 84.9 3.6 11.2 0.3 42.7 4.6 17.0 35.7 47.6 9.2 32.4 10.8Nepal 81.3 6.1 7.5 5.1 83.8 7.6 21.0 −12.4 80.2 8.0 22.4 −10.5 76.4 9.4 37.8 −23.7 77.6 11.5 42.5 −31.5Oman 19.8 12.7 13.8 53.7 41.3 27.0 17.6 14.1 35.0 21.2 15.6 28.2 33.4 18.4 23.4 24.7 42.8 28.5 28.9 −0.1Pakistan 76.8 10.1 15.8 −2.7 71.8 13.0 19.9 −4.7 75.5 8.1 17.6 −1.1 79.7 10.3 15.8 −5.8 80.0 11.3 15.6 −6.9Philippines 66.2 10.1 24.6 −0.8 70.1 10.6 26.3 −7.0 72.2 11.4 18.4 −2.0 71.6 9.7 20.5 −1.8 73.6 11.1 24.3 −9.0Qatar 21.7 20.3 23.4 34.6 28.1 32.2 18.7 21.0 15.6 19.3 21.1 44.0 16.8 13.7 31.8 37.7 26.6 22.4 45.3 5.7Saudi Arabia 32.6 15.8 22.4 29.2 46.6 28.8 15.7 8.9 36.5 25.6 19.4 18.5 32.4 20.0 31.2 16.4 42.6 25.5 31.4 0.4Singapore 69.0 11.8 38.2 −19.0 44.8 9.5 35.6 10.1 42.1 10.7 34.9 12.3 35.5 10.2 28.2 26.1 36.2 10.7 27.0 26.1Sri Lanka 79.4 6.3 16.9 −2.5 81.1 7.0 18.6 −6.7 73.1 7.6 28.2 −8.9 68.9 8.5 29.8 −7.3 64.3 8.6 34.5 −7.4Thailand 67.0 11.9 25.3 −4.2 55.8 10.0 41.7 −7.4 55.6 13.5 22.5 8.4 53.0 15.8 25.5 5.7 46.9 16.8 21.6 14.7UAE 38.5 6.0 21.7 33.8 56.9 9.5 17.4 16.2 58.0 9.3 20.9 11.9 64.2 9.8 27.3 −1.3 58.8 13.5 25.4 2.3Vietnam 74.3 33.5 21.8 −29.7 87.2 7.5 14.5 −9.1 67.7 6.1 28.6 −2.3 65.9 5.9 36.3 −8.1 63.6 6.4 27.5 2.5(region)APO20 59.6 11.2 29.8 −0.5 56.7 12.1 31.8 −0.7 58.6 12.9 25.7 2.7 57.2 13.2 28.8 0.9 58.0 13.0 27.1 1.9Asia24 59.4 11.2 30.0 −0.5 55.7 12.3 32.2 −0.1 55.6 13.9 27.9 2.7 48.9 13.0 35.9 2.2 49.8 13.6 34.5 2.1Asia30 56.7 11.6 28.8 2.9 55.1 13.5 30.7 0.7 54.4 14.4 27.1 4.0 48.2 13.3 35.4 3.2 49.5 14.1 34.3 2.0East Asia 50.3 11.1 38.0 0.6 50.5 13.5 34.4 1.5 51.1 16.0 30.9 2.0 43.2 14.5 39.0 3.3 43.6 15.3 38.5 2.7South Asia 75.8 8.6 16.0 −0.4 65.9 11.4 25.2 −2.5 66.9 11.5 23.2 −1.5 61.2 11.1 32.6 −4.9 63.4 10.7 28.6 −2.8ASEAN 70.4 12.0 22.5 −4.9 62.0 9.3 30.0 −1.2 59.0 9.1 23.3 8.6 55.1 10.4 28.4 6.1 55.3 11.1 28.8 4.8ASEAN6 68.6 10.5 23.4 −2.4 59.6 9.4 31.5 −0.6 57.2 9.6 23.4 9.9 54.3 11.1 28.3 6.3 54.6 11.7 28.8 4.9CLMV 81.5 21.6 16.7 −19.9 88.2 7.5 12.8 −8.5 74.6 5.3 22.7 −2.5 60.5 5.7 29.1 4.6 60.4 7.3 28.6 3.7GCC 34.8 14.9 19.2 31.2 48.9 25.8 16.2 9.1 40.8 21.1 18.5 19.6 37.4 16.8 28.6 17.2 44.8 22.7 30.9 1.6(reference)US 60.2 18.1 21.4 0.4 64.0 15.9 21.5 −1.3 66.0 14.0 23.6 −3.7 68.2 16.9 18.4 −3.4 68.8 14.3 19.7 −2.8EU15 56.6 15.9 28.0 −0.5 56.9 19.3 24.5 −0.7 58.0 18.9 22.6 0.4 57.5 21.5 20.1 0.8 56.3 20.5 19.8 3.4EU28 58.2 19.0 22.5 0.3 57.3 21.5 20.4 0.9 56.0 20.4 20.2 3.4Australia 54.2 13.9 32.1 −0.3 57.7 18.2 24.3 −0.1 58.7 17.7 23.5 0.1 54.8 17.8 26.4 1.0 56.8 18.5 24.2 0.6Turkey 72.8 7.9 19.7 −0.4 68.7 9.3 23.2 −1.2 67.3 12.0 23.8 −3.1 63.1 15.0 27.0 −5.0 59.8 14.8 28.2 −2.9
©20
18 A
sian
Prod
uctiv
ity O
rgan
izat
ion

152
Appendix
Table 14 Per-Worker Labor Productivity Level_GDP at constant basic prices per worker, using 2011 PPP, reference year 2016
Unit: Thousands of US dollars (as of 2016).Source: APO Productivity Database 2018.
1970 1980 1990 2000 2010 2016Iran 38.4 100.0 Singapore 46.0 100.0 Singapore 68.6 100.0 Singapore 101.1 100.0 Singapore 122.1 100.0 Singapore 131.9 100.0Singapore 32.6 84.9 Japan 44.3 96.3 Japan 63.2 92.1 Hong Kong 73.7 72.9 Hong Kong 101.4 83.0 Hong Kong 110.5 83.8Japan 30.1 78.4 Iran 40.7 88.4 Hong Kong 59.6 86.9 Japan 69.7 69.0 ROC 88.9 72.8 ROC 95.5 72.4Hong Kong 23.7 61.7 Hong Kong 37.4 81.3 Iran 41.8 60.9 ROC 64.6 63.9 Japan 75.4 61.7 Japan 78.7 59.7Fiji 15.1 39.3 ROC 22.1 48.0 ROC 38.5 56.1 Iran 46.7 46.2 Iran 68.8 56.3 Iran 67.5 51.2Malaysia 12.6 33.0 Malaysia 20.3 44.1 Malaysia 26.4 38.5 Korea 43.3 42.8 Korea 60.2 49.3 Korea 65.2 49.5ROC 11.3 29.4 Fiji 17.6 38.3 Korea 25.8 37.6 Malaysia 38.8 38.4 Malaysia 50.0 41.0 Malaysia 56.4 42.7Philippines 9.7 25.4 Korea 13.3 28.9 Fiji 17.2 25.0 Fiji 18.3 18.1 Sri Lanka 23.2 19.0 Sri Lanka 30.7 23.3Korea 8.0 20.7 Philippines 11.8 25.6 Mongolia 12.2 17.8 Thailand 16.8 16.6 Thailand 23.0 18.8 Mongolia 28.4 21.5Mongolia 6.9 18.0 Mongolia 10.4 22.6 Thailand 12.0 17.4 Sri Lanka 14.8 14.6 Indonesia 20.0 16.4 Thailand 28.3 21.5Sri Lanka 6.5 17.0 Indonesia 9.1 19.7 Indonesia 11.3 16.5 Indonesia 14.5 14.3 Mongolia 19.1 15.6 Indonesia 24.9 18.9Thailand 5.8 15.2 Sri Lanka 8.6 18.6 Sri Lanka 11.1 16.1 Pakistan 13.3 13.2 Fiji 19.0 15.6 China 24.0 18.2Indonesia 5.7 14.9 Thailand 7.8 17.0 Philippines 10.8 15.8 Mongolia 12.9 12.8 China 15.7 12.9 Fiji 21.9 16.6Pakistan 4.9 12.7 Pakistan 5.9 12.8 Pakistan 9.6 14.0 Philippines 12.3 12.1 Philippines 14.9 12.2 Philippines 18.7 14.2Myanmar 4.0 10.4 Myanmar 4.6 10.0 Bhutan 7.0 10.2 Bhutan 9.5 9.4 Pakistan 14.6 11.9 Bhutan 16.5 12.5Bangladesh 3.2 8.3 Bhutan 3.3 7.3 India 4.4 6.5 India 6.4 6.3 Bhutan 13.8 11.3 Pakistan 16.4 12.5Bhutan 3.2 8.2 India 3.1 6.8 Myanmar 4.3 6.2 China 6.1 6.0 India 11.5 9.4 India 16.0 12.1India 3.0 7.7 Bangladesh 3.0 6.5 Lao PDR 3.9 5.7 Myanmar 5.8 5.7 Myanmar 9.1 7.4 Lao PDR 11.5 8.7Nepal 2.5 6.6 Lao PDR 2.9 6.4 Nepal 3.5 5.2 Lao PDR 5.0 5.0 Lao PDR 8.4 6.9 Myanmar 10.6 8.1Vietnam 2.4 6.4 Nepal 2.5 5.4 Bangladesh 3.5 5.1 Vietnam 4.9 4.8 Vietnam 7.8 6.4 Vietnam 10.2 7.8Lao PDR 2.3 6.1 Vietnam 2.3 4.9 Vietnam 2.8 4.1 Bangladesh 4.7 4.6 Bangladesh 6.5 5.3 Bangladesh 8.6 6.5China 1.0 2.6 China 1.4 3.0 China 2.5 3.7 Nepal 4.6 4.5 Nepal 5.2 4.3 Cambodia 6.2 4.7
Cambodia 3.1 3.1 Cambodia 4.6 3.8 Nepal 5.7 4.3
Bahrain 136.7 356.4 Bahrain 123.9 269.4 Bahrain 91.9 134.0 Bahrain 109.4 108.3 Bahrain 75.8 62.1 Bahrain 82.6 62.6Kuwait 692.4 1804.8 Kuwait 271.4 589.9 Kuwait 111.0 161.8 Kuwait 214.2 212.0 Kuwait 159.7 130.8 Kuwait 158.5 120.2Oman 126.2 328.9 Oman 172.0 374.0 Oman 184.0 268.2 Oman 159.2 157.5 Oman 110.2 90.2 Oman 83.6 63.4Qatar 315.5 822.5 Qatar 268.1 582.8 Qatar 172.7 251.8 Qatar 231.5 229.0 Qatar 191.9 157.2 Qatar 161.9 122.8Saudi Arabia 256.4 668.4 Saudi Arabia 257.9 560.6 Saudi Arabia 147.7 215.3 Saudi Arabia 168.4 166.6 Saudi Arabia 152.2 124.6 Saudi Arabia 150.5 114.1UAE 101.4 264.2 UAE 373.6 812.2 UAE 232.2 338.4 UAE 200.3 198.2 UAE 148.7 121.8 UAE 178.5 135.4
Brunei 469.4 1020.3 Brunei 225.4 328.6 Brunei 202.4 200.3 Brunei 178.9 146.5 Brunei 161.9 122.7(region) (region) (region) (region) (region) (region)APO20 8.0 20.8 APO20 10.0 21.8 APO20 13.5 19.7 APO20 16.5 16.4 APO20 21.7 17.8 APO20 25.8 19.6Asia24 4.9 12.8 Asia24 6.2 13.4 Asia24 8.4 12.2 Asia24 12.0 11.9 Asia24 19.8 16.2 Asia24 26.1 19.8Asia30 5.5 14.3 Asia30 7.2 15.7 Asia30 9.2 13.3 Asia30 13.0 12.8 Asia30 21.0 17.2 Asia30 27.5 20.8East Asia 5.1 13.2 East Asia 6.6 14.4 East Asia 9.2 13.4 East Asia 13.8 13.7 East Asia 24.4 20.0 East Asia 33.3 25.2South Asia 3.3 8.6 South Asia 3.5 7.6 South Asia 5.0 7.3 South Asia 7.1 7.1 South Asia 11.9 9.7 South Asia 16.0 12.1ASEAN 6.2 16.1 ASEAN 8.8 19.0 ASEAN 10.8 15.7 ASEAN 14.1 13.9 ASEAN 19.1 15.7 ASEAN 23.4 17.8ASEAN6 7.4 19.2 ASEAN6 10.7 23.4 ASEAN6 13.2 19.2 ASEAN6 17.6 17.4 ASEAN6 23.6 19.4 ASEAN6 28.8 21.8CLMV 3.2 8.4 CLMV 3.3 7.2 CLMV 3.6 5.3 CLMV 5.2 5.2 CLMV 8.2 6.7 CLMV 10.4 7.9GCC 283.8 739.7 GCC 259.6 564.3 GCC 150.5 219.3 GCC 172.9 171.1 GCC 144.7 118.5 GCC 143.6 108.9(reference) (reference) (reference) (reference) (reference) (reference)US 65.0 169.5 US 70.4 153.0 US 81.7 119.1 US 99.4 98.4 US 115.2 94.3 US 119.6 90.7EU15 41.5 108.2 EU15 53.6 116.6 EU15 64.1 93.5 EU15 75.4 74.6 EU15 80.0 65.5 EU15 82.9 62.8
EU28 67.4 66.7 EU28 73.6 60.3 EU28 77.1 58.5Australia 51.7 134.9 Australia 59.4 129.1 Australia 63.8 93.0 Australia 79.9 79.0 Australia 87.4 71.6 Australia 94.5 71.6
Turkey 30.6 44.6 Turkey 38.6 38.2 Turkey 54.7 44.8 Turkey 67.4 51.1
(%) (%) (%) (%) (%)(%)
©20
18 A
sian
Prod
uctiv
ity O
rgan
izat
ion

153
A.9 Supplementary Tables
App.
Table 15 Per-Worker Labor Productivity Growth _Average annual growth rate of GDP at constant basic prices per worker, using 2011 PPP
Unit: Percentage.Source: APO Productivity Database 2018.Note: The starting period for Cambodia is 1993.
1990–1995 1995–2000 2000–2005 2005–2010 2010–2016 1990–2016Kuwait 13.0 China 7.1 China 8.6 China 10.3 China 7.1 China 8.7China 10.6 Oman 6.4 Vietnam 5.6 India 7.0 Mongolia 6.6 Vietnam 5.0Malaysia 6.6 Qatar 5.6 Lao PDR 5.1 Bhutan 5.9 India 5.5 India 4.9Thailand 6.5 Vietnam 5.4 Cambodia 4.7 Sri Lanka 5.4 Lao PDR 5.3 Lao PDR 4.2Indonesia 6.4 ROC 4.8 India 4.7 Lao PDR 5.2 Cambodia 4.9 Cambodia 4.2Vietnam 5.8 Korea 4.6 Myanmar 4.2 Mongolia 5.1 Bangladesh 4.8 Sri Lanka 3.9Korea 5.8 India 4.2 Thailand 3.8 Iran 4.8 Sri Lanka 4.7 Korea 3.6ROC 5.5 Singapore 3.5 Indonesia 3.7 Myanmar 4.8 Vietnam 4.5 Myanmar 3.5Cambodia 4.9 Cambodia 3.3 Sri Lanka 3.6 Vietnam 3.8 Philippines 3.8 ROC 3.5Bhutan 4.9 Bangladesh 3.3 Malaysia 3.6 Bangladesh 3.4 Indonesia 3.6 Bangladesh 3.5Pakistan 4.2 Myanmar 3.2 Hong Kong 3.3 Korea 3.4 Thailand 3.5 Bhutan 3.3Singapore 4.2 Nepal 2.7 Bangladesh 3.2 Cambodia 3.2 UAE 3.0 Thailand 3.3Sri Lanka 4.1 Lao PDR 2.6 Korea 3.2 ROC 3.2 Bhutan 3.0 Mongolia 3.2Hong Kong 3.8 Philippines 2.6 ROC 3.2 Hong Kong 3.1 Myanmar 2.6 Indonesia 3.0India 3.1 Mongolia 2.5 Singapore 3.2 Indonesia 2.8 Fiji 2.3 Malaysia 2.9Bahrain 2.9 Pakistan 2.2 Iran 2.9 Philippines 2.6 Malaysia 2.0 Singapore 2.5Myanmar 2.8 Sri Lanka 1.6 Mongolia 2.7 Thailand 2.5 Pakistan 2.0 Hong Kong 2.4Lao PDR 2.5 Saudi Arabia 1.6 Pakistan 2.3 Nepal 2.0 Hong Kong 1.4 Philippines 2.1Nepal 2.4 Fiji 1.5 Bhutan 1.5 Malaysia 1.5 Bahrain 1.4 Pakistan 2.1Bangladesh 2.3 Bhutan 1.3 Japan 1.4 Fiji 0.8 Nepal 1.4 Iran 1.8Iran 1.4 Japan 1.3 Philippines 1.2 Singapore 0.6 Korea 1.3 Nepal 1.8Saudi Arabia 1.0 Malaysia 1.1 Oman 1.1 Japan 0.2 Singapore 1.3 Kuwait 1.4Japan 0.7 Iran 0.8 Kuwait 0.8 Pakistan −0.4 ROC 1.2 Fiji 0.9Brunei 0.3 UAE 0.7 Nepal 0.6 Saudi Arabia −1.6 Japan 0.7 Japan 0.8Qatar 0.3 Bahrain 0.6 Fiji 0.1 Brunei −1.8 Kuwait −0.1 Saudi Arabia 0.1Philippines −0.1 Hong Kong 0.4 Saudi Arabia −0.4 Bahrain −2.6 Saudi Arabia −0.2 Qatar −0.2Fiji −0.2 Thailand 0.3 Brunei −0.7 Qatar −2.9 Iran −0.3 Bahrain −0.4Mongolia −1.4 Kuwait 0.2 Qatar −0.8 UAE −4.2 Brunei −1.7 UAE −1.0UAE −3.7 Indonesia −1.6 UAE −1.8 Kuwait −6.7 Qatar −2.8 Brunei −1.3Oman −9.3 Brunei −2.5 Bahrain −4.8 Oman −8.5 Oman −4.6 Oman −3.0(region) (region) (region) (region) (region) (region)APO20 2.5 APO20 1.6 APO20 2.5 APO20 3.0 APO20 2.9 APO20 2.5Asia24 4.2 Asia24 3.0 Asia24 4.4 Asia24 5.6 Asia24 4.6 Asia24 4.4Asia30 4.0 Asia30 2.9 Asia30 4.3 Asia30 5.4 Asia30 4.5 Asia30 4.2East Asia 4.5 East Asia 3.6 East Asia 4.9 East Asia 6.5 East Asia 5.2 East Asia 4.9South Asia 3.2 South Asia 3.9 South Asia 4.2 South Asia 5.9 South Asia 5.0 South Asia 4.5ASEAN 5.0 ASEAN 0.4 ASEAN 3.3 ASEAN 2.8 ASEAN 3.4 ASEAN 3.0ASEAN6 5.6 ASEAN6 0.1 ASEAN6 3.3 ASEAN6 2.6 ASEAN6 3.3 ASEAN6 3.0CLMV 2.9 CLMV 4.5 CLMV 5.0 CLMV 4.1 CLMV 4.0 CLMV 4.1GCC 0.9 GCC 1.9 GCC −0.5 GCC −3.0 GCC −0.1 GCC −0.2(reference) (reference) (reference) (reference) (reference) (reference)US 1.6 US 2.4 US 1.8 US 1.1 US 0.6 US 1.5EU15 1.9 EU15 1.3 EU15 0.9 EU15 0.3 EU15 0.6 EU15 1.0
EU28 1.8 EU28 1.3 EU28 0.4 EU28 0.8 EU28 1.1Australia 2.4 Australia 2.1 Australia 1.3 Australia 0.5 Australia 1.3 Australia 1.5Turkey 1.3 Turkey 3.4 Turkey 6.1 Turkey 0.8 Turkey 3.5 Turkey 3.0
©20
18 A
sian
Prod
uctiv
ity O
rgan
izat
ion

154
Appendix
Table 16 Per-Hour Labor Productivity Level_GDP at constant basic prices per hour, using 2011 PPP, reference year 2016
Unit: US dollar (as of 2016).Source: APO Productivity Database 2018.
1970 1980 1990 2000 2010 2016Iran 15.3 100.0 Singapore 21.6 100.0 Singapore 30.3 100.0 Singapore 42.1 100.0 Singapore 52.7 100.0 Singapore 56.4 100.0Singapore 14.9 97.5 Japan 20.6 95.3 Japan 30.2 99.9 Japan 36.9 87.7 Hong Kong 44.1 83.7 Hong Kong 50.8 90.1Japana 13.3 87.2 Iran 16.1 74.5 Hong Kong 26.2 86.4 Hong Kong 31.6 75.0 ROC 43.1 81.8 ROC 44.9 79.7Hong Kong 9.4 61.4 Hong Kong 15.1 69.7 ROC 17.3 57.0 ROC 29.6 70.4 Japan 41.9 79.5 Japan 44.6 79.0Fiji 8.1 53.1 ROC 9.5 44.1 Iran 16.4 54.2 Iran 18.6 44.0 Iran 28.9 54.9 Korea 30.1 53.4Malaysia 5.7 37.2 Fiji 9.3 43.2 Malaysia 11.8 39.0 Korea 17.7 42.1 Korea 27.6 52.3 Iran 28.8 51.0ROC 4.9 32.1 Malaysia 9.1 41.9 Korea 10.0 32.9 Malaysia 17.3 41.0 Malaysia 22.5 42.7 Malaysia 25.9 45.9Philippines 4.6 30.2 Philippines 5.5 25.5 Fiji 9.4 31.2 Fiji 9.8 23.3 Sri Lanka 12.4 23.5 Sri Lanka 15.9 28.3Mongolia 3.6 23.8 Mongolia 5.5 25.5 Mongolia 6.5 21.5 Indonesia 7.6 17.9 Fiji 10.5 20.0 Mongolia 15.0 26.6Sri Lanka 3.4 22.5 Korea 5.2 23.9 Indonesia 5.9 19.6 Sri Lanka 7.4 17.5 Mongolia 10.1 19.2 Thailand 12.8 22.7Indonesia 2.9 18.9 Indonesia 4.5 21.0 Sri Lanka 5.6 18.4 Mongolia 6.9 16.3 Thailand 9.8 18.6 Indonesia 12.3 21.9Korea 2.7 17.8 Sri Lanka 4.4 20.2 Philippines 4.9 16.3 Thailand 6.7 15.9 Indonesia 9.7 18.5 Fiji 11.3 20.1Thailand 2.4 15.5 Thailand 2.9 13.4 Thailand 4.6 15.3 Pakistan 5.9 14.1 China 7.2 13.7 China 11.1 19.7Pakistan 2.1 14.0 Pakistan 2.7 12.4 Pakistan 4.3 14.3 Philippines 5.7 13.5 Philippines 7.0 13.3 Philippines 8.7 15.4Myanmar 1.6 10.3 Myanmar 1.8 8.4 Bhutan 2.5 8.1 Bhutan 3.3 7.9 Pakistan 6.7 12.8 Pakistan 7.7 13.7Nepal 1.5 9.6 India 1.5 7.0 India 2.1 7.0 India 3.1 7.3 India 5.5 10.4 India 7.5 13.4India 1.4 9.4 Nepal 1.4 6.7 Nepal 2.0 6.5 China 2.9 6.9 Bhutan 5.1 9.6 Bhutan 6.9 12.3Bangladesh 1.3 8.3 Lao PDR 1.4 6.3 Lao PDR 1.8 6.0 Nepal 2.5 6.0 Lao PDR 3.9 7.4 Lao PDR 5.4 9.5Bhutan 1.1 7.3 Bangladesh 1.2 5.5 Myanmar 1.7 5.6 Lao PDR 2.3 5.5 Myanmar 3.5 6.7 Vietnam 4.7 8.4Lao PDR 1.1 7.1 Bhutan 1.2 5.4 Bangladesh 1.5 4.8 Myanmar 2.3 5.4 Vietnam 3.4 6.4 Myanmar 4.1 7.4Vietnam 1.0 6.9 Vietnam 1.0 4.5 China 1.3 4.2 Vietnam 2.0 4.8 Nepal 2.9 5.5 Bangladesh 3.4 6.1China 0.5 3.4 China 0.7 3.3 Vietnam 1.2 4.0 Bangladesh 1.8 4.3 Bangladesh 2.5 4.8 Nepal 3.1 5.6
Cambodia 1.4 3.2 Cambodia 1.9 3.7 Cambodia 2.5 4.5Brunei 143.2 938.2 Brunei 205.5 949.8 Brunei 98.7 326.1 Brunei 88.6 210.4 Brunei 78.3 148.7 Brunei 70.9 125.7(region) (region) (region) (region) (region) (region)APO20 3.7 24.0 APO20 4.6 21.5 APO20 6.3 20.8 APO20 7.7 18.4 APO20 10.2 19.3 APO20 12.1 21.5Asia24 2.3 15.4 Asia24 3.0 13.7 Asia24 4.0 13.4 Asia24 5.7 13.4 Asia24 9.2 17.4 Asia24 12.1 21.5East Asia 2.5 16.3 East Asia 3.3 15.2 East Asia 4.6 15.2 East Asia 6.6 15.7 East Asia 11.4 21.6 East Asia 15.6 27.6South Asia 1.6 10.2 South Asia 1.7 7.7 South Asia 2.4 7.8 South Asia 3.3 7.9 South Asia 5.5 10.5 South Asia 7.4 13.2ASEAN 2.8 18.4 ASEAN 3.9 18.0 ASEAN 4.9 16.2 ASEAN 6.4 15.3 ASEAN 8.7 16.5 ASEAN 10.9 19.3ASEAN6 3.5 22.6 ASEAN6 4.9 22.6 ASEAN6 6.2 20.5 ASEAN6 8.4 19.9 ASEAN6 11.1 21.0 ASEAN6 13.8 24.4CLMV 1.4 8.9 CLMV 1.4 6.5 CLMV 1.5 5.0 CLMV 2.2 5.1 CLMV 3.5 6.6 CLMV 4.5 8.0(reference) (reference) (reference) (reference) (reference) (reference)US 32.3 211.4 US 37.1 171.3 US 43.8 144.8 US 54.2 128.6 US 64.8 123.0 US 66.9 118.7
EU15 45.8 108.8 EU15 50.3 95.5 EU15 54.0 95.8Australia 32.5 150.0 Australia 35.7 118.0 Australia 44.9 106.6 Australia 50.6 96.0 Australia 55.2 97.9
Turkey 16.4 54.2 Turkey 19.9 47.4 Turkey 29.1 55.3 Turkey 35.2 62.4
(%) (%) (%) (%) (%)(%)
©20
18 A
sian
Prod
uctiv
ity O
rgan
izat
ion

155
A.9 Supplementary Tables
App.
Table 17 Per-Hour Labor Productivity Growth_Average annual growth rate of GDP at constant basic prices per hour, using 2011 PPP
Unit: Percentage.Source: APO Productivity Database 2018.Note: The annual average growth rate for Cambodia during 1990–1995 replicates their annual average growth rates of 1993–1995 because of the lack of hours-worked data.
1990–1995 1995–2000 2000–2005 2005–2010 2010–2016 1990–2016China 10.3 China 6.3 China 7.7 China 10.5 China 7.1 China 8.3Malaysia 6.5 Korea 5.4 Vietnam 7.3 India 6.9 Mongolia 6.6 Vietnam 5.2Indonesia 6.3 ROC 5.2 Thailand 5.2 Iran 5.9 Vietnam 5.5 India 4.9Thailand 6.2 Vietnam 4.7 Lao PDR 5.1 Sri Lanka 5.5 India 5.4 Korea 4.3Korea 6.2 India 4.1 Sri Lanka 4.8 Lao PDR 5.2 Lao PDR 5.3 Lao PDR 4.2Vietnam 5.7 Myanmar 3.2 India 4.6 Bhutan 5.2 Bhutan 5.2 Sri Lanka 4.0ROC 5.6 Bangladesh 3.1 Korea 4.2 Mongolia 4.9 Bangladesh 5.0 Bhutan 4.0Cambodia 5.0 Singapore 3.1 Myanmar 4.1 Myanmar 4.8 Thailand 4.5 Thailand 3.9Bhutan 4.9 Nepal 2.8 Cambodia 4.1 Korea 4.6 Cambodia 4.4 ROC 3.7Sri Lanka 4.5 Lao PDR 2.6 ROC 3.7 ROC 3.8 Sri Lanka 4.2 Cambodia 3.6Hong Kong 4.0 Mongolia 2.6 Singapore 3.7 Bangladesh 3.6 Indonesia 4.0 Myanmar 3.5Pakistan 3.8 Pakistan 2.6 Indonesia 3.3 Hong Kong 3.5 Philippines 3.6 Bangladesh 3.3Singapore 3.6 Cambodia 2.4 Bhutan 3.1 Cambodia 3.1 Myanmar 2.6 Mongolia 3.2India 3.2 Philippines 2.3 Hong Kong 3.1 Vietnam 2.8 Hong Kong 2.4 Malaysia 3.0Myanmar 2.8 Japan 2.1 Bangladesh 3.1 Philippines 2.4 Malaysia 2.3 Indonesia 2.8Lao PDR 2.5 Fiji 1.2 Malaysia 3.1 Thailand 2.4 Pakistan 2.2 Hong Kong 2.6Nepal 2.2 Bhutan 1.2 Iran 3.0 Malaysia 2.2 Korea 1.5 Singapore 2.4Japan 1.9 Thailand 1.2 Mongolia 2.8 Nepal 1.9 Nepal 1.4 Pakistan 2.2Iran 1.6 Malaysia 1.1 Pakistan 2.5 Indonesia 1.8 Fiji 1.3 Philippines 2.2Bangladesh 1.3 Sri Lanka 1.1 Philippines 1.8 Fiji 1.7 Singapore 1.1 Iran 2.2Philippines 0.5 Iran 0.9 Japan 1.8 Singapore 0.8 Japan 1.0 Nepal 1.8Brunei 0.3 Hong Kong −0.2 Nepal 0.7 Japan 0.8 ROC 0.7 Japan 1.5Fiji −0.4 Indonesia −1.4 Fiji −0.3 Pakistan 0.0 Iran −0.1 Fiji 0.7Mongolia −1.5 Brunei −2.5 Brunei −0.7 Brunei −1.8 Brunei −1.7 Brunei −1.3(region) (region) (region) (region) (region) (region)APO20 2.5 APO20 1.7 APO20 2.6 APO20 2.8 APO20 3.0 APO20 2.5Asia24 4.1 Asia24 2.6 Asia24 4.0 Asia24 5.6 Asia24 4.7 Asia24 4.2East Asia 4.4 East Asia 2.9 East Asia 4.2 East Asia 6.7 East Asia 5.2 East Asia 4.7South Asia 3.0 South Asia 4.0 South Asia 4.2 South Asia 5.8 South Asia 5.0 South Asia 4.4ASEAN 4.9 ASEAN 0.5 ASEAN 3.7 ASEAN 2.3 ASEAN 3.8 ASEAN 3.1ASEAN6 5.5 ASEAN6 0.5 ASEAN6 3.5 ASEAN6 2.1 ASEAN6 3.7 ASEAN6 3.1CLMV 3.0 CLMV 4.0 CLMV 6.0 CLMV 3.5 CLMV 4.5 CLMV 4.2(reference) (reference) (reference) (reference) (reference) (reference)US 1.7 US 2.5 US 2.2 US 1.4 US 0.5 US 1.6
EU15 1.2 EU15 0.6 EU15 1.2 EU15 1.0Australia 2.2 Australia 2.4 Australia 1.4 Australia 0.9 Australia 1.5 Australia 1.7Turkey 1.2 Turkey 2.7 Turkey 6.1 Turkey 1.4 Turkey 3.2 Turkey 2.9
©20
18 A
sian
Prod
uctiv
ity O
rgan
izat
ion

156
Appendix
Table18 Output Growth and Contributions of Labor, Capital, and TFP
Output Labor Capital TFP Output Labor Capital TFPIT Non-IT IT Non-IT
Bang
lade
sh
1970–1975 −2.0 0.2 (−10) 0.0 (−1) 0.2 (−12) −2.5 (123)
Brun
ei
1970–1975 7.9 1.2 (15) 0.0 (0) 1.1 (14) 5.6 (71)1975–1980 3.7 1.2 (34) 0.0 (1) 0.7 (19) 1.7 (46) 1975–1980 9.7 0.8 (9) 1.7 (18) 0.6 (6) 6.5 (67)1980–1985 3.7 1.5 (41) 0.1 (2) 1.6 (43) 0.5 (14) 1980–1985 −3.7 0.7 (−19) 1.1 (−30) 6.0 (−161) −11.5 (310)1985–1990 4.4 0.7 (15) 0.1 (2) 2.7 (63) 0.9 (20) 1985–1990 −1.8 1.2 (−69) 0.0 (−1) 4.3 (−242) −7.4 (411)1990–1995 5.0 1.8 (36) 0.1 (3) 3.0 (59) 0.1 (1) 1990–1995 3.1 0.8 (26) 1.0 (33) 6.5 (209) −5.2 (−168)1995–2000 5.1 1.0 (19) 0.2 (3) 3.9 (76) 0.1 (1) 1995–2000 1.3 1.1 (86) 0.7 (52) 3.6 (273) −4.1 (−310)2000–2005 5.0 0.9 (17) 0.2 (3) 4.3 (87) −0.4 (−8) 2000–2005 2.1 0.8 (37) 0.4 (19) 1.7 (83) −0.8 (−38)2005–2010 5.9 1.0 (18) 0.2 (3) 4.6 (78) 0.1 (1) 2005–2010 0.7 0.6 (93) 0.5 (72) 1.7 (263) −2.2 (−328)2010–2016 6.3 0.5 (7) 0.2 (4) 4.6 (73) 1.0 (16) 2010–2016 −0.5 0.3 (−64) 1.2 (−259) 2.9 (−607) −4.9 (1031)1970–2016 4.2 1.0 (23) 0.1 (3) 2.9 (69) 0.2 (4) 1970–2016 2.0 0.8 (41) 0.8 (37) 3.2 (156) −2.7 (−134)
Cam
bodi
a
1970–1975
Chin
a
1970–1975 5.7 1.4 (24) 0.0 (1) 4.2 (73) 0.1 (2)1975–1980 1975–1980 6.3 1.4 (22) 0.0 (1) 4.1 (64) 0.8 (13)1980–1985 1980–1985 10.1 1.9 (19) 0.0 (0) 3.4 (34) 4.8 (47)1985–1990 1985–1990 7.6 1.3 (17) 0.1 (1) 4.4 (58) 1.8 (23)1990–1995 7.6 0.7 (10) 0.1 (1) 1.4 (18) 5.4 (71) 1990–1995 11.6 0.7 (6) 0.1 (1) 3.6 (31) 7.1 (61)1995–2000 7.2 1.3 (18) 0.1 (2) 3.4 (48) 2.3 (32) 1995–2000 8.3 1.2 (15) 0.2 (2) 4.2 (51) 2.6 (32)2000–2005 8.8 1.5 (17) 0.2 (2) 5.2 (59) 1.9 (22) 2000–2005 9.3 0.9 (10) 0.7 (7) 4.5 (48) 3.2 (35)2005–2010 6.5 1.2 (19) 0.2 (3) 7.2 (111) −2.2 (−33) 2005–2010 10.7 0.1 (1) 0.6 (5) 5.9 (55) 4.2 (39)2010–2016 7.0 0.9 (12) 0.2 (3) 5.7 (82) 0.2 (3) 2010–2016 7.4 0.2 (2) 0.3 (4) 4.9 (66) 2.0 (28)1970–2016 7.4 1.2 (16) 0.2 (2) 5.1 (69) 1.0 (13) 1970–2016 8.5 1.0 (12) 0.2 (3) 4.4 (51) 2.9 (34)
ROC
1970–1975 9.3 1.7 (18) 0.5 (6) 7.3 (79) −0.3 (−3)
Fiji
1970–1975 5.6 1.8 (31) 0.1 (2) 3.2 (57) 0.5 (10)1975–1980 10.6 1.7 (16) 0.4 (4) 5.7 (54) 2.8 (26) 1975–1980 3.7 1.4 (37) 0.1 (2) 2.9 (80) −0.7 (−18)1980–1985 6.9 1.2 (17) 0.4 (6) 4.3 (62) 1.0 (15) 1980–1985 0.7 1.3 (187) 0.1 (9) 2.3 (321) −3.0 (−417)1985–1990 8.9 1.0 (11) 0.3 (4) 3.5 (39) 4.1 (46) 1985–1990 3.7 0.9 (25) 0.1 (3) 0.3 (7) 2.4 (65)1990–1995 7.2 0.9 (13) 0.3 (5) 3.9 (54) 2.1 (29) 1990–1995 2.7 1.4 (52) 0.2 (6) 1.5 (55) −0.4 (−14)1995–2000 5.8 0.3 (5) 0.7 (12) 3.5 (61) 1.3 (22) 1995–2000 2.0 0.4 (21) 0.0 (0) 1.4 (69) 0.2 (11)2000–2005 4.0 0.1 (3) 0.6 (14) 2.3 (59) 0.9 (24) 2000–2005 2.0 1.1 (55) 0.1 (6) 0.8 (39) 0.0 (−1)2005–2010 4.2 0.2 (5) 0.1 (2) 1.8 (42) 2.1 (51) 2005–2010 0.7 −0.4 (−58) 0.2 (22) 0.4 (57) 0.6 (79)2010–2016 2.4 0.8 (33) 0.1 (2) 1.1 (49) 0.4 (16) 2010–2016 3.1 0.7 (22) 0.1 (3) 0.0 (1) 2.3 (73)1970–2016 6.5 0.9 (13) 0.4 (6) 3.7 (56) 1.6 (24) 1970–2016 2.7 0.9 (35) 0.1 (4) 1.4 (51) 0.3 (10)
Hon
g Ko
ng
1970–1975 6.3 2.1 (33) 0.3 (4) 3.3 (52) 0.7 (11)
Indi
a
1970–1975 2.8 1.7 (60) 0.0 (1) 1.4 (48) −0.2 (−8)1975–1980 10.9 1.9 (18) 0.3 (3) 3.9 (36) 4.8 (44) 1975–1980 3.1 1.7 (55) 0.0 (1) 1.5 (49) −0.2 (−5)1980–1985 5.6 0.9 (15) 0.3 (6) 4.1 (73) 0.3 (5) 1980–1985 5.0 1.4 (29) 0.0 (1) 1.5 (29) 2.1 (41)1985–1990 7.4 0.2 (2) 0.5 (7) 3.0 (40) 3.8 (51) 1985–1990 5.8 1.3 (23) 0.0 (1) 1.6 (27) 2.9 (49)1990–1995 5.2 0.6 (11) 0.5 (9) 3.4 (66) 0.8 (15) 1990–1995 5.0 1.2 (24) 0.1 (1) 1.8 (36) 1.9 (39)1995–2000 2.6 1.5 (56) 0.8 (29) 2.9 (111) −2.5 (−96) 1995–2000 5.7 1.0 (18) 0.1 (2) 2.1 (37) 2.5 (44)2000–2005 4.1 0.5 (13) 0.5 (12) 1.5 (35) 1.6 (40) 2000–2005 6.5 1.2 (18) 0.1 (2) 2.1 (33) 3.1 (47)2005–2010 3.8 0.2 (5) 0.3 (9) 1.3 (34) 2.0 (53) 2005–2010 7.8 0.5 (6) 0.2 (3) 3.6 (46) 3.5 (44)2010–2016 2.8 0.2 (8) 0.2 (9) 0.9 (34) 1.4 (49) 2010–2016 6.3 0.5 (8) 0.2 (3) 4.0 (64) 1.5 (24)1970–2016 5.4 0.9 (16) 0.4 (8) 2.7 (50) 1.4 (27) 1970–2016 5.4 1.2 (22) 0.1 (2) 2.2 (41) 1.9 (35)
Indo
nesi
a
1970–1975 8.3 1.5 (18) 0.0 (0) 4.2 (50) 2.6 (31)
Iran
1970–1975 9.5 0.6 (6) 0.1 (1) 6.2 (66) 2.6 (27)1975–1980 7.8 1.0 (13) 0.2 (2) 5.8 (75) 0.8 (11) 1975–1980 −2.8 1.2 (−42) 0.1 (−2) 7.3 (−256) −11.4 (399)1980–1985 4.7 1.4 (31) 0.2 (4) 6.1 (130) −3.0 (−64) 1980–1985 3.8 0.6 (16) 0.1 (1) 2.9 (75) 0.3 (8)1985–1990 7.5 1.0 (13) 0.2 (3) 4.8 (64) 1.5 (20) 1985–1990 1.3 1.1 (79) 0.1 (5) 0.8 (59) −0.6 (−42)1990–1995 7.5 0.5 (7) 0.3 (4) 5.2 (68) 1.5 (21) 1990–1995 3.7 0.5 (13) 0.1 (2) 0.4 (11) 2.7 (73)1995–2000 0.7 0.9 (120) 0.2 (27) 4.6 (636) −5.0 (−684) 1995–2000 4.1 0.7 (17) 0.1 (2) 0.8 (19) 2.6 (62)2000–2005 4.6 0.5 (11) 0.2 (4) 2.7 (59) 1.2 (26) 2000–2005 6.8 0.8 (12) 0.3 (4) 3.0 (44) 2.7 (40)2005–2010 5.6 1.4 (24) 0.3 (5) 3.5 (63) 0.5 (8) 2005–2010 5.0 −0.2 (−4) 0.2 (4) 3.8 (77) 1.1 (23)2010–2016 5.3 0.5 (10) 0.2 (4) 4.1 (78) 0.4 (8) 2010–2016 1.2 0.4 (30) 0.1 (7) 1.8 (149) −1.0 (−86)1970–2016 5.8 1.0 (17) 0.2 (3) 4.5 (79) 0.1 (1) 1970–2016 3.6 0.6 (17) 0.1 (3) 3.0 (83) −0.1 (−4)
Japa
n
1970–1975 4.4 −0.4 (−9) 0.5 (11) 5.4 (124) −1.1 (−26)
Kore
a
1970–1975 9.4 1.2 (13) 0.2 (3) 7.5 (80) 0.4 (5)1975–1980 4.7 0.6 (13) 0.3 (6) 2.7 (57) 1.1 (23) 1975–1980 7.5 0.5 (7) 0.5 (7) 8.7 (115) −2.2 (−29)1980–1985 4.3 0.4 (10) 0.3 (8) 1.9 (45) 1.6 (37) 1980–1985 8.9 1.1 (13) 0.4 (5) 5.3 (60) 2.1 (23)1985–1990 4.9 0.4 (8) 0.5 (11) 1.9 (40) 2.0 (41) 1985–1990 9.8 1.6 (16) 0.7 (7) 5.2 (53) 2.3 (24)1990–1995 1.5 −0.2 (−16) 0.3 (22) 1.7 (112) −0.3 (−19) 1990–1995 8.1 1.0 (13) 0.5 (6) 5.4 (67) 1.2 (15)1995–2000 1.1 −0.5 (−50) 0.4 (33) 0.8 (72) 0.5 (45) 1995–2000 5.3 0.0 (−1) 0.6 (12) 3.8 (72) 0.9 (17)2000–2005 1.2 −0.3 (−27) 0.3 (25) 0.1 (13) 1.1 (90) 2000–2005 4.7 0.3 (5) 0.6 (13) 2.6 (56) 1.2 (26)2005–2010 0.1 −0.4 (−372) 0.1 (136) −0.1 (−114) 0.4 (449) 2005–2010 4.2 −0.2 (−5) 0.2 (4) 2.2 (52) 2.0 (49)2010–2016 1.0 0.0 (−2) 0.1 (6) −0.4 (−40) 1.4 (136) 2010–2016 2.9 0.7 (24) 0.1 (3) 1.9 (65) 0.2 (8)1970–2016 2.5 0.0 (−2) 0.3 (12) 1.5 (60) 0.7 (29) 1970–2016 6.7 0.7 (10) 0.4 (6) 4.7 (70) 0.9 (14)
Lao
PDR
1970–1975 5.3 0.7 (13) 0.0 (0) 3.4 (65) 1.2 (22)
Mal
aysi
a
1970–1975 7.7 1.2 (16) 0.1 (1) 5.6 (73) 0.8 (11)1975–1980 1.8 0.1 (5) 0.0 (1) 3.0 (168) −1.3 (−74) 1975–1980 8.2 1.2 (15) 0.1 (1) 5.8 (71) 1.1 (13)1980–1985 7.4 0.6 (9) 0.0 (1) 3.5 (46) 3.3 (44) 1980–1985 5.1 1.2 (24) 0.1 (2) 7.1 (141) −3.4 (−67)1985–1990 4.2 1.2 (28) 0.1 (2) 4.0 (95) −1.1 (−25) 1985–1990 6.9 1.3 (19) 0.2 (3) 3.5 (51) 2.0 (28)1990–1995 6.0 1.1 (18) 0.2 (3) 4.9 (82) −0.2 (−4) 1990–1995 9.3 1.0 (11) 0.3 (3) 6.5 (71) 1.4 (15)1995–2000 6.0 1.0 (17) 0.2 (3) 5.6 (93) −0.8 (−14) 1995–2000 4.9 1.3 (26) 0.5 (11) 5.7 (116) −2.6 (−53)2000–2005 6.4 0.4 (6) 0.3 (4) 3.2 (51) 2.5 (39) 2000–2005 5.2 0.7 (14) 0.7 (14) 2.3 (44) 1.5 (28)2005–2010 7.8 0.7 (9) 0.4 (4) 3.5 (45) 3.2 (41) 2005–2010 5.0 0.9 (19) 0.7 (14) 2.1 (42) 1.2 (25)2010–2016 7.5 0.5 (6) 0.6 (8) 5.7 (77) 0.6 (8) 2010–2016 5.0 1.0 (19) 0.4 (7) 3.0 (61) 0.6 (13)1970–2016 5.9 0.7 (12) 0.2 (4) 4.1 (71) 0.8 (14) 1970–2016 6.3 1.1 (17) 0.3 (5) 4.6 (73) 0.3 (5)
Mon
golia
1970–1975 6.5 0.5 (8) 0.1 (1) 5.2 (80) 0.7 (11)
Mya
nmar
1970–1975 2.4 0.6 (23) 0.0 (1) 3.0 (123) −1.2 (−48)1975–1980 5.4 0.9 (16) 0.1 (3) 5.7 (105) −1.3 (−24) 1975–1980 5.8 0.8 (14) 0.2 (3) 6.4 (112) −1.7 (−29)1980–1985 6.6 0.8 (12) 0.1 (2) 6.0 (91) −0.4 (−6) 1980–1985 4.7 0.7 (15) 0.2 (4) 7.8 (167) −4.0 (−86)1985–1990 3.8 1.5 (39) 0.1 (3) 3.9 (103) −1.7 (−46) 1985–1990 −2.1 0.4 (−20) 0.1 (−4) 2.8 (−132) −5.5 (256)1990–1995 −1.8 −0.1 (6) 0.1 (−4) 0.9 (−53) −2.7 (151) 1990–1995 4.9 0.7 (15) 0.1 (2) 2.9 (58) 1.2 (25)1995–2000 3.6 0.2 (6) 0.1 (4) 0.2 (6) 3.0 (84) 1995–2000 6.0 1.0 (17) 0.3 (6) 6.5 (109) −1.9 (−32)2000–2005 6.3 0.8 (12) 0.3 (4) 0.2 (3) 5.1 (81) 2000–2005 6.4 0.7 (11) 0.4 (6) 6.6 (102) −1.3 (−20)2005–2010 6.4 0.3 (5) 0.4 (7) 3.6 (57) 2.0 (31) 2005–2010 6.3 0.5 (7) 0.3 (4) 7.8 (124) −2.2 (−36)2010–2016 8.4 0.6 (7) 0.3 (3) 4.5 (53) 3.0 (36) 2010–2016 4.3 0.7 (15) 0.3 (6) 7.7 (178) −4.3 (−100)1970–2016 5.1 0.6 (12) 0.2 (4) 3.4 (67) 0.9 (18) 1970–2016 4.3 0.7 (16) 0.2 (5) 5.8 (134) −2.4 (−55)
©20
18 A
sian
Prod
uctiv
ity O
rgan
izat
ion

157
A.9 Supplementary Tables
App.
Output Labor Capital TFP Output Labor Capital TFPIT Non-IT IT Non-IT
Nep
al
1970–1975 2.9 1.6 (55) 0.1 (2) 3.0 (104) −1.8 (−62)
Paki
stan
1970–1975 3.6 1.3 (36) 0.0 (1) 2.2 (61) 0.1 (2)1975–1980 3.1 1.8 (60) 0.1 (4) 3.9 (127) −2.8 (−90) 1975–1980 5.8 0.8 (14) 0.0 (0) 2.3 (39) 2.7 (46)1980–1985 4.1 1.0 (23) 0.1 (2) 3.6 (88) −0.6 (−14) 1980–1985 7.9 1.4 (18) 0.0 (0) 2.6 (33) 3.9 (49)1985–1990 4.9 0.6 (13) 0.1 (1) 3.0 (62) 1.2 (24) 1985–1990 7.0 1.5 (22) 0.1 (1) 3.0 (43) 2.4 (34)1990–1995 4.9 1.6 (32) 0.0 (1) 2.9 (60) 0.4 (7) 1990–1995 6.0 1.2 (20) 0.1 (1) 2.8 (47) 1.9 (32)1995–2000 4.8 1.2 (25) 0.1 (1) 2.4 (51) 1.1 (23) 1995–2000 4.5 1.0 (22) 0.0 (1) 2.6 (58) 0.8 (19)2000–2005 3.0 1.4 (45) 0.1 (2) 2.1 (68) −0.5 (−15) 2000–2005 5.0 1.1 (21) 0.1 (2) 2.0 (39) 1.9 (38)2005–2010 4.1 1.1 (28) 0.1 (2) 2.3 (58) 0.5 (12) 2005–2010 3.3 1.3 (40) 0.1 (4) 1.6 (49) 0.2 (7)2010–2016 4.0 1.5 (37) 0.1 (3) 2.2 (56) 0.2 (4) 2010–2016 4.2 0.8 (19) 0.1 (2) 0.4 (9) 2.9 (70)1970–2016 4.0 1.3 (33) 0.1 (2) 2.8 (71) −0.2 (−6) 1970–2016 5.2 1.1 (22) 0.1 (1) 2.1 (41) 1.9 (36)
Phili
ppin
es
1970–1975 5.7 2.0 (35) 0.2 (3) 3.3 (58) 0.3 (5)
Sing
apor
e
1970–1975 9.1 2.5 (28) 0.5 (6) 7.3 (80) −1.3 (−14)1975–1980 5.9 1.4 (24) 0.1 (2) 4.8 (82) −0.5 (−8) 1975–1980 8.3 2.3 (27) 0.4 (5) 5.3 (64) 0.3 (3)1980–1985 −1.4 1.4 (−105) 0.2 (−14) 3.8 (−280) −6.8 (498) 1980–1985 6.6 1.4 (20) 0.6 (10) 5.9 (89) −1.3 (−19)1985–1990 5.3 1.0 (19) 0.2 (3) 1.1 (21) 3.0 (57) 1985–1990 8.3 2.1 (25) 0.9 (10) 3.1 (38) 2.2 (26)1990–1995 2.8 0.9 (32) 0.1 (3) 2.3 (82) −0.5 (−17) 1990–1995 8.3 2.1 (25) 0.9 (10) 3.5 (42) 1.9 (23)1995–2000 3.9 0.5 (13) 0.5 (12) 3.0 (77) −0.1 (−2) 1995–2000 5.5 1.1 (20) 0.7 (13) 4.2 (76) −0.5 (−9)2000–2005 4.5 0.8 (18) 0.7 (15) 2.1 (46) 1.0 (21) 2000–2005 4.8 0.5 (11) 0.7 (15) 2.1 (45) 1.4 (30)2005–2010 4.8 0.8 (17) 0.3 (7) 1.8 (38) 1.9 (39) 2005–2010 6.5 2.4 (37) 0.5 (8) 2.1 (32) 1.5 (23)2010–2016 5.9 1.0 (16) 0.2 (4) 2.4 (40) 2.4 (40) 2010–2016 3.9 1.2 (31) 0.6 (14) 2.4 (61) −0.3 (−7)1970–2016 4.2 1.1 (26) 0.3 (6) 2.7 (65) 0.1 (3) 1970–2016 6.7 1.7 (25) 0.6 (10) 4.0 (59) 0.4 (6)
Sri L
anka
1970–1975 2.9 0.8 (28) 0.0 (1) 2.1 (73) −0.1 (−2)
Thai
land
1970–1975 5.5 1.0 (18) 0.1 (2) 3.4 (62) 1.0 (18)1975–1980 5.4 0.8 (16) 0.1 (1) 3.8 (71) 0.7 (12) 1975–1980 7.4 3.0 (41) 0.2 (3) 3.3 (44) 0.9 (13)1980–1985 5.0 0.1 (3) 0.1 (2) 3.0 (60) 1.8 (36) 1980–1985 5.3 1.1 (22) 0.2 (5) 3.4 (64) 0.5 (10)1985–1990 3.3 1.5 (46) 0.0 (0) 1.3 (39) 0.5 (14) 1985–1990 9.8 1.6 (16) 0.4 (4) 3.6 (37) 4.2 (43)1990–1995 5.3 0.4 (7) 0.1 (1) 0.9 (17) 4.0 (75) 1990–1995 8.1 0.8 (9) 0.6 (8) 6.4 (79) 0.3 (4)1995–2000 4.9 1.9 (40) 0.1 (2) 0.5 (10) 2.4 (48) 1995–2000 0.7 −0.2 (−23) 0.3 (45) 3.3 (436) −2.7 (−358)2000–2005 4.0 −0.5 (−12) 0.3 (7) 1.8 (45) 2.4 (60) 2000–2005 5.3 0.1 (1) 0.2 (4) 0.8 (15) 4.2 (79)2005–2010 6.2 0.2 (4) 0.3 (5) 3.7 (60) 1.9 (31) 2005–2010 3.7 0.5 (14) 0.4 (12) 1.4 (38) 1.3 (36)2010–2016 5.7 0.5 (8) 0.1 (2) 5.0 (88) 0.1 (2) 2010–2016 3.0 −0.6 (−20) 0.3 (11) 1.4 (47) 1.9 (62)1970–2016 4.8 0.7 (14) 0.1 (2) 2.5 (53) 1.5 (31) 1970–2016 5.4 0.8 (15) 0.3 (6) 3.0 (55) 1.3 (25)
Viet
nam
1970–1975 1.8 2.1 (119) 0.0 (0) 0.4 (23) −0.8 (−43)
US
1970–1975 2.6 0.6 (23) 0.2 (8) 1.4 (53) 0.4 (16)1975–1980 3.5 1.3 (37) 0.0 (1) 1.3 (38) 0.9 (24) 1975–1980 3.6 1.5 (41) 0.3 (7) 1.2 (34) 0.7 (19)1980–1985 6.2 1.4 (22) 0.1 (1) 1.7 (27) 3.1 (50) 1980–1985 3.3 0.8 (25) 0.4 (13) 1.0 (31) 1.0 (30)1985–1990 4.4 0.7 (17) 0.1 (3) 2.6 (59) 0.9 (21) 1985–1990 3.3 1.0 (31) 0.5 (15) 1.0 (31) 0.7 (22)1990–1995 8.1 0.7 (9) 0.1 (2) 4.0 (49) 3.3 (41) 1990–1995 2.6 0.5 (20) 0.4 (17) 0.7 (26) 1.0 (38)1995–2000 7.3 0.8 (11) 0.2 (3) 6.5 (89) −0.2 (−3) 1995–2000 4.2 1.0 (23) 0.7 (18) 0.9 (21) 1.6 (39)2000–2005 8.0 0.2 (3) 0.2 (2) 6.2 (78) 1.4 (17) 2000–2005 2.5 0.2 (7) 0.6 (23) 0.9 (37) 0.9 (34)2005–2010 6.2 1.2 (19) 0.3 (5) 6.3 (101) −1.6 (−26) 2005–2010 0.8 −0.4 (−47) 0.3 (44) 0.8 (104) 0.0 (−1)2010–2016 5.9 0.2 (3) 0.3 (5) 4.4 (74) 1.0 (17) 2010–2016 2.0 0.8 (41) 0.2 (9) 0.4 (18) 0.6 (31)1970–2016 5.7 0.9 (17) 0.2 (3) 3.7 (65) 0.9 (16) 1970–2016 2.7 0.7 (25) 0.4 (15) 0.9 (33) 0.8 (28)
APO
20
1970–1975 5.0 0.9 (19) 0.3 (6) 4.6 (93) −0.8 (−17)
Asi
a24
1970–1975 5.1 1.2 (23) 0.3 (5) 4.6 (91) −1.0 (−20)1975–1980 4.5 1.2 (27) 0.2 (4) 3.3 (73) −0.2 (−4) 1975–1980 4.8 1.4 (29) 0.2 (4) 3.4 (71) −0.2 (−4)1980–1985 4.7 1.1 (24) 0.2 (5) 2.5 (54) 0.8 (18) 1980–1985 5.4 1.5 (29) 0.2 (4) 2.6 (49) 1.0 (19)1985–1990 5.8 1.0 (18) 0.3 (6) 2.3 (40) 2.1 (36) 1985–1990 6.0 1.2 (20) 0.3 (5) 2.5 (43) 1.9 (32)1990–1995 4.4 0.8 (18) 0.2 (5) 2.5 (58) 0.8 (18) 1990–1995 5.7 0.7 (13) 0.2 (4) 2.7 (47) 2.1 (36)1995–2000 3.1 0.6 (19) 0.3 (9) 2.0 (64) 0.3 (9) 1995–2000 4.4 0.9 (20) 0.2 (5) 2.4 (55) 0.9 (20)2000–2005 4.2 0.7 (16) 0.2 (6) 1.3 (31) 2.0 (47) 2000–2005 5.7 0.8 (14) 0.3 (5) 2.0 (36) 2.6 (45)2005–2010 4.4 0.6 (13) 0.1 (3) 1.6 (37) 2.0 (46) 2005–2010 6.6 0.3 (5) 0.2 (4) 2.9 (45) 3.1 (47)2010–2016 4.0 0.5 (12) 0.1 (3) 1.9 (48) 1.5 (38) 2010–2016 5.4 0.3 (6) 0.2 (3) 3.3 (62) 1.6 (29)1970–2016 4.4 0.8 (18) 0.2 (5) 2.5 (55) 0.9 (21) 1970–2016 5.4 0.9 (17) 0.2 (4) 3.0 (54) 1.3 (25)
East
Asi
a
1970–1975 5.1 1.1 (23) 0.4 (8) 5.4 (107) −1.9 (−38)
Sout
h A
sia
1970–1975 2.5 1.5 (59) 0.0 (1) 1.5 (59) −0.5 (−19)1975–1980 5.5 1.4 (25) 0.2 (4) 3.2 (57) 0.7 (13) 1975–1980 3.5 1.6 (45) 0.0 (1) 1.7 (49) 0.2 (5)1980–1985 6.0 1.7 (28) 0.3 (4) 2.4 (39) 1.7 (28) 1980–1985 5.3 1.4 (27) 0.0 (1) 1.7 (32) 2.1 (40)1985–1990 6.2 1.2 (20) 0.4 (7) 2.6 (41) 2.0 (32) 1985–1990 5.8 1.2 (22) 0.1 (1) 1.8 (31) 2.7 (46)1990–1995 5.6 0.6 (11) 0.2 (4) 2.4 (43) 2.3 (42) 1990–1995 5.1 1.3 (25) 0.1 (1) 1.9 (37) 1.9 (37)1995–2000 4.6 0.9 (20) 0.3 (6) 2.0 (43) 1.4 (31) 1995–2000 5.4 1.0 (19) 0.1 (2) 2.2 (40) 2.1 (39)2000–2005 5.6 0.7 (13) 0.3 (6) 1.9 (33) 2.7 (47) 2000–2005 6.1 1.1 (18) 0.1 (2) 2.2 (36) 2.6 (43)2005–2010 6.8 0.1 (1) 0.2 (4) 2.7 (40) 3.8 (56) 2005–2010 7.1 0.7 (9) 0.2 (3) 3.5 (50) 2.7 (38)2010–2016 5.5 0.2 (3) 0.2 (3) 3.1 (56) 2.1 (38) 2010–2016 6.1 0.6 (10) 0.2 (3) 3.9 (65) 1.3 (22)1970–2016 5.6 0.9 (15) 0.3 (5) 2.8 (50) 1.7 (29) 1970–2016 5.2 1.1 (22) 0.1 (2) 2.3 (44) 1.7 (32)
ASE
AN
1970–1975 6.6 1.4 (22) 0.1 (2) 3.8 (58) 1.2 (18)
ASE
AN
6
1970–1975 7.2 1.5 (21) 0.1 (2) 4.1 (57) 1.5 (21)1975–1980 7.2 1.4 (20) 0.2 (3) 4.8 (67) 0.8 (11) 1975–1980 7.5 1.5 (20) 0.2 (3) 4.9 (66) 0.8 (11)1980–1985 3.9 1.3 (34) 0.2 (6) 5.1 (131) −2.8 (−71) 1980–1985 3.7 1.3 (36) 0.2 (7) 5.1 (140) −3.0 (−83)1985–1990 7.0 1.1 (16) 0.3 (4) 3.7 (54) 1.9 (27) 1985–1990 7.5 1.2 (16) 0.3 (4) 3.7 (50) 2.3 (31)1990–1995 7.2 0.8 (11) 0.4 (5) 5.1 (71) 0.9 (13) 1990–1995 7.3 0.8 (11) 0.4 (5) 5.2 (71) 0.9 (13)1995–2000 2.4 0.7 (30) 0.3 (13) 4.3 (180) −3.0 (−123) 1995–2000 1.9 0.6 (31) 0.3 (17) 4.2 (216) −3.2 (−164)2000–2005 5.1 0.5 (10) 0.3 (6) 2.3 (46) 1.9 (38) 2000–2005 4.8 0.6 (12) 0.3 (7) 2.1 (44) 1.8 (37)2005–2010 5.2 1.0 (20) 0.4 (7) 2.9 (56) 0.9 (17) 2005–2010 5.0 1.0 (20) 0.4 (8) 2.6 (52) 1.0 (20)2010–2016 4.9 0.5 (9) 0.3 (6) 3.4 (70) 0.7 (15) 2010–2016 4.7 0.5 (11) 0.3 (6) 3.2 (67) 0.8 (16)1970–2016 5.5 1.0 (18) 0.3 (5) 3.9 (72) 0.3 (5) 1970–2016 5.5 1.0 (18) 0.3 (5) 3.9 (71) 0.3 (6)
CLM
V
1970–1975 2.2 1.4 (65) 0.0 (1) 1.0 (47) −0.3 (−13)1975–1980 4.5 1.1 (24) 0.1 (2) 2.5 (56) 0.8 (19)1980–1985 5.6 1.1 (19) 0.1 (2) 3.4 (60) 1.0 (18)1985–1990 1.8 0.7 (41) 0.1 (7) 2.8 (158) −1.9 (−106)1990–1995 6.9 0.7 (11) 0.1 (2) 3.6 (53) 2.4 (35)1995–2000 6.9 0.9 (13) 0.2 (3) 6.3 (92) −0.6 (−9)2000–2005 7.5 0.4 (5) 0.2 (3) 6.1 (80) 0.8 (11)2005–2010 6.3 1.0 (16) 0.3 (5) 6.6 (105) −1.6 (−26)2010–2016 5.6 0.3 (5) 0.3 (6) 5.6 (100) −0.6 (−11)1970–2016 5.2 0.8 (16) 0.2 (3) 4.2 (81) 0.0 (0)
Unit: Percentage (average annual growth rate, contribution share in parentheses).Source: APO Productivity Database 2018. Note: See footnote 63 for the country-exception in the country groups.
©20
18 A
sian
Prod
uctiv
ity O
rgan
izat
ion

158
Appendix
Table 19 Role of TFP and Capital Deepening in Labor Productivity Growth
LaborProductivity
Capital deepening TFP LaborProductivity
Capital deepening TFPIT Non-IT IT Non-IT
Bang
lade
sh
1970–1975 −2.4 0.0 (−1) 0.1 (−2) −2.5 (103)
Brun
ei
1970–1975 3.0 −0.6 (−20) −2.0 (−66) 5.6 (185) 1975–1980 1.3 0.0 (3) −0.5 (−37) 1.7 (135) 1975–1980 4.2 1.0 (25) −3.4 (−80) 6.5 (155)1980–1985 1.0 0.0 (4) 0.4 (43) 0.5 (52) 1980–1985 −8.2 0.5 (−6) 2.8 (−34) −11.5 (140)1985–1990 3.0 0.1 (3) 2.0 (68) 0.9 (29) 1985–1990 −6.4 −0.4 (6) 1.3 (−21) −7.4 (115)1990–1995 1.3 0.1 (8) 1.1 (87) 0.1 (5) 1990–1995 0.3 0.9 (252) 4.7 (1396) −5.2 (−1548)1995–2000 3.1 0.1 (5) 2.9 (93) 0.1 (2) 1995–2000 −2.5 0.4 (−17) 1.2 (−47) −4.1 (164) 2000–2005 3.1 0.1 (4) 3.4 (108) −0.4 (−12) 2000–2005 −0.7 0.2 (−33) −0.1 (16) −0.8 (117) 2005–2010 3.6 0.2 (5) 3.3 (93) 0.1 (2) 2005–2010 −1.8 0.3 (−19) 0.0 (−2) −2.2 (121)2010–2016 5.0 0.2 (4) 3.9 (76) 1.0 (19) 2010–2016 −1.7 1.1 (−68) 2.1 (−126) −4.9 (294)1970–2016 2.2 0.1 (5) 1.9 (87) 0.2 (8) 1970–2016 −1.5 0.4 (−27) 0.8 (−51) −2.7 (177)
Cam
bodi
a
1970–1975
Chin
a
1970–1975 2.9 0.0 (1) 2.8 (95) 0.1 (4)1975–1980 1975–1980 3.5 0.0 (1) 2.7 (76) 0.8 (23)1980–1985 1980–1985 6.6 0.0 (1) 1.8 (27) 4.8 (72)1985–1990 1985–1990 5.1 0.1 (2) 3.3 (64) 1.8 (35)1990–1995 5.0 0.1 (2) −0.5 (−10) 5.4 (108) 1990–1995 10.3 0.1 (1) 3.1 (30) 7.1 (69)1995–2000 2.4 0.1 (5) −0.1 (−3) 2.3 (98) 1995–2000 6.3 0.2 (3) 3.4 (55) 2.6 (42)2000–2005 4.1 0.1 (3) 2.0 (49) 1.9 (48) 2000–2005 7.7 0.6 (8) 3.8 (49) 3.2 (42)2005–2010 3.1 0.2 (6) 5.1 (164) −2.2 (−70) 2005–2010 10.5 0.5 (5) 5.8 (55) 4.2 (40)2010–2016 4.4 0.1 (3) 4.0 (92) 0.2 (5) 2010–2016 7.1 0.3 (4) 4.8 (67) 2.0 (29)1970–2016 3.6 0.1 (4) 2.5 (69) 1.0 (27) 1970–2016 6.7 0.2 (3) 3.5 (53) 2.9 (44)
ROC
1970–1975 5.9 0.5 (8) 5.7 (96) −0.3 (−4)
Fiji
1970–1975 1.9 0.1 (4) 1.3 (68) 0.5 (29)1975–1980 7.4 0.4 (5) 4.3 (58) 2.8 (38) 1975–1980 1.0 0.0 (4) 1.6 (165) −0.7 (−69)1980–1985 4.7 0.3 (7) 3.4 (71) 1.0 (22) 1980–1985 −1.7 0.0 (−2) 1.2 (−71) −3.0 (173)1985–1990 7.1 0.3 (4) 2.7 (38) 4.1 (58) 1985–1990 1.9 0.1 (4) −0.6 (−31) 2.4 (127)1990–1995 5.6 0.3 (5) 3.2 (58) 2.1 (37) 1990–1995 −0.4 0.1 (−33) −0.2 (50) −0.4 (83)1995–2000 5.2 0.7 (13) 3.3 (63) 1.3 (24) 1995–2000 1.2 0.0 (−1) 1.0 (84) 0.2 (17)2000–2005 3.7 0.5 (15) 2.2 (60) 0.9 (26) 2000–2005 −0.3 0.1 (−18) −0.4 (113) 0.0 (5)2005–2010 3.8 0.1 (2) 1.6 (41) 2.1 (56) 2005–2010 1.7 0.2 (11) 0.9 (55) 0.6 (34)2010–2016 0.7 0.0 (1) 0.3 (46) 0.4 (53) 2010–2016 1.3 0.0 (3) −1.0 (−80) 2.3 (177)1970–2016 4.8 0.3 (7) 2.9 (60) 1.6 (33) 1970–2016 0.7 0.1 (10) 0.4 (54) 0.3 (37)
Hon
g Ko
ng
1970–1975 2.4 0.2 (8) 1.5 (62) 0.7 (29)
Indi
a
1970–1975 0.4 0.0 (3) 0.6 (153) −0.2 (−56)1975–1980 7.1 0.2 (3) 2.1 (29) 4.8 (67) 1975–1980 0.6 0.0 (3) 0.8 (121) −0.2 (−24)1980–1985 3.9 0.3 (8) 3.3 (85) 0.3 (7) 1980–1985 3.0 0.0 (1) 0.8 (29) 2.1 (70)1985–1990 7.1 0.5 (7) 2.9 (40) 3.8 (53) 1985–1990 3.9 0.0 (1) 1.0 (27) 2.9 (72)1990–1995 4.0 0.4 (11) 2.8 (71) 0.8 (19) 1990–1995 3.2 0.1 (2) 1.2 (37) 1.9 (61)1995–2000 −0.2 0.6 (−293) 1.6 (−738) −2.5 (1130) 1995–2000 4.1 0.1 (3) 1.5 (37) 2.5 (60)2000–2005 3.1 0.5 (15) 1.0 (33) 1.6 (52) 2000–2005 4.6 0.1 (3) 1.4 (31) 3.1 (67)2005–2010 3.5 0.3 (9) 1.2 (34) 2.0 (58) 2005–2010 6.9 0.2 (3) 3.3 (47) 3.5 (50)2010–2016 2.4 0.2 (9) 0.8 (33) 1.4 (58) 2010–2016 5.4 0.2 (4) 3.7 (68) 1.5 (28)1970–2016 3.7 0.4 (10) 1.9 (51) 1.4 (39) 1970–2016 3.6 0.1 (3) 1.6 (45) 1.9 (52)
Indo
nesi
a
1970–1975 4.2 0.0 (0) 1.6 (38) 2.6 (61)
Iran
1970–1975 7.3 0.1 (1) 4.7 (64) 2.6 (35)1975–1980 4.9 0.1 (3) 3.9 (80) 0.8 (17) 1975–1980 −6.2 0.0 (−1) 5.1 (−82) −11.4 (182)1980–1985 0.6 0.1 (24) 3.4 (609) −3.0 (−533) 1980–1985 2.1 0.0 (2) 1.8 (84) 0.3 (14)1985–1990 4.8 0.2 (4) 3.1 (65) 1.5 (31) 1985–1990 −1.8 0.0 (−3) −1.3 (71) −0.6 (32)1990–1995 6.3 0.3 (4) 4.4 (71) 1.5 (25) 1990–1995 1.6 0.1 (5) −1.2 (−75) 2.7 (171)1995–2000 −1.4 0.2 (−12) 3.4 (−242) −5.0 (354) 1995–2000 0.9 0.1 (8) −1.8 (−204) 2.6 (296)2000–2005 3.3 0.2 (5) 1.9 (59) 1.2 (36) 2000–2005 3.0 0.2 (7) 0.1 (2) 2.7 (91)2005–2010 1.8 0.2 (10) 1.1 (63) 0.5 (26) 2005–2010 5.9 0.2 (4) 4.5 (77) 1.1 (19)2010–2016 4.0 0.2 (5) 3.3 (84) 0.4 (11) 2010–2016 −0.1 0.1 (−83) 0.9 (−1010) −1.0 (1194)1970–2016 3.2 0.2 (5) 2.9 (93) 0.1 (2) 1970–2016 1.4 0.1 (7) 1.4 (103) −0.1 (−9)
Japa
n
1970–1975 5.1 0.5 (10) 5.8 (112) −1.1 (−22)
Kore
a
1970–1975 6.5 0.2 (3) 5.9 (90) 0.4 (7)1975–1980 3.6 0.3 (7) 2.3 (63) 1.1 (30) 1975–1980 6.3 0.5 (8) 8.0 (127) −2.2 (−35)1980–1985 3.5 0.3 (9) 1.6 (46) 1.6 (45) 1980–1985 6.6 0.4 (6) 4.2 (63) 2.1 (31)1985–1990 4.2 0.5 (13) 1.6 (39) 2.0 (48) 1985–1990 6.5 0.6 (9) 3.6 (55) 2.3 (36)1990–1995 1.9 0.3 (18) 1.9 (97) −0.3 (−14) 1990–1995 6.2 0.4 (7) 4.6 (74) 1.2 (19)1995–2000 2.1 0.4 (19) 1.2 (57) 0.5 (24) 1995–2000 5.4 0.6 (11) 3.8 (72) 0.9 (17)2000–2005 1.8 0.3 (18) 0.4 (22) 1.1 (60) 2000–2005 4.2 0.6 (14) 2.4 (57) 1.2 (29)2005–2010 0.8 0.2 (22) 0.2 (20) 0.4 (58) 2005–2010 4.6 0.2 (4) 2.4 (51) 2.0 (44)2010–2016 1.0 0.1 (6) −0.4 (−37) 1.4 (130) 2010–2016 1.5 0.1 (4) 1.2 (82) 0.2 (15)1970–2016 2.6 0.3 (12) 1.6 (60) 0.7 (28) 1970–2016 5.2 0.4 (7) 3.9 (75) 0.9 (17)
Lao
PDR
1970–1975 3.0 0.0 (0) 1.8 (61) 1.2 (38)
Mal
aysi
a
1970–1975 4.5 0.1 (1) 3.6 (81) 0.8 (18)1975–1980 1.5 0.0 (2) 2.8 (186) −1.3 (−88) 1975–1980 4.9 0.1 (2) 3.7 (75) 1.1 (23)1980–1985 5.2 0.0 (1) 1.9 (36) 3.3 (63) 1980–1985 1.7 0.1 (5) 5.0 (293) −3.4 (−198)1985–1990 0.4 0.1 (18) 1.4 (359) −1.1 (−277) 1985–1990 3.6 0.1 (4) 1.5 (41) 2.0 (55)1990–1995 2.5 0.2 (7) 2.5 (103) −0.2 (−10) 1990–1995 6.5 0.3 (4) 4.8 (74) 1.4 (22)1995–2000 2.6 0.1 (6) 3.3 (126) −0.8 (−32) 1995–2000 1.1 0.4 (42) 3.2 (299) −2.6 (−241)2000–2005 5.1 0.3 (5) 2.4 (47) 2.5 (48) 2000–2005 3.1 0.7 (21) 1.0 (31) 1.5 (48)2005–2010 5.2 0.3 (5) 1.7 (32) 3.2 (62) 2005–2010 2.2 0.6 (26) 0.4 (18) 1.2 (57)2010–2016 5.3 0.6 (10) 4.1 (78) 0.6 (12) 2010–2016 2.3 0.2 (11) 1.4 (62) 0.6 (27)1970–2016 3.5 0.2 (5) 2.5 (71) 0.8 (23) 1970–2016 3.3 0.3 (9) 2.7 (82) 0.3 (9)
Mon
golia
1970–1975 5.1 0.1 (1) 4.3 (85) 0.7 (14)
Mya
nmar
1970–1975 0.2 0.0 (10) 1.4 (619) −1.2 (−530)1975–1980 3.2 0.1 (4) 4.4 (137) −1.3 (−41) 1975–1980 2.7 0.1 (5) 4.2 (157) −1.7 (−63)1980–1985 4.1 0.1 (3) 4.3 (106) −0.4 (−9) 1980–1985 2.0 0.2 (8) 5.8 (294) −4.0 (−203)1985–1990 −0.8 0.1 (−10) 0.9 (−109) −1.7 (219) 1985–1990 −3.5 0.1 (−2) 1.9 (−55) −5.5 (157)1990–1995 −1.5 0.1 (−5) 1.1 (−73) −2.7 (178) 1990–1995 2.8 0.1 (3) 1.5 (54) 1.2 (43)1995–2000 2.6 0.1 (5) −0.5 (−20) 3.0 (115) 1995–2000 3.2 0.3 (9) 4.8 (151) −1.9 (−60)2000–2005 2.8 0.2 (7) −2.4 (−86) 5.1 (180) 2000–2005 4.1 0.3 (8) 5.1 (122) −1.3 (−30)2005–2010 4.9 0.4 (8) 2.5 (51) 2.0 (41) 2005–2010 4.8 0.2 (5) 6.8 (142) −2.2 (−47)2010–2016 6.6 0.2 (3) 3.3 (50) 3.0 (46) 2010–2016 2.6 0.2 (9) 6.7 (255) −4.3 (−165)1970–2016 3.1 0.2 (5) 2.0 (65) 0.9 (29) 1970–2016 2.1 0.2 (8) 4.3 (203) −2.4 (−112)
©20
18 A
sian
Prod
uctiv
ity O
rgan
izat
ion

159
A.9 Supplementary Tables
App.
Unit: Percentage (average annual growth rate, contribution share in parentheses).Source: APO Productivity Database 2018. Note: See footnote 63 for the country−exception in the country groups.
LaborProductivity
Capital deepening TFP LaborProductivity
Capital deepening TFPIT Non-IT IT Non-IT
Nep
al
1970–1975 −0.1 0.1 (−77) 1.7 (−2331) −1.8 (2508)
Paki
stan
1970–1975 0.5 0.0 (3) 0.4 (82) 0.1 (15) 1975–1980 −0.2 0.1 (−53) 2.5 (−1408) −2.8 (1561) 1975–1980 4.1 0.0 (0) 1.4 (35) 2.7 (65) 1980–1985 2.4 0.1 (3) 2.9 (120) −0.6 (−23) 1980–1985 5.2 0.0 (0) 1.3 (26) 3.9 (74)1985–1990 3.8 0.0 (1) 2.6 (68) 1.2 (31) 1985–1990 4.2 0.1 (2) 1.8 (42) 2.4 (57)1990–1995 2.2 0.0 (1) 1.8 (83) 0.4 (16) 1990–1995 3.8 0.1 (2) 1.9 (49) 1.9 (49)1995–2000 2.8 0.1 (2) 1.7 (60) 1.1 (38) 1995–2000 2.6 0.0 (1) 1.7 (66) 0.8 (33)2000–2005 0.7 0.1 (8) 1.1 (157) −0.5 (−65) 2000–2005 2.5 0.1 (4) 0.5 (20) 1.9 (76)2005–2010 1.9 0.1 (4) 1.3 (69) 0.5 (27) 2005–2010 0.0 0.1 (−658) −0.3 (2571) 0.2 (−1813)2010–2016 1.4 0.1 (7) 1.1 (81) 0.2 (12) 2010–2016 2.2 0.0 (2) −0.8 (−34) 2.9 (132)1970–2016 1.7 0.1 (4) 1.8 (111) −0.2 (−15) 1970–2016 2.8 0.0 (2) 0.8 (30) 1.9 (68)
Phili
ppin
es
1970–1975 1.2 0.1 (6) 0.8 (72) 0.3 (22)
Sing
apor
e
1970–1975 4.3 0.4 (11) 5.1 (120) −1.3 (−30)1975–1980 2.4 0.1 (3) 2.8 (117) −0.5 (−20) 1975–1980 3.2 0.3 (9) 2.7 (83) 0.3 (8)1980–1985 −5.0 0.1 (−3) 1.7 (−34) −6.8 (137) 1980–1985 3.3 0.5 (16) 4.1 (122) −1.3 (−38)1985–1990 2.8 0.1 (4) −0.3 (−12) 3.0 (109) 1985–1990 3.4 0.6 (19) 0.5 (16) 2.2 (65)1990–1995 0.5 0.0 (9) 1.0 (183) −0.5 (−92) 1990–1995 3.6 0.6 (17) 1.1 (30) 1.9 (53)1995–2000 2.3 0.4 (19) 1.9 (84) −0.1 (−3) 1995–2000 3.1 0.6 (19) 2.9 (96) −0.5 (−15)2000–2005 1.8 0.5 (30) 0.3 (15) 1.0 (54) 2000–2005 3.7 0.6 (17) 1.6 (44) 1.4 (39)2005–2010 2.4 0.2 (9) 0.4 (14) 1.9 (76) 2005–2010 0.8 0.2 (23) −0.9 (−105) 1.5 (181)2010–2016 3.6 0.1 (4) 1.1 (30) 2.4 (66) 2010–2016 1.1 0.4 (36) 1.0 (87) −0.3 (−23)1970–2016 1.4 0.2 (14) 1.1 (77) 0.1 (9) 1970–2016 2.9 0.5 (17) 2.0 (69) 0.4 (15)
Sri L
anka
1970–1975 1.1 0.0 (2) 1.2 (103) −0.1 (−5)
Thai
land
1970–1975 3.1 0.1 (2) 2.0 (64) 1.0 (33)1975–1980 3.6 0.1 (2) 2.9 (80) 0.7 (18) 1975–1980 0.9 0.1 (13) −0.1 (−15) 0.9 (102)1980–1985 4.7 0.1 (2) 2.8 (60) 1.8 (38) 1980–1985 3.1 0.2 (7) 2.4 (76) 0.5 (17)1985–1990 0.2 0.0 (−2) −0.2 (−95) 0.5 (197) 1985–1990 6.3 0.3 (5) 1.8 (28) 4.2 (67) 1990–1995 4.5 0.1 (1) 0.5 (11) 4.0 (88) 1990–1995 6.2 0.6 (9) 5.3 (85) 0.3 (6)1995–2000 1.1 0.1 (6) −1.4 (−127) 2.4 (222) 1995–2000 1.2 0.4 (31) 3.5 (302) −2.7 (−232)2000–2005 4.8 0.3 (6) 2.1 (44) 2.4 (49) 2000–2005 5.2 0.2 (4) 0.7 (14) 4.2 (82)2005–2010 5.5 0.3 (5) 3.3 (59) 1.9 (35) 2005–2010 2.4 0.4 (16) 0.7 (28) 1.3 (56)2010–2016 4.2 0.1 (2) 4.1 (96) 0.1 (2) 2010–2016 4.5 0.4 (9) 2.2 (50) 1.9 (41)1970–2016 3.3 0.1 (3) 1.7 (52) 1.5 (44) 1970–2016 3.7 0.3 (8) 2.1 (56) 1.3 (36)
Viet
nam
1970–1975 −1.9 0.0 (0) −1.1 (60) −0.8 (40)
US
1970–1975 1.6 0.2 (12) 1.0 (62) 0.4 (25)1975–1980 0.6 0.0 (4) −0.3 (−42) 0.9 (137) 1975–1980 1.1 0.2 (18) 0.3 (22) 0.7 (59)1980–1985 2.7 0.1 (2) −0.5 (−17) 3.1 (115) 1980–1985 1.8 0.4 (22) 0.4 (24) 1.0 (54)1985–1990 1.4 0.1 (7) 0.4 (27) 0.9 (66) 1985–1990 1.5 0.4 (29) 0.3 (23) 0.7 (48)1990–1995 5.7 0.1 (2) 2.3 (41) 3.3 (57) 1990–1995 1.7 0.4 (23) 0.3 (19) 1.0 (58)1995–2000 4.7 0.2 (3) 4.8 (102) −0.2 (−5) 1995–2000 2.5 0.7 (26) 0.2 (9) 1.6 (64)2000–2005 7.3 0.2 (2) 5.8 (79) 1.4 (19) 2000–2005 2.2 0.5 (25) 0.8 (36) 0.9 (39)2005–2010 2.8 0.3 (10) 4.2 (147) −1.6 (−57) 2005–2010 1.4 0.4 (26) 1.0 (75) 0.0 (0)2010–2016 5.5 0.3 (6) 4.1 (76) 1.0 (19) 2010–2016 0.5 0.1 (23) −0.2 (−40) 0.6 (117)1970–2016 3.3 0.1 (4) 2.2 (68) 0.9 (27) 1970–2016 1.6 0.4 (23) 0.5 (29) 0.8 (48)
APO
20
1970–1975 3.2 0.3 (8) 3.8 (118) −0.8 (−27)
Asi
a24
1970–1975 2.7 0.2 (9) 3.5 (128) −1.0 (−37)1975–1980 2.2 0.2 (7) 2.2 (102) −0.2 (−9) 1975–1980 2.1 0.1 (7) 2.2 (102) −0.2 (−8)1980–1985 2.6 0.2 (7) 1.6 (61) 0.8 (32) 1980–1985 2.5 0.2 (6) 1.3 (54) 1.0 (40)1985–1990 3.8 0.3 (8) 1.4 (37) 2.1 (54) 1985–1990 3.7 0.3 (7) 1.5 (41) 1.9 (52)1990–1995 2.8 0.2 (7) 1.8 (65) 0.8 (28) 1990–1995 4.3 0.2 (4) 2.1 (48) 2.1 (48)1995–2000 2.0 0.2 (12) 1.4 (74) 0.3 (14) 1995–2000 2.7 0.2 (7) 1.6 (61) 0.9 (32)2000–2005 2.9 0.2 (7) 0.7 (23) 2.0 (70) 2000–2005 4.1 0.2 (6) 1.3 (32) 2.6 (62)2005–2010 3.2 0.1 (3) 1.0 (33) 2.0 (64) 2005–2010 5.9 0.2 (4) 2.6 (44) 3.1 (52)2010–2016 3.0 0.1 (3) 1.4 (47) 1.5 (50) 2010–2016 4.8 0.2 (3) 3.0 (64) 1.6 (33)1970–2016 2.9 0.2 (7) 1.7 (60) 0.9 (33) 1970–2016 3.7 0.2 (5) 2.2 (58) 1.3 (36)
East
Asi
a
1970–1975 2.8 0.4 (13) 4.4 (155) −1.9 (−67)
Sout
h A
sia
1970–1975 0.2 0.0 (7) 0.7 (304) −0.5 (−210)1975–1980 3.0 0.2 (7) 2.1 (69) 0.7 (24) 1975–1980 1.1 0.0 (2) 0.9 (81) 0.2 (17)1980–1985 3.0 0.2 (7) 1.1 (37) 1.7 (56) 1980–1985 3.1 0.0 (1) 1.0 (31) 2.1 (68)1985–1990 3.9 0.4 (9) 1.5 (40) 2.0 (51) 1985–1990 3.9 0.0 (1) 1.2 (30) 2.7 (69)1990–1995 4.5 0.2 (5) 1.9 (43) 2.3 (52) 1990–1995 3.1 0.1 (2) 1.2 (38) 1.9 (60)1995–2000 3.0 0.2 (8) 1.3 (45) 1.4 (47) 1995–2000 3.8 0.1 (3) 1.5 (40) 2.1 (57)2000–2005 4.2 0.3 (7) 1.3 (30) 2.7 (63) 2000–2005 4.2 0.1 (3) 1.4 (34) 2.6 (63) 2005–2010 6.7 0.2 (4) 2.7 (40) 3.8 (57) 2005–2010 5.9 0.2 (3) 3.0 (51) 2.7 (46)2010–2016 5.2 0.2 (3) 2.9 (57) 2.1 (40) 2010–2016 5.0 0.2 (4) 3.5 (70) 1.3 (27) 1970–2016 4.1 0.3 (6) 2.2 (53) 1.7 (41) 1970–2016 3.4 0.1 (3) 1.6 (48) 1.7 (49)
ASE
AN
1970–1975 3.0 0.1 (2) 1.7 (57) 1.2 (41)
ASE
AN
6
1970–1975 3.4 0.1 (2) 1.9 (55) 1.5 (43)1975–1980 3.4 0.1 (4) 2.5 (73) 0.8 (23) 1975–1980 3.4 0.2 (5) 2.4 (72) 0.8 (23) 1980–1985 0.5 0.2 (38) 3.1 (609) −2.8 (−547) 1980–1985 0.3 0.2 (71) 3.1 (1101) −3.0 (−1071)1985–1990 4.1 0.2 (5) 2.0 (49) 1.9 (46) 1985–1990 4.5 0.2 (5) 2.0 (44) 2.3 (51)1990–1995 5.2 0.3 (6) 4.0 (76) 0.9 (18) 1990–1995 5.3 0.3 (7) 4.1 (76) 0.9 (18)1995–2000 0.5 0.3 (52) 3.2 (627) −3.0 (−580) 1995–2000 0.4 0.3 (76) 3.3 (879) −3.2 (−854)2000–2005 3.7 0.3 (8) 1.5 (40) 1.9 (52) 2000–2005 3.3 0.3 (9) 1.2 (38) 1.8 (54)2005–2010 2.3 0.3 (12) 1.1 (49) 0.9 (39) 2005–2010 2.2 0.3 (13) 0.9 (40) 1.0 (46)2010–2016 3.7 0.3 (7) 2.7 (74) 0.7 (19) 2010–2016 3.5 0.3 (7) 2.4 (71) 0.8 (22) 1970–2016 2.9 0.2 (8) 2.4 (82) 0.3 (10) 1970–2016 2.9 0.2 (8) 2.4 (81) 0.3 (11)
CLM
V
1970–1975 −1.1 0.0 (0) −0.8 (74) −0.3 (26)1975–1980 1.6 0.1 (4) 0.7 (45) 0.8 (52)1980–1985 2.3 0.1 (4) 1.2 (51) 1.0 (45)1985–1990 −0.9 0.1 (−10) 0.9 (−96) −1.9 (206)1990–1995 4.5 0.1 (2) 2.0 (45) 2.4 (53)1995–2000 4.1 0.2 (5) 4.5 (110) −0.6 (−15)2000–2005 6.3 0.2 (4) 5.2 (83) 0.8 (13)2005–2010 3.3 0.3 (8) 4.7 (141) −1.6 (−48)2010–2016 4.8 0.3 (6) 5.1 (107) −0.6 (−13) 1970–2016 2.8 0.2 (5) 2.7 (95) 0.0 (0)
©20
18 A
sian
Prod
uctiv
ity O
rgan
izat
ion

160
Appendix
Table 20 Energy Productivity Level_GDP at constant basic prices per energy consumption, using 2011 PPP, reference year 2016
Unit: Thousands of US dollars per toe (tonne of oil equivalent) (as of 2016).Sources: Official national accounts in each country, including author adjustments; IEA, Energy Balances of OECD Countries 2017; IEA, Energy Balances of Non-OECD Countries 2017; APO Productivity Database 2018.
1980 1990 2000 2010 2015Hong Kong 28.7 100.0 Hong Kong 30.6 100.0 Singapore 25.5 100.0 Hong Kong 42.9 100.0 Hong Kong 45.3 100.0Singapore 23.8 82.7 Singapore 21.2 69.3 Hong Kong 25.1 98.6 Singapore 24.1 56.2 Singapore 26.9 59.2Iran 14.9 51.7 Japan 13.6 44.3 Sri Lanka 14.1 55.5 Philippines 22.6 52.8 Philippines 24.2 53.3Malaysia 13.9 48.5 Malaysia 13.0 42.6 Philippines 14.1 55.3 Sri Lanka 19.7 45.9 Sri Lanka 23.6 52.0Philippines 11.9 41.6 Thailand 12.6 41.2 Bangladesh 13.9 54.7 Bangladesh 15.9 37.2 Bangladesh 17.7 39.0Thailand 11.3 39.3 Philippines 12.2 39.9 Japan 13.5 53.1 Japan 15.3 35.7 Indonesia 17.4 38.4Bangladesh 11.0 38.1 Sri Lanka 11.8 38.4 ROC 13.1 51.4 Indonesia 14.7 34.2 Japan 17.1 37.6Japan 10.7 37.1 Bangladesh 11.7 38.2 Malaysia 12.4 48.7 Malaysia 14.4 33.7 ROC 15.9 35.0Sri Lanka 9.6 33.5 ROC 11.3 36.9 Thailand 11.2 44.1 ROC 14.1 32.9 Malaysia 15.4 34.0Indonesia 9.4 32.9 Indonesia 10.8 35.1 Indonesia 10.8 42.4 India 11.4 26.6 India 13.0 28.6ROC 8.2 28.4 Iran 9.7 31.7 Pakistan 9.9 39.0 Pakistan 11.0 25.6 Pakistan 12.1 26.6Pakistan 6.4 22.2 Pakistan 8.3 27.1 India 8.5 33.3 Thailand 10.5 24.4 Thailand 10.5 23.2Korea 6.1 21.1 Korea 7.4 24.3 Iran 8.3 32.5 Korea 9.4 21.8 Mongolia 10.4 22.9India 5.3 18.4 India 6.5 21.1 Vietnam 7.6 29.7 Iran 9.0 20.9 Korea 9.8 21.6Vietnam 3.9 13.7 Vietnam 5.5 17.8 Korea 7.4 29.2 Cambodia 8.2 19.2 China 9.2 20.2Nepal 3.6 12.4 Nepal 4.4 14.4 Mongolia 7.1 28.0 Vietnam 8.0 18.7 Cambodia 9.0 19.8China 1.4 4.8 Mongolia 3.4 11.2 Cambodia 5.9 23.2 China 7.6 17.7 Vietnam 8.9 19.6
China 2.5 8.1 China 5.6 22.1 Mongolia 7.4 17.2 Iran 8.0 17.6Nepal 5.1 20.2 Nepal 5.8 13.6 Nepal 6.1 13.4
(region) (region) (region) (region) (region)APO20 9.0 31.5 APO20 10.5 34.4 APO20 11.0 43.2 APO20 12.9 30.0 APO20 14.1 31.0Asia24 5.8 20.2 Asia24 7.3 23.8 Asia24 9.2 36.2 Asia24 10.8 25.1 Asia24 12.2 26.8Asia30 6.6 23.1 Asia30 7.7 25.1 Asia30 9.5 37.4 Asia30 10.8 25.2 Asia30 12.2 26.8East Asia 4.8 16.7 East Asia 6.5 21.3 East Asia 8.7 34.3 East Asia 9.9 23.2 East Asia 11.4 25.2South Asia 5.9 20.6 South Asia 7.2 23.6 South Asia 9.3 36.6 South Asia 12.1 28.2 South Asia 13.7 30.2ASEAN 10.2 35.7 ASEAN 11.4 37.2 ASEAN 11.7 46.1 ASEAN 14.1 32.9 ASEAN 15.5 34.2ASEAN6 11.4 39.6 ASEAN6 12.2 39.9 ASEAN6 12.3 48.2 ASEAN6 14.9 34.7 ASEAN6 16.6 36.5CLMV 5.5 19.0 CLMV 6.6 21.6 CLMV 8.5 33.3 CLMV 10.2 23.9 CLMV 10.9 24.0GCC 31.8 110.6 GCC 16.9 55.3 GCC 15.5 60.8 GCC 11.8 27.6 GCC 12.2 26.9(reference) (reference) (reference) (reference) (reference)US 5.3 18.6 US 7.5 24.5 US 8.8 34.6 US 10.6 24.7 US 11.7 25.9EU15 9.1 31.9 EU15 11.2 36.6 EU15 12.6 49.6 EU15 14.2 33.0 EU15 16.2 35.7
EU28 12.3 48.2 EU28 13.8 32.1 EU28 15.8 34.8Australia 8.0 27.8 Australia 8.9 28.9 Australia 10.2 40.1 Australia 12.6 29.4 Australia 13.6 30.1Turkey 13.3 46.4 Turkey 14.5 47.3 Turkey 14.4 56.5 Turkey 15.9 37.0 Turkey 18.6 41.1
(%) (%) (%) (%) (%)
©20
18 A
sian
Prod
uctiv
ity O
rgan
izat
ion

161
A.9 Supplementary Tables
App.
Unit: Percentage.Sources: Official national accounts in each country, including author adjustments.Note: Services are defined as the total of industries 6–9 and Others are defined as the total of industries 2, 4, and 5 of nine industries, which consists of 1–agriculture; 2–mining; 3–manufacturing; 4–electricity, gas, and water supply; 5–construction; 6–wholesale and retail trade, ho-tels, and restaurants; 7–transport, storage, and communications; 8–finance, real estate, and business activities; and 9–community, social, and personal services. See Appendix 10 (p. 166) for the concordance with the ISIC, Revisions 3 and 4.
Table 21 Industry Shares of Value Added_Shares of industry GDP at current prices by Industry
1970 1990 2000 2010 2016
Agric
ultu
re
Man
ufac
turin
g
Serv
ice
Othe
rs
Agric
ultu
re
Man
ufac
turin
g
Serv
ice
Othe
rs
Agric
ultu
re
Man
ufac
turin
g
Serv
ice
Othe
rs
Agric
ultu
re
Man
ufac
turin
g
Serv
ice
Othe
rs
Agric
ultu
re
Man
ufac
turin
g
Serv
ice
Othe
rs
Bahrain 0.7 11.1 58.0 30.2 0.6 11.4 55.1 32.9 0.3 14.6 54.2 30.8 0.3 18.3 59.9 21.5Bangladesh 32.7 12.7 46.0 8.6 27.8 14.8 47.0 10.4 18.0 17.4 55.1 9.4 14.7 17.9 56.5 10.9Bhutan 48.3 2.5 41.4 7.8 34.3 8.5 40.7 16.5 27.4 8.4 36.6 27.6 17.5 9.1 37.9 35.5 17.3 7.8 39.2 35.6Brunei 0.4 17.2 7.2 75.2 0.9 13.8 35.8 49.5 1.0 18.3 34.3 46.4 0.7 14.6 31.9 52.7 1.2 11.3 42.4 45.2Cambodia 37.8 16.9 39.1 6.2 36.0 15.6 40.7 7.6 26.3 17.0 42.4 14.3China 35.8 31.4 23.3 9.4 26.8 31.0 32.0 10.1 14.9 32.5 39.4 13.2 9.8 32.1 43.6 14.5 8.9 27.9 51.1 12.1ROC 17.1 29.3 45.2 8.5 4.2 32.6 54.7 8.5 2.0 26.4 65.7 5.9 1.6 29.9 63.6 4.9 1.8 31.6 61.5 5.0Fiji 20.4 10.8 58.6 10.3 16.3 13.3 62.6 7.9 11.7 15.3 67.1 5.9 15.1 14.0 65.9 5.0Hong Kong 0.2 16.7 75.4 7.6 0.1 4.8 87.3 7.8 0.1 1.8 93.0 5.2 0.1 1.1 92.2 6.6India 41.8 15.2 36.2 6.8 29.1 17.2 43.5 10.1 23.1 15.3 50.8 10.8 18.0 14.9 54.4 12.7 17.0 14.2 58.3 10.5Indonesia 39.4 9.4 44.2 7.0 16.6 18.4 50.4 14.7 13.4 23.2 47.3 16.1 13.6 21.5 44.7 20.2 13.2 20.2 48.1 18.5Iran 15.8 15.9 40.0 28.2 15.1 18.5 49.0 17.4 11.9 14.4 49.0 24.7 8.6 12.6 51.1 27.8 13.2 14.4 53.0 19.4Japan 5.9 34.3 48.8 11.0 2.3 26.6 58.9 12.2 1.5 22.5 65.8 10.2 1.1 20.9 70.4 7.6 1.2 21.2 69.3 8.3Korea 28.9 18.8 44.3 8.0 8.4 27.3 51.9 12.4 4.4 29.0 57.5 9.1 2.5 30.7 59.3 7.6 2.1 29.5 59.2 9.2Kuwait 0.4 4.2 32.9 62.5 1.6 11.2 49.1 38.1 0.6 6.5 44.2 48.7 0.4 5.3 41.4 52.9 0.5 6.4 54.0 39.1Lao PDR 68.2 3.5 21.4 6.9 61.2 5.1 24.3 9.4 52.5 10.7 24.6 12.2 31.4 9.8 40.4 18.4 25.0 8.5 38.1 28.4Malaysia 31.1 12.9 43.1 12.9 15.5 22.9 45.2 16.4 8.6 29.2 46.5 15.7 10.2 23.7 48.9 17.2 8.8 22.6 52.4 16.3Mongolia 14.9 11.7 61.9 11.5 10.1 20.3 52.8 16.8 25.8 7.8 51.8 14.6 13.1 7.6 50.0 29.4 13.3 7.3 51.4 28.0Myanmar 42.0 9.9 45.3 2.9 55.2 7.8 34.4 2.6 53.5 8.4 31.2 6.9 24.8 5.4 19.6 50.1 21.2 7.7 26.8 44.4Nepal 45.5 6.8 40.9 6.8 36.6 9.0 46.1 8.3 37.1 6.2 48.0 8.7 29.4 5.7 56.0 9.0Oman 15.7 0.4 18.7 65.2 2.9 2.9 40.5 53.6 2.2 5.6 39.4 52.7 1.4 10.4 35.9 52.4 1.9 9.2 51.7 37.2Pakistan 42.2 10.0 43.2 4.5 28.8 12.1 51.3 7.8 29.4 10.6 52.6 7.3 24.3 13.6 55.1 6.9 24.6 12.8 56.0 6.6Philippines 26.0 27.0 39.1 7.9 19.2 26.7 43.2 10.9 14.0 24.5 51.6 10.0 12.3 21.4 55.1 11.1 9.7 19.6 59.5 11.2Qatar 0.7 3.1 21.0 75.2 0.8 13.0 42.8 43.5 0.4 5.4 29.5 64.7 0.1 8.9 32.4 58.6 0.2 8.7 50.1 41.0Saudi Arabia 4.3 8.3 36.8 50.6 5.7 8.5 45.3 40.5 4.9 9.6 41.2 44.3 2.6 11.0 39.1 47.3 2.7 12.9 54.1 30.3Singapore 2.7 18.5 68.8 10.0 0.3 25.6 67.3 6.8 0.1 27.7 65.1 7.1 0.0 21.4 72.3 6.3 0.0 18.8 74.7 6.4Sri Lanka 17.4 20.0 53.5 9.1 11.6 20.3 59.8 8.2 9.5 20.1 60.9 9.6 8.2 17.2 62.1 12.6Thailand 22.4 17.7 50.9 9.0 10.0 27.1 53.1 9.8 8.5 28.4 54.8 8.3 10.5 30.9 49.6 9.0 8.5 27.2 55.8 8.5UAE 1.1 7.1 42.0 49.7 2.2 12.0 46.2 39.6 0.8 8.0 46.6 44.6 0.8 9.5 58.8 30.9Vietnam 41.5 5.6 43.1 9.8 26.2 12.7 42.6 18.5 21.0 14.8 42.8 21.3 18.1 15.9 46.1 19.9(region)
APO20 19.9 24.7 44.5 10.8 12.0 22.9 53.2 11.8 10.5 20.9 57.2 11.4 10.2 19.7 58.0 12.1 10.6 18.8 59.3 11.2Asia24 21.8 25.3 42.1 10.8 14.6 24.2 49.7 11.6 11.9 24.0 52.2 11.9 10.1 24.7 51.9 13.3 9.9 22.9 55.4 11.8Asia30 19.8 23.3 41.4 15.5 13.7 22.8 49.2 14.3 11.2 22.8 51.5 14.5 9.6 23.7 51.2 15.5 9.4 22.2 55.3 13.0East Asia 12.7 33.0 43.8 10.5 9.5 27.9 51.2 11.4 7.8 27.4 53.7 11.2 6.9 29.0 52.1 12.0 6.9 26.6 55.4 11.1South Asia 41.8 14.7 36.9 6.6 29.2 16.2 44.9 9.7 24.1 14.7 51.0 10.2 18.6 14.9 54.6 11.8 17.4 14.3 58.1 10.2ASEAN 30.8 15.6 44.3 9.3 16.8 21.1 49.4 12.7 13.2 24.2 49.3 13.3 12.6 22.3 48.0 17.1 11.4 20.6 51.9 16.1ASEAN6 29.9 16.0 44.4 9.7 14.3 22.3 50.2 13.2 10.7 25.5 50.5 13.3 11.2 23.7 49.6 15.5 10.3 21.6 53.5 14.6CLMV 44.0 9.4 43.4 3.2 47.5 6.4 39.0 7.1 36.4 11.5 38.1 14.0 23.5 11.9 35.8 28.9 19.8 13.4 40.3 26.5GCC 3.2 6.7 34.6 55.6 4.1 8.3 44.9 42.6 3.5 9.4 42.2 44.9 1.7 9.7 40.4 48.3 1.8 11.1 54.6 32.5(reference)US 2.5 23.9 65.6 8.0 1.6 17.7 72.7 8.0 1.0 15.1 76.6 7.3 1.1 12.2 79.1 7.6 1.0 11.7 80.1 7.2Australia 6.5 23.7 53.8 15.9 3.5 13.7 66.4 16.4 3.8 12.1 70.2 13.9 2.4 7.9 69.4 20.3 3.0 6.2 72.2 18.6Turkey 31.4 20.8 39.1 8.8 13.9 28.2 47.6 10.3 11.3 20.9 58.7 9.1 10.3 17.2 61.8 10.8 7.0 18.8 61.0 13.1
©20
18 A
sian
Prod
uctiv
ity O
rgan
izat
ion

162
Appendix
Unit: Percentage.Sources: Population census and labor force survey in each country, including author adjustments.Note: Services are defined as the total of industries 6–9 and Others are defined as the total of industries 2, 4, and 5 of nine industries, which consists of 1–agriculture; 2–mining; 3–manufacturing; 4–electricity, gas, and water supply; 5–construction; 6–wholesale and retail trade, ho-tels, and restaurants; 7–transport, storage, and communications; 8–finance, real estate, and business activities; and 9–community, social, and personal services. See Appendix 10 (p. 166) for the concordance with the ISIC, Revisions 3 and 4.
Table 22 Industry Shares of Employment_Shares of number of employment by industry
1980 1990 2000 2010 2016
Agric
ultu
re
Man
ufac
turin
g
Serv
ice
Othe
rs
Agric
ultu
re
Man
ufac
turin
g
Serv
ice
Othe
rs
Agric
ultu
re
Man
ufac
turin
g
Serv
ice
Othe
rs
Agric
ultu
re
Man
ufac
turin
g
Serv
ice
Othe
rs
Agric
ultu
re
Man
ufac
turin
g
Serv
ice
Othe
rs
Bahrain 2.7 10.3 60.6 26.4 2.5 12.2 67.7 17.6 1.8 17.2 69.1 12.0 1.1 12.2 63.2 23.6 1.0 11.7 66.2 21.2Bangladesh 63.6 8.6 25.8 2.0 53.6 9.7 33.9 2.7 51.1 9.5 35.9 3.5 47.2 12.4 35.1 5.2 41.5 15.2 37.1 6.2Bhutan 85.9 1.3 9.7 3.1 77.5 4.1 14.6 3.7 69.0 4.6 15.8 10.5 61.7 4.5 22.2 11.7 53.6 4.8 28.2 13.4Brunei 5.8 4.1 62.6 27.5 2.3 3.6 75.2 19.0 1.4 8.3 74.1 16.2 2.6 6.4 65.4 25.7 2.7 5.8 63.8 27.7Cambodia 73.5 7.2 17.8 1.5 57.4 10.8 28.1 3.7 41.6 9.3 42.0 7.0China 68.7 13.8 13.1 4.4 60.1 15.1 18.5 6.3 50.0 14.4 27.5 8.1 36.3 18.0 34.7 11.0 27.1 18.5 43.4 11.1ROC 19.4 32.6 37.9 10.0 12.8 31.8 46.0 9.4 7.8 27.8 54.7 9.7 5.2 27.3 58.8 8.7 4.9 26.9 59.2 9.0Fiji 22.9 14.9 48.2 14.1 18.6 18.8 52.3 10.3 12.1 21.7 58.9 7.3 7.9 18.0 60.1 14.0 7.8 16.3 61.6 14.2Hong Kong 1.4 42.2 48.4 8.0 0.9 27.7 62.4 9.0 0.3 10.4 79.4 9.9 0.2 3.8 87.9 8.0 0.3 3.1 87.5 9.1India 63.6 12.0 20.5 4.0 63.7 11.4 20.6 4.2 55.3 14.3 25.3 5.1 51.8 11.3 26.0 10.8 46.6 12.8 30.2 10.3Indonesia 56.0 9.0 30.9 4.1 56.0 10.2 30.3 3.6 45.2 12.9 36.9 5.0 38.5 12.8 42.0 6.6 32.5 13.7 45.4 8.4Iran 32.1 16.1 37.6 14.2 26.6 15.9 45.1 12.3 21.3 18.2 47.8 12.8 19.2 17.1 48.6 15.2 18.4 17.3 48.9 15.3Japan 12.8 22.7 53.4 11.1 8.7 22.7 58.0 10.6 5.9 18.7 64.7 10.8 4.6 16.3 70.4 8.7 3.9 15.2 72.6 8.3Korea 34.1 20.7 37.7 7.5 18.0 26.1 47.6 8.3 10.6 19.5 62.1 7.9 6.6 16.9 68.8 7.8 4.8 17.4 70.4 7.4Kuwait 1.9 8.4 67.0 22.8 1.5 6.9 73.7 17.9 2.3 4.7 72.2 20.9 1.7 4.5 77.5 16.3 1.3 4.3 79.6 14.8Lao PDRMalaysia 26.0 19.9 46.5 7.6 16.7 23.5 50.8 9.0 12.8 17.2 59.2 10.7 10.7 16.4 62.2 10.7Mongolia 39.1 12.3 40.3 8.3 33.1 12.5 44.2 10.2 43.3 9.8 41.0 5.9 33.6 6.3 50.1 10.0 30.4 7.5 50.6 11.5Myanmar 67.1 7.6 23.1 2.1 69.7 7.5 21.0 1.8 60.8 9.7 24.9 4.6 53.4 9.1 29.3 8.1 52.0 11.0 32.2 4.9Nepal 92.6 0.6 6.7 0.1 82.4 1.9 15.1 0.6 63.8 9.3 22.7 4.2 71.7 7.0 16.6 4.7 69.8 6.7 18.8 4.7Oman 8.2 9.6 70.6 11.5 5.8 9.3 47.4 37.4 4.2 10.9 51.2 33.7Pakistan 52.8 14.3 27.0 5.9 48.7 12.4 31.4 7.4 48.4 11.5 33.6 6.6 45.0 13.2 34.2 7.6 41.9 14.7 34.6 8.8Philippines 51.1 11.1 33.1 4.7 44.3 9.9 40.3 5.5 36.4 10.2 47.2 6.2 33.6 8.4 51.7 6.3 26.4 7.9 57.6 8.1Qatar 3.3 7.6 64.1 25.0 2.6 11.9 60.6 25.0 1.3 7.9 43.7 47.0 1.3 5.5 41.1 52.1Saudi Arabia 6.1 7.7 74.0 12.1 4.2 6.8 74.4 14.7 5.0 7.8 70.5 16.7Singapore 1.0 28.2 59.3 11.5 0.3 26.8 55.0 17.9 0.2 20.7 64.6 14.4 0.3 16.7 70.3 12.7 0.4 13.6 72.4 13.6Sri Lanka 50.4 12.6 30.5 6.6 48.3 13.7 31.7 6.3 37.2 17.1 38.4 7.3 32.5 17.6 42.9 7.0 27.1 17.9 46.5 8.5Thailand 70.8 7.9 18.7 2.6 64.0 10.2 21.7 4.1 44.4 14.9 35.0 5.6 38.3 14.1 40.9 6.7 31.6 16.7 44.9 6.8UAE 4.6 6.3 57.2 31.9 8.0 7.7 61.4 23.0 8.0 11.0 58.4 22.7 3.3 7.7 74.1 14.9 2.5 7.9 76.7 12.9Vietnam 71.4 7.3 17.7 3.6 64.7 8.6 23.0 3.7 49.5 13.5 29.5 7.4 41.9 16.6 33.4 8.1(region)
APO20 54.9 13.1 26.9 5.0 53.5 12.8 28.6 5.2 46.2 14.1 33.9 5.8 42.3 12.6 36.0 9.1 37.4 13.8 39.6 9.2Asia24 61.5 13.4 20.4 4.7 56.8 13.8 23.8 5.7 48.1 14.2 30.9 6.8 39.9 14.9 35.4 9.9 33.3 15.7 41.1 9.9Asia30 61.4 13.4 20.5 4.8 56.7 13.8 23.8 5.7 47.8 14.2 31.1 6.9 39.5 14.8 35.7 10.0 32.9 15.6 41.4 10.1East Asia 61.4 15.2 18.2 5.3 53.9 16.3 23.0 6.8 44.8 15.0 31.8 8.3 32.6 17.9 38.8 10.7 24.3 18.3 46.7 10.7South Asia 63.2 11.7 21.2 3.9 61.9 11.2 22.6 4.3 54.3 13.6 27.0 5.1 50.9 11.6 27.6 9.9 45.9 13.2 31.3 9.6ASEAN 57.9 9.9 28.0 4.1 47.6 12.3 34.9 5.2 39.9 12.5 40.6 7.0 33.6 13.6 44.9 8.0ASEAN6 58.0 9.3 28.7 4.0 53.7 10.8 31.1 4.4 41.3 13.6 39.4 5.7 35.4 12.6 45.1 6.9 29.2 13.3 49.2 8.3CLMV 70.9 7.3 18.7 3.1 64.4 8.8 23.1 3.8 51.4 12.1 29.3 7.2 44.6 14.3 34.0 7.1GCC 6.0 8.6 70.2 15.2 3.6 7.3 69.8 19.4 3.7 7.7 67.6 21.0(reference)US 2.9 19.9 69.6 7.6 2.0 15.3 75.6 7.0 1.6 12.9 78.3 7.1 1.5 8.9 83.3 6.4 1.4 8.6 83.4 6.6Australia 6.5 18.9 63.2 11.5 5.7 14.3 69.8 10.2 4.9 11.8 74.1 9.3 3.1 8.7 75.9 12.3 2.9 7.2 78.4 11.5Turkey 45.9 14.7 33.3 6.1 36.0 16.9 40.0 7.1 23.3 20.0 49.1 7.6 19.5 18.2 53.7 8.6
©20
18 A
sian
Prod
uctiv
ity O
rgan
izat
ion

163
A.9 Supplementary Tables
App.
Table 23 Industry Origins of Economic Growth___Average annual growth rates (contributions) of industry GDP at constant prices in 2000–2016
Unit: Percentage.Sources: Official national accounts in each country, including author adjustments.
1. A
gricu
lture
2. M
inin
g
3. M
anuf
actu
ring
4. Ele
ctrici
ty, ga
s, an
d wate
r sup
ply
5. Co
nstru
ction
6. Wh
olesal
e and
ret
ail tr
ade,
hotel
s, an
d rest
auran
ts
7. Tra
nspo
rt,
storag
e, an
d co
mmun
icatio
ns
8. Fin
ance,
real
estate
, and
bu
siness
activ
ities
9. Co
mmun
ity,
socia
l, and
pe
rsona
l servi
ces
Total
econ
omy
Bahrain 0.1 −0.1 6.6 10.4 7.0 4.6 7.9 5.9 7.9 5.2Bangladesh 3.5 7.5 8.1 7.9 7.5 6.8 7.1 4.5 4.9 5.9Bhutan 2.3 11.3 7.6 9.6 8.0 11.6 8.1 8.6 5.4 7.1Brunei 2.4 −2.2 −0.1 3.3 3.2 3.7 2.8 3.6 2.8 −0.2Cambodia 3.8 18.2 9.6 10.3 10.3 7.1 7.3 8.8 8.2 6.4China 4.1 8.9 9.7 7.9 10.6 10.4 8.8 9.7 9.9 9.1ROC −0.7 −5.6 5.8 3.0 −0.4 3.0 3.3 2.6 2.1 3.4Fiji 0.2 −1.8 0.8 2.9 3.1 2.3 3.3 1.9 2.0 1.9Hong Kong −3.0 −3.0 −2.5 0.8 1.8 5.0 3.9 4.1 3.7 3.9India 3.3 5.1 7.7 5.6 7.1 8.4 10.5 9.2 6.2 7.1Indonesia 3.6 1.2 4.5 6.8 6.6 5.6 10.7 6.7 5.3 5.5Iran 3.9 0.3 5.4 6.6 −1.5 4.2 7.5 4.5 3.1 3.5Japan −2.9 −8.8 1.3 −2.2 −1.5 0.1 0.9 1.3 0.5 0.6Korea 0.9 −0.5 5.2 4.1 1.7 2.7 4.5 3.9 3.3 3.9Kuwait 3.5 2.3 3.5 6.5 2.8 2.4 10.1 5.0 5.1 4.0Lao PDR 2.9 28.8 8.0 7.9 9.8 9.2 8.7 8.4 8.1 7.1Malaysia 2.3 0.7 4.0 4.6 5.7 6.4 6.3 6.1 5.6 4.6Mongolia 4.5 7.3 6.7 4.3 3.2 8.5 11.5 8.0 2.2 6.5Myanmar 2.3 7.0 7.0 11.0 15.4 2.3 4.8 28.5 11.6 5.6Nepal 3.0 3.9 1.5 4.5 3.6 2.4 5.9 4.3 6.8 3.8Oman 3.6 0.6 8.0 9.1 16.8 5.1 10.9 6.2 5.7 4.3Pakistan 2.4 4.4 5.1 3.0 3.5 3.4 4.3 4.3 6.2 4.1Philippines 2.2 8.2 4.8 4.5 5.8 5.5 6.5 6.7 4.8 5.1Qatar 6.8 7.0 8.4 9.7 19.5 13.6 16.7 13.8 9.9 9.6Saudi Arabia 2.3 1.8 6.1 5.8 5.5 8.4 11.0 5.6 3.5 3.9Singapore −1.5 4.1 3.5 5.0 6.0 4.4 5.9 4.4 5.1Sri Lanka 2.8 11.1 3.7 6.3 7.9 5.0 7.7 6.9 4.5 5.3Thailand 1.3 4.2 3.8 4.9 3.9 3.7 5.6 5.7 3.6 3.9UAE −1.8 1.6 3.7 9.1 6.3 5.2 7.6 5.7 7.2 4.5Vietnam 3.3 2.2 9.8 10.2 8.0 7.7 7.6 5.4 6.8 6.2(region)
APO20 2.9 2.0 4.5 3.2 3.6 4.4 5.9 4.7 3.4 4.2Asia24 3.4 5.0 7.0 5.1 6.2 6.0 6.9 6.0 5.7 5.9Asia30 3.3 3.8 7.0 5.2 6.3 6.0 7.0 6.0 5.6 5.8East Asia 3.6 8.7 7.5 4.8 6.2 5.7 5.7 5.2 5.8 6.1South Asia 3.2 5.3 7.3 5.3 7.0 7.5 9.1 8.7 6.0 6.6ASEAN 2.9 2.3 4.6 5.9 6.4 5.4 8.4 6.3 4.9 5.1ASEAN6 2.8 1.3 4.3 5.2 5.9 5.3 8.5 6.3 4.7 4.9CLMV 3.0 5.5 9.3 10.2 9.8 6.2 6.5 5.7 7.5 6.1GCC 1.9 2.1 5.7 7.3 7.2 7.0 9.9 6.2 4.7 4.5(reference)US 2.9 1.6 1.0 −0.2 −1.6 1.5 3.5 2.2 1.0 1.6Australia 1.9 4.5 2.8 1.0 4.7 3.0 3.3 3.2 2.8 2.9Turkey 2.2 0.8 4.4 5.1 7.8 5.6 4.7 4.4 4.4 4.8
©20
18 A
sian
Prod
uctiv
ity O
rgan
izat
ion

164
Appendix
Table 24 Industry Origins of Labor Productivity Growth___Average annual growth rates (contributions) of industry labor productivity in 2000–2016
Unit: Percentage (average annual growth rate, contribution share in parentheses).Source: APO Productivity Database 2018.
1. A
gricu
lture
2. M
inin
g
3.
Man
ufac
turin
g
4. El
ectri
city,
gas,
and w
ater
su
pply
5. Co
nstru
ctio
n
6. W
hole
sale
an
d ret
ail t
rade
, ho
tels,
and
resta
uran
ts
7. Tr
ansp
ort,
stora
ge, a
nd
com
mun
icatio
ns
8. Fi
nanc
e,
real
esta
te,
and b
usin
ess
activ
ities
9. Co
mm
unity
, so
cial, a
nd
perso
nal
serv
ices
Tota
l eco
nom
y
Bahrain −2.9 (−0.1) 4.0 (0.0) 2.4 (0.2) 15.4 (0.2) −4.4 (−1.3) −1.0 (−0.6) −1.9 (−0.2) 5.6 (1.5) 1.0 (−1.3) −1.6Bangladesh 3.0 (0.4) 8.6 (0.1) 3.2 (0.8) 7.0 (0.1) 1.4 (0.3) 5.1 (0.7) 3.8 (0.5) −2.0 (0.2) 3.6 (0.9) 4.0Brunei −3.8 (−0.1) −4.0 (−1.2) 0.0 (0.0) −0.1 (−0.0) −3.1 (−1.2) −1.0 (−0.7) −0.8 (−0.1) 2.2 (0.2) 3.3 (0.6) −2.5Cambodia 4.2 (1.4) 11.0 (0.1) 4.9 (1.3) −3.8 (−0.0) −2.9 (0.4) −1.1 (−0.3) −0.3 (0.3) 0.0 (0.7) −0.7 (−0.0) 3.9China 7.5 (1.6) 9.1 (0.5) 7.7 (2.7) 8.3 (0.3) 7.6 (0.4) 6.7 (0.7) 6.5 (0.6) 6.9 (1.0) 6.6 (0.8) 8.6ROC 1.1 (0.1) 0.7 (0.0) 5.0 (1.5) 1.3 (0.0) −0.9 (−0.0) 1.4 (0.2) 2.7 (0.1) −0.3 (0.3) 1.0 (0.2) 2.4Fiji 2.1 (0.2) 0.3 (0.1) 1.7 (0.3) −1.8 (−0.2) −4.8 (−0.3) 0.5 (0.1) 1.8 (0.3) −1.3 (0.3) 1.7 (0.3) 1.1Hong Kong −3.1 (−0.0) 0.0 (0.0) 4.0 (0.2) 1.0 (0.0) 1.3 (0.0) 4.4 (1.1) 2.5 (0.2) 0.8 (0.9) 1.9 (0.2) 2.6India 3.2 (0.6) 4.8 (0.1) 7.2 (1.1) 7.7 (0.1) 0.4 (0.1) 4.9 (1.0) 7.4 (0.7) 5.6 (1.4) 6.2 (0.9) 5.9Indonesia 3.9 (0.5) −2.5 (0.1) 2.4 (0.7) 3.7 (0.1) 1.3 (0.2) 2.8 (0.3) 10.0 (1.2) −1.6 (0.5) 1.2 (−0.1) 3.6Iran 2.9 (0.2) −0.8 (0.1) 3.8 (0.4) 4.2 (0.2) −4.7 (−0.4) 1.8 (0.3) 4.1 (0.2) −0.4 (0.5) 2.5 (0.3) 1.8Japan −0.4 (0.1) −5.1 (−0.0) 2.6 (0.5) −2.0 (−0.0) 0.2 (0.1) 0.1 (0.0) 0.2 (0.0) 1.5 (0.3) −0.7 (−0.4) 0.6Korea 4.5 (0.3) −1.1 (−0.0) 4.6 (1.4) 3.1 (0.1) 0.8 (0.0) 2.5 (0.3) 2.5 (0.2) 0.3 (0.4) −0.2 (−0.1) 2.5Kuwait 1.2 (0.0) −1.6 (1.1) −1.8 (−0.0) 2.2 (0.1) −0.7 (−0.5) 36.1 (1.2) 6.6 (0.4) 41.4 (6.0) −2.4 (−3.0) 5.4Malaysia 2.3 (0.2) −7.7 (−0.0) 3.5 (1.0) 1.5 (0.1) 2.2 (−0.1) 1.5 (−0.2) 2.9 (0.3) −0.5 (0.2) 3.4 (0.2) 1.8Mongolia 4.5 (0.6) 0.6 (1.1) 6.1 (0.5) −1.6 (−0.0) −3.1 (−0.2) 3.9 (1.0) 8.7 (0.9) −0.7 (0.8) −0.5 (−0.3) 4.3Nepal 0.1 (−1.0) −1.8 (−0.0) 1.1 (0.1) 4.2 (0.1) −0.4 (0.1) 1.5 (0.3) 1.5 (0.4) 1.0 (0.6) 6.2 (0.8) 1.4Oman 0.1 (−0.2) −5.6 (0.1) −0.4 (−0.1) 6.5 (0.1) 0.9 (−3.3) −2.9 (−1.0) 2.9 (0.4) −5.4 (0.0) 2.4 (0.1) −3.8Pakistan 0.5 (−0.3) −2.7 (0.1) 1.2 (0.1) −1.9 (−0.0) −0.6 (−0.2) −0.1 (0.1) 0.3 (0.3) 4.2 (0.4) 4.2 (0.6) 1.2Philippines 1.7 (0.1) 2.5 (0.1) 3.9 (1.0) 4.3 (0.2) 1.5 (0.1) 2.4 (0.2) 3.3 (0.2) −0.2 (0.9) 0.9 (0.0) 2.6Qatar −0.9 (−0.2) −4.5 (3.2) 1.4 (0.1) 4.0 (0.0) 2.1 (−5.3) 2.7 (−0.6) 2.4 (−0.1) 6.9 (1.3) 1.5 (−1.2) −2.7Saudi Arabia −0.9 (−0.1) −0.3 (0.7) 1.6 (0.3) 1.3 (0.0) −1.8 (−0.7) 5.8 (0.0) 6.6 (0.3) 3.1 (0.3) −1.2 (−1.7) −0.8Singapore −9.1 (−0.0) ( ) 3.4 (0.8) 3.1 (0.1) 2.0 (−0.1) 2.7 (0.5) 1.0 (0.2) 1.2 (1.3) −0.2 (−0.9) 1.8Sri Lanka 4.0 (0.6) 12.6 (0.3) 2.7 (0.6) 9.3 (0.1) 5.5 (0.3) 2.8 (0.4) 4.6 (0.7) 4.7 (0.8) 3.0 (0.6) 4.3Thailand 2.8 (0.6) 2.0 (0.1) 2.5 (0.9) 4.5 (0.1) 1.8 (0.0) 1.8 (0.2) 4.1 (0.4) 1.3 (0.5) 0.8 (0.2) 3.2UAE 0.5 (0.1) −2.2 (0.5) 0.9 (0.1) 2.1 (0.1) 5.8 (0.0) −0.2 (−0.2) 1.8 (0.2) −4.6 (−0.0) 0.5 (−1.6) −0.7Vietnam 4.0 (1.0) 1.1 (0.2) 3.6 (0.7) 2.5 (0.3) 0.6 (0.1) 3.3 (0.3) 5.7 (0.3) −3.7 (0.7) 1.8 (0.3) 4.0(region)APO20 2.9 (0.3) 0.5 (0.0) 3.3 (0.7) 3.0 (0.1) −1.2 (−0.1) 1.8 (0.4) 3.3 (0.4) 1.0 (0.7) 1.9 (0.3) 2.8Asia24 4.7 (0.8) 4.6 (0.2) 5.4 (1.5) 5.2 (0.1) 2.3 (0.1) 2.9 (0.5) 4.4 (0.5) 2.3 (0.8) 3.1 (0.5) 4.9Asia30 4.6 (0.8) 3.3 (0.2) 5.3 (1.4) 5.1 (0.1) 2.3 (0.1) 3.0 (0.5) 4.5 (0.5) 2.5 (0.8) 3.0 (0.4) 4.8East Asia 7.0 (1.3) 8.9 (0.3) 5.8 (1.8) 5.1 (0.1) 3.7 (0.2) 2.7 (0.4) 3.7 (0.4) 2.8 (0.8) 2.8 (0.3) 5.6South Asia 2.9 (0.4) 4.9 (0.1) 6.2 (0.9) 6.2 (0.1) 0.6 (0.1) 4.3 (0.9) 5.8 (0.6) 5.1 (1.2) 5.6 (0.8) 5.2ASEAN 3.2 (0.5) −0.1 (0.2) 2.1 (0.7) 2.9 (0.1) 1.4 (0.1) 2.2 (0.3) 6.4 (0.7) −0.6 (0.6) 1.2 (0.1) 3.2ASEAN6 3.2 (0.4) −2.7 (0.1) 2.6 (0.8) 3.7 (0.1) 1.6 (0.1) 2.5 (0.3) 6.7 (0.7) −0.3 (0.6) 1.0 (0.0) 3.1CLMV 3.2 (0.9) 6.8 (1.0) 4.1 (0.6) 2.5 (0.3) 2.3 (0.3) 1.6 (0.2) 3.5 (0.2) −1.7 (0.4) 3.3 (0.3) 4.2GCC −0.4 (−0.1) −2.1 (0.8) 1.0 (0.2) 2.5 (0.1) −0.9 (−0.9) 4.3 (0.0) 4.2 (0.3) 4.2 (0.9) −0.7 (−1.6) −0.3(reference)US 3.0 (0.0) 0.4 (0.0) 3.1 (0.4) 0.1 (0.0) −1.6 (−0.1) 1.1 (0.1) 3.5 (0.3) 1.1 (0.5) −0.3 (−0.3) 0.9Australia 3.3 (0.1) −4.2 (0.2) 1.1 (0.1) −2.2 (−0.0) 2.7 (0.2) 1.4 (0.0) 1.9 (0.2) 1.1 (0.7) 0.1 (−0.5) 1.0Turkey 4.7 (0.9) −2.3 (−0.0) 3.6 (0.7) 0.2 (0.1) 5.6 (0.4) 3.5 (0.4) 2.8 (0.5) −3.3 (0.2) 1.3 (0.2) 3.5
©20
18 A
sian
Prod
uctiv
ity O
rgan
izat
ion

165
A.9 Supplementary Tables
App.
Table 25 Real Income and Terms of Trade_Average annual growth rate of real income, real GDP, trading gain, and net primary income transfer from abroad
Unit: Percentage.Sources: Official national accounts in each country, including author adjustments.Note: See footnote 110 for the definition of real GDP growth, real income growth, and trading gain growth. The starting years for some coun-tries are different due to data availability during 1970–2016: Brunei (1989–), Cambodia (1993–), EU28 (1999–), Mongolia (2000–), Nepal (2000–), and Vietnam (1989–).
1995–2000 2000–2005 2005–2010 2010–2016 1970–2016
Real
inco
me
Real
GDP
Trad
ing g
ain
Net p
rimar
y inc
ome
from
aboa
d
Real
inco
me
Real
GDP
Trad
ing g
ain
Net p
rimar
y inc
ome
from
aboa
d
Real
inco
me
Real
GDP
Trad
ing g
ain
Net p
rimar
y inc
ome
from
aboa
d
Real
inco
me
Real
GDP
Trad
ing g
ain
Net p
rimar
y inc
ome
from
aboa
d
Real
inco
me
Real
GDP
Trad
ing g
ain
Net p
rimar
y inc
ome
from
aboa
d
Bhutan 8.6 6.2 −0.1 2.5 Mongolia 11.5 6.2 5.5 −0.2 Myanmar 12.8 5.5 7.4 0.0 Mongolia 9.9 9.1 0.8 0.0 China 8.4 8.4 0.0 0.0China 7.4 7.5 −0.1 0.1 China 11.0 10.0 0.9 0.1 China 11.9 11.7 0.2 0.1 China 8.1 7.8 0.3 0.0 Singapore 6.8 7.1 −0.2 −0.1Vietnam 7.4 7.4 0.2 −0.3 Cambodia 10.2 10.5 0.0 −0.3 India 8.6 8.4 0.3 −0.1 Myanmar 7.9 6.7 1.2 −0.1 Malaysia 6.8 6.4 0.4 0.0Singapore 6.2 6.4 0.1 −0.3 Iran 8.9 7.2 2.0 −0.3 Cambodia 7.7 6.7 1.1 0.0 Cambodia 6.8 6.8 0.3 −0.3 Korea 6.5 6.8 −0.3 0.0Philippines 5.8 3.0 1.1 1.7 Myanmar 8.6 5.8 2.8 0.0 Vietnam 7.3 6.6 1.1 −0.4 Vietnam 6.1 5.6 0.8 −0.3 ROC 6.2 6.9 −0.7 0.1ROC 5.7 5.9 −0.1 0.0 Vietnam 8.2 7.7 0.6 −0.1 Singapore 7.1 6.7 −0.9 1.3 India 5.9 6.3 −0.3 0.0 Bhutan 6.2 5.9 0.1 0.2India 5.3 5.5 −0.2 0.0 Bhutan 7.5 7.5 0.2 −0.3 Bhutan 7.0 7.8 0.1 −0.9 Philippines 5.7 5.9 −0.3 0.1 Indonesia 5.6 5.1 0.6 0.0Malaysia 5.3 5.6 0.4 −0.8 Malaysia 7.3 5.3 1.2 0.8 Bangladesh 6.3 6.2 −0.6 0.7 Bhutan 5.6 6.8 −0.6 −0.7 Hong Kong 5.5 5.5 0.0 0.0Iran 5.2 2.7 2.3 0.2 India 7.0 7.2 −0.3 0.1 Sri Lanka 6.0 5.7 0.3 0.0 Sri Lanka 5.4 5.0 0.7 −0.3 Myanmar 5.5 4.0 1.6 −0.1Cambodia 5.0 5.3 0.1 −0.3 Sri Lanka 5.6 4.9 0.6 0.1 Philippines 5.9 4.8 −0.1 1.1 Bangladesh 5.3 5.8 −0.1 −0.3 India 5.4 5.5 0.0 0.0Sri Lanka 4.7 4.9 −0.1 −0.1 Philippines 5.4 4.2 −0.3 1.4 Malaysia 5.8 4.9 0.6 0.3 Malaysia 4.8 4.9 −0.2 0.1 Thailand 5.2 5.5 −0.3 −0.1Myanmar 4.3 3.3 1.5 −0.6 Bangladesh 5.4 5.2 −0.1 0.2 Indonesia 5.7 6.0 −0.7 0.4 Indonesia 4.7 5.1 −0.3 −0.1 Sri Lanka 5.1 5.2 0.0 −0.1Pakistan 4.2 4.5 0.0 −0.3 Pakistan 5.0 5.2 −0.8 0.6 Iran 5.2 3.4 1.7 0.2 Nepal 4.7 3.7 0.8 0.2 Pakistan 5.0 5.2 −0.3 0.1Bangladesh 4.1 4.0 0.0 0.1 Thailand 4.6 5.1 0.0 −0.5 Mongolia 4.7 7.1 −1.0 −1.4 Pakistan 4.3 4.1 −0.3 0.4 Iran 4.8 3.4 1.3 0.1Korea 3.2 5.2 −2.0 −0.1 Singapore 4.0 5.0 0.2 −1.2 Nepal 4.1 3.2 0.9 0.0 Thailand 3.5 3.1 0.6 −0.2 Philippines 4.5 3.8 0.0 0.7Hong Kong 2.8 2.4 0.4 0.0 Korea 3.8 4.5 −0.7 0.0 Thailand 3.9 3.9 0.0 0.1 ROC 3.0 2.5 0.5 0.0 Bangladesh 3.4 3.4 −0.2 0.1Fiji 2.5 2.3 −0.4 0.5 Indonesia 3.6 4.2 −1.0 0.4 Korea 3.7 4.1 −0.6 0.2 Hong Kong 2.9 2.9 0.1 −0.1 Fiji 3.2 2.7 0.5 0.0Indonesia 1.4 1.4 0.8 −0.8 Fiji 3.3 3.6 0.2 −0.5 Hong Kong 3.3 3.8 −0.8 0.3 Fiji 2.7 2.8 0.1 −0.2 Japan 2.4 2.6 −0.3 0.1Japan 1.0 1.1 −0.2 0.1 Hong Kong 3.1 4.1 −1.0 −0.1 Pakistan 2.9 3.4 −0.9 0.4 Singapore 2.7 4.1 −0.8 −0.7Thailand −0.8 0.4 −1.2 0.0 Nepal 2.7 3.2 −0.8 0.1 ROC 1.9 4.2 −2.4 0.1 Korea 2.7 2.4 0.3 0.0
ROC 2.6 3.8 −1.4 0.2 Japan −0.3 0.1 −0.5 0.1 Japan 1.2 1.0 0.0 0.2Japan 1.0 1.2 −0.3 0.1 Fiji −0.5 −0.4 0.1 −0.2 Iran −2.3 1.4 −3.7 0.1
Bahrain 6.0 3.5 2.9 −0.3 Bahrain 7.8 6.5 1.3 0.0 Bahrain 8.5 6.4 3.5 −1.4 Bahrain 3.1 3.9 −1.6 0.8 Bahrain 5.6 4.8 0.9 −0.1Kuwait 6.4 1.6 4.4 0.3 Kuwait 10.6 7.2 4.6 −1.2 Kuwait 3.2 0.4 3.3 −0.5 Kuwait −1.4 3.5 −5.4 0.5 Kuwait 4.5 0.9 3.2 0.5Oman 8.2 4.2 4.4 −0.4 Oman 8.1 3.0 4.9 0.2 Oman 6.4 3.0 4.0 −0.6 Oman 2.0 3.9 −2.5 0.6 Oman 7.3 6.1 1.0 0.2Qatar 13.5 8.7 5.8 −0.9 Qatar 12.1 9.8 4.6 −2.3 Qatar 15.0 13.4 1.0 0.5 Qatar 5.2 6.3 −2.8 1.7 Qatar 6.2 6.1 0.1 0.1Saudi Arabia 4.9 3.0 2.1 −0.2 Saudi Arabia 9.1 4.0 5.2 −0.1 Saudi Arabia 5.5 2.7 2.7 0.2 Saudi Arabia 1.8 4.9 −3.3 0.2 Saudi Arabia 5.1 4.2 0.4 0.5UAE 8.0 6.6 1.9 −0.4 UAE 6.8 5.1 1.8 −0.1 UAE 1.2 2.6 −1.1 −0.3 UAE 3.9 6.2 −2.4 0.1 UAE 9.5 9.8 −0.7 0.3Brunei 5.0 1.9 3.2 0.0 Brunei 7.8 3.0 4.7 0.0 Brunei 4.6 −1.8 6.6 −0.2 Brunei −0.9 −1.0 −1.1 1.2(reference) (reference) (reference) (reference) (reference)US 4.3 4.2 0.1 0.0 US 2.5 2.5 0.0 0.1 US 0.8 0.7 −0.1 0.1 US 2.2 2.1 0.1 0.0 US 2.7 2.8 0.0 0.0EU15 2.8 2.9 −0.1 0.1 EU15 1.9 1.7 0.1 0.1 EU15 0.7 0.7 −0.1 0.0 EU15 0.8 0.9 0.1 −0.2 EU15 2.1 2.1 0.0 0.0
EU28 1.9 1.7 0.1 0.1 EU28 0.8 0.8 −0.1 0.0 EU28 1.1 1.0 0.1 −0.1Australia 4.1 3.8 0.1 0.2 Australia 4.3 3.3 1.2 −0.2 Australia 4.2 2.8 1.4 0.0 Australia 1.8 2.8 −1.4 0.4 Australia 3.3 3.3 0.1 0.0Turkey 4.1 4.5 −0.3 −0.1 Turkey 4.4 4.6 0.3 −0.5 Turkey 3.4 3.9 −0.3 −0.1 Turkey 6.5 6.8 −0.3 −0.1 Turkey 4.4 4.6 −0.1 −0.1
©20
18 A
sian
Prod
uctiv
ity O
rgan
izat
ion

166
Appendix
Industry ClassificationA.10
Cambodia, Iran, the Lao PDR, Nepal, and China use the International Standard Industry Classification of All Economic Activities (ISIC) Rev.3. Other Asian economies already have switched to the ISIC Rev.4. The concordances between the industry classification used in the Databook and the ISIC Rev.3 and Rev.4 are shown in Tables 26 and 27, respectively.
ISIC Rev. 3Division
DatabookSection 1st 2ndA - Agriculture, hunting, and forestry 01
02Agriculture, hunting, and related service activitiesForestry, logging, and related service activities
11
B - Fishing 05 Fishing, operation of fish hatcheries, and fish farms; service activities incidental to fishing 1
C - Mining and quarrying 1011
121314
Mining of coal and lignite; extraction of peatExtraction of crude petroleum and natural gas; service activities incidental to oil and gas extraction excluding surveyingMining of uranium and thorium oresMining of metal oresOther mining and quarrying
22
222
D - Manufacturing 151617181920
2122232425262728293031323334353637
Manufacture of food products and beveragesManufacture of tobacco productsManufacture of textilesManufacture of wearing apparel; dressing and dyeing of furTanning and dressing of leather; manufacture of luggage, handbags, saddlery, harness, and footwearManufacture of wood and of products of wood and cork, except furniture; manufacture of articles of straw and plaiting materialsManufacture of paper and paper productsPublishing, printing, and reproduction of recorded mediaManufacture of coke, refined petroleum products, and nuclear fuelManufacture of chemicals and chemical productsManufacture of rubber and plastics productsManufacture of other non-metallic mineral productsManufacture of basic metalsManufacture of fabricated metal products, except machinery and equipmentManufacture of machinery and equipment n.e.c.Manufacture of office, accounting, and computing machineryManufacture of electrical machinery and apparatus n.e.c.Manufacture of radio, television, and communication equipment and apparatusManufacture of medical, precision, and optical instruments, watches, and clocksManufacture of motor vehicles, trailers, and semi-trailersManufacture of other transport equipmentManufacture of furniture; manufacturing n.e.c.Recycling
333333
33333333333333333
3.13.13.23.23.23.3
3.43.43.53.53.53.63.73.83.83.83.83.83.83.83.83.93.9
E - Electricity, gas, and water supply 4041
Electricity, gas, steam, and hot water supplyCollection, purification, and distribution of water
44
F - Construction 45 Construction 5
G - Wholesale and retail trade; repair of motor vehicles, motorcycles, and personal and household goods
505152
Sale, maintenance, and repair of motor vehicles and motorcycles; retail sale of automotive fuelWholesale trade and commission trade, except of motor vehicles and motorcyclesRetail trade, except of motor vehicles and motorcycles; repair of personal and household goods
666
H - Hotels and restaurants 55 Hotels and restaurants 6
I - Transport, storage, and communications
6061626364
Land transport; transport via pipelinesWater transportAir transportSupporting and auxiliary transport activities; activities of travel agenciesPost and telecommunications
77777
J - Financial intermediation 656667
Financial intermediation, except insurance and pension fundingInsurance and pension funding, except compulsory social securityActivities auxiliary to financial intermediation
888
K - Real estate, renting, and business activities
7071727374
Real estate activitiesRenting of machinery and equipment without operator and of personal and household goodsComputer and related activitiesResearch and developmentOther business activities
88888
L - Public administration and defence; compulsory social security
75 Public administration and defence; compulsory social security 9
M - Education 80 Education 9
N - Health and social work 85 Health and social work 9
O - Other community, social, and personal service activities
90919293
Sewage and refuse disposal, sanitation, and similar activitiesActivities of membership organizations n.e.c.Recreational, cultural, and sporting activitiesOther service activities
9999
P - Private households with employed persons
95 Private households with employed persons 9
Q - Extra-territorial organizations and bodies
99 Extra-territorial organizations and bodies 9
Note: “n.e.c.” represents “not elsewhere classified.”
Table 26 Industry Classification – Concordance with ISIC Rev.3
©20
18 A
sian
Prod
uctiv
ity O
rgan
izat
ion

167
A.10 Industry Classification
App.
Table 27 Industry Classification – Concordance with ISIC Rev.4
Note: The concordance (b) is used if the division-level data is available. The concordance (a) is used if only the section-level data is available.
ISIC Rev. 4Section Division
Databook1st 2nd
(a) (b)A - Agriculture, forestry, and fishing 1
23
Crop and animal production, hunting, and related service activitiesForestry and loggingFishing and aquaculture
1 111
B - Mining and quarrying 56789
Mining of coal and ligniteExtraction of crude petroleum and natural gasMining of metal oresOther mining and quarryingMining support service activities
2 22222
C - Manufacturing 10111213141516
1718192021222324252627282930313233
Manufacture of food productsManufacture of beveragesManufacture of tobacco productsManufacture of textilesManufacture of wearing apparelManufacture of leather and related productsManufacture of wood and of products of wood and cork, except furniture; manufacture of articles of straw and plaiting materialsManufacture of paper and paper productsPrinting and reproduction of recorded mediaManufacture of coke and refined petroleum productsManufacture of chemicals and chemical productsManufacture of basic pharmaceutical products and pharmaceutical preparationsManufacture of rubber and plastics productsManufacture of other non-metallic mineral productsManufacture of basic metalsManufacture of fabricated metal products, except machinery and equipmentManufacture of computer, electronic and optical productsManufacture of electrical equipmentManufacture of machinery and equipment n.e.c.Manufacture of motor vehicles, trailers and semi-trailersManufacture of other transport equipmentManufacture of furnitureOther manufacturingRepair and installation of machinery and equipment
3 3333333
33333333333333333
3.13.13.13.23.23.23.3
3.43.43.53.53.53.53.63.73.83.83.83.83.83.83.83.93.9
D - Electricity, gas, steam, and air conditioning supply
35 Electricity, gas, steam, and air conditioning supply 4 4
E - Water supply; sewerage, waste management, and remediation activities
36373839
Water collection, treatment, and supplySewerageWaste collection, treatment, and disposal activities; materials recoveryRemediation activities and other waste management services
4 4999
F - Construction 414243
Construction of buildingsCivil engineeringSpecialized construction activities
5 555
G - Wholesale and retail trade; repair of motor vehicles and motorcycles
454647
Wholesale and retail trade and repair of motor vehicles and motorcyclesWholesale trade, except of motor vehicles and motorcyclesRetail trade, except of motor vehicles and motorcycles
6 666
H - Transportation and storage 4950515253
Land transport and transport via pipelinesWater transportAir transportWarehousing and support activities for transportationPostal and courier activities
7 77777
I - Accommodation and food service activities
5556
AccommodationFood and beverage service activities
6 66
J - Information and communication 5859
60616263
Publishing activitiesMotion picture, video, and television programme production, sound recording and music publishing activitiesProgramming and broadcasting activitiesTelecommunicationsComputer programming, consultancy, and related activitiesInformation service activities
7 39
9788
K - Financial and insurance activities 646566
Financial service activities, except insurance and pension fundingInsurance, reinsurance, and pension funding, except compulsory social securityActivities auxiliary to financial service and insurance activities
8 888
L - Real estate activities 68 Real estate activities 8 8
M - Professional, scientific, and technical activities
69707172737475
Legal and accounting activitiesActivities of head offices; management consultancy activitiesArchitectural and engineering activities; technical testing and analysisScientific research and developmentAdvertising and market researchOther professional, scientific, and technical activitiesVeterinary activities
8 8888889
N - Administrative and support service activities
777879808182
Rental and leasing activitiesEmployment activitiesTravel agency, tour operator, reservation service, and related activitiesSecurity and investigation activitiesServices to buildings and landscape activitiesOffice administrative, office support, and other business support activities
9 997999
O - Public administration and defence; compulsory social security
84 Public administration and defence; compulsory social security 9 9
P - Education 85 Education 9 9
Q - Human health and social work activities
868788
Human health activitiesResidential care activitiesSocial work activities without accommodation
9 999
R - Arts, entertainment, and recreation 90919293
Creative, arts, and entertainment activitiesLibraries, archives, museums, and other cultural activitiesGambling and betting activitiesSports activities and amusement and recreation activities
9 9999
S - Other service activities 949596
Activities of membership organizationsRepair of computers and personal and household goodsOther personal service activities
9 969
T - Activities of households as employers; undifferentiated goods- and services-producing activities of households for own use
9798
Activities of households as employers of domestic personnelUndifferentiated goods- and services-producing activities of private households for own use
9 99
U - Activities of extraterritorial organizations and bodies
99 Activities of extraterritorial organizations and bodies 9 9
©20
18 A
sian
Prod
uctiv
ity O
rgan
izat
ion
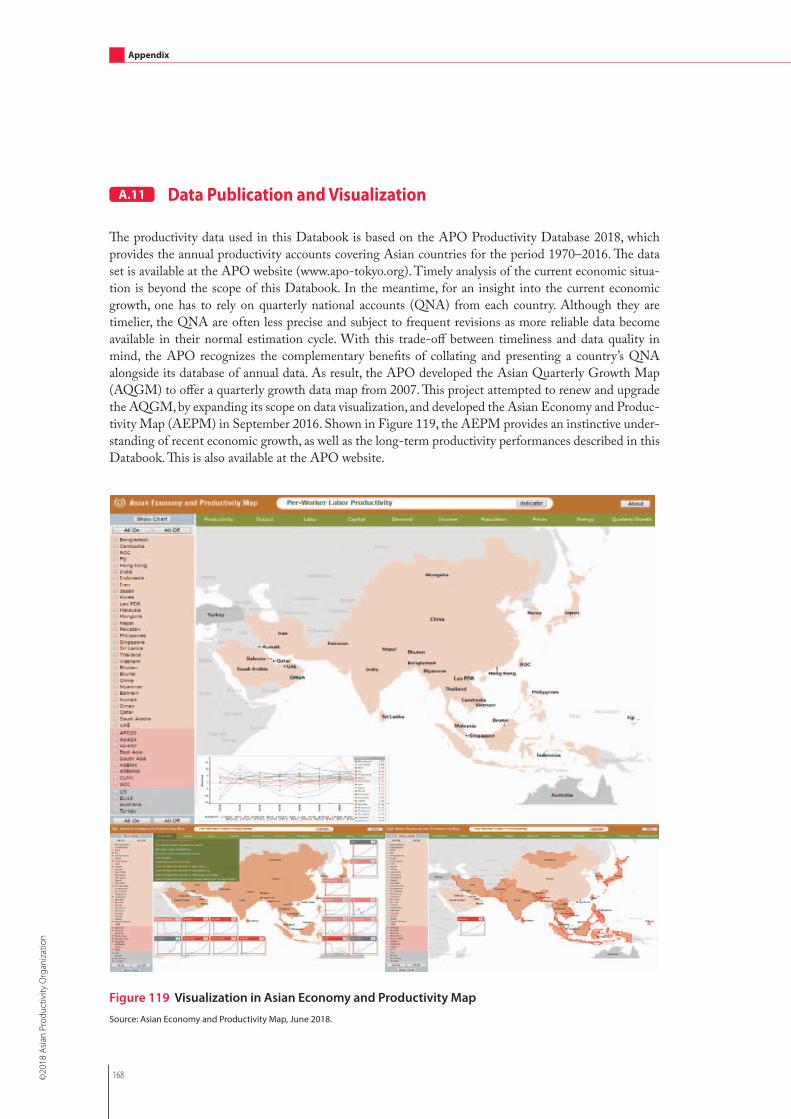
168
Appendix
Data Publication and VisualizationA.11
The productivity data used in this Databook is based on the APO Productivity Database 2018, which provides the annual productivity accounts covering Asian countries for the period 1970–2016. The data set is available at the APO website (www.apo-tokyo.org). Timely analysis of the current economic situa-tion is beyond the scope of this Databook. In the meantime, for an insight into the current economic growth, one has to rely on quarterly national accounts (QNA) from each country. Although they are timelier, the QNA are often less precise and subject to frequent revisions as more reliable data become available in their normal estimation cycle. With this trade-off between timeliness and data quality in mind, the APO recognizes the complementary benefits of collating and presenting a country’s QNA alongside its database of annual data. As result, the APO developed the Asian Quarterly Growth Map (AQGM) to offer a quarterly growth data map from 2007. This project attempted to renew and upgrade the AQGM, by expanding its scope on data visualization, and developed the Asian Economy and Produc-tivity Map (AEPM) in September 2016. Shown in Figure 119, the AEPM provides an instinctive under-standing of recent economic growth, as well as the long-term productivity performances described in this Databook. This is also available at the APO website.
Figure 119 Visualization in Asian Economy and Productivity Map
Source: Asian Economy and Productivity Map, June 2018.
©20
18 A
sian
Prod
uctiv
ity O
rgan
izat
ion

169
ADB (2017) Asian Development Outlook 2017: Asia’s Potential Growth, Manila: Asian Development Bank.ADB (2018) Asian Development Outlook 2018: How Technology Affects Jobs, Manila: Asian Development Bank.Baier, Scott L., Gerald P. Dwyer, and Robert Tamura (2006) “How Important Are Capital and Total Factor
Productivity for Economic Growth?” Economic Inquiry 44(1), pp. 23–49.Baldwin, Richard (2016) The Great Convergence: Information Technology and the New Globalization, Cambridge,
MA: Belknap Harvard University Press.Bosworth, Barry P. (2005) “Economic Growth in Thailand: The Macroeconomic Context,” paper presented to
World Bank project on investment climate, firm competitiveness and growth in Thailand.Bosworth, Barry P. and Susan M. Collins (2008) “Accounting for Growth: Comparing China and India,” Jour-
nal of Economic Perspective 22(1), pp. 45–66.Brookings Institution (2015) “Global Metro Monitor 2014,” Metropolitan Policy Program, Washington, D.C.Caselli, Francesco (2005) “Accounting for Cross-Country Income Differences,” in P. Aghion and S. N. Durlauf
(eds.) Handbook of Economic Growth, Amsterdam: North Holland, pp. 679–741.Cooley, Thomas F. and Espen Henriksen (2018) “The Demographic Deficit,” Journal of Monetary Economics 93,
pp. 45–62.Cororaton, Caesar B. (2002) “Total Factor Productivity in the Philippines,” Discussion Paper Series 2002–01,
Philippine Institute for Development Studies, Makati.Dapice, David, Thomas Valley, Ben Wilkinson, and Michael Montesano (2010) “Revitalizing Agriculture in
Myanmar: Breaking Down Barriers, Building a Framework for Growth,” Cambridge, MA: Harvard Univer-sity, Kennedy School of Government, ASH Center.
Department of Statistics Malaysia (2017) National Accounts Capital Stock Statistics 2016, December.Diewert, W. Erwin and Denis Lawrence (2006) “Measuring the Contributions of Productivity and Terms of
Trade to Australia’s Economic Welfare,” report by Meyrick and Associates to Australian Government Pro-ductivity Commission, Canberra.
Diewert, W. Erwin and Catherine J. Morrison (1986) “Adjusting Outputs and Productivity Indexes for Changes in the Terms of Trade,” Economic Journal 96(3), pp. 659–679.
Diewert, W. Erwin, Hideyuki Mizobuchi, and Koji Nomura (2005) “On Measuring Japan’s Productivity, 1995–2003,” Department of Economics Discussion Paper Series No. 05–22, December, Vancouver: Univer-sity of British Columbia.
Eichengreen, B., Donghyun Park, and Kwanho Shin (2012) “When Fast Growing Economies Slow Down: International Evidence and Implications for China,” Asian Economic Papers 11(1).
Eurostat-OECD (2012) Eurostat-OECD Methodological Manual on Purchasing Power Parities, 2012 edition, Eu-rostat Methodologies and Working Papers, European Union/OECD.
Fei, J. C. H. and G. Ranis (1964) Development of the Labor Surplus Economy: Theory and Policy, Homewood, Il-linois: Richard D. Irwin.
Furman, Jason and Wilson Powell (2018) “Why Have Employment Rates in the United States Lagged Other Countries?” PIIE Realtime Economic Issues Watch, 6 June.
GCC Secretariat General (2017) GCC: A Statistical Glance 2015, February.Global Witness (2015a) Lords of Jade, London: Global Witness. Global Witness (2015b) Jade: Myanmar’s “Big State Secret”, London: Global Witness.Gollin, Douglas, Stephen L. Parente, and Richard Rogerson (2004) “Farm Work, Home Work and Interna-
tional Productivity Differences,” Review of Economic Dynamics 7, pp. 827–850.Hallward-Driemeier, Mary and Gaurav Nayyar (2018) Trouble in the Making? The Future of Manufacturing-
Led Development, Washington, D.C.: The World Bank.Holz, Carsten A. (2006) “Measuring Chinese Productivity Growth, 1952–2005,” SSRN Electronic Journal,
10.2139/ssrn.928568.ILO (2013) Measuring Informality: A Statistical Manual on the Informal Sector and Informal Employment, Geneva:
ILO.IMF (2018) World Economic Outlook, Washington, D.C.: International Monetary Fund.Jorgenson, Dale W. and Zvi Griliches (1967) “The Explanation of Productivity Change,” Review of Economic
Studies 34(3), pp. 249–283.Jorgenson, Dale W., Mun S. Ho, and Kevin J. Stiroh (2005) Information Technology and the American Growth
Resurgence, Cambridge, MA: MIT Press.Jorgenson, Dale W. and Koji Nomura (2005) “The Industry Origins of Japanese Economic Growth,” Journal of
Japanese and International Economies 19 (4), pp. 482–542.Jorgenson, Dale W., Koji Nomura, and Jon D. Samuels (2016) “A Half Century of Trans-Pacific Competition:
Price Level Indices and Productivity Gaps for Japanese and U.S. Industries, 1955–2012,” in D. W. Jorgenson, et al. (eds.) The World Economy: Growth or Stagnation? Cambridge: Cambridge University Press, Chap.13.
References
©20
18 A
sian
Prod
uctiv
ity O
rgan
izat
ion

170
References
Kohli, Ulrich (2004) “Real GDP, Real Domestic Income and Terms of Trade Changes,” Journal of International Economics 62(1), pp. 83–106.
Kohli, Ulrich (2006) “Real GDP, Real GDI, and Trading Gains: Canada, 1981–2005,” International Productiv-ity Monitor 13, pp. 46–56.
Lewis, W. Arthur (1954) “Economic Development with Unlimited Supplies of Labour,” The Manchester School 22(2), pp. 139–191.
Lutz, Wolfgang, William P. Butz, and Samir KC (2014) World Population and Human Capital in the Twenty-First Century, Oxford: Oxford University Press.
Maddison, Angus (2007) Contours of the World Economy 1-2030 Ad: Essays in Macro-economic History, Oxford: Oxford University Press.
Nomura, Koji (2018) “Productivity Growth in Asia and Its Country Origins,” in Das Kusum Deb, et al. (eds.) Productivity Dynamics in Emerging and Industrialized Countries, New Delhi: Taylor & Francis Routledge India, Chap.3.
Nomura, Koji and Hiroshi Shirane (2016) “Redefining the Picture of Myanmar’s Economic Growth: Trade, Production, and Jade,” KEO Discussion Paper No. 141.
Nomura, Koji and Naoyuki Akashi (2017) “Measuring Quality-adjusted Labor Inputs in South Asia, 1970–2015,” KEO Discussion Paper No. 143.
Obashi, Ayako and Fukunari Kimura (2018) “Are Production Networks Passé in East Asia? Not Yet,” Forth-coming in Asian Economic Papers.
OECD (2001) Measuring Productivity- OECD Manual, Paris: OECD.OECD (2009) Measuring Capital- OECD Manual, 2nd edition, Paris: OECD.OECD (2018a) OECD Compendium of Productivity Indicators 2018, May, Paris: OECD.OECD (2018b) OECD Economic Outlook 2018, May, Paris: OECD.Ohkawa, Kazushi, Nobukiyo Takamatsu, and Yuzo Yamamoto (1974) Estimates of Long-Term Economic Statis-
tics of Japan since 1868 Vol. 1, National Income, Tokyo: Toyo Keizai Shinposha (in Japanese).Rodrik, Dani (2016) “Premature Deindustrialization,” Journal of Economic Growth 21(1), pp. 1–33.Schreyer, Paul (2002) “Computer Price Indices and International Growth and Productivity Comparisons,” Re-
view of Income and Wealth 48(1), pp. 15–33.Schreyer, Paul, Pierre-Emmanuel Bignon, and Julien Dupont (2003) “OECD Capital Services Estimates:
Methodology and a First Set of Results,” OECD Statistics Working Paper 2003/6, Paris: OECD.The Economist Intelligence Unit (2010) “Country Report: Myanmar, January 2010,” available at http://www.eiu.
com/.The Economist Intelligence Unit (2014) “Business Environment Rankings- Which Country is Best to Do
Business In?” available at http://www.eiu.com/.UNDESA (2016) A Growth Accounting Framework for the Kingdom of Bhutan, 1990–2014, New York: United
Nations Department of Economic and Social Affairs.United Nations (1993) System of National Accounts 1993, New York: United Nations.United Nations (2008) International Standard Industrial Classification of all Economic Activities, Revision 4,
Department of Economic and Social Affairs Statistics Division, Statistical Papers Series M No.4/Rev.4.United Nations (2009) System of National Accounts 2008, New York: United Nations.United Nations (2017) World Population Prospects: The 2017 Revision, New York: United Nations.United Nations Conference on Trade and Development (2017) World Investment Report 2017, Geneva: United
Nations Conference on Trade and Development.Van der Eng, Pierre (2008) “Capital Formation and Capital Stock in Indonesia, 1950–2007,” Working Papers
in Trade and Development 2008/24, Australian National University, Canberra.Van der Eng, Pierre (2009) “Total Factor Productivity and Economic Growth in Indonesia,” Working Papers in
Trade and Development 2009/01, Australian National University, Canberra.Vu, Khuong Minh (2013) The Dynamics of Economic Growth: Policy Insights from Comparative Analysis in Asia,
Cheltenham: Edward Elgar.Warr, Peter (2006) “Productivity Growth in Thailand and Indonesia: How Agriculture Contributes to Economic
Growth,” Working Paper in Economics and Development Studies 2006/06, Padjadjaran University, Bandung.World Bank (2014) Purchasing Power Parities and Real Expenditures of World Economies: Summary of Results and
Findings of the 2011 International Comparison Program, Washington, D.C.: World Bank.World Bank (2017) World Development Indicators 2017, Washington, D.C.: World Bank.World Bank (2018) Doing Business 2018, Washington, D.C.: World Bank.Zhang, Jun and Zhu Tian (2013) “Poor Chinese Consumption Data Creates Savings Myth,” World Economics
14(2).
©20
18 A
sian
Prod
uctiv
ity O
rgan
izat
ion

©20
18 A
sian
Prod
uctiv
ity O
rgan
izat
ion