organising environmental scanning: exploring information ... · organising environmental scanning:...
TRANSCRIPT

1
Organising Environmental Scanning: Exploring Information Source, Mode and the
Impact of Firm Size
Craig V. Robinson (corresponding author)
Edinburgh Business School, Heriot-Watt University
Edinburgh, EH14 4AS, United Kingdom
Email: [email protected]
Tel: (+44) 131 451 4066
John E. L. Simmons
Edinburgh Business School, Heriot-Watt University
Edinburgh, EH14 4AS, United Kingdom
Email: [email protected]
Tel: (+44) 131 451 4066

2
Organising Environmental Scanning: Exploring Information Source, Mode and the
Impact of Firm Size
Abstract
Recent research on environmental scanning has shown it to be an important part of many
organisational processes related to strategy. A fundamental aspect of scanning behaviour is
the mode or channel through which information is gathered. Existing research on mode
selection and source use has suggested that managers prefer to use personal sources that are
either internal to or external to the organisation depending on context. What is not clear,
however, is why one source may be preferred to another and how different scanning modes
might complement each other. We explore these issues through the collection and analysis of
interview data from seven organisations of widely differing sizes. Using the organisation
itself as the unit of analysis, we offer a number of theoretical contributions concerned with
mode and source use in environmental scanning activity. We find that quality of information
source may be less important in explaining source use than previous studies suggest. We also
uncover heavy reliance on internal reporting on the environment, compiled using multiple
channels, in larger companies. Furthermore, we present a variety of instances where scanning
modes were used to complement one another in different ways, the patterns changing
according to organisation size. Our findings, while exploratory and theoretical in nature, also
have practical implications for growing organisations that wish to ensure their environment is
scanned as effectively as possible.

3
Introduction
Environmental scanning is the process through which an organisation gathers information
about its external environment (Aguilar, 1967). Scanning is a key input into scenario
planning (Sharma & Yang, 2015), an antecedent to strategic change (Ben-Menahem et al.,
2013) and a driver of innovation (Berghman et al., 2013; Martini et al., 2016). In more
general terms scanning has come to be viewed as part of a wider process of organisational
learning (Daft & Weick, 1984; Drew, 1999; Sadler-Smith et al., 2001), and an integral
component of the ‘sensing’ aspect of an organisation’s dynamic capabilities (Danneels, 2008;
Fainshmidt & Frazier, 2016; Teece, 2007; Wilden et al., 2013).
The activity of environmental scanning itself has been examined extensively in preceding
literature, and appears to be driven in its focus and intensity by the level of perceived
environmental uncertainty in strategically important sectors of the environment (Boyd &
Fulk, 1996; Elenkov, 1997; Stewart et al., 2008). Systems for scanning the environment have
been studied for their effectiveness and, while early results on their usefulness were mixed
(e.g. Fahey & King, 1977; Jain, 1984), there now seems general agreement that more
effective systems should be integrated into the planning and decision-making processes of the
organisation (e.g. Lenz & Engledow, 1986; Mayer, 2011; Yasai-Ardekani & Nystrom, 1996).
A key characteristic of scanning behaviour that emerges from the literature is the medium or
channel through which information is gathered, often referred to as scanning mode (Daft et
al., 1988; May et al., 2000). Research on mode has found that size of organisation is more
important than industry setting in driving channel selection (Haase & Franco, 2011), and
more recently that organisations use a variety of both primary and secondary sources to scan
their environments even when formal systems do not exist (du Toit, 2016). Yet there is little
to explain why some sources are more popular than others and research to date has struggled

4
to address the way in which different information sources complement each other in the
organisation. We seek here to explore both these issues, using detailed qualitative data from
seven different organisations.
This paper is organised as follows. We first examine the current state of environmental
scanning literature and provide an overview of the methods employed in our research. We
then look at the relative importance of different information sources in scanning and offer
some possible explanations for the choices made. Following on from this, we propose three
tentative models of scanning mode use, dependent on the size of the organisation. These
models together capture some of the ways in which different sources are used by
organisations to develop a picture of the environment and provide further insight into the way
in which different information channels might complement one another.
Theoretical Background
Scanning research has examined a variety of issues and there has been a move towards
studying scanning in relation to other organisational variables in recent years. These include
scanning’s contribution to new product development and innovation (Danneels & Sethi,
2011; So-Jin & Sawyerr, 2014), its role in the development of sustainable supply chains
(Fabbe-Costes et al., 2014) and its importance in wider competence development and
knowledge management (Bedford & Harrison, 2015; Taipale-Erävala et al., 2015).
A number of country-specific studies have also been conducted, demonstrating that country
of origin may impact aspects of scanning behaviour (Barron et al., 2012; Stewart et al., 2008),
and that deliberate scanning as an input into planning processes can affect companies’
responsiveness to change (Olamade et al., 2011). At the same time, the need for proper
internal information systems to support scanning has also been identified (Mayer et al.,
2013).

5
A review of research related to scanning mode reveals a number of key themes and issues,
the first of which is concerned with the term mode itself. Very early work by Keegan (1974)
used interviews with senior managers to establish the information sources used to scan the
environment, finding scanning to be informal and unstructured in nature. These were
categorised as either internal or external sources, and as either human or documentary types
of information. A similar breakdown was used by Daft et al. (1988) but new terminology was
used and the expression scanning mode introduced. This was in contrast to research published
around the same time (Ghoshal, 1988), which examined sources of information used by
managers to scan the environment but used the word ‘mode’ to refer to intensity of scanning
in four categories, viewing, monitoring, investigation and research.
The approach adopted in later research (e.g. Elenkov, 1997; Jogaratnam & Wong, 2009; May
et al., 2000; Sawyerr, 1993; Stewart et al., 2008), and the approach followed in this paper, has
been to treat mode and source/channel as synonymous. A breakdown of four scanning modes,
internal personal, internal impersonal, external personal and external impersonal, is
provided in Figure 1, along with source examples. This figure provides a framework for
reviewing prior research on scanning mode below. First we examine existing knowledge of
personal versus impersonal channels and second we examine the use of internal versus
external media. Table 1 provides an overview of papers that directly address scanning mode,
with notes on findings about internal and external, and personal versus impersonal sources.
The third column provides a summary of the paper’s primary focus. These studies are
reviewed next with a view to proposing research questions.
--------------------------------
INSERT FIGURE 1 HERE
--------------------------------
--------------------------------
INSERT TABLE 1 HERE
--------------------------------

6
With regard to the personal or impersonal nature of a data source, findings suggest that
managers overwhelmingly prefer information received directly from other people
(Aldehayyat, 2015; Choo, 1994; Ghoshal, 1988; Jogaratnam & Law, 2006; Smeltzer et al.,
1988). This preference is not absolute, however, and a number of moderating factors exist,
including quality and accessibility of information (Culnan, 1983; May et al., 2000). It has
been suggested that quality of information is more of a concern for managers than
accessibility (Auster & Choo, 1994a).
The existence of uncertainty in a given sector of the environment has been shown to relate to
increased reliance on personal information sources (Daft et al., 1988; Elenkov, 1997),
perhaps because of the non-availability of hard data, but there is also evidence to suggest that
this relationship depends on the sector of the environment in question (Auster & Choo,
1994b; Sawyerr, 1993) or the national setting in which scanning takes place (Barron et al.,
2015; Sawyerr et al., 2003a). The age of the organisation in question has also been shown to
affect channel selection, where personal channels are used more by ‘younger’ organisations
(McGee & Sawyerr, 2003).
Impersonal sources tend to be used either when personal sources are not available (Sawyerr,
1993) or as a complement to information gathered through personal channels (Jennings &
Jones, 1999; Julien et al., 1999).
Findings on preference for external or internal sources have varied over time. Early work
tended to emphasise the external source over the internal, in that customers, family, friends
were preferred to employees or colleagues (Ghoshal, 1988; Sawyerr, 1993; Smeltzer et al.,
1988). It has, however, been proposed that internal sources are perceived to be of better
quality than external ones (Choo, 1994). Furthermore, other studies have suggested that

7
internal sources are preferred regardless of their personal or impersonal nature (Sawyerr et
al., 2000).
Uncertainty also appears to influence the selection of internal and external channels.
Increased uncertainty in a given environment sector is related to increased reliance on both
internal and external sources (Daft et al., 1988), or on external sources only (Elenkov, 1997;
Sawyerr, 1993). Other studies (e.g. Aldehayyat, 2015; Sawyerr et al., 2003b) have found the
existence of uncertainty in a given environment sector to result in a preference for external,
personal sources.
More recent studies that have addressed scanning mode found that larger organisations scan
more often and use a wider array of information sources than smaller ones (Aldehayyat,
2015; Haase & Franco, 2011). In addition it has been found that increased use of personal and
external sources is related to the success of new product introductions (So-Jin & Sawyerr,
2014) and that both primary and secondary sources are used frequently to scan the
environment (du Toit, 2016). None of these studies, however, have examined the reasons
behind the choice of one source over another.
Overall, research on scanning mode appears to acknowledge, either tacitly or explicitly, that
managers use multiple channels to acquire information on the external environment and there
is likely to be a degree of complementarity between different sources. It is this
complementarity that we intend to explore in more detail.
It is of interest that the four most recent papers in Table 1 have focused on examining
scanning in different national contexts. More generally, recent research has tended to look at
environmental scanning in relation to other organisational variables (Fabbe-Costes et al.,
2014; Taipale-Erävala et al., 2015). Our approach, in contrast, is to focus only on mode of
scanning. We seek here to explore the reasons behind particular media being chosen and the

8
way in which they are used to complement one another. This aim precipitates two research
questions as follows:
Why are some information sources more popular than others?
How do different modes of scanning complement one another in organisations?
Methods
The focus of our research on ‘how’ and ‘why’ issues made a case-based research design
appropriate (Yin, 2013). Existing research on mode has been predominantly quantitative in
nature, with only four of the papers in Table 1 using any qualitative data (Auster & Choo,
1994b; Ghoshal, 1988; Jennings & Jones, 1999; Keegan, 1974). This may help to explain the
relatively limited understanding of how and why different modes complement one another
and suggests that a qualitative approach could be useful, in that it could assist in providing a
new perspective on existing phenomena (Creswell, 2012). An interpretive, qualitative
approach was selected also because of its ability to facilitate detection of nuances and detail
that might otherwise have been missed (Bettis et al., 2015).
It is worthy of note that the unit of analysis used in all preceding studies of scanning mode,
apart from one (du Toit, 2016), has been the individual. We therefore decided that, in order to
explore complementarity of channels properly, an organisational perspective rather than and
individual one was required.
Our fieldwork was conducted in two stages. First, in order to gain a wide view of the
channels through which organisations scan their environments, data from seven companies of
radically different sizes was collected and analysed. Second, after analysis was complete,
respondents in three of the seven organisations were re-engaged to confirm validity of the
results of the analysis and discuss the outcomes of the research.

9
Sampling
A theoretical sampling approach (Eisenhardt & Graebner, 2007) was used to select
companies for the study. This involved choosing an initial sample that would produce as
much variability of behaviour as possible and expanding it until theoretical saturation was
reached.
Initially the research was restricted to companies in and around the oil and gas industry.
Previous studies of scanning mode have often used single industries as an empirical domain
(e.g. Daft et al., 1988; Jogaratnam & Law, 2006), the intention being to minimise the
likelihood of different scanning behaviours being driven by industry context. Others have
used multiple industries (e.g. Aldehayyat, 2015) or multiple countries (e.g. Sawyerr et al.,
2003a; Stewart et al., 2008), the intention being to compare scanning behaviour across
different industries or geographic areas.
It has in fact been proposed that firm size may be a more important determinant of scanning
behaviour than industry setting (Haase & Franco, 2011). Indeed, once the data collection
process began, the variation in both behaviour and context of the organisations studied
suggested that restricting the sample to a single industry was not meaningful. Thus the scope
of the sample was expanded to also include a financial services and a defence industry
organisation.
It was concluded after the seventh company had been studied, where a significant degree of
replication with earlier cases occurred, that a sufficiently heterogeneous and rich set of data
had been collected. Theoretical saturation requires that data collected must be adequate for
the purposes of addressing the research question (Bowen, 2008). Eisenhardt (1989) noted that
data collection should end once improvements become marginal. There appeared to be

10
sufficient replication of activity and approaches, both within the three size groups and across
the seven cases, to suggest that theoretical saturation had been reached.
Interviews were conducted between October 2011 and April 2014, either at company
headquarters or by telephone. In order to achieve access at the level required, significant
negotiation was required over a period of time, making use of personal contacts in the first
instance. Written approval (via email) was then sought from a senior manager before
interviews were conducted. Table 2 contains a breakdown of the seven companies studied
with details on industry, company type, size based on the number of employees, geographic
spread, and positions of those interviewed. Participating organisations are labelled A to G in
the order in which they were analysed.
--------------------------------------------
INSERT TABLE 2 ABOUT HERE
---------------------------------------------
Respondents within cases had to meet the following criteria to be approached for interview.
Be in a role that required some involvement in corporate or strategic business unit
(SBU) strategy. In the larger companies respondents at corporate level were
prioritised.
Operate at a level sufficiently high to have a view of the organisation as a whole.
Have some engagement with the external environment, either as a decision maker or
in a role that required examination of the external environment.
The respondents included chief executives, directors of corporate strategy, heads of SBUs
and members of environment teams. All were in roles requiring involvement in corporate or
business unit strategy and were at a senior level. Critically, all had engagement with the
environment external to their organisation. To avoid collection of data about individual
behaviour, questions were framed around the behaviour of the organisation as a whole rather

11
than that of the individual respondent, in a similar manner to the approach adopted by du Toit
(2016).
The possibility of functional bias in the cases was minimised by using multiple respondents
where access allowed and secondary data to support the analysis. The majority of individuals
who were asked to participate did so, but three proposed participants did not respond to
requests for interview, one each in companies B, E and G.
The number of available respondents in each company was limited by the level of access that
it was possible to negotiate. In companies A and B a single senior manager was interviewed.
In all other cases at least two senior managers were interviewed. One further company was
excluded from the research because of insufficient quality and quantity of data. This was in
part due to the fact that only one person was interviewed. In the case of companies A and B,
however, the focus of the interview questions on the organisation as the unit of analysis,
combined with the position of the respondent in each case (the CEO for company A and a
senior executive at the corporate level for company B) allowed for collection of sufficient
data for case study development. It is recognised that the case report for these two companies
is based on the personal judgement of the individuals in question.
Semi-structured interviews were chosen, being an appropriate technique to use when it is not
possible to repeatedly interview respondents (Bernard, 2012). Interviews were between 45
minutes and 2 hours in length. They were conducted using a set of questions designed to
guide the discussion through a number of relevant areas while, at the same time, allowing
respondents to talk freely about their experiences and how things were done in the
organisation. All interviews were recorded and then transcribed. Subsequently all respondents
were sent a copy of the transcript and invited to make comments or changes before the

12
transcript was used. In most cases no changes were made, but four respondents provided
additional data to clarify or enlarge particular issues that had arisen in the conversation.
Each case was supplemented with secondary data, used to develop a background
understanding of each organisation before conducting interviews. In companies B, C, D and F
these data consisted of publicly available documents and information collected from the
company website. The other companies (A, E and G) provided internal presentations and
documents relating to environmental scanning and strategy. These various documents and the
background understanding they conferred was critical in making the most of available
interview time (Eisenhardt, 1989).
Data Analysis
Data were subjected to content analysis (Bryman & Bell, 2011) in three stages, broadly
following a process of reduction, display and conclusion (Miles & Huberman, 1994). The
first stage was conducted using NVivo software and involved grouping together statements or
parts of interview transcripts that mentioned the use of data sources carried out on a case-by-
case basis. Initially two broad codes were used, one for personal channels and the other for
impersonal channels. The result of this first stage of analysis was a coding report for each
case that highlighted data concerned with source selection and scanning mode.
The second stage of analysis was conducted manually rather with the assistance of computer
software. The reports were read repeatedly to gain a deeper understanding of what was
happening in each case. Next the contents of each code were examined and further broken
down using internal/external dimensions. Various marginal notes were made in an attempt to
understand scanning mode choices. Time-ordered statements (x follows y) or more explicit
causal statements (x causes y) were highlighted to better understand causal factors in the
selection of scanning mode. Common approaches and themes were grouped together. All

13
coding was conducted by one individual, meaning that inter-coder reliability was not an
issue. Internal consistency of coding was checked at both stages through blind re-coding of a
single transcript or report.
The third and final stage of analysis involved cross-tabulation of results, the collection of
useful vignettes and the development of three mode networks, presented in the results section
of this paper. Mode networks were developed by examining the in-case reports and looking
for connections between modes used. After developing the network for one of the large
organisations (E) the other two large companies (C and G) were then mapped onto the same
network. The degree of similarity was striking, and the process was repeated for the medium
companies (A and B) and the small companies (D and F).
Findings
Various approaches to scanning the environment emerged across the seven cases. We found a
mixture of formal and informal processes being used to look at a variety of issues in the
environment. Even formal systems designed to systematically gather and analyse information
on the external environment made some use of individuals in other parts of the organisation
who, either passively or actively, scanned their immediate environment.
Information sources used were diverse, and evidence emerged from the data of explicit
movements from one source of information to another. The most important point that
emerged, however, is how sources were used by different groups of individuals across the
organisation to build a picture of events in the external environment. The way in which these
sources were used varied according to the size of organisation.
The first section below deals with explaining source popularity, while the second is
concerned with the interrelationships that emerged between different modes of scanning in
the organisations. A number of quotes from the primary data are included to provide context

14
for the reader. In some cases, words or names have been amended to maintain anonymity.
Where words have been removed or changed, this is shown with square brackets.
Explaining Source Popularity
The most popular sources overall were personal, with individuals inside the company and
individuals working at a customer or partner organisation being the most commonly used
sources of information on the external environment. The next most popular source was
impersonal, being industry intelligence reports and databases provided by a third party. Other
sources, such as internal reports, individual subject matter experts, public news sources and
competitor press releases were also discussed but less frequently.
Personal internal sources tended to be employees whose role involved engagement with some
part of the external environment. Their knowledge and understanding of regulators (B and C)
or customers and competitors (B, C and E) was seen as a valuable asset that could be used to
gather high-quality intelligence.
Personal channels were seen as more valuable than impersonal when looking specifically at
customers but their internal or external nature appeared to relate to the size of organisation in
question. In larger organisations the network of strategy professionals invested time and
effort getting face-to-face time with their own customer-facing employees who were seen as
a valuable source of intelligence. By contrast, in smaller organisations face-to-face time with
customers was sought directly. Availability of information was more of an issue for smaller
organisations than large ones.
In both cases the information gathered from personal sources was seen as more likely to be
reliable, or of higher quality, than information from elsewhere. The influence of perceived
source quality, however, becomes less clear when looking at impersonal external sources
15
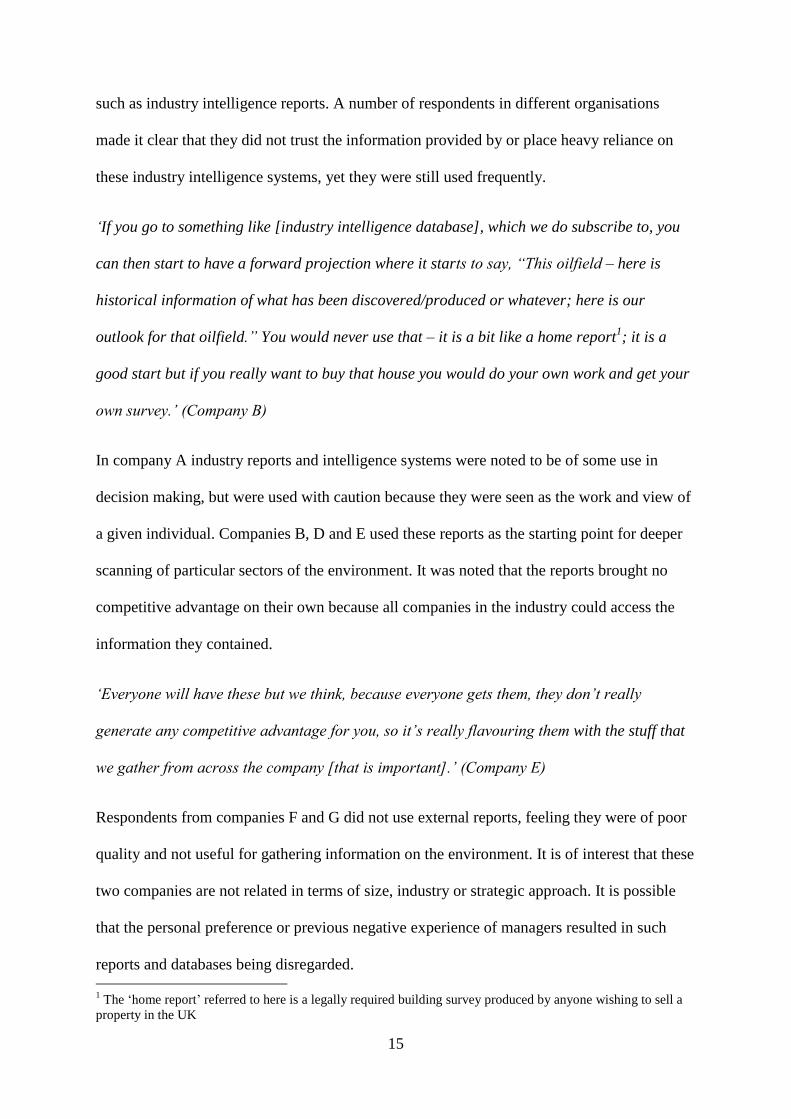
such as industry intelligence reports. A number of respondents in different organisations
made it clear that they did not trust the information provided by or place heavy reliance on
these industry intelligence systems, yet they were still used frequently.
‘If you go to something like [industry intelligence database], which we do subscribe to, you
can then start to have a forward projection where it starts to say, “This oilfield – here is
historical information of what has been discovered/produced or whatever; here is our
outlook for that oilfield.” You would never use that – it is a bit like a home report1; it is a
good start but if you really want to buy that house you would do your own work and get your
own survey.’ (Company B)
In company A industry reports and intelligence systems were noted to be of some use in
decision making, but were used with caution because they were seen as the work and view of
a given individual. Companies B, D and E used these reports as the starting point for deeper
scanning of particular sectors of the environment. It was noted that the reports brought no
competitive advantage on their own because all companies in the industry could access the
information they contained.
‘Everyone will have these but we think, because everyone gets them, they don’t really
generate any competitive advantage for you, so it’s really flavouring them with the stuff that
we gather from across the company [that is important].’ (Company E)
Respondents from companies F and G did not use external reports, feeling they were of poor
quality and not useful for gathering information on the environment. It is of interest that these
two companies are not related in terms of size, industry or strategic approach. It is possible
that the personal preference or previous negative experience of managers resulted in such
reports and databases being disregarded.
1 The ‘home report’ referred to here is a legally required building survey produced by anyone wishing to sell a
property in the UK

16
‘The information we were getting […] was way off what we were actually experiencing on
the ground. I mean, it wasn’t just that we were or weren’t receiving a good price. It was
other stuff as well, for example rig rates, drilling rig rates, workover rig rates. It was a whole
host of stuff that you just… if you relied upon it, you’re really foolish, based on the
experience on the ground. So I’ve, personally, shied away from those sorts of things.’
(Company F)
In general terms the use of external industry intelligence reports might be explained by their
widely available nature. The perceived reliability or otherwise of these reports tended to
dictate the level of use in the organisation, which itself seemed to depend on the past
experience of individual managers.
Internal company intelligence reports prepared for specific initiatives or for periodic strategy
meetings with senior managers and board members were the most common impersonal
internal source. The separation of responsibility for scanning the environment and decision-
making authority in the large organisations (C, E and G) resulted in a distinction between
sources used to scan the environment and sources used to make strategic decisions. In these
organisations compilation of internal reports on the environment formed a significant amount
of the activity of the strategy and/or environment teams. Senior executives would rely heavily
on these when making decisions.
In the small and medium organisations (D and F, A and B) detailed reports on the
environment were not compiled; decision makers were broadly responsible for scanning the
environment themselves. In company D, however, junior employees were assigned to gather
preliminary information on regulatory, competitive and technological issues to provide a
focus for senior executive scanning activity. Thus preference for use of internal, impersonal

17
channels could be related to organisation size and the consequent availability of resources to
produce them.
Table 3 provides a summary of explanations for source use, broken down by the four modes
shown in figure 1.
--------------------------------
INSERT TABLE 3 HERE
--------------------------------
In general, information gathered through personal channels was invariably seen to be of high
quality. Their internal or external nature depended upon the size of organisation in question.
The ready availability of impersonal external sources such as industry intelligence reports to
all organisations in a given sector appeared to drive their use regardless of perceived quality
in some instances. The perceived quality of a given source appeared to depend on the
individual user perception and past experience. Impersonal internal sources were only used in
the large organisations where there were significant resources devoted to their compilation
and dissemination.
Channel Use Across the Organisation
The preceding section provides some explanations for sources being used in different
situations. The use of certain sources, even when they were seen to be of low quality,
suggests that the overall understanding of the environment might be more important than the
impression taken from one information channel in isolation. The purpose of this section is to
examine the combination of scanning modes used and how they relate to those one another in
different organisations.
--------------------------------
INSERT FIGURE 2 HERE
--------------------------------

18
Figure 2 depicts the mode network for the small organisations in the study. The nodes down
the right-hand side represent external sources of information and the single node on the left-
hand side represents the decision-makers within the organisation. The letters on each arrow
represent the companies in which each of these relationships was observed. An arrow from
one node to another represents use of an information source and the mode type is noted on
the arrow. For example, the arrow from ‘customers’ to ‘decision-makers’ shows that
decision-makers scanned their environment using personal contact with customers. This
represents scanning through external personal media and was observed in both companies D
and F.
‘I do a lot of stuff with the Society of Petroleum Engineers – as much as I can. It’s a great
way of keeping your hand [in with] what is going on in the industry. […] They do a lot of
small events in each of the regions. […] They are very valuable indeed. It’s a good way of
seeing who needs what, why, when [and] what is the technological advance going on at the
moment, etc.’ (Company D)
‘If you’re in areas where there isn’t a lot of companies operating and all the companies that
are around you aren’t public companies, they keep their information very close to their
chests; it’s very difficult […]. So what we have to do is take a less formal approach. […] I go
to industry seminars and forums, where there is opportunity to speak to people from different
countries. If you’re lucky you get to speak to somebody and get their card. And [if] you find
yourself looking at something in that particular region at some point in the future you can
actually call upon that.’ (Company F)
The relatively straightforward nature of the network is to be expected from organisations with
relatively few employees. The small size of the companies resulted in decision makers
carrying out a number of different functions within the organisation that included

19
environmental scanning and analysis. While company F eschewed the use of industry
intelligence systems and databases, company D invested significant effort in using this source
of information. Company D’s technique of assigning particular geographic areas to graduate
trainee engineers was seen as useful in terms of both development of junior staff and
provision of a first pass of various sectors of the environment in a specific area.
--------------------------------
INSERT FIGURE 3 HERE
--------------------------------
Figure 3 shows the mode network for the two medium-sized companies in the study, in which
a more compact network of mode relationships was found to exist. In company A the
corporate development manager was responsible for some of the functions that a strategy
team would perform in the larger organisations. The difference between company A and the
large organisations was that the manager in question was part of the management team of the
organisation. Hence much of the scanning activity conducted was linked directly to the team
responsible for making decisions.
‘This is more when we are looking at strategy actually. […] it is a bit linked to how you have
your team. I have my team based around development, production and what I call
“subsurface”. […] I also have a function called “finance and commercial”, which is just
enabling the other three things. […] All the others come into the financial/commercial side,
which is oil price and all the other things we have talked about. […] All the rest are coming
at me from different parts of my organisation. And we merge all of that at the management
committee level.’ (Company A)
In both companies external-facing employees were seen as valuable sources of information
on their individual environments, but there was little in the way of formal processes for
compiling and synthesising such information. In company A it was noted that such

20
information was collated at management team level, with each functional head of department
being responsible for their own area of the environment. In company B the managers in
specific geographic areas were held responsible for understanding their own environments,
but a formal reporting system of external factors did not exist.
‘We have company staff in-country. Generally we have a representative office in the
countries in which we operate. So that again acts as a bidirectional opportunity for
information to flow, and it means that you are not relying on second-hand or indirect
feedback.’ (Company B)
Both companies A and B made use of intelligence reports and public news sources. Both
companies noted that external-facing employees would develop and maintain a network that
could be used to scan the environment, but only company A mentioned the use of industry
bodies and personal networks for decision makers.
--------------------------------
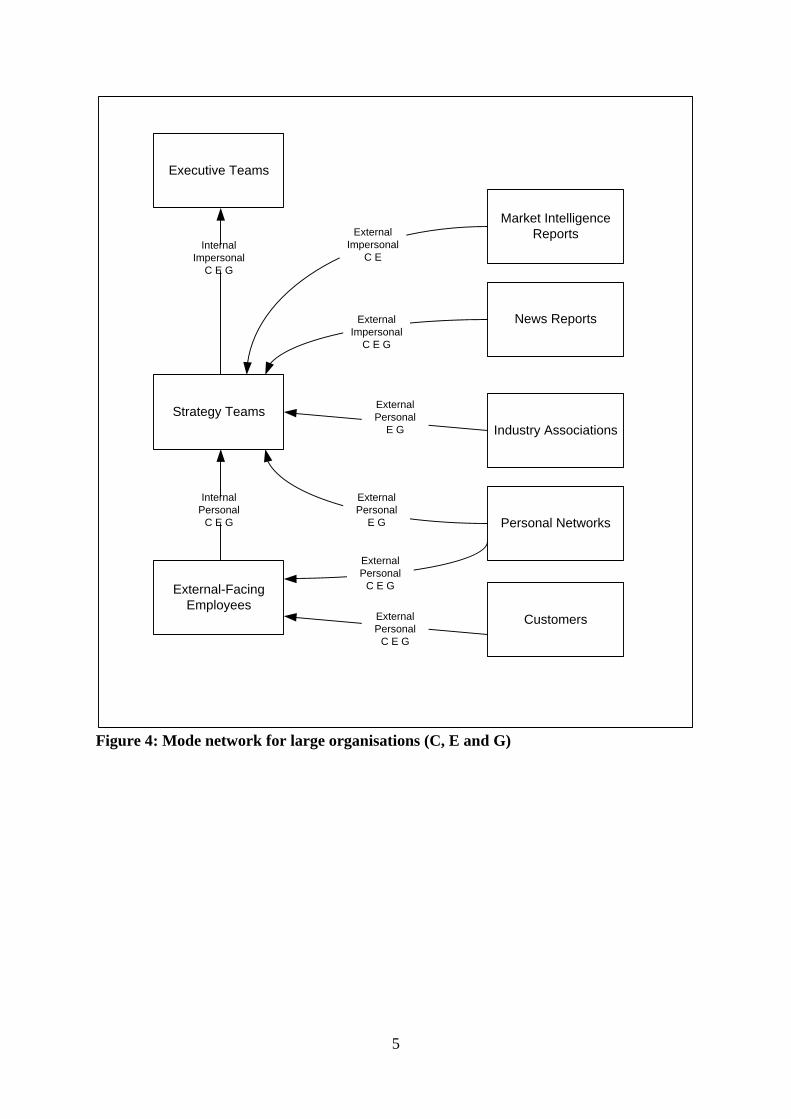
INSERT FIGURE 4 HERE
--------------------------------
Figure 4 shows the mode network for the large organisations in the study. Here wider, more
elaborate networks of individuals and departments with external-facing and reporting
responsibility meant that different scanning modes were apparent in different groups in the
organisation.
Employees whose main role was to face certain parts of the external environment used
external personal sources of information to understand the external environment relevant to
them in their work. This could be in terms of product (company E), in terms of geography
(company G) or in terms of a combination of the two (company C). The understanding of the
environment at this level was personal and not comprehensive but in each case could be
harnessed by those in the strategy teams with a wider view of the organisation.

21
‘The full-time team is about 15 people, and then there is the wider network that is called on.
We manage the network in as structured and systematic a way as we can. So we have people
who are within the company that are almost co-opted into the team through to where the
subject-matter experts are within the company and outside.’ (Company C)
‘We run what we call ICTs, which are integrated capture teams. They would involve people
from the business unit, include business development, and the corporate intelligence team, all
sharing information to make sure that the company is best informed around any given
prospect in any given country.’ (Company G)
The strategy teams, comprising business environment units (company C), competitive
intelligence units (company E), or business development and strategy units (company G),
built and used an internal network to gather and synthesise the knowledge gathered by
external-facing employees. This internal personal mode was used in conjunction with various
other modes to develop a synthesised picture of the external environment that was passed up
to executives with decision-making authority in the form of an internal report. This process
sought to turn various external and internal personal sources and external impersonal sources
into a single comprehensive internal impersonal source of information.
‘We’ve over 100 people, effectively, who are facing off to the market here [with reference to
diagram detailing internal network]. They all individually will hear things that are useful.
Some of them will be very low level, some will be very high-level-type stuff, and it really gives
you an insight to where our competitors are going in the market. That’s the bit that effectively
makes a difference when you understand what the competitors’ plans are.’ (Company E)
In summary, three different networks emerged from the data (as shown in figures 2, 3 and 4),
related to the size of the organisation in question.

22
The small organisations (D and F) exhibited a direct link between decision makers and the
environment, resulting in external sources, both impersonal and personal, being used. This is
perhaps unsurprising, given that small organisations are limited in terms of the number of
people available, firstly to scan their own environment and secondly to act as internal
personal sources of information.
The two medium organisations (A and B) tended towards a more direct relationship between
the external-facing employees and decision makers, resulting in use of internal personal,
rather than impersonal, sources to make the link between external-facing employees and
decision makers.
The large organisations (C, E and G), given their complex structures and multiple groups
scanning the environment, tended to engage in scanning through all four modes, with strategy
teams gathering personal and impersonal information from external sources, along with some
element of internal personal information from employees whose role happened to involve
facing some aspect of the external environment. These data were then collated into reports for
decision makers, who relied on these internal impersonal sources for their information on the
environment.
Discussion
Scanning mode has, in the past, been treated as an individual phenomenon. Here we have
attempted to acknowledge that it is not solely the information sources used by one individual
manager that are important; rather it is the way in which the organisation as a whole gathers
information that is of interest. Consequently, findings have been both supportive of and
divergent from existing knowledge in this area.
A general preference for personal as opposed to impersonal channels is unsurprising and has
been broadly supported in existing literature (Daft et al., 1988; Elenkov, 1997; Jogaratnam &

23
Law, 2006). While early research (Keegan, 1974) proposed that personal source preference is
due to the unstructured nature of scanning , others have argued that preference for personal
sources was a result of the inaccessibility of hard data on specific issues in uncertain
environments (May et al., 2000; Sawyerr, 1993). It is the second proposition here to which
the present findings lend more weight. In company F the technological and economic
environments were examined using personal contacts, sometimes gathered through industry
events or networks. Indeed it was explicitly noted by one of the respondents from company F
that, when secondary written data was not available, personal channels had to be developed.
In company D professional bodies were noted as a source of opportunities for gathering
information in an uncertain environment. This is in contrast to the findings of Sawyerr et al.
(2003b), who noted an increase in internal rather than external networking activities under
conditions of uncertainty. This divergence could be explained by differences in
methodological approach or field setting, but is nevertheless worthy of highlight.
Previously it has been suggested that source quality is of more concern than accessibility
when scanning the environment (Auster & Choo, 1994a). Our findings, while tentative, are
not consistent with this proposition. A source of perceived lower quality was not necessarily
dismissed by users. Despite reservations being expressed about quality of information
provided by various market intelligence systems, they were used frequently in five of the
seven organisations. In fact, easily accessible information was often gathered first from
impersonal sources and then examined with a critical eye, which would then provide prompts
for searching out further pieces of information that may be more difficult to access. While
previous research has suggested that impersonal sources complement personal (Jennings &
Jones, 1999; Julien et al., 1999), our exploration suggests that it could be personal sources
that augment impersonal ones.

24
The use of internal reports to scan the environment has often been overlooked in prior studies
(e.g. du Toit, 2016; Haase & Franco, 2011), which have tended to focus on external
impersonal channels. Therefore a key point from our work is the way in which external
reports were augmented with internally sourced information, as found in company E. A
system was uncovered whereby impersonal external sources were supplemented with
personal internal sources by the manager responsible for competitive intelligence activities.
The information was then synthesised into an internal report that combined insights from the
market intelligence companies and from those working in the firm. This type of behaviour is
consistent with the findings of other studies that suggested internal channels were preferred
over external (Aldehayyat, 2015; Sawyerr et al., 2000) but provides a different view to
studies that have overlooked internal reports as a source of information (du Toit, 2016; Haase
& Franco, 2011). Our findings here may add some weight to the proposition that internal
sources are often viewed as more reliable than external ones (Auster & Choo, 1994a).
Perhaps most importantly, our findings may afford some preliminary insight into how
different scanning modes are used across organisations, resulting in the mode networks
presented above. While recent research has also noted that scanning behaviour is affected by
firm size (Aldehayyat, 2015), the level of detail presented here deepens understanding of the
nature of how this change might work.
While the differences are of note, the similarities between the three networks presented above
are also worthy of consideration. In larger organisations, dedicated teams gathered both
personal and impersonal sources of information from inside and outside the organisation.
These were then compiled into reports for decision makers. Small and medium companies
exhibited less complicated networks, but similar activities were taking place. Medium
companies in the sample did not have dedicated scanning or strategy teams, yet used many of
the same sources in similar ways. Small organisations again used similar approaches in a

25
more concentrated manner. Such similarities may cast raise questions about earlier findings
showing that channel use widens as firm size increases (Haase & Franco, 2011). These
similarities could, however, be explained by the fact that all the organisations were successful
in their own right, given the suggestion that mode selection is related to success (So-Jin &
Sawyerr, 2014) and performance (Sawyerr et al., 2003a).
The mode networks lend a perspective to scanning mode that is richer and deeper than
existing studies might suggest. The organisation, it appears, gathers information through a
variety of channels and compiles it into useful media for decision makers. This was found to
be the case, to a greater or lesser extent, in all of the organisations studied. These findings are
complementary to those concerned with scanning and knowledge management (Bedford &
Harrison, 2015; Taipale-Erävala et al., 2015). We agree with du Toit (2016) that gathering of
information on the external environment from a wide variety of sources may occur even if a
formal system is not in place.
Overall, the similarities between different organisations within the three size groups are
striking. Indeed the degree of replication over a number of cases may suggest a consistent
pattern of mode use between companies that changes according to the size of the company in
question. That said, the exploratory nature of our research means that these findings are
tentative.
Conclusion
Our contribution to theory in this paper is to provide potential deeper insight into the way in
which different scanning modes are used in organisations to develop an understanding of the
external environment. Existing studies have suggested that different channels complement
one another. Our findings, while tentative, suggest that scanning modes may need to be
examined across the organisation in order to fully comprehend their use. The explanations for
26
different sources being more popular than others presented here suggest that source quality
may not be such a fundamental issue as existing research suggests and that internal reports on
the environment are increasingly important for senior management in large companies. In
addition, the mode networks presented provide some initial understanding as to how different
parts of the organisation may collect and compile information from different channels for
decision-making purposes.
The large number of case studies used in the research resulted in a wide frame of reference in
which the findings could be grounded. There was, however, some trade-off between the
number of cases examined and the number of interviews conducted in each case. The number
of cases included means that the depth of exploration in each individual case is, by design,
more limited than might have been possible in a different sort of study. It is important
therefore to acknowledge that the research design employed means that the findings
presented here are tentative.
We also acknowledge that the limited access and nature of the data collection process means
that instances of mode use and source preference that emerge are unlikely to be
comprehensive in nature. Furthermore, while the seven case study companies ranged in size,
in industry, in purpose and in type there can be no sense that taken together they can be
considered representative. The degree of replication across cases suggests that findings could
be indicative of wider practice, but any generalisation is likely to be theoretical as opposed to
empirical in nature (Tsang, 2014).
Our findings are also limited by our decision to focus on scanning mode. Our analysis did not
examine the level of uncertainty in the environment, a popular approach in preceding studies
(e.g. Stewart et al., 2008), nor did we examine organisational and environmental factors such

27
as the age of the organisation (McGee & Sawyerr, 2003) or the national setting in which
scanning took place (Barron et al., 2015). These aspects are worthy of further study in future.
With both contributions and limitations in mind, a number of areas for further research
emerge. First, the ideas developed here could be studied in a single organisation in further
depth than was possible here and would provide further explanation for source use in
different contexts. This would also facilitate deeper investigation of the organisational
variables and contingencies that affect scanning in organisations. In addition, an important
endeavour would be to approach the issues of source popularity and complementarity from a
more quantitative stance, using a survey instrument to gather data from multiple individuals
in a variety of organisations. This would provide more generalisable findings than those
presented here, which can be considered at best indicative.
A practical lesson for managers also emerges from our work. All of the organisations
involved in the study were successful in their own right. Given the accepted importance of
scanning in numerous organisational processes, it is not unreasonable to propose that the
activities uncovered here contribute towards the success of the organisation. It is therefore
important for all companies, from the smallest to the largest, to be aware of how and why
they scan the environments in which they operate. A crucial part of this is to ensure that the
arrangements in place to gather and analyse such information are appropriate for their size
and complexity. It is not hard to imagine a rapidly growing organisation that struggles to
adjust its scanning capabilities as its size and complexity grows. This may have grave
consequences for both strategy and survival.
Another practical question that emerges is concerned with the distance between decision-
makers and the activity of scanning the environment. It is of note that, in medium and small
organisations, decision makers appear to be much closer to the external environment and the

28
scanning thereof than in the large organisations. Does this illustrate that, in large
organisations, key decision makers risk becoming insulated from the environment? If so, how
might this affect the quality of scanning and the quality of strategic decisions in such an
organisation? Conversely in small organisations scanning and decision-making are all
concentrated in a very small number of people or even a single individual. A risk here,
particularly if the organisation is in a rapid growth phase, is that threats and opportunities in
the environment are missed in a plethora of data that it is impossible for one person to digest.

29
References
Aguilar, F. J. (1967). Scanning the business environment. New York, NY: Macmillan.
Aldehayyat, J. S. (2015). Environmental scanning in business organisations: Empirical
evidence from a Middle Eastern country context. Management Research Review,
38(5), 459-481.
Auster, E., & Choo, C. W. (1994a). CEOs, information, and decision-making: scanning the
environment for strategic advantage. Library trends, 43(2), 206-225.
Auster, E., & Choo, C. W. (1994b). How senior managers acquire and use information in
environmental scanning. Information Processing & Management, 30(5), 607-618.
Barron, A., Hultén, P., & Hudson, S. (2012). The financial crisis and the gathering of political
intelligence: A cross-country comparison of SMEs in France, Sweden and the UK.
International Small Business Journal, 30(4), 345-366.
Barron, A., Hultén, P., & Vanyushyn, V. (2015). Country-of-origin effects on managers'
environmental scanning behaviours: evidence from the political crisis in the
Eurozone. Environment and Planning C: Government and Policy, 33(3), 601-619.
Bedford, D., & Harrison, F. (2015). Leveraging environmental scanning methods to identify
knowledge management activities in transportation. Journal of Knowledge
Management, 19(3), 579-592.
Ben-Menahem, S. M., Kwee, Z., Volberda, H. W., & Van Den Bosch, F. A. (2013). Strategic
renewal over time: the enabling role of potential absorptive capacity in aligning
internal and external rates of change. Long Range Planning, 46(3), 216-235.
Berghman, L., Matthyssens, P., Streukens, S., & Vandenbempt, K. (2013). Deliberate
learning mechanisms for stimulating strategic innovation capacity. Long Range
Planning, 46(1), 39-71.
Bernard, H. R. (2012). Social research methods: Qualitative and quantitative approaches:
Sage.

30
Bettis, R. A., Gambardella, A., Helfat, C., & Mitchell, W. (2015). Qualitative empirical
research in strategic management. Strategic Management Journal, 36(5), 637-639.
doi:10.1002/smj.2317
Boyd, B. K., & Fulk, J. (1996). Executive Scanning and Perceived Uncertainty: A
Multidimensional Model. Journal of Management, 22(1), 1.
Bryman, A., & Bell, E. (2011). Business Research Methods 3e: Oxford university press.
Choo, C. W. (1994). Perception and use of information sources by chief executives in
environmental scanning. Library & Information Science Research, 16(1), 23-40.
Creswell, J. W. (2012). Qualitative inquiry and research design: Choosing among five
approaches: Sage publications.
Culnan, M. J. (1983). Environmental Scanning: The Effects Of Task Complexity And Source
Accessibility On Information Gathering Behavior. Decision Sciences, 14(2), 194-206.
Daft, R. L., Sormunen, J., & Parks, D. (1988). Chief Executive Scanning, Environmental
Characteristics, and Company Performance: An Empirical Study. Strategic
Management Journal, 9(2), 123-139.
Daft, R. L., & Weick, K. E. (1984). Toward a model of organizations as interpretation
systems. Academy of Management Review, 284-295.
Danneels, E. (2008). Organizational antecedents of second-order competences. Strategic
Management Journal, 29(5), 519-543. doi:10.1002/smj.684
Danneels, E., & Sethi, R. (2011). New product exploration under environmental turbulence.
Organization Science, 22(4), 1026-1039.
Drew, S. (1999). Building knowledge management into strategy: making sense of a new
perspective. Long Range Planning, 32(1), 130-136.
du Toit, A. S. A. (2016). Using environmental scanning to collect strategic information: A
South African survey. International Journal of Information Management, 36(1), 16-
24. doi:10.1016/j.ijinfomgt.2015.08.005

31
Eisenhardt, K. M. (1989). Building theories from case study research. Academy of
Management Review, 14(4), 532-550.
Elenkov, D. S. (1997). Strategic Uncertainty and Environmental Scanning: The Case for
Institutional Influences on Scanning Behavior. Strategic Management Journal, 18(4),
287-302.
Fabbe-Costes, N., Roussat, C., Taylor, M., & Taylor, A. (2014). Sustainable supply chains: a
framework for environmental scanning practices. International Journal of Operations
& Production Management, 34(5), 664-694.
Fahey, L., & King, W. R. (1977). Environmental scanning for corporate planning. Business
horizons, 20(4), 61-71.
Fainshmidt, S., & Frazier, M. L. (2016). What Facilitates Dynamic Capabilities? The Role of
Organizational Climate for Trust. Long Range Planning.
Ghoshal, S. (1988). Environmental scanning in Korean firms: Organizational isomorphism in
action. Journal of international business studies, 19(1), 69-86.
Haase, H., & Franco, M. (2011). Information sources for environmental scanning: do industry
and firm size matter? Management Decision, 49(10), 1642-1657.
Jain, S. C. (1984). Environmental scanning in US corporations. Long Range Planning, 17(2),
117-128.
Jennings, D., & Jones, A. (1999). Environmental scanning in an emerging industry. Strategic
Change, 8(3), 153-162.
Jogaratnam, G., & Law, R. (2006). Environmental scanning and information source
utilization: exploring the behavior of Hong Kong hotel and tourism executives.
Journal of Hospitality & Tourism Research, 30(2), 170-190.
Jogaratnam, G., & Wong, K. K. (2009). Environmental uncertainty and scanning behavior: an
assessment of top-level hotel executives. International Journal of Hospitality &
Tourism Administration, 10(1), 44-67.
32
Julien, P.-A., Raymond, L., Jacob, R., & Ramangalahy, C. (1999). Types of technological
scanning in manufacturing SMEs: an empirical analysis of patterns and determinants.
Entrepreneurship & Regional Development, 11(4), 281-300.
Keegan, W. J. (1974). Multinational scanning: A study of the information sources utilized by
headquarters executives in multinational companies. Administrative Science
Quarterly, 411-421.
Lenz, R. T., & Engledow, J. L. (1986). Environmental analysis units and strategic decision‐
making: A field study of selected ‘leading‐ edge’corporations. Strategic Management
Journal, 7(1), 69-89.
Martini, A., Neirotti, P., & Appio, F. P. (2016). Knowledge Searching, Integrating and
Performing: Always a Tuned Trio for Innovation? Long Range Planning.
May, R. C., Stewart, W. H., & Sweo, R. (2000). Environmental scanning behavior in a
transitional economy: evidence from Russia. Academy of Management Journal, 43(3),
403-427.
Mayer, J. H. (2011). Managing the Future—Six Guidelines for Designing Environmental
Scanning Systems Service-Oriented Perspectives in Design Science Research (pp.
276-290): Springer.
Mayer, J. H., Steinecke, N., Quick, R., & Weitzel, T. (2013). More applicable environmental
scanning systems leveraging “modern” information systems. Information Systems and
e-Business Management, 11(4), 507-540.
McGee, J. E., & Sawyerr, O. O. (2003). Uncertainty and information search activities: a study
of owner–managers of small high‐ technology manufacturing firms. Journal of Small
Business Management, 41(4), 385-401.
Miles, M. B., & Huberman, A. M. (1994). Qualitative Data Analysis - An Expanded
Sourcebook (Second Edition ed.). London: SAGE Publications.
Olamade, O. O., Oyebisi, T., Egbetokun, A., & Adebowale, B. (2011). Environmental
scanning strategy of manufacturing companies in southwestern Nigeria. Technology
analysis & strategic management, 23(4), 367-381.

33
Sadler-Smith, E., Spicer, D. P., & Chaston, I. (2001). Learning orientations and growth in
smaller firms. Long Range Planning, 34(2), 139-158.
Sawyerr, O. O. (1993). Environmental uncertainty and environmental scanning activities of
Nigerian manufacturing executives: a comparative analysis. Strategic Management
Journal, 14(4), 287-299.
Sawyerr, O. O., Ebrahimi, B. P., & Luk, V. W. (2003a). Environment, Executive Information
Search Activities, and Firm Performance A Comparative Study of Hong Kong and
Nigerian Decision-makers. International Journal of Cross Cultural Management,
3(1), 67-92.
Sawyerr, O. O., Ebrahimi, B. P., & Thibodeaux, M. S. (2000). Executive Environmental
Scanning, Information Source Utilisation, and Firm Performance: the case of Nigeria.
Journal of Applied Management Studies, 9(1), 95-115.
doi:10.1080/13600790050031988
Sawyerr, O. O., McGee, J., & Peterson, M. (2003b). Perceived Uncertainty and Firm
Performance in SMEs The Role of Personal Networking Activities. International
Small Business Journal, 21(3), 269-290.
Sharma, R. S., & Yang, Y. (2015). A Hybrid Scenario Planning Methodology for Interactive
Digital Media. Long Range Planning, 48(6), 412-429.
Smeltzer, L. R., Fann, G. L., & Nikolaisen, V. N. (1988). Environmental scanning practices
in small business. Journal of Small Business Management, 26(3), 55-62.
So-Jin, Y., & Sawyerr, O. (2014). The Search for Broad Environmental Information and New
Product Development Success in Technology-Based SMEs. Journal of Enterprising
Culture, 22(1), 27-55. doi:10.1142/S0218495814500022
Stewart, W. H., May, R. C., & Kalia, A. (2008). Environmental Perceptions and Scanning in
the United States and India: Convergence in Entrepreneurial Information Seeking?
Entrepreneurship: Theory & Practice, 32(1), 83-106. doi:10.1111/j.1540-
6520.2007.00217.x

34
Taipale-Erävala, K., Lampela, H., & Heilmann, P. (2015). Survival Skills in SMEs—
Continuous Competence Renewing and Opportunity Scanning. Journal of East-West
Business, 21(1), 1-21.
Teece, D. J. (2007). Explicating dynamic capabilities: the nature and microfoundations of
(sustainable) enterprise performance. Strategic Management Journal, 28(13), 1319-
1350. doi:10.1002/smj.640
Tsang, E. W. (2014). Generalizing from research findings: the merits of case studies.
International Journal of Management Reviews, 16(4), 369-383.
Wilden, R., Gudergan, S. P., Nielsen, B. B., & Lings, I. (2013). Dynamic capabilities and
performance: strategy, structure and environment. Long Range Planning, 46(1), 72-
96.
Yasai-Ardekani, M., & Nystrom, P. C. (1996). Designs for environmental scanning systems:
Tests of a contingency theory. Management Science, 187-204.
Yin, R. K. (2013). Case study research: Design and methods: Sage publications.

Tables
Table 1: Summary of Key Studies of Scanning Mode
Author(s) Year Personal or Impersonal External or Internal Focus
Keegan 1974 Personal preferred Int. abroad, Ext. in domestic Setting (Multinationals)
Culnan 1983 - - Quality and Accessibility
Daft et al. 1988 Personal increases with uncertainty Both increase with uncertainty Uncertainty
Ghoshal 1988 Personal preferred Ext. preferred Setting (Korea vs. USA)
Smeltzer et al. 1988 Personal preferred - Setting (Small Business)
Sawyerr 1993 Personal increases with uncertainty Ext. increases with uncertainty Uncertainty
Auster & Choo 1994a Personal preferred Both Quality and Accessibility
Auster & Choo 1994b Personal preferred Both Quality and Accessibility
Choo 1994 Personal preferred Int. better quality Quality and Accessibility
Elenkov 1997 Personal preferred Ext. increases with uncertainty Uncertainty
Jennings & Jones 1999 Impersonal complements personal Int. more important Setting (emerging industries)
Julien et al. 1999 Personal preferred - Setting (technological in SMEs)
May et al. 2000 Both increase with uncertainty Ext. often harder to access Uncertainty
Sawyerr et al. 2000 No preference Int. preferred Setting (Nigeria)
McGee & Sawyerr 2003 Personal used more by new firms Ext. used more by new firms Uncertainty
Sawyerr et al. 2003a Depends on country context Int. increases with uncertainty Uncertainty
Sawyerr et al. 2003b Focused on Personal Int. increases with uncertainty Uncertainty
Jogaratnam & Law 2006 Personal preferred Int. more utilised than ext. Setting (Hong Kong)
Haase & Franco 2011 Personal and Impersonal Focused on ext. Setting (Industry Comparison)
Barron et al. 2012 Varies according to setting - Setting (3 EU countries)
So-Jin & Sawyerr 2014 Personal increases chances of success Internal increases chances of success Setting (New Product Dev)
Aldehayyat 2015 Personal preferred Int. preferred Setting (Middle East)
Barron et al. 2015 Varies according to setting - Setting (3 EU countries)
du Toit 2016 Used primary/secondary distinction Focused on external Setting (South Africa)

2
Table 2: Sample companies, industry and size
Co. Industry Company Type Geographic Spread Size* Respondent Position(s)
A Oil and gas Development and
production
Europe Medium CEO
B Oil and gas Exploration and
development
Europe, Asia, Africa Medium Senior Executive, Corporate
Level
C Oil and gas Vertically integrated Global Large 2 Senior Executives,
Corporate Strategy
D Offshore services Offshore oil services Europe, S America, Asia Small Head of Division
Division Operations Manager
E Financial services Investments and pensions Europe, N America, Asia Large Senior Executive, Corporate
Strategy
Senior Executive, Risk
Management
Senior Executive, Business
Strategy
Senior Executive, Market
Intelligence
F Oil and gas Asset purchase and disposal Africa Small Chief Executive
Executive Director
Senior Manager, Finance
Senior Manager, Legal
G Defence Products and services Global Large Senior Executive, Corporate
Strategy
Senior Executive, Business
Development
*by number of employees. Small <100, Medium 101 – 2,000, Large >2,000

Table 3: Explaining Source Use by Mode
Mode Why Chosen?
Personal External Seen to provide high quality information, usually from individuals working at customer or competitor
organisations. More heavily relied upon in smaller organisations, perhaps because the pool of internal
individuals was small.
Personal Internal Also seen to provide high quality information. Mostly used in the medium and larger companies with sufficient
numbers of employees in external-facing roles. In general, organisation size appeared to drive whether
personal sources were internal or external in nature.
Impersonal External General availability to all companies in a given sector drove the use of these sources, usually industry
intelligence reports or databases. Frequently seen to have limited value and not to be sufficiently focussed to
guide decision making. Therefore general availability was a more important consideration than information
quality in this case.
Impersonal Internal Use limited to large companies due to sufficient internal resources being available for formal report generation.
These reports were produced by using some form of personal source to augment information from impersonal
external sources.

2
Colleague or
Subordinate
Contact in another
company
Internal reports
News report
Industry
intelligence report
Personal
Impersonal
Internal External
Figure 1: Four scanning modes with source examples (based on Daft et al., 1998,
Elenkov, 1997 and others)

3
Decision-Makers
Market Intelligence
Reports
Industry Associations
Customers
Personal Networks
News ReportsExternal
Impersonal
D F
External
Personal
D F
External
Personal
D F
External
Personal
D F
Filtered through junior staff as a
development exercise
(D only)
Figure 2: Mode network for small organisations (D and F)

4
External-Facing
Employees
Decision-Makers
Market Intelligence
Reports
Industry Associations
Customers
Personal Networks
News Reports
Internal
Personal
A B
External
Impersonal
A B
External
Impersonal
A B
External
Personal
A
External
Personal
A B
External
Personal
A B
External
Personal
A
Figure 3: Mode network for medium organisations (A and B)
5
Strategy Teams
External-Facing
Employees
Executive Teams
Market Intelligence
Reports
Industry Associations
Customers
Personal Networks
News Reports
Internal
Personal
C E G
Internal
Impersonal
C E G
External
Impersonal
C E
External
Impersonal
C E G
External
Personal
E G
External
Personal
E G
External
Personal
C E G
External
Personal
C E G
Figure 4: Mode network for large organisations (C, E and G)