organisation and financing of chronic dialysis in belgium · organisation and financing of chronic...
TRANSCRIPT

Organisation and financing of chronic dialysis in Belgium
KCE reports 124C
Federaal Kenniscentrum voor de Gezondheidszorg Centre fédéral d’expertise des soins de santé
Belgian Health Care Knowledge Centre 2010

The Belgian Health Care Knowledge Centre
Introduction: The Belgian Health Care Knowledge Centre (KCE) is an organization of public interest, created on the 24th of December 2002 under the supervision of the Minister of Public Health and Social Affairs. KCE is in charge of conducting studies that support the political decision making on health care and health insurance.
Administrative Council
Actual Members: Pierre Gillet (President), Dirk Cuypers (Vice-president), Jo De Cock (Vice-president), Frank Van Massenhove (Vice-president), Yolande Avondtroodt, Jean-Pierre Baeyens, Ri de Ridder, Olivier De Stexhe, Johan Pauwels, Daniel Devos, Jean-Noël Godin, Floris Goyens, Jef Maes, Pascal Mertens, Marc Moens, Marco Schetgen, Patrick Verertbruggen, Michel Foulon, Myriam Hubinon, Michael Callens, Bernard Lange, Jean-Claude Praet.
Substitute Members: Rita Cuypers, Christiaan De Coster, Benoît Collin, Lambert Stamatakis, Karel Vermeyen, Katrien Kesteloot, Bart Ooghe, Frederic Lernoux, Anne Vanderstappen, Paul Palsterman, Geert Messiaen, Anne Remacle, Roland Lemeye, Annick Poncé, Pierre Smiets, Jan Bertels, Catherine Lucet, Ludo Meyers, Olivier Thonon, François Perl.
Government commissioner: Yves Roger
Management
Chief Executive Officer: Raf Mertens
Assistant Chief Executive Officer: Jean-Pierre Closon
Information
Federaal Kenniscentrum voor de gezondheidszorg - Centre fédéral d’expertise des soins de santé – Belgian Health Care Knowlegde Centre. Centre Administratif Botanique, Doorbuilding (10th floor) Boulevard du Jardin Botanique 55 B-1000 Brussels Belgium Tel: +32 [0]2 287 33 88 Fax: +32 [0]2 287 33 85 Email : [email protected] Web : http://www.kce.fgov.be

Organisation and financing of chronic dialysis in Belgium
KCE reports 124C
IRINA CLEEMPUT, CLAIRE BEGUIN, YOLANDE DE LA KETHULLE, SOPHIE GERKENS, MICHEL JADOUL, GERT VERPOOTEN, CHRIS DE LAET
Federaal Kenniscentrum voor de Gezondheidszorg Centre fédéral d’expertise des soins de santé
Belgian Health Care Knowledge Centre 2010

KCE reports 124C
Title: Organisation and financing of chronic dialysis in Belgium
Authors: Irina Cleemput (KCE), Claire Beguin (UCL), Yolande de la Kethulle (UCL), Sophie Gerkens (formerly UCL, currently KCE), Michel Jadoul (UCL), Gert Verpooten (UA), Chris De Laet (KCE)
Reviewers: Christian Léonard (KCE)
External experts: Jean-Marie Billiouw (NBVN), Dirk Corens (UZ Brussel), Daniel Crabbe (RIZIV), Bart De Moor (NBVN), Luc Frimat (CHU Nancy, France), Norbert Lameire (UGent), Joëlle Nortier (GNFB), Jean-Michel Pochet (GNFB), Gauthier Saelens (Grand Hôpital de Charleroi), Koenraad Stas (Virga Jesse Ziekenhuis Hasselt), Robert Van den Oever (CM).
Acknowledgements: Philippe Beutels (UA), Stephan Devriese (KCE), Mark Leys (KCE), Murielle Lona (formerly KCE), Jan Meysman (IMA), Mike Smet (UA), Guy Vanden Boer (KUL), Emmanuel Vandenborre (FENIER-FABIR)
External validators: Willem Geerlings (MC Haaglanden, the Netherlands), Filip Roodhooft (KULeuven), Dirk Wouters (RIZIV/INAMI/NIHDI)
Conflict of interest: The following external experts and authors are working at a hospital with a dialysis unit that may gain or lose financially from the results of this study: Jean-Marie Billiouw, Dirk Corens, Bart De Moor, Michel Jadoul, Joëlle Nortier, Jean-Michel Pochet, Gauthier Saelens, Koenraad Stas, Gert Verpooten. The following external experts and authors declared that they received research funds from, or conducted consultancy services for, or received grants and/or travel assistance for attending conferences from companies that might gain or lose financially from the results of this HTA: Jean-Marie Billiouw, Bart De Moor, Luc Frimat, Michel Jadoul, Norbert Lameire, Joëlle Nortier, Jean-Michel Pochet, Koenraad Stas, Gert Verpooten.
Disclaimer: The external experts were consulted about a (preliminary) version of the scientific report. Subsequently, a (final) version was submitted to the validators.. The validation of the report results from a consensus or a voting process between the validators. Only the KCE is responsible for errors or omissions that could persist. The policy recommendations are also under the full responsibility of the KCE.
Layout: Ine Verhulst
Brussels, 10th February 2010
Study nr 2007-12
Domain: Health Technology Assessment (HTA)
MeSH : Renal Dialysis; Costs and Cost Analysis; Reimbursement, Incentive; Accreditation, Patient Preference
NLM classification : WJ378
Language: English
Format: Adobe® PDF™ (A4)
Legal depot: D/2010/10.273/13
How to refer to this document?
Cleemput I, Beguin C, de la Kethulle Y, Gerkens S, Jadoul M, Verpooten G, De Laet C. Organisation and financing of chronic dialysis in Belgium. Health Technology Assessment (HTA). Brussels: Belgian Health Care Knowledge Centre (KCE). 2010. KCE Reports 124C. D/2010/10.273/13.

KCE reports 124C Chronic Dialysis in Belgium i
Executive summary
BACKGROUND Renal Replacement Therapy (RRT) is a life-saving and highly effective supportive treatment for all patients with end stage renal disease (ESRD) i.e. patients whose renal function has become insufficient for whatever reason. There are essentially two types of RRT: dialysis and renal transplantation. Renal transplantation is considered the treatment of choice, because it offers a better outcome at lower costs. However, not all patients are eligible for renal transplantation and most eligible patients have to wait for a suitable kidney to become available. These patients are treated by means of one or a sequential combination of dialysis modalities:
• Haemodialysis in a hospital setting (hospital HD): full-care (high-care) haemodialysis in a hospital or equivalent centre, with full assistance by nephrologists and nursing personnel.
• Haemodialysis in a satellite unit (satellite HD): mainly low-care haemodialysis (sometimes called self-care HD) where part of the necessary manipulations are done by the patient, with a lower attendance of nephrologists and nursing personnel. Satellites centre for HD can be embedded in a hospital or be a separate building. A satellite HD unit is always associated with on a main dialysis centre.
• Peritoneal dialysis (PD): In contrast to HD, PD uses the peritoneal membrane as a semi-permeable membrane, instead of an artificial membrane. There are two main categories of PD: continuous ambulatory peritoneal dialysis (CAPD) and automated peritoneal dialysis (APD). CAPD uses, in contrast to APD, no machinery for the delivery and drainage of the dialysis fluids.
• Home haemodialysis (home HD): haemodialysis at the home of the patient, with the patient mainly in charge of necessary manipulations.
Satellite HD, PD and home HD are all lower-care dialysis modalities compared to hospital HD. They are commonly referred to as “alternative dialysis modalities” throughout this report. A main dialysis centre is responsible for the supervision of all patients on one of the alternative dialysis modalities.
Chronic dialysis treatment has a significant impact upon a patient’s life. Because of the differences in treatment schedule and location between the dialysis modalities –e.g. hospital HD occurs typically three times a week at a hospital unit, PD occurs daily at home- the (perceived) impact on patients’ daily life may also differ between modalities. Dialysis modalities cannot be considered as perfect substitutes from a patient’s point of view and patient preferences become an important element in the choice of dialysis modality.
Dialysis is a relatively expensive treatment. The reimbursement expenditures by the Belgian National Institute for Health and Disability Insurance (NIHDI/RIZIV/INAMI) are increasing continuously (from €206 million in 2000 to almost €336 million in 2008). This is mainly due to the growing population on RRT (between 2002 and 2007 the population increased with 26%). Within the RRT patient population, the growth rate has been highest in patients older than 65 years of age (+40% between 2002 and 2007). With the aging population, costs of dialysis for the NIHDI are expected to increase further. Policy makers therefore wish to find ways to control dialysis costs while maintaining the high quality of care. The main question is whether there is the possibility for an increase in the proportion of patients treated with presumably lower-cost dialysis modalities (PD or satellite HD) as compared to hospital HD and whether the financial incentives created thus far are appropriate to ensure an efficient allocation of dialysis resources.

ii Chronic Dialysis in Belgium KCE reports 124C
OBJECTIVES The objectives of this report are:
• to describe the different treatment options for patients with ESRD, give an overview of the existing evidence on the clinical effectiveness, cost-effectiveness and quality of life associated with different dialysis modalities and give an overview of the selection criteria for different types of dialysis described in literature (chapter 2);
• to describe the relative use of different dialysis modalities in Belgium as well as the legal framework for dialysis provision and financing (chapter 3);
• to describe the patient population and to assess the costs and budget impact for the NIHDI and for the patients on different dialysis modalities (chapter 4);
• to calculate the costs of the different dialysis modalities from the hospital’s point of view and compare the costs of a dialysis programme with its revenues (chapter 5);
• to compare the Belgian situation with other countries (chapter 6);
• to describe patient-related issues in different dialysis modalities (chapter 7) and
• to draw conclusions about the organization and financing of dialysis in Belgium (chapter 8).
This study focuses on the dialysis modalities most frequently used in Belgium for the treatment of adult ESRD patients. Renal transplantation is not examined in depth but discussed where appropriate.
METHODS A literature review was performed for the description of the clinical and economic evidence on chronic dialysis treatment, as well as quality of life in different dialysis modalities and aspects related to pre-dialysis patient education. Standard KCE procedures were followed.
Two sources of data were used to describe the epidemiology of ESRD and dialysis treatment in Belgium: (1) the report issued by the Belgian associations of nephrology and (2) data on dialysis patients’ characteristics and treatment modalities extracted from the reimbursement claims database of the IMA (Intermutualistic Agency) between 2003 and 2006.
The IMA data also allowed analysing the NIHDI expenditures for chronic dialysis patients and out-of-pocket expenses of patients. ‘Chronic dialysis’ was defined as at least 7 consecutive weeks of (reimbursed) chronic dialysis treatment, regardless of the year. Patients’ entire dialysis treatment histories during their inclusion period in the study were considered to classify them into one of 8 ‘profiles’: Hospital HD, Satellite HD, PD, HD and a number of combination profiles. some combination profiles when less than 80% of the modalities was one specific modality.
For the estimation of the costs of the different dialysis modalities a questionnaire was sent to more than 50 dialysis centres but only 8 centres returned the questionnaire. Participation was anonymous and responses were sent through a trusted third party. Variability in the reported volumes of resource use and unit costs was taken into account in the analysis. Despite the limited response rate, the results seemed consistent with the expected relationships between cost items and treatment modalities. For instance, as expected, human resources costs were higher for hospital HD than for satellite HD and higher for satellite HD than for PD. A cost-revenue model was developed to estimate the net result (revenues – costs) of running a hypothetical dialysis programme with 100 dialysis patients. Account is taken of the fact that some costs are fixed or semi-fixed in the short or medium term. Costs and revenues were expressed in values for 2006.

KCE reports 124C Chronic Dialysis in Belgium iii
For the international comparison the findings of the International Study of Health Care Organization and Financing (ISHCOF) about the financing of ESRD in 12 high income countries (Australia, Belgium, Canada, England and Wales, France, Germany, Italy, Japan, New Zealand, Spain, Sweden and United States) were summarized.
Patient-related issues were examined by means of a written questionnaire sent to some patient organisations and patients through the intermediary of the Belgian Federation of Organisations for ESRD Patients (Fenier/Fabir). Although several practical constraints impeded the implementation of a good qualitative research protocol, our results corroborated the findings from studies published in peer-reviewed literature.
RESULTS CLINICAL AND ECONOMIC EVIDENCE FROM LITERATURE
It is striking that in the literature, no convincing evidence was found about differences in mortality, morbidity or quality of life that would be due to the specific dialysis modality itself. All but one of the studies were purely observational with limited potential to correct for confounding, and mainly for confounding by indication. Some large registry results suggest a better survival for patients starting on PD in the initial period and a better survival with HD later on for patients with specific conditions, but those registries also had several biases and are confounded by indication. Very few patients are willing to be allocated randomly to different dialysis modalities. Randomized controlled trials on dialysis modalities have therefore been proven practically impossible.
According to the literature, hospital HD is more costly than satellite HD, home HD and PD from the health care payer’s and provider’s point of view. Economic studies comparing home HD with satellite HD are conflicting. Starting on PD is generally found to be less costly and equally or more effective than starting on HD in economic evaluations.
SELECTION CRITERIA FOR DIALYSIS MODALITIES Medical indications and contra-indications for specific dialysis modalities are mainly based on expert opinion and consensus and are lacking for the majority of patients (64% according to a large Dutch multicentre cohort study). The choice of the dialysis modality is discussed neither by the American Nephrology guidelines, nor by the European guidelines from ERA (European Renal Association). In Australia (2005) and France (2008), however, such guidelines were produced.
In the absence of specific indications or contra-indications, patients’ choice of dialysis modality should, according to the literature, be mainly determined by personal preferences of a fully informed patient. Pre-dialysis patient education and preparation is considered important by experts, patients and their relatives. The study of strategies for adequate pre-dialysis patient information and education fell outside the scope of this project.

iv Chronic Dialysis in Belgium KCE reports 124C
ORGANISATION AND USE OF DIALYSIS IN BELGIUM
Epidemiology
In 2007 there were about 11 400 prevalent patients on RRT, including about 6 700 patients on dialysis and about 4 700 transplanted patients. This was an increase of the prevalence of RRT by 26% as compared to 2002. The proportion of patients older than 75 years of age among these 11 400 on RRT increased in this period from 19% to 27%. In dialysis only, two thirds of the patients were aged 65 and above and 41.5% was older than 75 years in 2007. The increase in the proportion of elderly patients on dialysis has mainly had a impact on the use of hospital HD, where the proportion of elderly patients grew more rapidly than for other dialysis modalities.
Survival of chronic dialysis patients is low compared to the general population. In our survival analysis based on IMA data of approximately 8000 patients starting on dialysis (i.e. incident patients), the four-year survival after dialysis initiation was on average less than 40%. This survival was worse for hospital HD and better for PD and satellite HD. However, this observation is most likely due to the fact that patients with a high mortality risk are more likely to be on hospital HD.
As compared to other countries (the Netherlands, Austria, Finland, Sweden and the UK), incident patients in Belgium are on average 5 to 9 years older. The mean age of incident patients was almost 69 years in 2007.
Glomerulonephritis was the major cause of ESRD in prevalent patients in 2007 (19%). In incident patients, however, renal vascular disease and diabetic nephropathy were more important as major cause of ESRD.
Treatment modalities
About 66% of the chronic dialysis patients are treated by means of hospital HD in 2007. Satellite HD is used by 24% and PD by 10% of the chronic dialysis patients. There is some variability between Belgian dialysis centres in the extent to which they use alternative dialysis treatment modalities. Centres in the Dutch speaking provinces have on average a higher proportion of satellite HD and PD use than centres located in the French speaking provinces, with the exception of ‘Brabant Wallon’. The use of PD and satellite HD has increased between 2002 and 2007 from 28% to 34%. The increase was mainly due to an increase in the use of satellite HD.
Compared to other countries, the use of PD is limited in Belgium. In Finland, the Netherlands and UK, for instance, the proportion of RRT patients (dialysis+transplantation) on PD is between 8 and 10%, while in Belgium this is about 5%. Time on the waiting list for renal transplantation, is shorter in Belgium (2 to 2.5 years) than in some other countries.
Organisation and financing
The law defines the operational and functional criteria for the accreditation of dialysis centres. Conditions are imposed on the number and qualification of medical, nursing and technical staff. For nursing staff it is stated that at least 50% should have a special qualification in dialysis nursing. However, no such qualification officially exists (yet) in Belgium.
In 2007, there were 53 main dialysis centres in Belgium, 49 of which also had one or more satellite HD units.
Financing mechanisms of dialysis have undergone many changes throughout the years. The objective of these changes has mainly been to increase the use of alternative dialysis modalities.
Current reimbursement tariffs are presented in Table 1

KCE reports 124C Chronic Dialysis in Belgium v
Table 1: Reimbursement of different dialysis modalities in Belgium (values for 2009) HOSPITAL HD, per session Baseline lump sum €42.10 % of per diem price on June, 30th 2002 €20% Lump sum bonus: if 5% ≤ percentage alternative dialysis < 10% €31.41 if 10% ≤ percentage alternative dialysis < 25% €76.96 if 25% ≤ percentage alternative dialysis < 35% €100.43 if percentage alternative dialysis ≥ 25% €105.95 minimum lump sum €119.27 maximum lump sum €276.08 Honorarium fee €199.74 ALTERNATIVE DIALYSIS MODALITIES Home haemodialysis: With nursing assistance at home €309.96/session Without assistance €258.05/session Peritoneal dialysis: With nursing assistance at home €927.43/week Without assistance €734.16/week APD €817.04/week Incomplete peritoneal dialysis week: With nursing assistance at home €132.49/dialysis day Without assistance €104.88/dialysis day APD €116.72/dialysis day
Hospital HD is financed through a lump sum and a medical fee (honorarium) per session. Satellite HD and home HD are reimbursed to the supervising dialysis centre through a lump sum per session. For home dialysis with nursing support the NIHDI pays a higher lump sum. The main dialysis centre must pay the difference between the lump sum with and the lump sum without nursing support to the home nursing service providing the support. Although the amount for home nursing support is fixed, the payments received by home nursing services sometimes vary between dialysis centres without any apparent reason.
Public transportation to and from the dialysis centre is fully reimbursed to patients. Transportation by other means is since 1985 reimbursed at €0.25 per km and limited to 30 km per one way trip. This amount has not been indexed since. Some sickness funds provide an additional reimbursement in the context of their complementary insurance package.
NIHDI EXPENDITURES Sixty percent of the total NIHDI reimbursements for dialysis patients are for the ambulatory dialysis treatment, i.e. on average €40 354 per patient in 2006. Patient out-of-pocket expenses are difficult to measure since they are influenced by income, insurance statute, and additional financial benefits from sickness funds. Moreover, per-diem hospital prices and some other expenses such as over the counter drugs are not included in the IMA registration. However, the total patients’ out-of-pocket expenses linked to partly reimbursed health care rose from €6.1 million in 2003 (n=6 804) to €7.6 million in 2006 (n=7 630).
A longitudinal analysis of expenses, starting 1 year before dialysis onset until 4 years after the start of dialysis, showed that overall health care reimbursement expenses start to rise in the months preceding the onset of dialysis, reach a peak during the months after dialysis initiation and show a slow decrease afterwards.
vi Chronic Dialysis in Belgium KCE reports 124C
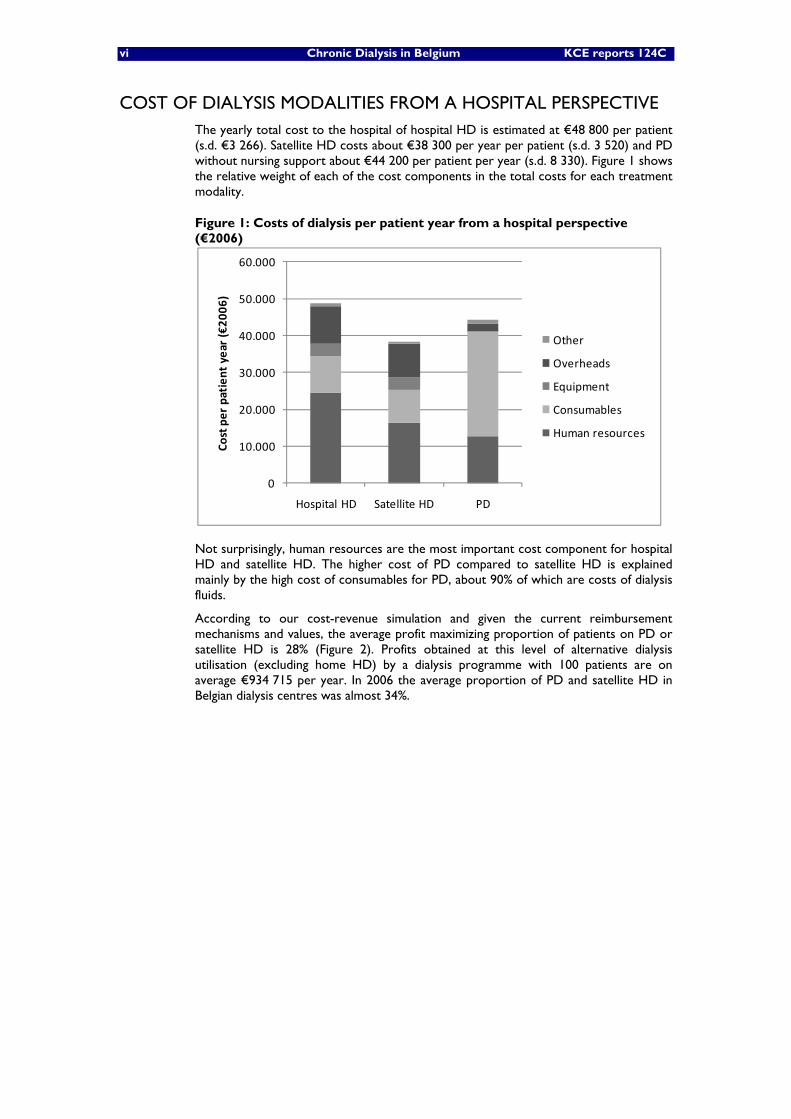
COST OF DIALYSIS MODALITIES FROM A HOSPITAL PERSPECTIVE The yearly total cost to the hospital of hospital HD is estimated at €48 800 per patient (s.d. €3 266). Satellite HD costs about €38 300 per year per patient (s.d. 3 520) and PD without nursing support about €44 200 per patient per year (s.d. 8 330). Figure 1 shows the relative weight of each of the cost components in the total costs for each treatment modality.
Figure 1: Costs of dialysis per patient year from a hospital perspective (€2006)
Not surprisingly, human resources are the most important cost component for hospital HD and satellite HD. The higher cost of PD compared to satellite HD is explained mainly by the high cost of consumables for PD, about 90% of which are costs of dialysis fluids.
According to our cost-revenue simulation and given the current reimbursement mechanisms and values, the average profit maximizing proportion of patients on PD or satellite HD is 28% (Figure 2). Profits obtained at this level of alternative dialysis utilisation (excluding home HD) by a dialysis programme with 100 patients are on average €934 715 per year. In 2006 the average proportion of PD and satellite HD in Belgian dialysis centres was almost 34%.
0
10.000
20.000
30.000
40.000
50.000
60.000
Hospital HD Satellite HD PD
Cost per patient year (€20
06)
Other
Overheads
Equipment
Consumables
Human resources

KCE reports 124C Chronic Dialysis in Belgium vii
Figure 2: Yearly profits of a dialysis programme with 100 patients depending on the proportion of patients on alternative dialysis modalities (€2006)
Presumably, the positive financial incentives which have been given for the use of alternative dialysis modalities might have been overruled by the incremental profits generated by hospital HD. This applies in particular for PD. According to our simulations, it is likely that for some hospitals in Belgium the revenues for PD are even insufficient to cover the costs of PD. This is less so for satellite HD. As a consequence, rather than to increase PD, hospitals might be more inclined to increase their level of satellite HD in order to obtain a higher lump sum bonus for hospital HD.
INTERNATIONAL COMPARISON In terms of the number of patients per nephrologist, Belgium ranks 5th in the list of the 12 countries included in the ISHCOF study, with one nephrologist per 42 ESRD patients (including dialysis and transplant patients). This number is largely determined by the staffing norms imposed by the Belgian law for hospital HD, combined with the relatively high proportion of patients on hospital HD in Belgium as compared to other countries. The average across all countries was one nephrologist per 56 ESRD patients.
In most countries, as in Belgium, patients can in theory benefit from the dialysis treatment modality of their choice, unless there are medical contra-indications. In practice, however, choices are constrained by a more or less early referral to the nephrologist (training patients for PD takes more time than preparing patients for hospital HD), limited geographical access to dialysis facilities, governmental planning of the number and location of dialysis units or established clinical practice patterns in a country or at the local level.
Financing mechanisms include fee for service (reimbursement per dialysis session or week), flat rate lump sum independent of the dialysis modality but depending on patient characteristics, financing through Diagnosis Related Groups, mixed systems of fee for service and capitation payments.
Measures for cost containment in dialysis include correcting reimbursement tariffs less frequently for inflation, limiting drug reimbursement to drugs with proven (cost-) effectiveness, reimbursing medications through a lump sum, charging penalties for excessive drug prescription and limiting the number of dialysis centres.
934.715
-400.000
-200.000
0
200.000
400.000
600.000
800.000
1.000.000
1.200.000
0 5 10 15 20 25 30 35 40 45 50 55 60 65 70 75 80 85 90 95 100
Ann
ual net results (in €20
06)
% patients on alternative dialysis modalities
5% ‐ 95%
+/‐1 Std. Dev.
Mean
viii Chronic Dialysis in Belgium KCE reports 124C
PATIENT-RELATED ISSUES Patient preferences are an important determinant for the choice of the dialysis modality whenever one specific modality is not specifically medically indicated. Home dialysis modalities are mainly chosen because of the flexibility and independence they offer, while dialysis in a centre is chosen because it is performed in a more secure environment. Social support from a partner or informal caregiver is an important but not sufficient condition for choosing a home dialysis modality. A crucial determinant for choosing a dialysis modality is maintenance of a normal life. Pre-dialysis education and counselling appears to be crucial for allowing patients and their relatives to make an informed decision about their treatment modality.
Respondents to our survey consider the information patients receive from their nephrologist, the pre-dialysis teams and patient organisations as appropriate and sufficient, although counselling once the treatment has started is still considered necessary.
Belgian patients experience the out-of-pocket costs as a heavy financial burden, especially given the impact of the disease and treatment on their ability to work full-time or to work at all.
DISCUSSION AND CONCLUSIONS The main concern in organizing dialysis care should be that patients who need dialysis are able to make a fully informed decision about their dialysis modality.
Yet, in Belgium, no clinical guidelines exist for the choice of starting a dialysis treatment in patients with chronic renal disease, the indications and contra-indications for dialysis modalities, pre-dialysis education and counseling and making the final choice between dialysis modalities.
The current reimbursement mechanisms for dialysis do not reflect the real costs to the hospital and the patient. Profits generated by dialysis services of a hospital are currently often used by the hospital management to subsidize loss-making activities of the hospital. However, such structural imbalances reduce the transparency in the costs of health care services to the NIHDI. Subsequently, such erroneous cost figures with built-in compensations for other services’ deficits may lead to biased resource allocation decisions.
The optimal financing mechanism for dialysis should be as profit neutral as possible for the provider in order to avoid financial incentives in favor of or against a particular modality. According to our cost-revenues simulations, this is currently not the case. It should be noted that for this study a traditional costing approach was used. This has some obvious limitations, such as the fact that it does not correct for potential inefficiencies in resource use. Moreover, the sample of dialysis centres that responded to our cost survey is not representative for all Belgian dialysis centres, as in 5 of the 8 responding centres physicians were employed and received a monthly salary. In many hospitals, however, physicians work privately.

KCE reports 124C Chronic Dialysis in Belgium ix
According to our cost-revenues simulations, the existing financial incentive mechanisms for alternative dialysis modalities, might actually have created a financial disincentive for the use of PD because no distinction is made between satellite HD and PD. It is more profitable to move patients from hospital HD to satellite HD because this is a less costly alternative than PD for the hospital but, given the current reimbursement of PD and satellite HD, a more costly alternative for the NIHDI. Although the incentive mechanism has had a clear effect on the use of satellite HD, its effect on PD has been minor. To refine the current incentive mechanism for alternative dialysis modalities, a distinction between PD and satellite HD should be made. However, this would require the definition of a threshold for the proportion of PD in all alternative dialysis modalities. There is no scientific basis for such a threshold, as the choice of dialysis modality is not only based on patients’ profiles but also on patients’ preferences. Hence, refining the system with lump sum bonuses will probably be difficult.
The high cost of PD compared to other dialysis modalities is mainly due to the high cost of consumables. This might be explained by the virtual monopoly position of one big supplier of dialysis fluids for PD. The price paid for dialysis fluids by a specific hospital is the result of negotiations between the company and the hospital. It is difficult to isolate the results of these negotiations from the other products sold to the hospital. As a consequence not all hospitals will pay the same price for the dialysis fluids.
A completely cost neutral financing mechanism would reimburse each dialysis modality at its real cost. In practice, the average cost of services is often used. It is argued that dialysis treatment costs more for specific categories of patients, e.g. diabetics, patients with many co-morbidities, elderly. We could not examine the validity of this assertion, because in Belgium no data are available on dialysis patients’ profiles in terms of cost-driving characteristics. If it would be true that costs differ between patient categories, it might be worthwhile to examine how data on cost-driving patient characteristics could be collected and how the financing of dialysis modalities could be made dependent upon these characteristics.
The financing of hospital HD through lump sums and medical fees, where the medical fee is supposed to cover the costs of the intellectual act of the physician as well as the consumables, contrasts with the financing of satellite HD, PD and home HD through lump sums only that are supposed to cover all costs. In its current format, the system has been a financial incentive for the hospitals to develop satellite HD, rather than PD, whereas for the nephrologists, the fee-for-service remuneration of hospital HD may remain financially the most attractive.

x Chronic Dialysis in Belgium KCE reports 124C
RECOMMENDATIONS GUIDELINES
• In Belgium, clinical guidelines should be developed to improve decision making, including patient participation in the process, about:
o starting dialysis treatment
o identification of indications and contra-indications for specific dialysis modalities
o pre-dialysis patient education and counseling and
o the final choice of dialysis modality.
COUNSELING • Every patient starting on dialysis should be informed timely, fully and
objectively about the different dialysis modalities, conform the law on patient rights.
• Patient counseling could be included as a requirement for all pre-dialysis patients in the existing ambulatory care pathway for ESRD of the NIHDI.
• The Belgian associations for nephrology should include in their current data registration protocols, a tool to assess the effect of introducing counselling services in dialysis centres.
FINANCING • The reimbursement of dialysis treatments should better reflect the real
costs of these treatments to the hospital and the patient and dialysis reimbursement should not be justified on the basis of compensation for other, underfinanced, hospital services.
• The coverage of both the intellectual act of the nephrologist and the consumables by one fee for service for hospital HD should be abandoned.
• The financing through a lump sum and a medical fee for hospital HD on the one hand and through a lump sum only for alternative dialysis modalities on the other hand should be reconsidered.
• A payment per hospital HD session, per satellite HD session and per PD week that resembles more closely the real costs of each treatment modality should be considered. A correction for co-morbidities that are clearly correlated with the costs of the ambulatory dialysis treatment can be considered. The link with the historical per diem price and the system of lump sum bonuses for hospital HD can, in the context of a complete revision of the financing mechanisms for dialysis, be abandoned.
• The reimbursement of transportation to and from the dialysis centre with private means should be reconsidered in order to better reflect the real costs of transportation to patients. If a private transportation means is shared by patients the reimbursement should only be charged to the NIHDI once.
• It should be investigated why and to what extent the amounts paid to home nursing services differ between hospitals.

KCE Report 124 Chronic Dialysis in Belgium 1
Scientific summary Table of contents
ABBREVIATIONS ...................................................................................................................... 4
1 INTRODUCTION ............................................................................................................ 7 1.1 BACKGROUND ........................................................................................................................................... 7 1.2 TECHNOLOGY OVERVIEW .................................................................................................................... 7
1.2.1 Dialysis ................................................................................................................................................ 7 1.2.2 Haemodialysis .................................................................................................................................... 7 1.2.3 Peritoneal dialysis ............................................................................................................................. 8
1.3 THE ISSUE ...................................................................................................................................................... 9 1.4 OBJECTIVES ................................................................................................................................................. 10
2 LITERATURE REVIEW OF CLINICAL AND ECONOMIC ASPECTS OF CHRONIC DIALYSIS .................................................................................................... 11
2.1 INTRODUCTION ...................................................................................................................................... 11 2.2 METHODS ................................................................................................................................................... 13
2.2.1 Literature search criteria .............................................................................................................. 13 2.2.2 Main MeSH terms and definitions ............................................................................................... 13 2.2.3 Selected literature .......................................................................................................................... 13 2.2.4 Terminology .................................................................................................................................... 14
2.3 MORTALITY AND MORBIDITY ............................................................................................................ 14 2.3.1 Hospital HD versus satellite HD versus home HD ................................................................ 14 2.3.2 Continuous ambulatory peritoneal dialysis (CAPD) versus automated peritoneal dialysis (APD/CCPD) ............................................................................................................................................... 15 2.3.3 PD versus HD ................................................................................................................................. 15
2.4 QUALITY OF LIFE ...................................................................................................................................... 17 2.4.1 Background ...................................................................................................................................... 17 2.4.2 Results .............................................................................................................................................. 17
2.5 COSTS AND COST-EFFECTIVENESS OF DIALYSIS MODALITIES .............................................. 18 2.5.1 Costs of dialysis modalities .......................................................................................................... 18 2.5.2 Cost-effectiveness of dialysis modalities .................................................................................... 20
2.6 CHOICE OF A SPECIFIC DIALYSIS MODALITY IN INDIVIDUAL PATIENTS .......................... 21 2.6.1 Medical indications and contra-indications for specific dialysis modalities ......................... 21 2.6.2 Patient choices ................................................................................................................................ 22
2.7 PREDIALYSIS PATIENT EDUCATION ................................................................................................. 23 2.8 CONCLUSION ........................................................................................................................................... 24
3 BELGIAN SITUATION ................................................................................................. 25 3.1 EPIDEMIOLOGY ......................................................................................................................................... 25
3.1.1 The patient population .................................................................................................................. 25 3.1.2 Renal Transplants ........................................................................................................................... 28 3.1.3 Use of different dialysis modalities for ESRD in Belgium ....................................................... 31
3.2 CLINICAL CHARACTERISTICS OF DIALYSIS PATIENTS .............................................................. 35 3.3 PLANNING, ORGANISATION AND REGULATION ...................................................................... 35
3.3.1 Legal aspects .................................................................................................................................... 35 3.3.2 Dialysis facilities in Belgium .......................................................................................................... 37 3.3.3 Real-world relevance of norms and rules for hospital and satellite HD units .................. 37
3.4 FINANCING OF CHRONIC RENAL FAILURE MANAGEMENT .................................................. 39 3.4.1 General Principles .......................................................................................................................... 39 3.4.2 Historical evolution of dialysis financing mechanisms ............................................................. 39 3.4.3 Current financing of hospital haemodialysis ............................................................................. 44 3.4.4 Current financing of satellite HD, home HD and PD............................................................. 46 3.4.5 Summary of financing mechanisms for the different types of dialysis ................................. 47 3.4.6 National expenditures for dialysis between 2002 and 2008 ................................................. 50

2 Chronic Dialysis in Belgium KCE Reports 124
3.4.7 Differences in use of alternative dialysis modalities between centres and between regions ........................................................................................................................................................... 52 3.4.8 Income from dialysis for hospitals .............................................................................................. 54
4 PATIENT CHARACTERISTICS, PUBLIC REIMBURSEMENT AND OUT-OF-POCKET EXPENSES .................................................................................................... 55
4.1 INTRODUCTION AND OBJECTIVES.................................................................................................. 55 4.2 METHOD ..................................................................................................................................................... 55
4.2.1 Financing of dialysis ........................................................................................................................ 55 4.2.2 Inclusion criteria ............................................................................................................................. 55 4.2.3 Working definitions ....................................................................................................................... 55 4.2.4 Patient profiles ................................................................................................................................ 56 4.2.5 Data analysis and presentation of results .................................................................................. 56
4.3 PATIENT CHARACTERISTICS ............................................................................................................... 57 4.3.1 Number of individuals receiving chronic dialysis treatment.................................................. 57 4.3.2 Number of patients by year of treatment and dialysis modality .......................................... 57 4.3.3 Age and gender ............................................................................................................................... 58 4.3.4 Starting, continuing and stopping dialysis .................................................................................. 61 4.3.5 Mortality ........................................................................................................................................... 62
4.4 PUBLIC REIMBURSEMENTS FOR CHRONIC DIALYSIS PATIENTS: CROSS-SECTIONAL ANALYSIS PER YEAR ................................................................................................................................ 64 4.4.1 NIHDI reimbursements ................................................................................................................ 65 4.4.2 Ambulatory dialysis ........................................................................................................................ 66 4.4.3 Hospital stays and one-day clinic ................................................................................................ 68 4.4.4 Ambulatory consultations ............................................................................................................. 71 4.4.5 Ambulatory medication ................................................................................................................. 73 4.4.6 Venofer® (intravenous iron) ....................................................................................................... 74
4.5 OUT-OF-POCKET EXPENSES FOR CHRONIC DIALYSIS PATIENTS: CROSS-SECTIONAL ANALYSIS PER YEAR ................................................................................................................................ 75 4.5.1 Total out-of-pocket expenses for reimbursed health care items ........................................ 75 4.5.2 Ambulatory dialysis ........................................................................................................................ 77 4.5.3 Hospital stays and one-day clinic ................................................................................................ 78 4.5.4 Ambulatory consultations ............................................................................................................. 80 4.5.5 Ambulatory medication ................................................................................................................. 81
4.6 PUBLIC REIMBURSEMENTS FOR CHRONIC DIALYSIS PATIENTS: LONGITUDINAL ANALYSIS FOR INCIDENT PATIENTS ................................................................................................ 82 4.6.1 Overall reimbursements ............................................................................................................... 82 4.6.2 Average reimbursement per patient .......................................................................................... 83
4.7 OVERVIEW AND CONCLUSIONS ...................................................................................................... 84 4.7.1 Patients ............................................................................................................................................. 84 4.7.2 Expenses for the public payer (NIHDI) ..................................................................................... 85 4.7.3 Out-of-pocket expenses for the patient ................................................................................... 86 4.7.4 Expenses before and after starting dialysis ............................................................................... 87
5 THE COSTS AND REVENUES OF DIFFERENT DIALYSIS MODALITIES IN BELGIUM FROM THE HOSPITAL PERSPECTIVE .................................................. 88
5.1 INTRODUCTION ...................................................................................................................................... 88 5.2 COSTS OF HOSPITAL HD, SATELLITE HD AND PD ..................................................................... 88
5.2.1 Methods ............................................................................................................................................ 88 5.2.2 Results .............................................................................................................................................. 99
5.3 COSTS AND REVENUES OF A DIALYSIS PROGRAMME FROM A HOSPITAL’S PERSPECTIVE ............................................................................................................................................ 103 5.3.1 Methods .......................................................................................................................................... 103 5.3.2 Results ............................................................................................................................................ 106
5.4 DISCUSSION ............................................................................................................................................. 112 5.4.1 Cost analysis .................................................................................................................................. 112 5.4.2 Simulation of revenues and costs .............................................................................................. 113

KCE Report 124 Chronic Dialysis in Belgium 3
6 INTERNATIONAL COMPARISON .......................................................................... 115 6.1 INTRODUCTION .................................................................................................................................... 115 6.2 ORGANISATION OF CARE FOR ESRD PATIENTS ....................................................................... 115
6.2.1 Incidence and prevalence ............................................................................................................ 115 6.2.2 Number of nephrologists ........................................................................................................... 116 6.2.3 Geographical access to dialysis facilities .................................................................................. 117 6.2.4 Distribution of patients between treatment modalities ....................................................... 117 6.2.5 Incentives and criteria influencing the choice of the treatment ......................................... 119
6.3 ESRD FUNDING ...................................................................................................................................... 120 6.3.1 Introduction ................................................................................................................................... 120 6.3.2 National budget for ESRD patients .......................................................................................... 120 6.3.3 Financing of dialysis physicians ................................................................................................... 121 6.3.4 Financing of dialysis units ............................................................................................................ 122 6.3.5 Patients’ co-payments .................................................................................................................. 123 6.3.6 Cost containment measures ...................................................................................................... 124
7 PATIENT PERSPECTIVE IN CHRONIC DIALYSIS ............................................... 126 7.1 INTRODUCTION .................................................................................................................................... 126 7.2 OBJECTIVES ............................................................................................................................................... 126 7.3 METHODS ................................................................................................................................................. 126 7.4 RESULTS ..................................................................................................................................................... 128
7.4.1 Methodological problems ........................................................................................................... 128 7.4.2 Reported issues by patients ....................................................................................................... 128 7.4.3 Information .................................................................................................................................... 128 7.4.4 Choice between dialysis modalities .......................................................................................... 129 7.4.5 Advantages and disadvantages of different dialysis modalities ............................................ 130 7.4.6 Support in case of home dialysis treatments .......................................................................... 131 7.4.7 Financial issues .............................................................................................................................. 131
7.5 PSYCHOSOCIAL CONSIDERATIONS .............................................................................................. 132 7.6 CONCLUSION ......................................................................................................................................... 132
7.6.1 Our survey ..................................................................................................................................... 132 7.6.2 Previous studies ............................................................................................................................ 133
8 DISCUSSION AND CONCLUSIONS ....................................................................... 136 8.1 EPIDEMIOLOGY OF RENAL REPLACEMENT THERAPY IN BELGIUM .................................... 136 8.2 RELATIVE EFFECTIVENESS OF DIALYSIS MODALITIES ............................................................... 137 8.3 COSTS OF DIALYSIS MODALITIES FROM A HOSPITAL PERSPECTIVE .................................. 137 8.4 COST-EFFECTIVENESS OF DIALYSIS MODALITIES ...................................................................... 138 8.5 COSTS AND REIMBURSEMENT .......................................................................................................... 138 8.6 LICENSING OF DIALYSIS CENTRES .................................................................................................. 140 8.7 NIHDI EXPENDITURES .......................................................................................................................... 141 8.8 INTERNATIONAL COMPARISON ..................................................................................................... 141 8.9 PATIENT-RELATED ISSUES ................................................................................................................... 142 8.10 LIMITATIONS OF THE REPORT ......................................................................................................... 142 8.11 FINAL CONCLUSION ............................................................................................................................ 142
9 APPENDICES ............................................................................................................... 143
APPENDIX TO CHAPTER 2 ................................................................................................ 143
APPENDIX TO CHAPTER 4 ................................................................................................ 187
APPENDIX TO CHAPTER 5 ................................................................................................ 203
APPENDIX TO CHAPTER 7 ................................................................................................ 215
10 REFERENCES ............................................................................................................... 221
4 Chronic Dialysis in Belgium KCE Reports 124
ABBREVIATIONS ABC Activity Based Costing
ADL Activities of Daily Living
APD Automated Peritoneal Dialysis (=CCPD)
AV-fistula Arterio-Venous fistula
BFM-BMF Budget Financiële middelen / Budget des moyen financiers
BMI Body Mass Index CAPD Continuous Ambulatory Peritoneal Dialysis CCPD Continuous Cycling Peritoneal Dialysis (=APD) CCTR Cochrane Controlled Trial Register CDC Centers for Disease Control and Prevention CEA Cost-Effectiveness Analysis CHD Coronary Heart Disease CHF Congestive Heart Failure CHMP Committee for Medicinal Products for Human Use CI Confidence Interval CKD Chronic Kidney Disease CKD5D Chronic Kidney Disease Stage V D (see ESRF and ESRD) CRT Cardiac Resynchronisation Therapy CUA Cost-Utility Analysis CVD Cardiovascular Disease DDD Defined Daily Dose DOPPS Dialysis Outcomes and Practice Patterns Study DRG Diagnosis Related Group EAC Equivalent Annual Cost EBPG European Best Practice Guidelines EMEA European Medicines Agency (EU Agency) EQ-5D EuroQoL 5 dimensions ERA European Renal Association ESRD End-Stage Renal Disease (see ESRF and CKD5D) ESRF End-Stage Renal Failure (see ESRD and CKD5D) EU European Union
EuroQol-5D European Quality of Life scale – 5 dimensions E-W England and Wales FDA Food and Drug Administration FFS Fee for Service FPS Federal Public Service (Federale Overheidsdienst/Service Public Fédéral) FTE Full Time Equivalent FU Follow-up GFR Glomerular Filtration Rate GNFB Groupement des Néphrologues Francophones de Belgique HAS Haute Authorité de Santé (France) HCHD High-Care Haemodialysis HD Haemodialysis HDD HD Domestic HDH HD in Hospital HDS HD in Satellite

KCE Report 124 Chronic Dialysis in Belgium 5
HG/UH Hospital Use Only (Belgium: Hospitaal Gebruik / Utilisation Hospitalière) HRQOL Health Related Quality of Life HUI Health Utilities Index ICER Incremental Cost-Effectiveness Ratio IMA - AIM Intermutualistisch agenschap - Agence intermutualiste IPD Intermittent Peritoneal Dialysis IR Incidence Rate
ISHCOF International Study of Health Care Organization and Financing ITT Intention-To-Treat (population) KCE Kennis Centrum – Centre d’Expertise (Belgian Health Care Knowledge Centre) KDIGO Kidney Disease Improving Global Outcomes KDOQI Kidney Disease Outcomes Quality Initiative KDQOL Kidney Disease Quality of Life LCHD Low-Care Haemodialysis LE Life Expectancy LY Life Year LYG Life Year Gained MDS Minimal Data Set MeSH Medical Subject Heading MS Member State (EU) MVD Multi Vessel Disease (more than 1 coronary vessel affected) NBVN Nederlandstalige Belgische Vereniging voor Nefrologie NCA National Competent Authority (EU) NECOSAD Nederlandse Coöperatieve Studie naar de Adequaatheid van Dialyse NHHD Nocturnal Home Haemodialysis NIHDI National Institute for Health and Disability Insurance (RIZIV/INAMI – Belgium) NIPD Nightly Intermittent Peritoneal Dialysis NKF National Kidney Foundation NZ New Zealand ONT National Transplant Organization ORPADT ORganisatie van het PAramedisch personeel der Dialyse en Transpalantie Centra OTC Over-the-counter drugs PC Peritoneal Cavity PD Peritoneal Dialysis PET Peritoneal Equilibration Test PP Per-protocol (population) PPS Prospective Price System PY Person Years QALY Quality Adjusted Life Year QOL Quality of Life RCT Randomized Controlled Trial RKF Residual Kidney Function (=RRF) RRF Residual Renal Function (=RKF) RRT Renal Replacement Therapy RTX Renal Transplantation SF-36 Medical Outcome Study Short Form 36-Item Health Survey SG Standard Gamble TPD Tidal Peritoneal Dialysis TTO Time Trade-Off

6 Chronic Dialysis in Belgium KCE Reports 124
TTP Trusted Third Party USA United States of America USRDS United States Renal Data System VAS Visual Analogue Scale (for measuring HRQOL) VAT Value Added Tax WHO World Health Organisation

KCE Report 124 Chronic Dialysis in Belgium 7
1 INTRODUCTION
1.1 BACKGROUND With ageing, renal function declines, as has been documented in longitudinal studies.1 In patients with chronic renal disease, this decline can be much more outspoken, leading to a situation where residual kidney function is insufficient. At that stage Renal Replacement Therapy (RRT) may become necessary. Several classifications have been used to quantify the stages of chronic renal disease. The most severe state may be called end-stage renal disease (ESRD), end-stage renal failure (ESRF) or chronic kidney disease stage VD (CKD5D) as described in more detail in chapter 2 on the literature review. Throughout this review, and for consistency reasons, we will use the term ‘end-stage renal disease’ (ESRD).
As in other industrialised countries the prevalence of end-stage renal disease (ESRD) treatment in Belgium is increasing. In Belgium, the annual growth rate in the number of patients treated for ESRD was about 5.2% between 2002 and 2007.a The incidence of ESRD treatment remained relatively stable over this period. There are large differences in the growth rates of ESRD treatment prevalence between age groups. The highest growth rate is observed in patients older than 65 years of age.
There are different treatment options for patients needing RRT. The patients can be dialysed, either with haemodialysis (HD) or with peritoneal dialysis (PD). In both cases patients can also receive a kidney transplant, either from a deceased or a living donor. Ultimately, kidney transplantation is considered to be the most preferable option, whenever possible.
1.2 TECHNOLOGY OVERVIEW
1.2.1 Dialysis
During the disease process ultimately leading to ESRD, therapy for kidney failure (dialysis) may become necessary while waiting for the, if at all possible, preferable therapy of kidney transplantation. Dialysis, or ‘renal replacement therapy’ (RRT) refers to the process by which fluids and solutes are removed from, or added to the patient’s blood.2 During this process, the blood from the patient undergoes exchanges with a dialysate either in a dialyzer outside the body (‘extracorporeal circuit’) through an artificial semi permeable membrane and is then returned to the patient (such as in haemodialysis) or through a natural membrane provided by the peritoneum (such as in peritoneal dialysis). A full description of techniques and dialysis schedules is outside the scope of this report and can be found in appropriate reference manuals.
1.2.2 Haemodialysis
Haemodialysis (HD) removes or adds solutes by diffusion between blood and dialysate across a semi-permeable membrane. The haemodialysis machine incorporates many features, such as a pump to deliver blood to the dialyzer at a constant rate, monitors to ensure that the pressures inside extracorporeal circuit are not excessive, a detector for leakage of red blood cells from the blood compartment into the dialysate compartment, an air detector and shut-off system to prevent air embolism, a pump to deliver dialysate, a proportioning system for proper dilution of the dialysate concentrates, a heater to warm the dialysate to body temperature, an ultra filtration controller for precise regulation of fluid removal, and conductivity monitors to check the total ion strength in the dialysate.2 These devices ensure the proper, safe, and reliable delivery of blood and dialysate to the membrane, where exchange of water and solutes takes place.
a Source: at the moment of writing unpublished common report of the NBVN-GNFB 2008.
8 Chronic Dialysis in Belgium KCE Reports 124
For chronic haemodialysis, the maintenance of vascular access is a major challenge. Adequate vascular access should deliver blood flow to the dialyzer of 0.2 up to 0.5 l/min, depending upon body size. Long-term vascular access for haemodialysis is preferably established by the creation of an AV fistula in an upper extremity (usually the forearm), although a lower extremity vessel is sometimes used.2 Those fistulae are established by connecting an artery to a nearby vein through a surgical anastomosis of the native vessels. Sometimes, the anastomosis has to rely on a synthetic graft. In general, native fistulae are preferred over synthetic grafts because of the relative longevity (approximately 80 % vs. 50 % over 3 years), and a lower susceptibility to infection.2
Although haemodialysis is a relatively safe procedure, several complications may arise. Some are inherent to side effects of the extracorporeal circuit, some derive from technical errors, and some from specific reactions of patients. Hypotension during dialysis is common, attributed to volume depletions and shifting of fluid from extra- to intracellular space. Furthermore, impaired sympathetic activity, vasodilatation, sequestration of blood in the muscles, and splanchnic pooling of blood while eating during dialysis are commonly reported.2 Many of these complications can be prevented by adequate counselling. The most common post-haemodialysis symptom is asthenia, a generalized ‘washed-out’ sensation, attributed to the rapid changes in fluids and serum chemistry.2 It usually lasts for a few hours and disappears spontaneously.
Chronic haemodialysis typically is performed three times weekly and can be delivered in various settings: in the hospital in a classical full-care haemodialysis unit, in a low-care setting (further in this report called a satellite dialysis centre), or less commonly at the home of the patient. Also the frequency of dialysis can differ, depending on remaining renal function (RRF) and patient preferences, including longer dialysis times, more frequent dialyses and during daytime or at night
1.2.3 Peritoneal dialysis
In the 1960’s peritoneal dialysis (PD) was mainly used to manage patients with acute renal failure, while patients with ESRD were treated almost exclusively by haemodialysis, or occasionally by intermittent PD (IPD). In the 1970’s, continuous ambulatory peritoneal dialysis (CAPD) was introduced leading to an increase in the use of chronic PD.2
In contrast to HD, instead of an artificial membrane the peritoneal membrane is used as a semi-permeable membrane in PD. Standard PD fluid contains a high concentration of glucose or of a polysaccharide as osmotic agent, making the dialysate hyperosmolar as compared with serum and causing fluid removal through ultra filtration. The important physiological constraints of PD are, therefore, the peritoneal blood flow and peritoneal membrane, as well as dialysate volume, duration of exchange and number of exchanges per day.2 The patient-dependent physiological aspects are monitored through a peritoneal equilibration test (PET), during which a series of peritoneal transport capabilities are measured. This test allows for an optimal design of the treatment regimen with PD. The access for PD is a surgically inserted catheter into the abdominal cavity. As a general advantage, PD is claimed to better preserve RRF in patients than HD.2 Therefore it is believed that PD might be preferable as the initial treatment option for ESRD, if possible. There are, however, possible complications, the most important of which is peritonitis. Peritonitis accounts for an important proportion of the hospital admissions for these patients and it is the major cause of technique failure resulting to a transfer from PD to HD. Because of the daily manipulations, entry of bacteria into the catheter during exchanges is common. Treatment of peritonitis is initially empiric and based on antibiotics, but sometimes catheter removal and switching to other dialysis modalities can be necessary. Other frequent complications include catheter infections at the entry or in the tunnel, catheter malfunctions, hernias and fluid leaks. A long-term complication is due to the fact that the peritoneum undergoes changes in response to the new environment, leading to thickening of the peritoneal interstitium and basement membrane reduplication in both mesothelium and in the capillaries, usually after about 4 to 5 years of PD,2 leading to decreased PD efficiency, and sometimes encapsulating (sclerosing) peritonitis.

KCE Report 124 Chronic Dialysis in Belgium 9
Survival of patients on PD appears to be similar to those on HD, although most of these studies are observational and therefore influenced by underlying co-morbidity (see chapter 2). Ultimately, many patients transfer from PD to HD for various reasons, but often because of peritonitis or catheter infections. Other reasons are catheter malfunction, inability to perform the procedures, or an inadequate clearance, especially in the presence of decreasing RRF.
There are two main categories of PD, Continuous Ambulatory Peritoneal Dialysis (CAPD) and Automated Peritoneal Dialysis (APD).
Continuous Ambulatory Peritoneal Dialysis (CAPD)
CAPD does not require specific machinery and uses the smallest volume of dialysate to prevent uremia, usually a daily volume of around 8 to 10 litres of dialysate. CAPD involves a series of daily exchanges (three to five daily), with dialysis occurring continuously. Treatment regimens depend on patient size, peritoneal transport capabilities and residual renal function (RRF).
The dialysis fluid is instilled by gravity into the peritoneal cavity (PC) and drained out after a dwell period of several hours.2 The CAPD system consists of a plastic bag containing the PD fluid, a transfer tubing set, and a permanent, indwelling implanted catheter. The connection between bag and transfer set is manipulated a few times daily, a procedure which must be done using strict, semi sterile, no-touch techniques.
Automated Peritoneal Dialysis (APD)
Automated PD (APD) is a rather broad term that is used for different forms of PD requiring a mechanical device, a ‘cycler’ to assist in the delivery and drainage of the dialysis fluid.2 APD variants include Continuous Cycling PD (CCPD) involving exchanges during both day and night, but also other variants such as Intermittent PD (IPD), Nightly Intermittent PD (NIPD) or Tidal PD (TPD).
APD regimens usually include an increased number of short-dwell exchanges with the ‘cycler’ delivering a preset number of exchanges. The major advantage of APD is that it eliminates the need for frequent manual interventions, with most of the dialysis occurring at night during sleep.2 Normally, APD needs only two procedures daily, the initial connection of the catheter to the machine and the disconnection at the end of dialysis.
1.3 THE ISSUE Substitution of the more expensive haemodialysis in hospital by the less expensive alternatives such as low-care haemodialysis in satellite centres and peritoneal dialysis has been slower in Belgium than in many other countries. This is thought to be partly due to the financing mechanisms for dialysis. Since 1995 the Belgian government has modified the financing system a couple of times, with the explicit goal of introducing incentives for substitution.
In this study we investigate the current situation of dialysis in Belgium. We examine the clinical, economical, organisational or patient-related reasons for the observed distribution between dialysis modalities.
The clinical reasons are related to patient characteristics. Clearly not all patients are eligible for low-care haemodialysis in satellite centres or for peritoneal dialysis. Indications for the different types of dialysis need to be carefully reviewed.
Economic reasons relate to the real cost of the different types of dialysis and the financing of these services. Therefore, the real costs of the different forms of dialysis for hospitals need to be calculated and compared with the corresponding reimbursement.

10 Chronic Dialysis in Belgium KCE Reports 124
Organisational reasons relate to the legal requirements for different types of dialysis. Legal requirements are imposed on the logistics, qualification and availability of personnel, numbers of patients treated annually, agreements with a transplantation centre etc.
Finally, patient-related factors, such as patient preferences or socio-economic situation, may explain the choice of type of dialysis.
A thorough analysis of all these elements is currently lacking. In this HTA, we will try to fill this gap.
1.4 OBJECTIVES The primary objectives of this HTA are:
• To describe the different treatment options for patients with ESRD and give an overview of the selection criteria for different types of dialysis described in literature (chapter 2);
• To describe the relative use of different dialysis modalities in Belgium as well as the legal framework for dialysis provision and financing (chapter 3);
• To describe the patient population and to assess the costs and budget impact for the National Institute for Health and Disability Insurance (NIHDI) and for the patients of the different dialysis modalities (chapter 4);
• To calculate the costs of the different dialysis modalities from the hospital’s point of view and compare the costs of a dialysis programme with its revenues (chapter 5);
• To compare the Belgian situation with other countries (chapter 6);
• To describe patient-related issues in different dialysis modalities (chapter 7) and
• To draw conclusions for the organization and financing of dialysis in Belgium (chapter 8).
The focus of this HTA lies on the different types of dialysis used in Belgium for adult patients with chronic end stage renal failure who need chronic dialysis: high-care haemodialysis (hospital HD) in a hospital setting, low-care haemodialysis in a satellite centre (satellite HD), home haemodialysis and peritoneal dialysis (PD). The phrase “alternative dialysis modalities” is used throughout the text to cover PD, home HD and HD in a satellite centre.
Acute dialysis and paediatric dialysis is not considered in this study. Specific aspects for renal transplantation are not examined in depth, but discussed whenever appropriate.

KCE Report 124 Chronic Dialysis in Belgium 11
2 LITERATURE REVIEW OF CLINICAL AND ECONOMIC ASPECTS OF CHRONIC DIALYSIS
2.1 INTRODUCTION The optimal treatment of ‘end-stage renal disease (ESRD), also called ‘end-stage renal failure’ (ESRF) and currently officially labelled as chronic kidney disease stage V D (CKD5D, see Table 1), is clearly a successful kidney transplantation. However, and not surprisingly, not a single randomized controlled trial of kidney transplantation versus any kind of dialysis has ever been performed and such a trial is very unlikely ever to be performed. Still, large observational studies strongly suggest that kidney transplantation is associated with both a better quality of life and a better survival than long-term dialysis. For instance, Wolfe et al.3 compared the survival of patients enlisted in the US for a kidney transplant (but not transplanted) with those enlisted and transplanted between 1991 and 1997. After adjustment for many potential confounders, middle and long-term survival was shown to be substantially better in those who were transplanted than in those who did not have the chance to be transplanted.3 The discussion of the reasons for this better survival with kidney transplantation are beyond the scope of this review of the clinical and economic aspects of chronic dialysis and probably include both a better correction (even suboptimal with most kidney transplants) of the uremic syndrome and avoidance of the potential complications of chronic dialysis.
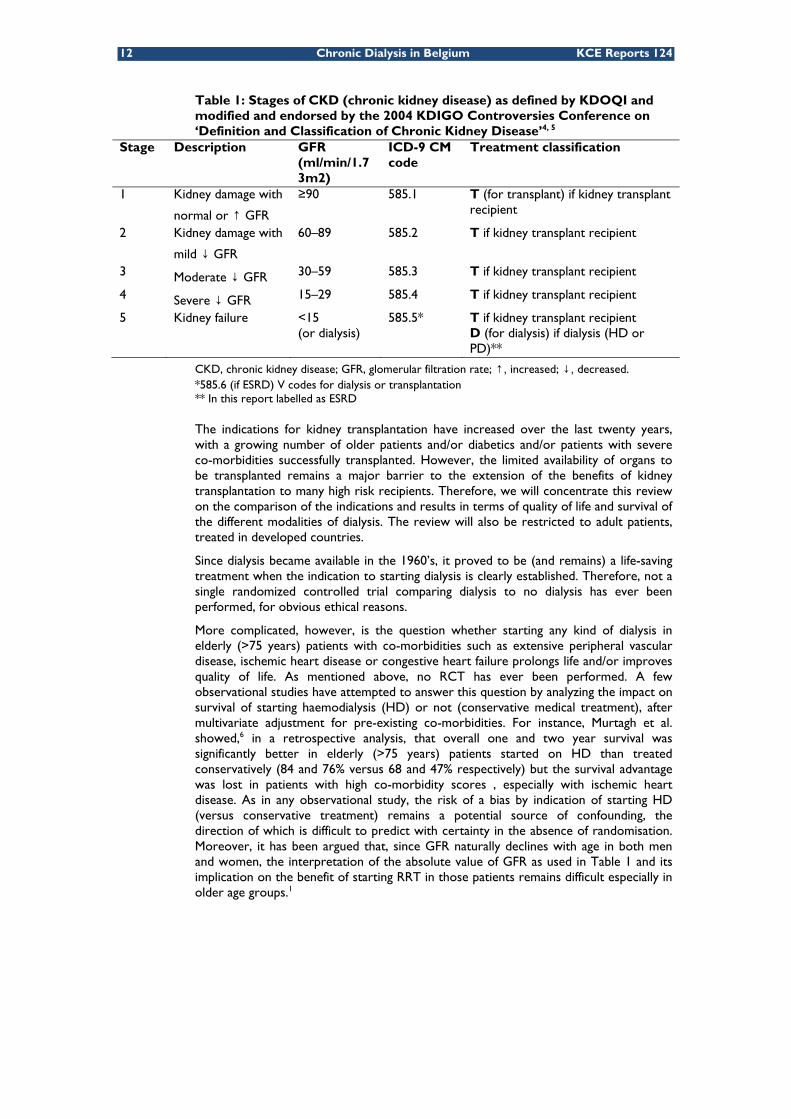
As mentioned in the introduction we will use, throughout this review, the term ‘end-stage renal disease’ (ESRD) for simplicity and for consistency reasons. We also assume that kidney transplantation is, in principle, the treatment of choice for ESRD for reasons explained above. However, several stages of chronic renal disease have been defined by international consensus, all requiring different approaches as summarized in the position statement of the Kidney Disease Outcomes Quality Initiative (KDOQI) and modified and endorsed by the ‘Kidney Disease: Improving Global Outcomes’ Foundation (KDIGO).4, 5 The only modification recommended at this 2004 conference was the addition of a suffix for treatment: ‘T’ for all kidney transplant recipients at any level of GFR, and ‘D’ to indicate dialysis for CKD stage 5 patients treated by dialysis (see Table 1).5
12 Chronic Dialysis in Belgium KCE Reports 124
Table 1: Stages of CKD (chronic kidney disease) as defined by KDOQI and modified and endorsed by the 2004 KDIGO Controversies Conference on ‘Definition and Classification of Chronic Kidney Disease’4, 5
Stage Description GFR (ml/min/1.73m2)
ICD-9 CM code
Treatment classification
1 Kidney damage with
normal or ↑ GFR
≥90 585.1 T (for transplant) if kidney transplant recipient
2 Kidney damage with
mild ↓ GFR
60–89 585.2 T if kidney transplant recipient
3 Moderate ↓ GFR 30–59 585.3 T if kidney transplant recipient
4 Severe ↓ GFR 15–29 585.4 T if kidney transplant recipient
5 Kidney failure <15 (or dialysis)
585.5* T if kidney transplant recipient D (for dialysis) if dialysis (HD or PD)**
CKD, chronic kidney disease; GFR, glomerular filtration rate; ↑, increased; ↓, decreased. *585.6 (if ESRD) V codes for dialysis or transplantation ** In this report labelled as ESRD
The indications for kidney transplantation have increased over the last twenty years, with a growing number of older patients and/or diabetics and/or patients with severe co-morbidities successfully transplanted. However, the limited availability of organs to be transplanted remains a major barrier to the extension of the benefits of kidney transplantation to many high risk recipients. Therefore, we will concentrate this review on the comparison of the indications and results in terms of quality of life and survival of the different modalities of dialysis. The review will also be restricted to adult patients, treated in developed countries.
Since dialysis became available in the 1960’s, it proved to be (and remains) a life-saving treatment when the indication to starting dialysis is clearly established. Therefore, not a single randomized controlled trial comparing dialysis to no dialysis has ever been performed, for obvious ethical reasons.
More complicated, however, is the question whether starting any kind of dialysis in elderly (>75 years) patients with co-morbidities such as extensive peripheral vascular disease, ischemic heart disease or congestive heart failure prolongs life and/or improves quality of life. As mentioned above, no RCT has ever been performed. A few observational studies have attempted to answer this question by analyzing the impact on survival of starting haemodialysis (HD) or not (conservative medical treatment), after multivariate adjustment for pre-existing co-morbidities. For instance, Murtagh et al. showed,6 in a retrospective analysis, that overall one and two year survival was significantly better in elderly (>75 years) patients started on HD than treated conservatively (84 and 76% versus 68 and 47% respectively) but the survival advantage was lost in patients with high co-morbidity scores , especially with ischemic heart disease. As in any observational study, the risk of a bias by indication of starting HD (versus conservative treatment) remains a potential source of confounding, the direction of which is difficult to predict with certainty in the absence of randomisation. Moreover, it has been argued that, since GFR naturally declines with age in both men and women, the interpretation of the absolute value of GFR as used in Table 1 and its implication on the benefit of starting RRT in those patients remains difficult especially in older age groups.1

KCE Report 124 Chronic Dialysis in Belgium 13
2.2 METHODS
2.2.1 Literature search criteria
We conducted a systematic search strategy. At first, the literature was searched for meta-analyses and systematic reviews on specific subjects. Then, individual studies published later than the publication date of the most recent reference in the reviews, were identified using the same keywords. The initial search was performed at the end of 2007 and an update search was performed end of October 2009. Additional references were identified based on the reference lists of previous articles and on specific searches on follow-up articles of published studies.
Since the focus of this report is on the basic organisation and location of RRT, we excluded articles that dealt specifically with the effect of technical matters such as the differences between convective dialytic techniques compared to diffusive techniques, the frequency of dialysis and the controversies surrounding high- versus low-flux HD.7, 8 RCTs are ongoing to sort out the comparative efficacy of those different HD techniques, but those are outside the scope of this report.
More details on the search strategy and on the inclusion and exclusion criteria can be found in the appendix.
2.2.2 Main MeSH terms and definitions
Over the years, several MeSH terms and definitions have been created for indexing dialysis and renal failure. Although some definitions may seem to have become slightly outdated by current definitions, they are mentioned here with their official definition as used by the US National Library of Medicine.
• Renal Dialysis: Therapy for the insufficient cleansing of the BLOOD by the kidneys based on dialysis and including hemodialysis, PERITONEAL DIALYSIS, and HEMODIAFILTRATION. Year introduced: 2001(1967)
• Kidney Failure, Chronic: The end-stage of CHRONIC RENAL INSUFFICIENCY. It is characterized by the severe irreversible kidney damage (as measured by the level of PROTEINURIA) and the reduction in GLOMERULAR FILTRATION RATE to less than 15 ml per min (Kidney Foundation: Kidney Disease Outcome Quality Initiative, 2002). These patients generally require HEMODIALYSIS or KIDNEY TRANSPLANTATION. Year introduced: 1967(1966)
• Renal Replacement Therapy: Procedures which temporarily or permanently remedy insufficient cleansing of body fluids by the kidneys. Year introduced: 1994
While, for practical and dissemination purposes, the US literature and the NKF prefer to use the word ‘kidney’, we will try to use ‘renal’ consistently throughout this report, whenever we are referring to the generic term rather than to a proprietary name, such as an organisation.
2.2.3 Selected literature
Four systematic reviews were identified and three relevant for this report will be discussed in more detail.9-11 Observational studies were only included if they met all of the following criteria: sample size >500, multivariate adjustment for potential confounders such as age, gender, co-morbidities and published after 1996.
For quality of life, twelve reviews were found of which three were relevant for this report and retained for more detailed discussion together with a few specific studies.
For costs and cost-effectiveness five relevant literature reviews were found.9, 12-15 Six additional primary costs studies,16-21 and five additional primary cost-effectiveness studies13, 22-29 of different dialysis modalities were found.

14 Chronic Dialysis in Belgium KCE Reports 124
In addition to this literature, we used the position statement from KDOQI and KDIGO,5 and the Australian and French guidelines on the indications and contra-indications for choice of dialysis modality.30-32
2.2.4 Terminology
Terms used in international literature vary and are sometimes slightly different. According to expert opinion, the situation in Belgium can also be very different from one centre to another while there appears to be a shift in patient profiles with an increasing number of high-care patients being treated in so called ‘low-care’ settings. The mortality data presented in chapter 4, however, seem to indicate that on average the patient profile of patients treated in different facilities is still very different.
For the sake of consistency we will use the following terms throughout this report:
• Hospital HD: full-care (high-care) haemodialysis in a hospital or equivalent centre (can also be done in satellite centres), with full assistance by nephrologists and nursing personnel; in international literature this type of HD is often called in-centre HD,
• Satellite HD: mainly low-care haemodialysis (sometimes called self-care haemodialysis) where part of the necessary manipulations are done by the patient, with a lower attendance of nephrologists and nursing personnel. Satellites centre for HD can be embedded in a hospital or in a separate building. Also full-care (high-care) HD is possible in some of the satellite centres and according to expert opinion the proportion of patients treated in that way is increasing.
• Home HD: haemodialysis at the home of the patient, with the patient mainly in charge of necessary manipulations, without attendance of nephrologists and with limited, if any, nursing personnel,
• CAPD: Continuous Ambulatory Peritoneal Dialysis, see description in chapter 1,
• APD: Automated Peritoneal Dialysis, see description in chapter 1.
Satellite HD, home HD, CAPD and APD are collectively referred to as “alternative dialysis modalities” throughout this report. As home HD is only used by a small proportion of patients in Belgium (0.55% in 2006 according to the NIHDI Dialysis survey 2006), most of the analyses of alternative dialysis modalities focus on PD and satellite HD.
2.3 MORTALITY AND MORBIDITY
2.3.1 Hospital HD versus satellite HD versus home HD
2.3.1.1 Mortality
A systematic review of studies comparing the medical effectiveness of these various HD modalities was published in full in 2003, and in summary form in 2004.9, 33 This review included a total of 27 studies of variable quality: 4 systematic reviews, 1 randomized cross-over trial and 22 comparative observational studies, and outcomes included quality of life and survival. There were, however, major concerns about potential patient selection biases due to confounding by indication. Eight primary studies and one systematic review included in this review provided information on survival for people undergoing home HD compared with hospital or satellite HD. Only 6 studies used a Cox proportional hazards model to try and correct for baseline characteristics.
Overall, the mortality risk for patients undergoing home HD was lower than for patients undergoing hospital or satellite unit HD. The single exception was a study by Price and colleagues dating back from the late seventies and including patients dialyzed between 1964 and 1976.34 Therefore, this comparison appears irrelevant for obtaining valid conclusions on current dialysis technologies and practice. Of the 2 studies using the Cox model and comparing home with satellite HD, one reported a significantly better survival in home HD,35 whereas the other reported similar survival with home and satellite HD.36

KCE Report 124 Chronic Dialysis in Belgium 15
Overall, Mowatt et al. concluded that patients on home HD are in most studies a highly selected group, generally younger and with less co-morbidities than those who are dialyzed in hospital.9, 33
In addition, home dialysis provides an opportunity to dialyze more frequently and for longer period than would be possible in most hospital or satellite units. It is therefore difficult to disentangle the true benefits of home HD from the effects of socio-demographic and co-morbidity factors and the opportunity provided by home HD for greater duration and/or frequency of dialysis sessions.
2.3.1.2 Morbidity
Only two studies reviewed by Mowatt et al. provided information on hospitalization rates.9, 33 In one of them,37 the average yearly hospitalization rate was 13.4 days/patient for home HD, compared with 11.5 days for satellite HD and 15.1 days for hospital HD. In a review comparing short daily or nocturnal HD with hospital HD 3 times/week, Mohr and colleagues found an average reduction of 43 % (weighted CI 23-63 %) in hospital days associated with daily or nocturnal HD.21 Again, this benefit may result from various factors: patient selection bias, potential benefits of home HD by itself or higher dialysis dose related to the home setting and thus opportunity to dialyze for longer sessions and or more frequently.
2.3.2 Continuous ambulatory peritoneal dialysis (CAPD) versus automated peritoneal dialysis (APD/CCPD)
2.3.2.1 Mortality
A Cochrane review analyzed RCTs comparing CAPD with APD in patients with ESRD and this was published as a full review but also as a summary paper.10, 38 The authors were able to include only 3 trials (139 patients). APD did not statistically significantly differ from CAPD with respect to mortality endpoints (relative risk 1.49, 95 % confidence intervals 0.51 to 4.37).
2.3.2.2 Morbidity
In the same review, 10, 38 APD did not differ from CAPD with respect to the risk of peritonitis (relative risk 0.75, 95 % CI 0.50 to 1.11), switching from original PD modality to a different dialysis modality (RR 0.50, 95 % CI 0.25 to 1.02) hernias (RR 1.26; 95 % CI 0.32 to 5.01), PD fluid leaks (RR 1.06, 95 % CI 0.11 to 9.83), PD catheter removal (RR 0.64, 95 % CI 0.27 to 1.48) or hospital admissions (RR 0.96, 95 % CI, 0.43 to 2.17). The evolution of residual renal function was also similar between groups (mean difference – 0.17, 95 % CI, -1.66 to +1.32). In 1 study, the peritonitis and hospitalization rate was significantly lower in patients on APD (expressed as episodes per patient year.39
Overall, the authors of this review conclude that APD has not been shown to have significant advantages over CAPD in terms of important clinical outcomes, but that APD may be considered advantageous in younger PD patients or those in employment or education due to psychosocial advantages.10 Additional RCTs, however; are recommended to provide more evidence on the relative benefits of both treatments.
2.3.3 PD versus HD
A Cochrane review presented a systematic review of RCTs and quasi RCTs comparing CAPD to hospital or home HD for adults with ESRD.11 The reviewers identified only one small trial. This trial was performed within the context of a large Dutch multicentre cohort study (NECOSAD) on patients with ESRD that started on RRT. The original cohort study ran from 1997 and included 1983 patients by August 2005.40
For the trial, new dialysis patients from 38 dialysis centres, without obvious contra-indication to either PD or HD were further invited to participate in a trial and were randomly assigned to start with HD or PD. Inclusion period was between January 1997 and August 2000. Ultimately, only 38 patients could be randomized: 18 patients to HD and 20 to PD. There was no statistical difference between PD and HD patients over 2 years of follow-up in death or quality of life years.41

16 Chronic Dialysis in Belgium KCE Reports 124
After 5 years of follow-up, 9 HD and 5 PD patients had died, a borderline significant crude hazard ratio of death of 3.8 for HD compared to PD (95 % CI 1.1 to 12.6). After adjustment for age, co-morbidities and primary kidney disease, the hazard ratio declined and was no longer statistical significant: 3.6 (0.8 to 15.4). However, it should be stressed that in this trial 4 of the initial 20 patients randomized to PD were switched to HD whereas only 1 of the initial 18 patients randomized to HD switched to PD. It should also be stressed that quality of life was the primary outcome of this trial, while survival was only a secondary endpoint. Finally, the 7 years average age difference between the HD (62 y) and PD (55 y) group casts serious doubt on the allocation concealment, although this might also be due to spurious randomisation variation due to the small number of patients included.
This single RCT comparing HD with PD in 38 Dutch dialysis centres clearly illustrates the major difficulties of such an undertaking. The authors commented that although their study was underpowered, their results may suggest that the treatment strategy starting with PD leads to better survival compared to a strategy starting with HD. The authors suggest that the difference in survival rate between modalities, although not significant after adjustment for various confounding factors, may potentially be due to the better preservation of residual renal function in PD than HD.
Early observational studies comparing PD and HD had multiple methodological problems related to their observational and retrospective nature and presented design flaws as well as important case-mix differences.
Some more recent and better-designed observational studies suggest that after correction for base-line co-morbidities, there may be an early survival benefit with PD (first 1 to 2 years) with a tendency toward improved outcomes with HD in later years. Additional large-sized observational studies based on data from the US Renal Data System (USRDS) have suggested that patients starting dialysis with known atherosclerotic heart disease or congestive heart failure have a greater relative risk of death on PD than with HD at 2 years (see Table 2).
Overall, the existing data show that the apparent benefits for one modality over the others are modest compared with the influence of other more important prognostic factors such as age, diabetes and heart disease.
Table 2: Observational studies comparing survival between PD and HD Country Study design N of
patients Hazard Ratio of death and comments
USA42 Registry Billing data
398 940 PD = HD Except Diabetics > 65 y (in which PD < HD)
USA43 Registry Billing data
107 922 Congestive heart failure PD < HD
USA44 Cohort 1041 year PD = HD 1 - 2 years PD < HD
USA45 Registry 107 922 PD < HD in patients with coronary disease
Netherlands46 Cohort 1222 < 2 y PD = HD > 2 y PD < HD in elderly
USA47 Cohort of candidates for TP only
12 568 PD = HD except BMI > 26 where PD < HD
Canada48 Cohort 822 PD = HD Denmark49 Registry 4921 PD > HD during first 2 years Netherlands50 Registry 16 643 PD > HD within first 15 months
PD < HD after 15 months in > 70 y old diabetics No adjustment for co-morbidity, only for primary renal disease

KCE Report 124 Chronic Dialysis in Belgium 17
2.4 QUALITY OF LIFE
2.4.1 Background
As renal function declines, patients may experience symptoms that severely affect their health related quality of life (HRQOL). When the phase of end-stage renal disease is reached, the impact of the illness on functioning and HRQOL is considerable.
Especially in chronic diseases, the assessment of HRQOL is important as an outcome measure. This also applies to the evaluation of various renal replacement therapies because of the improved survival among patients with ESRD.
HRQOL can be assessed using both generic and disease specific instruments. The advantage of generic instruments is that it allows for the comparison of different diseases. The generic instruments are either preference-based instruments or health-profile measures. Disease specific instruments do not allow for comparison of different diseases, but can have a value for example in trials comparing two treatments for the same disease.
Preference-based methods assign a quantitative value to a person’s preference for a specific health status. Examples of techniques to solicit these preferences include time-trade off (TTO), standard gamble (SG) and visual analogue scale (VAS) methods.
The most widely used health-profile measure is the Medical Outcome Study Short Form 36-Item Health Survey (SF-36).51 The SF-36 instrument includes 36 items assessing eight dimensions of functioning and well-being.
Disease-specific quality of life questionnaires for ESRD have been developed, such as the Kidney Quality of Life (KDQOL).52, 53
Several studies assessed health-related quality of life in patients with ESRD and compared the quality of life of different dialysis modalities and we also retrieved a few meta-analyses of these.
2.4.2 Results
A meta-analysis compared quality of life measurements using the SF-36 instrument among HD, PD and renal transplant patients.54 Fifty-two studies were identified that included 44 HD groups (30 372 patients), 20 PD groups (3 262 patients), and 28 transplant groups (2 948 patients). SF-36 scores were significantly lower for dialysis patients compared with transplant patients except for the ‘Mental Health’ dimension for which PD patient scores were not different from transplantation patient scores. Scores of HD compared with PD were not different. Correction for age and the presence of diabetes decreased the differences between dialysis and transplantation. The authors concluded that, except for the Mental Health dimension, HRQOL was higher among renal transplant patients than among dialysis patients.
In a later meta-analysis, the same authors also assessed preference-based quality of life indicators, identifying studies from literature that reported VAS, time trade-off (TTO), SG, EuroQol 5D, and health utilities index (HUI) values in ESRD patients.55 They identified 27 articles that met preset criteria. They concluded that transplant patients tended to have a higher utility than dialysis patients (although not statistically significant for all measurement instruments), but no evidence for a statistically significant difference in utility could be found between HD and PD patients.
In the Cochrane review comparing CAPD and APD,10, 38 (see 2.3.2) one out of the three RCTs reported on quality of life measurements using the Karnofsky scores. There was no difference between CAPD and APD. Another study, using a self-developed ‘Patient Satisfaction with Treatment score’, reported that patients on APD had significantly more time for work, family, and social activities compared to CAPD patients.

18 Chronic Dialysis in Belgium KCE Reports 124
The small RCT within the NECOSAD study comparing CAPD to HD (also see 2.3.3) measured HRQOL using the EuroQol Visual Analogue Scale (VAS). Quality of life was measured at start of dialysis and at regular intervals thereafter.41 There was no significant difference in quality of life (measured as mean EuroQoL score) at 2 years between the two types of treatment, but due to the small numbers there were insufficient data to draw any conclusion.
Data comparing HRQOL of hospital HD with satellite HD or home HD are lacking, but data from a Danish focus group study shows that compared to HD, eligible patients that are on PD mention as advantages the absence of transport needs, the greater flexibility, a better social life, the possibility to work and also the possibility to take equipment on holiday (see chapter 7 for more details on this study).56
Finally, an important component of HRQOL is the functional status and dependence of patients. Recently, Tamura et al. published a large registry study including 3 702 US nursing home residents.57 Functional dependence, as measured with the Minimum Data Set-Activities of Daily Living scale (MDS-ADL) showed that among nursing home residents with ESRD, the initiation of dialysis is associated with a substantial and sustained decline in functional status. However, this study does not compare different dialysis modalities, but is important when considering whether or not to start dialysis.
In conclusion, HRQOL in ESRD patients has been extensively studied, often with the purpose to compare renal transplantation with dialysis. These studies mainly tend to confirm the consensus among health-care professionals and patients that quality of life is better after renal transplantation compared to dialysis. Complete uncertainty remains, however, about the differences in HRQOL between HD and PD patients, since observed differences are small, and since studies were based on observational data that did not allow adequate correction for confounding. Therefore, selection bias and confounding introduced by unmeasured covariates cannot be excluded.
2.5 COSTS AND COST-EFFECTIVENESS OF DIALYSIS MODALITIES Details on the methodology and a more extensive description the studies included in the economic literature review and their weaknesses can be found in the appendix to Chapter 2. The evidence tables in this appendix only include studies identified before the update search. The relevant articles identified during the update search are included in the narrative summary of findings below.
2.5.1 Costs of dialysis modalities
Comparisons of cost data from different studies are difficult because of the methodological and transparency differences between studies, such as differences in the perspective of the cost analysis or the methods used for allocating costs and overhead expenses to dialysis modalities. To draw meaningful conclusions about the relative cost differences between PD and HD, a recent systematic literature review calculated the HD:PD cost ratios found in different studies.15 These ratios are less sensitive to methodological differences between studies. The study concluded that in developed countries PD usually costs less to the health care payer than HD.15 The HD:PD cost ratios as calculated and presented by Just et al.15, are shown in Figure 1.

KCE Report 124 Chronic Dialysis in Belgium 19
Figure 1: Hospital HD:PD cost ratio in developed economies15
Source: Just, et al. 200815
If data on resource use are collected prospectively over a specific period of time, they should be analyzed on an intention to treat basis. This implies that the costs of PD may also include costs of hospital HD, namely for those patients who started on PD and switched to hospital HD in the course of time. Moreover, resource use data should be corrected for age and co-morbidities as these factors may impact on the costs of treatment. Several –though not all- studies included in the review and more recent ones applied this principle.19, 27, 58, 59
More results from the same review show hospital HD to be more expensive than home or satellite HD and APD to be more expensive than CAPD.15 A French study not included in this review found that, from a health insurers point of view, there were no important differences between the costs of the three home dialysis modalities (home HD, CAPD and APD), while hospital HD is more expensive than PD.17 It should be noted that costs in this study are actually charges. The health insurance costs of hospital HD were almost 40% higher than the costs of PD. The cost difference is mainly explained by the higher reimbursement of hospital HD sessions and the costs of medications not covered by the lump sum reimbursement for dialysis. The costs of transport for hospital HD are almost equal to the costs of nursing support and treatment of complications for PD.
Regarding the costs of different dialysis modalities over time, it is found that during the first 6 months of dialysis treatment the incremental cost of hospital HD compared to PD is larger than during the following 6 months. This is mainly explained by the higher hospitalisation costs for hospital HD in this period. During the next 6 months, the cost gap becomes smaller because the cost of hospitalisation goes down for the HD patients. In the following years of treatment the hospitalisation and medication costs for PD rise compared to the previous years while the cost for the hospital HD treatment remains relatively stable, thereby reducing the cost difference between the modalities.17, 59
With respect to different HD modalities, the cost of hospital HD is found to be highest.16, 18-21. Mowatt et al. concluded from their literature review that satellite HD seems to cost more than home HD but that results vary depending on the staffing intensity and the ability to maximize use of HD machines.

20 Chronic Dialysis in Belgium KCE Reports 124
It is thought that the new generation of home HD equipment, with lower complication rates and less need for caregiver involvement might reduce the costs of home HD.9 Lee et al19 found hospital HD to be about 18% more costly than satellite HD and about 42% more costly than home HD. Four studies concluded that both hospital HD or satellite HD are more costly than home HD.16, 20, 21, 24
Most cost studies adopt a payer or provider perspective, including only direct costs in the analyses. Indirect costs (productivity losses) were rarely included. This may introduce a bias against home dialysis modalities for which productivity losses might be less than for hospital HD.
2.5.2 Cost-effectiveness of dialysis modalities
A general comment with respect to the cost-effectiveness of dialysis modalities raised by many authors of cost-effectiveness analyses is that the comparison of dialysis modalities is hampered by selection bias in observational data. Dialysis modalities are in most cases no perfect substitutes -the choice between them being inspired mainly by the medical condition and preferences of the patient and, for transplantations, also the availability of organs. Moreover, investigating the relative cost-effectiveness of different dialysis modalities is seriously hampered by the absence of effectiveness data from RCTs. Many authors limit themselves, therefore, to a discussion of the costs on the one hand and the effects on the other hand. Some, however, have attempted to calculate an incremental cost-effectiveness ratio (ICER). These ICERs should be interpreted with caution, as they are, by nature, unstable. If patients currently treated with modality A are being moved to modality B because B is found to be more cost-effective (a lower ICER), the ICER of B risks to increase, because A might have been the most cost-effective treatment for some of these patients. Moving them to B reduces B’s effectiveness and increases B’s costs.
2.5.2.1 HD modalities comparison
Mowatt et al 9 examined the cost-effectiveness of home HD versus satellite and hospital HD, based on a review of 6 studies. They concluded that home HD has lower costs and better outcomes than hospital HD. At the start of dialysis treatment the costs of home HD are higher than the costs of hospital HD. The payback period was estimated to be around 14 months. Satellite HD generates lower costs and better outcomes than hospital HD.9
Findings with respect to the relative costs and effects of home HD compared to satellite HD are conflicting. Two primary cost-utility analyses 9, 22 found home HD to be more costly and more effective than satellite HD. Costs of transportation and productivity losses were not included in this study, which may bias the results against home HD. A cost-utility study from Finland that did include costs of transportation (though not productivity losses) found neither significant difference in health-related quality of life (HRQOL) nor total healthcare related costs differences between home HD nor satellite HD. The study compared costs and HRQOL between home HD and satellite HD patients that were originally suitable for either modality using a cross-sectional design. Higher direct medical costs of dialysis and hospital treatment in case of home HD were compensated by lower travel costs.24
Two studies compared hospital HD and home nocturnal HD.25, 26 In a cross sectional study, home nocturnal HD was found to be a dominant strategy, i.e. more effective and less costly.25 A second study compared hospital HD to a strategy of starting on hospital HD and moving to home nocturnal HD after 5 years.26 The authors concluded that starting on hospital HD and being transferred to home nocturnal HD was a dominant strategy compared to staying on hospital HD lifelong.

KCE Report 124 Chronic Dialysis in Belgium 21
2.5.2.2 PD compared to HD
Winkelmayer et al assessed the average cost-effectiveness ratios of HD, PD, and renal transplantation based on a literature review. The average cost-effectiveness ratio of hospital HD was found to be the highest, followed by home HD, PD and finally renal transplantation.14
Another literature review based on seven economic evaluations suggested that CAPD was more efficient than hospital HD because of its lower average cost per life year saved.60 A Greek economic evaluation not yet included in the literature review also reached this conclusion based on the finding that PD was as effective as hospital HD in terms of QALYs and less costly.23 This conclusion was based on lifelong extrapolations of observational data.
In a Markov model comparing HD to PD and taking into account switches between PD and HD, multiple scenarios were assessed with respect to transition probabilities, survival rates and discount rates.13 In half of these scenarios, starting on HD was a dominant (more effective and less costly) strategy compared to starting on PD and in the other cases, starting on HD was more effective but also more costly than starting on PD.13
A study that used, besides other observational designs, a case-control study design with 68 CAPD-HD pairs matched on age and co-morbidities, found that CAPD is a dominant strategy compared to HD over the first three years of treatment. The analysis was performed on an intention-to-treat basis.27 Other primary economic evaluations also concluded that starting on PD is a dominant strategy or a more cost-effective strategy (i.e. has lower average cost-effectiveness ratio) compared to starting on HD.28, 29
In conclusion, PD is generally found to be less costly and more or equally effective as hospital HD in economic models, especially in the first 6 months of treatment. A difference remains afterwards but becomes smaller as the complication rates of PD increase. Results of economic evaluations comparing home HD with hospital or satellite HD are conflicting. Comparisons between studies are difficult because much depends on the costs of resources and the resource use in the country.
2.6 CHOICE OF A SPECIFIC DIALYSIS MODALITY IN INDIVIDUAL PATIENTS
2.6.1 Medical indications and contra-indications for specific dialysis modalities
The formulation of indications and contra-indications for the different dialysis modalities is difficult and the evidence is largely restricted to expert opinion.
The choice of dialysis modality is discussed neither by the American Nephrology guidelines (KDOQI),61 nor by the European guidelines from ERA (EBPG).62
2.6.1.1 Australian guidelines
In Australia, a specific guideline on the ‘mode of dialysis at initiation’ was produced by CARI (Caring for Australians with Renal Impairment) in 2005, based on a systematic literature overview,30 but all suggestions for choice of dialysis modality are based on level III or IV evidence only. These guidelines suggest that the mode of initial dialysis should take into account the preferences of a fully informed patient, the absence of medical and surgical contra-indications (see below), and resource availability, although this part of the guideline is based on level IV evidence only. The following relative and absolute medical and surgical contraindications to PD or HD are mentioned :30
For PD:
• previous abdominal surgery with adhesions
• unrepaired hernia
• pleuro-peritoneal communication
• bowel problems (e.g. chronic constipation, diverticulitis)

22 Chronic Dialysis in Belgium KCE Reports 124
• severe respiratory insufficiency
• ileal conduit or colostomy
• abdominal obesity
• large muscle mass
For HD:
• vasculature unsuitable for AV fistula
• cardiovascular instability
• needle phobia
These guidelines also suggest that when there are no specific patient preferences, no contraindications or no resource constraints, the use of CAPD should be considered (not APD) in preference to HD, in order to better preserve residual renal function (RRF) and to allow for a graded introduction of dialysis.30 This last statement is based on level III evidence, and also supported by Greenberg et al. 2
An additional absolute contra-indication to self-care peritoneal dialysis is blindness (in the absence of a third party helping for exchanges) and an additional relative contraindication is a history of non-compliance with medical treatment and follow-up. In addition, there are social contra-indications to peritoneal dialysis, especially the inability to perform PD exchange safely oneself for other reasons than blindness. Absolute contra-indications to haemodialysis are few and usually not known before actually starting HD. These include very severe congestive heart failure (CHF) with the inability to tolerate ultra filtration, or extensive thrombosis of most or all of the major central veins, precluding the creation of a suitable vascular access.
2.6.1.2 French guidelines
In 2008 the French ‘Haute Authorité de Santé’ (HAS) released consensus based guidelines on indications and contra-indications for PD versus HD.31 These guidelines concern not only the criteria for the initial choice of dialysis modality, but also criteria for the transfer from PD to HD and vice versa, the choice of PD or HD before a planned kidney transplant and the choice of dialysis modality after graft failure. For the initial choice it is recommended that several factors are taken into account: residual renal function (RRF), body mass index (BMI), psychosocial factors that might influence the capability of the patient to strictly adhere to the treatment, the initial cause of renal disease and co-morbidities.
For new dialysis patients the French guidelines recommend PD more than HD for cirrhotic patients with ascites, for patients with kidney failure due to cholesterol embolism or with difficulties for HD vascular access. PD is not recommended in patients with morbid obesity (BMI>45 kg/m2) or with irreparable abdominal hernias.31, 32
2.6.2 Patient choices
2.6.2.1 Reported choice
It is obvious that many non-medical factors, more related to patient preferences, are important in the choice of a specific dialysis modality.
Patient choice in the absence of medical contra-indications has been described in the Dutch NECOSAD study that started in 1997 (see also 2.3.3).40, 63 All ESRD patients included in NECOSAD were new on dialysis treatment. The majority (64%) of all ESRD patients had indeed no medical contra-indications to either HD or PD. Of these patients, 52% preferred HD over PD.40 Older patients, women, and patients living alone were more likely to choose HD, and these latter findings largely correspond to the Belgian observations as reported in chapter 4. Patients who received predialysis care were two times more likely to choose PD instead of HD,63. In younger patients, employment status and the ability to work were most likely taken into account in the choice of treatment modality.

KCE Report 124 Chronic Dialysis in Belgium 23
Mehrotra et al. reported that in the USA, chronic peritoneal dialysis declined from 11% in 1996-1997 to 7% in 2002-2003 (p<0.001) despite the fact that the outcomes associated with PD improved significantly over the same period.64 This trend of a PD decline could not be explained by increasing age, co-morbidity and body size of incident ESRD patients.
An Italian multi-centre study among 9773 incident chronic dialysis patients starting RRT in 2004, found an average of 15.9% of PD as initial therapy but also large variations ranging from 0.4%to 19.3% depending on type of centre and geography. 65
2.6.2.2 Factors influencing choice
A recent systematic review analysed the factors influencing decision-making in adults with ESRD.66 This review included studies and decision support tools since 1998. Forty studies that focused on patient decisions for RRT were appraised, and also the provision of information from health care professionals was analysed. The conclusion from this systematic review was that decision making is extremely complex from a patients’ point of view, both for choice of a specific RRT modality as for the choice whether or not to start dialysis therapy. Little is known about interventions to support patients with ESRD in making informed decisions on RRT choices. The authors conclude that it would be beneficial to develop specific clinical practice guidelines and decision support tools.
In Denmark, the patient’s views regarding the choice of dialysis modality were investigated through a method of focus groups. The participants (patients and relevant others) considered that each dialysis modality has its advantages and disadvantages. Flexibility, independence and feelings of security were key factors for the choice.56 This study will be described in more detail in chapter 7.
2.7 PREDIALYSIS PATIENT EDUCATION Only a few randomized controlled trials and cohort studies have been performed on this highly relevant clinical issue.
Devins et al. randomised 297 patients with progressive CKD expected to require RRT within 6 to 18 months to an interactive 1-on-1 slide-supported educational session and booklet and supportive telephone calls or usual care.67 The intervention delayed the time to dialysis by an average of 2.8 months (p<0.032).
Manns et al. randomized 70 patients with CKD to either a two-phase patient-centred educational intervention (booklets, a video on self-care dialysis, and a small group educational session on self-care dialysis) or ongoing standard care.68 Significantly more patients in the intervention group than the standard group intended to start dialysis with a self-care modality (82.1% versus 50%, p=0.015). However, the authors only studied the tentative decision of the patient to choose one or another modality; the study did not provide information on the actual modality chosen by the patients included in this study.
The few observational studies concur to conclude that, when detailed information on the various dialysis modalities is provided early, more patients are likely to start with a self-care modality such as PD or home HD.69, 70
The European Best Practice Guidelines recommend (quote): “Patients whose GFR is <30 mL/min and declining despite therapy should be under the care of a nephrologist and be prepared for the onset of end-stage renal failure. This preparation includes choosing the most appropriate location (e.g. home or hospital) and the form of treatment (e.g. HD, CAPD, pre-emptive transplantation or conservative treatment). This choice will involve discussion between patients, their families and nephrology staff. This process may need support from specialist renal counsellors and social workers”.62

24 Chronic Dialysis in Belgium KCE Reports 124
In Belgium the system of so called ‘ambulatory care pathways’ also called ‘shared care‘ (Zorgtrajecten/Trajets de soins, see http://www.zorgtraject.be) became applicable for chronic kidney disease patients on June 1st 2009. Within those Care Pathways the management, treatment and follow-up of patients with a chronic disease are streamlined. This trajectory is based on a close cooperation between patient, general practitioner and specialist doctor. The main aim of this system is to enhance collaboration between all parties and ultimately enhance patient care. Moreover, it offers financial and other benefits to both patients and treating physicians. Since the system is new, it is too early to be evaluated at this moment.
2.8 CONCLUSION Overall, this overview of the literature is disappointing as there is limited evidence about the comparative intrinsic value of different dialysis modalities. Only one single RCT has ever tried to compare HD and PD but unfortunately that study failed to recruit sufficient patients and the small size of the included cohort and methodological problems preclude any reliable conclusion.
The evidence on different dialysis modalities is limited to results from observational studies that were not designed to adequately deal with underlying confounders. The recommendation of the Australian guidelines to initiate dialysis with PD when there are no contra-indications and when acceptable to the patient is plausible but unproven. The recent French guidelines are more reserved on this topic.
Key points
• There is no evidence for a difference in survival due to different dialysis modalities per se.
• Differences in survival were observed for different dialysis modalities but almost all studies were observational and therefore subject to several biases and especially confounding by indication.
• Some large registry data suggest a better survival for patient starting on PD in the initial period and a better survival with HD later on for patients with specific conditions but also those registries are characterised by several biases and especially confounding by indication
• There is no evidence for a difference in morbidity due to different dialysis modalities per se for similar reasons as mentioned above.
• There is no evidence for a difference in quality of life due to different dialysis modalities per se.
• According to the literature hospital HD seems to be more costly than satellite HD, home HD and PD both from the health care payer’s and provider’s point of view.
• Economic evidence about home HD and satellite HD seems to be conflicting and does not allow conclusions about their relative cost(-effectiveness). Starting on PD, however, seems more cost-effective and sometimes even dominant (more effective and less costly) compared to starting on HD.
• Medical indications and contra-indications for the choice of specific dialysis modalities are mainly based on expert opinion and consensus.
• For the majority of patients there are no absolute medical indications or contra-indication for specific dialysis modalities.
• According to the literature, patients’ choice should be mainly determined by personal preferences of a fully informed patient, if there are no specific indications or contra-indications.
• Pre-dialysis patient education and preparation is considered important by experts. The study of strategies for pre-dialysis patient information and education fell outside the scope of this report.

KCE Report 124 Chronic Dialysis in Belgium 25
3 BELGIAN SITUATION
3.1 EPIDEMIOLOGY
3.1.1 The patient population
Data on the prevalence and incidence of renal replacement therapy for Belgium are available from the two professional organisations of nephrologists in Belgium, the NBVN b (Nederlandstalig Belgische Vereniging voor Nefrologie/Dutch Speaking Nephrology Association) and the GNFB c (Groupement des Néphrologues Francophones de Belgique/French Speaking Nephrology Association). All dialysis centres, including those located in the Brussels region, are associated with one community, either the French speaking community or the Dutch speaking community. The NBVN and GNFB publish a common report on their activities. The most recent common report for the year 2008, reporting on the activities up to 2007 was not yet published on the organisations’ websites at the time of the final edition of this report, However, we received a draft version of the common report from the presidents of the organisations which allowed us to present the most up-to-date statistics about prevalence, incidence according to age, major causes of ESRD and transplantation activities. The data from the GNFB and NBVN are also reported in the annual reports of the European Renal Association (ERA)d, although small differences exist between the figures presented in the ERA Annual Reports and the common reports of the NBVN/GNFB. In this chapter the common reports of the NBVN/GNFB are the main source of information, unless specified otherwise.
3.1.1.1 Incidence and Prevalence
Table 3 presents the evolution of the number of patients on renal replacement therapy (RRT, including all dialysis modalities and renal transplantation) between 2002 and 2007.
Table 3: Number of patients on RRT in Belgium (dialysis and renal transplant patients)
2002 2003 2004 2005 2006 2007 Prevalence 9027 9438 9967 10422 10948 11396 Prevalence pmp* 875.6 911.4 958.7 997.7 1041.5 1076.7 Incidence 1783 1751 1909 1885 1999 1957 Incidence pmp* 172.9 169.1 183.6 180.5 190.2 184.9
*pmp: per million of the populatione Source: Common report NBVN-GNFB, 2008.
In five years time, the number of prevalent patients on RRT has increased with 26%, going from 9 000 patients in 2002 to almost 11 400 patients in 2007. The population on RRT has been growing annually at a rate of about 5% between 2002 and 2007.
The number of new patients grew at an annual rate of about 2% between 2002 and 2007. This can partly be explained by the relatively large proportion of older patients and the aging population in Belgium. The age distribution of prevalent patients is shown in Table 4.
b http://www.nbvn.be c http://www.gnfb.be d Available from http://www.era-edta-reg.org/index.jsp?p=annrep, last accessed November 10, 2009.

26 Chronic Dialysis in Belgium KCE Reports 124
Table 4: Number and percentage of prevalent RRT patients according to age (both dialysis and renal transplant patients)
2002 2003 2004 2005 2006 2007 Age N % N % N % N % N % N % 0-24 149 2 144 2 159 2 159 2 153 1 159 1 25-34 455 5 469 5 459 5 459 4 464 4 445 4 35-44 916 10 909 10 942 9 942 9 965 9 978 9 45-54 1597 18 1624 17 1669 17 1720 17 1727 16 1759 15 55-64 1909 21 1971 21 2080 21 2218 21 2361 22 2460 22 65-74 2214 25 2319 25 2436 24 2465 24 2506 23 2583 23 75-84 1564 17 1756 19 1944 20 2125 20 2348 21 2495 22 ≥85 223 2 246 3 278 3 334 3 424 4 517 5
Total 9027 9438 9967 10422 10948 11396 Source: Common report of the NBVN and GNFB, 2008.
The largest age group is the group of patients between 65 and 74 years of age, although the older age group (75-84 years of age) seems to gain in importance in the last two years. In 2002 about 19% of the patients on ESRD treatment were 75 years of age or above. In 2007, already 27% of the ESRD patients were older than 75 years of age (see also Figure 3). This is more than could be expected by ageing of the population alone and seems to indicate a paradigm shift in therapeutic choices by nephrologists.
Compared to other countries, the mean age of the incident and prevalent patients on renal replacement therapy is high (Figure 2 and Table 5). The ERA-EDTA annual report does not contain data for the entire Belgian territory. Data are presented for the Dutch-speaking part of Belgium and the French-speaking part separately, based on the data from the NBVN and the GNFB respectively.
Figure 2: Mean age of incident and prevalent ESRD patients on renal replacement therapy in 6 countries(dialysis and renal transplant patients)
* patients below 20 years of age were not reported. Source: ERA-EDTA Annual Report 2007
0
10
20
30
40
50
60
70
80
Incident patients Prevalent patients
Mean
age
(years)
Belgium, Dutch‐speaking*
Belgium, French‐speaking*
Austria
Sweden
The Netherlands
UK*
Finland

KCE Report 124 Chronic Dialysis in Belgium 27
Table 5: Mean and median age of incident and prevalent ESRD patients on renal replacement therapy in 4 countries (2007) (dialysis and renal transplant patients)
Incident patients Prevalent patients Mean age
(years) Median age
(years) Mean age
(years) Median age
(years) Belgium, Dutch-speaking*
69.0 72.8 63.8 65.6
Belgium, French-speaking*
68.5 71.6 62.4 63.5
Austria 64.7 67.6 58.7 60.1 The Netherlands 62.8 66.0 57.2 58.9 Finland 60.0 62.2 56.4 58.1 Sweden 64.3 67.6 58.6 60.3 UK* 61.6 64.0 57.2 57.9
* patients below 20 years of age were not reported. Source: ERA-EDTA Annual Report 2007
The proportion of patients younger than 35 years is stable over time, while the group of people younger than 25 years is small (less than 2% of the population).
Figure 3: Evolution of the prevalent ESRD population by age from 2002 to 2007 (dialysis and renal transplant patients)
Source: Common report of the GNFB and NBVN, 2008
The age and gender distribution of new, i.e. incident, patients receiving chronic renal replacement therapy registered in 2007 is shown in Table 6. e In 2007, 1 973 new patients with chronic renal failure were reported: 1 219 men and 754 women. About 60% of the population were thus males. More than one third of the new patients treated for the disease is 75 years old or older and among those new patients.
e These data were derived from the ERA Annual Report 2007, as they were not presented in the draft
common report of the GNFB/NBVN.
0%
10%
20%
30%
40%
50%
60%
70%
80%
90%
100%
2002 2003 2004 2005 2006 2007
>85
75‐84
65‐74
55‐64
45‐54
35‐44
25‐34
0‐24
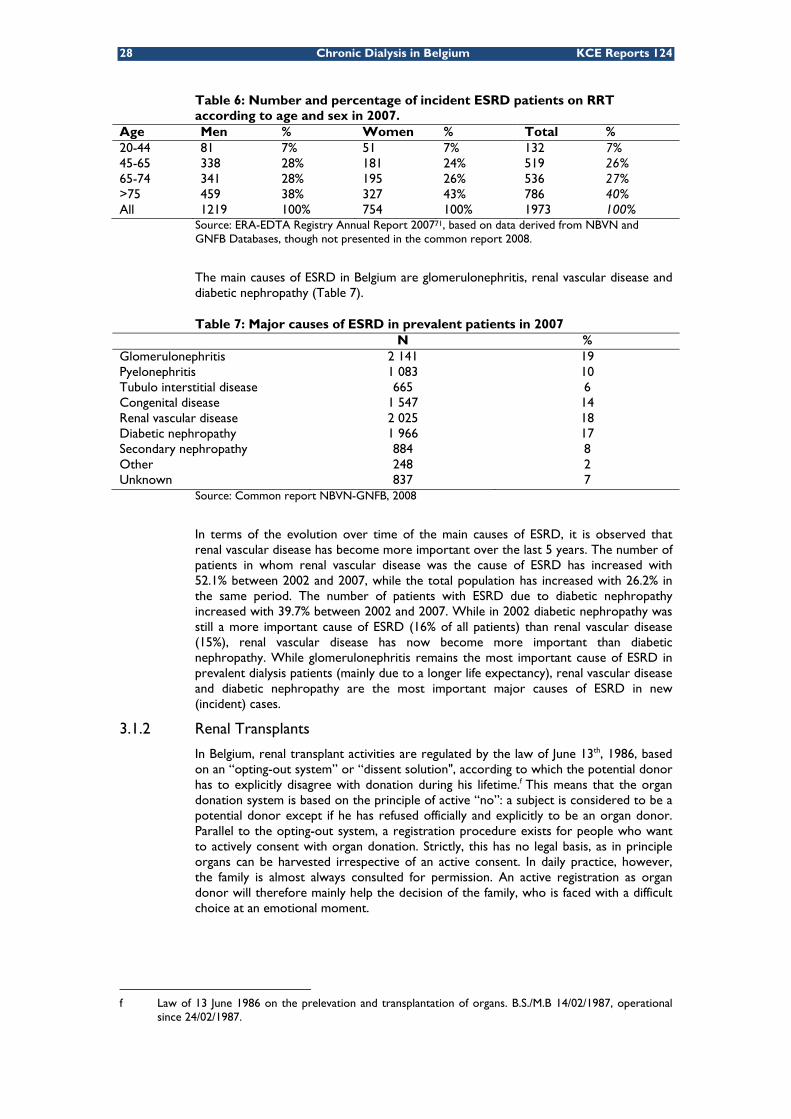
28 Chronic Dialysis in Belgium KCE Reports 124
Table 6: Number and percentage of incident ESRD patients on RRT according to age and sex in 2007.
Age Men % Women % Total % 20-44 81 7% 51 7% 132 7% 45-65 338 28% 181 24% 519 26% 65-74 341 28% 195 26% 536 27% >75 459 38% 327 43% 786 40% All 1219 100% 754 100% 1973 100%
Source: ERA-EDTA Registry Annual Report 200771, based on data derived from NBVN and GNFB Databases, though not presented in the common report 2008.
The main causes of ESRD in Belgium are glomerulonephritis, renal vascular disease and diabetic nephropathy (Table 7).
Table 7: Major causes of ESRD in prevalent patients in 2007 N % Glomerulonephritis 2 141 19 Pyelonephritis 1 083 10 Tubulo interstitial disease 665 6 Congenital disease 1 547 14 Renal vascular disease 2 025 18 Diabetic nephropathy 1 966 17 Secondary nephropathy 884 8 Other 248 2 Unknown 837 7
Source: Common report NBVN-GNFB, 2008
In terms of the evolution over time of the main causes of ESRD, it is observed that renal vascular disease has become more important over the last 5 years. The number of patients in whom renal vascular disease was the cause of ESRD has increased with 52.1% between 2002 and 2007, while the total population has increased with 26.2% in the same period. The number of patients with ESRD due to diabetic nephropathy increased with 39.7% between 2002 and 2007. While in 2002 diabetic nephropathy was still a more important cause of ESRD (16% of all patients) than renal vascular disease (15%), renal vascular disease has now become more important than diabetic nephropathy. While glomerulonephritis remains the most important cause of ESRD in prevalent dialysis patients (mainly due to a longer life expectancy), renal vascular disease and diabetic nephropathy are the most important major causes of ESRD in new (incident) cases.
3.1.2 Renal Transplants
In Belgium, renal transplant activities are regulated by the law of June 13th, 1986, based on an “opting-out system” or “dissent solution", according to which the potential donor has to explicitly disagree with donation during his lifetime.f This means that the organ donation system is based on the principle of active “no”: a subject is considered to be a potential donor except if he has refused officially and explicitly to be an organ donor. Parallel to the opting-out system, a registration procedure exists for people who want to actively consent with organ donation. Strictly, this has no legal basis, as in principle organs can be harvested irrespective of an active consent. In daily practice, however, the family is almost always consulted for permission. An active registration as organ donor will therefore mainly help the decision of the family, who is faced with a difficult choice at an emotional moment.
f Law of 13 June 1986 on the prelevation and transplantation of organs. B.S./M.B 14/02/1987, operational
since 24/02/1987.

KCE Report 124 Chronic Dialysis in Belgium 29
The eight Belgian renal transplant centresg are collaborating with Eurotransplant. The Eurotransplant International Foundation is responsible for the mediation and allocation of organ donation procedures in Austria, Belgium, Germany, Luxemburg, the Netherlands, Slovenia and Croatia. Eurotransplant has an allocation system of kidneys based on 5 factors: HLA matching, frequency of HLA type, waiting time, geographical distance between place of kidney removal and transplantation and balance between the number of kidneys offered and received at the national level. Organs can also be allocated on the basis of medical urgency.
Given that renal transplantation is generally believed to offer a better quality of life to ESRD patients, the possibility of renal transplantation should at least be considered in all ESRD patients. The number of patients on the transplant waiting list for a kidney only or combined kidney-liver, kidney-heart, kidney-lung or kidney-pancreas transplantation in 4 countries is presented in Table 8. The proportion of dialysis patients on the renal transplant waiting list is comparable to that in the Netherlands, but lower than in Austria.
Table 8: Active kidney transplant waiting list as per December 31st, 2007 Type of transplant Austria Belgium Germany Netherlands kidney 820 796 7 916 916 kidney+heart 3 3 18 0 kidney+liver 4 9 50 1 kidney+lung 0 0 3 0 kidney+pancreas 25 32 220 20 Total (% of dialysis patients)
852 (18.97%)
840 (12.54%)*
8 207 937 (12.78%)
Source for the number of patients on the transplant waiting list: Annual Report of the Eurotransplant International Foundation 2007 (http://www.eurotransplant.nl/files/annual_report/AR2007_def.pdf). Percentages of dialysis patients on the transplant waiting list calculated based on the prevalence figures of RRT presented in the ERA-EDTA Registry Annual Report 2007 for Austria and the Netherlands, no data were available for Germany in this registry. * based on the total prevalence figures of RRT and renal transplantation presented in the NBVN-GNFB Common report, 2008.
g AN Universitair Ziekenhuis Antwerpen, BJ Academisch Ziekenhuis der Vrije Universiteit, BR ULB, Hôpital Erasme, Bruxelles GE Universitair Ziekenhuis, Gent LA Cliniques Universitaires St. Luc, Bruxelles LE Kinderdialyse Universitair Ziekenhuis Gasthuisberg, Leuven R. LG Centre Hospitalier Universitaire, Liège LM Universitair Ziekenhuis Gasthuisberg, Leuven

30 Chronic Dialysis in Belgium KCE Reports 124
The number of transplantations in 2007 in the same countries is presented in Table 9.
Table 9: Kidney transplants from deceased donor (2007) Type of transplant Austria Belgium Germany Netherlands kidney only 306 410 2157 433 kidney en bloc 1 8 10 4 kidney + pancreas 20 16 116 25 kidney + heart 1 4 8 0 kidney en bloc + whole liver
0 0 1 0
Kidney + split liver 0 0 4 0 Kidney + whole liver 8 11 42 2 Kindney + pancreas + whole liver
0 0 1 0
Kidney + lung 0 0 1 0 Total 336 449 2340 464 Source: Annual Report of the Eurotransplant International Foundation 2007 (http://www.eurotransplant.nl/files/annual_report/AR2007_def.pdf).72
The kidney, like lung and partial liver is an organ that can also be donated by living donors Almost a third of all kidney organs registered in Eurotransplant come from living donors, possessing bilateral renal function and not having other systemic diseases. Over 2/3 of kidney allografts, however, come from deceased donors. According to the Eurotransplant statistics for the year 2008, 413 “kidney only”-transplants in Belgium were from deceased donors and 45 from living donors (33 from related and 12 from non-related donors). This means that about 10% of the kidneys transplanted in Belgium are from living donors. The option of living-related and particularly living-unrelated donation is used infrequently in Belgium. Other countries, especially the Netherlands, use this option more often (Table 10).
Table 10: Deceased versus living donor kidney transplantation (kidney only) in a selection of countries associated with Eurotransplant (2008)
Deceased donor
Living donor
% living donor Total
Belgium 413 45 10% 458
Austria 263 57 18% 320
Germany 2005 565 22% 2570
The Netherlands 336 411 55% 747
Source: Annual Report of the Eurotransplant International Foundation.73
A persistent issue relating to organ transplantation is the scarcity of organ donors relative to the number of potential recipients on organ transplantation waiting lists. The average waiting time for renal transplant candidates is 2 to 2.5 years.
Compared to Germany and the Netherlands, patients have to wait less long for a kidney transplant in Belgium (Figure 4). Also the proportion of patients transplanted pre-emptively is relatively large in Belgium, compared to other countries (almost 3.6% compared to 0.23% in Germany and 1.37 in the Netherlands). According to the experts, both differences may partly explain the lower use of living donors in Belgium.

KCE Report 124 Chronic Dialysis in Belgium 31
Figure 4: Time on the transplant waiting list for kidney (only) transplantation (2007)
Source: Annual Report of the Eurotransplant International Foundation 2007 (http://www.eurotransplant.nl/files/annual_report/AR2007_def.pdf).72
3.1.3 Use of different dialysis modalities for ESRD in Belgium
The total number of patients on all dialysis modalities has increased between 2002 and 2007 (Figure 5). In 2007 approximately 6 700 patients were on chronic dialysis therapy in Belgium. The annual growth rates show different patterns between dialysis modalities. The number of peritoneal dialysis patients has grown less rapidly than the number of patients on hospital HD or satellite HD. In 2007 even a small decrease in the number of prevalent patients on PD was observed as compared to 2006 (from 671 to 654).
Figure 5: Evolution of the numbers of patients in different dialysis modalities between 2002 and 2007
Source: Figure based on data from the common report NBVN-GNFB, 2008
In relative terms, the percentage of patients on alternative dialysis treatments (PD and satellite HD) has grown from 28% in 2002 to 34% in 2007 (Figure 6). The growth in the proportion of satellite HD patients has had the largest contribution to this increase. The vast majority of chronic dialysis patients is treated with hospital HD (almost 66%). Satellite HD is used by approximately 24% of the patients in 2007 and PD by approximately 10% of the dialysis patients.
0%
10%
20%
30%
40%
50%
60%
70%
Waiting time (months)
Austria
Belgium
Germany
Netherlands
0
500
1000
1500
2000
2500
3000
3500
4000
4500
5000
2002 2003 2004 2005 2006 2007
Num
ber o
f patients
Hospital HD
Satellite HD
Peritoneal dialysis

32 Chronic Dialysis in Belgium KCE Reports 124
Figure 6: Evolution of the percentage of prevalent dialysis patients treated with different modalities of dialysis treatment in Belgium
Source: Figure based on data from the common report NBVN-GNFB, 2008
The evolution of the age distribution of prevalent patients in PD and satellite HD between 2002 and 2007 is presented in Figure 7. The figures show several observations:
• The number of prevalent patients on RRT has been increasing throughout these six years. An uneven growth has been observed between treatment modalities, with satellite HD showing the most important increase in the number of patients (+69.5%).
• Older patients are more often treated by means of hospital HD than younger patients. Eight in 10 patients younger than 55 years were treated by means of satellite HD, home HD, PD or transplantation in 2007.
• Over the years, the proportion of older patients on any of the dialysis modalities is increasing, although in 2007 the proportion of patients ≥75 years treated with PD declined slightly. In 2007 the proportion of all dialysis patients (excluding transplanted patients) older than 75 years of age was 41%.
• Besides the decline in the number of elderly patients on PD also the number of patients younger than 55 years of age on PD declined between 2005 and 2007, suggesting that the decline in the relative use of PD cannot only be attributed to an age-effect.
0%
10%
20%
30%
40%
50%
60%
70%
80%
90%
100%
2002 2003 2004 2005 2006 2007
PD
Satellite HD
Hospital HD
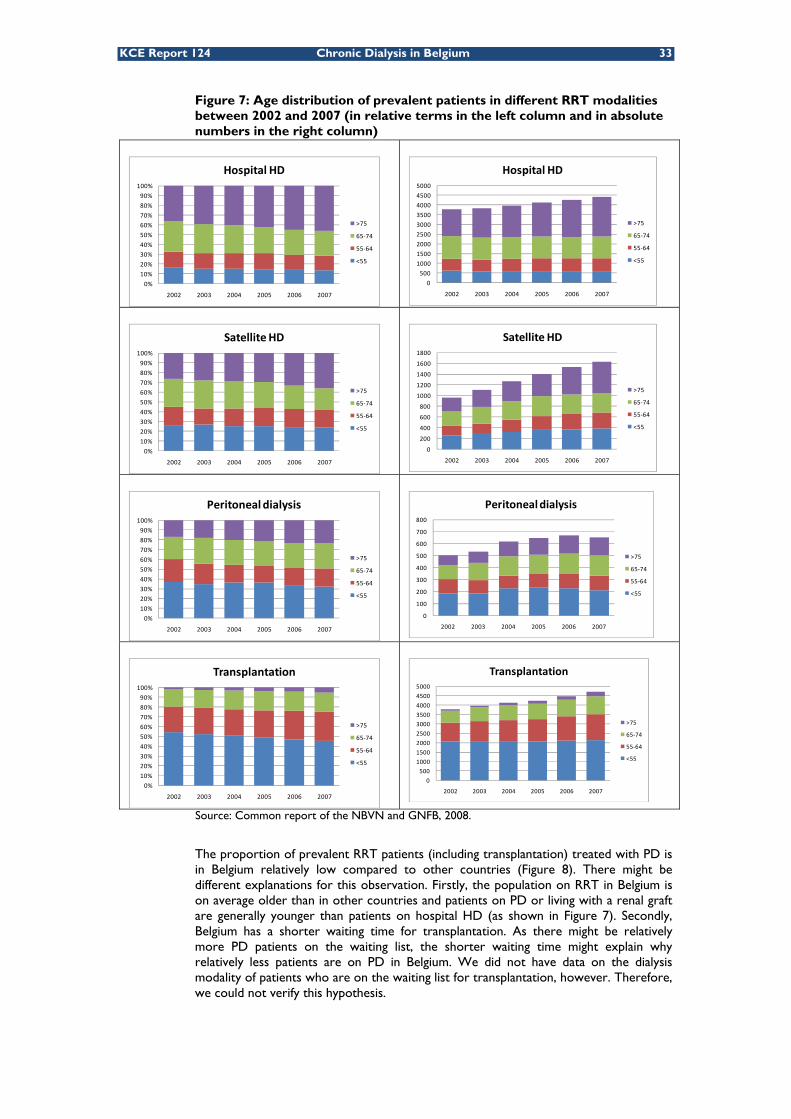
KCE Report 124 Chronic Dialysis in Belgium 33
Figure 7: Age distribution of prevalent patients in different RRT modalities between 2002 and 2007 (in relative terms in the left column and in absolute numbers in the right column)
Source: Common report of the NBVN and GNFB, 2008.
The proportion of prevalent RRT patients (including transplantation) treated with PD is in Belgium relatively low compared to other countries (Figure 8). There might be different explanations for this observation. Firstly, the population on RRT in Belgium is on average older than in other countries and patients on PD or living with a renal graft are generally younger than patients on hospital HD (as shown in Figure 7). Secondly, Belgium has a shorter waiting time for transplantation. As there might be relatively more PD patients on the waiting list, the shorter waiting time might explain why relatively less patients are on PD in Belgium. We did not have data on the dialysis modality of patients who are on the waiting list for transplantation, however. Therefore, we could not verify this hypothesis.
0%
10%
20%
30%
40%
50%
60%
70%
80%
90%
100%
2002 2003 2004 2005 2006 2007
Hospital HD
>75
65‐74
55‐64
<55
0
500
1000
1500
2000
2500
3000
3500
4000
4500
5000
2002 2003 2004 2005 2006 2007
Hospital HD
>75
65‐74
55‐64
<55
0%
10%
20%
30%
40%
50%
60%
70%
80%
90%
100%
2002 2003 2004 2005 2006 2007
Satellite HD
>75
65‐74
55‐64
<55
0
200
400
600
800
1000
1200
1400
1600
1800
2002 2003 2004 2005 2006 2007
Satellite HD
>75
65‐74
55‐64
<55
0%
10%
20%
30%
40%
50%
60%
70%
80%
90%
100%
2002 2003 2004 2005 2006 2007
Peritoneal dialysis
>75
65‐74
55‐64
<55
0
100
200
300
400
500
600
700
800
2002 2003 2004 2005 2006 2007
Peritoneal dialysis
>75
65‐74
55‐64
<55
0%
10%
20%
30%
40%
50%
60%
70%
80%
90%
100%
2002 2003 2004 2005 2006 2007
Transplantation
>75
65‐74
55‐64
<55
0
500
1000
1500
2000
2500
3000
3500
4000
4500
5000
2002 2003 2004 2005 2006 2007
Transplantation
>75
65‐74
55‐64
<55

34 Chronic Dialysis in Belgium KCE Reports 124
Figure 8: Proportion of prevalent PD patients in total prevalent patient population on RRT in 5 countries*
* Data from Belgium and the UK do not include dialysis modality use of patients younger than 20 years of age. Source: ERA-EDTA Registry Annual Report 200771
Key points
• In Belgium, approximately 11 000 patients are on renal replacement therapy (dialysis or transplantation) at any given moment. The population with ESRD has been growing annually at a rate of about 5% during the last five years.
• According to the Belgian ESRD registries approximately 6 700 patients were on chronic dialysis therapy in 2007. The vast majority of chronic dialysis patients is treated with hospital HD (almost 66%). Satellite HD was used by 24% and PD by 10% of the dialysis patients.
• The proportion of older people treated for ESRD grows. While in 2002 about 19% of the patients on renal replacement therapy were older than 75 years of age this proportion was 27% in 2007. This includes patients living with a renal transplant. In 2007 the proportion of dialysis patients older than 75 years of age was 41% according to the registries of the two Belgian professional organisations NBVN and GNFB.
• The main causes of ESRD in prevalent RRT patients in Belgium are glomerulonephritis, renal vascular disease and diabetic nephropathy. The relative importance of renal vascular disease as a cause of ESRD has increased during the last five years because it became a major cause of ESRD in incident patients.
• Belgium has an opting-out system for organ donation. Nevertheless the need for kidneys for transplantation still exceeds the availability.
• In Belgium patients wait less long for a kidney transplantation than in the Netherlands and Germany.
• Less than 10% of the kidneys transplanted in Belgium are from living donors. Some other countries use this option more often.
• Over a period of 6 years (2002-2007), the proportion of patients on alternative dialysis therapies has increased from 28 to 34%. The growth can be largely attributed to the increase in the use of satellite HD.
0%
2%
4%
6%
8%
10%
12%

KCE Report 124 Chronic Dialysis in Belgium 35
• The proportion of older patients on renal replacement therapy has been increasing between 2002 and 2007, though unequally across treatment modalities. The proportion of prevalent elderly patients (≥75 years of age) on PD has remained stable between 2005 and 2007, while the proportion of prevalent elderly patients on hospital HD has increased rapidly.
• The proportion of ESRD patients on PD treatment is lower in Belgium than in other countries. This might be explained by the higher average age of patients on renal replacement therapy in Belgium and the shorter waiting time for transplantation compared to other countries.
3.2 CLINICAL CHARACTERISTICS OF DIALYSIS PATIENTS As explained in chapter 2, the clinical characteristics of patients are one of the factors that determine the appropriateness of giving the choice to patients about their dialysis treatment modality. Therefore, it is important to have an idea of the Belgian patient characteristics, to put the findings in this and the following two chapters on health care expenditures and provider costs into the right perspective. The professional organizations in Flanders and Wallonia (NBVN and GNFB) register medical patient characteristics to some extent, but not exactly in the same way. For example, the GNFB database contains data on the Charlson co-morbidity score of incident patients, while the NVBN database does not contain these data. The data do therefore not allow drawing firm conclusions about the patient profiles in the whole of Belgium.
In 2009-2010, the NBVN and GNFB will perform a large survey on the dependency of dialysis patients. The questionnaire contains questions about, for instance, the patients’ mobility, living situation and professional activities. The results are expected to be presented at the end of 2010.
3.3 PLANNING, ORGANISATION AND REGULATION
3.3.1 Legal aspects
In Belgium, the programming of dialysis centres is regulated by the Royal Decree of 27 November 1996.h
In the regulation, a centre for the treatment of chronic renal failure is defined as a medico-technical service, functionally and operationally embedded in a hospital, where a chronic renal failure patient can receive the most appropriate renal replacement therapy, such as
• Chronic haemodialysis, either the classic haemodialysis in a hospital setting (hospital haemodialysis) or collective haemodialysis in an appropriate environment (satellite haemodialysis) or home haemodialysis
• Chronic peritoneal dialysis (PD) at home
• Renal transplantation
3.3.1.1 Hospital haemodialysis units
With regard to the haemodialysis unit in a hospital setting, the law stipulates the requirements the hospital service must fulfil. The dialysis unit must be located in an acute hospital with at least a laboratory for clinical biology with a continuous surveillance, a department of medical imaging and an approved emergency service. The dialysis centre must treat at least 40 ESRD patients each year with one of the four treatment possibilities: hospital HD, satellite HD, PD or renal transplantation. Renal transplant patients being followed-up in the hospital after transplantation are counted as one patient. Also patients treated in satellite centres are included in this patient count.
h Royal Decree of 27 November 1996 on the enactment of the norms with which centres for the
treatment of chronic renal failure should comply to be approved as medical-technical service in the sense of art 44 of the Law on Hospitals, coordinated on 7 August 1987; B.S./M.B. 18/02/1997.

36 Chronic Dialysis in Belgium KCE Reports 124
For each patient, a medical and a medical-technical patient file is required. The data to be included in the medical file include: actual duration of dialysis, blood flow, dialysis efficiency, biological and technical examinations, drug treatment, etc. Data to be included in the medical-technical file relate to the methods used for blood purification, re-use of the artificial kidney, sterilisation methods used for materials and equipment and registration of the results of the control mechanisms for the composition of the water and dialyzer.
The activities are under supervision of a qualified nephrologist or specialist in internal medicine who works full-time (at least 8/10 of the normal professional activity) in the hospital. Besides the supervising specialist, an additional specialist in internal medicine has to be available for the first 4000 dialysis sessions performed in the centre. The hospital must employ an additional nephrologist for each additional 4000 dialysis sessions performed in the centre. At least one specialist (nephrologist or specialist in internal medicine) must be present in the unit for the full duration of the dialysis sessions.
The number of nurses and renal technicians required is related to the number of dialysis sessions performed yearly by the unit. The number of nurses and renal technicians is fixed at one full-time equivalent per 500 dialysis sessions (or one full time equivalent for 3.2 patients). The law stipulates that at least 50% of this staff should be a qualified dialysis nurse. However, such a qualification does not officially exist in Belgium. The ORPADT has some form of recognition for dialysis nurses, but this has strictly speaking no legal value. This requirement hence remains unfulfilled in practice. Consequently, the only real requirement with respect to nursing and technical staff is that at least 50% is a qualified nurse.
Each dialysis centre must have a formal collaboration agreement with at least one renal transplant centre.
The wards, rooms and space of the dialysis centre must be well-adapted to the number of patients and to the dialysis material used. The dialysis unit must have the possibility to isolate patients with Hepatitis B Virus, Hepatitis C Virus and Human Immune deficiency Virus (HIV). Additionally, the dialysis centre must organise a permanent “on call” service for urgent treatment at every time of day and night. Finally, the centre must commit itself to a programme for the evaluation of medical practice, established to ensure that each and every patient receives the most appropriate form of renal replacement therapy. Moreover, centres are obliged to develop initiatives to allow for internal audit of their activities.
3.3.1.2 Home haemodialysis and peritoneal dialysis
The specialist responsible for the dialysis centre decides, on a case by case basis and by mutual agreement with the patient, which patients are eligible for home dialysis (home HD, PD).
The supervision of the dialysis is done by the physicians of the dialysis centre. They are supported in their activities by a team of qualified personnel (nurse, technician, logistic personnel). According to law, at least one of them should be a nurse with a special qualification in dialysis but, as explained before, as this qualification does not exist in Belgium, the requirement cannot be applied in practice.
Prior to the start of the home HD and PD, the dialysis centre must educate the patient and if necessary a second person who supports the patient in order to ensure that the patient can correctly perform his dialysis. In case of calls from a patient dialysed at home by HD or PD –be it for an emergency or not- the responsible nephrologist of the centre or a delegated doctor, needs to be immediately available for advice. If necessary, a qualified person is sent to the patients’ home. No formal legal requirements for the number of staff members are imposed.
The dialysis centre must provide the dialysis equipment (machines), materials and some dialysis-related medication. The centre also performs the necessary in-house adaptation works such as electricity, water supply, telephone connections for home dialysis. Moreover, the dialysis centre installs and maintains the equipment.

KCE Report 124 Chronic Dialysis in Belgium 37
As for hospital HD patients, the centre keeps a medical-technical patient file for every home dialysis patient and supervises the dialysis journal completed by the patients.
3.3.1.3 Satellite haemodialysis
The specialist responsible for the dialysis centre decides, on a case by case basis and by mutual agreement with the patient, which patients are eligible for satellite HD.
The dialysis centre should educate the patient in order to enable him to correctly perform his dialysis treatment. The physicians of the dialysis centre are responsible for the supervision of the satellite dialysis. They cannot delegate this responsibility to another physician and are supported by a team of nursing, technical and logistic personnel. At least one nurse should have a special qualification or experience in dialysis techniques.
In case of a call from the satellite unit, the hospital dialysis centre should always be available to give instructions, send a qualified person and, in case of an emergency, take the patient back for treatment at the hospital unit. The hospital dialysis unit chooses the appropriate premises for the organisation of the collective satellite HD unit and is responsible for the operation of the services. It also provides the necessary consumables, medicines and materials.
A satellite HD unit should never be located nearer to another hospital HD unit than the one it is associated with. A satellite unit can be embedded in the acute hospital premises or be established outside the acute hospital.
3.3.2 Dialysis facilities in Belgium
Belgium counts 53 ESRD treatment centres. Of these, 49 have one or more satellite HD units located inside or outside the main hospital. Currently, five centres have a paediatric dialysis programme and a sixth is being developed.i
3.3.3 Real-world relevance of norms and rules for hospital and satellite HD units
According to some of the experts consulted in the context of this study, the norms established for satellite HD units are outdated. They have the strong impression that satellite centres are increasingly treating “high-care” patients (i.e. patients that would normally get their HD treatment in hospital). Strictly speaking this violates the spirit of the law, being that patients treated in satellite centres should be able to take a certain responsibility for their own treatment and do not require the continuous presence of a nephrologist. They should be “low-cost” dialysis patients, which justifies the lower reimbursement of patients treated in these centres compared to patients treated in a hospital HD centre.
The experts presume, however, that treating high-care patients in a satellite dialysis centre does not jeopardize the safety of the treatment for patients, as more personnel will be engaged in the satellite centres if more high-care patients are being treated there and the nephrologist will visit the centre whenever needed. The reimbursement of the dialysis sessions provided in the satellite centres, which were intended to be “low-cost setting”, then becomes insufficient to cover the costs of the treatment of the “high-cost patients”.
If the difference between the profiles of patients treated in satellite HD centres and patients treated in hospital HD centres is indeed decreasing, we should be able to observe this in the data from the NBVN/GNFB and the IMA/AIM. Figure 7 showed that the proportion of patients older than 75 years of age has been increasing in the last 5 years. Over 30% of the patients on satellite HD were over 75 years of age in 2008. Mortality, however, is still significantly different between the two groups (see chapter 4), with patients on satellite HD treatment having a better life expectancy than patients on hospital HD. Unfortunately, no data have been collected over time about the profile of patients in both settings in terms of dependency, preferences and co-morbidities.
i U.Z. Leuven, U.Z. Antwerpen, U.Z. Gent, C.H.U. Liège, Hôpital Universitaire des Enfants Reine Fabiola
(HUDERF). Paediatric programme is currently being developed at the Cliniques Universitaires Saint Luc.

38 Chronic Dialysis in Belgium KCE Reports 124
Consequently, firm conclusions about the evolution of patient profiles and the potential reduction of the difference between hospital HD centres and satellite HD centres cannot be drawn.
Key points
In 2007, there were 52 main dialysis centres in Belgium, 49 of which also have a satellite dialysis unit located inside or outside the main hospital building.
By law:
• A centre for the treatment of chronic renal failure is considered as a medico-technical service, functionally and operationally embedded in a hospital.
• A dialysis centre must treat at least 40 ESRD patients per year with any type of dialysis or renal transplantation.
• A nephrologist or specialist in internal medicine working full-time in the hospital must supervise the activities of the dialysis centre.
• Besides the supervising physician, a nephrologist or specialist in internal medicine must be available for the first 4000 hospital HD sessions and an additional one for every additional 4000 hospital HD sessions performed in the centre.
• One full-time equivalent nurse or technician is required per 500 hospital HD sessions, with at least half of this staff being qualified dialysis nurses. As no officially recognized qualification in dialysis nursing exists in Belgium, the only practical implication of this requirement is that at least 50% of the nursing and technical staff should be a qualified nurse.
• The supervision of home HD and PD is done by the physicians of the dialysis centre, supported by a team of qualified nurses, technicians and logistic personnel. The dialysis centre must provide the dialysis equipment, materials and medication, perform the necessary in-house adaptation works and install and maintains the equipment.
• In case of satellite HD, the dialysis centre must educate the patient to enable the patient to correctly perform his/her dialysis treatment. The physicians of the dialysis centre are responsible for the supervision of the satellite dialysis.
Some experts believe the norms and rules imposed on satellite HD and hospital HD centres are no longer relevant, as the profiles of patients treated in hospital centres and patients in satellite centres are becoming increasingly similar. There are, however, no data available to support this perception.

KCE Report 124 Chronic Dialysis in Belgium 39
3.4 FINANCING OF CHRONIC RENAL FAILURE MANAGEMENT
3.4.1 General Principles
The costs related to the treatment of chronic renal failure are mainly supported by the public health insurance. The costs for transport of the patients to the dialysis unit are also covered (mainly or partly) by the NIHDI.
The financing of dialysis depends on the treatment modality. Two financing mechanisms co-exist:
• the system of lump sums for hospital HD, Home HD and PD: the dialysis centre receives a lump sum per dialysis session (in case of HD or incomplete PD weeks) or per dialysis week (in case of PD) to cover the costs of material, equipment, salaries of nurses and technical personnel;
• the system of “fees for services” on top of the lump sum for hospital HD: the nephrologists receives a honorarium per dialysis session for his activities during the session. Part of this honorarium can flow back to the hospital, according to internal policy rules.
Financing mechanisms for dialysis have been defined for HD first in 1995 and have been modified several times since then. The current financing mechanisms for dialysis activities are stipulated in the Royal Decree of June 23rd, 2003 and came into effect on July 1st 2003.j A brief overview of the changes in the financing mechanisms between 1995 and 2003 is given in the paragraph 3.4.2.
3.4.2 Historical evolution of dialysis financing mechanisms
3.4.2.1 Hospital HD
Until the 1st of January 1996, the lump sum for hospital HD was strongly related to the hospital’s per diem price. Hospitals received a lump sum of 75% of their per diem price per dialysis session, with a minimum of BEF4 500 (~€111.55). The lump sum was increased with 15% if 25% or more of the dialysis patients were treated by means of dialysis modalities outside the hospital (CAPD, satellite HD or home HD).
In January 1996, the lump sum for hospital HD was re-defined. The strictly linear relationship between the per diem price and the baseline lump sum was abandoned, but a categorical relationship was maintained (see Table 11 for the lump sum as a % of the per diem price categories). Dialysis centres’ still received a ‘bonus’ of 15% if more than 25% of the ESRD patients were treated with alternative dialysis modalities. Due to the strong relationship between the lump sum and the hospital per diem price, also the lump sum ‘bonus’ was variable across hospitals. The minimum lump sum was fixed at BEF4 500.
Table 11: Lump sums for hospital HD between 1/1/1996 and 1/11/1996 Per diem price Lump sum for hospital HD as a % of
the hospital’s per diem price < BEF7000 (~€173.52) 75% >= BEF7000 and < BEF8000 (~€198.31) 73% >= BEF8000 and < BEF9000 (~€223.10) 71% >= BEF9000 69%
j Royal Decree of 23 June 2003 for the execution of article 71bis, §§1 and 2 of the law concerning the
compulsory insurance of health care and reimbursements, coordinated on 14 July 1994. B.S./M.B. 1/07/2003.

40 Chronic Dialysis in Belgium KCE Reports 124
In the Royal Decree of 28 October 1996 (B.S./M.B. of November 9th, 1996), the relationship between the per diem price and the lump sum for hospital HD was reduced further. A baseline lump sum for hospital HD was fixed at BEF2 000 (~€49.58) for all dialysis centres. On top of this baseline lump sum, dialysis centres also received 40% of the per diem price per hospital HD dialysis session. A lump sum bonus of BEF500 (~12.39) was allocated if at least 15% but less than 25% of the ESRD patients followed an alternative dialysis therapy. The lump sum bonus for treating more than 25% of the ESRD patients with alternative dialysis types was fixed at BEF1,000 (~€24.79) per session. The minimum lump sum was kept at BEF4 500 (~€111.55).
In July 2001, the baseline lump sum of BEF2 000 was reduced to BEF1 500 (~€37.18) per hospital HD session, still 40% of the hospital’s per diem price was added to this lump sum and a positive incentive was given to alternative ESRD treatment modalities by giving a lump sum bonus in function of the proportion of patients treated with alternative treatment modalities (see Table 12). The minimum lump sum remained fixed at BEF4 500 (~€111.55) and the maximum was set at BEF10 000 (~€247.89).
Table 12: Lump sum bonus for hospital HD between 1/07/2001 and 30/06/2003 in function of the % of patients on alternative dialysis modalities
% of patients on alternative dialysis modalities
Lump sum bonus Baseline lump sum
≥10% and <25% BEF900 (~€22.31) BEF1 500 (~€37.18) + 40%*per diem price
≥25% and <35% BEF1 750 (~€43.38) ≥35% BEF1 950 (~€48.34)
On the 1st of October 2001 all lump sums were reduced by 15%, as a general saving measure.
The Royal Decree of June 23, 2003 (coming into effect on July 1st, 2003) redefined the categories for the lump sum bonus. The change was largest for dialysis centres that treated more than 10% of their ESRD patients with alternative treatment modalities (Table 13). The minimum lump sum was set at €111.55 and the maximum at €247.89.
Table 13: Lump sum bonus and baseline lump sum for hospital HD between 1/07/2003 and 30/06/2005 in function of the % of patients on alternative dialysis modalities
% of patients on alternative dialysis modalities
Lump sum bonus Baseline lump sum
<5% 0
€37.80 + 25%*per diem price 5-10% €18.59 10-25% €59.49 25-35% €80.56 >35% €85.52
* Since July 2002, the ‘budget of financial means’ (Budget Financiële Middelen/Budget des Moyens Financiers) of Belgian hospitals is no longer calculated based on per diem prices. The system of per diem prices has been abandoned. The per diem prices used for the calculations of the lump sums are therefore based on the per diem prices as of 30/06/2002

KCE Report 124 Chronic Dialysis in Belgium 41
Reimbursement prices are revised on the 1st of July of every year per hospital, in function of the percentage of alternative dialysis modalities used. Indexation is performed on the 1st of January of every year if the health index of the previous year exceeded the so-called ‘spill index’ (trigger index). Dialysis reimbursement tariffs are coupled to the trigger index used for the payment of social services (e.g. pensions) at that date. This trigger index is based on the health index.k The adaptation factor for the reimbursement tariffs is equal to the health index/trigger index. The tariffs defined in the Royal Decree of June 23, 2003 are multiplied by the adaptation factor to determine the reimbursement values for that year. In practice, the reimbursement tariffs increase by about 2% each year.
Table 14 gives an overview of the changes that have taken place in the financing mechanisms for hospital HD between 2003 and 2009, with the references to the Royal Decrees. The amounts presented in the table are indexed amounts. In March 2006 the trigger index was increased from 109.45 to 111.64 as a saving measure for the government. The implication was that the actual reimbursement tariffs decreased because the adaptation factor for the tariffs defined in 2003 decreased from 1.061 (health index/trigger index=116.15/109.45) to 1.04 (=116.15/111.64).
In 2009 the trigger index was increased from 111.64 to 112.89. The implication of this was that the reimbursement tariffs did not increase by 4.04% compared to the previous year but by 2.89%.
The current financing mechanisms for hospital haemodialysis are described in more detail in paragraph 3.4.3.1.
k The health index differs from the consumer price index. The health index is calculated by excluding a
number of products from the basket used for the calculation of the consumer price index, more specifically alcoholic drinks (bought in a store or consumed in a bar), tobacco products, motor fuels (excluding LPG). Indexation is done when the average health index of the last 4 months exceeds the trigger index. If the trigger index has been exceeded, a new trigger index is set by multiplying the previous trigger index by 1.02.

42 Chronic Dialysis in Belgium KCE Reports 124
Table 14: Overview of the historical evolution in hospital HD lump sums in Belgium Royal Decree 23/06/2003 17/02/2005 3/06/2005 24/03/2006 Application date 1/07/2003 1/01/2004 1/01/2005 25/02/2005 1/07/2005 1/01/2006 28/03/2006 1/01/2007 1/01/2008 1/01/2009 Baseline lump sum 37,80 38,56 39,33 38,54 39,33 40,11 39,33 40,11 40,92 42,10 % of the per diem price* 25% 25% 25% 25% 20% 20% 20% 20% 20% 20% Lump sum bonus if % alternative dialysis modalities is:
<5% 0 0 0 0 0 0 0 0 0 0 ≥5 and <10% 18,59 18,96 19,34 18,95 29,34 29,93 29,34 29,93 30,52 31,41 ≥10 and <25% 59,49 60,68 61,89 60,65 71,89 73,33 71,89 73,33 74,79 76,96 ≥25 and <35% 80,56 82,17 83,81 82,13 93,81 95,69 93,81 95,69 97,60 100,43 ≥35% 85,52 87,23 88,97 87,19 98,97 100,95 98,97 100,95 102,97 105,95 Minimum lump sum 111,55 113,78 116,05 113,73 111,41 113,65 111,42 113,64 115,92 119,27 Maximum lump sum 247,89 252,85 257,90 252,74 257,90 263,06 257,90 263,06 268,32 276,08
* Per diem prices as of 30/06/2002.

KCE Report 124 Chronic Dialysis in Belgium 43
3.4.2.2 Satellite HD, home HD and PD
Up until June 30, 2001, a lump sum of €222.34 per session (maximum 6 times per 2 weeks) and €217.82 per session (maximum 3 times per week) was paid for respectively satellite HD and home HD. This was intended to cover the costs of medical and paramedical personnel, equipment, materials and consumables. For PD, this lump sum was determined at €619.73 per week.
A separate reimbursement for APD as well as for home HD and PD with nursing support was introduced on July, 1st, 2001. APD was reimbursed at €694.10 per week, home HD with nursing support at €264.43 per session and PD with nursing support at €793.26 per week.
In July 2003, along with the major changes made to the lump sums for hospital HD, the lump sums for alternative dialysis modalities were increased. Table 15 compares the lump sums as from July 1st, 2003 with the lump sums applied between July 2001 and June 30th, 2003.
Table 15: Lump sums for alternative dialysis modalities in 2001 and 2003 Dialysis modality NIHDI code 2001 until
June 30, 2003
From July 1st, 2003 onwards
Satellite HD, per session 761515 222.34 236.50 Home HD, per session 761493 217.82 231.70 Home HD with nursing support, per session 761456 264.43 278.31 CAPD, per week 761552 619.73 659.21 APD, per week 761530 694.10 733.58 PD with nursing support, per week 761471 793.26 832.74
Figure 9 shows how lump sums for alternative dialysis modalities have changed since 2003. The kink in 2006 is due to the increase in the trigger index in March 2006, as a consequence of which the lump sums declined in March 2006.
Figure 9: Evolution of lump sums for alternative dialysis modalities since July 2003
PD and APD
0
100
200
300
400
500
600
700
800
900
1.000
1/07
/03
1/01
/04
1/07
/04
1/01
/05
1/07
/05
1/01
/06
1/07
/06
1/01
/07
1/07
/07
1/01
/08
1/07
/08
1/01
/09
lum
p su
m p
er w
eek
(in €
of t
hat y
ear)
PD PD w ith nursing support APD

44 Chronic Dialysis in Belgium KCE Reports 124
3.4.2.3 Transport
Public transport from the patient’s home to and from the dialysis centre is fully reimbursed to the patients. Transport by other means is since 1985 reimbursed at €0.25 per km and limited to 30 km per one way journey. If there is no dialysis centre within a range of 30 km from the patient’s home, the real distance is reimbursed at the same amount of €0.25 per km. l Travel costs of patients following home dialysis treatment related to consultations and/or surveillance of their dialysis treatment have been reimbursed much more under the same conditions as for patients on hospital HD treatment.m This amount has not been indexed since 1985 and is currently still €0.25 per km.
Besides the NIHDI reimbursement of €0.25 per km in case of private transport, some sickness funds provide an additional reimbursement in the context of the complementary insurance package. Different formulas exist, such as a lump sum out-of-pocket payment per treatment day or an additional reimbursement per kilometre.
3.4.3 Current financing of hospital haemodialysis
As mentioned before, the current financing mechanisms are basically as determined in 2003.
All figures presented in this paragraph are indexed amounts for 2009 unless specified otherwise. The index applied for the calculation of the tariffs in 2009 is 125.73 (1996=100); the trigger index is 112.89, meaning that the amounts mentioned in the Royal Decree of 23 June 2003 have to be multiplied by 125.73/112.89 to obtain the tariffs applicable in 2009. The original figures in the Royal Decree of were coupled to the trigger price index of 109.45 (1996=100).
3.4.3.1 Lump sums for hospital haemodialysis
Since July, 1st 2005, a dialysis centre receives a lump sum of €42.10 per haemodialysis session (2009 reimbursement rate), plus 20% of the hospital’s per diem price.n The lump sum is increased with a variable amount, depending on the proportion of ESRD patients treated with alternative dialysis modalities, i.e. home HD, PD or satellite HD. The incremental indexed lump sums are presented in Table 16.
Table 16: Incremental lump sums according to the percentage of ESRD patients of a hospital receiving alternative types of dialysis (all amounts in € 2009)
Percentage of patients receiving alternative dialysis treatments
Incremental lump sum (indexed)
Baseline lump sum
5-10% €31.41
€42.10 + 20%*per diem price 10-25% €76.96 25-35% €100.43 >35% €105.95
* Per diem prices as of 30/06/2002
The minimum lump sum per hospital HD session is set at €119.27 and the maximum is €276.08.
l Ministerial Decree of 21 January 2001 - Ministerieel besluit tot wijziging van het ministerieel besluit van 24
januari 1985 tot vaststelling van de tegemoetkoming van de verplichte verzekering voor geneeskundige verzorging en uitkeringen in de reiskosten van de gedialyseerde rechthebbenden, B.S./M.B. 19-02-2002.
m Ministerial Decree of 8 December 1999 - Ministerieel besluit tot wijziging van het ministerieel besluit van 24 januari 1985 tot vaststelling van de tegemoetkoming van de verplichte
verzekering voor geneeskundige verzorging en uitkeringen in de reiskosten van de gedialyseerde rechthebbenden, B.S./M.B. 28-01-2000.
n Royal Decree of 3 June 2005. - Koninklijk besluit tot wijziging van het koninklijk besluit van 23 juni 2003 tot uitvoering van artikel 71bis, §§ 1 en 2 van de wet betreffende de verplichte verzekering voor geneeskundige verzorging en uitkeringen, gecoördineerd op 14 juli 1994, B.S./M.B. 20-06-2005.

KCE Report 124 Chronic Dialysis in Belgium 45
The percentage of alternative dialysis treatments is calculated as:
A B C+ +156 52 days in year
A B C D+ + +156 52 days in year 156
Where
A = number of lump sums charged for home HD and satellite HD per year (the maximum number of lump sums per year is 156, i.e. three lump sums per week for 52 weeks/year)
B= number of lump sums charged for PD per year (maximum number of lump sums per year is 52; i.e. one lump sum per week x 52 weeks/year)
C= number of lump sums charged for fractionated PD at home (i.e. in case of incomplete PD weeks, a lump sum per day is charged to the RIZIV/INAMI. The denominator is the total number of days in the year, i.e. 365 or 366)
D= number of lump sums charged for hospital HD patients per year (the maximum number of lump sums per year is 156; i.e. three lump sums per week for 52 weeks/year)
For hospitalized patients, the dialysis centre receives 50% of the reimbursement for hospital HD, with a minimum of €92.76. If a patient is hospitalized in a hospital that is not a legally recognized dialysis centre, the hospital HD dialysis lump sum (100%) is paid to the centre that provides the HD treatment.
3.4.3.2 Fee for service for hospital haemodialysis
Per hospital HD session the nephrologists can charge an honorarium fee of €199.74 (code 470470 – 470481). This honorarium covers the intellectual act of the physician supervising the patient treated with haemodialysis or intermittent haemofiltration, including the costs for the haemofiltration and haemodialysis material, the individual appliances of the artificial kidney and the tubes needed for dialysis.o It also covers the costs of dialysis fluid.p
The evolution of the honorarium fees over time is presented in Figure 10. The figure shows that no indexation was applied to the honorarium fees in 2005, i.e. the fee remained at the same level as in 2004.q
Figure 10: Honorarium fees for hospital HD since 2003 (per session)
o Royal Decree of 29 April 1999. - Koninklijk besluit tot wijziging van het koninklijk besluit van 14
september 1984 tot vaststelling van de nomenclatuur van de geneeskundige verstrekkingen inzake verplichte verzekering voor geneeskundige verzorging en uitkeringen. B.S./M.B. of 27-05-1999.
p Interpretatieregels betreffende de nomenclatuur van de geneeskundige verstrekkingen, B.S./M.B. 13/03/2002
q No indexation was applied in 2003 either, data not shown in the figure.
199,74
191,47188,60
185,54
181,44181,44
170
175
180
185
190
195
200
205
2004 2005 2006 2007 2008 2009
Hon
orar
ium
fee
per H
D s
essi
on

46 Chronic Dialysis in Belgium KCE Reports 124
3.4.4 Current financing of satellite HD, home HD and PD
The financing of satellite HD, home HD and PD consists of a lump sum only. This means that for ambulatory low-care and home HD and for PD the nephrologist does not receive a specific honorarium. During the education of a PD patient, however, be it ambulatory or in hospital, the nephrologist can charge an honorarium fee per day, for a maximum period of 3 consecutive weeks (codes 470433-470444). Also in case of hospitalisation of a PD patient for installation of the dialysis catheter (codes 470400 and 470422) or for another reason (codes 470374-470385), specific honorarium fees can be charged (limited to 6 weeks in case of hospitalisation for installation of the dialysis catheter). The fees-for-service charged to the NIHDI for supervision during the education of a patient (470433-470444) or during hospitalisation for another reason (470374-470385) cover all costs associated with PD, including the dialysis fluids and leads needed for the dialysis treatment.r
The lump sum paid to the centre is due per treatment session for haemodialysis at home (limited to 3 lump sums a week) and satellite HD (limited to 6 lump sums per two weeks). Peritoneal dialysis is reimbursed per week, except if the treatment has been interrupted during the week. In that case PD is reimbursed per treatment day.
The lump sum is intended to cover all the costs borne by the dialysis centre (depreciations, wages and social security contributions for personnel, overhead costs, administration, materials and consumables and other direct costs) as well as the costs borne by the patients for home dialysis (increased electricity and water use and telephone costs). The dialysis centre has to reimburse the patient for his additional expenses due to dialysis from this lump sum at a rate of €5.19 per session for home HD patients or €3.84 per week for PD patients.
For home HD and PD, different tariffs apply depending on whether support is required from a nurse at home. The cost of nursing support is included in the lump sum and hence the nurses providing the support are supposed to charge the dialysis centre for their services. Nursing support can only be charged to the centre if it was prescribed by the nephrologist of the supervising dialysis centre.
For PD different tariffs apply for CAPD and APD. An overview of the lump sums for each type of dialysis treatment with their respective sub-categories is presented in Table 17.
Table 17: Lump sums for home HD, satellite HD and PD (2009 prices) Lump sum Home haemodialysis With nursing assistance at home Without assistance
€309.96/session €258.05/session
Peritoneal dialysis With nursing assistance at home Without assistance APD Incomplete peritoneal dialysis week With nursing assistance at home Without assistance APD
€927.43/week €734.16/week €817.04/week €132.49/dialysis day €104.88/dialysis day €116.72/dialysis day
Satellite HD €263.40/session
The lump sum per week or per day for nursing support is in principle equal to the difference in lump sums between PD or home HD with and PD or home HD without nursing support; i.e. €193.27 per week PD, €51.91 per home HD session, €110,39 per week APD and €27,61 per day for incomplete weeks of PD. However, a survey conducted in 2006 by the Wit-Gele Kruis, a Flemish home nursing organisation, revealed that the amount reimbursed to the nursing organisation for nursing support differs across dialysis centres.
r K.B. 29.4.1999" (operational 1.7.1999) +,"K.B. 27.3.2003" [operational 1.4.2003 ("K.B. 22.4.2003" +
Erratum B.S. 29.4.2003)]
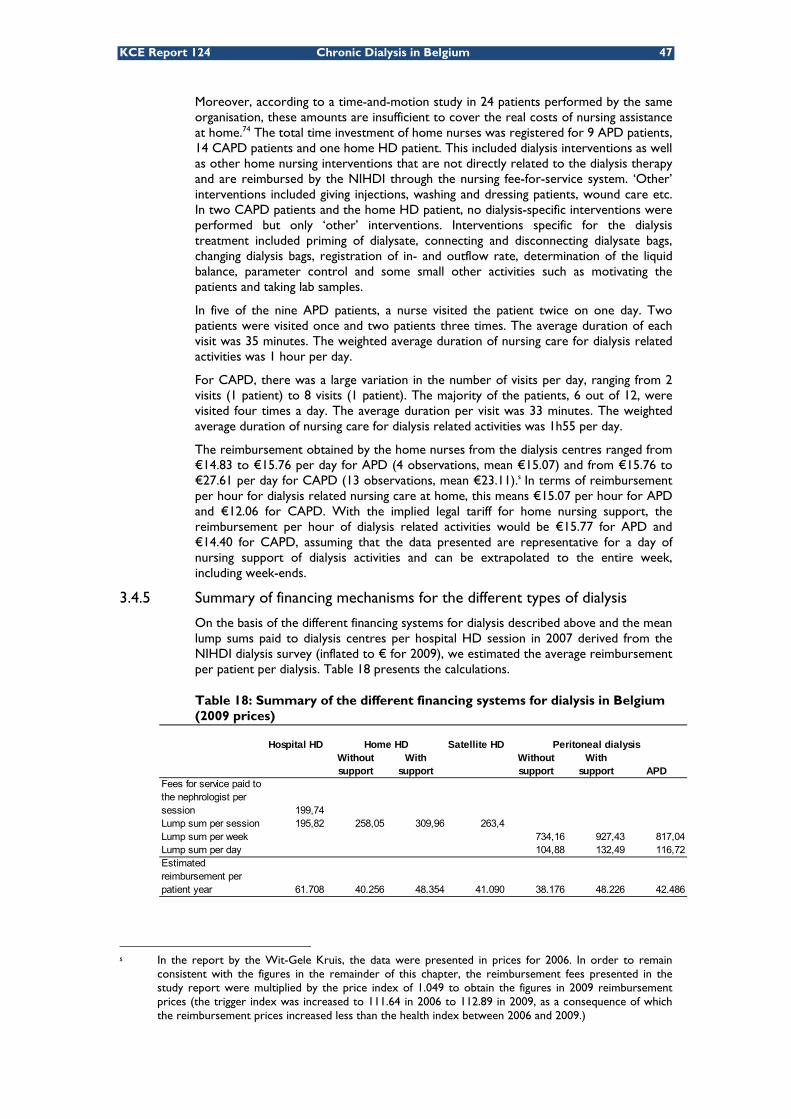
KCE Report 124 Chronic Dialysis in Belgium 47
Moreover, according to a time-and-motion study in 24 patients performed by the same organisation, these amounts are insufficient to cover the real costs of nursing assistance at home.74 The total time investment of home nurses was registered for 9 APD patients, 14 CAPD patients and one home HD patient. This included dialysis interventions as well as other home nursing interventions that are not directly related to the dialysis therapy and are reimbursed by the NIHDI through the nursing fee-for-service system. ‘Other’ interventions included giving injections, washing and dressing patients, wound care etc. In two CAPD patients and the home HD patient, no dialysis-specific interventions were performed but only ‘other’ interventions. Interventions specific for the dialysis treatment included priming of dialysate, connecting and disconnecting dialysate bags, changing dialysis bags, registration of in- and outflow rate, determination of the liquid balance, parameter control and some small other activities such as motivating the patients and taking lab samples.
In five of the nine APD patients, a nurse visited the patient twice on one day. Two patients were visited once and two patients three times. The average duration of each visit was 35 minutes. The weighted average duration of nursing care for dialysis related activities was 1 hour per day.
For CAPD, there was a large variation in the number of visits per day, ranging from 2 visits (1 patient) to 8 visits (1 patient). The majority of the patients, 6 out of 12, were visited four times a day. The average duration per visit was 33 minutes. The weighted average duration of nursing care for dialysis related activities was 1h55 per day.
The reimbursement obtained by the home nurses from the dialysis centres ranged from €14.83 to €15.76 per day for APD (4 observations, mean €15.07) and from €15.76 to €27.61 per day for CAPD (13 observations, mean €23.11).s In terms of reimbursement per hour for dialysis related nursing care at home, this means €15.07 per hour for APD and €12.06 for CAPD. With the implied legal tariff for home nursing support, the reimbursement per hour of dialysis related activities would be €15.77 for APD and €14.40 for CAPD, assuming that the data presented are representative for a day of nursing support of dialysis activities and can be extrapolated to the entire week, including week-ends.
3.4.5 Summary of financing mechanisms for the different types of dialysis
On the basis of the different financing systems for dialysis described above and the mean lump sums paid to dialysis centres per hospital HD session in 2007 derived from the NIHDI dialysis survey (inflated to € for 2009), we estimated the average reimbursement per patient per dialysis. Table 18 presents the calculations.
Table 18: Summary of the different financing systems for dialysis in Belgium (2009 prices)
s In the report by the Wit-Gele Kruis, the data were presented in prices for 2006. In order to remain
consistent with the figures in the remainder of this chapter, the reimbursement fees presented in the study report were multiplied by the price index of 1.049 to obtain the figures in 2009 reimbursement prices (the trigger index was increased to 111.64 in 2006 to 112.89 in 2009, as a consequence of which the reimbursement prices increased less than the health index between 2006 and 2009.)
Hospital HD Satellite HDWithout support
With support
Without support
With support APD
Fees for service paid to the nephrologist per session 199,74Lump sum per session 195,82 258,05 309,96 263,4Lump sum per week 734,16 927,43 817,04Lump sum per day 104,88 132,49 116,72Estimated reimbursement per patient year 61.708 40.256 48.354 41.090 38.176 48.226 42.486
Peritoneal dialysisHome HD
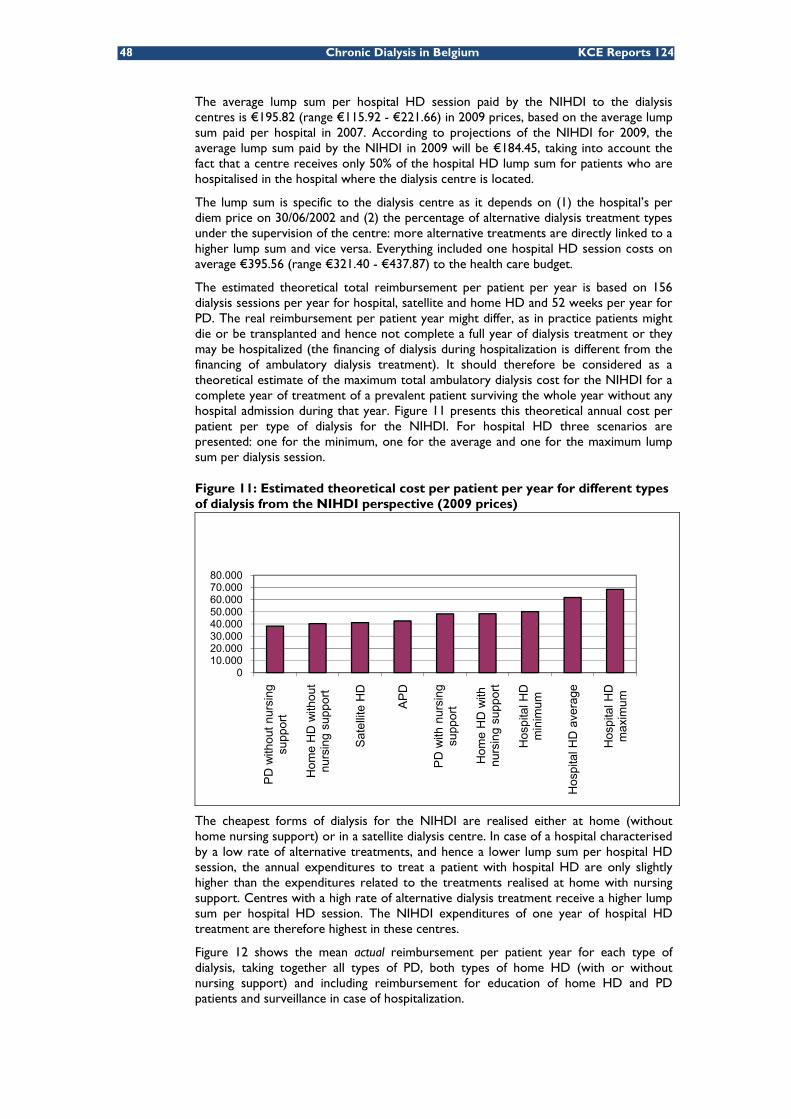
48 Chronic Dialysis in Belgium KCE Reports 124
The average lump sum per hospital HD session paid by the NIHDI to the dialysis centres is €195.82 (range €115.92 - €221.66) in 2009 prices, based on the average lump sum paid per hospital in 2007. According to projections of the NIHDI for 2009, the average lump sum paid by the NIHDI in 2009 will be €184.45, taking into account the fact that a centre receives only 50% of the hospital HD lump sum for patients who are hospitalised in the hospital where the dialysis centre is located.
The lump sum is specific to the dialysis centre as it depends on (1) the hospital’s per diem price on 30/06/2002 and (2) the percentage of alternative dialysis treatment types under the supervision of the centre: more alternative treatments are directly linked to a higher lump sum and vice versa. Everything included one hospital HD session costs on average €395.56 (range €321.40 - €437.87) to the health care budget.
The estimated theoretical total reimbursement per patient per year is based on 156 dialysis sessions per year for hospital, satellite and home HD and 52 weeks per year for PD. The real reimbursement per patient year might differ, as in practice patients might die or be transplanted and hence not complete a full year of dialysis treatment or they may be hospitalized (the financing of dialysis during hospitalization is different from the financing of ambulatory dialysis treatment). It should therefore be considered as a theoretical estimate of the maximum total ambulatory dialysis cost for the NIHDI for a complete year of treatment of a prevalent patient surviving the whole year without any hospital admission during that year. Figure 11 presents this theoretical annual cost per patient per type of dialysis for the NIHDI. For hospital HD three scenarios are presented: one for the minimum, one for the average and one for the maximum lump sum per dialysis session.
Figure 11: Estimated theoretical cost per patient per year for different types of dialysis from the NIHDI perspective (2009 prices)
The cheapest forms of dialysis for the NIHDI are realised either at home (without home nursing support) or in a satellite dialysis centre. In case of a hospital characterised by a low rate of alternative treatments, and hence a lower lump sum per hospital HD session, the annual expenditures to treat a patient with hospital HD are only slightly higher than the expenditures related to the treatments realised at home with nursing support. Centres with a high rate of alternative dialysis treatment receive a higher lump sum per hospital HD session. The NIHDI expenditures of one year of hospital HD treatment are therefore highest in these centres.
Figure 12 shows the mean actual reimbursement per patient year for each type of dialysis, taking together all types of PD, both types of home HD (with or without nursing support) and including reimbursement for education of home HD and PD patients and surveillance in case of hospitalization.
010.00020.00030.00040.00050.00060.00070.00080.000
PD
with
out n
ursi
ng
supp
ort
Hom
e H
D w
ithou
t nu
rsin
g su
ppor
t
Sate
llite
HD
AP
D
PD w
ith n
ursi
ng
supp
ort
Hom
e H
D w
ith
nurs
ing
supp
ort
Hos
pita
l HD
m
inim
um
Hos
pita
l HD
ave
rage
Hos
pita
l HD
m
axim
um

KCE Report 124 Chronic Dialysis in Belgium 49
The reimbursement per patient year is obtained by dividing the total NIHDI reimbursement by the total number of patient years in the respective treatment modalities. The number of patient years in PD is obtained by dividing the total number of lump sums paid for PD by the 52 (as there are 52 weeks in a year and PD lump sums are paid per week) plus the number of fractioned PD lump sums divided by 365 (as lump sums for fractionated PD are paid per day). The number of patient years in hospital HD is obtained by dividing the total number of lump sums for hospital HD by 156, corresponding to 3 sessions per week in each of the 52 weeks of the year. Similarly, the number of patient years for home HD and satellite HD was calculated.
The mean actual reimbursement per patient year of hospital HD treatment was lower than the theoretical estimate of the reimbursement per year of hospital HD treatment presented in Figure 11. The reason is twofold. First, there is a price effect. Figure 11 uses prices of 2009, while Figure 12 expresses reimbursement in terms of prices of 2008 for the honorarium fees and PD and satellite HD lump sums and of 2007 for the hospital HD lump sums. Second, the real NIHDI expenditures per patient year include the effect of the lump sum for hospitalized HD patients being 50% of the normal lump sum for an ambulatory hospital HD session if the patient is hospitalized in a hospital with a recognized dialysis centre. The theoretical estimate in Figure 11 assumes a full year of treatment without hospitalizations.
The similarity between the theoretical reimbursement per year for home HD in Figure 11 and the actual reimbursement per patient year in Figure 12 reflects the fact that the majority of patients are treated with home HD without nursing support (32 patient years without nursing support compared to 3 patient years with nursing support). The average expenditure for PD reflects a mixture of patients treated with and patients treated without nursing support (91 patient years with nursing support versus 140 without nursing support).
Figure 12: Mean actual NIHDI reimbursement per patient year, based on the number of cases in 2007 and reimbursement tariffs of 2008
Source: NIHDI dialysis questionnaire 2007
0
10000
20000
30000
40000
50000
60000
Hospital HD Satellite HD Home HD PD
NIH
DI R
eim
burs
emen
t per
pat
ient
yea
r
Lump sums Honorarium fees

50 Chronic Dialysis in Belgium KCE Reports 124
Key points
• The financing mechanisms of the different dialysis modalities have undergone many changes throughout recent years. The objective of all major changes was to reduce the strong relationship between dialysis reimbursement and the hospital per diem price established in 1995 and to give stronger (financial) incentives to increase the use of alternative dialysis modalities (PD and satellite HD).
• Currently, hospital HD is financed through a lump sum and a fee (honorarium) per session. The baseline amount of the lump sum depends for 20% on the hospital’s historical per diem price. A lump sum bonus is granted depending on the proportion of patients treated with alternative dialysis modalities. The bonus increases up to the point where 35% of the dialysis treatments are through alternative dialysis modalities and remains constant afterwards.
• Satellite HD is reimbursed through a lump sum per session. A maximum of 6 lump sums are paid per 14 days of satellite HD treatment.
• Home HD is reimbursed through a lump sum per session, with a maximum of 3 sessions per week. A higher lump sum is paid for home HD with nursing support.
• PD is reimbursed through a lump sum per week. A higher lump sum is paid for PD with nursing support.
• The dialysis centre receives the lump sums. In case of home dialysis with nursing support, the dialysis centre has to pay home nursing service €51.91 per session for home HD, €193,27 per week for CAPD and €110,39 per week for APD. According to a study of the Wit-Gele Kruis, however, the reimbursement received by the home nursing services differs across centres.
• The average total NIHDI expenditures for ambulatory dialysis per patient year were in 2008 €56 817 for hospital HD, €41 167 for PD, €40 224 for satellite HD and €39 870 for home HD and (prices of 2008 applied to cases of 2007).
3.4.6 National expenditures for dialysis between 2002 and 2008
The total NIHDI expenditures for chronic dialysis-related services were more than €336 Million in 2008. This represents 1.57% of the national budget allocated for health care in 2008.
Figure 13 shows the evolution of the total NIHDI expenditures for dialysis between 1995 and 2005, including paediatric dialysis, and the relative contribution of the honoraria and the lump sums to the total expenditures. The honoraria include all honoraria related to all types of chronic dialysis treatment, i.e. not only the hospital HD honoraria but also the honoraria for supervision of peritoneal dialysis during the education of a patient in-hospital or during hospitalizations of patients on peritoneal dialysis for other causes.

KCE Report 124 Chronic Dialysis in Belgium 51
Figure 13: Evolution of NIHDI expenditures for chronic dialysis-related activities from 1995 to 2008
Source: Aggregated NIHDI data 1995-2008 (Doc N)
Figure 14 shows the expenditures per dialysis type. The totals include the lump sums as well as the honorarium fees. As in Figure 13, the amounts in Figure 14 include the expenditures for ambulatory dialysis as well as for dialysis during hospitalization, travel costs, surveillance during education of PD patient in hospital and costs of dialysis in children. Expenditures for acute dialysis, however, are excluded. Note that in 2001, the year of the financial reforms for the dialysis sector, expenditures for all types of dialysis started to rise more rapidly than in the earlier years.
Figure 14: Evolution of expenditures for hospital HD, satellite HD, PD and home haemodialysis from 1995 to 2008
Source: Aggregated NIHDI data 1995-2008 (Doc N)
0
50.000.000
100.000.000
150.000.000
200.000.000
250.000.000
300.000.000
350.000.000
400.000.000
Expe
nditures
Honorarium fees Lump sums
0
50.000.000
100.000.000
150.000.000
200.000.000
250.000.000
300.000.000
350.000.000
400.000.000
Expe
nditures
Home HD Hospital HD PD Satellite HD Transport

52 Chronic Dialysis in Belgium KCE Reports 124
An increase in the relative expenditures on presumed “low-cost” dialysis modalities (satellite HD, PD and home HD) has been observed between 2000 and 2006 (Figure 15). This might be seen as an immediate result of the financial reforms in 2001. While in 2000 only 16% of the expenditures were for alternative forms of dialysis, this increased to 27% in 2006. Since 2006 the relative expenditures on alternative dialysis modalities seem to be stable at slightly less than 30% of total expenditures on dialysis-related activities, including lumps sums and medical surveillance fees for ambulatory dialysis or dialysis during hospitalization and transportation.t
Figure 15: Evolution of the relative expenditures on different dialysis modalities
Source: Aggregated NIHDI data 1995-2008 (Doc N)
3.4.7 Differences in use of alternative dialysis modalities between centres and between regions
There is quite some variability in the use of alternative dialysis modalities across the Belgian territory. Figure 16 illustrates the overall variability in the use of alternative dialysis types of all Belgian dialysis centres in function of the theoretical number of patients (or “patient years”) of the centre in 2007 and in function of the geographical region where the centre is located. The number of patient years of a centre in 2007 is obtained by dividing the number of lump sums charged to the NIHDI for each dialysis modality by the maximum possible number of lump sums per year (i.e. 156 for HD, 52 for PD and 365 for fractionated PD). This is a theoretical number of patients, as not all patients will be treated for a full year. Patients can die, be transplanted or start dialysis in the middle of the year. Nevertheless, the theoretical number of patients gives an indication of the scale of the dialysis centre. The higher the theoretical number of patients is, the larger the centre.
t More specifically, dialysis-related activities encompass the dialysis treatment itself either ambulatory or
during hospitalization, medical surveillance during ambulatory dialysis treatment or during hospitalization of PD or HD patients, surveillance during training of PD patients, paediatric hospital HD and transportation to and from the dialysis centre.
0%10%20%30%40%50%60%70%80%90%100%
Expe
nditures
Home HD Hospital HD PD Satellite HD Transport

KCE Report 124 Chronic Dialysis in Belgium 53
Figure 16: Percentage use of alternative dialysis types per centre in function of the theoretical number of patients treated in 2007 and in function of the community
Source: NIHDI Dialysis Survey, 2007
Two small centres do not treat patients with alternative dialysis modalities at all. The centre with the highest use of alternative dialysis types (67%) is also the largest centre, treating on average 256 patients per year.
For centres with 50 or more “full-year” dialysis patients, the relationship between the scale of the centre and the percentage of alternative dialysis use is not clear.
The distribution of small versus large centres is similar for Brussels and the Dutch-speaking community (Figure 16). 33% of the Brussels’ and Flemish centres treated more than 150 patients in 2007. This percentage is lower in the French-speaking community: one centre treated more than 150 dialysis patients. In the French-speaking community there are more smaller dialysis centres than in the Dutch-speaking community or in Brussels.
Figure 17 shows the variation in the use of alternative dialysis modalities according to the province of the dialysis centres in Belgium. For each province, the mean percentage of alternative dialysis use in the centres of that province is shown, as well as the minimum and maximum percentage observed in the centres located in that province.
The mean percentage of alternative dialysis types per unit is higher in the Dutch-speaking provinces than in the French-speaking provinces, with the exception of ‘Brabant Wallon’. The proportion of alternative dialysis types per unit in Brussels is comparable to the proportions observed in the Dutch-speaking provinces. A large variability between centres can be observed within the provinces (Figure 17).
0%10%20%30%40%50%60%70%80%
0 50 100 150 200 250 300
Number of patient years
% a
ltern
ativ
e di
alys
is
ther
apie
s
Dutch-speaking community French-speaking communityGerman-speaking community Brussels

54 Chronic Dialysis in Belgium KCE Reports 124
Figure 17: Mean, minimum and maximum percentage of use of alternative dialysis types according to province (number of centres) in 2007
3.4.8 Income from dialysis for hospitals
The honoraria and lump sums for hospital HD are an important source of revenues for dialysis centres. Because both are paid per hospital HD session, they are purely variable financing mechanisms. Ideally, variable financing mechanisms should be used to reimburse variable costs. In the case of hospital HD, however, the corresponding costs are often fixed or semi-fixed, at least in the short run. For instance, the costs of the equipment and personnel (nurses, technicians, dieticians and nephrologists) do not increase proportionally to the number of patients. One dialysis machine can be used to treat up to 5 hospital HD patients if dialysis is also performed on Saturdays and at night. With the current financing system, treating 40 hospital HD patients generates twice as many revenues as treating 20 hospital HD patients. The costs of treating 40 patients is, however, likely to be less than twice the costs of treating 20 patients because of the presence of fixed and semi-fixed costs. Such a discrepancy between the cost structure and the reimbursement mechanisms for hospital HD might give financial incentives in favour of or against a specific dialysis modality, if medically a choice is possible.
In chapter 5 the costs and revenues of a dialysis programme, from the perspective of a hospital, in function of the relative use of alternative dialysis modalities is simulated in order to study the financial incentives for the use of more or less alternative dialysis treatment types.
Key points
• Total NIHDI expenditures for chronic dialysis have risen sharply between 1995 and 2008, with a marked increase in the growth rate from 2001 onwards. Since 2006 the average relative share of alternative dialysis modalities in total expenditures on dialysis has stabilized at slightly less than 30%.
• There is variability between Belgian dialysis centres in the extent to which they use alternative dialysis treatment modalities. Centres in the Dutch speaking provinces have on average a higher proportion of alternative dialysis treatment use than centres located in the French speaking provinces, with the exception of ‘Brabant Wallon’,
• The honorarium fees and lump sums for hospital HD are a purely variable financing mechanism, while some costs of hospital HD are fixed or semi-fixed. This might create financial incentives for or against the use of hospital HD if medically a choice is possible.
0,00%
10,00%
20,00%
30,00%
40,00%
50,00%
60,00%
70,00%
80,00%
Ant
wer
p (9
)
Vla
ams
Bra
bant
(1)
Wes
tFl
ande
rs (5
)
Eas
tFl
ande
rs (7
)
Lim
burg
(3)
Bru
ssel
s (9
)
Bra
bant
Wal
lon
(1)
Hai
naut
(8)
Lièg
e (6
)
Luxe
mbo
urg
(2)
Nam
ur (2
)% o
f alte
rnat
ive
dial
ysis
ther
apie
s

KCE Report 124 Chronic Dialysis in Belgium 55
4 PATIENT CHARACTERISTICS, PUBLIC REIMBURSEMENT AND OUT-OF-POCKET EXPENSES
4.1 INTRODUCTION AND OBJECTIVES This chapter analyses reimbursement and out-of-pocket data that were routinely collected between 2003 and 2006 for patients in Belgium with registered chronic dialysis during at least 7 consecutive weeks. Apart from patient characteristics such as age and gender, these data include the dialysis modality, the NIHDI cost of dialysis, NIHDI cost of hospital stays, medical consultation fees and ambulatory drug prescriptions of all affiliates of the Belgian sickness funds during those years.
The objective of this chapter is to describe patient characteristics and costs by dialysis modality.
4.2 METHOD
4.2.1 Financing of dialysis
The mechanisms for the financing of haemodialysis (HD) have been described in the chapter 3. The main characteristics are that for hospital haemodialysis (HD) the reimbursement consists of 2 parts, a fee for the nephrologist and a lump sum for the hospital, while for satellite HD, home HD and for peritoneal dialysis (PD), only a lump sum can be asked. In all cases of haemodialysis, the lump sum is due for each session (with a maximum number of sessions in case of satellite and home HD). In case of peritoneal dialysis, the lump sum is intended to cover a week of treatment or a fraction of a week (per day). For routine satellite or home HD sessions and for routine PD treatment at home, nephrologists do not receive an honorarium fee.
In case of hospitalisation of a PD patient for the insertion of his treatment catheter, his treatment education or any other reason, an honorarium fee can be charged by the nephrologist per day, with limits on the number of days in case of catheter insertion (6 weeks) and education (3 weeks). In the nomenclature a distinction is made between satellite HD delivered to a hospitalized patient and satellite HD delivered to an ambulatory patient. The reimbursement amounts are identical. If a hospital HD patient is hospitalized in a centre with an accredited hospital HD dialysis unit, the hospital receives 50% of the lump sum of an ambulatory hospital HD session. The hospital performing the dialysis receives the full lump sum for hospital HD if the patient is hospitalized in another hospital without an accredited dialysis unit.
4.2.2 Inclusion criteria
Patients were included when they had an episode of chronic dialysis occurring during any of 4 consecutive years (2003 until 2006). For the purpose of this analysis ‘chronic dialysis’ was defined as reimbursement corresponding to 7 consecutive weeks of chronic dialysis treatment regardless of the year, defined according to the reimbursement codes associated with chronic dialysis as registered in the IMA - AIM database (see appendix to chapter 4). The specific NIHDI nomenclature codes used can be found in the appendix to this chapter. Only patients aged 18 years and older were included in this analysis.
4.2.3 Working definitions
The first episode of 7 consecutive weeks of chronic dialysis during 2003-2006 marked the start of follow-up. Those patients were considered as incident chronic dialysis patients for that specific year, while being considered prevalent for the next years if still on dialysis (labelled as ongoing). For the first year this rule was slightly different: when there was chronic dialysis reimbursement between January 1st and January 7th 2003, these patients were considered as ‘prevalent’ for 2003.

56 Chronic Dialysis in Belgium KCE Reports 124
In the database the data are presented by year of billing. Therefore, the definition of incident and prevalent patients was made for each year separately, and the same patient might be in the database for several years. Patients treated during more than one year are ‘incident’ the first year and ‘prevalent’ the next years.
Kidney transplant, death of the patient, or the absence of further data were considered as indicating the end of dialysis treatment (labelled further in this chapter as transplant, death and stop). Patients with dialysis reimbursement during the last week of 2006 were considered as having ongoing dialysis treatment after the study period.
4.2.4 Patient profiles
For the analysis, patients were categorised into 8 profiles as a function of the whole dialysis treatment they received during the period 2003-2006. These profiles were defined as follows:
• Hospital HD: at least 80% of the dialysis duration during the complete period of the dialysis treatment in hospital HD
• Satellite HD: at least 80% of the dialysis duration during the complete period of the dialysis treatment in satellite haemodialysis
• Home HD: at least 80% of the dialysis duration during the complete period of the dialysis treatment in home haemodialysis
• PD: at least 80% of the dialysis duration during the complete period of the dialysis treatment in peritoneal dialysis (CAPD or APD)
• HD: at least 80% of the dialysis duration during the complete period of the treatment in either Hospital or Satellite HD (when the patient would not apply for either the Hospital HD or Satellite HD category)
• PD-Hospital HD: at least 80% of the dialysis duration during the complete period of the treatment in either PD or Hospital HD
• PD-Satellite HD: at least 80% of the dialysis duration during the complete period of the treatment in either PD or Satellite HD
• Rest: all other combinations.
During the remainder of this chapter, those 8 categories will be referred to as the ‘dialysis modality’.
4.2.5 Data analysis and presentation of results
Data are analysed separately from a third payer perspective (sections 4.4 and 4.6) and from a patient perspective (out-of-pocket payments in section 4.4.6). Data are mainly presented by calendar year except for sections 4.3.1 were numbers of individual patients are described and in section 4.6 were a longitudinal analysis of incident patients is presented.
Whenever relevant, results are described for prevalent and incident patients separately. All expenses are presented in € without correction for inflation. Between 2003 and 2006 dialysis reimbursement increased by approximately 6% over the four years.
In the section on hospitalisation, all hospital stays in acute and non acute beds were included and the hospitalisation year was defined as the year of discharge. This means, for example, that if a patient was transplanted during a specific year, the cost for this hospital stay was included in that year. If a patient was transferred from an acute to a non acute bed, the complete hospital stay was taken into account.
For the average cost per patient the analysis is limited to prevalent patients only, for reasons explained later.

KCE Report 124 Chronic Dialysis in Belgium 57
4.3 PATIENT CHARACTERISTICS
4.3.1 Number of individuals receiving chronic dialysis treatment
Table 19 provides an overview of the number of individual patients included in this study. A total of 12 742 individuals (7309 men) received chronic dialysis treatment between 2003 and 2006. Of these, 4807 (2556 men, 53%) were prevalent patients in 2003. The remaining 7935 patients (4753 men, 60%) became incident chronic dialysis patients during one of the four years of follow-up.
During the four years of follow-up approximately 40% of those patients died.
Table 19: Number of individual patients by treatment year and dialysis modality
Prevalent 2003
Incident 2003
Incident 2004
Incident 2005
Incident 2006 Total
Hospital HD 3224 1324 1458 1405 1251 8662
Satellite HD 762 242 243 252 183 1682
Home HD 19 5 3 1 . 28
PD 341 189 212 182 173 1097
HD 331 158 148 126 113 876
PD-Hospital HD 62 45 42 44 40 233
PD-Satellite HD 1 1 2 4
Rest 67 34 23 25 11 160
Total 4807 1997 2129 2036 1773 12 742
Males 2556 1191 1273 1213 1076 7309
Prop. Male 53% 60% 60% 60% 61% 57%
For ease of presentation, and because of a better data granularity, the remainder of the results will be presented by year of dialysis, keeping in mind that some patients appear in this administrative database for more than one year. Patient characteristics will mainly be shown overall, for all years combined, since they have changed little over those four years. Where appropriate, time trends will be addressed.
4.3.2 Number of patients by year of treatment and dialysis modality
Table 20 shows the number of patients (both prevalent and incident) for each treatment year by dialysis modality. For most dialysis modalities there is a steady increase in the absolute numbers during the four years studied, although the numbers for some of the dialysis modes are too low to draw firm conclusions, especially for home HD and for the group of PD mixed with satellite HD.
However, as shown in Figure 18, the distribution of the different dialysis modalities barely changed during the four years studied.

58 Chronic Dialysis in Belgium KCE Reports 124
Table 20: Number of patients by treatment year and dialysis modality
2003 2004 2005 2006 Increase
Hospital HD 4548 4814 4894 4838 6,4%
Satellite HD 1004 1090 1172 1162 15,7%
Home HD 24 22 18 15 -37,5%
PD 530 618 677 704 32,8%
HD 489 583 610 640 30,9%
PD-Hospital HD 107 125 139 143 33,6%
PD-Satellite HD 1 1 2 4 300,0%
Rest 101 118 131 124 22,8%
Total 6804 7371 7643 7630 12,1%
Figure 18: Proportion of different dialysis modalities
4.3.3 Age and gender
Overall the proportion of males in the chronic dialysis is 56%, and this proportion slightly increased from 55% in 2003 to around 57% in 2006, an increase observed in all major dialysis modality categories. The proportion of males is higher (around 60%) in the incident cases and lower (around 54%) in the prevalent cases, which might partly be reflecting a higher mortality in men. The mortality effect is also apparent in the gender ratio by age as can be seen in Figure 19, showing that with increasing age the proportion of women slightly increases.
0%
10%
20%
30%
40%
50%
60%
70%
80%
90%
100%
2003 2004 2005 2006
Rest
PD‐Satellite HD
PD‐Hospital HD
HD
PD
Home HD
Satellite HD
Hospital HD

KCE Report 124 Chronic Dialysis in Belgium 59
Figure 19: Gender ratio by age in chronic dialysis patients
However, there do not appear to be major gender effects. Therefore, the distribution of age categories is shown in Figure 20 for men and women combined, illustrating that two third of the population is aged 65 and above, and that almost 40% are 75 and above. Over the four years of study there appears to be an evolution towards treating even more elderly patients as illustrated in Figure 21, where the proportion of chronic dialysis patients aged 75 and above increased from 35% to 41% between 2003 and 2006.
Figure 20: Age distribution in chronic dialysis patients (both genders)
0%
10%
20%
30%
40%
50%
60%
70%
80%
90%
100%
18‐44 45‐64 65‐74 ≥ 75
Female
Male
18‐44
45‐64
65‐74
≥ 75

60 Chronic Dialysis in Belgium KCE Reports 124
Figure 21: Age evolution in chronic dialysis patients (both genders)
In Figure 22 and Figure 23 the choice of (main) dialysis modality is shown by gender and age. Although there appear to be some differences between modalities, it should be kept in mind that for some of these categories (especially home HD, and mixed PD-satellite HD, but also for the groups of PD-Hospital HD and for the rest group) the numbers are small. From the figure it could be hypothesised that men tend to prefer peripheral HD and PD, whereas women seem to rely somewhat more on hospital HD. Age, however, also appears to have an important influence on the choice of dialysis modality as can be seen from Figure 23. Over 70% of hospital HD patients are aged 65 and over, but less than 50% of PD patients. The satellite HD and the mixed HD group have an intermediate age distribution.
Figure 22: Gender distribution by dialysis modality
0%
10%
20%
30%
40%
50%
60%
70%
80%
90%
100%
2003 2004 2005 2006
≥ 75
65‐74
45‐64
18‐44
0%10%20%30%40%50%60%70%80%90%100%
Female
Male

KCE Report 124 Chronic Dialysis in Belgium 61
Figure 23: Age distribution by dialysis modality (both genders)
4.3.4 Starting, continuing and stopping dialysis
Patients start with chronic dialysis because of end-stage renal disease (ESRD). Therefore, therapy is either for life or until successful renal transplantation. Figure 24 shows, by dialysis modality, the start/stop status. The most important categories are the patients that either start during the year (the incident patients) or continue from previous year (prevalent patients). According to the data, each year approximately 4% of chronic dialysis patients in the study (mainly prevalent patients) received a renal transplantation, and an additional 20% stopped dialysis, mainly because they died.
The overall transplantation rate corresponds to approximately 80% of the total number of transplantations in Belgium reported by Eurotransplant (www.eurotransplant.nl), except in the first year 2003 where it is lower. There are several reasons for this discrepancy. In 2003 some patients who received a kidney transplant were not included in our study because they did not fulfill the chronic dialysis inclusion criteria for our study (at least 7 weeks of chronic dialysis in the study period). Other reasons for this discrepancy applying to all study years include pre-emptive transplantations, patients being on dialysis for a short period of time before transplantation, paediatric transplants and possibly other reasons.
The stop reasons differ markedly by dialysis modality, which is undoubtedly caused by important ‘confounding by indication’. It should be remembered that the data we present are observational and that patients on different dialysis modalities have very different average patient profiles. Therefore, the associations should not be interpreted causally.
It can for instance be seen from Figure 24 that patients on home HD, on PD and to a lesser extent on satellite HD have a higher probability of receiving a renal transplant, whereas individuals on hospital HD and on HD in general are more likely to die.
Over the four year study period those results remained relatively stable across dialysis modalities. Therefore, results have been presented for all years together in one figure.
0%
10%
20%
30%
40%
50%
60%
70%
80%
90%
100%
≥ 75
65‐74
45‐64
18‐44

62 Chronic Dialysis in Belgium KCE Reports 124
Figure 24: Continuation rates and reasons for stopping per year in prevalent and incident chronic dialysis patients (all years combined)
4.3.5 Mortality
4.3.5.1 Cross-sectional analysis
As mentioned in 4.3.1, approximately 40% of individual patients included in this study died during the four-year study period. However, those patients were a mixture of prevalent patients and incident patients that were followed-up for different periods of time. The high mortality, obviously, is influenced by the relatively high and increasing age of patients that receive chronic dialysis therapy in Belgium.
The mortality of dialysis patients who died during the same calendar year was on average 17% (only slightly higher in men than in women). In incident patients this mortality during the same year was 15% while in prevalent patients it was 18%. But, the mortality during the same calendar year is very much age dependent: 4% at ages 18-44, 10% at ages 45-64, 18% at ages 65-74 and 24% at age 75 and above.
4.3.5.2 Longitudinal Survival Analysis
To avoid the interpretational problems of the mix of prevalent and incident patients we also conducted a longitudinal survival analysis for the whole study period on incident patients only, i.e. patients that did not have chronic dialysis in the first week of 2003, as defined previously.
Overall mortality for both genders is presented in Figure 25, showing that the four-year survival for incident chronic dialysis patients is less than 40%. As expected, the four-year survival is extremely age dependent and is somewhat lower in men as anticipated (see Figure 26 and survival curves in appendix).
0%10%20%30%40%50%60%70%80%90%
100%
Prevalent + stop
Incident + stop
Prevalent + death
Incident + death
Prevalent + ongoing
Incident + ongoing
Prevalent + transplant
Incident + transplant

KCE Report 124 Chronic Dialysis in Belgium 63
Figure 25: Survival for incident chronic dialysis patients (all ages and both genders)
Figure 26: Survival for incident chronic dialysis patients by gender and age
For the mortality by dialysis modality, we limited the analysis to those modalities with a least 500 incident patients over the 4 year period, i.e. the hospital HD, satellite HD, PD and mixed HD groups. There is a marked observed difference between dialysis modalities, as shown in Figure 27. Where patients categorised in the hospital HD group have a four-year survival of slightly more than 20%, the survival in de PD group, the mixed HD group and especially in the satellite HD group is much better.
Obviously, those results should be interpreted with much caution, since these results are heavily biased by several confounders, the most important of which is the confounding by indication as mentioned previously. The patient profile, age, co-morbidities and case severity are very different for those different categories and are in themselves reasons to select a specific dialysis modality. Therefore, these results should certainly not be interpreted as being causally linked to the use of specific dialysis modalities but should be interpreted as descriptive data only.
Other survival analyses are shown in the appendix to chapter 4.

64 Chronic Dialysis in Belgium KCE Reports 124
Figure 27: Survival for incident chronic dialysis patients by dialysis modality (both genders)
4.4 PUBLIC REIMBURSEMENTS FOR CHRONIC DIALYSIS PATIENTS: CROSS-SECTIONAL ANALYSIS PER YEAR In this section specific reimbursed expenses will be analysed and described. For the overall costs, all patients will be included. For the average cost per patient, we will only use cost and numbers of the ‘prevalent’ patients, since ‘incident’ patients will, on average, only have started chronic dialysis therapy in the middle of the year. Including incident patients in the cost per patient analyses would artificially lower the estimates. An analysis of cost before and after initiation of therapy is presented in 4.6
It should also be remembered that also prevalent patients will, on average, not receive dialysis therapy for a full year since some of them stopped chronic dialysis during the year for various reasons, as described in 4.3.4. On average, across dialysis modalities and over the four years, approximately 25% of patients stop dialysis for various reasons (transplant, death or unknown). Assuming those patients stop on average in the middle of the year, we can assume that on average prevalent patients will have dialysis for 87.5% of the year. Therefore, the data for the average reimbursement per patient will be underestimated by about 14% (the reciprocal of 87.5% minus 1). Moreover, prevalent patients spend on average more than 60 days per year in hospital (see section 4.4.3), leading to an lower average cost for ambulatory dialysis, consultations and ambulatory medication.
On the other hand, expenses are likely to be higher for patients that are starting on chronic dialysis, because very often there will be an acute episode that will frequently require a hospital admission. Therefore, an additional longitudinal analysis for incident patients will be presented in section 4.6, detailing the costs for the same cost items in relations to the time to and since start of dialysis.

KCE Report 124 Chronic Dialysis in Belgium 65
4.4.1 NIHDI reimbursements
4.4.1.1 Overall reimbursements
In Figure 28 the total reimbursements for all medical costs for dialysis patients are shown. The total reimbursement for those patients (patients as defined in Table 20) increased from €386 million in 2003 to €450 million in 2006. Total reimbursement is obviously associated with the dialysis modality but is rather unrelated to age as shown in Figure 28 and Figure 29. These reimbursements only consider direct reimbursements by the NIHDI, but do not include the per diem cost for hospital care, which is paid out of the budget of financial means (BFM/BMF). These expenses are estimated to amount to approximately an additional € 170 million per year as detailed in 4.4.3.
Figure 28: Total reimbursements for chronic dialysis patients by year for different dialysis modality categories
Figure 29 shows the same data but by age. The distribution of reimbursements by age category closely resembles the age distribution as shown in Figure 20, indicating that the underlying pathology is the main driver for total medical expenses.
Figure 29: Total reimbursements for chronic dialysis patients by year for different age categories
0 €
50.000.000 €
100.000.000 €
150.000.000 €
200.000.000 €
250.000.000 €
300.000.000 €
350.000.000 €
400.000.000 €
450.000.000 €
500.000.000 €
2003 2004 2005 2006
Rest
PD‐Satellite HD
PD‐Hospital HD
HD
PD
Home HD
Satellite HD
Hospital HD
0 €
50.000.000 €
100.000.000 €
150.000.000 €
200.000.000 €
250.000.000 €
300.000.000 €
350.000.000 €
400.000.000 €
450.000.000 €
500.000.000 €
2003 2004 2005 2006
≥ 75
65‐74
45‐64
18‐44

66 Chronic Dialysis in Belgium KCE Reports 124
4.4.1.2 Average reimbursement per patient (prevalent only)
Using the above data, but limiting those to prevalent patients only, Table 21 gives the average total reimbursement per year by dialysis modality, while Table 22 shows the same data by age. The average reimbursements are relatively stable over the four years studied, and the growth in total expenses is mainly associated with the growing numbers of chronic dialysis patients. Patients on alternative dialysis modalities have markedly less overall medical expenses that patients on hospital HD.
Also in those prevalent patients, the age appears to have a minor influence on the average reimbursement of medical expenses.
Table 21: Average total reimbursement for prevalent patients by dialysis modality
Dialysis Modality 2003 2004 2005 2006
Hospital HD 67.469 € 65.980 € 65.707 € 67.385 € Satellite HD 52.304 € 53.423 € 53.098 € 53.207 € Home HD 50.042 € 49.402 € 46.154 € 49.301 € PD 45.117 € 46.501 € 47.104 € 48.458 € HD 61.727 € 62.261 € 63.065 € 60.632 € PD-Hospital HD 55.235 € 57.802 € 58.453 € 61.844 € PD-Satellite HD 45.122 € 56.043 € 55.933 € 55.141 € Rest 55.236 € 61.951 € 60.914 € 62.583 €
Overall 62.682 € 61.868 € 61.492 € 62.451 €
Table 22: Average total reimbursement for prevalent patients by age
Age Category 2003 2004 2005 2006
18-44 61.041 € 61.274 € 59.037 € 60.351 €
45-64 63.370 € 63.360 € 63.500 € 63.620 €
65-74 63.187 € 62.139 € 62.023 € 63.948 €
≥ 75 62.118 € 60.744 € 60.293 € 61.221 €
Total 62.682 € 61.868 € 61.492 € 62.451 €
4.4.2 Ambulatory dialysis
4.4.2.1 Overall reimbursements
The reimbursement data for dialysis include the medical fees (honoraria), the lump sums (“forfait"), and the transport costs. Total reimbursement for dialysis was €227.7 million in 2003 and increased to €272.1 million in 2006, an increase of 20%. As shown in Figure 30, the majority of these reimbursements (approximately 60%) come through the lump sum for dialysis. Medical fees account for almost 40% of the cost, while transport reimbursement accounts for only around 2% of the reimbursements. These proportions remained relatively stable over the four years studied although there is a slight increase in the proportion of the lump sum (59 to 62%), and a slight decrease in the proportion of the medical fees (40 to 37%), which can be explained by the increase in the proportion of dialysis patients treated with alternative dialysis modalities, which are only reimbursed through a lump sum.

KCE Report 124 Chronic Dialysis in Belgium 67
Figure 30: Reimbursements for ambulatory dialysis by year for different reimbursement categories
Figure 31 shows the same data but now by the dialysis modality. Not surprisingly the categories with most patients account for the highest reimbursement costs. Therefore, in the next section, the average cost per patient in each category is given.
The proportion of medical fees is higher in the Hospital HD group, approximately 50% compared to the 40% overall.
Figure 31: Reimbursements for ambulatory dialysis by year for different dialysis modalities
0 €
50.000.000 €
100.000.000 €
150.000.000 €
200.000.000 €
250.000.000 €
300.000.000 €
2003 2004 2005 2006
Transport
Honoraria
Lump sum
0 €
50.000.000 €
100.000.000 €
150.000.000 €
200.000.000 €
250.000.000 €
300.000.000 €
2003 2004 2005 2006
Rest
PD‐Satellite HD
PD‐Hospital HD
HD
PD
Home HD
Satellite HD
Hospital HD

68 Chronic Dialysis in Belgium KCE Reports 124
4.4.2.2 Average reimbursement per patient (prevalent only)
Table 23 gives the average reimbursement for ambulatory dialysis per year for prevalent patients only. Overall, hospital HD is the most expensive with a cost ranging from approximately €42 500 to 44 000 per year. Satellite HD is cheaper with average reimbursements around €33 000. PD average cost per patient ranges from €29 000 to €31 000. Other categories are smaller, and results more difficult to interpret.
It should be stressed that the average reimbursement cost for dialysis per patient in Table 23 is underestimated for reasons explained in the introduction of this section 4.4. At first by 14% because not all patients continue a full year on dialysis because they stop for various reasons, and secondly because prevalent patients spend, on average, more than 60 days in hospital (see 4.4.3) where they still receive dialysis therapy but those data are not included in the ambulatory dialysis reimbursements. As shown in 4.4.3.2 the dialysis during hospital stays amounts for all patients combined to almost €20 million each year.
The increase of the average dialysis expenses for patients from the PD group are related to an improved reimbursement for PD during the study period, as described in chapter 3.
Table 23: Average reimbursement for ambulatory dialysis per year for prevalent patients
2003 2004 2005 2006
Hospital HD 44.098 € 42.472 € 42.686 € 44.320 €
Satellite HD 32.966 € 33.912 € 33.707 € 33.560 €
Home HD 33.611 € 32.788 € 32.663 € 34.002 €
PD 29.131 € 31.339 € 31.612 € 31.501 €
HD 39.257 € 38.513 € 38.689 € 37.506 €
PD-Hospital HD 33.454 € 31.876 € 33.751 € 33.977 €
PD-Satellite HD 42.400 € 44.411 € 39.220 € 39.923 €
Rest 36.407 € 36.351 € 38.412 € 34.886 €
Average 40.652 € 39.584 € 39.627 € 40.354 €
4.4.3 Hospital stays and one-day clinic
The hospital stays and one-day clinic admissions in this section concern all hospitalisations, both in acute and non-acute beds of the patients included in the sample. The year of hospitalisation was defined as the year of discharge. As a result, if for example a patient is transplanted during a given year that hospital stay will be included. If a patient is transferred from an acute to a non-acute bed, the complete hospital stay is taken into account. If should be emphasised that the one-day clinic admissions associated with dialysis are not included in those data. For those the data are presented in 4.4.2. Dialysis costs during a normal hospital stay, however, are included in those data.
This analysis only takes into account the specific reimbursements for medical acts drugs and implants. The so-called ‘per diem prices for hospital stays (ligdagprijs/prix de journée) are not taken into account since these have assumed different forms throughout the years, and are now based, since July 1st 2002, on estimates and a forecast-based provisional rate,75 through the so-called budget of financial means (BFM/BMF, see also chapter 5). In 2006 the average ‘per diem cost’ for the dialysis centres was € 269.44 (source: dialysis questionnaire RIZIV/INAMI, www.riziv.be, also see chapter 5). Therefore, the approximately 600 000 hospital days yearly (see further) correspond to an additional yearly budgetary reimbursement impact of approximately € 170 million. In the calculations we have included this cost as the ‘estimated per-diem’ cost. For the one-day clinic admissions, the day prices (‘forfaits’) were included in the reimbursement analysis.
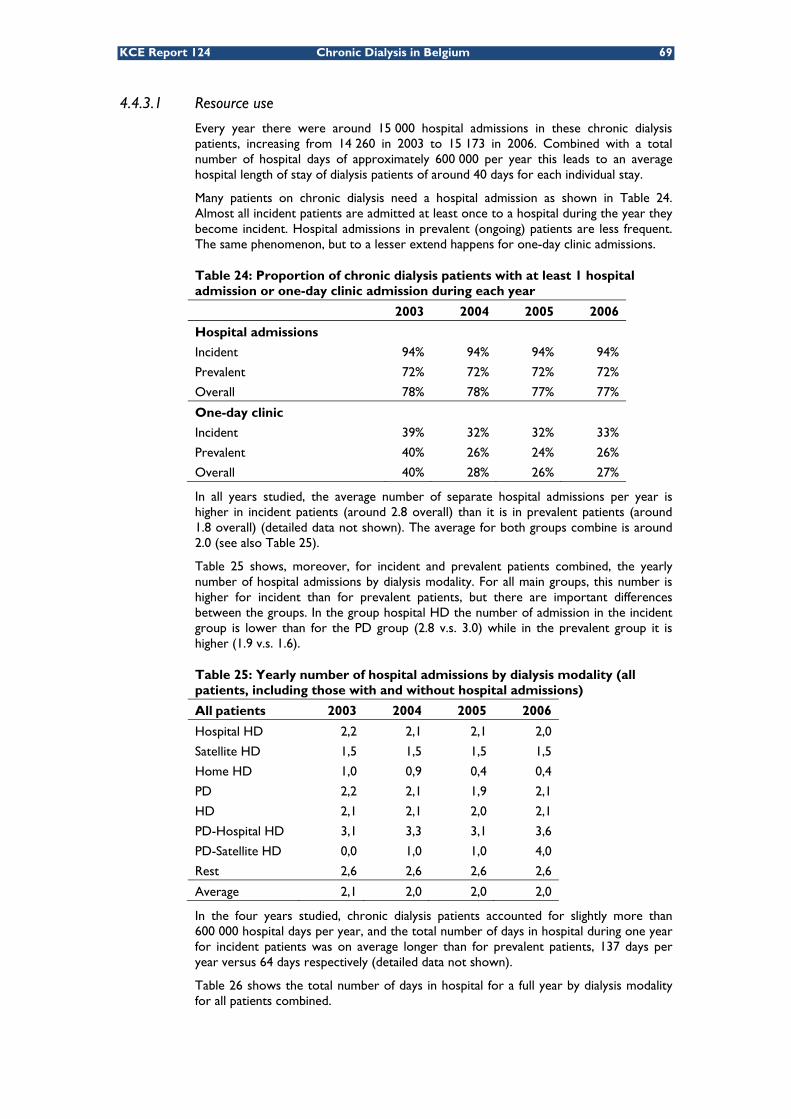
KCE Report 124 Chronic Dialysis in Belgium 69
4.4.3.1 Resource use
Every year there were around 15 000 hospital admissions in these chronic dialysis patients, increasing from 14 260 in 2003 to 15 173 in 2006. Combined with a total number of hospital days of approximately 600 000 per year this leads to an average hospital length of stay of dialysis patients of around 40 days for each individual stay.
Many patients on chronic dialysis need a hospital admission as shown in Table 24. Almost all incident patients are admitted at least once to a hospital during the year they become incident. Hospital admissions in prevalent (ongoing) patients are less frequent. The same phenomenon, but to a lesser extend happens for one-day clinic admissions.
Table 24: Proportion of chronic dialysis patients with at least 1 hospital admission or one-day clinic admission during each year
2003 2004 2005 2006
Hospital admissions
Incident 94% 94% 94% 94%
Prevalent 72% 72% 72% 72%
Overall 78% 78% 77% 77%
One-day clinic
Incident 39% 32% 32% 33%
Prevalent 40% 26% 24% 26%
Overall 40% 28% 26% 27%
In all years studied, the average number of separate hospital admissions per year is higher in incident patients (around 2.8 overall) than it is in prevalent patients (around 1.8 overall) (detailed data not shown). The average for both groups combine is around 2.0 (see also Table 25).
Table 25 shows, moreover, for incident and prevalent patients combined, the yearly number of hospital admissions by dialysis modality. For all main groups, this number is higher for incident than for prevalent patients, but there are important differences between the groups. In the group hospital HD the number of admission in the incident group is lower than for the PD group (2.8 v.s. 3.0) while in the prevalent group it is higher (1.9 v.s. 1.6).
Table 25: Yearly number of hospital admissions by dialysis modality (all patients, including those with and without hospital admissions)
All patients 2003 2004 2005 2006
Hospital HD 2,2 2,1 2,1 2,0
Satellite HD 1,5 1,5 1,5 1,5
Home HD 1,0 0,9 0,4 0,4
PD 2,2 2,1 1,9 2,1
HD 2,1 2,1 2,0 2,1
PD-Hospital HD 3,1 3,3 3,1 3,6
PD-Satellite HD 0,0 1,0 1,0 4,0
Rest 2,6 2,6 2,6 2,6
Average 2,1 2,0 2,0 2,0
In the four years studied, chronic dialysis patients accounted for slightly more than 600 000 hospital days per year, and the total number of days in hospital during one year for incident patients was on average longer than for prevalent patients, 137 days per year versus 64 days respectively (detailed data not shown).
Table 26 shows the total number of days in hospital for a full year by dialysis modality for all patients combined.
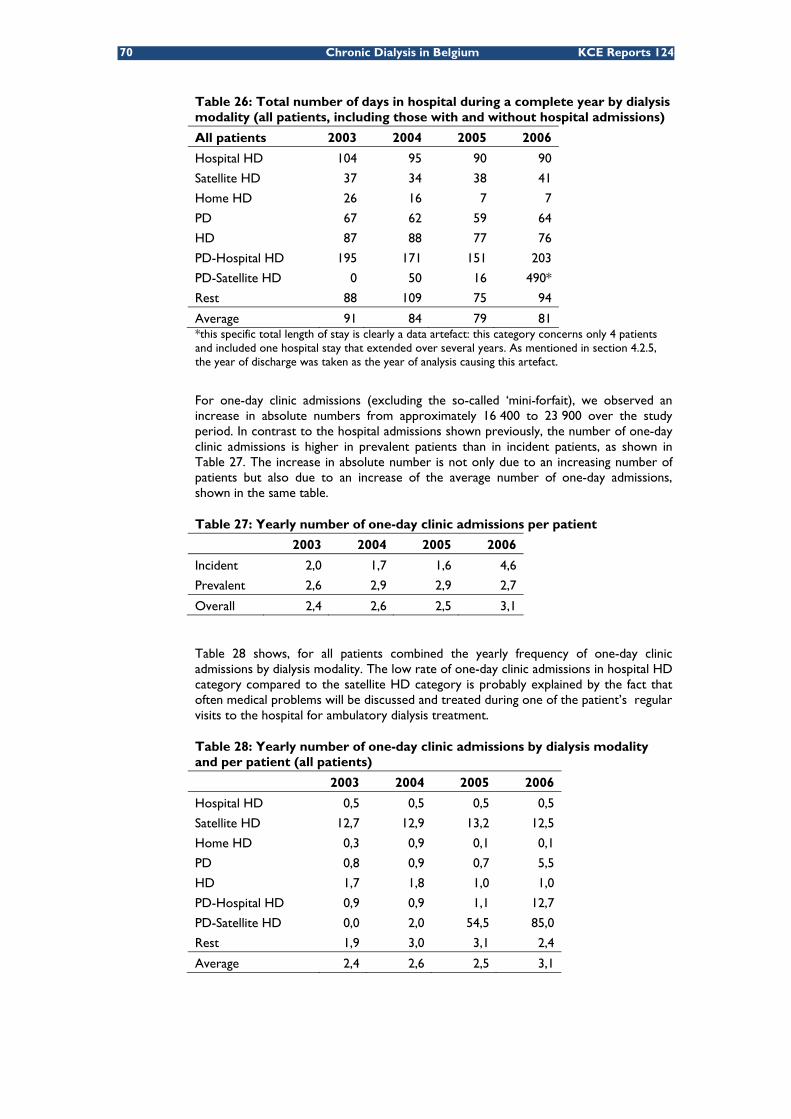
70 Chronic Dialysis in Belgium KCE Reports 124
Table 26: Total number of days in hospital during a complete year by dialysis modality (all patients, including those with and without hospital admissions)
All patients 2003 2004 2005 2006
Hospital HD 104 95 90 90
Satellite HD 37 34 38 41
Home HD 26 16 7 7
PD 67 62 59 64
HD 87 88 77 76
PD-Hospital HD 195 171 151 203
PD-Satellite HD 0 50 16 490*
Rest 88 109 75 94
Average 91 84 79 81 *this specific total length of stay is clearly a data artefact: this category concerns only 4 patients and included one hospital stay that extended over several years. As mentioned in section 4.2.5, the year of discharge was taken as the year of analysis causing this artefact.
For one-day clinic admissions (excluding the so-called ‘mini-forfait), we observed an increase in absolute numbers from approximately 16 400 to 23 900 over the study period. In contrast to the hospital admissions shown previously, the number of one-day clinic admissions is higher in prevalent patients than in incident patients, as shown in Table 27. The increase in absolute number is not only due to an increasing number of patients but also due to an increase of the average number of one-day admissions, shown in the same table.
Table 27: Yearly number of one-day clinic admissions per patient
2003 2004 2005 2006
Incident 2,0 1,7 1,6 4,6
Prevalent 2,6 2,9 2,9 2,7
Overall 2,4 2,6 2,5 3,1
Table 28 shows, for all patients combined the yearly frequency of one-day clinic admissions by dialysis modality. The low rate of one-day clinic admissions in hospital HD category compared to the satellite HD category is probably explained by the fact that often medical problems will be discussed and treated during one of the patient’s regular visits to the hospital for ambulatory dialysis treatment.
Table 28: Yearly number of one-day clinic admissions by dialysis modality and per patient (all patients)
2003 2004 2005 2006
Hospital HD 0,5 0,5 0,5 0,5
Satellite HD 12,7 12,9 13,2 12,5
Home HD 0,3 0,9 0,1 0,1
PD 0,8 0,9 0,7 5,5
HD 1,7 1,8 1,0 1,0
PD-Hospital HD 0,9 0,9 1,1 12,7
PD-Satellite HD 0,0 2,0 54,5 85,0
Rest 1,9 3,0 3,1 2,4
Average 2,4 2,6 2,5 3,1

KCE Report 124 Chronic Dialysis in Belgium 71
4.4.3.2 Overall reimbursements
Figure 32 shows the public imbursement for hospital and one-day care, with an estimated ‘per diem costs’ for inpatient care (see above). Every year, almost €20 million is reimbursed for dialysis during hospital stays in addition to the ambulatory dialysis reimbursements presented in 4.4.2.
Figure 32: Reimbursements for hospital care and one-day clinic per year
4.4.3.3 Average reimbursement per patient (prevalent only)
As shown in Table 29 the prevalent patients in the peripheral dialysis modalities have less expensive hospital and one-day clinic stays than those in the hospital HD dialysis modality category or in mixed categories, probably indicating that the latter indeed correspond to older, frailer and more ill patients. It should be emphasised that the numbers in this table include an estimated per diem hospital cost which was not included in the original reimbursement data.
Table 29: Yearly average reimbursement for hospital care and one-day clinic per year by dialysis modality for prevalent patients (including the estimated per diem cost)
2003 2004 2005 2006
Hospital HD 39.581 € 36.294 € 34.609 € 33.545 €
Satellite HD 22.112 € 22.297 € 23.492 € 23.441 €
Home HD 17.176 € 17.543 € 11.922 € 12.734 €
PD 22.939 € 22.366 € 21.553 € 26.697 €
HD 35.097 € 40.063 € 37.424 € 33.800 €
PD-Hospital HD 51.548 € 61.291 € 51.226 € 66.287 €
PD-Satellite HD 1.365 € 21.308 € 21.920 € 229.641 €
Rest 32.846 € 49.629 € 37.414 € 47.239 €
Average 35.287 € 33.833 € 32.139 € 32.112 €
4.4.4 Ambulatory consultations
The consultations included in this section include all types of medical consultation, with the exclusion of specific dialysis sessions (section 4.4.2) and hospital admissions (section 4.4.3). Overall, about 100 000 ambulatory consultations occurred each year for chronic dialysis patients, slightly increasing from 99 122 in 2003 to 105 961 in 2006.
4.4.4.1 Resource use
More than 90% of chronic dialysis patients had ambulatory consultations reimbursements, and this proportion was rather similar for incident and prevalent patients (detailed data not shown).
0 €
50.000.000 €
100.000.000 €
150.000.000 €
200.000.000 €
250.000.000 €
300.000.000 €
350.000.000 €
2003 2004 2005 2006
Estimated per diem cost
One‐day forfaits
Implants
Medication
Non‐dialysis
Dialysis

72 Chronic Dialysis in Belgium KCE Reports 124
As shown in Table 30, incident patients consult more often than prevalent patients. Overall, the highest frequency for ambulatory consultations per patient are performed for the PD group, as shown in Table 31.
Table 30: Yearly number of ambulatory consultations per patient
2003 2004 2005 2006
Incident 19,4 19,4 18,7 18,0
Prevalent 12,6 13,0 13,0 12,6
Overall 14,6 14,8 14,5 13,9
Table 31: Yearly number of ambulatory consultations by dialysis modality and per patient (all patients)
2003 2004 2005 2006
Hospital HD 13,7 14,2 14,0 13,4
Satellite HD 14,2 14,5 13,7 13,2
Home HD 13,9 12,5 12,2 13,1
PD 21,3 20,8 20,0 19,3
HD 15,1 13,9 13,8 12,7
PD-Hospital HD 18,2 18,5 17,7 14,9
PD-Satellite HD 0,0 0,0 0,0 11,3
Rest 15,2 14,2 14,3 15,0
Average 14,6 14,8 14,5 13,9
4.4.4.2 Overall reimbursements
Figure 33 shows a steady increase of the reimbursements for ambulatory consultations in all patients, from €1.7 million in 2003 to €2.3 million in 2006. This increase is observed for all major categories of dialysis modalities.
Figure 33: Reimbursements for ambulatory consultations by dialysis modality (all patients)
4.4.4.3 Average reimbursement per patient (prevalent only)
Table 32 indicates that the increase of reimbursements is not only due to the slight increase in the number of consultations, but mainly to higher reimbursements per (prevalent) patient.
0 €
500.000 €
1.000.000 €
1.500.000 €
2.000.000 €
2.500.000 €
2003 2004 2005 2006
Rest
PD‐Satellite HD
PD‐Hospital HD
HD
PD
Home HD
Satellite HD
Hospital HD

KCE Report 124 Chronic Dialysis in Belgium 73
Table 32: Yearly average reimbursement of ambulatory consultations per patient by dialysis modality
2003 2004 2005 2006
Hospital HD 203 € 233 € 255 € 265 €
Satellite HD 215 € 251 € 248 € 265 €
Home HD 253 € 231 € 259 € 282 €
PD 373 € 396 € 396 € 405 €
HD 219 € 227 € 251 € 251 €
PD-Hospital HD 291 € 307 € 323 € 322 €
PD-Satellite HD 0 € 0 € 0 € 11 €
Rest 252 € 250 € 244 € 323 €
Average 220 € 250 € 267 € 279 €
4.4.5 Ambulatory medication
Ambulatory medication costs were collected as described in the appendix to this chapter. Reimbursements are described as in previous sections, overall and by prevalent patient and include the deliveries done by public pharmacies in the classes A, B, C, Cs and Cx. Reimbursed dietary products, ambulatory oxygen, contraceptives, diagnostic products and vaccines were excluded.
4.4.5.1 Overall reimbursements
Table 33 shows the yearly reimbursement for ambulatory medication by type of patient, while Table 34 gives the same information by dialysis modality. The yearly reimbursement for ambulatory medication appears to be relatively stable over the study period.
Table 33: Yearly reimbursement for ambulatory medication by type of patient
2003 2004 2005 2006
Incident patients 2.466.031 € 2.174.620 € 2.031.131 € 1.852.168 €
Prevalent patients 5.727.504 € 5.379.873 € 5.619.123 € 6.813.815 €
All patients 8.193.535 € 7.554.493 € 7.650.254 € 8.665.983 €
Table 34: Yearly reimbursement for ambulatory medication by dialysis modality (all patients)
2003 2004 2005 2006
Hospital HD 5.251.205 € 4.577.586 € 4.603.663 € 5.207.473 €
Satellite HD 1.372.944 € 1.258.520 € 1.198.423 € 1.366.477 €
Home HD 26.289 € 17.260 € 13.468 € 22.957 €
PD 818.344 € 876.610 € 941.927 € 1.062.937 €
HD 459.635 € 550.869 € 586.764 € 656.154 €
PD-Hospital HD 149.238 € 140.391 € 181.485 € 181.040 €
PD-Satellite HD 0 € 0 € 1.081 € 1.935 €
Rest 115.879 € 133.257 € 123.444 € 167.010 €
Total 8.193.535 € 7.554.493 € 7.650.254 € 8.665.983 €
4.4.5.2 Average reimbursement per patient (prevalent only)
Table 35 shows the ambulatory drug reimbursement costs in prevalent chronic dialysis for the different dialysis modality groups.

74 Chronic Dialysis in Belgium KCE Reports 124
Table 35: Yearly average reimbursement for ambulatory medication by dialysis modality for prevalent patients
2003 2004 2005 2006
Hospital HD 1.088 € 930 € 931 € 1.084 €
Satellite HD 1.443 € 1.193 € 1.059 € 1.215 €
Home HD 1.323 € 786 € 792 € 1.530 €
PD 1.763 € 1.590 € 1.485 € 1.630 €
HD 942 € 882 € 935 € 1.050 €
PD-Hospital HD 1.580 € 1.151 € 1.200 € 1.321 €
PD-Satellite HD 0 € 0 € 0 € 369 €
Rest 1.267 € 1.140 € 775 € 1.397 €
Total 1.191 € 1.026 € 1.002 € 1.163 €
4.4.6 Venofer® (intravenous iron)
A special case of medication in chronic dialysis is Venofer® (iron sacharose), an iron preparation used for iron supplementation through intravenous delivery, frequently needed in dialysis patients and intended for hospital use only (category HG/UH.).
4.4.6.1 Overall reimbursements
Table 36 shows that use and reimbursement for Venofer mainly occurs in prevalent patients and that over the study period there is overall a modest increase of reimbursements.
Table 36: Yearly reimbursement for Venofer by type of patient
2003 2004 2005 2006
Incident patients 293.562 € 337.076 € 311.894 € 293.996 €
Prevalent patients 1.272.740 € 1.305.424 € 1.378.283 € 1.446.116 €
All patients 1.566.302 € 1.642.499 € 1.690.178 € 1.740.113 €
4.4.6.2 Average reimbursement per patient (prevalent only)
Table 37 indicates that Venofer is mainly used for the HD patients, and almost not in the PD dialysis modality category (defined as 80% of total time in PD). Venofer was indeed not indicated and not reimbursed for PD patients during PD at the time of study, although nowadays it is reimbursed for PD patients as well.
Table 37: Yearly average reimbursement for Venofer by dialysis modality for prevalent patients
2003 2004 2005 2006
Hospital HD 294 € 269 € 270 € 271 €
Satellite HD 271 € 288 € 273 € 283 €
Home HD 213 € 115 € 181 € 103 €
PD 15 € 13 € 10 € 16 €
HD 279 € 285 € 276 € 271 €
PD-Hospital HD 113 € 111 € 178 € 183 €
PD-Satellite HD 0 € 0 € 14 € 11 €
Rest 137 € 202 € 247 € 227 €
Total 265 € 249 € 246 € 247 €

KCE Report 124 Chronic Dialysis in Belgium 75
4.5 OUT-OF-POCKET EXPENSES FOR CHRONIC DIALYSIS PATIENTS: CROSS-SECTIONAL ANALYSIS PER YEAR Compared to reimbursements the official out-of-pocket payments for the patients themselves are relatively small. For the analyses of the global out-of-pocket payments in this section we will combine patients’ co-payments (remgeld/ticket modérateur) and co-insurance with the supplements that can be asked in specific cases.u The same cost categories as in section 4.4 will be used. For the calculation of the out-of-pocket expenses co-payments, co-insurance and supplements were combined.
Overall resource use has been described in section 4.4; therefore, in this section only overall costs and cost per patient will be detailed.
In interpreting these results, however, it should be kept in mind that a number of those patients have special statutes (MAF, OMNIO) that lower the impact of these out-of-pocket payments and also that sickness funds often offer additional financial benefits for those patients. However, it should also kept in mind that the costs listed in this section only include the registered out-of-pocket health care costs related to health care services that are partly reimbursed, and that, because they are not essential for the reimbursement itself, the extent to which these registrations are complete might be heterogeneous. Non-reimbursed items such as over the counter drugs (OTC), supplies, waste disposal etc. are not included in these out-of-pocket costs. Another important cost item not included in this registered expenses are the personal per-diem hospital costs.
4.5.1 Total out-of-pocket expenses for reimbursed health care items
4.5.1.1 Overall expenses
Total out-of-pocket expenses for chronic dialysis patients have increased from €6.1 million in 2003 to €7.6 million in 2006. Figure 34 and Figure 35 show those expenses by dialysis modality category and by age category. Similar to what was shown for reimbursements in Figure 29, the cost by age category closely matches the age distribution.
u Both co-payments and co-insurance are cost-sharing arrangements which require the individual covered to pay part of the cost of care. A co-payment is a fixed fee (flat rate) per item or service; in case of co-insurance the patient pays a fixed proportion of the total cost. In addition to co-payments and co-insurance, patients also pay supplements. Supplements are distinct from co-payments and co-insurance. Supplements can be defined as the difference between the total payments and the convention tariff.

76 Chronic Dialysis in Belgium KCE Reports 124
Figure 34: Total out-of-pocket expenses for reimbursed care by year for different for different dialysis modality categories
Figure 35: Total out-of-pocket expenses for chronic dialysis patients by year for different age categories
4.5.1.2 Average expenses per patient (prevalent only)
With the above data but limiting them to prevalent patients only the average total out-of-pocket cost was calculated. Results are shown in Table 38. No large and consistent differences were observed between the dialysis modalities. In the analysis by age shown in Table 39, the group of prevalent patients aged 45 to 64, consistently had higher out-of-pocket expenses than the other age groups.
Table 38: Yearly total average out-of-pocket expenses per year for prevalent patients by dialysis modality
Dialysis Modality 2003 2004 2005 2006 Hospital HD 868 € 877 € 859 € 904 € Satellite HD 810 € 878 € 864 € 955 € Home HD 833 € 921 € 634 € 698 € PD 885 € 842 € 855 € 897 €
0 €
1.000.000 €
2.000.000 €
3.000.000 €
4.000.000 €
5.000.000 €
6.000.000 €
7.000.000 €
8.000.000 €
2003 2004 2005 2006
Rest
PD‐Satellite HD
PD‐Hospital HD
HD
PD
Home HD
Satellite HD
Hospital HD
0 €
1.000.000 €
2.000.000 €
3.000.000 €
4.000.000 €
5.000.000 €
6.000.000 €
7.000.000 €
8.000.000 €
2003 2004 2005 2006
≥ 75
65‐74
45‐64
18‐44
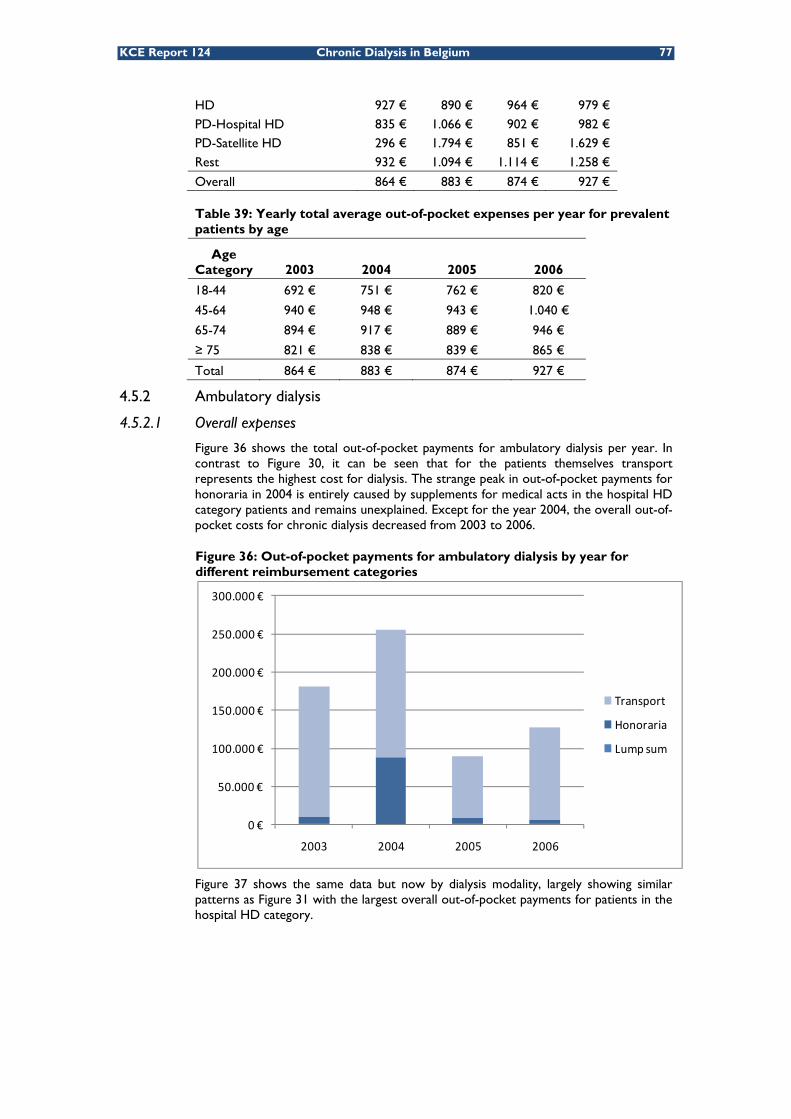
KCE Report 124 Chronic Dialysis in Belgium 77
HD 927 € 890 € 964 € 979 € PD-Hospital HD 835 € 1.066 € 902 € 982 € PD-Satellite HD 296 € 1.794 € 851 € 1.629 € Rest 932 € 1.094 € 1.114 € 1.258 €
Overall 864 € 883 € 874 € 927 €
Table 39: Yearly total average out-of-pocket expenses per year for prevalent patients by age
Age Category 2003 2004 2005 2006
18-44 692 € 751 € 762 € 820 €
45-64 940 € 948 € 943 € 1.040 €
65-74 894 € 917 € 889 € 946 €
≥ 75 821 € 838 € 839 € 865 €
Total 864 € 883 € 874 € 927 €
4.5.2 Ambulatory dialysis
4.5.2.1 Overall expenses
Figure 36 shows the total out-of-pocket payments for ambulatory dialysis per year. In contrast to Figure 30, it can be seen that for the patients themselves transport represents the highest cost for dialysis. The strange peak in out-of-pocket payments for honoraria in 2004 is entirely caused by supplements for medical acts in the hospital HD category patients and remains unexplained. Except for the year 2004, the overall out-of-pocket costs for chronic dialysis decreased from 2003 to 2006.
Figure 36: Out-of-pocket payments for ambulatory dialysis by year for different reimbursement categories
Figure 37 shows the same data but now by dialysis modality, largely showing similar patterns as Figure 31 with the largest overall out-of-pocket payments for patients in the hospital HD category.
0 €
50.000 €
100.000 €
150.000 €
200.000 €
250.000 €
300.000 €
2003 2004 2005 2006
Transport
Honoraria
Lump sum
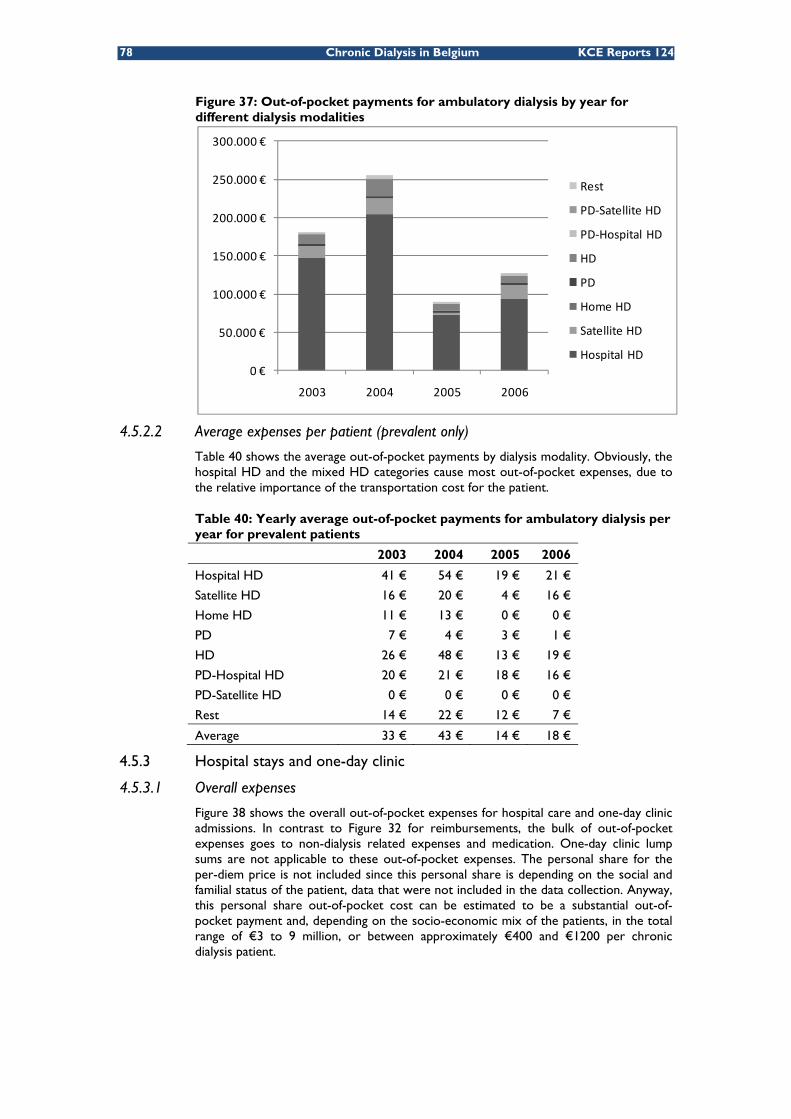
78 Chronic Dialysis in Belgium KCE Reports 124
Figure 37: Out-of-pocket payments for ambulatory dialysis by year for different dialysis modalities
4.5.2.2 Average expenses per patient (prevalent only)
Table 40 shows the average out-of-pocket payments by dialysis modality. Obviously, the hospital HD and the mixed HD categories cause most out-of-pocket expenses, due to the relative importance of the transportation cost for the patient.
Table 40: Yearly average out-of-pocket payments for ambulatory dialysis per year for prevalent patients
2003 2004 2005 2006
Hospital HD 41 € 54 € 19 € 21 €
Satellite HD 16 € 20 € 4 € 16 €
Home HD 11 € 13 € 0 € 0 €
PD 7 € 4 € 3 € 1 €
HD 26 € 48 € 13 € 19 €
PD-Hospital HD 20 € 21 € 18 € 16 €
PD-Satellite HD 0 € 0 € 0 € 0 €
Rest 14 € 22 € 12 € 7 €
Average 33 € 43 € 14 € 18 €
4.5.3 Hospital stays and one-day clinic
4.5.3.1 Overall expenses
Figure 38 shows the overall out-of-pocket expenses for hospital care and one-day clinic admissions. In contrast to Figure 32 for reimbursements, the bulk of out-of-pocket expenses goes to non-dialysis related expenses and medication. One-day clinic lump sums are not applicable to these out-of-pocket expenses. The personal share for the per-diem price is not included since this personal share is depending on the social and familial status of the patient, data that were not included in the data collection. Anyway, this personal share out-of-pocket cost can be estimated to be a substantial out-of-pocket payment and, depending on the socio-economic mix of the patients, in the total range of €3 to 9 million, or between approximately €400 and €1200 per chronic dialysis patient.
0 €
50.000 €
100.000 €
150.000 €
200.000 €
250.000 €
300.000 €
2003 2004 2005 2006
Rest
PD‐Satellite HD
PD‐Hospital HD
HD
PD
Home HD
Satellite HD
Hospital HD
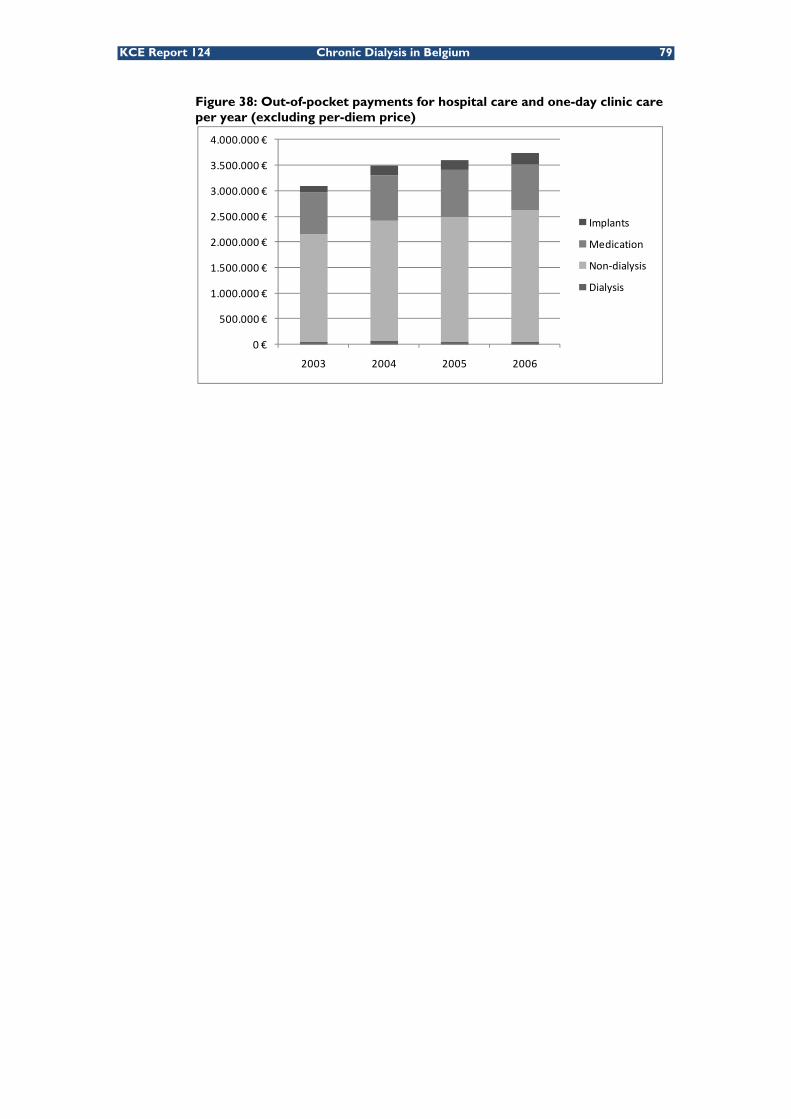
KCE Report 124 Chronic Dialysis in Belgium 79
Figure 38: Out-of-pocket payments for hospital care and one-day clinic care per year (excluding per-diem price)
0 €
500.000 €
1.000.000 €
1.500.000 €
2.000.000 €
2.500.000 €
3.000.000 €
3.500.000 €
4.000.000 €
2003 2004 2005 2006
Implants
Medication
Non‐dialysis
Dialysis

80 Chronic Dialysis in Belgium KCE Reports 124
4.5.3.2 Average expenses per patient (prevalent only)
The figures in Table 41 do not include, as described above, the out-of-pocket payments for the personal share in hospital stays. Except for these costs, the yearly average out-of-pocket payments for hospital care and one-day clinic care per patient appear rather homogeneous for the most important dialysis modality categories. Out-of-pocket expenses for the PD group, however, appear to be consistently lower than for the other groups. For satellite HD, this is less clear and not consistent over the studies years.
Table 41: Yearly average out-of-pocket payments for hospital care and one-day clinic for prevalent patients (excluding ‘per diem’ payments)
2003 2004 2005 2006
Hospital HD 449 € 429 € 431 € 445 €
Satellite HD 429 € 456 € 449 € 499 €
Home HD 331 € 531 € 280 € 286 €
PD 400 € 333 € 358 € 352 €
HD 514 € 445 € 523 € 510 €
PD-Hospital HD 354 € 522 € 403 € 487 €
PD-Satellite HD 296 € 1.736 € 764 € 806 €
Rest 528 € 680 € 673 € 756 €
Average 446 € 434 € 439 € 458 €
4.5.4 Ambulatory consultations
4.5.4.1 Overall expenses
Figure 39: Out-of-pocket payments for ambulatory consultations by dialysis modality per year (all patients)
0 €
100.000 €
200.000 €
300.000 €
400.000 €
500.000 €
600.000 €
700.000 €
2003 2004 2005 2006
Rest
PD‐Satellite HD
PD‐Hospital HD
HD
PD
Home HD
Satellite HD
Hospital HD
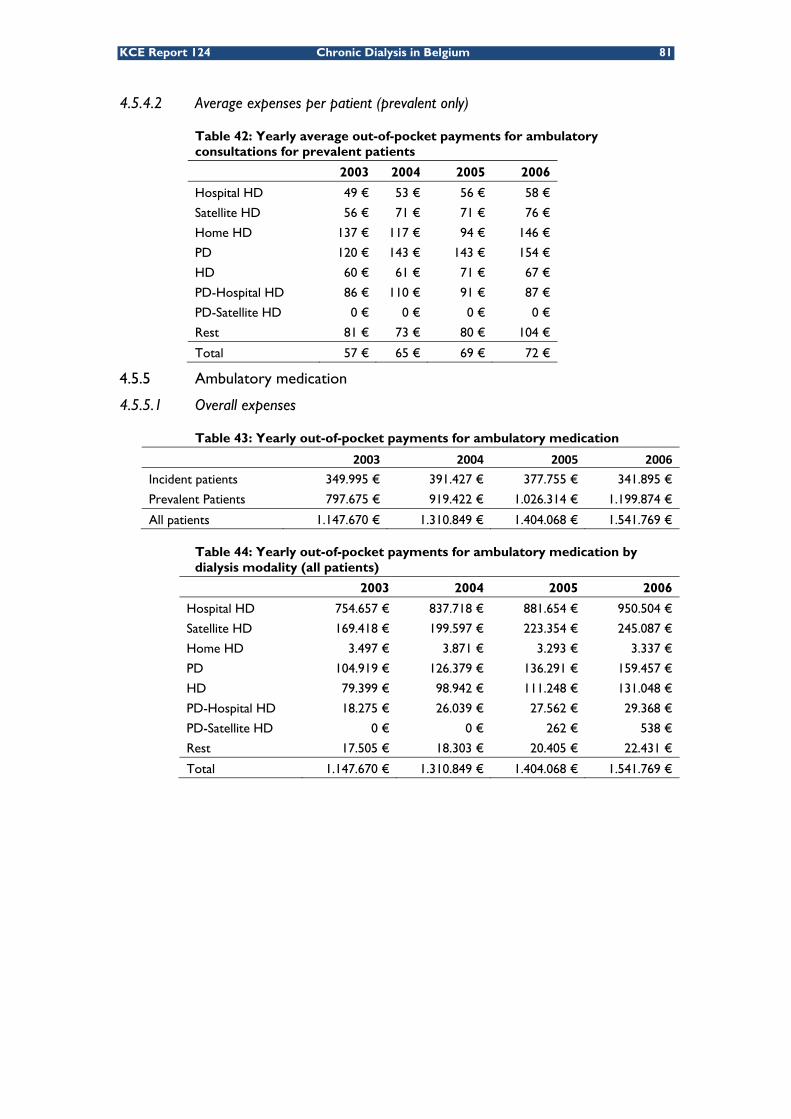
KCE Report 124 Chronic Dialysis in Belgium 81
4.5.4.2 Average expenses per patient (prevalent only)
Table 42: Yearly average out-of-pocket payments for ambulatory consultations for prevalent patients
2003 2004 2005 2006
Hospital HD 49 € 53 € 56 € 58 €
Satellite HD 56 € 71 € 71 € 76 €
Home HD 137 € 117 € 94 € 146 €
PD 120 € 143 € 143 € 154 €
HD 60 € 61 € 71 € 67 €
PD-Hospital HD 86 € 110 € 91 € 87 €
PD-Satellite HD 0 € 0 € 0 € 0 €
Rest 81 € 73 € 80 € 104 €
Total 57 € 65 € 69 € 72 €
4.5.5 Ambulatory medication
4.5.5.1 Overall expenses
Table 43: Yearly out-of-pocket payments for ambulatory medication
2003 2004 2005 2006
Incident patients 349.995 € 391.427 € 377.755 € 341.895 €
Prevalent Patients 797.675 € 919.422 € 1.026.314 € 1.199.874 €
All patients 1.147.670 € 1.310.849 € 1.404.068 € 1.541.769 €
Table 44: Yearly out-of-pocket payments for ambulatory medication by dialysis modality (all patients)
2003 2004 2005 2006
Hospital HD 754.657 € 837.718 € 881.654 € 950.504 €
Satellite HD 169.418 € 199.597 € 223.354 € 245.087 €
Home HD 3.497 € 3.871 € 3.293 € 3.337 €
PD 104.919 € 126.379 € 136.291 € 159.457 €
HD 79.399 € 98.942 € 111.248 € 131.048 €
PD-Hospital HD 18.275 € 26.039 € 27.562 € 29.368 €
PD-Satellite HD 0 € 0 € 262 € 538 €
Rest 17.505 € 18.303 € 20.405 € 22.431 €
Total 1.147.670 € 1.310.849 € 1.404.068 € 1.541.769 €

82 Chronic Dialysis in Belgium KCE Reports 124
4.5.5.2 Average expenses per patient (prevalent only)
Table 45: Yearly out-of-pocket payments for ambulatory medication by dialysis modality for prevalent patients
2003 2004 2005 2006
Hospital HD 163 € 171 € 178 € 199 €
Satellite HD 167 € 181 € 195 € 215 €
Home HD 164 € 191 € 194 € 222 €
PD 192 € 209 € 201 € 225 €
HD 166 € 165 € 179 € 205 €
PD-Hospital HD 174 € 207 € 204 € 214 €
PD-Satellite HD 0 € 0 € 0 € 82 €
Rest 182 € 158 € 164 € 182 €
Total 166 € 175 € 183 € 205 €
4.6 PUBLIC REIMBURSEMENTS FOR CHRONIC DIALYSIS PATIENTS: LONGITUDINAL ANALYSIS FOR INCIDENT PATIENTS The objective of this last section is to illustrate the evolution of expenses in six-month periods before and after starting dialysis. In this analysis, all the incident patients since 2003 and until the end of 2006 are included (see Table 19). Expenses incurred up to a year before dialysis’ start were taken into account.
As shown in section 4.3.1, the number of incident patients over the 4 years was 7935. However, we do not have information on all of these patients for the whole duration of the follow-up period. Table 46 shows the number of patients by age and period of available reimbursement data (for a full or partial period of 6 months) for analysis
Table 46: Number of patients by age and period (months) of available reimbursement data for analysis
Age category
-12 to -6
-6 to Start
Start to +6
+6 to +12
+12 to +18
+18 to +24
+24 to +30
+30 to +36
+36 to +42
+42 to +48
18-44 612 667 700 549 423 323 232 158 83 48
45-64 1943 2048 2107 1547 1173 895 650 431 241 111
65-74 2107 2184 2207 1547 1183 904 645 448 253 114
≥ 75 2849 2905 2921 1949 1411 1015 679 436 231 97
Total 7511 7804 7935 5592 4190 3137 2206 1473 808 370
4.6.1 Overall reimbursements
The same reimbursement categories have been included as in section 4.4: ambulatory dialysis, hospital stays and one-day clinic but excluding the per diem cost (ligdagprijs/prix de journée), ambulatory consultations and ambulatory medication. Figure 40 shows the total reimbursements for those categories in relation to the start of chronic dialysis. Reimbursements are for six-month periods to improve the granularity of the results. It should be noted however, that this figure only concerns total reimbursements for all surviving patients on dialysis. Therefore, the apparent important decrease in the consecutive six-month periods after the onset of dialysis is artificial since many patients either died or were censored during the study. For more relevant information on the average expenses per patient see Figure 41.

KCE Report 124 Chronic Dialysis in Belgium 83
Figure 40: Six-monthly total reimbursements for incident and surviving patients in relation to start of chronic dialysis treatment (in months)
4.6.2 Average reimbursement per patient
Table 47 shows the six-monthly average reimbursement for incident patients in relation to the start of dialysis. As expected, a sharp peak is seen at the beginning of dialysis. The reimbursement cost for patients on chronic Hospital HD show a less outspoken peak with a more steady reimbursement profile afterwards. This could be related to the relatively old age and high mortality in those patients and who, because of death, spend considerably less than 6 months on average on chronic dialysis. For a better visual presentation the overall data are also presented in Figure 41.
Table 47: Six-monthly average reimbursements for incident patients in relation to the start of dialysis (in months)
0 €
50.000.000 €
100.000.000 €
150.000.000 €
200.000.000 €
250.000.000 €
300.000.000 €
Rest
PD‐Satellite HD
PD‐Hospital HD
HD
PD
Home HD
Satellite HD
Hospital HD
‐12 to ‐6
‐6 to Start
Start to +6
+6 to +12
+12 to +18
+18 to +24
+24 to +30
+30 to +36
+36 to +42
+42 to +48
Hospital HD 2.962 € 6.664 € 38.779 € 39.838 € 40.188 € 40.043 € 38.511 € 36.659 € 34.332 € 26.137 €Satellite HD 2.512 € 4.766 € 27.944 € 23.169 € 23.223 € 22.436 € 22.864 € 20.589 € 18.934 € 13.858 €Home HD 2.186 € 3.261 € 29.924 € 22.114 € 22.490 € 25.414 € 20.098 € 23.333 € 18.270 € 17.995 €PD 2.652 € 4.603 € 23.466 € 19.970 € 20.691 € 20.505 € 20.243 € 16.801 € 17.359 € 12.248 €HD 2.543 € 5.245 € 38.786 € 31.283 € 29.260 € 28.631 € 28.981 € 28.007 € 24.199 € 16.466 €PD‐Hospital HD 3.078 € 5.408 € 28.405 € 25.504 € 27.519 € 30.839 € 32.965 € 28.598 € 25.345 € 16.920 €PD‐Satellite HD 1.591 € 6.306 € 30.665 € 31.003 € 26.594 € 25.057 €Rest 2.762 € 6.230 € 32.450 € 26.913 € 26.784 € 27.922 € 26.879 € 26.130 € 25.014 € 14.561 €Total 2.850 € 6.112 € 35.754 € 33.702 € 33.734 € 33.326 € 32.348 € 30.099 € 28.051 € 21.018 €

84 Chronic Dialysis in Belgium KCE Reports 124
Figure 41: Six-monthly average reimbursements for incident patients in relation to the start of dialysis (in months)
4.7 OVERVIEW AND CONCLUSIONS For this analysis of the daily practice of chronic dialysis in Belgium over the years 2003 till 2006, we divided ESRD patients on chronic dialysis in eight ‘dialysis modality categories’ based on an arbitrary threshold of 80% of the use of specific dialysis modality during the full study period. Therefore, in all the groups, patients sometimes switched from one dialysis mode to another. However, this 80% of a specific modality was seen as a form of ‘intention to treat’ analysis, because it can be supposed that patients having 80% of their dialysis with a specific modality were indeed intended to use that modality as the main method for chronic dialysis.
We have presented the data in detail for the eight categories but we decided to focus the description and also the discussion on the four largest groups since the other groups were often too small for meaningful interpretation. Those four groups are the hospital HD, satellite HD, the general HD group (mixed hospital and satellite HD but neither of them more than 80% of the total period) and the PD group. As shown in Table 1 the four other groups are relatively small.
4.7.1 Patients
At the start of the year 2003, 4 807 patients were on chronic dialysis treatment. During the four subsequent years another 7 935 patients started chronic dialysis treatment. The proportion of males in those incident cases was higher (around 60%) than in the prevalent cases (53%).
The vast majority of patients were on hospital HD (68%), while 13% were on satellite HD and 9% on PD. An additional 7% were also for more than 80% on HD, but partly in hospital and partly in satellite (the ‘HD group’).
Patients on chronic dialysis in Belgium are relatively old in comparison with some other countries. Two third of the dialysis population is aged 65 and above, and almost 40% are aged 75 and over. During the four years of study the proportion of patients aged 75 and above increased from 35% to 41%.
The choice of the main dialysis modality appears to be influenced by age and gender, with younger patients relying more on PD and women more on hospital HD.
Each year, approximately 4% of dialysis patients in this study (mainly prevalent patients) received a kidney transplant, while about 20% stopped dialysis for other reasons, mainly death. As explained in 4.3.4 the transplant rate appears to be slightly underestimated in those data.
0 €
5.000 €
10.000 €
15.000 €
20.000 €
25.000 €
30.000 €
35.000 €
40.000 €
‐12 to ‐6
‐6 to Start
Start to +6
+6 to +12
+12 to +18
+18 to +24
+24 to +30
+30 to +36
+36 to +42
+42 to +48

KCE Report 124 Chronic Dialysis in Belgium 85
The transplant and mortality rates are very different across main dialysis modalities with more people on PD receiving a kidney transplant and more people on hospital HD dying. However, this observation cannot be interpreted as causal, but is mainly due to an important confounding by indication: patients start on a specific dialysis modality not only because of choice, but also dependent on their physical condition.
Approximately 60% of patients included in this study survived beyond the end of 2006, but these patients were a mix of prevalent patients at baseline and incident patients that started dialysis at some moment during the four years. The four-year survival in patients that became incident during the study was on average less than 40%. Further survival analyses showed that survival was very much age dependent and to a lesser extent gender dependent, but most importantly depended on main dialysis modality. Patients on hospital HD had a four-year survival of slightly more than 20% while the survival in the PD, the mixed HD and especially in the satellite HD group was markedly better. Again, this should not be seen as a causal relationship, since the available observational data did not allow for an adequate control for confounders. The most plausible explanation is again confounding by indication leading the more elderly and most severe patients to hospital HD.
4.7.2 Expenses for the public payer (NIHDI)
A similar situation of confounding by indication is found in the cost data. We detailed both the overall expenses and the expenses per patient by calendar year. For the expenses per patients we only used those patients who were prevalent during that same calendar year because incident patients actually started therapy, on average, in the middle of the year only, making overall averages meaningless and incomparable.
The total NIHDI reimbursements for patients in this study on chronic dialysis went from €386 million in 2003 to more than €450 million in 2006. Looking at the average reimbursement per patient (an analysis done for prevalent patients only for reasons explained before) it appears that hospital HD is overall the most expensive dialysis modality from the perspective of the NIHDI, while patients on alternative dialysis modalities such as satellite HD or PD but also home HD costs less on total patient reimbursements. Again, interpretation of these data is limited by the observational nature of the registry without much possibility to control for confounders.
We also studied the detailed medical expenses in four mutually exclusive domains: ambulatory dialysis expenses, expenses for hospital care and one-day clinic, ambulatory consultations and ambulatory medication. Obviously, those patients also incur other medical expenses grouped in a rest category. In Figure 42 the distribution of those different expense domains is given. Pure NIHDI reimbursements for the therapy itself, ambulatory dialysis, is the largest part with almost 60% of expenses. However, hospital and one-day clinic expenses come second (30%), but this is without the inclusion of the former per-diem price of hospital stays since those are not paid through NIHDI resources but through the Budget of Financial Means (BFM/BMF) directly from the Federal Public Service (FPS) of Health. Inclusion of those expenses would add an additional 40% to the total cost.
Other expenses, ambulatory consultations and ambulatory medication are rather marginal, and an additional 9% is spent on other health care domains.

86 Chronic Dialysis in Belgium KCE Reports 124
Figure 42: Distribution of NIHDI reimbursements
4.7.3 Out-of-pocket expenses for the patient
For the analyses of the global out-of-pocket payments in this section we combined the co-payments (remgeld/ticket modérateur) with the supplements that can be demanded in specific cases. The same cost categories as before were used.
Compared to reimbursements from the public payer, the expenses for the patient appear at first glance to be small. However, we should bear in mind that many of their real expenses are not included, mainly the personal ‘hotel’ cost for hospital stays and the over-the-counter (OTC) medication. It should also be remembered that the costs listed in this section only included out-of-pocket costs that are partly reimbursed by NIHDI. Non-reimbursed items such as some supplies, waste disposal etc. are not included in these out-of-pocket costs.
On the other hand, the different statutes for patients such as MAF and OMNIO, which in practice lower the impact of these out-of-pocket payments, and also sickness funds that often offer additional financial benefits for their members could not be taken into account in this analysis.
Given these limitations, the registered out-of-pocket expenses for patients overall rose from €6.1 million in 2003 to €7.6 million in 2006. Considering cost per (prevalent) patient no large and consistent differences were observed between the different dialysis modalities. However, the group of prevalent patients aged 45 to 64, consistently had higher out-of-pocket expenses than the other age groups.
The distribution of these expenses, for the same cost domains as before are given in Figure 43. This distribution is markedly different from the distribution of the reimbursement expenses shown in Figure 42. For the patient, half of the out-of-pocket expenses are for hospital care and one-day clinic care, even disregarding the personal contribution for the per-diem hospital cost. Ambulatory medication (19%) and other medical costs (21%) come next. The ambulatory dialysis itself is almost cost-free for the patient as the main burden is paid for by the public payer.
Ambulatory Dialysis
Hospital and one‐day (without per‐diem cost)
Ambulatory Consultations
Ambulatory Medication
Other

KCE Report 124 Chronic Dialysis in Belgium 87
Figure 43: Distribution of patient out-of-pocket expenses
4.7.4 Expenses before and after starting dialysis
We analysed the reimbursement expenses before and after starting dialysis in all 7 935 incident patients since 2003 and until the end of 2006.
The six-monthly reimbursements show an increase in the six months before starting dialysis, with a high peak during the 6 months following the initiation of dialysis and gradual decline thereafter (see Table 47). There were some marked differences between the average costs for patient in the different dialysis modality groups but, again, proving a causal relation is impossible with the observational registry data.
Key points
• Survival of chronic dialysis patients is low. In our study, the four-year survival was on average less than 40%. This survival was worse for hospital HD and better for PD and satellite HD. However, this observation is most likely due to inverse causation.
• Between 2003 and 2006, total NIHDI reimbursements for all health care for those patients rose from €386 million to more than €450 million (without per-diem hospital costs).
• Considering these total NIHDI reimbursements, hospital HD is overall the most expensive dialysis modality. Total reimbursements for patients on peripheral dialysis modalities such as satellite or home HD and PD are markedly lower.
• For the pure NIHDI reimbursements, ambulatory dialysis is responsible for 60% of expenses. Hospital and one-day clinics come second with 30%. However, inclusion of the per-diem price would add an additional 40% on the total reimbursement expenses.
• Patient out-of-pocket expenses are difficult to estimate with precision since they are influenced by income, statute, and additional financial benefits from sickness funds. Moreover, per-diem hospital prices and some other expenses such as over the counter drugs are not included in the registration. However, the patient’s out-of-pocket expenses directly linked to partly reimbursed health care rose from €6.1 million in 2003 to €7.6 million in 2006.
• For the patient out-of-pocket expenses no important or consistent differences between dialysis modalities were observed. However, the patients aged 45-64 consistently incurred higher out-of-pocket expenses.
• Overall health care reimbursement expenses start to rise in the months preceding the onset of dialysis, reach a peak during the months after dialysis initiation and show a slow decrease afterwards.
Ambulatory Dialysis
Hospital and one‐day (without per‐diem cost)
Ambulatory Consultations
Ambulatory Medication
Other

88 Chronic Dialysis in Belgium KCE Reports 124
5 THE COSTS AND REVENUES OF DIFFERENT DIALYSIS MODALITIES IN BELGIUM FROM THE HOSPITAL PERSPECTIVE
5.1 INTRODUCTION To assess the extent to which the revenues generated by different dialysis modalities fit the costs from the perspective of the hospital, the costs of the different dialysis modalities need to be calculated.
This chapter contains two types of analysis:
• an analysis of the costs of hospital haemodialysis (hospital HD), satellite HD and peritoneal dialysis (PD) from the perspective of the hospital;
• a simulation of the costs and revenues for a hospital of an ‘average’ dialysis programme with 100 patients, as a function of the proportion of use of ‘alternative’ dialysis modalities (PD and satellite HD).v
Both analyses are performed from a purely financial perspective. As each of the other chapters in this report, this chapter contributes only some pieces to the complex dialysis policy puzzle. It should therefore not be read on its own, ignoring the other pieces presented in this report.
5.2 COSTS OF HOSPITAL HD, SATELLITE HD AND PD
5.2.1 Methods
The following cost components were included in the analysis: human resources (medical, paramedical and technical staff), medical equipment, consumables, overhead costs and other costs such as maintenance contracts. Where relevant, a distinction is made between satellite HD, hospital HD and PD.
A traditional costing approach was used, whereby costs that could be directly attributed to dialysis modalities were allocated directly and indirect costs were allocated by means of appropriate cost drivers. An appropriate cost driver for the indirect cost “personnel administration”, for instance, is the number of full-time equivalents (FTEs) needed for an activity. The personnel administration cost per FTE (cost per unit) is obtained by dividing the total cost of personnel administration in a hospital by the total number of FTEs in that hospital. To allocate the costs of personnel administration to HD dialysis sessions or PD dialysis weeks, the number of FTEs needed per HD dialysis session or per PD week is multiplied by the personnel administration cost per FTE.
For each cost component, the volume of resource use and the unit cost of the resource was estimated. Different sources were used: data from a hospital survey performed by KCE for this specific purpose, results from other published surveys such as the ORPADTw survey and data from the NIHDI dialysis survey 2004. The NIHDI dialysis survey 2004 contains, in contrast to the later surveys, data on dialysis centres’ human resource use. More specifically, this survey collected information on the number of FTEs nephrologists, specialists internal medicine, nurses and technicians.
v The number of patients in the programme was chosen to facilitate the interpretation of the results; i.e.
the number of patients on an alternative dialysis modality equals the proportion of patients in the total programme if the total number of patients is 100. Home HD is a very small proportion in the total dialysis population. Because of insufficient data on the costs of home HD (see infra), home HD is ignored in this analysis.
w ORPADT is the organisation of paramedical personnel of the dialysis and transplantation centres (Organisatie van het Paramedisch Personeel der Dialyse- en Transplantatiecentra).
KCE Report 124 Chronic Dialysis in Belgium 89
The total cost per HD session and per PD week was obtained by first calculating the total cost per resource item (volume X unit cost) per session or per week and then adding up all these costs. For PD, the costs of continuous ambulatory peritoneal dialysis (CAPD) and automated peritoneal dialysis (APD) as reported by the dialysis centres in the hospital survey were added and divided by the total number of dialysis weeks to obtain a cost per week of PD. The resource use data were not questioned separately for the two PD types. It was therefore not possible to calculate the difference in costs between CAPD and APD.
Based on the cost per HD session or per PD week, the cost per patient year could be calculated by multiplying the cost per HD session with 156 (52 weeks X 3 sessions per weekx) and the cost per week of PD by 52.
It is important to note that this traditional costing approach has some important limitations. First, this approach does not correct for potential inefficiencies in resource use. It assumes that the resources are currently used efficiently, i.e. without excess capacity or waste of resources. Validation of this hypothesis was impossible within the time constraints of this study. Second, for the application of this costing approach we had to rely on the responses of hospital accountants to our cost survey, which had to work in collaboration with the nephrologists of their hospital for some parts of the survey. The data provided are, after some checks and clarifications asked, assumed to be reliable and correct. Experts in cost analysis believe, however, that responses to surveys are rarely completely reliable and comparable between respondents because respondents are not always completely sure about which data are asked in particular. Because of the anonymous nature of the survey –on request of the dialysis centres- we could not invite respondents for a common discussion about the data. Third, the dialysis centres responding to the survey were not necessarily representative for all dialysis centres in Belgium, as in more than half of the centres physicians are paid a salary, while in most Belgian dialysis centres physicians are working privately.
Alternative cost calculation methods, such as Activity Based Costing and time driven costing, would give more accurate cost estimates. Each of these systems gives more details on the cost structure and on the actual time and resource use. Their application in health care is difficult –though probably not impossible- for a number of reasons. First, these cost calculation methods require a high level of openness from the hospital management and the providers to share information on prices paid by the hospitals for pharmaceutical products, equipment and devices. This has been proven difficult in the Belgian health care sector. Second, the success of the application of these cost calculation methods depends on the willingness of the hospital management and providers to allow researchers to collect resource use data on the floor during clinical activities.
5.2.1.1 Hospital survey
A cost survey was sent to the medical directors and the head of the nephrology department of all hospitals in Belgium with a dialysis centre. The questionnaires were sent by regular mail and by e-mail on 16/10/2008. The initial deadline for returning the questionnaires was 7/11/2009. On the request of several centres the deadline was extended with two weeks. Centres were informed about the deadline extension on 24/10/2008. The centres were asked to send their responses to a trusted third party, external to the KCE. The trusted third party (TTP) delivered the anonymized individual responses to the KCE. Respondents received a cost compensation of €200 for their participation. The full questionnaire is presented in the appendix to chapter 5.
The main source of information was the hospital accountancy of 2006. Data were obtained for human resources costs, equipment costs, costs of consumables, transportation costs and overhead costs. Where possible, the aggregated results of the survey were cross-checked with other sources, such as the NIHDI dialysis survey and the ORPADT survey.
x HD treatment consists typically of 3 session of approximately 4 hours per week.

90 Chronic Dialysis in Belgium KCE Reports 124
If national data, or data based on more observations than obtained from our hospital survey, existed on specific cost items (e.g. on the number of nurse FTEs per patient), these data were used in the cost analysis. All cost components and within these the different resource items and the sources for their unit costs and volumes are presented in a table in the appendix to chapter 5. This table also presents the mean value, standard deviation and, where applicable, the probability distribution of all input variables used in the cost simulations. These input variables are further described in paragraphs 5.2.1.3 to 0.
Eight questionnaires were returned to the trusted third party, containing data from the complete dialysis programmes in 6 hospitals (with data for hospital HD, satellite HD and PD), one satellite HD centre (with data for satellite HD only) and one PD programme. Five of the six hospitals with data on all dialysis types reported to have a remote satellite dialysis unit. Three of them also provide satellite HD in hospital. In 3 of the 8 responding centres doctors work privately, in the 5 remaining centres doctors receive a salary. The costs of home HD are not calculated in this chapter because insufficient data were obtained from the survey on this dialysis modality.
5.2.1.2 Accounting for variability and uncertainty in the cost analysis
Due to the low response rate the results on all variables show relatively large variability. Performing a cost analysis using only the mean observed data would not provide reliable results. To account for uncertainty and variability in unit costs and volumes of resource use between dialysis centres, each variable in the cost analysis for which more than 3 observations (responses) were available was re-defined by a probability distribution. For variables in the cost analysis for which only 2 or 3 observations were available, the average of the reported figures was used because in case of so few observations, any fitted probability distribution becomes unreliable. If only one hospital reported a specific cost item under equipment, consumables or overhead costs, this cost was added to that hospital’s “other costs”.
A complete overview of the cost items included in the analysis, their mean unit cost and volume, distributions and parameters of the distributions is provided in a table in the appendix to chapter 5.
Using the distributions of each of the variables in the cost analysis, the expected distribution of the total costs per HD session or per PD week could be simulated. For this simulation 5000 Monte Carlo simulations were performed using @Risk software. @Risk is an add-in for Microsoft® Excel used for economic modelling and decision-making under uncertainty. y The Monte Carlo simulation procedure implies random draws from each of the distributions included in the analysis and a re-calculation at each draw of the total cost per HD session or per PD week. At the same time, the Monte Carlo simulation can also calculate at each draw the costs of each of the cost components (human resources, equipment, consumables, overhead costs and other costs). The result is 5000 estimates of the total costs and each of the cost components per HD session and per PD week. Based on these estimates the distribution of the total costs estimates, as well as of different cost components can be defined.
5.2.1.3 Human resources
Human resources costs for dialysis include the costs of medical, nursing, technical and administrative staff and dieticians. For the calculation of human resources costs per dialysis session or week, information is needed for each staff category working for the ambulatory dialysis programme on the number of FTEs, the division of time between different dialysis modalities and the cost per FTE. Combined with information on the number of dialysis sessions or weeks provided in the dialysis programme, the staff cost per HD session or PD week can be calculated.
y http://www.palisade.com/risk/default.asp

KCE Report 124 Chronic Dialysis in Belgium 91
Medical staff
Data on the time devoted to each dialysis modality by the medical staff and the cost per FTE was derived from the hospital survey. Respondents were asked to fill out a time sheet for each nephrologist, stating the number of working hours devoted to each of the following activities: the ambulatory dialysis programme, other patient care unrelated to ambulatory dialysis, education, research and management activities. For the ambulatory dialysis programme, it was moreover asked to specify how much of the time was devoted to hospital HD, to satellite HD, to PD and to home HD.
Nephrologists in the responding hospitals devoted on average 59.2% of their working time on the ambulatory dialysis programme. Of this 59.2%, on average 60.4% of their time is allocated to hospital HD, 28.5% to satellite HD, 10.5% to PD and 0.6% to home HD related activities.
Because the cost of nephrologists’ time devoted to other activities such as education, research and management, are supposed to benefit the ambulatory dialysis programme as well to some extent, a proportion of this time (and thus cost) is added to the time devoted for ambulatory dialysis programme. This latter proportion is set equal to:
dialysiseducation dialysis educationT T T= ×
Where dialysiseducationT represents the proportion of medical staff time devoted to education,
research and management attributed to the ambulatory dialysis programme, Tdialysis the proportion of medical staff time only devoted to the ambulatory dialysis programme and Teducation the proportion of medical staff time devoted to education, research and management activities.z Thus, the total proportion of medical staff time devoted to the ambulatory dialysis programme is calculated as
(1 )dialysisdialysistotal dialysis educationT T x T= + )
To allocate medical staff costs to the different dialysis modalities, the time devoted to each of the dialysis modalities needs to be calculated. This is done by multiplying Tdialysis
modality by Tdialysistotal, where Tdialysis modality X refers to the proportion of the total time devoted to the dialysis programme spent on modality X. The total time devoted to the dialysis programme is on average 59.2% according to the survey. Also according to the survey, ThospitalHD is 60.4%, %TPD is 10.5% and %Tsatellite HD is 28.5%. The remainder of the time spent on the ambulatory dialysis programme is devoted to spent on home HD (0.6%) and is, due to insufficient cost data, disregarded in this study. The medical staff cost for hospital HD is then equal to
%hospitalHDmedicalstaff medicalstaff hospitalHDC C T= ×
where Cmedicalstaff equals the average total cost of a full-time nephrologist as derived from the hospital survey.
Combined with data on the number of patients treated with each of the dialysis modalities, the number of PD patients and the number of HD sessions per full-time ‘dialysis nephrologist’ could be calculated. A full-time ‘dialysis nephrologist’ is defined as a nephrologist working 100% for the dialysis programme (including some education, research and management). In practice, a nephrologist will almost always spent some of his time on other activities (e.g. patient care unrelated to the dialysis programme). For the calculation of the costs of nephrologists’ time for each dialysis modality, account has to be taken of the time actually spent on the dialysis modality, rather than the time working at the hospital. To illustrate the difference between the number of FTE nephrologists working for the dialysis programme (the costs of whom should be attributed to dialysis activities) and the number of FTEs working at the dialysis centre, we can refer to the results of the NIHDI dialysis survey 2004.
z For example, if a nephrologist spends 51% of his time working for the ambulatory dialysis programme,
and 10% of his time on education, research and management, we allocate 0.51*0.1 = 5.1% of this time spent on education, research and management activities to the dialysis programme.

92 Chronic Dialysis in Belgium KCE Reports 124
According to the data collected in this survey, a dialysis programme with 100 dialysis patients, with 69.87% patients on hospital HD, 20% on satellite HD, 9.45% on PD and 0.54% on home HD (i.e. the average proportions of patients on different modalities in 2004), employs on average 4.34 FTE nephrologists. These nephrologists devote on average 59.2% of their time to the ambulatory dialysis programme and 6.5% on education, research and management (data from hospital survey). From these data, we can conclude that a cost of 2.74 FTE (4.34*0.592*(1+0.065)) nephrologists should be allocated to this dialysis programme.
The number of PD patients and the number of hospital HD sessions per FTE dialysis nephrologist are presented in Table 48. The figures in this table represent the number of patients one FTE nephrologist can follow-up if he would spend all of his time on only one dialysis modality. For example, one FTE dialysis nephrologist that would only follow-up PD patients and no other patients would be able to follow-up on average 40 PD patients. Similarly, one FTE dialysis nephrologist would be able to supervise on average 8 203 hospital HD sessions per year, corresponding to 52 patients following hospital HD for a full year.
Table 48: Number of hospital HD and satellite HD sessions and number of PD patients per FTE nephrologist as derived from the responses to the hospital survey*
Mean s.d. Median Min Max PD patients per FTE 40 15 49 16 52 Hospital HD sessions per FTE 8.203 2.731 8.369 4.705 11.973 Satellite HD sessions per FTE 9.273 4.233 7.674 4.980 18.218
* number of FTEs corrected for time not devoted to the ambulatory dialysis programme but taking into account a proportion of the activities related to education, research and management.
The means do not show any surprising results: the number of hospital HD sessions per FTE nephrologist is lower than the number of satellite HD sessions. However, the standard deviation is large, due to large differences between centres. The observed distribution is moreover skewed, as shown by the strange result for the medians. The median number of hospital HD sessions managed per FTE nephrologist according to our survey is higher than the median number of satellite HD sessions managed by one FTE nephrologist. This is unexpected, as no permanent presence of a nephrologist is required for satellite HD units and hence one would expect a higher number of satellite HD sessions per FTE nephrologist than hospital HD sessions. In the cost analysis, a gamma distribution was fitted on the variables, setting the mean correctly at the observed mean. As such, the impact of the observed inconsistency might be somewhat reduced.
Taking the total actual number of FTE nephrologists, not corrected for time devoted to dialysis but counting the number of full-time people, results for all centres in a ratio of 1 or 2 nephrologists per 4000 HD sessions. This is consistent with the regulatory requirements.
Obtaining the cost per FTE of medical doctors in Belgium is known to be difficult. In Belgium, physicians are generally paid on a fee-for-service basis, except at some hospitals where physicians receive a salary and sometimes additional bonuses. However, even those salaries are paid by the hospitals out of the fees-for-service they receive from the NIHDI for the activities performed by their physicians. There is only one fee-for-service system: the NIHDI pays the same fee for acts performed by physicians whether or not they receive a salary. To estimate the physician costs, respondents were asked to report data as booked on specific entries in the hospital accounting system. The entries are referred to as “Finhosta entries” because the accounting data of hospitals are put in a database called Finhosta. Finhosta is used for the calculation of the “Budget van Financiële Middelen/Budget des Moyens Financiers” of Belgian hospitals. The Belgian Federal Public Service for Health collects the data on a yearly basis. Data collection and transmission is mandatory for all hospitals. Entries are split according to cost centres. The dialysis unit is one specific cost centre in Finhosta.

KCE Report 124 Chronic Dialysis in Belgium 93
Finhosta entries 6200x; 6210x, 6220x, 6230x, 6240x, 62500x, 62510x, 6170x encompass all the costs for the hospital related to the employed medical personnel, including salaries, social security costs, employer contributions and other medical personnel-related costs. Respondents were asked to report the sum of these entries for medical staff receiving a salary. For medical staff not receiving a salary, respondents were asked to report the amount booked under Finhosta entry 6190x.
The cost per FTE is obtained by dividing the total personnel cost of the dialysis unit by the number of FTEs working at the unit. The reported costs per FTE nephrologist showed a large variability across responding centres (Table 50).
Nursing, technical and other staff
It was asked whether nurses were shared between the hospital haemodialysis programme and the satellite dialysis programme in order to be able to allocate nursing costs to the right modality. In three centres, nurses at the satellite unit worked exclusively for the satellite unit and were not involved in dialysis at the hospital. All other hospitals with a satellite unit shared nurses between the hospital unit and the satellite unit. For these, it was important to know how nurses’ time is allocated between the different dialysis modalities to calculate the number of FTEs nurses required for each modality. The proportion of total working time devoted to each dialysis modality was therefore asked, both for nurses, dieticians, technical and administrative staff (see questionnaire in the appendix to chapter 5). The cost of nursing support at home provided by home nurses in case of PD is not included in this cost analysis. From a hospital point of view, these are not costs, as the hospital receives a fixed lump sum from the NIHDI for nursing support at home which it has to transfer fully to the home nursing services, independent of whether or not this lump sum covers the total real costs of home nursing services.aa
The number of HD sessions or PD patients per FTE nurse, technician, administrative staff or dietician could be calculated similarly to the calculations for the number of hospital and satellite HD sessions and the number of PD patients per FTE nephrologist. The results are presented in Table 49.
Table 49: Number of hospital HD and satellite HD sessions and number of PD patients per FTE nurse, technician, secretary and dietician as derived from the responses to the hospital survey Mean s.d. Median Min Max
Nurses PD patients 8 5 6 3 16 Hospital HD sessions 472 93 489 293 569 Satellite HD sessions 876 628 791 300 2.030 Technicians PD patients 14 14 14 14 Hospital HD sessions 17.231 10.494 11.150 8.700 29.343 Satellite HD sessions 20.511 12.357 25.060 2.581 29.343 Administrative staff PD patients 114 114 114 114 Hospital HD sessions 15.659 11.438 14.816 4.061 28.942 Satellite HD sessions 4.797 3.163 4.797 2.561 7.033 Dieticians PD patients 239 239 239 239 Hospital HD sessions 37.421 6.447 33.944 33.460 44.860 Satellite HD sessions 18.436 18.436 18.436 18.436
One respondent failed to provide any data on costs or FTE for nursing or other non-medical staff.
aa See chapter 3 for the calculation of the reimbursement per hour of nursing support implied by the lump
sum reimbursement.

94 Chronic Dialysis in Belgium KCE Reports 124
Costs per FTE nurse, technician, administrative staff and dietician are presented in Table 50. The mean annual wage cost for medical staff and its large variability may be explained by the overrepresentation of hospitals paying their physicians a salary. The actual wage cost of physicians working privately is often unknown and not available as such in the hospital accounting system. The figures presented might hence underestimate the actual wage cost of the medical staff.
Table 50: Costs per FTE per year reported by respondents to the hospital survey for different categories of staff (in €2006)
Cost/FTE Mean s.d. Median Min. Max. n Medical staff 269.490 129.010 278.010 121.439 479.489 8 Nursing staff 54.313 3.437 54.508 49.863 58.490 6 Technical staff 62.106 4.773 62.943 54.991 66.777 6 Administrative staff 49.603 8.527 47.713 41.451 61.535 4 Dietician 57.098 15.903 57.540 40.979 72.776 3
5.2.1.4 Equipment
Equipment used for HD includes the dialysis machine, the seat, the weighing device, a tensiometer and a water purification machine. For PD a dialysis machine is needed in case of APD, as well as a heating plate, a weighing device, a tensiometer, a table, a serum standard and buckets. This equipment has to be provided by the dialysis centre following-up the PD patient. The cost for equipment per patient per year is obtained by calculating first the equivalent annual cost (EAC) of the machine, and then dividing this EAC by the number of patients that can be treated with the machine per year. This approach assumes that the equipment is financed through loan capital, while in practice it could also be financed through equity capital.
The EAC calculates the cost of equipment per year, taking into account the financial costs of the investment. It equals the amount that needs to be repaid yearly (including capital and interest repayments) when the full investment is borrowed at a rate r% and repaid over a period of t years. The EAC is calculated by dividing the initial investment cost by an annuity factor. The annuity factor depends on the lifetime of the equipment (t) and the interest rate (r) and is calculated as (1-1/(1+r)t)/r.bb An annual interest rate used for these calculations depends on the lifetime of the equipment. The lifetime of each type of equipment was derived from the hospital survey.
The interest rate used for the calculation of the EAC equals the average interest rate in 2006 on a long term obligation (Obligation Linéaire - Lineaire Obligatie), increased with 0.15 percent points to account for the bank margin.cc The 5, 7 and 10 year average OLO’s were in 2006 respectively 3.6%, 3.73% and 3.81%.dd. Including the 0.15 percent points bank margin, this leads to the following interest rates used for equipment that is used for respectively 5, 7 and 10 years: 3.75%, 3.88% and 3.95%. These interest rates are assumed to cover the financial costs of investment.
The lifetime of the dialysis and water purification machines, heating plates and buckets is assumed to be 7 years. Seats, weighing devices, serum standards, beds and tables are assumed to have a lifetime of 10 years. Smaller medical equipment such as tensiometers and vascular access monitoring devices are assumed to have a lifetime of 5 years.
The number of HD sessions or PD weeks per unit of equipment per year are presented in Table 51. As shown in the table, only few or none of the respondents reported the use of some types of equipment. The estimated number of HD sessions or PD weeks for these units per year does not allow estimating a reliable distribution (see paragraph 5.2.1.2 for how variables with few observations are dealt with in the cost analysis).
bb This formula assumes payments are made at the end of the year. cc The bank margin assumed is consistent with the bank margin assumed in previous KCE reports (see, for
example, KCE-report 106). Data on interest margins are available at http://www.nbb.be/ dd http://www.nbb.be/belgostat/PresentationLinker?TableId=420000033&Lang=N

KCE Report 124 Chronic Dialysis in Belgium 95
Table 51: Number of HD sessions and number of PD weeks per unit of equipment per year as derived from the responses to the hospital survey
Mean s.d. Median Min Max n Haemodialysis Dialysis machines 373 120 361 249 612 7 Seats 692 342 744 249 1.128 7 Weighing devices 2.067 1.562 1.494 817 4.591 5 Tensiometer 959 152 961 806 1.109 3 Water purification machine
6.771 4.682 5.869 1.494 16.334 7
Vascular access monitoring device
16.334 16.334 16.334 16.334 1
Beds 835 835 835 835 1 Peritoneal dialysis Dialysis machine (in case of APD)
39 14,34 42,33 23,35 51,45 3
Heating plate 62 40,70 43 34 109 3 Weighing devices 236 365,61 58 43 784 4 Tensiometer 198 181,86 154 43 398 3 Serum standards 398 398 398 398 1 Buckets 103 103 103 103 1 Tables 398 398 398 398 1 Beds 784 784 784 784 1
The distributions are large for many of the equipment items. The data were taken as reported by the respondents to the survey. The fact that the number of PD weeks per APD dialysis machine is lower than 52 (corresponding to one year) might be explained by the method used for counting the number of APD weeks. When asked how many APD weeks the hospital provided in 2006, the respondents counted the number of lump sums for APD charged to the NIHDI in 2006. However, this number is likely to be smaller than 52 per APD patient, as the lump sum for APD cannot be charged by the hospital if the APD patient is hospitalized or during the training of CAPD patients. During hospitalization APD is financed through honorarium fees and not through the ambulatory lump sum for APD. The number of APD weeks reported by the respondents is therefore smaller than 52 times the number of APD patients and consequently the number of APD weeks per APD machine is smaller than 52.
Respondents were asked to report the catalogue unit price of the equipment including VAT, in order to get a full cost estimate of the different dialysis modalities. However, some hospitals in Belgium receive their (home) HD equipment at a reduced price or lease the equipment from the supplier. According to the experts we consulted, companies compensate price reductions on equipment through the prices for consumables. As consumables like dialyzers produced by one company cannot be used on equipment produced by another company, hospitals’ negotiating power decreases once the equipment is installed. According to the experts, therefore, hospitals have to make a trade-off between paying a higher price for the equipment and thus a lower price for the consumables and paying a lower price for the equipment and thus higher prices for the consumables.ee
Two in 8 dialysis centres responding to the hospital survey declared not paying or leasing the HD equipment. As we asked to report the catalogue unit price of the equipment, the estimated average cost of equipment might be higher than the cost actually paid.
The unit costs of the different types of equipment, as derived from the hospital survey are presented in Table 52.
ee With dialysis fluids for PD being subject to a value added tax (VAT) of 6% and equipment to a VAT of
21%, the option of lower prices for equipment and higher prices for consumables might be more attractive from the hospital’s point of view, at least if the same company delivers the equipment for HD and APD and the dialysis fluids for PD.

96 Chronic Dialysis in Belgium KCE Reports 124
Table 52: Cost per unit of dialysis equipment as derived from the hospital survey (in €2006)
Mean s.d. Median Min Max n Haemodialysis Dialysis machines 3.931 677 3.747 3.039 4.929 6 Seats 416 101 445 230 511 6 Weighing devices 839 719 644 238 1.635 3 Tensiometer 200 270 200 9 390 2 Water purification machine 32.711 11.744 28.862 19.127 49.761 5 Peritoneal dialysis Dialysis machine (in case of AP)
n.a. n.a. n.a. n.a. 0
Heating plate 26,03 26,03 26,03 26,03 1 Weighing devices 23,09 21,53 19,31 3,69 46,26 3 Tensiometer 18,88 5,01 19,85 13,46 23,34 3
n.a.: no data available
The difference in costs between the weighing devices and tensiometers used for PD (at the patients’ home) and the ones used at the hospital may be explained by the more intensive use of the hospital weighing devices and tensiometers and the usually more sophisticated nature of professional equipment. Professional equipment is more expensive than equipment for private use by one or a few people.
5.2.1.5 Consumables
Consumables used for HD and PD are presented in Table 53. Respondents were asked to give the total cost of consumables booked on cost places 560 to 569 in the Finhosta accounting system.
Table 53: Consumables used for HD and PD Haemodialysis Peritoneal dialysis Medication Dialysate Artificial kidney Desinfectant fluids Blood lines Clips Bicarbonate Connector/deconnector Acid concentrate Nursing kits Heparine Tape Saline solution Belts Needles Needles Connector/deconnector Micropore Desinfectant Waste basket Dustbin Other: …. Syringes Perfusion sets Other: ….
The cost of consumables varied largely between the responding hospitals for PD. The mean and median total costs of consumables per dialysis modality are presented in Table 54.
Table 54: Total costs of consumables per satellite and hospital HD session and per week of PD (in €2006)
Mean s.d. Median Min Max n Hospital HD, per session 63,66 11,21 59,67 54,15 83,97 6 Satellite HD, per session 57,27 11,63 58,56 41,14 69,31 7 PD, per week 547,04 131,72 573,09 312,69 664,77 6
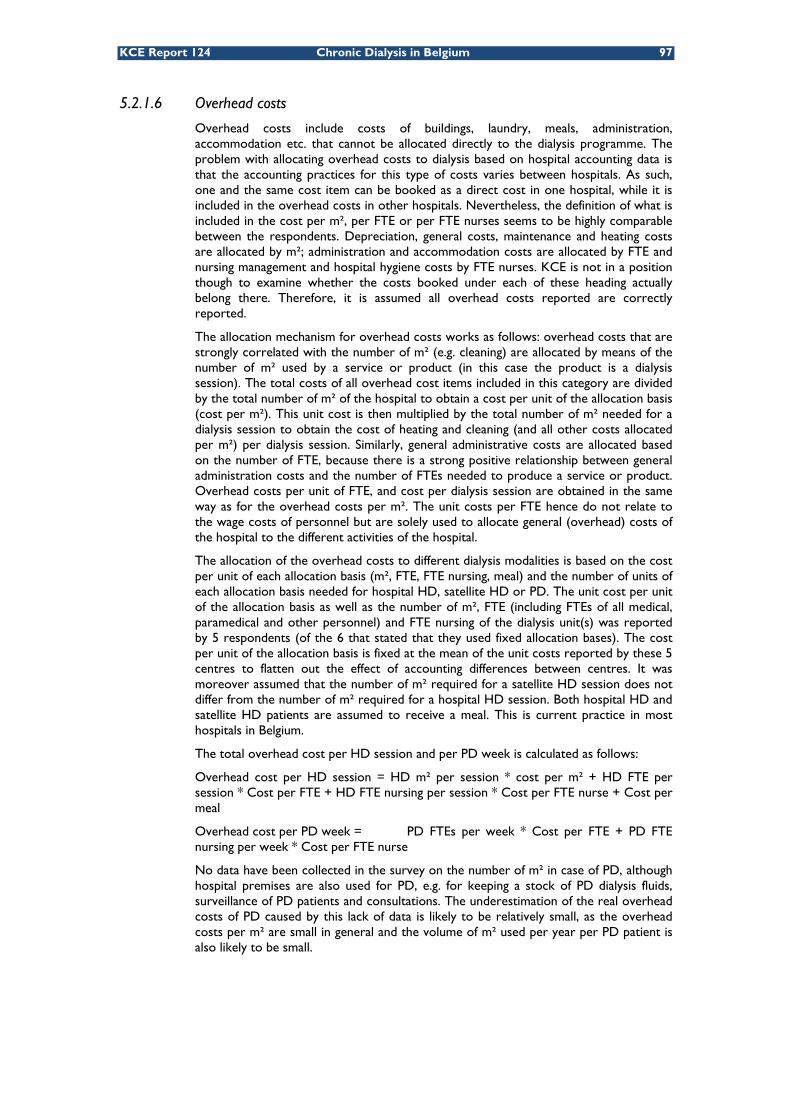
KCE Report 124 Chronic Dialysis in Belgium 97
5.2.1.6 Overhead costs
Overhead costs include costs of buildings, laundry, meals, administration, accommodation etc. that cannot be allocated directly to the dialysis programme. The problem with allocating overhead costs to dialysis based on hospital accounting data is that the accounting practices for this type of costs varies between hospitals. As such, one and the same cost item can be booked as a direct cost in one hospital, while it is included in the overhead costs in other hospitals. Nevertheless, the definition of what is included in the cost per m², per FTE or per FTE nurses seems to be highly comparable between the respondents. Depreciation, general costs, maintenance and heating costs are allocated by m²; administration and accommodation costs are allocated by FTE and nursing management and hospital hygiene costs by FTE nurses. KCE is not in a position though to examine whether the costs booked under each of these heading actually belong there. Therefore, it is assumed all overhead costs reported are correctly reported.
The allocation mechanism for overhead costs works as follows: overhead costs that are strongly correlated with the number of m² (e.g. cleaning) are allocated by means of the number of m² used by a service or product (in this case the product is a dialysis session). The total costs of all overhead cost items included in this category are divided by the total number of m² of the hospital to obtain a cost per unit of the allocation basis (cost per m²). This unit cost is then multiplied by the total number of m² needed for a dialysis session to obtain the cost of heating and cleaning (and all other costs allocated per m²) per dialysis session. Similarly, general administrative costs are allocated based on the number of FTE, because there is a strong positive relationship between general administration costs and the number of FTEs needed to produce a service or product. Overhead costs per unit of FTE, and cost per dialysis session are obtained in the same way as for the overhead costs per m². The unit costs per FTE hence do not relate to the wage costs of personnel but are solely used to allocate general (overhead) costs of the hospital to the different activities of the hospital.
The allocation of the overhead costs to different dialysis modalities is based on the cost per unit of each allocation basis (m², FTE, FTE nursing, meal) and the number of units of each allocation basis needed for hospital HD, satellite HD or PD. The unit cost per unit of the allocation basis as well as the number of m², FTE (including FTEs of all medical, paramedical and other personnel) and FTE nursing of the dialysis unit(s) was reported by 5 respondents (of the 6 that stated that they used fixed allocation bases). The cost per unit of the allocation basis is fixed at the mean of the unit costs reported by these 5 centres to flatten out the effect of accounting differences between centres. It was moreover assumed that the number of m² required for a satellite HD session does not differ from the number of m² required for a hospital HD session. Both hospital HD and satellite HD patients are assumed to receive a meal. This is current practice in most hospitals in Belgium.
The total overhead cost per HD session and per PD week is calculated as follows:
Overhead cost per HD session = HD m² per session * cost per m² + HD FTE per session * Cost per FTE + HD FTE nursing per session * Cost per FTE nurse + Cost per meal
Overhead cost per PD week = PD FTEs per week * Cost per FTE + PD FTE nursing per week * Cost per FTE nurse
No data have been collected in the survey on the number of m² in case of PD, although hospital premises are also used for PD, e.g. for keeping a stock of PD dialysis fluids, surveillance of PD patients and consultations. The underestimation of the real overhead costs of PD caused by this lack of data is likely to be relatively small, as the overhead costs per m² are small in general and the volume of m² used per year per PD patient is also likely to be small.

98 Chronic Dialysis in Belgium KCE Reports 124
The calculations of the overhead costs per hospital HD session and per satellite HD session are similar, only the number of medical and other FTEs will differ between the modalities. Therefore, the actual overhead cost figures will differ between the two modalities.
Table 55 presents the volume of overhead cost drivers used by each dialysis modality as derived from the responses to the hospital survey. The number of m² used for one HD session, for instance, is obtained by dividing the total number of m² of the hospital and satellite dialysis units by the total number of HD sessions performed at these units. The figure thus obtained reflects how much of the overhead cost per m² should be allocated to one HD session. The overhead costs allocated on the basis of the number of FTEs refer to the number of FTEs of all personnel categories except medical personnel. It includes nursing, dieticians, administrative staff and technical staff.
Table 55: Volume of the overhead cost drivers by type of dialysis as reported in the hospital survey
Mean s.d. Median Min Max n m² per HD session* 0,10480 0,03 0,11 0,06 0,14 5 Number of FTEs** - hospital HD, per session 0,00251 0,0006 0,0024 0,0019 0,0036 6 - satellite HD, per session 0,00198 0,0010 0,0019 0,0006 0,0035 6 - PD, per week 0,00344 0,0016 0,0031 0,0021 0,0065 6 Number of FTE nurses - hospital HD, per session 0,00222 0,0006 0,0020 0,0018 0,0034 6 - satellite HD, per session 0,00169 0,0011 0,0013 0,0005 0,0033 6 - PD, per week 0,00311 0,0019 0,0032 0,0012 0,0061 5 Meals per HD session 1
* calculated as the total number of m² of the dialysis unit divided by the total number of HD sessions. ** includes the number of FTEs of all personnel categories except for the medical personnel.
The costs per unit of the allocation basis as reported by the five respondents are presented in Table 56. The standard deviation, median, minimum and maximum figures are only for illustrative purposes, as the cost analysis will use a fixed cost per m², FTE (including all personnel categories except medical personnel), FTE nurse and meal equal to the mean of the reported unit costs. These unit costs need to be multiplied by the volume of overhead resource use per year for each of the dialysis modalities. This volume per year is obtained by multiplying the volumes per HD session by 156 (3 sessions a week for 52 weeks per year), and the volumes per PD week by 52.
Table 56: Unit costs per year of the overhead allocation bases as derived from the responses to the hospital survey (in €2006) Mean s.d. Median Min Max n
Overhead cost per m² 167,47 64,62 169,05 69,46 228,06 5 Overhead cost per FTE 10.766 3.760 11.852 6.550 14.569 5 Overhead cost per FTE nurse 1.404 309 1.252 1.120 1.796 5 Cost per meal 19,20 4,16 19,20 16,26 22,14 2
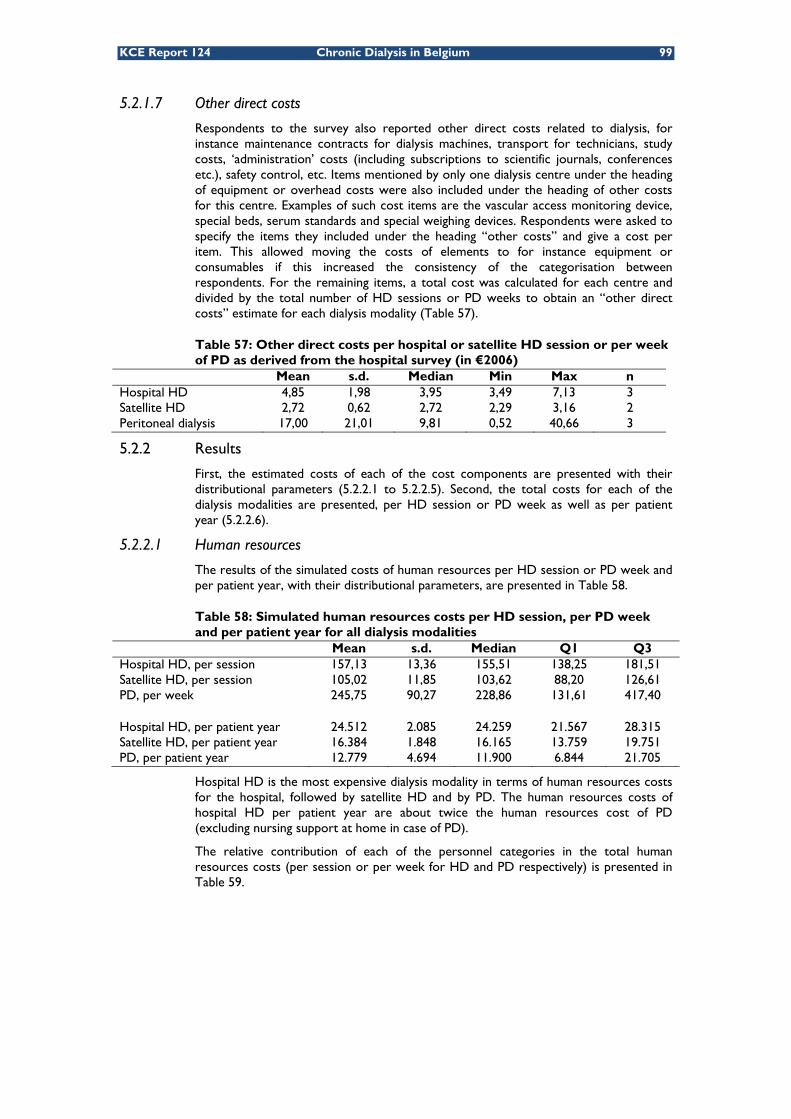
KCE Report 124 Chronic Dialysis in Belgium 99
5.2.1.7 Other direct costs
Respondents to the survey also reported other direct costs related to dialysis, for instance maintenance contracts for dialysis machines, transport for technicians, study costs, ‘administration’ costs (including subscriptions to scientific journals, conferences etc.), safety control, etc. Items mentioned by only one dialysis centre under the heading of equipment or overhead costs were also included under the heading of other costs for this centre. Examples of such cost items are the vascular access monitoring device, special beds, serum standards and special weighing devices. Respondents were asked to specify the items they included under the heading “other costs” and give a cost per item. This allowed moving the costs of elements to for instance equipment or consumables if this increased the consistency of the categorisation between respondents. For the remaining items, a total cost was calculated for each centre and divided by the total number of HD sessions or PD weeks to obtain an “other direct costs” estimate for each dialysis modality (Table 57).
Table 57: Other direct costs per hospital or satellite HD session or per week of PD as derived from the hospital survey (in €2006)
Mean s.d. Median Min Max n Hospital HD 4,85 1,98 3,95 3,49 7,13 3 Satellite HD 2,72 0,62 2,72 2,29 3,16 2 Peritoneal dialysis 17,00 21,01 9,81 0,52 40,66 3
5.2.2 Results
First, the estimated costs of each of the cost components are presented with their distributional parameters (5.2.2.1 to 5.2.2.5). Second, the total costs for each of the dialysis modalities are presented, per HD session or PD week as well as per patient year (5.2.2.6).
5.2.2.1 Human resources
The results of the simulated costs of human resources per HD session or PD week and per patient year, with their distributional parameters, are presented in Table 58.
Table 58: Simulated human resources costs per HD session, per PD week and per patient year for all dialysis modalities
Mean s.d. Median Q1 Q3 Hospital HD, per session 157,13 13,36 155,51 138,25 181,51 Satellite HD, per session 105,02 11,85 103,62 88,20 126,61 PD, per week 245,75 90,27 228,86 131,61 417,40 Hospital HD, per patient year 24.512 2.085 24.259 21.567 28.315 Satellite HD, per patient year 16.384 1.848 16.165 13.759 19.751 PD, per patient year 12.779 4.694 11.900 6.844 21.705
Hospital HD is the most expensive dialysis modality in terms of human resources costs for the hospital, followed by satellite HD and by PD. The human resources costs of hospital HD per patient year are about twice the human resources cost of PD (excluding nursing support at home in case of PD).
The relative contribution of each of the personnel categories in the total human resources costs (per session or per week for HD and PD respectively) is presented in Table 59.

100 Chronic Dialysis in Belgium KCE Reports 124
Table 59: Relative contribution of each category of personnel in total costs of the dialysis modalities: mean cost in €2006 (% in total mean human resources cost of the modality)
Medical personnel Nursing Other
Hospital HD, per session 36.44 (23,19%) 108.63 (69,13%) 12.06 (7,68%) Satellite HD, per session 33.22 (31,63%) 59.74 (56,89%) 12.06 (11,49%- PD, per week 157.74 (64,19%) 81.47 (33,15%) 6.55 (2,66%)
5.2.2.2 Equipment
The results of the simulated costs of equipment per HD session or PD week and per patient year, with their distributional parameters, are presented in Table 60.
Table 60: Simulated equipment costs per HD session, per PD week and per patient year for all dialysis modalities
Mean s.d. Median Q1 Q3 Hospital HD, per session 20,61 8,45 18,72 10,59 36,89 Satellite HD, per session 20,61 8,45 18,72 10,59 36,89 PD, per week 1,08 n/a 1,08 1,08 1,08 Hospital HD, per patient year 3.215 1.318 2.920 1.652 5.754 Satellite HD, per patient year 3.215 1.318 2.920 1.652 5.754 PD, per patient year 56 n/a 56 56 56
The equipment needed for hospital HD and satellite HD is assumed to be equal, therefore the costs are equal. Dialysis machines account for more than 55% of the total equipment costs of hospital and satellite HD. PD requires only limited equipment, explaining the low cost for PD on this cost component. Costs of equipment for APD could not be estimated due to the absence of data on this cost item. None of the respondents to the hospital survey provided a cost estimate for the APD equipment. A possible explanation might be that the equipment is provided without charge by the company that provides the dialysis fluids and that the company is compensated through the price paid for the dialysis fluids. This hypothesis, expressed by the external experts working at dialysis centres, could not be verified with the limited data available to us.
5.2.2.3 Consumables
The results of the simulated costs of consumables per HD session or PD week and per patient year, with their distributional parameters, are presented in Table 61.
Table 61: Simulated consumables costs per HD session, per PD week and per patient year for all dialysis modalities
Mean s.d. Median Q1 Q3 Hospital HD, per session 63,66 11,22 63,00 46,40 83,15 Satellite HD, per session 57,27 11,63 56,49 39,56 77,64 PD, per week 547,04 131,74 536,44 349,67 779,86 Hospital HD, per patient year 9.931 1.751 9.828 7.239 12.972 Satellite HD, per patient year 8.935 1.814 8.812 6.172 12.111 PD, per patient year 28.446 6.850 27.895 18.183 40.553
PD induces the highest consumables costs of the three modalities, followed by hospital HD and satellite HD. Ninety percent of the consumables costs of PD are related to the dialysis fluids. These are delivered directly at the patients’ home.
5.2.2.4 Overhead costs
The results of the simulated overhead costs per HD session or PD week and per patient year are presented in Table 62. As noted before, the overhead costs of PD will be slightly underestimated as costs per m² were not included.

KCE Report 124 Chronic Dialysis in Belgium 101
Table 62: Simulated overhead costs per HD session, per PD week and per patient year for all dialysis modalities
Mean s.d. Median Q1 Q3 Hospital HD, per session 66,53 8,36 66,10 53,58 81,11 Satellite HD, per session 59,62 12,34 58,00 42,66 82,64 PD, per week 39,15 17,60 36,41 15,66 71,98 Hospital HD, per patient year 10.379 1.303 10.311 8.358 12.654 Satellite HD, per patient year 9.300 1.924 9.049 6.654 12.892 PD, per patient year 2.036 915 1.893 814 3.743
5.2.2.5 Other direct costs
The results of the simulated other direct costs per HD session or PD week and per patient year are presented in Table 63. All input data for the other direct costs were based on 2 or 3 observations only. As a consequence the mean observed value was used as input value for the cost analysis and there is no variability in the results of the simulations on this variable.
Table 63: Simulated other direct costs per HD session, per PD week and per patient year for all dialysis modalities Mean Hospital HD, per session 5,01 Satellite HD, per session 2,96 PD, per week 17,02 Hospital HD, per patient year 782 Satellite HD, per patient year 462 PD, per patient year 885
PD has the largest average “other” cost of the three modalities. The other costs of PD include serum standards, tables, furniture etc provided by the hospital to the patient. It concerns items of other cost components (e.g. equipment) reported by only one or two hospitals that were transferred to the “other costs” category.
5.2.2.6 Total costs
Table 64 summarizes the total costs per patient year of the different dialysis modalities. Concerning the different HD modalities our results show that hospital HD is more costly for the hospital than satellite HD. PD is found to be more costly than satellite HD, but less costly than hospital HD. This finding contrasts with most studies in literature, where PD is usually found to be the least costly dialysis modality.
Table 64: Simulated total costs per patient year for hospital HD, satellite HD and PD
Mean s.d. Median Q1 Q3 Hospital HD, per patient year 48.819 3.266 48.688 43.769 54.340 Satellite HD, per patient year 38.296 3.520 38.099 32.911 44.256 PD, per patient year 44.202 8.330 43.670 31.652 59.012
Figure 44 shows the relative importance of each of the cost components in the total costs of the different dialysis modalities. Clearly, human resources is the most important cost component for hospital and satellite HD. The costs of consumables for PD are high compared to the other cost components of PD and compared to any of the cost components of the other dialysis modalities. The importance of the consumables costs makes PD a relatively more expensive dialysis modality than satellite HD from the hospitals’ point of view. As mentioned before, the largest share of the total consumables costs for PD is taken by the cost of the dialysis fluid (about 90%). A possible explanation of the high consumables costs for PD might be that they reflect partly the compensation for providing equipment at a reduced price or free of charge through the prices of the consumables for PD. The proportion of APD in total PD was almost 50% in 2006 (NIHDI dialysis survey 2007).

102 Chronic Dialysis in Belgium KCE Reports 124
Only one dialysis centre provided a cost estimate for the lending of APD equipment in our survey, although five out of eight centres did report APD activities. This may indicate that compensation through the prices of consumables is common.
The cost of equipment for hospital HD is relatively small compared to the other cost components. An explanation for this might be the different value added tax (VAT) applicable to equipment (21%) and dialyzers and blood lines (both 6%). It is not uncommon for companies to give a discount on the price of equipment. This implies, however, that the hospital has to buy the dialyzers and blood lines at the same company, as the dialyzers most often only fit the dialysis machine of the same company. For the hospital this is nevertheless an interesting deal because it has to pay less VAT on the consumables than on the equipment.
Figure 44: Cost of dialysis per patient year (€2006)
Key points
• The yearly total cost for a hospital of hospital HD is estimated at €48 800 per patient. Satellite HD costs about €38 300 per year per patient and PD without nursing support about €44 200 per patient per year. These figures correspond to €313 per hospital HD session, €245 per satellite HD session and €850 per week PD without nursing support. These estimates encompass costs of medical and paramedical personnel, equipment, consumables, overheads and other hospital costs. Costs of nursing home care or patient transportation are not included, as they represent no direct cost to the hospital.
• Human resources are the most important cost component for hospital HD and satellite HD.
• The higher cost of PD compared to satellite HD is explained mainly by the relatively high cost of consumables for PD, the largest part of which are the dialysis fluids. PD dialysis fluids cost more per patient per year than personnel in case of hospital HD.
0
10.000
20.000
30.000
40.000
50.000
60.000
Hospital HD Satellite HD PD
Cost per patient year (€20
06)
Other
Overheads
Equipment
Consumables
Human resources

KCE Report 124 Chronic Dialysis in Belgium 103
5.3 COSTS AND REVENUES OF A DIALYSIS PROGRAMME FROM A HOSPITAL’S PERSPECTIVE Based on the cost estimates presented above and the current financing mechanisms for the different dialysis modalities, a simulation was made of the total costs and revenues for a hypothetical dialysis programme with 100 patients from the perspective of the hospital. Because of the trapped financing system for hospital HD (an incremental lump sum is granted depending on the proportion of patients following alternative dialysis treatments), there is no single fixed reimbursement fee for hospital HD which can be compared to the costs of hospital HD. The proportion of patients on alternative dialysis treatments (PD or satellite HD) will determine the balance between costs and revenues of a dialysis programme for the hospital. Therefore, the costs and revenues of a dialysis programme are simulated in function of the proportion of patients on alternative dialysis modalities. Costs and revenues were calculated from the perspective of the hospital. Costs include all elements described in paragraph 5.2, revenues include lump sums and fees for service (honoraria) for hospital HD and lump sums for satellite HD and PD.
In the short term some costs are fixed or semi-fixed. In the long term all costs are in principle variable. Assuming that all costs are variable is highly theoretical, because even in the (very) long run a hospital dialysis unit will always be confronted with semi-fixed costs of staffing and equipment. The number of transplantations, for instance, is highly unpredictable. If a patient is transplanted, inefficiencies may arise in the resource use of a dialysis unit if the free space for a dialysis patient is not filled in immediately. One dialysis machine has the capacity to treat 4 to 5 patients if used from Monday until Saturday and at night. “Losing” a patient induces inefficiencies in the use of equipment (and personnel). It is often not possible for a hospital to adapt resources (staff, equipment) to the level required for treating the number of patients at a specific moment in time. We present a scenario that is situated between the short run and the long run scenario, i.e. we assume that the equipment and personnel can be adapted to a certain extent to the number of patients, though not infinitesimal. For example, the number of dialysis machines increases per 4 additional patients treated with HD and the number of nephrologists increases per 25 hospital HD patients treated.
5.3.1 Methods
For the simulation of the costs and revenues of a hypothetical dialysis programme with 100 patients, a number of assumptions had to be made.
5.3.1.1 Revenues
The total revenues of a dialysis programme with 100 patients are estimated starting from the financing mechanisms described in chapter 3. In order to simulate the revenues for an ‘average’ Belgian dialysis centre, national averages were used where possible. This is the case for the per diem price, the proportion of satellite HD in total alternative dialysis modalities and the proportion of APD in total PD. The average per diem price of the dialysis centres in 2006 was €269.44 (median €250.95; st.dev. €61.88, Q1 €230, Q2 €280.25, as derived from the NIHDI dialysis survey 2006). This implies a lump sum per hospital HD session for the ‘average dialysis centre’ of €40.11+0.2*€269.44=€94 (i.e. the baseline lump sum of €40.11 plus 20% of the per diem price. This amount equals a centre’s lump sum per hospital HD session, see chapter 3). The incremental lump sums according to the percentage of alternative dialysis treatments are as in Table 65. They reflect the reimbursement tariffs between January 1st, 2006 and March 30th, 2006. As from April 1st, 2003 reimbursement tariffs were reduced. This was not taken into account in the calculations. On January 1st 2007, the tariffs were again at the same level as during the first three months of 2006 due to indexation.

104 Chronic Dialysis in Belgium KCE Reports 124
Table 65: Input data for the simulation of the revenues of a hypothetical dialysis programme as a function of the proportion of patients treated with alternative dialysis modalities
% alternative dialysis Incremental lump sum for hospital HD
5-10% 29,95 10-25% 73,33 25-35% 95,69 >35% 100,95
Input variables Per diem price (national average in 2006) 269,44 Baseline lump sum hospital HD 94
Minimum lump sum hospital HD 113,64 Maximum lump sum hospital HD 263,06 Fee for service Hospital HD 188,6
Lump sum PD without nursing support 699,51 Lump sum APD 778,54 Lump sum for Satellite HD 250,98 Reimbursement to patients from PD lump sum, per week 3.45 % PD in all alternative dialysis treatments 32.08% % satellite HD in all alternative dialysis treatments 67.92% % APD in total PD 49.88%
The calculation of the revenues for CAPD was based on the lump sum for PD without nursing support to remain consistent with the cost estimates for PD. For the calculation of the costs of CAPD, payments made to the home nursing services were not included as real costs, as they actually are (or should beff) a zero-operation for the hospital. The hospital acts as the intermediary between the NIHDI and the home nursing services. These payments are neither a cost nor a revenue for the hospital.
In the calculations of the revenues, only the relative use of two broad categories of dialysis are varied: hospital HD and alternative dialysis. This is done to make the simulations manageable. Moreover, this simplification allows presentation of the results on a two dimensional graph. It implies, however, that the composition of “alternative dialysis” needs to be specified in the model. We used the national averages on the relative use of satellite HD, APD and CAPD to define this composition. In 2006 about 67.92% of all the alternative dialysis treatments were satellite HD treatments, 16% was APD (i.e. 49.88% of 32.08%) and 16.08% was CAPD (source: NIHDI Dialysis survey 2006gg). This is accounted for in the calculations, by assuming at each level of alternative dialysis treatments, a lump sum for satellite HD is received for 67.92% of the patients on alternative dialysis therapy, a lump sum for APD for 16% of the patients and a lump sum for CAPD (without nursing support) for 16.08% of the patients.
ff As described in chapter 3, there appears to be some variability between the payments received by the
home nursing services from different dialysis centres. gg The proportion alternative dialysis use in Belgian centres derived from the NIHDI Dialysis survey is based
on the concept of patient years, obtained by dividing the number of dialysis sessions or weeks by 156 or 52 respectively. The proportion differs from the figures presented in the NBVN-GNFB Common report 2007 (and in Chapter 3) because the latter are based on actual patients rather than on the theoretical number of patient years. The figures derived from the NIHDI Dialysis survey are presented here as they are more consistent with the concept of a patient in the costs-revenues model.

KCE Report 124 Chronic Dialysis in Belgium 105
5.3.1.2 Costs
For the calculation of the short term costs for the hospital, a distinction is made between fixed, semi-fixed and variable costs. Fixed costs do not change with the number of patients treated, semi-fixed costs increase stepwise and variable costs increase directly with the number of patients treated. Table 66 gives an overview of the fixed, semi-fixed and variable cost categories for each type of dialysis.
Table 66: Fixed, semi-fixed and variable cost categories for each dialysis modality
Hospital HD Satellite HD PD Fixed cost 1 nephrologist for the entire dialysis programme Fixed cost Equipment
Building space Cleaning Energy
Equipment Building space Cleaning Energy
Semi-fixed costs
Nephrologists Nurses Technicians
Nephrologists Nurses Technicians
Nephrologists Nurses
Variable costs Consumables Meals
Consumables Meals
Consumables Patients’ expenses
For the simulation of short term costs, the legal requirements for medical personnel were imputed, the national average number of patients per FTE nurse as obtained from ORPADT was used, and results from the hospital survey were used for input data for which no national averages were available.
The law requires that for a dialysis programme of 40 patients, at least one full-time nephrologist should be available, defined as a nephrologist working at least 8/10 of normal professional activities at the hospital. Additional staff requirements are stipulated in the law for hospital HD. For the first 4000 and each additional 4000 hospital HD sessions an additional specialist must be present. It is not specified how much of his time this additional nephrologist should work for the dialysis programme. According to the results of the hospital survey, this additional nephrologist would spent about 63% of his time on these 4000 hospital HD dialysis sessions.hh Four thousand HD sessions corresponds to 25.6 patients. It is therefore assumed that, besides the one FTE nephrologist required for the supervision of the entire dialysis programme, an additional 0.63 FTE nephrologist is needed per 25 hospital HD patients.
For the costs-revenues model, this implies that if less than 25 of the 100 patients are treated with hospital HD and hence more than 75 patients with alternative dialysis treatments, 1.63 FTE nephrologist would be needed for the follow-up of the patients. Table 67 shows the number of FTE nephrologists modelled at different levels of hospital HD and alternative dialysis use in our hypothetical dialysis programme with 100 patients. The distribution of patients between alternative dialysis modalities is fixed at 16% on APD, 16.08% on CAPD and 67.92% on satellite HD. The cost of this number of FTE nephrologists is assigned to the simulated dialysis programme. The cost of one FTE is allocated as a general cost for the entire programme, also being to the benefit of the PD and satellite HD patients, while the remainder is attributed exclusively for the hospital HD activities. Note that this may slightly overestimate the costs of hospital HD, as in practice these other physician FTEs will also be used for the follow-up of PD and satellite HD patients.
hh This 63% includes a provision for time devoted to education, management and research.

106 Chronic Dialysis in Belgium KCE Reports 124
Table 67: Number of nephrologists in function of the number of hospital HD patients included in the costs-revenues model Number of hospital HD patients Number of nephrologists
0-25 1.63 26-50 2.25 51-75 2.88 76-100 3.50
To verify the validity of our assumptions with respect to the number of FTEs at any specific level of alternative dialysis use, we cross-checked our assumptions with the data from the NIHDI dialysis questionnaire 2004. These data reflect the actual number of FTEs nephrologists and specialists internal medicine in Belgian dialysis centres at that time. According to these observations, a dialysis centre with 100 patients, of which 70 are on hospital HD, 20 on satellite HD, 10 on PD (i.e. the national average proportions on each of the modalities in 2004), employs 2.74 FTE. In our model, a dialysis programme with this distribution of patients between the different modalities employs 2.88 FTE.
As for the nurses, the law imposes one FTE nurse per 3.2 hospital HD patients per year. For satellite HD, no legal requirements are imposed on the number of nurses. We assume 5.5 satellite HD patients per FTE nurse per year, corresponding to the results for Flanders from the ORPADT survey in 2006.ii We further assume, based on the results of the hospital survey, that one FTE technician, one FTE secretary and 0.5 FTE dietician would be needed for the entire dialysis programme.
The total costs for alternative dialysis treatments are assumed to be composed in the same way as the revenues; i.e. 67.92% of the alternative dialysis treatments are satellite HD, 32.08% PD.
5.3.2 Results
5.3.2.1 Revenues
Total revenues for each of the dialysis modalities, in function of the proportion of patients on alternative dialysis modalities (X-axis), are presented in Figure 45. Regardless of the number of patients on alternative dialysis modalities, it is assumed that always 16% of these patients follow CAPD treatment, 16.08% APD treatment and 67.92% satellite HD treatment, as found in the Belgian data of 2006 (cfr. 5.3.1). Revenues per patient on each of the modalities are presented in Figure 46.
The revenues for PD and for satellite HD increase linearly with the number of patients following these treatments. This is due to the lump sum reimbursement per PD week or per satellite HD session. The existence of ‘bonuses’ for the lump sums of hospital HD related to the proportion of patients treated with alternative dialysis modalities, introduces a non-linear relationship between the revenues for hospital HD and the number of patients on alternative dialysis modalities. Due to this stepwise increase in lump sums for hospital HD with the increase in the proportion of patients treated with alternative dialysis types, the total revenues of the dialysis programme initially increase stepwise but then decrease again. From the point where total revenues start a linear decline (i.e. at 35% of the patients treated with alternative dialysis modalities) the hospital earns less with each additional patient on an alternative dialysis treatment (essentially this is because from that point onwards the reimbursement per patient remains constant, as shown in Figure 46). With current reimbursement rules and values, total revenues are maximized at the point where 25% of the patients are treated with an alternative dialysis modality (assuming that the proportion of patients being treated with satellite HD versus PD equals the national average: 67.92% for satellite HD, 16% for CAPD and 16.08% for APD).
ii http://www.orpadt.be/documenten/EPDResultsFlandersWallonia2007.pdf
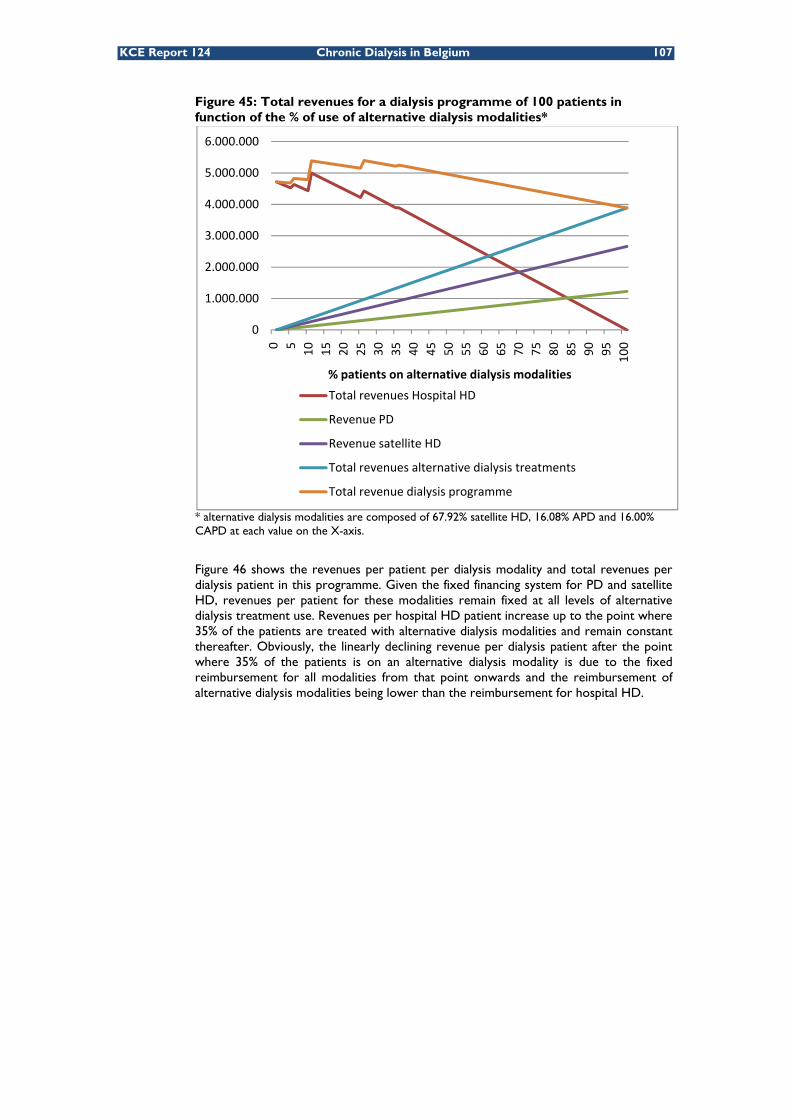
KCE Report 124 Chronic Dialysis in Belgium 107
Figure 45: Total revenues for a dialysis programme of 100 patients in function of the % of use of alternative dialysis modalities*
* alternative dialysis modalities are composed of 67.92% satellite HD, 16.08% APD and 16.00% CAPD at each value on the X-axis.
Figure 46 shows the revenues per patient per dialysis modality and total revenues per dialysis patient in this programme. Given the fixed financing system for PD and satellite HD, revenues per patient for these modalities remain fixed at all levels of alternative dialysis treatment use. Revenues per hospital HD patient increase up to the point where 35% of the patients are treated with alternative dialysis modalities and remain constant thereafter. Obviously, the linearly declining revenue per dialysis patient after the point where 35% of the patients is on an alternative dialysis modality is due to the fixed reimbursement for all modalities from that point onwards and the reimbursement of alternative dialysis modalities being lower than the reimbursement for hospital HD.
0
1.000.000
2.000.000
3.000.000
4.000.000
5.000.000
6.000.000
0 5 10 15 20 25 30 35 40 45 50 55 60 65 70 75 80 85 90 95 100
% patients on alternative dialysis modalities
Total revenues Hospital HD
Revenue PD
Revenue satellite HD
Total revenues alternative dialysis treatments
Total revenue dialysis programme
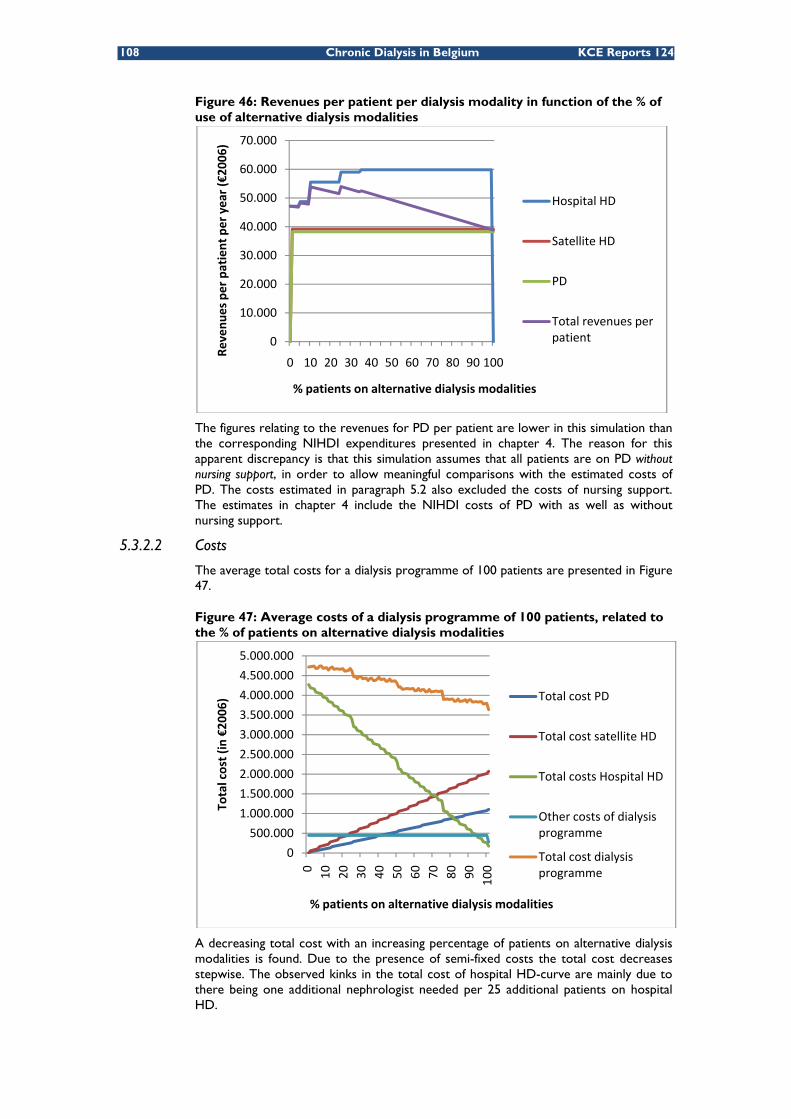
108 Chronic Dialysis in Belgium KCE Reports 124
Figure 46: Revenues per patient per dialysis modality in function of the % of use of alternative dialysis modalities
The figures relating to the revenues for PD per patient are lower in this simulation than the corresponding NIHDI expenditures presented in chapter 4. The reason for this apparent discrepancy is that this simulation assumes that all patients are on PD without nursing support, in order to allow meaningful comparisons with the estimated costs of PD. The costs estimated in paragraph 5.2 also excluded the costs of nursing support. The estimates in chapter 4 include the NIHDI costs of PD with as well as without nursing support.
5.3.2.2 Costs
The average total costs for a dialysis programme of 100 patients are presented in Figure 47.
Figure 47: Average costs of a dialysis programme of 100 patients, related to the % of patients on alternative dialysis modalities
A decreasing total cost with an increasing percentage of patients on alternative dialysis modalities is found. Due to the presence of semi-fixed costs the total cost decreases stepwise. The observed kinks in the total cost of hospital HD-curve are mainly due to there being one additional nephrologist needed per 25 additional patients on hospital HD.
0
10.000
20.000
30.000
40.000
50.000
60.000
70.000
0 10 20 30 40 50 60 70 80 90 100
Revenu
es per patient per year (€20
06)
% patients on alternative dialysis modalities
Hospital HD
Satellite HD
PD
Total revenues per patient
0
500.000
1.000.000
1.500.000
2.000.000
2.500.000
3.000.000
3.500.000
4.000.000
4.500.000
5.000.000
0 10 20 30 40 50 60 70 80 90 100
Total cost (in €20
06)
% patients on alternative dialysis modalities
Total cost PD
Total cost satellite HD
Total costs Hospital HD
Other costs of dialysis programme
Total cost dialysis programme

KCE Report 124 Chronic Dialysis in Belgium 109
5.3.2.3 Revenues and costs balance
Figure 48 shows the balance between the revenues and costs, with its area of uncertainty. With the current information on costs, and for a dialysis centre with a per diem price of €269.44, the average revenues equal the average costs if about 5% of the patients are treated with alternative dialysis modalities. Below this 5% average revenues are lower than average costs, implying a deficit to the hospital; above this 5% the hospital makes on average a profit. The grey zone around the black mean cost curve represents the variability (± 1 standard deviation) in costs across hospitals, resulting from the Monte Carlo simulations on costs. It shows that some hospitals might make profits at or even below 5% alternative dialysis modalities, while some will make losses even up to 10% of alternative modality use.
Figure 48: Short term revenues-cost balance of a dialysis programme with 100 patients related to the proportion of patients on alternative dialysis modalities
According to our simulations, mean profits are maximised if 28% of patients are treated with an alternative dialysis modality under current reimbursement rules and values. Total profits amount to approximately €934 700 per year for a dialysis programme with 100 patients (in €2006). In 2006, the average proportion of PD+satellite HD in total dialysis (excluding home HD) was 33.72% in Belgian dialysis centres (source: Dialysevragenlijst RIZIV 2006).
Figure 49 and Figure 50 show the costs and revenues for respectively the alternative dialysis modalities and hospital HD related to the proportion of patients on alternative dialysis modalities. Fixed costs related to the dialysis programme (independent from the distribution of patients between modalities) are not included in these figures because they cannot be attributed to one specific modality. This explains why the figures do not show the same deficits as Figure 48 for levels of alternative dialysis use below 5%. The sum of the profits generated by hospital HD and the profits generated by the alternative dialysis modalities MINUS the general fixed costs correspond to the profits (and losses) presented in Figure 48.
934.715
-400.000
-200.000
0
200.000
400.000
600.000
800.000
1.000.000
1.200.000
0 5 10 15 20 25 30 35 40 45 50 55 60 65 70 75 80 85 90 95 100
Annual net results (in €2006)
% patients on alternative dialysis modalities
5% ‐ 95%
+/‐1 Std. Dev.
Mean
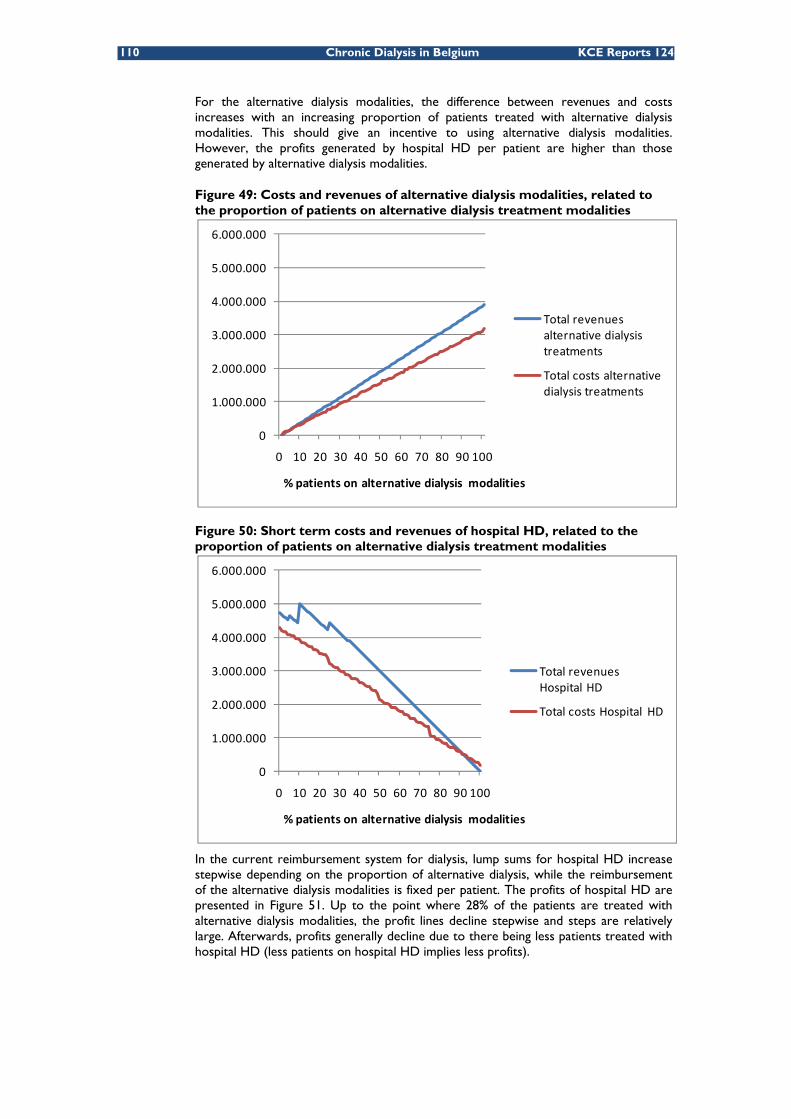
110 Chronic Dialysis in Belgium KCE Reports 124
For the alternative dialysis modalities, the difference between revenues and costs increases with an increasing proportion of patients treated with alternative dialysis modalities. This should give an incentive to using alternative dialysis modalities. However, the profits generated by hospital HD per patient are higher than those generated by alternative dialysis modalities.
Figure 49: Costs and revenues of alternative dialysis modalities, related to the proportion of patients on alternative dialysis treatment modalities
Figure 50: Short term costs and revenues of hospital HD, related to the proportion of patients on alternative dialysis treatment modalities
In the current reimbursement system for dialysis, lump sums for hospital HD increase stepwise depending on the proportion of alternative dialysis, while the reimbursement of the alternative dialysis modalities is fixed per patient. The profits of hospital HD are presented in Figure 51. Up to the point where 28% of the patients are treated with alternative dialysis modalities, the profit lines decline stepwise and steps are relatively large. Afterwards, profits generally decline due to there being less patients treated with hospital HD (less patients on hospital HD implies less profits).
0
1.000.000
2.000.000
3.000.000
4.000.000
5.000.000
6.000.000
0 10 20 30 40 50 60 70 80 90 100
% patients on alternative dialysis modalities
Total revenues alternative dialysis treatments
Total costs alternative dialysis treatments
0
1.000.000
2.000.000
3.000.000
4.000.000
5.000.000
6.000.000
0 10 20 30 40 50 60 70 80 90 100
% patients on alternative dialysis modalities
Total revenues Hospital HD
Total costs Hospital HD

KCE Report 124 Chronic Dialysis in Belgium 111
The profits of alternative dialysis modalities show a smoother increase with the number of patients on alternative dialysis. This is because of the fixed reimbursement rate for alternative dialysis modalities and the preponderance of variable costs in total costs of these modalities. Variable costs as well as reimbursement increase linearly with the number of patients on alternative dialysis modalities. Therefore the total profits increase the more patients are treated with these modalities.
Figure 51 jj also shows that treating 65 patients out of 100 with alternative dialysis modalities (of which 44 on satellite HD, 11 on CAPD and 10 on APD) generates the same profit as treating 35 patients out of 100 with hospital HD (represented by the intersection between the “profit alternative dialysis”-line and the “profit hospital HD”-line). As a consequence, the presumed positive financial incentive created for alternative dialysis modalities turns out to be a financial disincentive for the use of alternative dialysis modalities because beyond the point where 28% of the patients are treated with alternative dialysis modalities the marginal profit from a further increase in alternative dialysis is negative (meaning that profits diminish).
Figure 51: Contribution of hospital HD and alternative dialysis modalities to the annual net result of a hypothetical 100-patient dialysis programme*
* General fixed costs related to the dialysis programme in se are not taken into account in this figure. These costs cannot be attributed to a specific modality. The sum of the profits generated by hospital HD and the profits generated by the alternative dialysis modalities MINUS the general fixed costs correspond to the profits (and losses) presented in Figure 48.
Key points
• In the simulated average Belgian dialysis programme, short run profits are maximized if on average 28% of the patients are on alternative dialysis treatments (PD or satellite HD). In 2006 the average proportion of PD and satellite HD in total dialysis (excluding home HD) was 33.72% in the Belgian dialysis centres.
• A dialysis programme with average costs (including fixed costs) makes a deficit if less than 5% of the patients are on alternative dialysis.
• The presumed financial incentives for alternative dialysis treatments in practice turn out to be financial disincentives.
jj Note that this figure includes only variable and semi-fixed costs. Fixed costs do not change with the
number of patients on alternative dialysis modalities and hence would be disregarded for –purely hypothetical- short term decisions on the “optimal” level of alternative dialysis use. We emphasize this is purely hypothetical as decisions about dialysis modalities are of course in first instance inspired by other considerations than financial profits.
‐400.000
‐200.000
0
200.000
400.000
600.000
800.000
1.000.000
1.200.000
1.400.000
1.600.000
0 10 20 30 40 50 60 70 80 90 100
Ann
ual net result (in
€20
06)
% patients on alternative dialysis modalities
Profit hospital HD
Profit alternative dialysis
Total profit
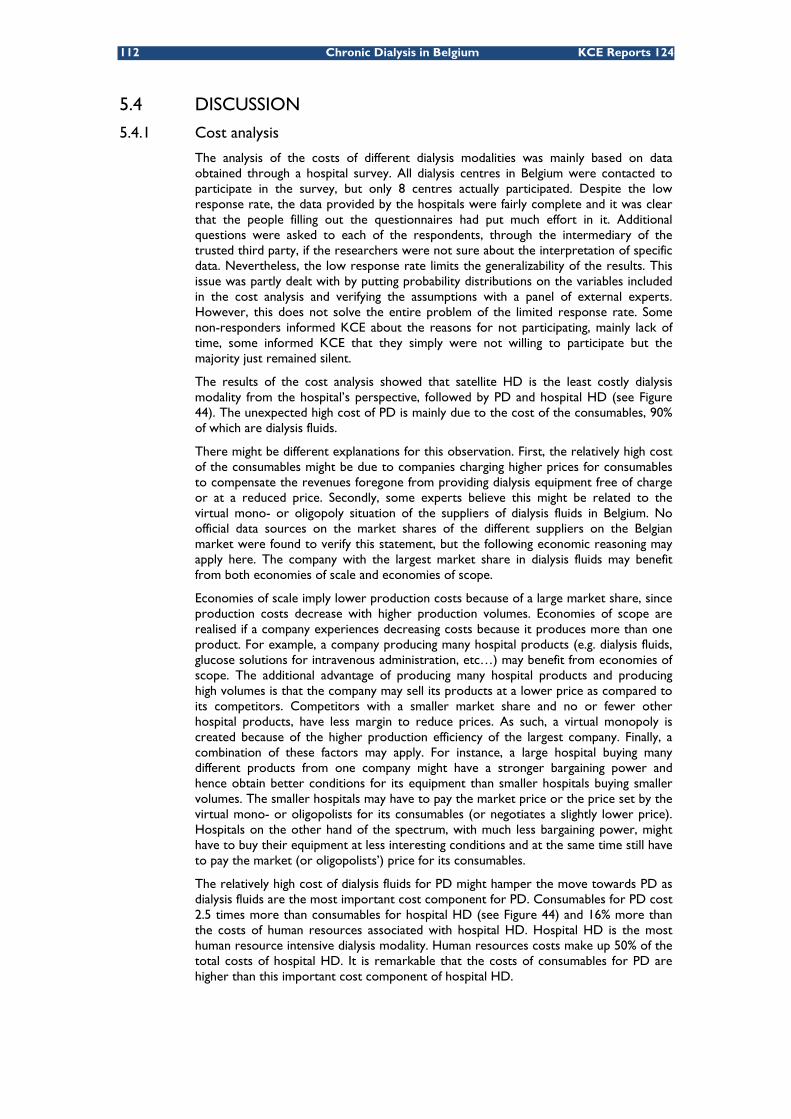
112 Chronic Dialysis in Belgium KCE Reports 124
5.4 DISCUSSION
5.4.1 Cost analysis
The analysis of the costs of different dialysis modalities was mainly based on data obtained through a hospital survey. All dialysis centres in Belgium were contacted to participate in the survey, but only 8 centres actually participated. Despite the low response rate, the data provided by the hospitals were fairly complete and it was clear that the people filling out the questionnaires had put much effort in it. Additional questions were asked to each of the respondents, through the intermediary of the trusted third party, if the researchers were not sure about the interpretation of specific data. Nevertheless, the low response rate limits the generalizability of the results. This issue was partly dealt with by putting probability distributions on the variables included in the cost analysis and verifying the assumptions with a panel of external experts. However, this does not solve the entire problem of the limited response rate. Some non-responders informed KCE about the reasons for not participating, mainly lack of time, some informed KCE that they simply were not willing to participate but the majority just remained silent.
The results of the cost analysis showed that satellite HD is the least costly dialysis modality from the hospital’s perspective, followed by PD and hospital HD (see Figure 44). The unexpected high cost of PD is mainly due to the cost of the consumables, 90% of which are dialysis fluids.
There might be different explanations for this observation. First, the relatively high cost of the consumables might be due to companies charging higher prices for consumables to compensate the revenues foregone from providing dialysis equipment free of charge or at a reduced price. Secondly, some experts believe this might be related to the virtual mono- or oligopoly situation of the suppliers of dialysis fluids in Belgium. No official data sources on the market shares of the different suppliers on the Belgian market were found to verify this statement, but the following economic reasoning may apply here. The company with the largest market share in dialysis fluids may benefit from both economies of scale and economies of scope.
Economies of scale imply lower production costs because of a large market share, since production costs decrease with higher production volumes. Economies of scope are realised if a company experiences decreasing costs because it produces more than one product. For example, a company producing many hospital products (e.g. dialysis fluids, glucose solutions for intravenous administration, etc…) may benefit from economies of scope. The additional advantage of producing many hospital products and producing high volumes is that the company may sell its products at a lower price as compared to its competitors. Competitors with a smaller market share and no or fewer other hospital products, have less margin to reduce prices. As such, a virtual monopoly is created because of the higher production efficiency of the largest company. Finally, a combination of these factors may apply. For instance, a large hospital buying many different products from one company might have a stronger bargaining power and hence obtain better conditions for its equipment than smaller hospitals buying smaller volumes. The smaller hospitals may have to pay the market price or the price set by the virtual mono- or oligopolists for its consumables (or negotiates a slightly lower price). Hospitals on the other hand of the spectrum, with much less bargaining power, might have to buy their equipment at less interesting conditions and at the same time still have to pay the market (or oligopolists’) price for its consumables.
The relatively high cost of dialysis fluids for PD might hamper the move towards PD as dialysis fluids are the most important cost component for PD. Consumables for PD cost 2.5 times more than consumables for hospital HD (see Figure 44) and 16% more than the costs of human resources associated with hospital HD. Hospital HD is the most human resource intensive dialysis modality. Human resources costs make up 50% of the total costs of hospital HD. It is remarkable that the costs of consumables for PD are higher than this important cost component of hospital HD.

KCE Report 124 Chronic Dialysis in Belgium 113
The cost analysis presented in this chapter is performed from the perspective of the hospital. Its results underestimate the true total cost of dialysis from a societal point of view. A number of important cost items are not included, such as nursing support at home in case of PD, patient transportation costs, PD patients’ medication costs, out-of-pocket expenses of patients and their caregiver and caregiver’s time investment. Some of these costs, however, are dealt with in chapter 4 of this report, and a summary of the analysis on home nursing costs for dialysis patients performed by the “Wit-Gele Kruis” has been presented in chapter 3.
Patient’s transport is reimbursed by the NIHDI. The patients receive the reimbursement directly from their sickness fund. In addition to the legal reimbursement provided by the NIHDI, patients can receive additional reimbursement from their sickness fund as part of the complementary insurance package. Large differences exist, however, between sickness funds. The standard NIHDI reimbursement is €0.25 per kilometre, with a maximum of 30 km single journey or to the nearest dialysis centre. Patients can use different means of transportation. As shown in Table 68 most patients go to the dialysis centre by taxi. This can be a taxi shared with other patients. Some sickness funds and dialysis centres organise shared transport to the hospital for dialysis patients for which they make an agreement with private taxi companies. The cost of patient transport for the NIHDI was described in chapter 4.
Table 68: Means of transportation used by HD patients Ambulance, lying 4% Ambulance, sitting 14% Taxi 54% Public transport 5% Private transport 23% Source: ORPADT survey 2006
5.4.2 Simulation of revenues and costs
A short term revenues/cost scenario was presented for a hypothetical “average” dialysis programme with 100 patients. Revenues and costs were estimated in function of the proportion of patients on alternative dialysis modalities. The balance shows that dialysis programmes are on average profitable for a hospital, especially at a proportion of patients on alternative dialysis modalities superior to 10%. In reality, a hospital’s balance may deviate from the estimated average, mainly due to differences in the cost structure, case mix or efficiency.
The simulations described in this chapter are performed from a purely financial point of view and look at a dialysis programme as an isolated hospital activity of a hospital. In practice, however, the hospital management is concerned with the full set of activities at the hospital rather than each of the activities separately. In that sense, the profits generated by the dialysis activities of a hospital might be used to cover the deficits incurred by other hospital services. This does not mean that from a financial point of view large imbalances between costs and revenues are desirable. Such imbalances reduce transparency.
For the calculation of the balance between revenues and costs, no distinction was made between the character of the revenues of hospital HD and the character of the revenues for alternative dialysis modalities. The revenues of hospital HD consist of a lump sum and a medical fee (honorarium), while the revenues of PD consist of a lump sum only. The presumption was that the total revenues of hospital HD, including lump sums and honoraria, should compensate the total costs of hospital HD (including, besides other components, medical personnel). This distinction between lump sums and honoraria was therefore irrelevant for the specific cost-benefit analysis presented here, but for medical professionals this will not be perceived as such. Honoraria are perceived as a direct remuneration of the work of medical doctors (and hence belonging to them), while a lump sum is considered a reimbursement of operational costs like nursing personnel, buildings, equipment and material belonging to the hospital.

114 Chronic Dialysis in Belgium KCE Reports 124
In case of dialysis, however, honorarium fees are supposed to cover part of the consumables associated with hospital HD. The precise proportion is not specified by law. As a result, the income from the nephrologist is the result of a negotiation between the hospital management and the nephrologists.
In the hypothetical dialysis programme with 100 patients, about 48% of the total revenues for hospital HD are honoraria. For the alternative dialysis modalities the revenues consist entirely and exclusively of lump sums. Therefore, because physicians are not remunerated for PD in the same way as for hospital HD, i.e. by means of a honorarium fee, physicians might feel less inclined to guide a patient who has different treatment options and who is indifferent or asks for decision support, towards alternative dialysis treatments. The incremental lump sum mechanism creates, from this point of view, only in theory a positive incentive for the hospital management. This is only in theory because, as demonstrated by the revenues-cost analysis, also from a hospital’s financial point of view the incentive stops if 28% of the patients are on alternative dialysis modalities.
Finally, this revenues-cost simulation does not take any medical considerations into account. The objective was limited to the evaluation of the financial consequences and built-in incentives of the current financing mechanisms for dialysis, given the costs from the hospitals’ point of view resulting from the cost analysis. This analysis should not be read in isolation from the other parts of this study, and medical criteria for choosing between dialysis preferences and patient preferences are described in other chapters.
Key points
Cost analysis
• The analysis of the costs of different dialysis modalities in Belgium from the perspective of the hospital was hampered by a low response rate on the cost survey but variability in cost estimates was taken into account and results appeared consistent.
• Costs from the hospitals’ perspective underestimate the costs of dialysis from a societal point of view.
Revenues – cost simulation
• According to the simulation, the optimal proportion of patients on alternative dialysis modalities (from a purely financial point of view from the hospitals’ perspective) is approximately 28%.
• Presumed positive financial incentives for the use of alternative dialysis modalities might be neutralized by the profits generated by hospital HD.
• Because alternative dialysis modalities are reimbursed by means of lump sums only and hospital HD by lump sums and a honorarium fee, physicians might not be given the right financial incentives to promote alternative dialysis modalities.
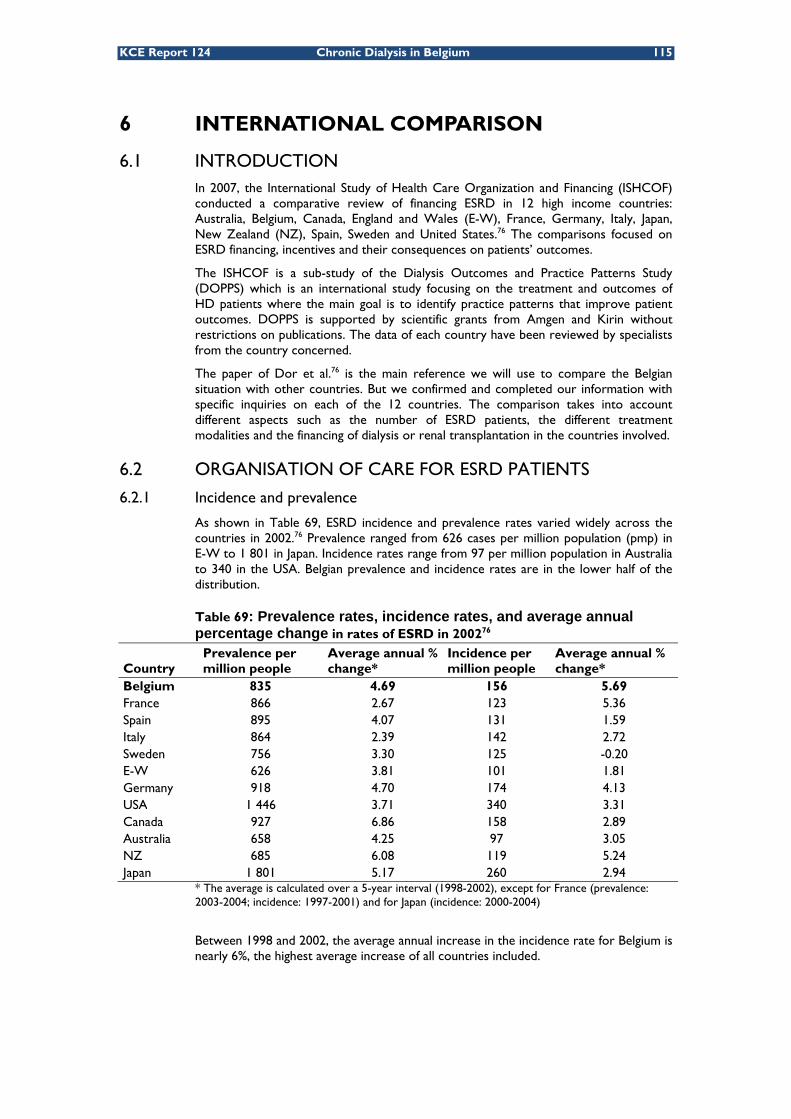
KCE Report 124 Chronic Dialysis in Belgium 115
6 INTERNATIONAL COMPARISON
6.1 INTRODUCTION In 2007, the International Study of Health Care Organization and Financing (ISHCOF) conducted a comparative review of financing ESRD in 12 high income countries: Australia, Belgium, Canada, England and Wales (E-W), France, Germany, Italy, Japan, New Zealand (NZ), Spain, Sweden and United States.76 The comparisons focused on ESRD financing, incentives and their consequences on patients’ outcomes.
The ISHCOF is a sub-study of the Dialysis Outcomes and Practice Patterns Study (DOPPS) which is an international study focusing on the treatment and outcomes of HD patients where the main goal is to identify practice patterns that improve patient outcomes. DOPPS is supported by scientific grants from Amgen and Kirin without restrictions on publications. The data of each country have been reviewed by specialists from the country concerned.
The paper of Dor et al.76 is the main reference we will use to compare the Belgian situation with other countries. But we confirmed and completed our information with specific inquiries on each of the 12 countries. The comparison takes into account different aspects such as the number of ESRD patients, the different treatment modalities and the financing of dialysis or renal transplantation in the countries involved.
6.2 ORGANISATION OF CARE FOR ESRD PATIENTS
6.2.1 Incidence and prevalence
As shown in Table 69, ESRD incidence and prevalence rates varied widely across the countries in 2002.76 Prevalence ranged from 626 cases per million population (pmp) in E-W to 1 801 in Japan. Incidence rates range from 97 per million population in Australia to 340 in the USA. Belgian prevalence and incidence rates are in the lower half of the distribution.
Table 69: Prevalence rates, incidence rates, and average annual percentage change in rates of ESRD in 200276
Country Prevalence per million people
Average annual % change*
Incidence per million people
Average annual % change*
Belgium 835 4.69 156 5.69 France 866 2.67 123 5.36 Spain 895 4.07 131 1.59 Italy 864 2.39 142 2.72 Sweden 756 3.30 125 -0.20 E-W 626 3.81 101 1.81 Germany 918 4.70 174 4.13 USA 1 446 3.71 340 3.31 Canada 927 6.86 158 2.89 Australia 658 4.25 97 3.05 NZ 685 6.08 119 5.24 Japan 1 801 5.17 260 2.94
* The average is calculated over a 5-year interval (1998-2002), except for France (prevalence: 2003-2004; incidence: 1997-2001) and for Japan (incidence: 2000-2004)
Between 1998 and 2002, the average annual increase in the incidence rate for Belgium is nearly 6%, the highest average increase of all countries included.

116 Chronic Dialysis in Belgium KCE Reports 124
6.2.2 Number of nephrologists
Table 70 and Figure 52 show the average number of patients treated per nephrologist. There are important differences between ISHCOF countries concerning the average number of patients per nephrologist. The ratio ranges between one nephrologist for 15 patients in Italy to one for 123 patients in England and Wales. It is however unclear whether for all countries the renal transplant patients were included in the patient numbers per nephrologist. The ratios may therefore not be completely comparable between the countries. The average for the 12 ISHCOF countries is one nephrologist for 56 patients. The value observed for Belgium is around the median value of the sample.
Table 70: Nephrologist/patients ratio Nephrologists/patients Rank Belgium 1 / 42 5 France 1 / 48 7 Spain 1 / 39 4 Italy 1 / 15 1 Sweden 1 / 28 2 England and Wales 1 / 123 11 Germany 1 / 45 6 USA 1 / 48 7 Canada 1 / 65 8 Australia 1 / 79 9 New Zealand 1 / 102 10 Japan 1 / 35 3 Data of 2001 for Australia; 2002 for Canada; 2003 for E-W and USA; 2004 for France and New Zealand; 2005 for Belgium; 2006 for Spain; when it is not specified in the article, we assume it corresponds to the time window of the studies: 2002-2003 for Sweden and 2004-2005 for Italy, Germany and Japan
Figure 52: Patients/Nephrologist ratio
In Sweden, the territory is divided into several counties and the number of primary care physicians and nephrologists is limited by each county. Moreover, the historic lack of physicians in several disciplines has forced the development of very skilled nurses.77
In Germany, the number of physicians involved in the care of ESRD patients is linked to the number of patients treated at each centre. Kleophas and Reichel precise that to ensure treatment quality this number must be limited to a maximum of 50 patients per nephrologist.78
0
20
40
60
80
100
120
Italy
Swed
en
Japa
n
Spai
n
Belg
ium
Ger
man
y
Fran
ce
USA
Can
ada
Aust
ralia N Z
E-W
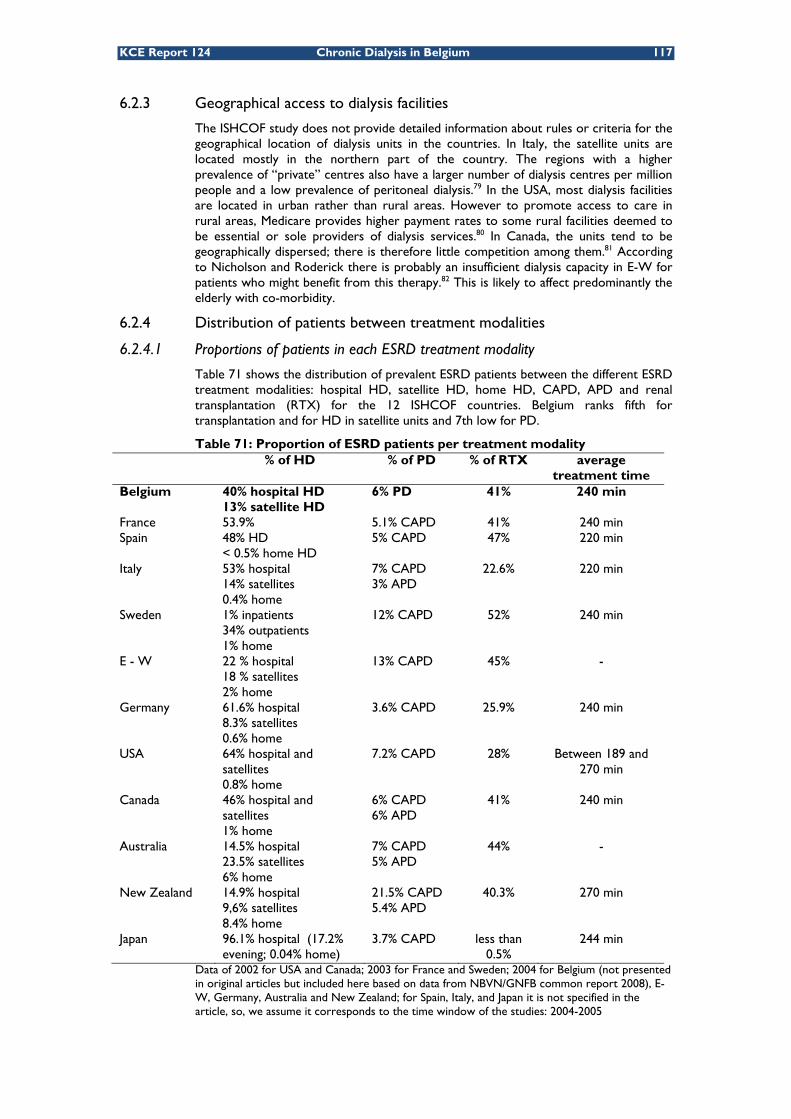
KCE Report 124 Chronic Dialysis in Belgium 117
6.2.3 Geographical access to dialysis facilities
The ISHCOF study does not provide detailed information about rules or criteria for the geographical location of dialysis units in the countries. In Italy, the satellite units are located mostly in the northern part of the country. The regions with a higher prevalence of “private” centres also have a larger number of dialysis centres per million people and a low prevalence of peritoneal dialysis.79 In the USA, most dialysis facilities are located in urban rather than rural areas. However to promote access to care in rural areas, Medicare provides higher payment rates to some rural facilities deemed to be essential or sole providers of dialysis services.80 In Canada, the units tend to be geographically dispersed; there is therefore little competition among them.81 According to Nicholson and Roderick there is probably an insufficient dialysis capacity in E-W for patients who might benefit from this therapy.82 This is likely to affect predominantly the elderly with co-morbidity.
6.2.4 Distribution of patients between treatment modalities
6.2.4.1 Proportions of patients in each ESRD treatment modality
Table 71 shows the distribution of prevalent ESRD patients between the different ESRD treatment modalities: hospital HD, satellite HD, home HD, CAPD, APD and renal transplantation (RTX) for the 12 ISHCOF countries. Belgium ranks fifth for transplantation and for HD in satellite units and 7th low for PD.
Table 71: Proportion of ESRD patients per treatment modality % of HD % of PD % of RTX average
treatment time Belgium 40% hospital HD
13% satellite HD 6% PD 41% 240 min
France 53.9% 5.1% CAPD 41% 240 min Spain 48% HD
< 0.5% home HD 5% CAPD 47% 220 min
Italy 53% hospital 14% satellites 0.4% home
7% CAPD 3% APD
22.6% 220 min
Sweden 1% inpatients 34% outpatients 1% home
12% CAPD 52% 240 min
E - W 22 % hospital 18 % satellites 2% home
13% CAPD 45% -
Germany 61.6% hospital 8.3% satellites 0.6% home
3.6% CAPD 25.9% 240 min
USA 64% hospital and satellites 0.8% home
7.2% CAPD 28% Between 189 and 270 min
Canada 46% hospital and satellites 1% home
6% CAPD 6% APD
41% 240 min
Australia 14.5% hospital 23.5% satellites 6% home
7% CAPD 5% APD
44% -
New Zealand 14.9% hospital 9,6% satellites 8.4% home
21.5% CAPD 5.4% APD
40.3% 270 min
Japan 96.1% hospital (17.2% evening; 0.04% home)
3.7% CAPD less than 0.5%
244 min
Data of 2002 for USA and Canada; 2003 for France and Sweden; 2004 for Belgium (not presented in original articles but included here based on data from NBVN/GNFB common report 2008), E-W, Germany, Australia and New Zealand; for Spain, Italy, and Japan it is not specified in the article, so, we assume it corresponds to the time window of the studies: 2004-2005

118 Chronic Dialysis in Belgium KCE Reports 124
6.2.4.2 Average number of patients per centre
In Table 72 we calculated for each country for which data were available the average number of patients per hospital or satellite HD unit and per hospital doing transplantation. Our calculations are based on information given in Error! Reference source not found. and Table 71. For some countries (France, Spain, Sweden, Canada, Australia and Japan) only the number of transplanted patients per hospital are given.
Table 72: Average number of ESRD patients per treatment centre and per modality
Patients per hospital HD unit
Patients per satellite HD unit
Transplanted patients per hospital
Belgium 54 21 551 France 576 Spain 453 Italy 28 25 277 Sweden 879 E - W 127 56 742 Germany 152 8 530 Canada 520 Australia 272 New Zealand 47 34 382 Japan 7
Figure 53 positions Belgium within the entire group of ISHCOF countries for the 3 treatment modalities concerned.
Figure 53: Average number of ESRD patients per dialysis or transplantation unit and per treatment modality
0
100
200
300
400
500
600
700
800
900
1000
Italy
Sw
eden N
Z
Bel
gium E-W
Ger
man
y
Ger
man
y
Bel
gium Ita
ly
NZ
Sw
eden
E-W
Japa
n
Aust
ralia Italy
NZ
Spa
in
Can
ada
Ger
man
y
Bel
gium
Fran
ce
E-W
Sw
eden
Hospital HD
Satellite HD Transplantation

KCE Report 124 Chronic Dialysis in Belgium 119
6.2.5 Incentives and criteria influencing the choice of the treatment
6.2.5.1 Comparison of incentives for transplantation
Renal transplantation is considered the optimal treatment strategy for ESRD. But all ISHCOF countries have a waiting list for transplantation due to a lack of donors. To increase the donation rate each country attempts to develop incentives for donation. For instance, the French Ministry of Health has provided human and financial resources to launch a national donation campaign and the age limit for donors was increased to 70 years.83 The government of New Zealand gives compensations to living kidney donors toward loss of income and has set up a national organ donor registry in 2005.84 In the last decade, Spain has had a continuous increase of cadaveric organ donation. This success may have resulted in part from the creation in 1989 of the National Transplant Organization. This agency manages the transplant waiting list, assists hospital transplant coordinators and coordinates the distribution of organs. Each transplant hospital has a transplant coordinator team that must be available 24 hours a day. Moreover, a financial incentive is given to nephrologists per transplantation. This sum represents 10%-25% of their salary.85 An “old-for-old” program is established in Germany: transplant candidates over 65 may only receive organs from donors in their same age cohort.76 In Japan, where there is widespread believe that removing organs from a donor after brain death is equivalent to murder, the government does not promote transplantation from brain death donors. As a result, the absolute number of kidney transplantations is low and most of them are from living donors who are related to the patient.86
6.2.5.2 Characteristics of patients eligible for transplantation
As there are not enough grafts for all potentially eligible patients criteria are applied to give priority for transplantation to specific patients. In the USA, patients eligible for transplantation are healthier than the average ESRD patients.87 In France, priority is given to hyper-immunized patients, followed by candidates from the same region, children, patients awaiting a pancreas-kidney graft, and patients with the longest waiting time.83 In New Zealand, to be eligible for the transplant waiting list, patients are generally required to have a more than 80% chance of two-year survival from all causes of mortality. Other waiting list criteria incorporate the extent and impact of co-morbidities such as cancer and cardiovascular disease.84 In England and Wales, children and patients regarded as difficult to match are favoured for transplantation.82 In Japan, children receive the highest priority. Patients who are positive for hepatitis C virus are matched with kidneys that are positive for the same virus. Priority is then given to recipients who are in the same region as the donor or who have been waiting a long time for a kidney.86
6.2.5.3 Criteria for dialysis facilities
In Belgium, ESRD patients on the transplant waiting list or patients not eligible for transplantation can choose among different dialysis modalities. In some other countries patients have no or a constrained choice. Reasons for a constrained choice might be related to geographical access to dialysis centres, governmental planning of dialysis facilities or established clinical practice patterns in the country. Geographical access
In the E-W patients in general have no choice due to the shortage of dialysis units in E-W. Even in the larger urban areas, such as Greater London and Manchester, renal services have been consolidated in a few main centres.82
In Sweden, patients living in rural areas most often have to travel long distances to reach a dialysis unit. To avoid this burdensome transport patients may prefer PD.77 Governmental planning
All French dialysis centres have an occupancy rate close to 100%. This is the result of state-managed, regional planning, which determines the number of facilities required to treat the population of ESRD patients. The government authorizes centres to provide care accordingly. This system results in very little competition between the centres because they are guaranteed to have their beds filled.83

120 Chronic Dialysis in Belgium KCE Reports 124
In Spain, the Health Authority of each autonomous community determines the number of authorized units needed to cover dialysis and transplantation needs in function of the ESRD prevalence in each area and quality criteria fixed by the Health regulation. It assigns patients to units in function of their home address.85
Clinical practice pattern
The decreasing incidence rate of ESRD in Sweden suggests that there is a decreasing tendency to initiate ESRD treatment in very old patients.77 In Germany, hospital-based dialysis facilities are supposed to treat ESRD patients with more co-morbidities than patients in other settings.78 In the past, patients in New Zealand have been rejected for treatment because of older age or the presence of diabetes mellitus. These criteria have now been abandoned in clinical practice.84
New Zealand has the highest prevalence of home-based and self-care dialysis in the world. This practice pattern and dialysis infrastructure has evolved in part from a philosophical position among nephrologists that this form of dialysis is better. Based on observational data nephrologists in New Zealand perceive PD and HD to generate equivalent outcomes and that home HD generates generally better outcomes than satellite or hospital HD. Home-based therapies have also been perpetuated by the need to minimize costs. However, it might limit access to dialysis for less capable or medically more unstable patients who are treated palliatively for ESRD without dialysis.84
6.3 ESRD FUNDING
6.3.1 Introduction
In this section, we present for each country the budget linked to ESRD treatment compared to the budget of health care, the financing rules used for payment of physicians and dialysis units, the proportion of out-of-pocket payments made by the patient and the incentives used to contain costs.
6.3.2 National budget for ESRD patients
Table 73 and Figure 54 show the proportion of the Gross Domestic Product (GDP) allocated to health care and the proportion of the total health care budget allocated to ESRD treatment for each of the 12 ISCHOF countries.
Table 73: ESRD expenditures as a proportion of total health care expenditures
Health care expenditures as a % of GDP
ESRD expenditures as a % of total health care expenditures
Belgium 9 1.8 France 10.5 1.3 Spain 7.7 1.5 Italy 8.3 1.8 Sweden 9.2 - England and Wales 8.7 1.5 Germany 11 - USA 14.6 1.8 Canada 9.3 1.2 Australia - - New Zealand 8.5 0.91 Japan 7.9 3.7
Data of 2001 for Belgium and Italy; 2002 for Sweden, USA, Canada, N Z and Japan; 2003 for Spain and Germany; 2004 for France and E-W
Figure 54 shows a positive correlation between the annual health expenditures per capita and the annual expenditures per ESRD patient.

KCE Report 124 Chronic Dialysis in Belgium 121
Figure 54: Annual expenditure per ESRD patient and general population health expenditure per capita, 200376
ESRD expenditures data have been inflated at 3% per year to estimate the year 2003
The figure suggests at first glance that higher annual health care expenditures per capita are associated with higher annual expenditures per ESRD patient. However, excluding the US from the regression analysis would flatten the linear relationship considerably.
According to Wikström et al.77, the cost of a functioning kidney transplantation is about one-fifth of the cost of treating a HD patient for one year, except for the year of the transplantation where it is about one-half.
6.3.3 Financing of dialysis physicians
Table 74 summarises the financing modalities for physicians and dialysis units.
In Italy, Spain and Sweden, ESRD physicians are employed by the hospitals and are salaried. Most physicians from Belgium working in a university hospital are also salaried; while the others are paid on a fee-for-service basis. The hospital-based physicians of Japan and E-W and those working in public hospitals of France and Australia receive a salary. The office-based physicians of France, Japan and New-Zealand and those working in private hospitals (France and Australia) are paid a fee for service. The non-hospital-based physicians of E-W and New Zealand are paid through a capitation payment. Finally, in the USA, physicians receive a fixed monthly capitation payment for outpatient services and a fee-for-service for hospitalized patients.
Table 74: Payment rules76 Dialysis units Physicians Belgium FFS Salary, FFS France Mix Salary, FFS Spain FFS Salary Italy FFS Salary Sweden Global budget Salary England and Wales Mix Salary, Capitation Germany Outpatient dialysis:
fixed lump sum Inpatient dialysis: FFS
FFS
USA Mix Capitation, FFS Canada Global budget FFS Australia Mix Salary, FFS New Zealand Global budget Capitation, FFS Japan Mix Salary, FFS FFS= fee-for-service or fee-per-treatment session

122 Chronic Dialysis in Belgium KCE Reports 124
6.3.4 Financing of dialysis units
Health care systems in the ISCHOF countries are clearly different. However, treatment for ERSD is primarily funded through social insurance, with relatively low levels of patients’ co-payments.
In several countries the organization and financing of ESRD services is fully integrated into the main national health care system. In others, they are governed by the regional health care authorities. This is the case, for example, in Australia, New Zealand and some Canadian provinces where regional health authorities administer specific ESRD programs.
There are large differences between the payment systems of countries. Three types of models tend to dominate the financing mechanisms of dialysis units. Table 74 summarises for each ISHCOF country the financing mechanisms for both the dialysis units and the physicians.
6.3.4.1 Fee for service or fee-per-session
In Italy each centre is reimbursed according to the outpatient services performed. The amount of the fees depends on the type and location of the dialysis unit. In Spain, the public insurance system pays facilities for each individual session on a fee-for-service basis. In Germany, a distinction is made between the reimbursement of dialysis services for inpatient dialysis treatments and ambulatory dialysis services. Inpatient dialysis services are reimbursed per dialysis procedure, while ambulatory dialysis services are paid by means of a lump sum per week. The reimbursement for ambulatory dialysis treatments is a weekly flat rate independent of the mode of dialysis procedure and the frequency of dialysis treatment.
6.3.4.2 Global budget
In Canada and New Zealand, regional ESRD authorities receive overall budgets, which they allocate to various providers (province or territory). This system confers flexibility in allocating resources among centres based on needs and patient flows. In Sweden, the annual budget is the result of a negotiation between the government and the physicians in function of their expected patients load for the following year.
6.3.4.3 Mix
Australia, USA, Japan and England and Wales have a mixed system. In Australia, public facilities receive an annual grant based on the annual number of dialysis patients. There has been a movement towards a two parts payment system, consisting of a capitation payment designed to cover fixed costs and a case payment to cover variable costs.88 The specific annual capitation grant is payable to the parent centre, while the case payment per dialysis session is made directly to the providers of in-centre and satellite services. In the United States, payment for HD and related services for ESRD is a mix of a fee-for-service and a prospective payment. Dialysis facilities are reimbursed by a single “composite rate” payment per dialysis treatment which covers the basic services. In Japan, the reimbursement system for ambulatory dialysis has both a prospective price system (PPS) component and a fee-for-service component. The fee-for-service covers the dialyzers, drugs, special examinations (such as diagnostic imaging) and clinical biology. The PPS component covers the other costs of treatment, such as personnel costs, dialysis fluid and anti-coagulants. On average, 79% of the reimbursement is PPS and 21% is fee-for-service.
The Payment by Results system, introduced recently in England and Wales, has tariffs based on the average national reference cost of Healthcare Resource Groups. This system is similar to the DRG system. For renal services, the idea was to introduce this system from April 2008 onwards, but due to problems with the data that should form the basis for the calculation of the national tariffs for dialysis the introduction has been postponed until November 2010. At this moment, contracts between commissioners and dialysis providers tend to incorporate a global budget through prospective payments (depending on the planned activity) or fee-for-service (per outpatient HD treatment and transplant).

KCE Report 124 Chronic Dialysis in Belgium 123
In Belgium, PD is reimbursed per patient per week89, while satellite and home HD are reimbursed per session, three times a week (see chapter 3). Hospital HD is reimbursed per session with no limit on the number of sessions per week.
6.3.5 Patients’ co-payments
In most countries, the national health care insurance bears most of the ESRD treatment costs. In France as well as in Italy, the social security covers 100% of all medical expenditures of ESRD patients.79, 83 In Spain, the public health system covers nearly all costs of ESRD, including all medication, erythropoietin (EPO) and transportation. In addition it pays a disability pension for ESRD patients. The amount of this disability pension granted to patients depends on the degree of disability. A commission of sanitary inspectors or referees estimates the degree of disability on an individual basis.85
In Canada, New Zealand, E-W, Japan, Sweden and Germany, patients must pay a part of their treatment costs, generally related to medication.
In Canada, policies concerning prescription drugs and coverage differ between provinces. In British Columbia (BC), for instance, all ESRD patients registered with the BC Renal Agency are eligible to receive “renal” medication from a restricted pharmacopeia free of charge. For all other provinces, the ministry of health contracts with an independent pharmaceutical insurance plan to provide government-sponsored drug insurance which is paid for out of general taxation dollars and by prorated, income-based, insurance premiums. Pharmaceutical coverage is provided by such government-sponsored drug insurance plans for citizens aged 65 years and older and must be available to all Canadian citizens who pay an annual insurance premium. Generally, only drugs that have been shown to be clinically effective and cost-effective are available through government-sponsored formularies.81 Some ESRD drugs are provided to patients without the requirement for third-party or government-sponsored insurance. This is the case for anti-rejection drugs, which are free to all Canadian transplant patients.
The out-of-pocket payments for primary care in New Zealand are high. Most citizens do not hold private insurance and there is evidence that the co-payments deter some people from accessing General Practitioners services. Therefore it may represent a barrier to early detection and treatment of ESRD. Concerning medication, any pharmaceutical prescribed and directly dispensed from a hospital pharmacy to a hospitalised patient or an ambulatory treated patient at the hospital are fully subsidized by the government.84 In other words, drugs that are listed are completely reimbursed; this is not the case for those that are not listed.
In England and Wales, patients pay only 2% of their health care expenditures out of pocket.82 In Japan, co-payments of 10%-30% are usual but are limited to approximately US$600 per month. Above this sum health insurance fully reimburses patients.86 The Swedish Health Care system covers all costs related to ESRD treatment, including dialysis, medications, lost wages and other sickness benefits. However limited co-payments do exist for medical care, prescription drugs, travel and extra supplies (such as home dialysis machines).77
In Germany, night dialysis is not covered by medical insurance (public or private). It is mostly a costly dialysis alternative mainly due to nurse salaries and dialysis centres are largely unwilling to pay for night HD. This situation can discourage patient to choose this modality.78 Concerning transportation costs in Germany, different insurance providers are now introducing systems to manage patient transportation so that 2 to 3 patients can share one car to the dialysis centre and back home.78

124 Chronic Dialysis in Belgium KCE Reports 124
6.3.6 Cost containment measures
In the USA, since the current composite rate system for dialysis units was implemented in 1983, there have been only 4 payment updates, resulting in a substantial real (inflation-adjusted) decline in the payment for services covered by the composite rate. This process has stimulated providers to adopt productivity-improving measures and to minimize costs for whatever they do. This financial pressure encouraged the limitation of dialysis units and improve the efficiency of current dialysis practices, such as reuse of dialyzer and reduction of staffing.80
Reuse of dialyzers has passed into disuse in Belgium. The dialyzer label of the FX class Capillary Dialyzer of Fresenius Medical Care, for instance, explicitly mentions that the dialyzers are for single use. The manufacturer renounces any liability in case of reuse of the dialyzers and states that reuse may be hazardous to both patients and operators. Another reason why reuse has passed into disuse might be economical: reuse requires a nurse preparing the dialyzer for reuse. As human resources are relatively more expensive than the dialyzers themselves, it is more efficient not to reuse dialyzers.
In Canada, generally, only drugs that have been shown to be clinically effective and cost-effective are available through government-sponsored formularies.81
Japan revises its national fee schedule every two years. In the revision of April 2006, the government imposed price and policy changes to achieve a target reduction of 4% in overall HD expenditures. To achieve this target, payment for the use of EPO was changed from a dose-based payment per patient to a fixed-amount payment per session, regardless of dosage.86
In Germany, a number of measures to contain costs have been introduced. Firstly there has been a change from a reimbursement per treatment to a weekly flat rate independent of the dialysis modality and the frequency of dialysis treatments. This flat rate has been progressively reduced: from €580 in 2002 to €550 in 2003 and to €520 in 2004. The reimbursement rate differs however for patient younger than 60 years, patient 60 years and older and diabetic ESRD patients. Another action was the regulation and limitation of the number of dialysis units. The expectation is that this will increase the volume of dialysis treatments per centre and, thus, spread fixed costs among more patients, resulting in better economic efficiency. In Germany, as in all other countries, physicians are free to prescribe pharmaceuticals. However, if the average spending on drugs prescribed compared to other dialysis facilities and nephrological practices is grossly exceeded, the physicians responsible are held liable and forced to pay the additional costs.78

KCE Report 124 Chronic Dialysis in Belgium 125
Key points
Based on the results of the ISHCOF study, comparing the organisation and financing of ESRD treatments in 12 high income countries, the following conclusions can be drawn:
In terms of the number of patients per nephrologist, Belgium ranks 5th in the list of 12 countries, with one nephrologist per 42 ESRD patients (including dialysis and transplant patients). This results from the staffing norms imposed by the Belgian law for hospital HD and the relatively high proportion of patients on hospital HD in Belgium as compared to other countries. The average across all countries was one nephrologist per 56 ESRD patients. These ratios need to be interpreted with caution, however, as they might not be completely comparable between countries.
In most countries, home HD is not frequently used (less than 1% of ESRD patients are on this treatment modality). The technique is more frequently used, however, in New Zealand (8%), Australia (6%) and England and Wales (2%). The high prevalence of home-based and self-care dialysis in New Zealand may be explained by the large distances between dialysis centres and patients’ homes.
In most countries, patients can in theory chose between dialysis modalities if medically appropriate. In practice, however, choices can be constrained by late referral to the nephrologist, limited geographical access to dialysis facilities (England and Wales and Sweden), governmental planning of the number and location of dialysis units (France and Spain) or established clinical practice patterns in a country (Sweden, Germany, New Zealand).
Different financing mechanisms for dialysis facilities exist in the countries examined:
• Fee for service (e.g. Belgium): fixed fee per treatment session or per treatment week
• Flat rate lump sum independent of the type of dialysis modality used (e.g. Germany)
• DRG financing (e.g. UK): reimbursement according to the average national cost of the diagnosis related group
• Mixed financing mechanisms (e.g. Japan, USA), combining capitation payments (budget per patient per year, usually to cover fixed costs) with fee-for-service (to cover variable costs)
Ambulatory ESRD treatment is almost fully reimbursed in most countries. Consequently, patient co-payments are usually low and mostly limited to the costs of some medications.
Cost containment measures implemented by the countries studied include:
• Introduction of a flat rate lump sum reimbursement per treatment week independent of the dialysis modality but dependent on age and co-morbidity
• Less frequent indexing of reimbursement fees
• Limitation of the reimbursement of medications to medications with proven effectiveness and cost-effectiveness
• Moving from dose-based reimbursement to lump sum reimbursement of medications
• Limitation of the number of dialysis centres
• Penalties in case of excessive medication prescription

126 Chronic Dialysis in Belgium KCE Reports 124
7 PATIENT PERSPECTIVE IN CHRONIC DIALYSIS
7.1 INTRODUCTION End-stage renal disease (ESRD) is a chronic condition requiring chronic treatment. If transplantation is no option or patients are waiting for transplantation, patients have to make a choice between the different dialysis treatment modalities. Besides medical criteria, patient characteristics and preferences are important for the choice of the most appropriate dialysis modality.
In this report we briefly touched upon the medical aspects of dialysis choice, but we mainly focused on the organisational and financial aspects of chronic dialysis treatment. In this chapter, we look at the issue of chronic dialysis treatment from the patients’ perspective.
7.2 OBJECTIVES The objective of this part of the study was to describe the experiences and perceptions of patients with respect to the following elements:
• the information received before the start of dialysis treatment;
• the determinants of choice between dialysis modalities;
• the advantages and disadvantages of different dialysis modalities;
• the social support and support from hospital/home nursing facilities in case of dialysis treatments at home;
• the out-of-pocket costs directly or indirectly related to the disease and to the treatment.
The focus was on chronic dialysis patients under PD therapy, hospital HD, satellite HD, home HD or nocturnal HD as well as on patients who switched between different dialysis modalities. We were interested in the experiences of both patients in the early stages of their treatment and patients who were already on dialysis for a longer time.
7.3 METHODS For this part of the study a sequential approach of data collection was used, consisting of an exploratory phase and a phase intended to collect more in-depth information.
In January 2007, VlaVeNierkk (Vlaamse Vereniging voor Nierpatiënten vzw) and Fenier-Fabir ll (Federatie van Belgische Verenigingen voor Nierinsufficiënten/Fédération des Associations Belges d'Insuffisants Rénaux) were invited for an exploratory discussion at KCE.
• VlaVeNier was a Flemish association for patients with ESRD. The association ceased its activities in July 2009. Three people of VlaVeNier attended the exploratory meeting at KCE.
• Fenier-Fabir is an umbrella organization of ESRD patient associations in Belgium (Flanders and Wallonia). All Belgian associations of ESRD patients, except for VlaVeNier, are member of Fenier-Fabir. In 2007 the representative of Fenier-Fabir was unable to come to Brussels for the exploratory meeting.
The exploratory meeting gave a first general impression about the elements that are important for patients on each of the different dialysis treatment modalities.
kk http://www.nierpatient.be/ ll http://www.fenier-fabir.net/

KCE Report 124 Chronic Dialysis in Belgium 127
In September 2009, we contacted Fenier-Fabir again to discuss options to obtain more in depth information on patient-related issues.
Many practical constraints and the discussion with the representative have had an impact on the data collection methods used.
A first option discussed was to organize a focus group or Delphi panel discussion. However, both of these approached seemed unfeasible for several (mainly practical) reasons.
• Sampling issues: we needed the perspective of so many categories of patients that it would be impossible to find a way to gather all of them in the same place at the same time (older and younger, recently started with dialysis or on dialysis for a longer time, all dialysis modalities, with social support or without social support, etc…).
• Condition of patients: the treatment regimen of ESRD patients is very strict and is performed for different patients at different moments of the day, which leads to practical problems when one wants to gather those patients in one place at the same time for about two hours.
• Mobility: transportation for the Delphi panel or focus group discussion may be a problem for patients.
• Language: a French and a Dutch speaking focus group or Delphi panel would have to be organized with the patients coming from each of the categories mentioned earlier, which was not feasible within the time constraints imposed by the project.
A second option proposed to the president of Fenier-Fabir was to organize a group-interview with representatives of individual patient organizations (members of Fenier-Fabir). The proposal was made to have this meeting as part of the Board Meeting of Fenier-Fabir, held on September 17th, 2009.
KCE proposed two scenarios: a formal agenda point “discussion with KCE researchers” could be introduced as part of the Board meeting: The president was reluctant to work along the lines of this scenario, and preferred to discuss the questions raised internally without participation of an external party.
As an alternative scenario the KCE proposed to come to the location of the Board meeting, where KCE researchers would be available outside the meeting room during the discussions of the Board to answer potential additional queries about our questions.
A second alternative was finally chosen considering the conditions set by the president of Fenier-Fabir. The option was to let the president of Fenier-Fabir send out a questionnaire to a number of people, collect the answers and send the original answers to KCE.
The questionnaire and accompanying letter (see appendix to this chapter) for the participants was developed by KCE. The letter explained the objectives and the reason for the survey and explained that the presidents of the organizations were expected to respond to the questions as representatives of their members and present the points of view of their individual members.
The questionnaire and letter were sent to the president of Fenier-Fabir in the first week of September to allow sufficient time for preparation of the discussion. The questionnaires were sent out by the president after the Board meeting took place. KCE asked in an accompanying mail to distribute the questionnaire to all members of the Board of Fenier-Fabir (see appendix to this chapter).
Even after asking the explicit question to the president of Fenier-Fabir, it still remains unclear to us to whom the questionnaire was eventually sent: whether it was sent to several patient organizations, only one patient organization, the members or one member of the Board of Fenier-Fabir and whether it was sent to president(s) of the patient organization(s) only that responded as representatives of the members of their organization or also to individual patients.

128 Chronic Dialysis in Belgium KCE Reports 124
7.4 RESULTS This section reports on the results of the survey. No other information sources have been used in this section.
7.4.1 Methodological problems
Twelve questionnaires were returned to KCE through the intermediary of the president of Fenier-Fabir. A number of major problems from a methodological point of view were noticed that jeopardized the usability and reliability of the responses:
• The lay-out of the questionnaire has apparently been changed. From the completed questionnaires received it appeared that the accompanying letter had been removed and a front page had been added. One questionnaire mentioned Fenier-Fabir as author of the questionnaire, where the other questionnaires mentioned “KCE”.
• It appeared that the questionnaires were not filled out independently from each other. There were sets of questionnaires with very similar responses to all of the questions: identical word choice, structure of sentences etc. Two “sets” could be identified: one set with 4 questionnaires and one with 5 questionnaires. The remaining 3 questionnaires seem to have been completed independently by individual patients answering from their personal experience.
• Two questions (related to the advantages and disadvantages of each dialysis modality and the relative importance of each of these advantages and disadvantages for the choice between modalities) were only answered by 3 respondents, all three of them being respondents answering from their personal perspective as patients.
First, the fact that the accompanying letter appeared to have been removed before the questionnaire was sent out is a major problem from a methodological point of view, since crucial information on the aims and scope of the questions was removed.
Second, the interdependency between answers to the questionnaires made it impossible to apply standard techniques for the analysis of qualitative data. Because of the interdependency between the answers, serious questions can be raised about the validity and reliability of the responses.
7.4.2 Reported issues by patients
Taking into account all these methodological flaws we present the general viewpoints as reported in the questionnaires with the clear disclaimer, however, that we do not consider this part of the study as a reliable representation of patient-related issues as perceived by Belgian patients.
7.4.3 Information
Currently, information on different dialysis modalities is first provided by the nephrologist and the pre-dialysis team of the hospital. Patients sometimes also receive information from other patients (e.g. during visits to the dialysis centre) and patient associations. One patient, who was already on dialysis treatment for a long time, stated that when she started her chronic treatment, she received her information mainly from the nephrologist. The choices were much more limited at that time; the information was therefore limited to hospital HD and –to a much more limited extent- home HD.
The information provided by the nephrologist and the pre-dialysis team is in general considered accurate. It gives some idea of the impact of the treatment on daily life, although the real impact is only felt once the treatment has started.

KCE Report 124 Chronic Dialysis in Belgium 129
The written information consists of an extensive education bundle containing information on all aspects of the dialysis treatment modalities, sample issues of the journal Horizon, published by Fenier-Fabir, and leaflets. Some hospitals also organize visits to the dialysis centre and some hospitals also provide a DVD with relevant information and testimonies of patients. Information and contact details addresses of patient organizations are provided. Patients can contact such organization if they want.
Patients consider the leaflets combined with the information given face-to-face by the physician and others, including other patients, to be very useful. Oral information gives them the opportunity to ask additional questions or clarifications. The information provided is considered accurate and sufficient by most patients. Some patients prefer to get additional information once they have started their treatment as well as regular updates of the information.
7.4.4 Choice between dialysis modalities
According to the responses received, patients can in most cases explicitly choose between dialysis modalities. A patient who is already on dialysis for a long time stated that at the time she started her treatment, the options were limited to hospital HD and home HD. Some reluctance from the nephrologist was felt by this patient to present home HD as a treatment option. If for medical reasons a choice between dialysis modalities is not possible, reasons are explained to the patient.
Most patients consider the time they have for making a decision about their treatment modality sufficient, although some patients note that time is always too short for this kind of important decisions.
Most but not all respondents considered the support provided by health care professionals for choosing between treatment modalities sufficient. People stating that the support was not sufficient gave no further explanation.
The choice of treatment seems to be mainly determined by on the one hand the expected flexibility (PD and home HD) and on the other hand the security it provides (hospital HD). According to the respondents, active, younger patients or students tend to chose initially for PD, home HD or evening or night HD. This is confirmed by the findings in chapter 4.
Professional arrangements are also an important determinant for the choice of the dialysis modality, e.g. whether patients can obtain a special working statute that allows them to perform their dialysis treatment at work or have a flexible working schedule. We should note that this may apply only to the professionally active patient population. Chapter 4 showed that only 1 in 3 patients on chronic dialysis treatment are younger than 65 years of age and thus could be part of this population.
The advantages and disadvantages of each dialysis modality are weighed to determine the final preference for one dialysis modality or another. This weighing is very patient specific and depends on the patient’s character and attitude (e.g. ability to take responsibility for own treatment) and social status (e.g. living alone, with a partner or with adult children).
Frequent reasons for switching from PD to HD are peritonitis and the feeling of continuously being busy with the treatment and having no single day off. Switches from HD to PD are mentioned as being less frequent. They can occasionally occur if patients start on acute dialysis and can still make a choice at the moment dialysis becomes chronic. According to one respondent, a reason for switching from HD to PD could be the lack of privacy in the sometimes crowded dialysis centres.

130 Chronic Dialysis in Belgium KCE Reports 124
7.4.5 Advantages and disadvantages of different dialysis modalities
The advantages and disadvantages of the different dialysis modalities, as reported in the questionnaires, are presented in Table 75.
Table 75: Reported advantages and disadvantages of different dialysis modalities from the patients’ point of view
Advantages Disadvantages
Home dialysis modalities (PD, Home HD)
- Flexibility (adaptation of treatment schedule to professional activities, social life, family life, holidays)
- Responsibility over own treatment - Autonomy - Leaving the hospital environment - Costs of installation of equipment and
material costs borne by the dialysis centre - Hospital can be contacted in case of an
emergency - No transportation - Less strict diet (PD)
- Less security - Not every patient is eligible - Availability of informal caregiver highly
desirable - Disease and treatment are more
prominently present in the home environment
- Special premise for treatment required - Patient must be able to contact the
dialysis centre in case of an emergency - Less social contacts - Extra out-of-pocket costs (e.g. electricity
and water) - Difficult treatment procedure - No treatment free days (PD)
Satellite HD - Being in charge of own treatment - Secure environment with adequate
professional support - Flexibility (flexible treatment hours)
allows to maintain family, professional and social life
- Contact with other patients
- Transportation to the satellite centre
Hospital HD - Surveillance by a competent team - No responsibility over own treatment - Reduction of risks related to treatment
(treatment failure, contamination risk) - Treatment frequency limited to three
times per week and duration to 4 hours, treatment free days in-between
- Secure environment - Availability and accessibility of an entire
care team (physician, nurses, social worker, dietician)
- Easy access to other health care services (e.g. ergotherapy)
- No hospital facilities needed at home (family not confronted with disease and treatment all the time)
- Social contacts with other patients
- Transportation: time, effort and cost - Patient is less implicated in his treatment - Exposition to risk of nosocomial
infections

KCE Report 124 Chronic Dialysis in Belgium 131
7.4.6 Support in case of home dialysis treatments
Support to patients on home dialysis treatments can be provided by the informal caregiver, the home nursing services and the dialysis centre.
In general, respondents value the support of the informal caregiver (partner, adult children), although some respondents state that the support by an informal caregiver is useless, because the treatment is too complicated. In the answers we distinguished responses that were related to the technical support and responses related to the psychological support. Moreover, we made a distinction between PD and home HD. Informal caregivers seem most important for the psychological support and motivation of PD patients, although limited technical support is often also needed from the informal caregiver (e.g. emptying the heavy dialysis bags). For home HD informal caregiver support is thought to be indispensable both for the technical and for the psychological aspects. Providing support to the home dialysis treatment is thought to be burdensome for the informal caregiver.
Some but not all patients need professional support, provided by home nursing services.
7.4.7 Financial issues
Although the reimbursement system for dialysis covers many costs related to the dialysis treatment, patients report that they still have to bear important costs themselves. These costs may be directly related to the dialysis treatment but also to the treatment of co-morbidities.
Respondents report that the patients’ out-of-pocket costs related to hospitalization can be high, especially for patients without hospitalization insurance. At the start of chronic dialysis treatment, all patients are hospitalized: hospital HD patients for the creation of the AV fistula, PD patients for the insertion of the PD catheter and for training. Once ambulatory dialysis has started, patients may require additional hospitalizations related to complications or co-morbidities (see also chapter 4). The out-of-pocket costs related to the treatment of co-morbidities (diabetes, cardiovascular diseases), which are common in dialysis patients, may be important.
In addition, patients report co-payments for some medications or costs for other pharmaceutical products (e.g. ointments, bandages, special nutrition), clinical biology (is reported to be relatively high for hospital HD), honorarium fees for ambulatory consultations or consultations in the hospital, physiotherapy etc. Other costs patients might have to bear are costs of prostheses that are not or only partially reimbursed. Although all of these individual cost items might have a relatively small cost per unit, the sum of them may become considerable compared to the patients’ income.
Patient costs specifically related to PD are storage costs for PD fluids, home adaptation costs to prepare a room for the treatment, and waste management. The bags with the dialysis fluid create additional waste. The empty fluid bags can be put in the regular bin bags of the municipality but induces as such a cost of additional bin bags. Some patients can dispose of the empty dialysis fluid bags in their local container park.
Patient costs specifically for home HD include building adaptation costs (bathroom, bedroom and treatment room), electricity and water.
Patient costs specific for hospital or satellite HD include out-of-pocket payments for transportation to and from the dialysis centre. Several patients argue that the reimbursement for transportation is insufficient and has not followed the increasing prices of transportation. The results presented in chapter 4 confirm that the most important out-of-pocket costs for patients related to ambulatory dialysis are for transport to and from the dialysis centre.
Patients also report opportunity costs, i.e. the cost of not being able to keep a full time job and the problem of finding or keeping a job.
132 Chronic Dialysis in Belgium KCE Reports 124
7.5 PSYCHOSOCIAL CONSIDERATIONS Respondents had the opportunity to provide any additional information they considered important from a dialysis patient’s point of view. Some psychosocial considerations were raised.
A general comment was that the disease and treatment are heavy to bear. It is hard to cope with the dietary restrictions and the constraints experienced every day. Dialysis patients do not always feel well understood by the general public. The general public is insufficiently aware of the disease and may therefore avoid ESRD patients. As a consequence patients risk becoming isolated. Moreover, simple social activities may become problematic, e.g. going to a restaurant with friends is difficult because of the complicated diet patients have to adhere to.
The professional caregivers perfectly master the treatment technically. However, the psychological aspects seem less well understood. Without a partner, the treatment seems even more difficult to bear. Patients feel that they live thanks to a machine. Dialysis not only impacts upon the life of the patient but also upon the life of their family members. They are hampered in their activities and bear part of the costs.
Some patients also struggle with the financial consequences of their treatment. Out-of-pocket costs might sometimes be high. Moreover, they often have to stop their professional activities or have to work part time, which reduces their level of income. Some respondents criticize the way in which invalidity is assessed and that it takes the limitations a patient on chronic dialysis experiences insufficiently into account. After HD, for instance, patients may experience headaches, loss of strength and dizziness and feel ill. Moreover, they have to be careful for bleedings and cannot perform heavy work. In these circumstances it may be difficult to work for some patients.
7.6 CONCLUSION
7.6.1 Our survey
Despite the problems encountered during the development of the methodology for this part of the study, a few conclusions can be drawn with respect to specific patient-related issues in chronic dialysis treatment.
ESRD and chronic dialysis treatment have a profound impact on patients’ life. Consequences of the disease and treatment relate to the technical aspects of the treatment as well as psychosocial aspects.
Patients receive both oral and written information on the dialysis modalities before the start of their chronic dialysis treatment. They generally consider the information accurate but desire a regular update or refreshing of information after their treatment has started.
Patients are able to choose their dialysis modality if this is medically feasible. Home dialysis modalities are mainly chosen for the flexibility they offer, while hospital and satellite HD are mainly chosen for the security they provide. Having social support at home seems to be an important determinant for choosing home dialysis, but it is not a sufficient determinant. Even patients with social support at home might prefer hospital HD or satellite HD. The final choice of a patient depends heavily on his preferences. The weighing of the advantages and disadvantages of each dialysis modality is highly patient dependent.
The availability of an informal caregiver seems important for the psychological support of the patient, motivation and, to a limited extent, the technical aspects of the treatment procedure.
Patients report important out-of-pocket costs related to hospitalizations, clinical biology, transportation to the dialysis centre, medication and other pharmaceutical products, prostheses and honorarium fees for consultations.

KCE Report 124 Chronic Dialysis in Belgium 133
Finally, ESRD and dialysis has an impact on the patients’ psychosocial functioning: they sometimes feel isolated and not well understood by the general public and are constrained in their social activities. The activities of patient associations through which patients get in touch with other patients are highly valued by the respondents.
7.6.2 Previous studies
Relatively few studies have been performed on decision-making support for ESRD patients. A recent literature review, including 40 studies on factors influencing patient involvement in decisions about ESRD treatment, found that studies about decision-making needs of ESRD patients mainly focussed on the choice between dialysis modalities and health care professional’s provision of information about the decision, and less on the decisional conflict and support of patients in the decision-making process.66 While many patients want to participate in the decision about their dialysis modality, they may experience a decisional conflict when weighing the pros and cons of each of these options. There seems to be a gap in the knowledge about patient decision aids and implementation of shared decision-making in order to support ESRD patients in making a choice.
According to this literature review, factors influencing decisions related to ESRD treatment include interpersonal relationships (e.g. opinions of family and providers), trust in providers, preservation of current well-being, normality and quality of life (e.g. concerns about impact on daily living), need for control, being personally responsible. A Canadian study of 197 ESRD patients included in the review identified age-related differences in preferences for involvement in decision-making. Older participants in general preferred their health care team to make the decision for them. Younger patients preferred to be involved in the decision making process and therefore contact more often their nurses and other renal patients. Opinions of family members had a greater influence on the dialysis modality chosen by older patients than on the dialysis modality chosen by younger patients.66
The findings of our limited survey are in agreement with the findings of a Danish qualitative study on the patients’ views regarding the advantages and disadvantages of dialysis modalities, problems experienced and patient involvement in the choice of modality. In contrast to our study, that study followed the standards for good qualitative research. The findings were, however, very similar to ours. Table 76 summarizes the findings of the study by Lee et al., including the findings from literature described by the same authors56
Table 76: Patients’ views and literature findings regarding the advantages and disadvantages of different dialysis modalities*
Focus group participants56 Literature findings: advantages
Advantages Disadvantages Hospital HD
Security (known professionals carrying out the treatment), freedom from illness at home and on dialysis-free days, socializing (mainly with staff)
Transport time, fixed time in dialysis (no flexibility in extent or time of dialysis), limitations to holidays
Dialysis-free days, having others do the dialysis while the patient sleeps, reads, etc. Good for patients who are uncertain about ability to dialyze without direct supervision or have limited space at home.
Satellite HD
No waiting time when starting a dialysis session, possible flexibility in extent and time of dialysis
Transport time, limited flexibility in extent and time of dialysis, limitations to holidays
Greater flexibility with respect to choice of day, time and frequency
Home HD
No transport, greater flexibility, better social life, possibility of work, dialysis at night means
Takes up space, technical problems and noise, limitations to holidays
Flexibility with respect to choice of time and frequency, less time consumption, no

134 Chronic Dialysis in Belgium KCE Reports 124
that days are free transport, possibility for doing other things (watch TV, use PC, read, sleep, etc.) while on dialysis
CAPD No transport, greater flexibility, better social life, possibility of work, possible to take equipment on holiday
PD bags are heavy and both full bags, used bags and other equipment takes up a lot of space
Flexibility, possibility of night treatment, greater self-care and autonomy, privacy, no transport, possibilities for work. Good for patients fearing needles but considerations related to body image
APD As for CAPD plus dialysis at night means that days are free
As for CAPD plus technical problems and noise
PD with nursing support
As for APD plus security (known professionals carrying out the treatment)
As for APD plus dependence on community health nurses
Improves the lifestyle for the frail and the elderly by avoiding travelling to the HD unit three times weekly. Allows patients to remain on PD in their own environment even though they have become dependent on a caregiver
* Table slightly adapted from Lee et al.56 to make the terms used for dialysis modalities consistent with terms used in this report
As for the factors influencing the choice, similar elements were raised in our survey as in the Danish focus group interviews: flexibility and independence, sense of security, transport, maintenance of normal life. Hospital HD patients felt that dialysis-free days and a home life free of illness were advantageous. On dialysis-free days, hospital HD and satellite HD patients did not consider themselves ill until the next dialysis session, which is considered a way to normalize their everyday life. Hospital HD was found to be exhausting, however, for some patients as well as for their relatives. For some older, frail dialysis patients, PD with nursing support seemed to be the only way to have a life at all. For home dialysis patients avoiding the hospital could be a way of normalizing everyday life. Home dialysis patients considered 24-hour telephone access for advice and instructions crucial to ensure the sense of security.
The Danish survey included some additional elements, such as physical space and noise, involvement of family members in the decision making about the choice of the dialysis modality and pre-dialysis education. The dialysis machines, bags and other equipment take a lot of space. Moreover, home HD makes noise, which may be considered annoying to patients and their relatives. Involving the family in the decision making is found to be important because the dialysis also fills a large part of their lives, be it hospital HD, satellite HD or home dialysis.56
The Danish study also included pre-dialysis patients in its focus group interviews. The conclusion was that a move towards greater numbers of patients on out-of-hospital dialysis requires greater focus on pre-dialysis patients. In literature, not only information, but also counselling was found to be an independent predictor for choosing PD over HD. Timing of the dialysis education is important. Patients should therefore be referred early enough to the nephrologist. The focus group participants noted that it takes time to adjust to being a chronic dialysis patient and to find ways of handling the restrictive and time-consuming treatment.56
In conclusion, the choice of a dialysis modality depends on medical indications but also, to a large extent, on patients’ expectations and wishes regarding daily life and lifestyle. Timely pre-dialysis education is likely to influence the effectiveness and acceptability of alternative dialysis modalities.
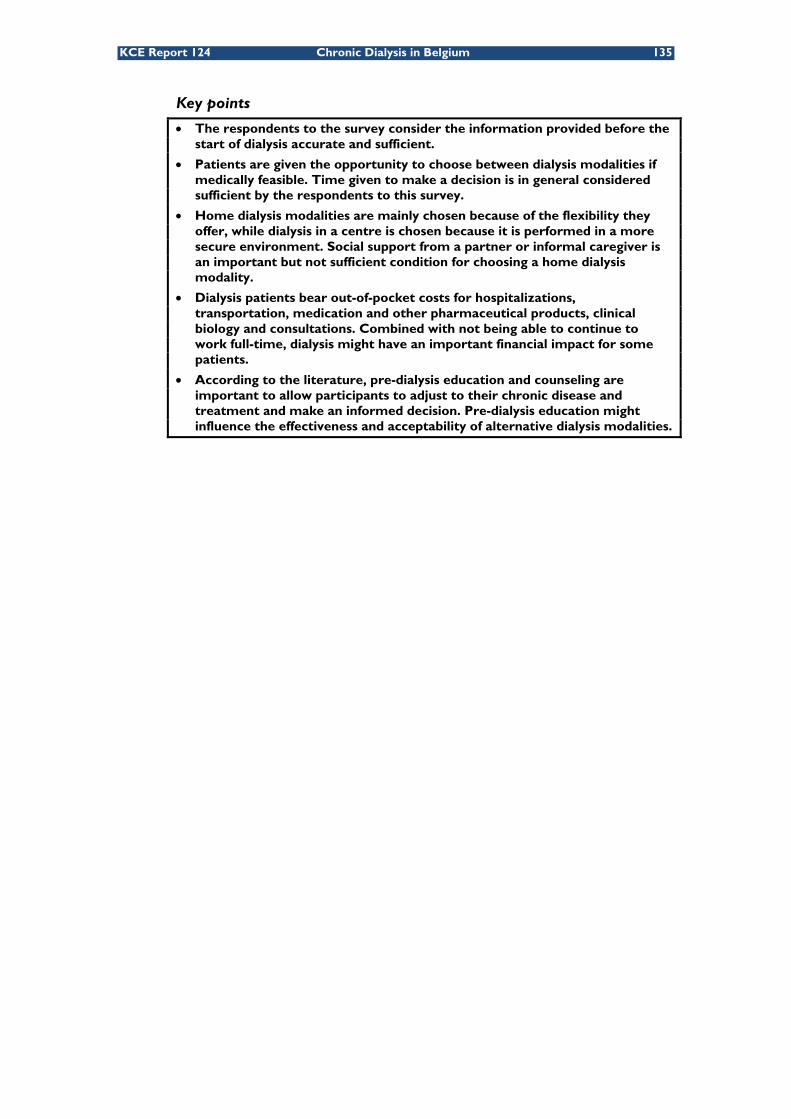
KCE Report 124 Chronic Dialysis in Belgium 135
Key points
• The respondents to the survey consider the information provided before the start of dialysis accurate and sufficient.
• Patients are given the opportunity to choose between dialysis modalities if medically feasible. Time given to make a decision is in general considered sufficient by the respondents to this survey.
• Home dialysis modalities are mainly chosen because of the flexibility they offer, while dialysis in a centre is chosen because it is performed in a more secure environment. Social support from a partner or informal caregiver is an important but not sufficient condition for choosing a home dialysis modality.
• Dialysis patients bear out-of-pocket costs for hospitalizations, transportation, medication and other pharmaceutical products, clinical biology and consultations. Combined with not being able to continue to work full-time, dialysis might have an important financial impact for some patients.
• According to the literature, pre-dialysis education and counseling are important to allow participants to adjust to their chronic disease and treatment and make an informed decision. Pre-dialysis education might influence the effectiveness and acceptability of alternative dialysis modalities.

136 Chronic Dialysis in Belgium KCE Reports 124
8 DISCUSSION AND CONCLUSIONS
8.1 EPIDEMIOLOGY OF RENAL REPLACEMENT THERAPY IN BELGIUM The prevalence of patients on renal replacement therapy (RRT, including dialysis and renal transplantation) has been growing with about 5% per year during the last decade in Belgium. The incidence of new RRT patients grew at a rate of about 2% per year. The highest growth rate in prevalence of RRT is observed in patients aged 65 years and older. In 2007, 27% of the patients on RRT were older than 75 years of age. Compared to other countries (Austria, Finland, Sweden, the Netherlands and UK), the mean age of patients on RRT in Belgium is relatively high.
Glomerulonephritis is the most important cause of ESRD in prevalent patients in Belgium but between 2002 and 2007 renal vascular disease has become a more important cause of ESRD than diabetic nephropathy. Renal vascular disease and diabetic nephropathy are the most important major causes of ESRD in incident patients.
Patients on the transplant waiting list on average wait less long for a transplant in Belgium than in some other European countries. Also the proportion of patients transplanted pre-emptively is relatively high in Belgium, compared to some other European countries (almost 3.6% compared to 0.23% in Germany and 1.37% in the Netherlands). The use of kidneys from living donors, on the contrary, is relatively low in Belgium compared to other countries (10% in Belgium compared to 55% in the Netherlands, 22% in Germany and 18% in Austria).
The analysis of NIHDI reimbursements over the years 2003 until 2006 showed that hospital HD is still the main dialysis modality, with 68% of patients mainly being treated through this modality. Satellite HD accounted for 13% and PD for 9%. The remainder of patients were treated with mixtures of those modalities and a small proportion with home HD. The dialysis patients in Belgium are relatively old. Two-thirds are 65 and above and almost 40% are aged 75 and over. Moreover, the proportion of elderly people seems to be increasing.
The proportion of patients on PD as compared to hospital HD in Belgium is lower than in many other countries. The proportion of patients on PD in the total number of patients on dialysis was relatively stable between 2004 and 2006 but declined in 2007. However, the proportion of patients treated with satellite HD grew steadily over the years. This led to an increase in the total proportion of patients treated with alternative dialysis modalities (PD+satellite HD) from 28% in 2002 to 34% in 2007.
There are relatively few data on dialysis patient profiles in Belgium. The appropriateness of the observed distribution of patients between dialysis modalities is therefore hard to interpret. However, it can be assumed that a combination of factors is responsible for the lower proportion of PD in Belgium compared to other countries. Some of these might be:
• The higher average age of dialysis patients in Belgium compared to other countries combined with the fact that older patients are more often treated by hospital HD than by alternative dialysis modalities;
• The shorter time on the transplant waiting list in Belgium compared to other countries combined with the fact that relatively more PD and satellite HD patients than hospital HD patients are on the transplant waiting list;
• The balance between costs and revenues from PD in Belgium compared to the balance between costs and revenues from satellite HD (see 8.2);
• Patients’ characteristics and preferences.
KCE Report 124 Chronic Dialysis in Belgium 137
8.2 RELATIVE EFFECTIVENESS OF DIALYSIS MODALITIES There is no evidence of a difference in survival, morbidity or quality of life specifically ‘due to’ different dialysis modalities (hospital HD, satellite HD, home HD, APD and CAPD). Differences in survival were observed but almost all studies were observational and subject to several potential biases, especially confounding by indication. Based on our analysis of NIHDI reimbursements over the years 2003 until 2006, we can conclude that the survival of patients on chronic dialysis is poor. Overall four-year survival is less than 40% and this survival was worst for hospital HD patients, and better for patients on PD and satellite HD. We should be careful, however, to interpret these results with caution, as they are most probably caused by confounding by indication that influenced the initial choice of dialysis modality.
Good pre-dialysis patient care is, according to the experts, crucial for the quality of care provided to patients with renal failure. There seems to be a need for Belgian clinical guidelines for the choice and management of treatment and follow-up of patients with impaired kidney function. Clinical practice guidelines might improve the clinical decision making process related to starting dialysis treatment in patients and the appropriate allocation of patients to dialysis modalities. Patient information and preparation is an important part of pre-dialysis work-up, but as in most cases, it is finally the patient who has to be able to make an informed decision. According to the respondents to our survey on patient perceptions about dialysis treatment and choices, the information provided before the start of dialysis is technically accurate and sufficient and enough time is given to make a choice between the dialysis modalities.
8.3 COSTS OF DIALYSIS MODALITIES FROM A HOSPITAL PERSPECTIVE According to the literature, PD is in general less costly than any type of HD from the hospital’s point of view. In our cost simulation model, however, we found satellite HD to be less costly than PD from a hospital’s point of view. The yearly total cost of hospital HD was estimated at €48 800 per patient. Satellite HD was estimated to cost on average about €38 300 per year per patient and PD without nursing support about €44 200 per patient per year (in values for 2006). The estimates corresponded to €313 per hospital HD session, €245 per satellite HD session and €850 per week PD without nursing support. For comparison NIHDI reimbursements were in 2006 on average €367.37 per hospital HD session, €250.98 per satellite HD session and €699.51 per week for PD without nursing support. The higher cost of PD compared to satellite HD is explained mainly by the relatively high cost of consumables for PD. About 90% of the consumable costs of PD are related to the dialysis fluids.
According to our model, that estimated the short term costs and revenues of different dialysis modalities from the perspective of the hospital, profits of a hypothetical dialysis programme with 100 patients and with average costs are maximized if 28% of the patients are treated with alternative dialysis treatments. In 2006 the average proportion of PD and satellite HD in total dialysis (excluding home HD) was 33.72% in Belgium.
It should be noted that costs from the hospital’s perspective are not a good indicator for the societal costs of dialysis. For the purpose of this study, however, i.e. to compare the costs of different modalities with the revenues for the hospital, costs needed to be estimated from the narrow perspective of the hospital. From a policy point of view it is important to notice, however, that dialysis patients still bear important out-of-pocket costs related to hospitalization, transport, medication and other pharmaceutical products, clinical biology and consultations. Respondents to our survey on patient perceptions about dialysis treatment perceive these extra costs as a heavy financial burden, a feeling that is reinforced by patients’ no longer being able to work full-time.

138 Chronic Dialysis in Belgium KCE Reports 124
8.4 COST-EFFECTIVENESS OF DIALYSIS MODALITIES Assessing the cost-effectiveness of different dialysis modalities is not very relevant, because for most patients there are either medical indications or contra-indications –although these are mainly based on expert opinion and consensus- and, more importantly, explicit patient preferences for or against specific modalities. Dialysis modalities can hence not be considered to be perfect substitutes. It would not make sense to conclude, for instance, that PD is the most cost-effective dialysis modality and should therefore always be first choice. There are two main reasons for this. First, PD is usually not a treatment option that can be maintained over a patients’ lifetime. Most PD patients will have to switch to HD at some moment in time, unless they receive a kidney transplant or die. Second, the incremental cost-effectiveness ratio (ICER) of any dialysis modality cannot be determined because no unbiased data comparing the outcomes of different dialysis modalities are available. Almost all available data on the effectiveness of dialysis modalities are based on inherently biased observational data that are confounded by indication. Some studies have assessed the relative cost-effectiveness of starting on a specific dialysis modality and found that, for patients having a choice, starting on PD seems to be more cost-effective than starting on HD. However, these economic models are also based on the same biased observational data and hence suffer from similar weaknesses as the observational studies on clinical effectiveness.
8.5 COSTS AND REIMBURSEMENT In Belgium, the financing mechanisms for the different dialysis modalities have been modified several times since 1995. The explicit goal of the modifications was to introduce incentives for the use of PD and satellite HD. The importance of the relationship between the reimbursement of dialysis and the hospital per diem price has been reduced over the years but some historical relation has always been maintained. A stepwise reimbursement mechanism was created. Currently, four levels of proportions of alternative dialysis modalities determine the amount of the incremental lump sum a hospital receives per hospital HD session: <5%, 5-10%, 10-25%, 25-35% and >35% alternative dialysis modalities, corresponding to incremental lump sums of €31.41, €76.96, €100.43, €105.95 and €119.27 respectively (baseline lump sum is €42,10 in 2009).
The NIHDI reimbursements of a complete year of dialysis treatment are the highest in case of hospital HD, followed by Home HD and PD with nursing support and then by APD, satellite HD, home HD without nursing support and finally PD without nursing support. In terms of costs for the hospital, however, PD without nursing support is more expensive than satellite HD and hence the cost-revenue balance is better for satellite HD than for PD.
The modifications in the financing mechanisms indeed had an effect on the use of alternative dialysis modalities, especially on the use of satellite HD. PD also increased but not to the same extent. This can be explained by the balance between costs and revenues of PD versus satellite HD from the hospital’s point of view. For the incremental lump sum of hospital HD only the proportion of alternative dialysis modalities is important, no requirements are imposed on the distribution between satellite HD and PD within the alternative dialysis modalities. Hence the hospital can increase its proportion of alternative dialysis modalities by increasing either the number of PD patients or the number of satellite HD patients. Obviously, it is easier to increase the number of satellite HD patients than to increase the number of PD patients. According to our external experts, patients who would normally be treated with hospital HD are increasingly being treated with satellite HD, without loss of quality of care (see also 8.6). Although these patients might have a higher cost profile (e.g. because they need relatively more nursing support during their dialysis treatment than other satellite HD patients) it might, from an economic point of view still be more interesting for hospitals to carry these additional costs in satellite centres than to keep patients in the hospital HD setting. Increasing the proportion of patients on alternative dialysis modalities might bring them in a higher reimbursement level for all hospital HD patients treated in their dialysis centre.

KCE Report 124 Chronic Dialysis in Belgium 139
The incremental revenue thus generated may outweigh the incremental cost of treating more patients with satellite HD. In other words, increasing the proportion of satellite patients by moving patients from hospital HD to satellite HD may be economically interesting without violating the rules of good medical practice. Moreover, treating hospital HD patients in a satellite unit may also be a practical solution for patients, e.g. if the patient lives closer to a satellite unit than to the main hospital dialysis unit. Figure 55 presents the histogram of the net results (revenues – costs) of PD and satellite HD per patient, resulting from the cost-revenues simulation described in chapter 5. Negative values on the X-axis represent deficits. The distributions are related to uncertainty and variability in costs between Belgian dialysis centres. The probability that satellite HD offers a positive net value (i.e. profit) is clearly higher than the probability that PD offers a positive net value, as reflected by the larger part of the PD histogram being in the negative values of the X-axis. In addition it may also be more feasible from a medical point of view.
Figure 55: Relative frequency of net results generated per PD patient and per satellite HD patient*
* Negative values on the X-axis represent deficits associated with PD or satellite HD.
The reimbursement system for dialysis was designed to increase the use of alternative dialysis modalities. However, the built-in financial incentive mechanisms induce a clear “financial optimum” for alternative dialysis modalities, meaning in particular that profits can be maximised if 28% of the patients are treated with alternative dialysis modalities. Increasing the proportion of patients on alternative dialysis modalities above this threshold would reduce total profits. Knowing the optimal proportion of patients on alternative dialysis modalities from a financial point of view, the crucial question becomes to what extent this corresponds with the medically optimal proportion of alternative dialysis modalities. Are the financing mechanisms providing the right incentives to provide optimal choice of treatment to each of the patients? Any financing system should be neutral with respect to the choice of treatment modalities and not provide a financial incentive in favour or against one treatment or another.
The reimbursement mechanisms for hospital HD differ from those of satellite HD, PD and home HD. Whereas the nephrologist receives a honorarium fee per hospital HD session, no honorarium fee is paid for satellite HD, home HD or PD (except for consultations). If nephrologists do not receive part of the lump sums paid for alternative dialysis modalities (e.g. after negotiations with the hospital management), a financial disincentive towards these alternative dialysis modalities might, de facto, be created.

140 Chronic Dialysis in Belgium KCE Reports 124
For all dialysis modalities, the reimbursement is variable: a lump sum is paid per dialysis session or per week of dialysis treatment. This purely variable financing mechanism contrasts, especially for hospital HD, with the cost structure of dialysis. Some costs are fixed or semi-fixed (e.g. equipment, buildings and some overhead costs). Ideally, a financing system should follow as much as possible the cost structure of a service. If not, financial incentives might unintentionally or intentionally be created for or against specific services. For example, transplantation of a hospital HD patient potentially implies an important loss of income for small centres. As there are no waiting lists of chronic dialysis treatment, the empty seat might not be filled immediately.
Nursing support provided to patients dialysed at home is paid directly to the dialysis centre that follows-up the patient. There are indications that the reimbursement to home nursing services by hospitals sometimes differs between hospitals, although the lump sums include a fixed fee for nursing support.
Transport to and from the dialysis centre by other means than public transport is reimbursed by the NIHDI at €0.25 per km. This amount has not been indexed and has remained constant since 1985, although the prices of private transport have increased. Some sickness funds provide additional reimbursement for transport as part of their complementary health insurance. The formulas used, however, are highly variable across sickness funds.
8.6 LICENSING OF DIALYSIS CENTRES The Belgian law defines the norms and criteria for the accreditation of dialysis centres. In 2007 there were 53 accredited dialysis centres, 49 of which also had one or more satellite dialysis units in or outside the main hospital building. To obtain accreditation, a dialysis centre must treat at least 40 ESRD patients, including the transplanted ESRD patients. A dialysis centre must have one nephrologist or specialist in internal medicine working full-time at the hospital to supervise the centres’ activities. For every 4000 hospital HD sessions performed by the centre, the centre must have an additional nephrologist or specialist internal medicine. Per 500 hospital HD sessions the centre must employ one full-time equivalent (FTE) nurse or technician and at least 50% of the nurses should have a special qualification in dialysis nursing. However, an officially recognized qualification of dialysis nurse does not exist in Belgium. Hospitals therefore train their nursing staff in-house.
Experts believe that some of the accreditation norms are outdated and are no longer applicable in daily practice. Some hospitals, for instance, also treat hospital HD patients in satellite dialysis units with apparently equal quality of care although the criteria for personnel are less stringent for satellite units than for hospital HD units. The permanent presence of a nephrologist is for instance not required in satellite units, while this is obligatory in hospital HD units. To guarantee good quality of care, hospital management might be prepared to increase the human resources in satellite units, for reasons explained in 8.5. However, because the majority of the patients treated in a satellite unit will have a lighter health profile, it is not necessary to comply with the staff requirements imposed for hospital HD units to guarantee equal quality of care. Based on the analyses of the patients’ age and mortality, we concluded that the profile of patients treated in satellite units is still clearly different from the profile of patients treated in hospital HD units: patients treated in satellite units are on average younger and have a much higher four-year survival rate, which suggests they are in a better general condition. It can therefore not be concluded from this observation that the norms imposed for hospital HD are too strict. In the cost analysis, on the other hand, we found that nephrologists spend on average about 60% of their time to the ambulatory dialysis programme. The number of “bodies” on the work floor fits with the legal requirements, but taking into account the time devoted to the dialysis programme, it might be concluded that the required number of nephrologists per 4000 hospital HD sessions might be relatively high.

KCE Report 124 Chronic Dialysis in Belgium 141
8.7 NIHDI EXPENDITURES Mean total NIHDI expenditures for dialysis per patient year (including also reimbursements for transportation and all dialysis-related honoraria) were, in 2008, about €57 000 for hospital HD, €41 000 for PD, €40 000 for satellite HD and €40 000 for home HD. The increasing number of patients on RRT in general and on dialysis in particular has led to an increase of total NIHDI expenditures for RRT. A marked increase in the growth rate of the NIHDI expenditures for dialysis was observed since 2001, the year when the stepwise incremental lump sums for hospital HD, in function of three levels of the proportion of patients on alternative dialysis modalities, was introduced. After the financing reforms in 2003, where more levels of alternative dialysis percentages were introduced to define the incremental lump sums for hospital HD, the growth rate increased even further. The increase was especially noticed in the lump sum expenditures. The proportion of honoraria expenditures in total expenditures declined slightly over the years, moving from about 40% in 2004 to about 38% in 2008.
Between 2003 and 2006, total NIHDI reimbursements for all health care for those patients rose from € 386 million to more than € 450 million (without per-diem hospital costs). Considering these total NIHDI reimbursements, hospital HD is overall the most expensive dialysis modality. Total reimbursements for patients on peripheral dialysis modalities such as satellite or home HD and PD are markedly lower. For the pure NIHDI reimbursements, ambulant dialysis is responsible for 60% of expenses. Hospital and one-day clinics come second with 30%. However, inclusion of the hospital per-diem price would add an additional 40% on the total reimbursement expenses.
Patient out-of-pocket expenses are difficult to measure since they are influenced by income, reimbursement ‘statute’ (OMNIO, MAF), and additional financial benefits from mutualities. Moreover, per-diem hospital prices and some other expenses such as over the counter drugs are not included in the registration. However, taking into account those limitations, the patient’s out-of-pocket expenses directly linked to partly reimbursed health care rose from € 6.1 million in 2003 to € 7.6 million in 2006. In contrast with the reimbursement data, we did not identify important or consistent differences between dialysis modalities in the patient out-of-pocket expenses. However, the patients aged 45-64 consistently incurred higher out-of-pocket expenses.
In the longitudinal analyses we noticed that overall health care reimbursement expenses start to rise in the months preceding the onset of dialysis, reach a peak during the months after dialysis initiation and show a slow decrease afterwards.
8.8 INTERNATIONAL COMPARISON The number of patients per nephrologist in Belgium is generally comparable to that in the 11 countries included in our international comparison. Home HD is not frequently used in any of those countries, although countries with large distances between hospitals and patients’ homes (e.g. New Zealand, Australia) use home dialysis modalities more frequently.
Factors impeding patients’ choice between dialysis modalities include late referral, limited geographical access to dialysis facilities, governmental planning of the number and location of dialysis units or established clinical practice patterns.
ESRD treatment is almost fully reimbursed in most countries. Consequently, patient co-payments for ambulatory dialysis are usually low and mostly limited to the costs of some medications.
Cost containment measures implemented by other countries include the introduction of a flat rate lump sum reimbursement per treatment week independent of the dialysis modality but dependent on age and co-morbidity of the patient, less frequent indexing of reimbursement fees, limitation of the reimbursement of medications to medications with proven effectiveness and cost-effectiveness, moving from dose-based reimbursement to lump sum reimbursement of medications, limitation of the number of dialysis centres and penalties in case of excessive medication prescription.

142 Chronic Dialysis in Belgium KCE Reports 124
8.9 PATIENT-RELATED ISSUES Patient preferences are an important determinant for the choice of the dialysis modality. Home dialysis modalities are mainly chosen because of the flexibility and independence they offer, while dialysis in a centre is chosen because it is performed in a more secure environment. Social support from a partner or informal caregiver is an important but not sufficient condition for choosing a home dialysis modality. A crucial determinant for choosing a dialysis modality is maintenance of a normal life. This may be a reason for choosing hospital HD (being free of illness on dialysis-free days) or home dialysis (being able to work). In literature, emphasis is put on the importance of pre-dialysis education and counselling for allowing patients and their relatives to make an informed decision about their treatment modality. Pre-dialysis education is believed to have an influence on the effectiveness and acceptability of alternative dialysis modalities. Literature also suggests that there are medical contra-indications for alternative dialysis modalities in about 36% of the patients with ESRD. The remainder of the patients should get a real choice of treatment modality, supported by information and counselling of both the patient and his/her relatives. In Belgium, patients consider the information they receive from their nephrologist, the pre-dialysis teams and patient organisations as appropriate and sufficient, although counselling after the treatment has started is still considered important.
8.10 LIMITATIONS OF THE REPORT This study focussed on adult ESRD patients. Children were not included in the assessment.
The main weakness of the cost study presented in this report is the low response rate from hospitals to the cost survey. This created a large variability in some of the cost estimates. Variability was taken into account by means of the technique of Monte Carlo simulations. This allowed reflecting the variability in the analysis results.
From the perspective of the dialysis centres, it might have been a strategic decision not to participate in a cost survey. This might have two effects: either the policy makers will use the results of the analysis based on limited data or they will take an ad hoc decision. The quality and acceptance of the results of policy preparing research would be much better if providers would participate and collaborate with this kind of research.
The assessment of patient-related issues has been hampered by many practical inconveniences. The standards for good qualitative research could not be followed. However, the findings from our limited survey in patients and patient organisations were similar to those reported previously in international literature.
8.11 FINAL CONCLUSION This HTA focussed on chronic dialysis treatment, its organisation, financing and patient-related issues in Belgium. End-stage renal disease is a life-threatening condition that has a significant impact on patients’ and their families’ life. Renal transplantation is the treatment of choice for ESRD. Patients who cannot be transplanted or have to wait for a kidney transplant are treated by means of one of the different dialysis modalities: hospital HD, satellite HD, home HD, CAPD or APD. Dialysis is an expensive treatment, both for society and for patients. With the population growing older the dialysis population increases. This increases the financial burden of ESRD. As for all health care interventions, it is important to reflect about measures to ensure that dialysis patients receive appropriate care at an acceptable cost. We hope this HTA provides useful information for the development of such a policy for ESRD treatment.

KCE Report 124 Chronic Dialysis in Belgium 143
9 APPENDICES
APPENDIX TO CHAPTER 2
LITERATURE SEARCH FOR CLINICAL AND ECONOMIC ASPECTS OF CHRONIC DIALYSIS INDICATIONS FOR CHRONIC DIALYSIS Date 18/06/2007 Database MEDLINE Pubmed Date covered 1950 to Present Search Strategy
1) Search "Kidney Failure, Chronic"[Mesh] AND "Renal Replacement Therapy"[Mesh] 32771 2) Search "contraindications"[Subheading] OR "Patient Selection"[Mesh] 38284 3) Search #1 and #2 380 4) Search #3 Limits: Publication Date from 2000/01/01 to 2007/06/18 209 5) Search #4 Limits : Humans 209 6) Search #5 Limits : English, French, German, Italian, Spanish, Dutch 205
Note Date 18/06/2007 Database Cochrane Database of systematic review via
Cochrane Library Date covered 1993 to Present Search Strategy
1) MeSH descriptor Kidney Failure, Chronic explode all trees 16 2) MeSH descriptor Renal Replacement Therapy explode all trees 23 3) #1 and #2 10 4) "MeSH descriptor Patient Selection explode all trees 1 5) indication in Title, Abstract or Keywords or indications in Title, Abstract or Keywords or contraindication in Title, Abstract or Keywords or contraindications in Title, Abstract or Keywords 94 6) #4 or #5 95 7) #3 and #6 0
Note Date 18/06/2007 Database DARE via Cochrane Library Date covered 1993 to Present Search Strategy
1) MeSH descriptor Kidney Failure, Chronic explode all trees 32 2) MeSH descriptor Renal Replacement Therapy explode all trees 50 3) #1 and #2 15 4) "MeSH descriptor Patient Selection explode all trees 42 5) indication in Title, Abstract or Keywords or indications in Title, Abstract or Keywords or
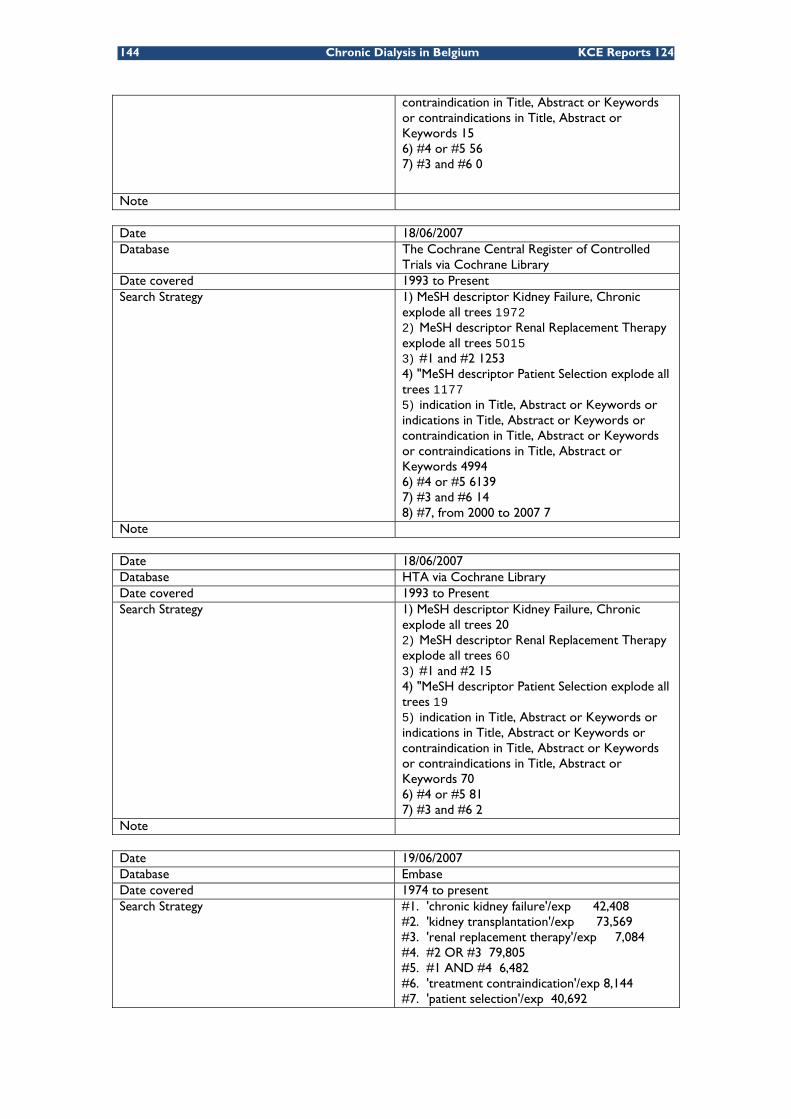
144 Chronic Dialysis in Belgium KCE Reports 124
contraindication in Title, Abstract or Keywords or contraindications in Title, Abstract or Keywords 15 6) #4 or #5 56 7) #3 and #6 0
Note Date 18/06/2007 Database The Cochrane Central Register of Controlled
Trials via Cochrane Library Date covered 1993 to Present Search Strategy
1) MeSH descriptor Kidney Failure, Chronic explode all trees 1972 2) MeSH descriptor Renal Replacement Therapy explode all trees 5015 3) #1 and #2 1253 4) "MeSH descriptor Patient Selection explode all trees 1177 5) indication in Title, Abstract or Keywords or indications in Title, Abstract or Keywords or contraindication in Title, Abstract or Keywords or contraindications in Title, Abstract or Keywords 4994 6) #4 or #5 6139 7) #3 and #6 14 8) #7, from 2000 to 2007 7
Note Date 18/06/2007 Database HTA via Cochrane Library Date covered 1993 to Present Search Strategy
1) MeSH descriptor Kidney Failure, Chronic explode all trees 20 2) MeSH descriptor Renal Replacement Therapy explode all trees 60 3) #1 and #2 15 4) "MeSH descriptor Patient Selection explode all trees 19 5) indication in Title, Abstract or Keywords or indications in Title, Abstract or Keywords or contraindication in Title, Abstract or Keywords or contraindications in Title, Abstract or Keywords 70 6) #4 or #5 81 7) #3 and #6 2
Note Date 19/06/2007 Database Embase Date covered 1974 to present Search Strategy
#1. 'chronic kidney failure'/exp 42,408 #2. 'kidney transplantation'/exp 73,569 #3. 'renal replacement therapy'/exp 7,084 #4. #2 OR #3 79,805 #5. #1 AND #4 6,482 #6. 'treatment contraindication'/exp 8,144 #7. 'patient selection'/exp 40,692

KCE Report 124 Chronic Dialysis in Belgium 145
#8. 'treatment indication'/exp 57,788 #9. #6 OR #7 OR #8 99,939 #10. #5 AND #9 146 #11. #5 AND #9 AND [2000-2007]/py 109 #12. #5 AND #9 AND [2000-2007]/py AND [humans]/lim 109 #13. #5 AND #9 AND [2000-2007]/py AND [humans]/lim AND ([dutch]/lim OR [english]/lim OR [french]/lim OR [german]/lim OR [italian]/lim OR [spanish]/lim) 105 #14. #5 AND #9 AND ([dutch]/lim OR [english]/lim OR [french]/lim OR [german]/lim OR [italian]/lim OR [spanish]/lim) AND [humans]/lim AND [2000-2007]/py AND [embase]/lim 55
Note
FACTORS INFLUENCING CHOICE Date 18/06/2007 Database MEDLINE Pubmed Date covered 1950 to Present Search Strategy
1) Search "Kidney Failure, Chronic"[Mesh] AND "Renal Replacement Therapy"[Mesh] 32771 2) Search ("Patient Satisfaction"[Mesh] OR "Physician-Patient Relations"[Mesh] OR "Quality of Life"[Mesh] OR "Socioeconomic Factors"[Mesh]) 349410 3) Search #1 and #2 1335 4) Search #3 Limits: Entrez Date from 2000/01/01 to 2007/06/18 682 5) Search #4 Limits : Humans 682 6) Search #5 Limits : English, French, German, Italian, Spanish, Dutch 639 7) Search #6 Not Editorial[ptyp] OR Letter[ptyp]) 617
Note Date 18/06/2007 Database Cochrane Database of systematic review via
Cochrane Library Date covered 1993 to Present Search Strategy
1) MeSH descriptor Kidney Failure, Chronic explode all trees 16 2) MeSH descriptor Renal Replacement Therapy explode all trees 23 3) #1 and #2 10 4) MeSH descriptor Patient Satisfaction explode all trees 14 5) MeSH descriptor Physician-Patient Relations explode all trees 3 6) MeSH descriptor Quality of Life explode all trees 38 7) MeSH descriptor Socioeconomic Factors explode all trees 7 8) #4 or #5 or #6 or #7 61 9) #3 and #8 0
Note
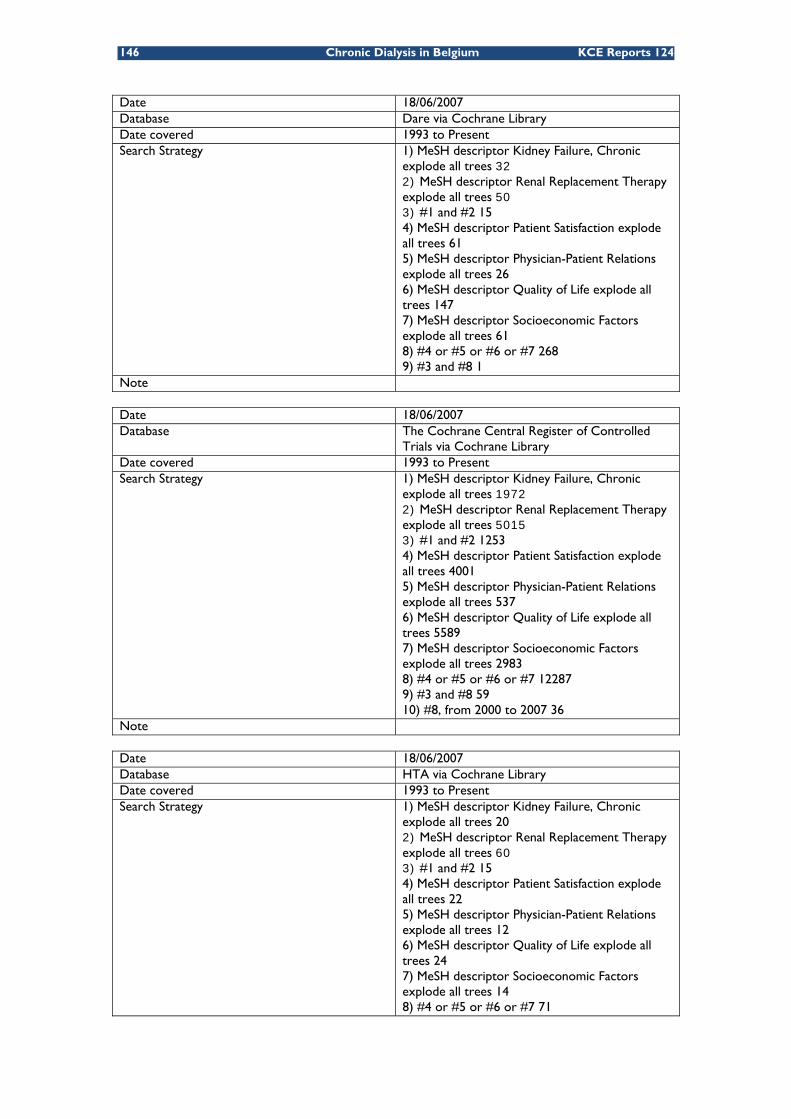
146 Chronic Dialysis in Belgium KCE Reports 124
Date 18/06/2007 Database Dare via Cochrane Library Date covered 1993 to Present Search Strategy
1) MeSH descriptor Kidney Failure, Chronic explode all trees 32 2) MeSH descriptor Renal Replacement Therapy explode all trees 50 3) #1 and #2 15 4) MeSH descriptor Patient Satisfaction explode all trees 61 5) MeSH descriptor Physician-Patient Relations explode all trees 26 6) MeSH descriptor Quality of Life explode all trees 147 7) MeSH descriptor Socioeconomic Factors explode all trees 61 8) #4 or #5 or #6 or #7 268 9) #3 and #8 1
Note Date 18/06/2007 Database The Cochrane Central Register of Controlled
Trials via Cochrane Library Date covered 1993 to Present Search Strategy
1) MeSH descriptor Kidney Failure, Chronic explode all trees 1972 2) MeSH descriptor Renal Replacement Therapy explode all trees 5015 3) #1 and #2 1253 4) MeSH descriptor Patient Satisfaction explode all trees 4001 5) MeSH descriptor Physician-Patient Relations explode all trees 537 6) MeSH descriptor Quality of Life explode all trees 5589 7) MeSH descriptor Socioeconomic Factors explode all trees 2983 8) #4 or #5 or #6 or #7 12287 9) #3 and #8 59 10) #8, from 2000 to 2007 36
Note Date 18/06/2007 Database HTA via Cochrane Library Date covered 1993 to Present Search Strategy
1) MeSH descriptor Kidney Failure, Chronic explode all trees 20 2) MeSH descriptor Renal Replacement Therapy explode all trees 60 3) #1 and #2 15 4) MeSH descriptor Patient Satisfaction explode all trees 22 5) MeSH descriptor Physician-Patient Relations explode all trees 12 6) MeSH descriptor Quality of Life explode all trees 24 7) MeSH descriptor Socioeconomic Factors explode all trees 14 8) #4 or #5 or #6 or #7 71

KCE Report 124 Chronic Dialysis in Belgium 147
9) #3 and #8 0 Note Date 19/06/2007 Database Embase Date covered 1974 to present Search Strategy
#1. 'chronic kidney failure'/exp 42,408 #2. 'kidney transplantation'/exp 73,569 #3. 'renal replacement therapy'/exp 7,084 #4. #2 OR #3 79,805 #5. #1 AND #4 6,482 #6. 'patient satisfaction'/exp 44,096 #7. 'treatment refusal'/exp 1,875 #8. 'doctor patient relation'/exp 59,864 #9. 'quality of life'/exp 104,051 #10. 'socioeconomics'/exp 98,802 #11. #6 OR #7 OR #8 OR #9 OR #10 293,627 #12. #5 AND #11 310 #13. #5 AND #11 AND [2000-2007]/py 182 #14. #5 AND #11 AND [2000-2007]/py AND [humans]/lim 180 #15. #5 AND #11 AND [2000-2007]/py AND [humans]/lim AND ([dutch]/lim OR [english]/lim OR [french]/lim OR [german]/lim OR [italian]/lim OR [spanish]/lim) 155 #16. #5 AND #11 AND [2000-2007]/py AND [humans]/lim AND ([dutch]/lim OR [english]/lim OR [french]/lim OR [german]/lim OR [italian]/lim OR [spanish]/lim) AND [embase]/lim 72
Note
POSSIBLE COMPLICATIONS Date 18/06/2007 Database MEDLINE Pubmed Date covered 1950 to Present Search Strategy 1) Search "Kidney Failure, Chronic"[Mesh] AND
"Renal Replacement Therapy"[Mesh] 32771 2) Search "complications "[Subheading] OR "adverse effects "[Subheading] OR "Life Expectancy"[Mesh] OR "Mortality"[Mesh] OR "Fatal Outcome"[Mesh] 2484467 3) Search #1 and #2 15958 4) Search #3 Limits: Entrez Date from 2000/01/01 to 2007/06/18 5987 5) Search #4 Limits : Humans 5974 6) Search #5 Limits : English, French, German, Dutch 5327 7) Search #6 Not Editorial[ptyp] OR Letter[ptyp]) 1203
Note Date 18/06/2007 Database Cochrane Database of systematic review via
Cochrane Library Date covered 1993 to Present

148 Chronic Dialysis in Belgium KCE Reports 124
Search Strategy 1) MeSH descriptor Kidney Failure, Chronic explode all trees 16 2) MeSH descriptor Renal Replacement Therapy explode all trees 23 3) #1 and #2 10 4) complication in Title, Abstract or Keywords or complications in Title, Abstract or Keywords or adverse effects in Title, Abstract or Keywords or side effects in Title, Abstract or Keywords or mortality in Title, Abstract or Keywords 2580 5) MeSH descriptor Life Expectancy explode all trees 1 6) MeSH descriptor Mortality explode all trees 37 7) #4 or #5 or #6 2580 8) #3 and #7 8 9) #8, from 2000 to 2007 8
Note Date 18/06/2007 Database Dare via Cochrane Library Date covered 1993 to Present Search Strategy 1) MeSH descriptor Kidney Failure, Chronic
explode all trees 32 2) MeSH descriptor Renal Replacement Therapy explode all trees 50 3) #1 and #2 15 4) complication in Title, Abstract or Keywords or complications in Title, Abstract or Keywords or adverse effects in Title, Abstract or Keywords or side effects in Title, Abstract or Keywords or mortality in Title, Abstract or Keywords 2031 5) MeSH descriptor Life Expectancy explode all trees 2 6) MeSH descriptor Mortality explode all trees 200 7) #4 or #5 or #6 2044 8) #3 and #7 10
Note Date 18/06/2007 Database The Cochrane Central Register of Controlled
Trials via Cochrane Library Date covered 1993 to Present Search Strategy 1) MeSH descriptor Kidney Failure, Chronic
explode all trees 1972 2) MeSH descriptor Renal Replacement Therapy explode all trees 5015 3) #1 and #2 1253 4) complication in Title, Abstract or Keywords or complications in Title, Abstract or Keywords or adverse effects in Title, Abstract or Keywords or side effects in Title, Abstract or Keywords or mortality in Title, Abstract or Keywords 146697 5) MeSH descriptor Life Expectancy explode all trees 60 6) MeSH descriptor Mortality explode all trees 6041 7) #4 or #5 or #6 147190

KCE Report 124 Chronic Dialysis in Belgium 149
8) #3 and #7 800 9) #8, from 2000 to 2007 434
Note Date 18/06/2007 Database HTA via Cochrane Library
Date covered 1993 to Present
Search Strategy 1) MeSH descriptor Kidney Failure, Chronic explode all trees 20 2) MeSH descriptor Renal Replacement Therapy explode all trees 60 3) #1 and #2 15 4) complication in Title, Abstract or Keywords or complications in Title, Abstract or Keywords or adverse effects in Title, Abstract or Keywords or side effects in Title, Abstract or Keywords or mortality in Title, Abstract or Keywords 205 5) MeSH descriptor Life Expectancy explode all trees 0 6) MeSH descriptor Mortality explode all trees 12 7) #4 or #5 or #6 209 8) #3 and #7 0
Note Date 19/06/2007 Database Embase Date covered 1974 to present Search Strategy #1. 'chronic kidney failure'/exp 42,408
#2. 'renal replacement therapy'/exp 7,084 #3. 'kidney transplantation'/exp 73,569 #4. #2 OR #3 79,805 #5. #1 AND #4 6,482 #6. 'mortality'/exp 330,687 #7. 'life expectancy'/exp 15,068 #8. 'survival rate'/exp 68,190 #9. 'fatality'/exp 61,837 #10. complication*:ab,ti 438,251 #11. 'adverse effect':ti,ab 13,987 #12. 'adverse effects':ab,ti 54,538 #13. 'side effect':ab,ti 18,495 #14. 'side effects':ab,ti 131,091 #15. #6 OR #7 OR #8 OR #9 OR #10 OR #11 OR #12 OR #13 OR #14 1,016,883 #16. #5 AND #15 1,330 #17. #5 AND #15 AND [2000-2007]/py 737 #18. #5 AND #15 AND [2000-2007]/py AND [humans]/lim 727 #19. #5 AND #15 AND [2000-2007]/py AND [humans]/lim AND ([dutch]/lim OR [english]/lim OR [french]/lim OR [german]/lim OR [italian]/lim OR [spanish]/lim) 643 #20. #5 AND #15 AND [2000-2007]/py AND [humans]/lim AND ([dutch]/lim OR [english]/lim OR [french]/lim OR [german]/lim OR [italian]/lim OR [spanish]/lim) AND [embase]/lim 323
Note

150 Chronic Dialysis in Belgium KCE Reports 124
ECONOMIC ASPECTS OF CHRONIC DIALYSIS Date 18/06/2007 Database MEDLINE Pubmed Date covered 1950 to Present Search Strategy
1) Search "Kidney Failure, Chronic"[Mesh] AND "Renal Replacement Therapy" [Mesh] 32774 2) Search ("Economics"[Mesh:NoExp]) 24741 3) Search ("Costs and Cost Analysis"[Mesh]) 128629 4) Search ("Value of Life"[Mesh:NoExp]) 4828 5) Search ("Economics, Dental" [Mesh:NoExp]) 1722 6) Search ("Economics, Hospital"[Mesh]) 14722 7) Search ("Economics, Medical"[Mesh:NoExp]) 6720 8) Search ("Economics, Nursing"[Mesh:NoExp]) 3742 9) Search ("Economics, Pharmaceutical" [Mesh:NoExp]) 1760 10) Search #27 or #29 or #30 or #31 or #32 or #34 or #37 or #39 172842 11) Search econom*[Title/Abstract] OR cost[Title/Abstract] OR costs[Title/Abstract] OR costly[Title/Abstract] OR costing[Title/Abstract] OR price[Title/Abstract] OR prices[Title/Abstract] OR princing[Title/Abstract] OR pharmacoeconomic*[Title/Abstract] 267715 12) Search expenditure*[Title/Abstract] NOT energy[Title/Abstract] 11276 13) Search value *1 money 335 14) Search budget* 16464 15) Search #11 or #12 or #13 or #14 284152 16) Search #10 or #15 370747 17) Search #1 and #16 1276 18) Search #17 Limits: Publication Date from 2000/01/01 to 2007/06/18 579 19) Search #18 Limits: Humans 576 20) Search #19 Limits: English, French, German, Italian, Spanish, Dutch 562 21) Search #55 NOT (Editorial[ptyp] OR Letter[ptyp]) 530
Note Date 18/06/2007 Database
Cochrane Database of systematic review via Cochrane Library
Date covered 1993 to Present Search Strategy
1) MeSH descriptor Kidney Failure, Chronic explode all trees 16 2) MeSH descriptor Renal Replacement Therapy explode all trees 23 3) #1 and #2 10 4) MeSH descriptor Economics explode all trees 17 5) (cost):ti,ab,kw or (costs):ti,ab,kw or (costing):ti,ab,kw or (economic):ti,ab,kw or (pharmacoeconomic):ti,ab,kw 520 6) #4 or #5 521
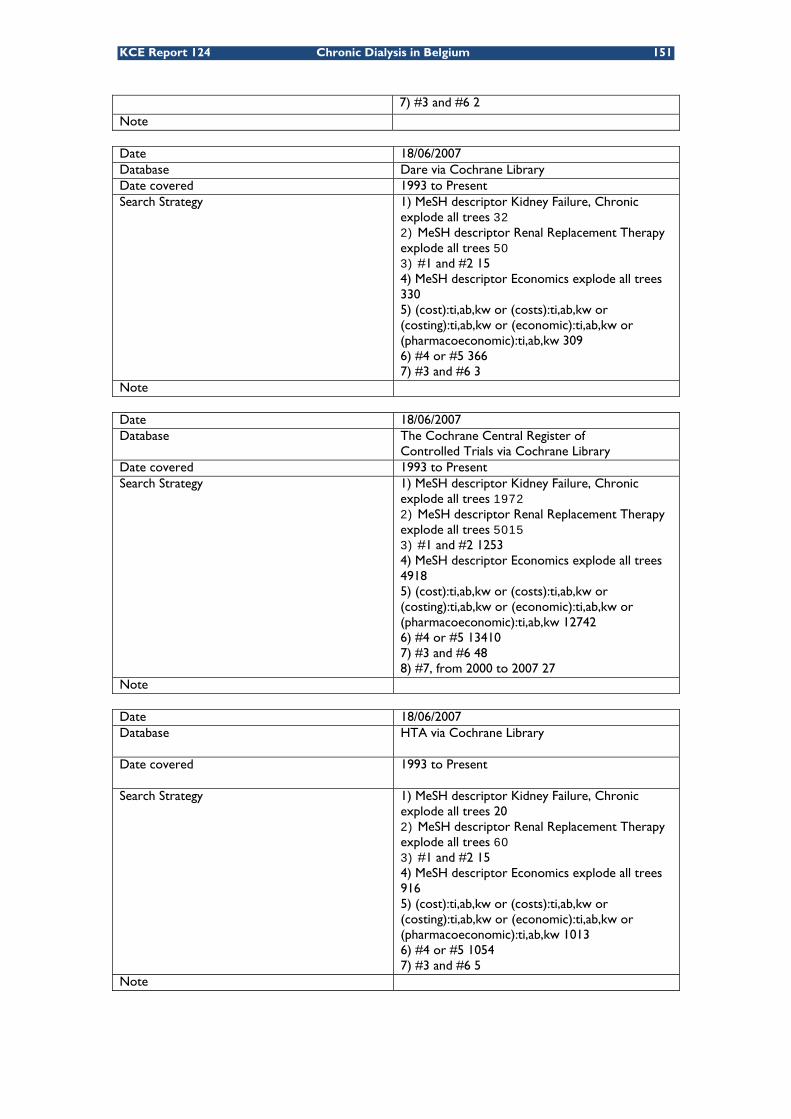
KCE Report 124 Chronic Dialysis in Belgium 151
7) #3 and #6 2 Note Date 18/06/2007 Database Dare via Cochrane Library Date covered 1993 to Present Search Strategy
1) MeSH descriptor Kidney Failure, Chronic explode all trees 32 2) MeSH descriptor Renal Replacement Therapy explode all trees 50 3) #1 and #2 15 4) MeSH descriptor Economics explode all trees 330 5) (cost):ti,ab,kw or (costs):ti,ab,kw or (costing):ti,ab,kw or (economic):ti,ab,kw or (pharmacoeconomic):ti,ab,kw 309 6) #4 or #5 366 7) #3 and #6 3
Note Date 18/06/2007 Database The Cochrane Central Register of
Controlled Trials via Cochrane Library Date covered 1993 to Present Search Strategy
1) MeSH descriptor Kidney Failure, Chronic explode all trees 1972 2) MeSH descriptor Renal Replacement Therapy explode all trees 5015 3) #1 and #2 1253 4) MeSH descriptor Economics explode all trees 4918 5) (cost):ti,ab,kw or (costs):ti,ab,kw or (costing):ti,ab,kw or (economic):ti,ab,kw or (pharmacoeconomic):ti,ab,kw 12742 6) #4 or #5 13410 7) #3 and #6 48 8) #7, from 2000 to 2007 27
Note Date 18/06/2007 Database
HTA via Cochrane Library
Date covered
1993 to Present
Search Strategy
1) MeSH descriptor Kidney Failure, Chronic explode all trees 20 2) MeSH descriptor Renal Replacement Therapy explode all trees 60 3) #1 and #2 15 4) MeSH descriptor Economics explode all trees 916 5) (cost):ti,ab,kw or (costs):ti,ab,kw or (costing):ti,ab,kw or (economic):ti,ab,kw or (pharmacoeconomic):ti,ab,kw 1013 6) #4 or #5 1054 7) #3 and #6 5
Note

152 Chronic Dialysis in Belgium KCE Reports 124
Date 18/06/2007 Database NHS EED via Cochrane Library
Date covered 1993 to Present
Search Strategy
1) MeSH descriptor Kidney Failure, Chronic explode all trees 237 2) MeSH descriptor Renal Replacement Therapy explode all trees 451 3) #1 and #2 168 4) MeSH descriptor Economics explode all trees 18064 5) (cost):ti,ab,kw or (costs):ti,ab,kw or (costing):ti,ab,kw or (economic):ti,ab,kw or (pharmacoeconomic):ti,ab,kw 18400 6) #4 or #5 18890 7) #3 and #6 148 8) #7, from 2000 to 2007 104
Note Date 19/06/2007 Database Embase Date covered 1974 to present Search Strategy
#1. 'chronic kidney failure'/exp 42,408 #2. 'renal replacement therapy'/exp 7,084 #3. 'kidney transplantation'/exp 73,569 #4. #2 OR #3 79,805 #5. #1 AND #4 6,482 #6. 'health economics'/de 25,132 #7. 'economic evaluation'/exp 125,778 #8. 'health care cost'/exp 119,532 #9. 'pharmacoeconomics'/exp 106,257 #10. #6 OR #7 OR #8 OR #9 295,797 #11. econom*:ab,ti OR cost:ab,ti OR costs:ab,ti OR costly:ab,ti OR costing:ab,ti OR price:ab,ti OR prices:ab,ti OR pricing:ab,ti OR pharmacoeconomic*:ab,ti 321,263 #12. expenditure*:ab,ti NOT energy:ab,ti 13,603 #13. 'value *2 money' 612 #14. budget*:ab,ti 14,478 #15. #11 OR #12 OR #13 OR #14 336,250 #16. #10 OR #15 515,337 #17. #5 AND #16 407 #18. #5 AND #16 AND [2000-2007]/py 226 #19. #5 AND #16 AND [2000-2007]/py AND [humans]/lim 223 #20. #5 AND #16 AND [2000-2007]/py AND [humans]/lim AND ([dutch]/lim OR [english]/lim OR [french]/lim OR [german]/lim OR [italian]/lim OR [spanish]/lim) 213 #21. #5 AND #16 AND [2000-2007]/py AND [humans]/lim AND ([dutch]/lim OR [english]/lim OR [french]/lim OR [german]/lim OR [italian]/lim OR [spanish]/lim) AND [embase]/lim 82
Note

KCE Report 124 Chronic Dialysis in Belgium 153
FLOW DIAGRAM FOR COST STUDIES
352 citations identified from electronic search and broad screened
0 citations identified from other sources
332 citations excluded
21 citations identified from electronic search and broad screened
22 potentially relevant reports
1 potentially relevant reports retrieved from other sources
11 Reports excluded : • Duplicate report of same trial data (1) • Did not contain sufficient information (1) • Report had no additional trial information (5) • Trial design not appropriate for the review (4)
11 relevant reports describing unique studies : • Economic Evaluations : 10 • Reviews of literature: 1

154 Chronic Dialysis in Belgium KCE Reports 124
FLOW DIAGRAM FOR COST-EFFECTIVENESS STUDIES
UPDATE SEARCH OCTOBER 2009 The aim of this update search was to cover the period between original searches at the start of this research project in mid 2007 and the more recent literature that appeared just before the publication of this report. The search was conducted at the end of October 2009 and to allow for potentially missed publications in 2007 we broadened the search to the years 2007 untill 2009. This update search was deliberately broad and no specific selection criteria were applied concerning relevance for indication, choice, complications or economic aspects as were described in the initial search (see previous). The aim was to find the most recent information on all topics addressed in this report.
Relevant reports describing unique studies: Economic Evaluations: 7 Reviews: 3
352 citations identified from electronic search and broad
screened
0 citations identified from other sources
326 citations excluded
26 citations identified from electronic search and broad
screened
32 potentially relevant reports
4 potentially relevant report retrieved from other
sources
Reports excluded: Duplicate report of same trial data (0) Did not contain sufficient information (5) Report had no additional trial information (0)Trial design not appropriate for the review (17)

KCE Report 124 Chronic Dialysis in Belgium 155
CRD
#1 MeSH Renal Replacement Therapy EXPLODE 1 780 #2 MeSH Kidney Failure, Chronic EXPLODE 1 2 3 4 405 #3 MeSH Renal Dialysis EXPLODE 1 2 457 #4 #1 or #2 or #3 919 #5 #1 or #2 or #3 RESTRICT YR 2007 2009 221
Pubmed
#1 Search (renal dialysis [Mesh]) AND systematic[sb] 06:08:24 690 #2 Search (kidney failure, chronic [Mesh]) AND systematic[sb] 06:10:40 655 #3 Search (renal replacement therapy [Mesh]) AND systematic[sb] 06:11:09 1158 #4 Search #1 or #2 or #3 06:11:41 1468 #5 Search ("2007"[Publication Date] : "3000"[Publication Date]) AND #1 or #2
or #3# 06:12:24 428
EMBASE
Search on emtree term ‘renal replacement therapy’, a term added to EMTREE in 2006. Registered synonyms are dialysis therapy; dialysis treatment; kidney dialysis; kidney replacement therapy; kidney support; renal dialysis; renal support
'renal replacement therapy'/exp AND ([cochrane review]/lim OR [meta analysis]/lim OR [systematic review]/lim) AND [humans]/lim AND [abstracts]/lim AND [2007-2010]/py:
140 hits
Cochrane collaboration
#1 MeSH descriptor Renal Replacement Therapy explode all trees 6510 #2 MeSH descriptor Kidney Failure, Chronic explode all trees 2738 #3 MeSH descriptor Renal Dialysis explode all trees 3554 #4 (#1 OR #2 OR #3), from 2007 to 2009 72
Filtering and sifting based on duplicates and title
After automatic elimination of duplicates this resulted in 719 individual references. A further manual elimination of duplicates resulted in 638 different references. A further sifting based on title and sometimes abstract resulted in 31 potentially valuable references that were retrieved. Twenty-one articles were discarded while 10 selected articles were valuable for one or more of the research topics addressed in this chapter.
DATA EXTRACTION SHEETS
Systematic Reviews and meta analyses
DATA EXTRACTION FORM Systematic review / Meta-analysis STUDY ID SHORT REF
…. ….
TITLE Rabindranath KS, Adams J, Ali TZ, MacLeod AM, Vale L, Cody J, Wallace SA, Daly C. Continuous ambulatory
peritoneal dialysis versus automated peritoneal dialysis for end-stage renal disease. Cochrane Database Syst Rev. 2007 Apr 18;(2):CD006515.10
SPONSOR CONFLICT OF INTEREST
The Cochrane Collaboration …. OBJECTIVES
To assess the comparative efficacy of continuous ambulatory peritoneal dialysis (CAPD) versus automated peritoneal dialysis (APD) for end-stage renal disease.

156 Chronic Dialysis in Belgium KCE Reports 124
SEARCH STRATEGY Cochrane Register of Controlled Trials, MEDLINE and other databases Most recent search May 2006
SELECTION CRITERIA
RCTs comparing CAPD and APD
RESULTS Three trials (139 patients) were included. APD did not differ from CAPD with respect to mortality, risk for
peritonitis, switching from PD to other dialysis modality, hernias, PD fluid leaks, PD catheter removal rate of hospital admissions. One study found a difference in peritonitis rate in favour of APD.
AUTHORS’ CONCLUSION
APD has no significant advantages over CAPD in terms of clinical outcomes.
COMMENTS REFEREE
The 3 studies included in this review are of small size. Most recent RCT dates from 1999.
CONCLUSION
DATA EXTRACTION FORM Systematic review / Meta-analysis STUDY ID SHORT REF
…. ….
TITLE Vale L, Cody J, Wallace S, Daly C, Campbell M, Grant A, Khan I, Donaldson C, MacLeod A. Continuous ambulatory
peritoneal dialysis (CAPD) versus hospital or home haemodialysis for end-stage renal disease in adults. Cochrane Database of Systematic Reviews 2003, Issue 1. Art. No.: CD003963. DOI: 10.1002/14651858.CD003963.pub2.11
SPONSOR CONFLICT OF INTEREST
The Cochrane Collaboration …. OBJECTIVES
To assess the benefits and harms of CAPD versus hospital or home haemodialysis for adults with CKD stage V.
SEARCH STRATEGY Cochrane Register of Controlled Trials, MEDLINE and other databases Most recent search January 2004
SELECTION CRITERIA
RCTs and quasi-RCTs comparing CAPD to hospital or home haemodialysis for adults with CKD stage V
RESULTS Only one trial published in abstract form was located. There was no statistical difference in death or quality
adjusted life years at 2 years between peritoneal and haemodialysis. AUTHORS’ CONCLUSION
Insufficient data to allow conclusions to be drawn about the relative effectiveness of CAPD compared with haemodialysis.
COMMENTS REFEREE The study was eventually published: Korevaar JC, Feith GW, Dekker FW, van Manen JG, Boeschoten EW, Bossuyt PM, Krediet RT; NECOSAD Study
Group. Effect of starting with hemodialysis compared with peritoneal dialysis in patients new on dialysis treatment: a randomized controlled trial.Kidney Int. 2003 Dec;64(6):2222-8.
Only 38 patients were randomised in this study. CONCLUSION

KCE Report 124 Chronic Dialysis in Belgium 157
DATA EXTRACTION FORM Systematic review / Meta-analysis
STUDY ID SHORT REF
…. ….
TITLE
Haemodiafiltration, haemofiltration and haemodialysis for end-stage kidney disease (review)90
SPONSOR CONFLICT OF INTEREST
National Kidney Research Fund (UK) National Kidney Research Fund (UK)
OBJECTIVES To compare convective modes of extracorporeal RRT (HF,HDF or AFB) with HD and to establish if any of these
techniques is superior to each other in patients with ESKD. SEARCH STRATEGY
MEDLINE (1966-2006), EMBASE (1980-2006), Cochrane Central Register of Controlled Trials (CENTRAL, in The Cochrane Library issue 2, 2006) and CINAHL (1872-2006). Authors of included studies were contacted, reference lists of identified RCTs and relevant narrative reviews were
screened. SELECTION CRITERIA
RCTs comparing HF, HDF, AFB and HD for ESKD were included. Trials enrolling any patient undergoing RRT for ESKD were included
RESULTS Description of studies (n = 20):
• RCTs The quality of the primary studies was variable. The quality check list was:
• Allocation concealment • Blinding • Intention-to-treat analysis • Completeness of follow-up
Outcomes: o All-cause mortality. o Hypotension (including incidence of symptomatic hypotension, hypotension requiring treatment
and post-dialysis hypotension, recorded as number of treatment sessions at which event occurred or number of patients experiencing one or more episodes of these complications).
o Symptoms (headaches, nausea, vomiting) occurring during or afterHDtreatment sessions (recorded as number of treatment sessions at which event occurred or number of patients experiencing one or more episodes of headaches, nausea or vomiting).
o Number of dialysis treatments associated with “any adverse symptoms” or number of patients experiencing “any adverse symptoms”.
o Number of dialysis sessions thatwere stopped early, independent of cause. o Quality of life measures: any instrument used o Number of hospital admissions and length of stay (as indicators of morbidity and resource use). o Number of patients with amyloid-related complications. o Change of dialysis modality (from HF or HDF or AFB or HD to PD). o Adequacy of dialysis (assessed by Kt/V values or by urea reduction ratio (URR)). o End of treatment blood pressure (measured as systolic, diastolic or mean arterial pressure, in mm
Hg). o End of treatment 2-microglobulin levels (mg/L).
AUTHORS’ CONCLUSION
• We were unable to demonstrate whether convective modalities (either HF, HDF or AFB) have significant advantages over HD with regard to clinically important outcomes of mortality, dialysis-related hypotension and hospitalisation. More adequately-powered good quality RCTs assessing clinically important outcomes (mortality, hospitalisation, quality of life) are needed.
It is therefore not possible to recommend the use of one modality in preference to the other.

158 Chronic Dialysis in Belgium KCE Reports 124
COMMENTS REFEREE • A table with the duration of the study is lacking.
13 studies are cross over. As the authors removed data from cross over in the meta-analyses, I am not sure that this meta-analysis was necessary. A simple description would be sufficient.
CONCLUSION
DATA EXTRACTION FORM Systematic review / Meta-analysis
STUDY ID SHORT REF
…. ….
TITLE Mowatt G, Vale L, Perez J, Wyness L, Fraser C, MacLeod A, Daly C and Stearns SC. Health Technology Assessment
2003; vol 7 n°2.Mowatt R., Vale L, MacLeod A. 9 and Systematic review of the effectiveness of home versus hospital or satellite unit hemodialysis for people with end-stage renal failure. Intl J of Technology Assessment in Health Care, 2004; 20:3, 258-268. 33
SPONSOR CONFLICT OF INTEREST
NHS None
OBJECTIVES
To assess the effectiveness of home hemodialysis versus hospital or satellite unit hemodialysis.
SEARCH STRATEGY MEDLINE 1966 to October 2001; EMBASE 1980 to week 46 2001; HealthSTAR 1975 to December 2000; CINAHL 1982 to October 2001; PREMEDLINE (Ovid) 13 December 2001; BIOSIS (Edina) 1985 to October 2001; Science Citation Index (Web of Science) 1981 to October 2001; The Cochrane Library (Issue 3 2001); National Research Register (Issue 3 2001); Health Management Information Consortium (HCN) 1979 to 2001; BL Inside (December 2001); NLM Gateway (for HSRProj, Health Services Research Meetings and Locatorplus); Current Controlled Trials; Clinical Trials; DH Research Findings Register; and World Wide Web. Reference
SELECTION CRITERIA Randomized controlled trials (RCTs), Controlled clinical trials (in which the participants are assigned to alternative forms of health care using a quasi
random method, for example alternation), Comparative observational studies (in which the participants are assigned to alternative forms of health care in a
nonrandom manner), and Systematic reviews comparing home with hospital or satellite hemodialysis for people with ESRF.
RESULTS Description of studies (n = 27):
• 4 systematic reviews • 1 RCT • 22 comparative observational studies
The quality of the primary studies and of the systematic review was variable: • 11 studies had less than 100 participants • socio-demographic characteristics and co-morbidities were not evenly balanced between the
treatment groups • in many studies, the intervention, particularly the equipment used and the duration and the
frequency of dialysis was poorly described Outcomes:
• Quality of life: o the QoL of home hemodialysis patients was higher and they were better able to engage in
activities of daily living o 2 studies reported that home hemodialysis is less disruptive for the patient but more disruptive
for their families than hospital dialysis • Survival (Cox model)

KCE Report 124 Chronic Dialysis in Belgium 159
o Lower mortality rate for home hemodialysis (versus hospital hemodialysis) o 2 studies with contradictory results:
similar survival in home versus satellite hemodialysis greater survival for home hemodialysis
• Other outcomes: o Hospitalisation: contradictory results:
Higher hospitalisation rate for home hemodialysis than for satellite hemodialysis, but the highest rate is observed for in-hospital
reduction in-hosptial days hemodialysis associated with daily or nocturnal hemodialysis o Employment: home HD patients were more likely to be employed o Technical survival: only one study, o Measures of anemia: higher hematocrit for patients in home hemodialysis o Biochemical indices of renal disease: difficult to interpret o Dialysis adequacy: difficult to interpret o Blood Pressure control: the home hemodialysis group achieved better control o Adverse events: better outcomes for home hemodialysis patients
AUTHORS’ CONCLUSION
• Home hemodialysis was associated with better outcomes than both hospital dialysis and (more modestly so) satellite unit dialysis in most of the studies included and for almost all measures of effectiveness considered. It is unclear to what extent these findings are influenced by the selection bias.
• The extent to which the associations with better outcome are causally linked to home dialysis, however, is difficult to judge. People offered hemodialysis at home are a deliberately highly selected group. They are generally younger and with fewer comorbidities than those receiving dialysis in hospital or in satellite units.
• Another factor that makes interpretation difficult is that, in some studies, the primary comparison was actually between different durations/frequencies of hemodialysis rather than specifically comparing settings for hemodialysis.
• A new generation of home hemodialysis machines is under development. These machines should improve ease of use for those undertaking hemodialysis at home, reducing the rate of complications and also the burden of care on partners/carers.
• For those without a carer but who might otherwise be considered potentially eligible for home hemodialysis, community carers could be trained to fulfill this role.
• Further prospective comparative studies are needed on the effectiveness and cost-effectiveness of home versus satellite unit haemodialysis. Further qualitative research is also needed on the acceptability to patients and their carers/families of home haemodialysis as a form of treatment.
COMMENTS REFEREE • The difficulty encountered in all studies is the bias in the attribution of patients to home hemodialysis • I could not correctly appreciate the relevance and the exhaustivity of all other outcomes
CONCLUSION

160 Chronic Dialysis in Belgium KCE Reports 124
Cost studies
Article Purpose of study Costs categories Results
Nocturnal haemodialysis: an Australian cost comparison with conventional satellite haemodialysis.16
Compare the expenditures of a conventional satellite HD unit (SHDU) and a nocturnal home HD program (NHHD).
The study was approved and financed by the Department of Human Services, Victoria (DHSV) to assess the financial cost benefits/deficit of NHHD in Australia. Data for 1 year (1 July 2003 – 30 June 2004) were collected from the Renal Unit in Geelong Hospital, Barwon Health, Victoria in Australia.
N = 30 SHDU patients
and 30 NHHD patients
• Staffing and recurrent costs
o Wages (nursing, cleaner, technician)
o Food
o Pharmacy
o Consumables
o Domestic (cleaning, waste disposal…)
o Energy (electricity, gas, water)
o Administration
o Maintenance
• Fixed and estimated costs
o Dialysis machine
o Main reverse osmosis plant
o Dialysis chair
o Generator plant
o Ancillary plant
o Bricks and mortar
The total expenditures per patient per year are:
NHHD: $A 32 392
SHDU: $A 36 284
Health services should encourage home HD because for a 30 patient cohort they could save $A 116 750
Economic evaluation of hemodialysis: implications for technology assessment in Greece.91
Provide an estimate of the direct cost of HD in a public hospital setting and an estimate of the loss of production for end stage renal disease (ESRD) patients.
Data were collected
. at the GGG NHS hospital in Athens
. from a countrywide sample of 128 patients for the lost of productivity and costs to the patient and family
. from national accounts (mean gross income) to compute lost production
• Direct health-care sector costs
o Medical supplies
o Drugs
o Laboratory tests
o Salaries and wages
o Overhead expenses
o Equipment, plant depreciation
o Dialysis membrane
o Concomitant drugs (EPO…)
o Laboratory tests
o Personnel costs
o Other (Administration, laundry,
Health-care sector costs for each HD session is estimated at €189/session where:
medical supplies and drugs = 53%
staff remuneration = 31%
overhead expenses = 6%

KCE Report 124 Chronic Dialysis in Belgium 161
due to absence from work
N = 128 patients
housekeeping, technical, porterage, electricity, depreciation expenses…)
• Mortality and Morbidity costs
• Value of production lost due to the treatment: absence, change in type of work, premature retirement
An operating cost comparison between conventional and home quotidian hemodialysis.18
Compare economic costs of short daily HD, long nocturnal HD and conventional thrice-weekly HD in Canada.
A retrospective costs analysis of each patient on conventional HD during 12 months is compared with the costs after switching to quotidian HD
N = 10 short daily HD patients,
12 long nocturnal HD patients and
22 conventional thrice-weekly HD patients
• Patient-measured costs
o Treatment supplies
o Consults and Intervention (consults, hospitalization days, emergency visits, laboratory tests)
o Pharmaceuticals
• Support-modeled costs
o Physician fees
o Machine
o Water
Maintenance of the home water system
Strict testing
• Labor costs
Registered nurse labor
Other labor
• Biomedical engineering
• Nontreatment supplies (administrative, direct overhead charges)
According to the retrospective analysis, the annual cost per patient is
Can$ 77,055 for a conventional HD
Can$ 91,793 for a nocturnal HD.
These figures decrease to Can$ 67,281 when the patient switched to daily HD modality.
Thus, the switch provokes an annual reduction of about Can$ 10,000 (-13%) and Can$ 17,000 (-19%) respectively.
Cost analysis of ongoing care of patients with end-stage renal disease: the impact of dialysis modality and dialysis access.19
Establish an accurate and updated itemized list of costs and resources required to treat patients with ESRD on dialysis therapy and contrast differences in resources needed for various dialysis modalities in Canada.
N = 88 In-center HD patients,
• Outpatient dialysis expenses
o Equipment costs (dialysis machine)
o Staff (nursing, dieticians, clericals, social)
o Consumables items
o Reverse-osmosis water
• Inpatient expenses
o Nursing
Annual costs of care per patient per modality before adjusting them in function of the comorbidity are:
In-center: US$ 51,252
Satellite: US$ 42,057
Home/self-care: US$ 29,961
Perit. Dial.: US$ 26,959

162 Chronic Dialysis in Belgium KCE Reports 124
31 Satellite HD patients,
9 Home/Self-care HD patients and
38 PD patients
o Laboratory
o Diagnostic
o Surgical (and surgical supplies)
o Medications
o Support staff
• Outpatient nondialysis expenses
o Clinic visits
o Emergency room
o Day surgery
o Laboratory tests
o Radiology
o Medications (EPO, intravenous iron, others)
• Physician fees
To maximize the efficiency with which care is provided to patients with ESRD, dialysis programs should encourage the use of home/self-care HD and PD.
Cost savings of home nocturnal versus conventional in-center hemodialysis.20
Cost comparison between Home nocturnal HD and In-center HD.
A prospective descriptive costing study was performed at two centers in Toronto, Canada from 1 January 2000 to 1 March 2001.
N = 33 HNHD patients and
23 IHD patients
• Staff
o Nursing
o Assistants
o Technical personnel
o Other (pharmacists, dieticians, social...)
o Non-medical pers (admin. management)
• Direct HD material
o Consumables
o Access-specific connectivity costs
• Drugs
• Overhead and support
• Physician fees
• Admission and procedures (costs for in-patients and out-patients)
• Depreciation
o Dialysis machine
The measured weekly costs per patient are (in year 2000 Canadian $):
$ 1,322 for IHD modality
$ 1,082 for HNHD modality
The projected annual costs for the two modalities are $ 68,935 and $ 56,394 respectively.
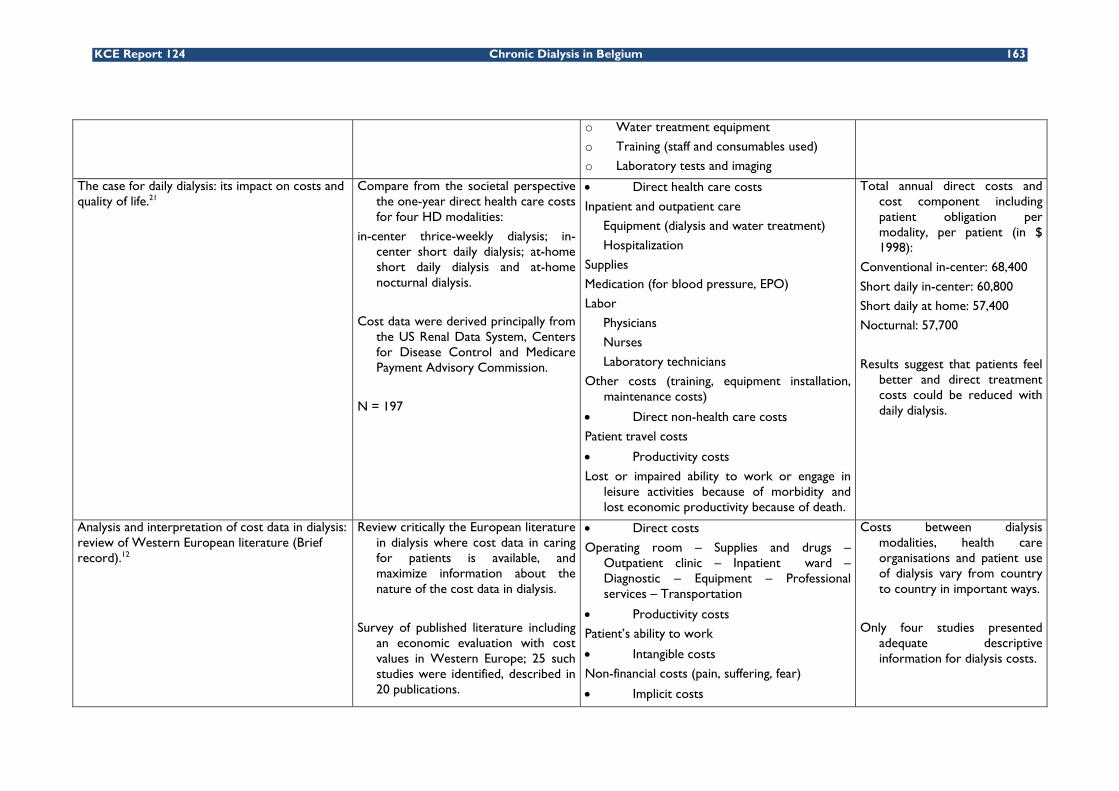
KCE Report 124 Chronic Dialysis in Belgium 163
o Water treatment equipment
o Training (staff and consumables used)
o Laboratory tests and imaging
The case for daily dialysis: its impact on costs and quality of life.21
Compare from the societal perspective the one-year direct health care costs for four HD modalities:
in-center thrice-weekly dialysis; in-center short daily dialysis; at-home short daily dialysis and at-home nocturnal dialysis.
Cost data were derived principally from the US Renal Data System, Centers for Disease Control and Medicare Payment Advisory Commission.
N = 197
• Direct health care costs
Inpatient and outpatient care
Equipment (dialysis and water treatment)
Hospitalization
Supplies
Medication (for blood pressure, EPO)
Labor
Physicians
Nurses
Laboratory technicians
Other costs (training, equipment installation, maintenance costs)
• Direct non-health care costs
Patient travel costs
• Productivity costs
Lost or impaired ability to work or engage in leisure activities because of morbidity and lost economic productivity because of death.
Total annual direct costs and cost component including patient obligation per modality, per patient (in $ 1998):
Conventional in-center: 68,400
Short daily in-center: 60,800
Short daily at home: 57,400
Nocturnal: 57,700
Results suggest that patients feel better and direct treatment costs could be reduced with daily dialysis.
Analysis and interpretation of cost data in dialysis: review of Western European literature (Brief record).12
Review critically the European literature in dialysis where cost data in caring for patients is available, and maximize information about the nature of the cost data in dialysis.
Survey of published literature including an economic evaluation with cost values in Western Europe; 25 such studies were identified, described in 20 publications.
• Direct costs
Operating room – Supplies and drugs – Outpatient clinic – Inpatient ward – Diagnostic – Equipment – Professional services – Transportation
• Productivity costs
Patient’s ability to work
• Intangible costs
Non-financial costs (pain, suffering, fear)
• Implicit costs
Costs between dialysis modalities, health care organisations and patient use of dialysis vary from country to country in important ways.
Only four studies presented adequate descriptive information for dialysis costs.

164 Chronic Dialysis in Belgium KCE Reports 124
Land – Building – Equipment
• Indirect cost
Donated labor (time spent by patient’s relatives…)
Prospective analysis of global costs for maintenance of patients with ESRD. 92
Analyse global costs for the management of an ESRD patient population supported with hemodialysis therapy in a satellite unit.
It’s a one-year prospective study (1 March 2000 to 1 March 2001). There are 4 data sources:
- medical records in the dialysis unit
- hospital patient accounting and medical system database
- system that allow measurement of hospital costs
- direct patient interviews.
N = 76 patients
Hospital costs
Hospital professional fees
Dialysis center facility fees
Dialysis center professional fees
The average cost for management of a patient with ESRD maintained with hemodialysis therapy in this setting is about $ 76,500 per patient per year in USA (South Carolina).
Cost analysis of renal replacement therapies in Finland. 59
Perform a detailed analysis of direct health care costs of the most used renal replacement therapies (RRTs) in Finland: in-center HD, CAPD and cadaveric renal transplantation (XT).
Retrospective study of the files of adults patients with ESRD who entered dialysis therapy between 1 January 1991 and 31 December 1996. Additional data from local hospitals and health centers were also collected.
Cost analysis take the perspective of service providers and the costing method determines direct health care costs associated with each treatment, including overhead costs caused by infrastructure, administration, amortization…
• HD Session
Salaries – Material, Supplies – Overhead costs
• CAPD Day
Fluid – Hoses – Protective caps – Disinfectants – Other equipment
The costs are converted from Finnish marks to US $ and the prices are those of year 1997.
Mean cost per patient:
- for months 1-6
HD = $ 32,566
CAPD = $ 25,504
- for months 7-12
HD = $ 26,272
CAPD = $ 24,218

KCE Report 124 Chronic Dialysis in Belgium 165
N = 138 in-center HD patients and 76 CAPD patients
- for year 2
HD = $ 54,140
CAPD = $ 45,262
- for year 3
HD = $ 54,490
CAPD = $ 49,299
Comparison of hemodialysis and peritoneal dialysis - A cost-utility analysis.28
Compare both health-related quality of life and costs for both HD and PD in a defined population in Sweden. The study has a societal perspective.
Cost data come from the annual accounts for 1998 and are looked in relation to the number of HD sessions carried out and the number of patients receiving PD that year.
Other data were obtained from a matched population by a quality-of-life questionnaire.
Retrospective record study:
N = 68 matched patients pairs
Prospective questionnaire study:
N = 21 matched patients triplets
• Direct costs
Staff
External activities
analysis, anesthesia, X rays,
consultations
Activity related material
pharmaceuticals, fluids, dialyzers, testing
and bandage materials, chemicals and
provisions
Other activity costs
rent, cleaning, porters and technicians,
laundry, communication, administration
Inpatient care
Secretarial and financial costs, depreciation
Transportation costs
• Indirect costs
Home care
Lost spare time on the part of patients and relatives
Lost working time on the part of patients
Costs per patient per month for HD = US$ 8,257
for PD = US$ 6,240
The marginal cost of satellite versus in-center hemodialysis.93
Establish the efficiencies associated with shifting resources and patients form In-center HD (ICHD) to SHD (Satellite HD unit) by finding the break-even volume (number of
• In-center Unit
Variable costs
Nephrologists
Nursing
The financial viability of a specific-sized SHD unit is expressed in terms of break-even volume: the number of patient needed in the satellite unit such that the yearly

166 Chronic Dialysis in Belgium KCE Reports 124
patients needed) in a satellite unit such that the yearly cost of SHD treatment would be the same as ICHD treatment.
For that, a cost analysis of both modalities from a societal perspective was performed.
Patient volume is
10 for the SHD unit
198 for the ICHD
Other patient care
Dialysis supplies
Laboratory
Drugs
Patient travel
Fixed costs
Other patient care (nurse practitioner)
Administration and support
Operating overhead
Machine and water treatment
• Satellite Unit
Variable costs
Idem + Standby staff and Dialysis assistant
Fixed costs
Idem except Other patient care
costs of HD treatment would be the same in that satellite unit as in hospital. Two parts compose the total yearly cost: a fixed cost plus a variable cost.
The SHD fixed costs can be fully offset if the volume of SHD patients is 7 per year. Shifting patients from ICHD to SHD can result in significant savings both to the health-care system and to patients:
- SHD has lower costs for nursing and physician fees.
- Mean travel costs saving of $ 12,364 per patient per year.

KCE Report 124 Chronic Dialysis in Belgium 167
Dialysis modalities taken into account by the articles Hospital HD Satellite HD1 Home
HD PD RTX2
Article Day Night Peeters 200012 European Literature review Agar 200516 X X McFarlane 200220 X X Kroeker 200318 X X X Mohr 200121 X X X Soroka 200693 X X Lee 200219 X X X Salonen 200359 X X X Sennfalt 200228 X X Kaitelidou 200591 X Ploth 200392 X
1 Low-care Haemodialysis

168 Chronic Dialysis in Belgium KCE Reports 124
Cost categories taken into account by the articles
Personnel
Medical Equipment Consumables Pharma Overheads Labo,imag. Hospitalis. Productivity
Surgical procedures Travel Training
Peeters 2000 12 Western Europe
X X X X X X X X X
Agar 2005 16 Australia X X X X X McFarlane 2002 20 Canada X X X X X X X X X Kroeker 2003 18 Canada X X X X X X X Mohr 2001 21 USA X X X X X X X X Soroka 2005 93 Canada X X X X X X X Lee 2002 19 Canada X X X X X X X Salonen 2003 59 Finland X X X X X X X X X Sennfalt 2002 28 Sweden X X X X X X X X X Kaitelidou 2005 91 Greece X X X X X X X X Ploth 2003 92 USA X X
Medical equipment: dialyzer and water treatment machines; Pharma = Pharmaceuticals: drugs and medication Overhead: administration, cleaning, electricity… ; Hospitalis = hospitalisation costs Labo,imag = laboratory tests, imaging, consultations
Population analyzed and measure’s unit
Dialysis Units Population Measure’s unit
Agar 2005 16 1 hospital 30 Hospital HD patients
30 Low care HD patients
Costs per patients, per month
McFarlane 2002 20 2 hospitals 23 Hospital HD patients
33 Home nocturnal HD patients
Measured weekly costs, projected annual costs for healthcare delivery
Kroeker 2003 18 10 Short daily HD patients
12 Long nocturnal HD patients
22 Conventional thrice-weekly HD patients
Costs per patient-year

KCE Report 124 Chronic Dialysis in Belgium 169
Mohr 2001 21 26 short daily HD patients
13 nocturnal HD patients
Annual direct costs of treatment for HD patients
Soroka 2005 93
1 hospital
1 Low care HD unit
198 Hospital HD patients
10 Low care patients
Fixed costs are expressed as a total amount for all patients;Variable costs are calculated per patient per year
Lee 2002 19 88 Hospital HD patients
31 Low care patients
9 Home HD patients
38 PD patients
Annual cost per patient
Salonen 2003 59 1 university hospital 138 Hospital HD patients
76 PD patients
Mean costs for months 1-6, months 7-12, year 2 and year 3
Sennfalt 2002 28 All dialysis departments in the southeastern health-care region of Sweden
Retrospective record study: 136 patients
Prospective questionnaire study: 81 patients
Cost per patient, per month
Kaitelidou 2005 91 1 hospital 128 hospital HD patients Cost per session extrapolated to obtain cost per year forentire ESRD population
Ploth 2003 92 1 hospital 76 HD patients ESRD global costs, average costs per patient per month
Units of resources measures Costs categories Personnel Medical Equipment Consumables Medicines Overheads Hospitalisation Agar 2005 16
FTE Amortization: Purchase price/number of years of use
Item Doses FTE, Square metre (m²), amortization or depreciation
NA
McFarlane 2002 20 FTE
Amortization: Purchase price/number of years of use
Per-treatment basis
Per medication Paid hours, m², percentage Number of admissions
Kroeker 2003 18 No detail
Amortization: Purchase price/number of years of
No detail No detail No detail No detail
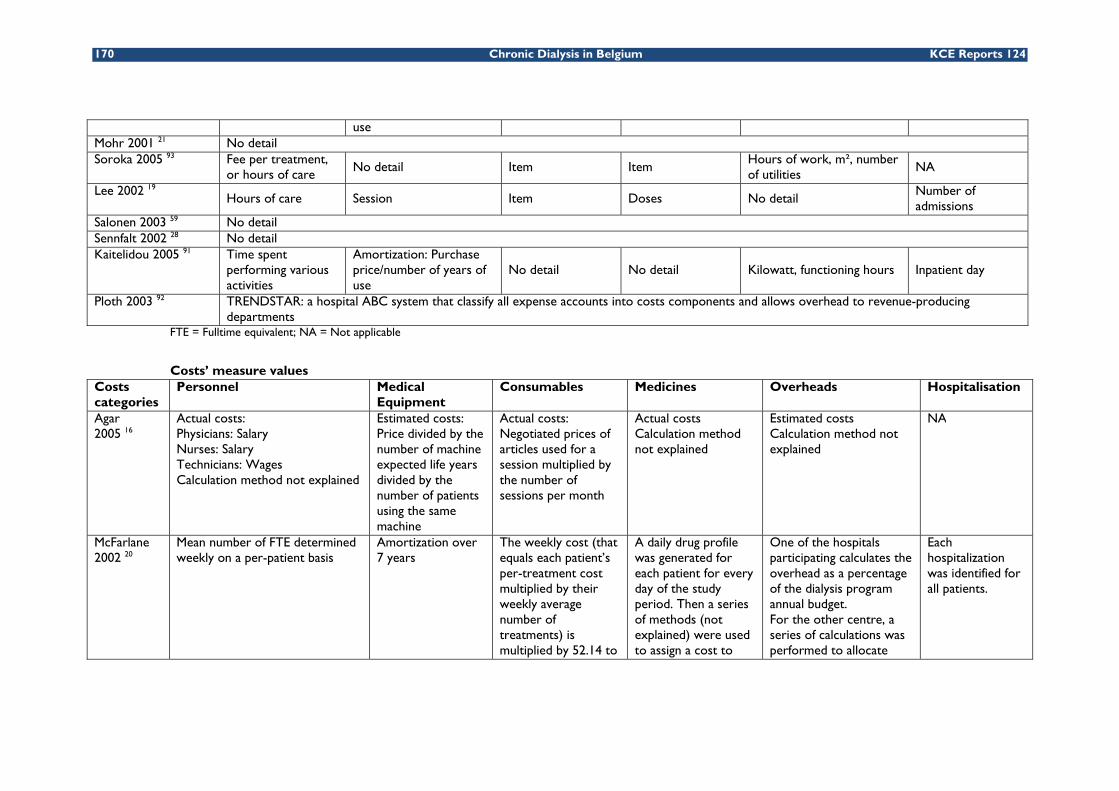
170 Chronic Dialysis in Belgium KCE Reports 124
use Mohr 2001 21 No detail Soroka 2005 93 Fee per treatment,
or hours of care No detail Item Item
Hours of work, m², number of utilities
NA
Lee 2002 19 Hours of care Session Item Doses No detail
Number of admissions
Salonen 2003 59 No detail Sennfalt 2002 28 No detail Kaitelidou 2005 91 Time spent
performing various activities
Amortization: Purchase price/number of years of use
No detail No detail Kilowatt, functioning hours Inpatient day
Ploth 2003 92 TRENDSTAR: a hospital ABC system that classify all expense accounts into costs components and allows overhead to revenue-producing departments
FTE = Fulltime equivalent; NA = Not applicable
Costs’ measure values Costs categories
Personnel Medical Equipment
Consumables Medicines Overheads Hospitalisation
Agar 2005 16
Actual costs: Physicians: Salary Nurses: Salary Technicians: Wages Calculation method not explained
Estimated costs: Price divided by the number of machine expected life years divided by the number of patients using the same machine
Actual costs: Negotiated prices of articles used for a session multiplied by the number of sessions per month
Actual costs Calculation method not explained
Estimated costs Calculation method not explained
NA
McFarlane 2002 20
Mean number of FTE determined weekly on a per-patient basis
Amortization over 7 years
The weekly cost (that equals each patient’s per-treatment cost multiplied by their weekly average number of treatments) is multiplied by 52.14 to
A daily drug profile was generated for each patient for every day of the study period. Then a series of methods (not explained) were used to assign a cost to
One of the hospitals participating calculates the overhead as a percentage of the dialysis program annual budget. For the other centre, a series of calculations was performed to allocate
Each hospitalization was identified for all patients.

KCE Report 124 Chronic Dialysis in Belgium 171
obtain a projected annual cost
each medication. these costs in function of the measure units (table 4). The calculation methods is not developed.
Kroeker 2003 18
Nephrologists: capitated weekly fee per patient
Amortization over 5 years
Calculation method not explained
Calculation method not explained
Calculation method not explained
Calculation method not explained
Mohr 2001 21
The costing method is explained in another article which is not available
Soroka Fixed costs are expressed as a total amount for all patients; Variable costs are calculated per patient per year 2005 93 Cost per hour multiplied by the
number of hours of work Purchase price (fixed cost)
Sum of the individual cost per item from hospital purchasing
Number of drugs used multiplied by their price
Annual salaries of administrative personnel, cost of utilities and housekeeping per m²
NA
Lee 2002 19
Direct nursing costs: estimated for each patient for every dialysis session Indirect nursing costs: divided equally among patients
Price divided by the number of years of use and by the total of runs estimated per year
The number of units used by each patient was multiplied by the price per unit
Allocation between 3 modalities per standard Calgary Health Region (Canada) costing procedure
Cost calculated using a provincially approved method (not developed)
Salonen 2003 59
The files of patients are studied retrospectively; The calculation method is not explained
Sennfalt 2002 28
Costs based on the proportion of the total number of performed HD session or the total number of PD patients
Amount of consumables needed per session multiplied by their price
Quantity of drugs prescribed during the year of the study multiplied by their price
Costs based on the proportion of the total number of performed HD session or the total number of PD patients
Kaitelidou 2005 91
The analyse was performed using a micro-costing evaluation of health-care resources consumed for HD sessions Calculation method not explained Amortization over
5 years for the dialysis machines and over 7 years for the water preparation system
Calculation method not explained
Calculation method not explained
Calculation method not explained
The cost of an inpatient day is multiplied by the length of stay to estimate the total cost
Ploth 2003 92
TRENDSTAR: a hospital ABC system that classify all expense accounts into costs components and allows overhead to revenue-producing departments

172 Chronic Dialysis in Belgium KCE Reports 124
Data sources Categories Personnel Medical Equipment Consumables Medicines Overheads Hospitalisation Agar 2005 16
Receipts and payments made through the Department of Finance
No detail Department of finance Hospital Pharmacy records
Department of finance NA
McFarlane 2002 20
Hospital data No detail Individualized per-treatment
. Physician order
. Pharmacist notes
. Computer based pharmacy records
. Percentage of the dialysis program annual budget . Costs split in function of m², hours, percentage…
Identified for all patients (hospital records)
Kroeker 2003 18
Workload measurement tool: Ambulatory Resource Measurement System
No detail Costs obtained from vendors and reflect fair market values
T-2 case-costing system: use general ledger information and relative values assigned to procedures
Mohr 2001 21
Data sources: the US Renal Data System (Annual report) ; Health Care Financing Administration ; Centers for Disease Control ; Medicare Payment Advisory Commission
Soroka 2005 93
Data come from the hospital and the Low care centre NA
Lee 2002 19
Recorded workload measurement unit (WLM)
No detail Data recorded in the monthly dialysis supplies records
Frequency and dosage were extracted from the Southern Alberga Renal Program (SARP) database for each patient
No detail SARP data base records the number of clinic visits made by each patient
Salonen 2003 59
Hospital data Medication recorded in detail for each patient
Source: hospital data Hospital records
Sennfalt 2002 28
Hospital data
Kaitelidou 2005 91
Data for the year 2000 were collected at the Georgios Gennimatas General NHS hospital in Athens
Ploth 2003 92
. Medical records in the dialysis unit
. KEANE: the hospital patient accounting and medical record system database (record all information about patient visit)
. TRENDSTAR: system that classify all expense accounts into costs components and allows overhead to revenue-producing departments
. Direct patient interviews to identify health care utilization by the patient during the interdialysis interval

KCE Report 124 Chronic Dialysis in Belgium 173
Cost-effectiveness analyses
Authors (Year) Gonzalez-Perez JG, Vale L, Stearns SC, Wordsworth S 2005 22
Funding UK department of Health
Country UK
Design CUA - Markov model
Perspective Not clearly specified (Health Care Payer?)
Time window 5-10 years
Interventions Satellite, home and hospital hemodialysis (HD)
Population A typical cohort of patients starting home, hospital or satellite hemodialysis with high, moderate and low risks.
Assumptions 1) Once patients died, were transplanted or were transferred to continuous peritoneal ambulatory dialysis, further costs or benefits incurred by these states were not included in the analysis. 2) Each row of the matrix of possible transitions should sum to one, some estimates were thus deduced using this requirement. 3) For hospital HD, lifespan of building and equipment were assumed to be 50 and 10 years respectively. For home HD, lifespan of home conversion and equipment were assumed to be 4 and 10 years respectively. 4) Costs per year were calculated assuming that dialysis occurred 3 times per week. 5) Access/set up, training, dialysis sessions and complication costs for satellite and hospital hemodialysis were assumed to be equal, except for staff costs. Cost of access and consumable were assumed to be the same between home, satellite and hospital hemodialysis. 6) Transfer probabilities from home HD to hospital HD and to satellite HD, and from hospital HD to home HD and satellite HD were assumed to be zero. 7) Mortality rate for satellite hemodialysis and hospital hemodialysis were assumed to be equal. 8) Home and satellite hemodialysis were assumed to have same utilities.
Data source for costs Mowatt 2003 9, Valderrabano 199694, Bremer 198937, Westlie 198495, Mackenzie 199896, renal administration at the Grampian University Hospital Trust and Kirby 2001 13.
Cost items included Direct health care costs: access/set up, training, dialysis sessions and complication. Items: Labor, consumable, capital and overheads. Transportation costs were not included (Costs: 2001/2002 UK £).
Data source for outcomes Mowatt 2003 9, Probabilities: UK Renal Registry 2001.97 Survival rates : Hellerstedt 1984.98 QALYs: De Wit 1998 (EQ-5d) 99 and Churchill 1988.100
Discounting Costs : 6%, Outcomes : 1,5%
Costs 1) Satellite HD: 5 years: £46,001 / 10 years: £62,054. 2) Home HD : 5 years : £47,657 / 10 years : £63,539 3) Hospital HD: 5 years: £48,254 / 10 years: £65,131. 4) Short daily or home nocturnal HD: 5 years: £53,494 / 10 years: £71,616.
Outcomes 1) Satellite HD: 5 years: 2.08 QALY / 10 years: 3.03 QALY. 2) Home HD: 5 years: 2.32 QALY / 10 years: 3.45 QALY. 3) Hospital HD: 5 years: 1.69 QALY / 10 years: 2.47 QALY. 4) Short daily or home nocturnal HD: 5 years: 2. 32 QALY / 10 years: 3.45 QALY.

174 Chronic Dialysis in Belgium KCE Reports 124
Cost-effectiveness 1) Home HD versus Satellite HD: 5 years: £6,665/QALY / 10 years: £3,493/QALY. 2) Home HD versus Hospital HD: 5 years: Home HD dominant / 10 years: Home HD dominant. 3) Short daily or home nocturnal HD versus Satellite HD: 5 years: £30,188/QALY / 10 years: £22,515/QALY. 4) Short daily or home nocturnal HD versus Hospital HD: 5 years: £7,586/QALY / 10 years: £6,696/QALY.
Sensitivity analysis A univariate sensitivity analysis was performed on QALYS but also on staffing levels of home and satellite HD and on the impact of similar mortality rate between modalities. Home hemodialysis was dominant compared to hospital for all variations investigated in the study. The maximal ICER of home versus satellite HD among the variations investigated in the study was £31,460/QALY at 10 years and £41,764/QALY at 5 years. A specific analysis for diabetic patients aged less than 50 years showed that home HD was a dominant strategy compared to hospital and satellite HD. For diabetic patients over 65 years, the ICER of home versus satellite HD was £36,007/QALY and the ICER of home versus hospital was £6,597/QALY.
Conclusions Satellite and home HD are dominant strategies compared to hospital HD at 5 and 10 years. Satellite HD seems to be less costly but also less effective than home dialysis but more data are needed to make a decision between these two strategies (considerable uncertainty concerning effectiveness data). Efficiency of home HD required that patients do not change of modality for a reasonable period (home HD become less costly than hospital HD only after 5 years). Further researches are needed (RCT, studies taking into account different organizations of care for satellite HD or improved technologies, etc.).
Remarks 1) As explained in their discussion, more effectiveness data are needed, especially from RCT. Some cost and utility data came from assumptions. Real values should be investigated in the future. QALYs found in this studies differ from the study of Mowatt et al 9, even if same sources and assumptions were used. We did not find any explications for these differences. 2) Quantities of resources were also not reported separately from their unit costs. However, sources were given and in these sources quantities of resources were given. Compared to the study of Mowatt et al 9, this study included the costs of converting a home for HD, which explain why costs of home HD were higher in this study. Finally, only direct health care costs were included. 3) Short daily home dialysis seems to deteriorate the cost-effectiveness ratio but such result was not taking into account in the conclusion. 4) Once patients were transplanted or were transferred to continuous peritoneal ambulatory dialysis, further costs or benefits incurred by these states would have been included in the analysis. 5) The univariate sensitivity analysis was not performed on all uncertain parameters. A probabilistic sensitivity analysis on all uncertain parameters should be performed. 6) Even if the choice of alternative was justified, they did not compare all existing modalities. 7) They should choose a lifelong timeframe instead of 10 years.
Authors (Year) Hooi LS, Lim TO, Goh A, Wong HS, Tan CC, Ahmad G, Morad Z (2005) 101
Funding Ministry of Health (MOH) research grant
Country Malaysia

KCE Report 124 Chronic Dialysis in Belgium 175
Design CEA - retrospective observational study
Perspective Ministry of Health
Time window Not clearly specified
Interventions 1) In-center hemodialysis (HD) versus no treatment. 2) Continuous ambulatory peritoneal dialysis (CAPD) versus no treatment.
Population Patients with end stage renal failure who were on dialysis between 1980 and 2001, who had been on either HD or CAPD for at least 5 years and who had not change modality when they were on dialysis.
Assumptions No assumption
Data source for costs National renal registry database
Cost items included Direct health care costs: Labor, consumable, capital and overheads costs. Costs borne by patients were excluded. (Costs: 2001 RM; USD 1 = 3.80 RM).
Data source for outcomes National renal registry database; Department of statistics, Malaysia102
Discounting Costs : 3% / Outcomes : 3%
Costs Total cost not given. HD : mean cost : RM 169 / HD; CAPD : mean cost : RM 2186/patient/month
Outcomes 1) HD: Life expectancy : 10.96 years 2) CAPD: Life expectancy : 5,21 years
Cost-effectiveness 1) HD: MR 33,641.96/life year 2) CAPD: MR 31,634.93/life year (average cost per life year saved).
Sensitivity analysis Uncertainty was not handled by confidence intervals. Some parameters were varied in an univariate sensitivity analysis. In all situation investigated, the average cost per life year saved of CAPD was better than for HD. When age increased, this ratio for both modalities got worse.
Conclusions The average costs per life year saved were similar for HD and CAPD. The use of these 2 modalities should thus be promoted.
Remarks 1) Effectiveness data come from an observational study (no RCT). 2) Major outcome was the number of life years gained, which is an appropriate outcome. However, QALY should have been interesting. 3) They do not perform an incremental analysis between HD and CAPD. Thus, they do not assess an incremental cost-effectiveness ratio. 4) Even if calculation of costs seems appropriate, total cost of both modalities on a lifelong period was not given. Moreover, quantities of resources were not reported separately from their unit costs. The generalisability to other settings is thus more difficult. Finally, only direct health care costs were included. 5) Uncertainty was not handled by confidence intervals for the cost-effectiveness ratios. 6) The choice of modalities compared was not justified, they did not compare all existing modalities and they did not clearly describe modalities compared.
Authors (Year) Kirby L, Vale L (2001) 13
Funding Chief Scientist Office of the Scottish Executive Health Department.
Country UK
Design CEA - Markov model (cycles of one month)
Perspective Not clearly specified (Health Care Payer?)
Time window Not clearly specified (lifelong?)

176 Chronic Dialysis in Belgium KCE Reports 124
Interventions Hospital? hemodialysis (HD) versus Continuous ambulatory peritoneal dialysis (CAPD).
Population Patients with end stage renal disease.
Assumptions 1) Patients only switched treatment modality after a complication. 2) Each row of the matrix of possible transitions should sum to one, some estimates were thus deduced using this requirement. 3) Each patient was treated the same way.
Data source for costs Grampian University Royal Hospitals NHS Trust and British National Formulary.103
Cost items included Direct health care costs: access, dialysis sessions and complication (e.g. peritonitis, access problems, etc.). Items: Labor, consumable, capital and overheads. (Costs : 1999 UK £)
Data source for outcomes MacLeod 1998,60 Burton 1989,104 Charytan 1986,105 Gokal 1987.106
Discounting Costs and outcomes: 0%, 6% and 10%.
Costs Incremental cost of HD compared to CAPD: varied from -£13,056 to £14,417 according to the scenario. (high and low estimates of probabilities and costs combined for each discount rate (0-6-10%) : 16 x 3 scenario were presented)
Outcomes Incremental effectiveness of HD compared to CAPD: varied from 0.01 to 0.82 additional life-years according to the scenario. (high and low estimates of probabilities and survival rates combined for each discount rate (0-6-10%) : 16 x 3 scenario were presented)
Cost-effectiveness and sensitivity analysis
In half of the scenario investigated (24/48), HD was a dominant strategy compared to CAPD. For the remaining scenario, HD was more effective but more costly and the ICER was £50,122 in the worst case.
Conclusions Starting with hospital HD may be more cost-effective than with CAPD. However, more robust and pragmatic primary researches (especially RCT) are needed to address such issue.
Remarks 1) Effectiveness data come from 3 observational studies (no RCT) but the method to deduce parameters of the model from these three studies was not given. 2) Major outcome was the number of life years gained, which is an appropriate outcome. However, QALY should have been interesting. 3) Even if calculation of costs seems appropriate, quantities of resources were not reported separately from their unit costs. The generalisability to other settings is thus more difficult. Finally, only direct health care costs were included. 4) Sensibility analysis on all uncertain parameters was performed but the method to obtain the ranges tested was not clear. A probabilistic sensitivity analysis on all uncertain parameters should be performed. 5) Even if the choice of modalities compared was justified, they did not compare all existing modalities. Moreover, they did not clearly describe modalities compared. 6) They concluded that HD was a more cost-effective strategy compared to CAPD. However, it is more correct to conclude that HD is a dominant strategy in some situations and is more effective but more costly strategy in other situations.

KCE Report 124 Chronic Dialysis in Belgium 177
Authors (Year) McFarlane PA, Bayoumi AM, Pierratos A, Redelmeier DA 200325
Funding The Canadian Society of Nephrology and the Kidney Foundation
Country Canada
Design CUA - Cross-sectional study
Perspective Not specified. (Health care payer perspective according to data sources for costs).
Time window Costs: 1 year and 2 months: January 1, 2000 to March 1, 2001.
Interventions In-center hemodialysis (IHD) (19 patients – one center) versus home nocturnal hemodialysis (HNHD) (24 patients).
Population 43 patients with end-stage renal disease, being proficient in English, having the capacity for self-care training and having a life expectancy of longer than 1 year. Moreover, either the patient or someone living in the home must have sufficient dexterity, vision, and auditory acuity to perform HNHD dialysis and patients had to be performing the modality for at least 3 months.
Assumptions /
Data source for costs A prospective descriptive costing study from January 1, 2000 to March 1, 2001. (McFarlane 2002) 20
Cost items included Direct health care costs: Labor, consumable, capital and overheads costs. (Costs: 2000 Canadian dollars).
Data source for outcomes
Interview of patients at the Humber River Regional Hospital and the St. Michael's Hospital in Toronto. Utilities: Standard gamble technique.
Discounting Not specified (but short term study => not appropriated).
Costs HNHD : $55,139 +/- $7,651 / IHD : $66,367 +/- $17,502 (p = 0.03)
Outcomes Utilities : HNHD : 0.77 +/- 0.23 / IHD : 0.53 +/- 0.35 (p = 0.03)
Cost-effectiveness HNHD = dominant strategy.
Sensitivity analysis and handle of uncertainty
Bootstrap analysis with 2500 iterations. ICER 95%: -$13,976 to -$142,998.
Conclusions HNHD is a dominant strategy compared to IHD: HNHD is associated with a higher quality of life and a lower cost when compared to IHD.
Remarks 1) Time horizon was too short and the sample size was small. As explained in their discussion, more long term data are needed, especially from large-scale RCT. 2) Patients were in general younger, had less diabetes and cardiovascular disease, and had been on dialysis for longer than typical patients, which may bias the utility scores (higher values) and limits the generalisability of the analysis. Moreover, interviews were delayed if there were recent events that could significantly lower utility scores, which also bias utilities toward higher values. 3) Quantities of resources were not reported separately from their unit costs. The generalisability to other settings is thus more difficult. Moreover, only direct health care costs were included and methods to obtain them were not explained. Only sources were given. 4) A bootstrap analysis was performed which reduce the uncertainty of data. 5) They did not compare all existing modalities and they did not assess changing in modalities.
Authors (Year) McFarlane PA, Bayoumi AM, Pierratos A, Redelmeier DA 2006 26
Funding The Canadian Society of Nephrology and the Kidney Foundation of Canada Country Canada
Design CUA - Markov model (cycles of one week)
Perspective Health care payer
Time window Lifelong
Interventions In-center hemodialysis (IHD) versus starting on IHD and subsequently transferring to home nocturnal hemodialysis (HNHD).

178 Chronic Dialysis in Belgium KCE Reports 124
Population Patients with a mean age of 47.2, with few co-morbidities and who have been on dialysis on average for 9.4 years.
Assumptions 1) Delay before switching from IHD to HNHD = 5-year. 2) Home and conventional HD have similar mortality rate. 3) Many of the known health benefits of HNHD do not directly lead to cost savings. 4) Capital costs of HNHD were not amortized over a long period of time and were assumed to be borne at the initiation of the modality. 5) Graft functioned initially after transplantation but short and long-term graft losses with subsequent return to IHD were allowed. Re-transplantations were not allowed (because it is a rare event). 6) The weekly probability of death from home dialysis complications was 10%, the weekly probability of resolution of home dialysis complications was 80%, the proportion of patients eligible for transplantation was 50% and the proportion of transplantations from live donors was 33%. 7) Health care costs unrelated to end stage renal disease were assume to be equal. (N.B.: Authors specified that all these assumptions were conservative, i.e. supporting stating on IHD).
Data source for costs Laupacis 1996,107 McFarlane 2002,20 McFarlane 2003, 25, Redelmeier 1996,108 and Robers 2001.109
Cost items included Direct health care cost of dialysis, complications and transplantations. (Costs : 2003 Canadian $)
Data source for outcomes
Canadian Organ Replacement Registry 2001,110 Wolfe 1999,3 Laupacis 1996,107 McFarlane 2002 20, McFarlane 2003 25, Coyte 1996,111 Levin 1992,112 Kroeker 2003,18 a study of 1992 and authors' opinions.
Discounting Outcomes: 3%; Costs: 3%.
Costs HNHD: $538,094; IHD: $543,602
Outcomes 1) Life expectancy: IHD → HNHD: 13.4 years; IHD: 13.2 years. 2) QALY: IHD → HNHD: 5.79; IHD: 5.31.
Cost-effectiveness IHD → HNHD is a dominant strategy compared to IHD for a lifetime period.
Sensitivity analysis If the cost of IHD was less than HNHD, if IHD was associated with higher utility or if the benefits of HNHD declined rapidly, HNHD is not anymore a cost-effective strategy (>$ 50,000/QALY). If transplantation was allowed, the cost-effectiveness ratio gets worse. A Monte Carlo analysis with 1000 iterations showed that HNHD was dominant in 75.9% of iteration and was cost-effective (i.e. < $50,000/QALY) for 99.7% of iterations.
Conclusions HNHD is a dominant strategy compared to IHD for a lifetime period.
Remarks 1) As explained in their discussion, more effectiveness data are needed, especially from large-scale RCT. 2) The method to deduce parameters of the model from the selected studies was not given. 3) Quantities of resources were not reported separately from their unit costs. The generalisability to other settings is thus more difficult. Moreover, only direct health care costs were included and methods to obtain them were not explained. 4) A probabilistic sensitivity analysis on all uncertain parameters was performed which reduce the uncertainty of data. 5) Even if the choice of modalities compared was justified, they did not compare all existing modalities. Moreover, they did not clearly describe modalities compared. 6) Authors seem to have done conservative assumptions.
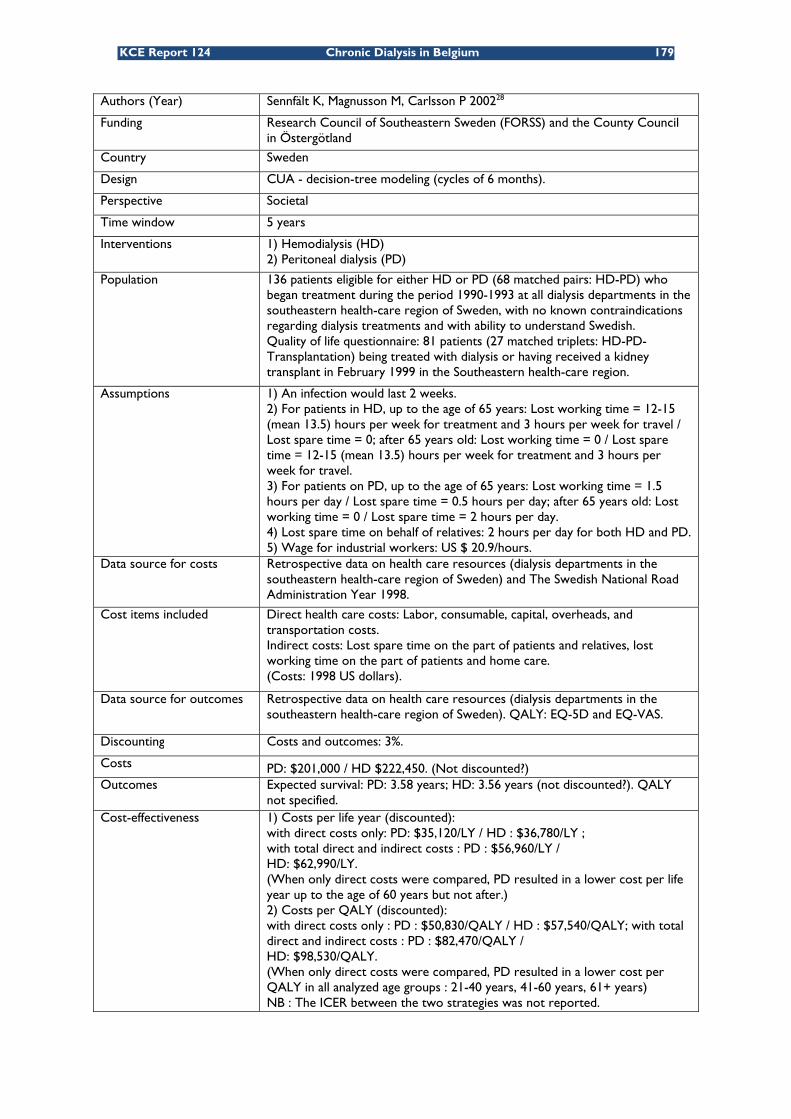
KCE Report 124 Chronic Dialysis in Belgium 179
Authors (Year) Sennfält K, Magnusson M, Carlsson P 200228
Funding Research Council of Southeastern Sweden (FORSS) and the County Council in Östergötland
Country Sweden
Design CUA - decision-tree modeling (cycles of 6 months).
Perspective Societal
Time window 5 years
Interventions 1) Hemodialysis (HD) 2) Peritoneal dialysis (PD)
Population 136 patients eligible for either HD or PD (68 matched pairs: HD-PD) who began treatment during the period 1990-1993 at all dialysis departments in the southeastern health-care region of Sweden, with no known contraindications regarding dialysis treatments and with ability to understand Swedish. Quality of life questionnaire: 81 patients (27 matched triplets: HD-PD-Transplantation) being treated with dialysis or having received a kidney transplant in February 1999 in the Southeastern health-care region.
Assumptions 1) An infection would last 2 weeks. 2) For patients in HD, up to the age of 65 years: Lost working time = 12-15 (mean 13.5) hours per week for treatment and 3 hours per week for travel / Lost spare time = 0; after 65 years old: Lost working time = 0 / Lost spare time = 12-15 (mean 13.5) hours per week for treatment and 3 hours per week for travel. 3) For patients on PD, up to the age of 65 years: Lost working time = 1.5 hours per day / Lost spare time = 0.5 hours per day; after 65 years old: Lost working time = 0 / Lost spare time = 2 hours per day. 4) Lost spare time on behalf of relatives: 2 hours per day for both HD and PD. 5) Wage for industrial workers: US $ 20.9/hours.
Data source for costs Retrospective data on health care resources (dialysis departments in the southeastern health-care region of Sweden) and The Swedish National Road Administration Year 1998.
Cost items included Direct health care costs: Labor, consumable, capital, overheads, and transportation costs. Indirect costs: Lost spare time on the part of patients and relatives, lost working time on the part of patients and home care. (Costs: 1998 US dollars).
Data source for outcomes Retrospective data on health care resources (dialysis departments in the southeastern health-care region of Sweden). QALY: EQ-5D and EQ-VAS.
Discounting Costs and outcomes: 3%.
Costs PD: $201,000 / HD $222,450. (Not discounted?) Outcomes Expected survival: PD: 3.58 years; HD: 3.56 years (not discounted?). QALY
not specified. Cost-effectiveness 1) Costs per life year (discounted):
with direct costs only: PD: $35,120/LY / HD : $36,780/LY ; with total direct and indirect costs : PD : $56,960/LY / HD: $62,990/LY. (When only direct costs were compared, PD resulted in a lower cost per life year up to the age of 60 years but not after.) 2) Costs per QALY (discounted): with direct costs only : PD : $50,830/QALY / HD : $57,540/QALY; with total direct and indirect costs : PD : $82,470/QALY / HD: $98,530/QALY. (When only direct costs were compared, PD resulted in a lower cost per QALY in all analyzed age groups : 21-40 years, 41-60 years, 61+ years) NB : The ICER between the two strategies was not reported.

180 Chronic Dialysis in Belgium KCE Reports 124
Sensitivity analysis An univariate sensitivity analysis was performed but not on all uncertain parameters. Only inpatients care costs and external activities (analysis, anesthesia, X Rays and consultation costs) for HD (but not for PD) were varied. As results, the cost-effectiveness ratio varied from $90,760/QALY to $100,070/QALY for HD (costs and outcomes not discounted). Variations in transplantation rate were also investigated but neither the range, nor the results were given. They only specified that there were few impacts on results. Variations in other costs and outcomes were not investigated.
Conclusions 1) PD and HD resulted in similar frequencies of transplantation and expected survival for the period studied (5 years). 2) PD resulted in more favorable expected cost/LY and cost/QALY than HD.
Remarks 1) As explained in their discussion, more long term data are needed. 2) Data come from a retrospective studies based on databases (no RCT) 3) Quantities of resources were not reported separately from their unit costs. The generalisability to other settings is thus more difficult. Moreover, all assumptions made to estimate costs do not seem to be described. 4) They do not perform an incremental analysis between HD and PD. Thus, they do not assess an incremental cost-effectiveness ratio. 5) An univariate sensitivity analysis was performed but parameters investigated were insufficient to correctly handle uncertainty. A probabilistic sensitivity analysis on all uncertain parameters should be performed. 6) Even if the choice of modalities compared was justified, they did not compare all existing modalities. Moreover, they did not clearly describe modalities compared.
Authors (Year) Teerawattananon Y, Mugford M, TangcharoensathienV. 200729
Funding The National Health Security Office (NHSO) and the World Health Organization (WHO) country office.
Country Thailand.
Design CUA - Markov model.
Perspective The National Health Security Office and the societal perspectives
Time window Lifelong (99-year period)
Interventions 1) Peritoneal dialysis (PD) as initial care followed by hemodialysis (HD) if complications/switching occur compared to the "palliative care" option. 2) HD as initial care followed by PD if complications/switching occur compared to the "palliative care" option. N.B. : PD = Continuous ambulatory peritoneal dialysis (CAPD) / HD = Hospital HD
Population ESRD patients aged between 20 to 70 years.
Assumptions 1) PD and HD are equally effective in terms of patient survival (based on results of systematic reviews). 2) Short half-life of patients with palliative care (1-3 months). 3) Quality of life of ESRD patients with dialysis and complications was assumed to be equal to the quality of life of ESRD patients without dialysis because other data were not available. 4) They assumed independence between the occurrence of complications and switching between treatment modalities in the model.
Data source for costs Micro-costing survey in two public hospitals and one private hospital. Tisayathikom 2003,113 Sriwajana 1997,114 and Homvijitkul 1999.115
Cost items included Health care costs: Labor, material, and capital costs + Opportunity costs lost by patients and relatives (2004 Thai Baht / 1US$ 2004 = 12.868 Thai Baht).

KCE Report 124 Chronic Dialysis in Belgium 181
Data source for outcomes Survival : Thailand Renal Replacement Therapy Registry (follow-up 4 years), MacLeod 1998 (systematic review)60 Korevaar 2003 (RCT),41 Van Biesen 2000 (observational study),116 Complication rate : Tangcharoensathien 2001,117 Wongsiripisaan 2003,118 Quality of life : meta-analysis of 3 thesis and one study : Sriwajana 2003,114 Maharatanavirosn 1999,119 Pukpobsuk 2001,120 and Kusoom 2004.121
Discounting Base case : Costs and outcomes : 3.5% / sensitivity analysis : 0-6%
Costs 1) PD: NHSO's perspective: from 3,126,000 to 7,804,000 Bath according to the patient age. Societal perspective: from 3,286,000 to 8,277,000 Bath according to the patient age. 2) HD: NHSO's perspective: from 3,235,000 to 7,956,000 Bath according to the patient age. Societal perspective: from 3,775,000 to 9,286,000 Bath according to the patient age. 3) Palliative care: NHSO's perspective: 72,000 Baht. Societal perspective: 224,000 Baht.
Outcomes 1) PD: life year (LY): from 6.53 to 17.65 according to the age and the calculation of survival. QALY : from 4.60 to 12.32 according to the age and the calculation of survival 2) HD: LY: from 6.53 to 17.65 according to the age and the calculation of survival. QALY: from 4.38 to 11.89 according to the age and the calculation of survival. 3) Palliative care: LY: 0.34 / QALY: 0.20.
Cost-effectiveness 1) PD versus palliative care: NHSO's perspective: from 447,000 Bath/LY to 495,000 Bath/LY and from 641,000 Bath/QALY to 696,000 Bath/QALY. Societal perspective: from 466,000 Bath/LY to 497,000 Bath/LY and from 667,000 Bath/QALY to 700,000 Bath/QALY. 2) HD versus palliative care: NHSO's perspective: from 456,000 Bath/LY to 512,000 Bath/LY and from 675,000 Bath/QALY to 759,000 Bath/QALY. Societal perspective: from 525,000 Bath/LY to 575,000 Bath/LY and from 777,000 Bath/QALY to 850,000 Bath/QALY.
Sensitivity analysis A probabilistic sensitivity analysis using a second-order Monte Carlo simulation. Results: Proving PD first was the optimal choice for a societal willingness-to-pay threshold of 700,000 Bath/QALY for age group 20 years and 750,000 Bath/QALY for age group 70 years. Variation in the interest rate did not change major direction of results.
Conclusions Proving PD first was the optimal choice but was only considered as a cost-effective strategy if the societal willingness-to-pay threshold was 700,000 Bath/QALY for age group of 20 years and 750,000 Bath/QALY for age group of 70 years.
Remarks 1) Effectiveness and costs data came from national registry and national studies, which limits the generalisability of the analysis to others setting, especially to developed countries. 2) More evidence on PD versus HD survival should be conducted, in this study, they were assumed to be equal. 3) Quantities of resources were not reported separately from their unit costs. The generalisability to other settings is thus more difficult. Moreover, they came from different sources and methods to obtain them were only partially explained. In most cases, only sources were given. 4) Few details were given about parameters used in the model. 5) A probabilistic sensitivity analysis was used to reduce uncertainty. 6) They did not clearly described modalities compared. 7) Transfer to transplantation and further costs or benefits incurred by this were not included in the analysis.

182 Chronic Dialysis in Belgium KCE Reports 124
Authors (Year) Mowatt G, Vale L, Perez J, Wyness L, Fraser C, MacLeod A, Daly C, Stearns
SC9
Funding UK National Health Service (NHS)
Country UK
Design CUA - Markov model
Perspective NHS
Time window 5-10 years
Interventions Satellite, home and hospital hemodialysis (HD)
Population A typical cohort of patients starting home, hospital or satellite hemodialysis with high, moderate and low risks.
Assumptions 1) Once patients died, were transplanted or were transferred to continuous peritoneal ambulatory dialysis, further costs or benefits incurred by these states were not included in the analysis. 2) Each row of the matrix of possible transitions should sum to one, some estimates were thus deduced using this requirement. 3) For hospital HD, lifespan of building and equipment were assumed to be 50 and 10 years respectively. For home HD, lifespan of home conversion and equipment were assumed to be 4 and 10 years respectively. 4) Costs per year were calculated assuming that dialysis occurred 3 times per week. 5) Access/set up, training, dialysis sessions and complication costs for satellite and hospital hemodialysis were assumed to be equal, except for staff costs. Cost of access and consumable were assumed to be the same between home, satellite and hospital hemodialysis. 6) Transfer probabilities from home HD to hospital HD and to satellite HD, and from hospital HD to home HD and satellite HD were assumed to be zero. 7) Mortality rate for satellite hemodialysis and hospital hemodialysis were assumed to be equal. 8) Home and satellite hemodialysis were assumed to have same utilities.
Data source for costs Valderrabano 1996 94, Bremer 1989 37, Westlie 1984 95, Mackenzie 1998 96, renal administration at the Grampian University Hospital Trust and Kirby 2001 13.
Cost items included Direct health care costs: access/set up, training, dialysis sessions and complication. Items: Labor, consumable, capital and overheads. Transportation costs and productivity changes are reported separately (Costs: 2001/2002 UK £).
Data source for outcomes Probabilities: UK Renal Registry 2001 97. Survival rates: Hellerstedt 1984 98. QALYs: De Wit 1998 99 (EQ-5d) and Churchill 1988 100.
Discounting Costs : 6%, Outcomes : 1,5%
Costs 1) Satellite HD: 5 years: £46,001 / 10 years: £62,054. 2) Home HD: 5 years: £46,551 / 10 years: £63,717. 3) Hospital HD: 5 years: £48,254 / 10 years: £65,131. 4) Short daily or home nocturnal HD: 5 years: £54,133 / 10 years: £74,232.
Outcomes 1) Satellite HD: 5 years: 2.48 QALY / 10 years: 3.43 QALY. 2) Home HD: 5 years: 2.73 QALY / 10 years: 3.86 QALY. 3) Hospital HD: 5 years: 2.02 QALY / 10 years: 2.80 QALY. 4) Short daily or home nocturnal HD: 5 years: 2. 73 QALY / 10 years: 3.86 QALY.

KCE Report 124 Chronic Dialysis in Belgium 183
Cost-effectiveness 1) Home HD versus Satellite HD: 5 years: £2,215/QALY / 10 years: £3,914/QALY. 2) Home HD versus Hospital HD: 5 years: Home HD dominant / 10 years: Home HD dominant. 3) Short daily or home nocturnal HD versus Satellite HD: 5 years: £32,753/QALY / 10 years: £28,669/QALY. 4) Short daily or home nocturnal HD versus Hospital HD: 5 years: £8,307/QALY / 10 years: £8,585/QALY.
Sensitivity analysis An univariate sensitivity analysis was performed on QALYS but also on staffing levels of home and satellite HD, on the impact of similar mortality rate between modalities, and on the inclusion of travel costs and careers' allowance for home HD. Home hemodialysis was dominant compared to hospital for most variations investigated in the study. The maximal ICER of home versus satellite HD among the variations investigated in the study was £37,242/QALY at 5 years and £31,879/QALY at 10 years. With the inclusion of travel costs, home HD is dominant strategy compared to both hospital and satellite HD. On the other hand, inclusion of high allowances to home HD patients would dramatically increase the ICER of home HD compared to hospital or satellite HD. A specific analysis for diabetic patients aged less than 50 years and for diabetic patients over 65 years was also performed. As results, home HD was a dominant strategy compared to hospital and satellite HD (for patients over 65 years, home was a dominant strategy only after 2 years).
Conclusions Satellite and home HD are dominant strategies compared to hospital HD at 5 and 10 years. Satellite HD seems to be less costly but also less effective than home dialysis but more data are needed to make a decision between these two strategies (considerable uncertainty concerning effectiveness data). Efficiency of home HD required that patients do not change of modality for a reasonable period. Further researches are needed.
Remarks 1) As explained in their discussion, more effectiveness data are needed, especially from RCT. Some cost and utility data came from assumptions. Real values should be investigated in the future. QALYs found in this studies differ from the study of Gonzalez-Perez et al 22, even if same sources and assumptions were used. We did not find any explications for these differences. 2) Compared to the study of Gonzalez-Perez et al 22, this study did not include the costs of converting a home for HD, which explain why costs of home HD were lower in this study. Finally, the impact of added transportation and allowances costs on the ICER were investigated. 3) Short daily home dialysis seems to deteriorate the cost-effectiveness ratio but such result was not taking into account in the conclusion. 4) Once patients were transplanted or were transferred to continuous peritoneal ambulatory dialysis, further costs or benefits incurred by these states would have been included in the analysis. 5) The univariate sensitivity analysis was not performed on all uncertain parameters. A probabilistic sensitivity analysis on all uncertain parameters should be performed. 6) Even if the choice of alternative was justified, they did not compare all existing modalities. 7) They should choose a lifelong timeframe instead of 10 years.

184 Chronic Dialysis in Belgium KCE Reports 124
Quality assessment checklists economic evaluations
Study design Gonzalez 22 Hooi
101 Kirby
13 McFarlane
2003 25 McFarlane
2006 26 Sennfält 28
Teerawat-tananon 29
Mowatt 9
The research question is stated Yes Yes Yes Yes Yes Yes Yes Yes The economic importance of the research question is stated Yes No Yes Yes Yes Yes Yes Yes The viewpoints of the analysis are clearly stated and justified No Not justified No No Yes Yes Yes Yes The rationale for choosing the alternative programmes or interventions compared is stated Yes No Yes No Yes Yes Yes Yes The alternatives being compared are clearly described Partially No No Partially No No Partially Partially The form of economic evaluation used is stated Yes Yes Yes Yes Yes Yes Yes Yes The choice of form of economic evaluation is justified in relation to the questions addressed Yes Partially Partially Yes Yes Yes Yes Yes

KCE Report 124 Chronic Dialysis in Belgium 185
Data collection Gonzalez 22 Hooi 101 Kirby
13 McFarlane
2003 25 McFarlane
2006 26 Sennfält 28
Teerawat-tananon 29
Mowatt 9
The sources of effectiveness estimates used are stated Yes Yes Yes Yes Yes Yes Yes Yes Details of the design and results of effectiveness study are given (if based on a single study) NA Yes NA Yes NA Yes NA NA Details of the method of synthesis or meta-analysis of estimates are given (if based on an overview of a number of effectiveness studies)
Not detailed but sources were given NA No NA No NA Partially Yes
The primary outcome measure(s) for the economic evaluation are clearly stated Yes Yes Yes Yes Yes Yes Yes Yes Methods to value health states and other benefits are stated Yes Yes Yes Yes No Yes Yes Yes Details of the subjects from whom evaluations were obtained are given No Yes No Yes Yes Yes No No Productivity changes (if included) are reported separately NA NA NA NA NA Yes No Yes The relevance of productivity changes to the study question is discussed No No No No Yes No No Yes Quantities of resources are reported separately from their unit costs
Sources were given
Not reported
Not reported No No
Not reported No Yes
Methods for the estimation of quantities and unit costs are described Partially Yes Yes
No (sources given) No Partially No Yes
Currency and price data are recorded Yes Yes Yes Yes Yes Yes Yes Yes Details of currency or price adjustments for inflation or currency conversion are given Yes Yes Yes Yes Yes Yes Yes Yes Details of any model used are given Yes NA Yes NA Yes Yes Yes Yes The choice of model used and the key parameters on which it is based are justified Partially NA Partially NA Partially Partially No Partially

186 Chronic Dialysis in Belgium KCE Reports 124
Analysis and interpretation of results
Gonzalez 22 Hooi
101 Kirby
13 McFarlane
2003 25 McFarlane
2006 26 Sennfält 28 Teerawat-tananon 29 Mowatt 9
Time horizon of costs and benefits is stated Yes Not clearly Not clearly Not clearly Yes Yes Yes Yes The discount rate(s) is stated Yes Yes Yes NA Yes Yes Yes Yes The choice of rate(s) is justified Yes No No NA No Yes Yes Yes An explanation is given if costs or benefits are not discounted NA NA NA NA NA NA NA NA Details of statistical tests and confidence intervals are given for stochastic data NA No NA Yes NA NA NA NA The approach to sensitivity analysis is given Yes Yes Yes NA Yes Yes Yes Yes The choice of variables for sensitivity analysis is justified No No Yes NA Yes No Yes Partially The ranges over which the variables are varied are stated Yes
Not for all variables Yes NA Yes
Not for all variables Partially Yes
Relevant alternatives are compared No No No No No No No No Incremental analysis is reported Yes No Yes Yes Yes No Yes Yes Major outcomes are presented in a disaggregated as well as aggregated form Yes No No Yes Yes Yes No Yes The answer to the study question is given Yes Partially Yes Yes Yes Partially Yes Yes Conclusion follow from the data reported Partially Yes Partially Yes Yes Yes Yes Partially Conclusions are accompanied by the appropriate caveats Yes No Yes Yes Yes No Yes Yes
Primary economic evaluations
CUA CEA HD comparisons Gonzalez 22 Mowatt 9 McFarlane
2003 25 McFarlane 2006 26
/ PD versus HD Sennfält 28 Teerawattananon 29 Hooi 101 Kirby {Kirby, 2001 #177}

KCE Report 124 Chronic Dialysis in Belgium 187
APPENDIX TO CHAPTER 4 SELECTION OF DATA
Relevant dialysis procedure data were extracted from the IMA data retrieval XS2CI111 of invoiced healthcare expenses (CHDI.Dm_soins_sante_pharmanet_v) for years 2002 and 2003- 2006 for all patients with the following RIZIV procedure codes:
Code Procedure Type 761272 HDH (Haemodialysis hospital) 1 (HDH) 761283 HDH (Haemodialysis hospital) 1 (HDH) 470470 HDH (Haemodialysis hospital) 1 (HDH) 470481 HDH (Haemodialysis hospital) 1 (HDH) 761515 HDS (Haemodialysis satellite) 2 (HDS) 761526 HDS (Haemodialysis satellite) 2 (HDS) 761456 HDD (Haemodialysis domicile) 3 (HDD) 761493 HDD (Haemodialysis domicile) 3 (HDD) 470374 DP (Peritoneal Dialysis) 4 (DP) 470385 DP (Peritoneal Dialysis) 4 (DP) 761471 DP (Peritoneal Dialysis) 4 (DP) 761530 DP (Peritoneal Dialysis) 4 (DP) 761552 DP (Peritoneal Dialysis) 4 (DP) 761574 DP (Peritoneal Dialysis) 4 (DP) 761655 DP (Peritoneal Dialysis) 4 (DP) 761670 DP (Peritoneal Dialysis) 4 (DP) 318010 TP (Transplantation) 9 (TP) 318021 TP (Transplantation) 9 (TP)
DATA PROCESSING STUDY POPULATION.
Cleanup corrected invoice data.
Observations containing corrected invoice data were deleted in case of negative and matching positive invoice amounts by date and based on number of cases, number of days, RIZIV reimbursement, franchise and supplement.
Week numbers.
SAS week number function numbers were used to allocate unique week numbers for the study period 2002-2006. 2002: (SAS week number –54 to -1) 2003: (SAS week number 1 to 52) 2004: (SAS week number 53 to 106) 2005: (SAS week number 107 to 158) 2006: (SAS week number 159 to 211)
Procedures performed on 01 January 2005 and between 02 – 08 January were allocated week number 107 to ensure continuity in weekly dialysis data.
Population variables.
All population data for patients selected were extracted from the IMA DMPOPU(YY).Dm_POPULATION_V datasets for years 2002 and 2003- 2006.
Birth year, gender, national institute of statistics code, major and minor risk insurance codes, anonymized beneficiary and titular numbers, year and month of death were derived from the last known value in successive 6-month snapshots of the source population.

188 Chronic Dialysis in Belgium KCE Reports 124
Inclusion criteria.
Patients were included in the analysis if they had at least one continuous 7 week dialysis treatment during the study period consisting of the following combination of dialysis procedure types: Dialysis type RIZIV code Number of procedures during 7 weeks HDH 761272 18 HDH 761283 18 HDH 470470 18 HDH 470481 18 HDS 761515 18 HDS 761526 18 HDD 761456 18 HDD 761493 18 DP 470374 42 DP 470385 42 DP 761471 6 DP 761530 6 DP 761552 6 DP 761574 42 DP 761655 42 DP 761670 42
Different dialysis procedures codes were aggregated into the corresponding dialysis type for the benefit of the inclusion criteria evaluations:
1. In a First step, a patient was considered evaluable if the specified number of procedures above where performed during the first 7 weeks after dialysis start.
2. A second step detected continuous 7 week dialysis treatment during ongoing treatment.
3. The results of both methods were combined into an overall inclusion flag per patient. Patients without any evaluable dialysis period were flagged as excluded. Any included patients were excluded from further analysis if the patient was younger than 18 during a given analysis year or if they had a renal transplant prior to dialysis treatment.
Proportion of dialysis and group allocation.
Dialysis group allocation was based on the weekly proportion of dialysis types during the study period. For weeks with a combination of dialysis types, a corresponding occurrence week fraction was allocated to each type. Any weeks without dialysis data were excluded from proportion calculation. Excluded patients were allocated to group 0. Group definition: Group 0: Excluded patients Group 1: At least 80% of HDH during dialysis treatment Group 2: At least 80% of HDS during dialysis treatment Group 3: At least 80% of HDD during dialysis treatment Group 4: At least 80% of DP during dialysis treatment Group 5: At least 80% of HDH/HDS during dialysis treatment Group 6: At least 80% of DP+HDH during dialysis treatment Group 7: At least 80% of DP+HDS during dialysis treatment Group 8: All other proportional combinations.

KCE Report 124 Chronic Dialysis in Belgium 189
DATA PROCESSING EXPENSES.
Health care expenses
All healthcare expenses for included patients were extracted from the IMA data retrieval XS2CI111 of invoiced healthcare expenses (CHDI.Dm_soins_sante_pharmanet_v) for years 2002 and 2003- 2006.
Ambulatory pharmaceutical expenses
All ambulatory pharmaceutical expenses for included patients were extracted from the IMA data retrieval XF2CI111 (CHDIv1.Dm_soins_sante_pharmanet_v) for years 2002 and 2003- 2006.
Observations for both expense types containing corrected invoice data were deleted in case of negative and matching positive invoice amounts by date and based on number of cases, number of days, RIZIV reimbursement, franchise and supplement.
Negative franchise invoice amounts pertaining to a data correction were set to ‘0’ if a corresponding correction was present for the RIZIV reimbursement on the same date. If no corresponding RIZIV correction matched by date and procedure code was found, the negative values were retained.
Based on the date of procedure or dispense a corresponding SAS week number was allocated according to the same criteria as for the dialysis procedural dates.
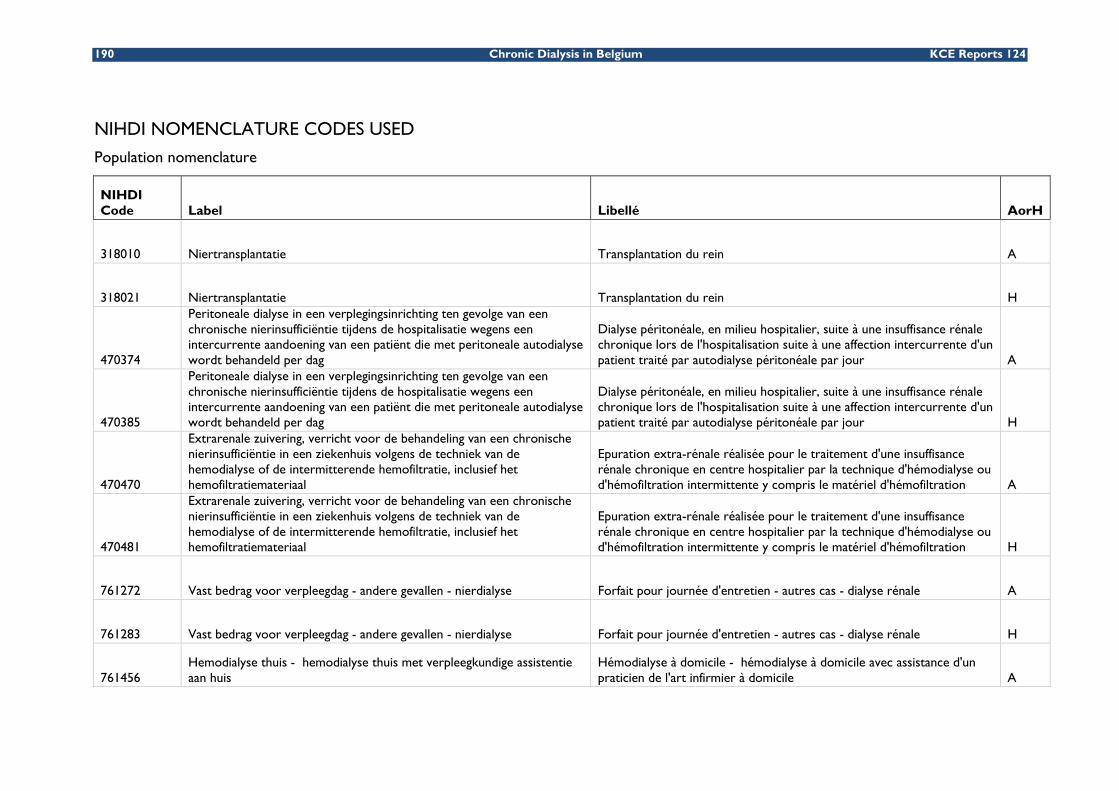
190 Chronic Dialysis in Belgium KCE Reports 124
NIHDI NOMENCLATURE CODES USED
Population nomenclature
NIHDI Code Label Libellé AorH
318010 Niertransplantatie Transplantation du rein A
318021 Niertransplantatie Transplantation du rein H
470374
Peritoneale dialyse in een verplegingsinrichting ten gevolge van een chronische nierinsufficiëntie tijdens de hospitalisatie wegens een intercurrente aandoening van een patiënt die met peritoneale autodialyse wordt behandeld per dag
Dialyse péritonéale, en milieu hospitalier, suite à une insuffisance rénale chronique lors de l'hospitalisation suite à une affection intercurrente d'un patient traité par autodialyse péritonéale par jour A
470385
Peritoneale dialyse in een verplegingsinrichting ten gevolge van een chronische nierinsufficiëntie tijdens de hospitalisatie wegens een intercurrente aandoening van een patiënt die met peritoneale autodialyse wordt behandeld per dag
Dialyse péritonéale, en milieu hospitalier, suite à une insuffisance rénale chronique lors de l'hospitalisation suite à une affection intercurrente d'un patient traité par autodialyse péritonéale par jour H
470470
Extrarenale zuivering, verricht voor de behandeling van een chronische nierinsufficiëntie in een ziekenhuis volgens de techniek van de hemodialyse of de intermitterende hemofiltratie, inclusief het hemofiltratiemateriaal
Epuration extra-rénale réalisée pour le traitement d'une insuffisance rénale chronique en centre hospitalier par la technique d'hémodialyse ou d'hémofiltration intermittente y compris le matériel d'hémofiltration A
470481
Extrarenale zuivering, verricht voor de behandeling van een chronische nierinsufficiëntie in een ziekenhuis volgens de techniek van de hemodialyse of de intermitterende hemofiltratie, inclusief het hemofiltratiemateriaal
Epuration extra-rénale réalisée pour le traitement d'une insuffisance rénale chronique en centre hospitalier par la technique d'hémodialyse ou d'hémofiltration intermittente y compris le matériel d'hémofiltration H
761272 Vast bedrag voor verpleegdag - andere gevallen - nierdialyse Forfait pour journée d'entretien - autres cas - dialyse rénale A
761283 Vast bedrag voor verpleegdag - andere gevallen - nierdialyse Forfait pour journée d'entretien - autres cas - dialyse rénale H
761456 Hemodialyse thuis - hemodialyse thuis met verpleegkundige assistentie aan huis
Hémodialyse à domicile - hémodialyse à domicile avec assistance d'un praticien de l'art infirmier à domicile A
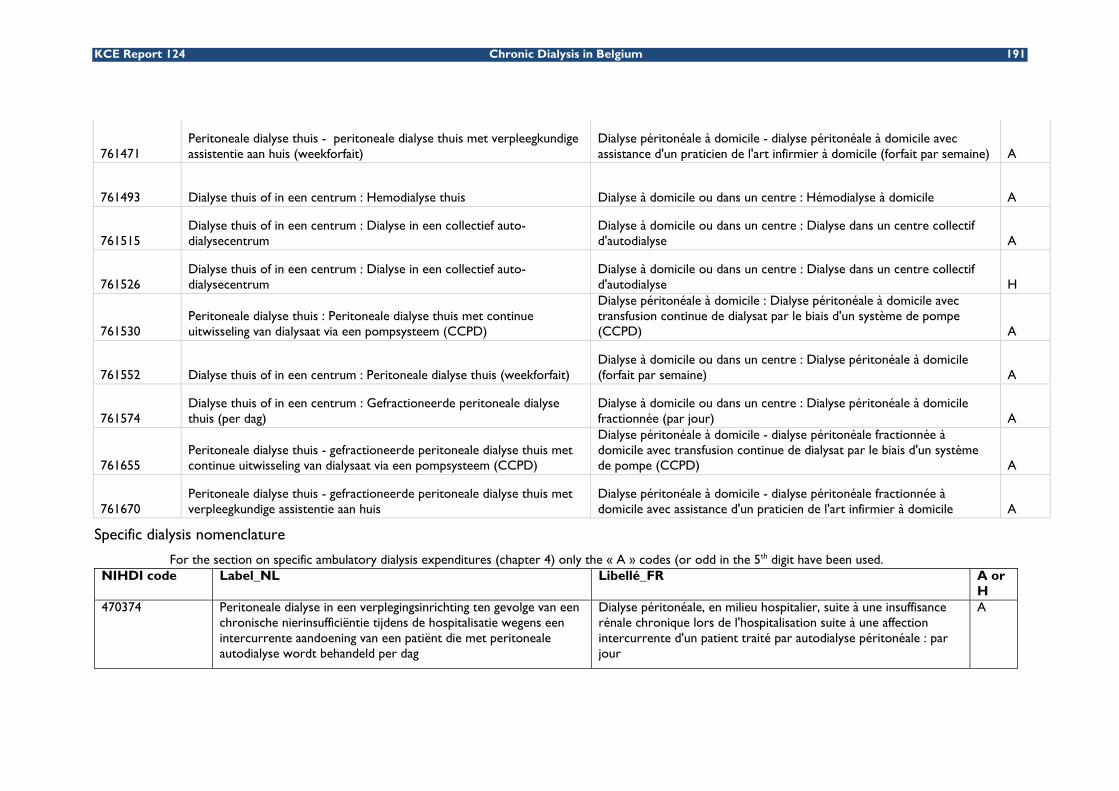
KCE Report 124 Chronic Dialysis in Belgium 191
761471 Peritoneale dialyse thuis - peritoneale dialyse thuis met verpleegkundige assistentie aan huis (weekforfait)
Dialyse péritonéale à domicile - dialyse péritonéale à domicile avec assistance d'un praticien de l'art infirmier à domicile (forfait par semaine) A
761493 Dialyse thuis of in een centrum : Hemodialyse thuis Dialyse à domicile ou dans un centre : Hémodialyse à domicile A
761515 Dialyse thuis of in een centrum : Dialyse in een collectief auto-dialysecentrum
Dialyse à domicile ou dans un centre : Dialyse dans un centre collectif d'autodialyse A
761526 Dialyse thuis of in een centrum : Dialyse in een collectief auto-dialysecentrum
Dialyse à domicile ou dans un centre : Dialyse dans un centre collectif d'autodialyse H
761530 Peritoneale dialyse thuis : Peritoneale dialyse thuis met continue uitwisseling van dialysaat via een pompsysteem (CCPD)
Dialyse péritonéale à domicile : Dialyse péritonéale à domicile avec transfusion continue de dialysat par le biais d'un système de pompe (CCPD) A
761552 Dialyse thuis of in een centrum : Peritoneale dialyse thuis (weekforfait) Dialyse à domicile ou dans un centre : Dialyse péritonéale à domicile (forfait par semaine) A
761574 Dialyse thuis of in een centrum : Gefractioneerde peritoneale dialyse thuis (per dag)
Dialyse à domicile ou dans un centre : Dialyse péritonéale à domicile fractionnée (par jour) A
761655 Peritoneale dialyse thuis - gefractioneerde peritoneale dialyse thuis met continue uitwisseling van dialysaat via een pompsysteem (CCPD)
Dialyse péritonéale à domicile - dialyse péritonéale fractionnée à domicile avec transfusion continue de dialysat par le biais d'un système de pompe (CCPD) A
761670 Peritoneale dialyse thuis - gefractioneerde peritoneale dialyse thuis met verpleegkundige assistentie aan huis
Dialyse péritonéale à domicile - dialyse péritonéale fractionnée à domicile avec assistance d'un praticien de l'art infirmier à domicile A
Specific dialysis nomenclature
For the section on specific ambulatory dialysis expenditures (chapter 4) only the « A » codes (or odd in the 5th digit have been used. NIHDI code Label_NL Libellé_FR A or
H 470374 Peritoneale dialyse in een verplegingsinrichting ten gevolge van een
chronische nierinsufficiëntie tijdens de hospitalisatie wegens een intercurrente aandoening van een patiënt die met peritoneale autodialyse wordt behandeld per dag
Dialyse péritonéale, en milieu hospitalier, suite à une insuffisance rénale chronique lors de l'hospitalisation suite à une affection intercurrente d'un patient traité par autodialyse péritonéale : par jour
A

192 Chronic Dialysis in Belgium KCE Reports 124
470385 Peritoneale dialyse in een verplegingsinrichting ten gevolge van een chronische nierinsufficiëntie tijdens de hospitalisatie wegens een intercurrente aandoening van een patiënt die met peritoneale autodialyse wordt behandeld per dag
Dialyse péritonéale, en milieu hospitalier, suite à une insuffisance rénale chronique lors de l'hospitalisation suite à une affection intercurrente d'un patient traité par autodialyse péritonéale : par jour
H
470400 Installatie van en toezicht op een peritoneale dialyse, inclusief het plaatsen van de catheters, met uitsluiting van de peritoneale dialyses verricht voor de behandeling van chronische nierinsufficiëntie tijdens de opleiding van een patiënt voor chronische autodialyse of tijdens de opneming in een ziekenhuis van een patiënt die wordt behandeld met peritoneale dialyse thuis : de eerste dag
Installation et surveillance d'une dialyse péritonéale, y compris la mise en place des cathéters, à l'exclusion des dialyses péritonéales réalisées pour le traitement de l'insuffisance rénale chronique au cours de la formation d'un patient à l'autodialyse chronique ou lors de l'hospitalisation d'un patient traité par dialyse péritonéale à domicile : le 1er jour
H
470422 Installatie van en toezicht op een peritoneale dialyse, inclusief het plaatsen van de catheters, met uitsluiting van de peritoneale dialyses verricht voor de behandeling van chronische nierinsufficiëntie tijdens de opleiding van een patiënt voor chronische autodialyse of tijdens de opneming in een ziekenhuis van een patiënt die wordt behandeld met peritoneale dialyse thuis : de volgende dagen, per dag, maximum 6 weken.
Installation et surveillance d'une dialyse péritonéale, y compris la mise en place des cathéters, à l'exclusion des dialyses péritonéales réalisées pour le traitement de l'insuffisance rénale chronique au cours de la formation d'un patient à l'autodialyse chronique ou lors de l'hospitalisation d'un patient traité par dialyse péritonéale à domicile : les jours suivants, par jour, un maximum de 6 semaines.
H
470433 Peritoneale dialyse in een verplegingsinrichting tijdens de opleiding van een patiënt voor chronische autodialyse langs peritoneale weg (gedurende maximum drie opeenvolgende weken) : per dag
Dialyse péritonéale, en milieu hospitalier, au cours de la formation d'un patient à l'autodialyse chronique par voie péritonéale (pendant un maximum de trois semaines consécutives) : par jour
A
470444 Peritoneale dialyse in een verplegingsinrichting tijdens de opleiding van een patiënt voor chronische autodialyse langs peritoneale weg (gedurende maximum drie opeenvolgende weken) : per dag
Dialyse péritonéale, en milieu hospitalier, au cours de la formation d'un patient à l'autodialyse chronique par voie péritonéale (pendant un maximum de trois semaines consécutives) : par jour
H
470470 Extrarenale zuivering, verricht voor de behandeling van een chronische nierinsufficiëntie in een ziekenhuis volgens de techniek van de hemodialyse of de intermitterende hemofiltratie inclusief het hemofiltratiemateriaal
Epuration extra-rénale réalisée pour le traitement d'une insuffisance rénale chronique en centre hospitalier par la technique d'hémodialyse ou d'hémofiltration intermittente y compris le matériel d'homofiltration
A

KCE Report 124 Chronic Dialysis in Belgium 193
470481 Extrarenale zuivering, verricht voor de behandeling van een chronische nierinsufficiëntie in een ziekenhuis volgens de techniek van de hemodialyse of de intermitterende hemofiltratie inclusief het hemofiltratiemateriaal
Epuration extra-rénale réalisée pour le traitement d'une insuffisance rénale chronique en centre hospitalier par la technique d'hémodialyse ou d'hémofiltration intermittente y compris le matériel d'homofiltration
H
761272 Forfaitaire verpleegdag nierdialyse Forfait pour journée d'entretien dialyse rénale A 761283 Forfaitaire verpleegdag nierdialyse Forfait pour journée d'entretien dialyse rénale H 761456 Hemodialyse thuis - hemodialyse thuis met verpleegkundige
assistentie aan huis Hémodialyse à domicile - hémodialyse à domicile avec assistance d'un praticien de l'art infirmier à domicile
A
761471 Peritoneale dialyse thuis - peritoneale dialyse thuis met verpleegkundige assistentie aan huis (weekforfait)
Dialyse péritonéale à domicile - dialyse péritonéale à domicile avec assistance d'un praticien de l'art infirmier à domicile (forfait par semaine)
A
761493 Dialyse thuis of in een centrum : Hemodialyse thuis Dialyse à domicile ou dans un centre : Hémodialyse à domicile A 761515 Dialyse thuis of in een centrum : Dialyse in een collectief auto-
dialysecentrum Dialyse à domicile ou dans un centre : Dialyse dans un centre collectif d'autodialyse
A
761526 Dialyse thuis of in een centrum : Dialyse in een collectief auto-dialysecentrum
Dialyse à domicile ou dans un centre : Dialyse dans un centre collectif d'autodialyse
H
761530 Peritoneale dialyse thuis : Peritoneale dialyse thuis met continue uitwisseling van dialysaat via een pompsysteem (CCPD)
Dialyse péritonéale à domicile : Dialyse péritonéale à domicile avec transfusion continue de dialysat par le biais d'un système de pompe (CCPD)
A
761552 Dialyse thuis of in een centrum : Peritoneale dialyse thuis (weekforfait)
Dialyse à domicile ou dans un centre : Dialyse péritonéale à domicile (forfait par semaine)
A
761574 Dialyse thuis of in een centrum : Gefractioneerde peritoneale dialyse thuis (per dag)
Dialyse à domicile ou dans un centre : Dialyse péritonéale à domicile fractionnée (par jour)
A
761596 Dialyse thuis of in een centrum, reiskosten dialyse Dialyse à domicile ou dans un centre, frais de déplacement dialyse A
761655 Peritoneale dialyse thuis - gefractioneerde peritoneale dialyse thuis met continue uitwisseling van dialysaat via een pompsysteem (CCPD)
Dialyse péritonéale à domicile - dialyse péritonéale fractionnée à domicile avec transfusion continue de dialysat par le biais d'un système de pompe (CCPD)
A
761670 Peritoneale dialyse thuis - gefractioneerde peritoneale dialyse thuis met verpleegkundige assistentie aan huis
Dialyse péritonéale à domicile - dialyse péritonéale fractionnée à domicile avec assistance d'un praticien de l'art infirmier à domicile
A

194 Chronic Dialysis in Belgium KCE Reports 124
Hospital stays
*Dialyses; RIZIV code = (470374,470385,470433,470444,470470,470481)
*MaxiForfait; RIZIV code = (761235,761246)
*MiniForfait; RIZIV code = (761213)
*Forfait A; RIZIV code = (761132,761143)
*Forfait B; RIZIV code = (761154,761165)
*Forfait C; RIZIV code = (761176,761180)
*Forfait D; RIZIV code = (761191,761202)
*Other procedures; (112011≤RIZIV code≤149623 or 301011≤RIZIV code≤309164 or 371011≤RIZIV code≤379164 or 350033≤RIZIV code≤355961 or 200012≤RIZIV code≤203420 or 211013≤RIZIV code≤214922 or 220091≤RIZIV code≤300425 or 310516≤RIZIV code≤318920 or 431012≤RIZIV code≤432762 or 215014≤RIZIV code≤216086 or 219951≤RIZIV code≤219984 or 450015≤RIZIV code≤469943 or 433016≤RIZIV code≤444603 or 449912≤RIZIV code≤449923 or 470013≤RIZIV code≤470373 or 470386≤RIZIV code≤470432 or 470445≤RIZIV code≤470469 or 470482≤RIZIV code≤470540 or 531016≤RIZIV code≤532766 or 558390≤RIZIV code≤558994 or 540013≤RIZIV code≤556544 or 559016≤RIZIV code≤559661 or 559812≤RIZIV code≤559860 or 592270≤RIZIV code≤593176 or 591091≤RIZIV code≤591603 or 590100≤RIZIV code≤590995 or 596024≤RIZIV code≤599804 or 590015≤RIZIV code≤590052 or 599513≤RIZIV code≤599966 or 588011≤RIZIV code≤588921 or 589013≤RIZIV code≤589923 or RIZIV code = (592001)
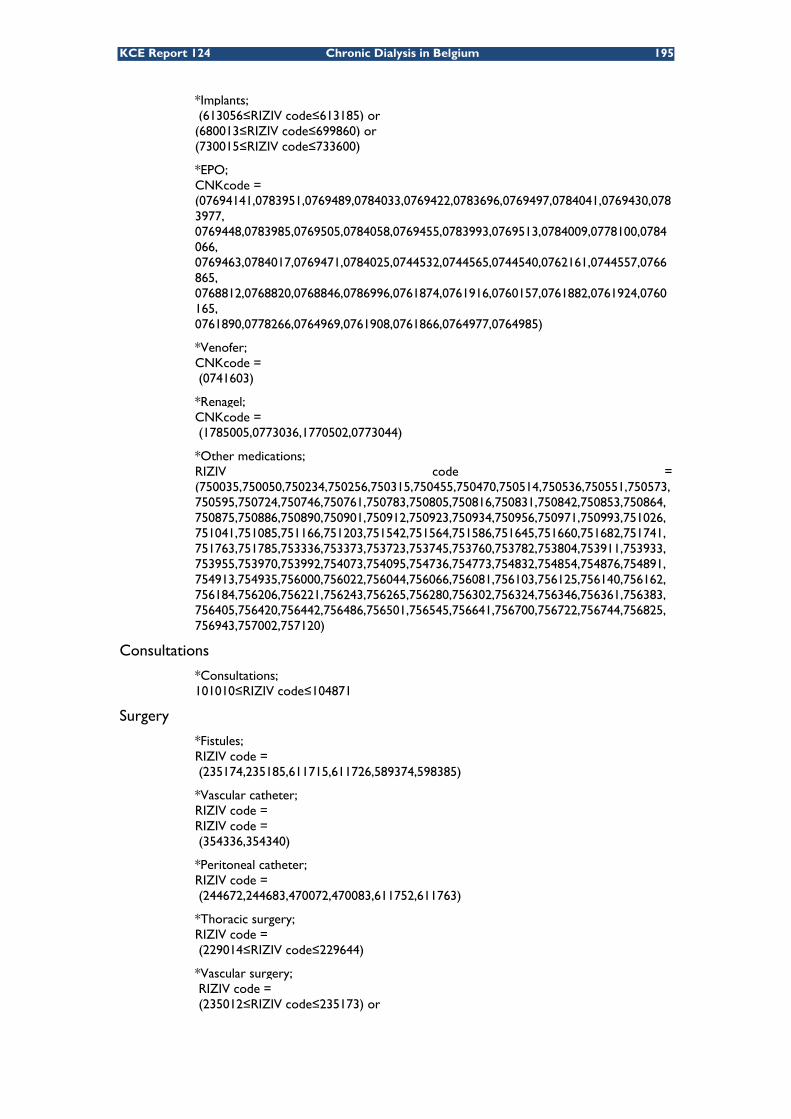
KCE Report 124 Chronic Dialysis in Belgium 195
*Implants; (613056≤RIZIV code≤613185) or (680013≤RIZIV code≤699860) or (730015≤RIZIV code≤733600)
*EPO; CNKcode = (07694141,0783951,0769489,0784033,0769422,0783696,0769497,0784041,0769430,0783977, 0769448,0783985,0769505,0784058,0769455,0783993,0769513,0784009,0778100,0784066, 0769463,0784017,0769471,0784025,0744532,0744565,0744540,0762161,0744557,0766865, 0768812,0768820,0768846,0786996,0761874,0761916,0760157,0761882,0761924,0760165, 0761890,0778266,0764969,0761908,0761866,0764977,0764985)
*Venofer; CNKcode = (0741603)
*Renagel; CNKcode = (1785005,0773036,1770502,0773044)
*Other medications; RIZIV code = (750035,750050,750234,750256,750315,750455,750470,750514,750536,750551,750573,750595,750724,750746,750761,750783,750805,750816,750831,750842,750853,750864,750875,750886,750890,750901,750912,750923,750934,750956,750971,750993,751026,751041,751085,751166,751203,751542,751564,751586,751645,751660,751682,751741,751763,751785,753336,753373,753723,753745,753760,753782,753804,753911,753933,753955,753970,753992,754073,754095,754736,754773,754832,754854,754876,754891,754913,754935,756000,756022,756044,756066,756081,756103,756125,756140,756162,756184,756206,756221,756243,756265,756280,756302,756324,756346,756361,756383,756405,756420,756442,756486,756501,756545,756641,756700,756722,756744,756825,756943,757002,757120)
Consultations
*Consultations; 101010≤RIZIV code≤104871
Surgery
*Fistules; RIZIV code = (235174,235185,611715,611726,589374,598385)
*Vascular catheter; RIZIV code = RIZIV code = (354336,354340)
*Peritoneal catheter; RIZIV code = (244672,244683,470072,470083,611752,611763)
*Thoracic surgery; RIZIV code = (229014≤RIZIV code≤229644)
*Vascular surgery; RIZIV code = (235012≤RIZIV code≤235173) or

196 Chronic Dialysis in Belgium KCE Reports 124
*Other surgery; (235186≤RIZIV code≤238253) or (238266≤RIZIV code≤239341) ((220091≤RIZIV code≤228200) or (230230≤RIZIV code≤432762)) and RIZIV code not in (235174,235185,611715,611726,589374,598385,354336,354340, 244672,244683,470072,470083,611752,611763) and not (229014≤RIZIV code≤229644) and not (235012≤RIZIV code≤235173) and not (235186≤RIZIV code≤238253) and not (238266≤RIZIV code≤239341)
Cardiology
*Echography; RIZIV code = (460456,460460,460574,460585,461230,461241,461252,461263,469652, 469663,469674,469685,469814,469825,469836,469840,469873,469884)
*Diagnostic coronarography; RIZIV code = (453110,453121,453132,453143,464111,464122,464133,464144)
*Intervention coronarography; RIZIV code = (589153,589164,589175,589186,589455,589466,689776,689780)
*Other Cardiology; RIZIV code = (475016,475020,475075,475086,475090,475532,475543,475650,475661) or (475812≤RIZIV code≤476081) or (476195≤RIZIV code≤476346) or (476615≤RIZIV code≤476663) or RIZIV code in (476114,476125,476136,476140)
Clinical Biology
*Blood analyses; (540013≤RIZIV code≤542780)
*Microbiology; (549010≤RIZIV code≤550981)
*Other clinical biology; (543012≤RIZIV code≤548726)or (551014≤RIZIV code≤559661)
Ambulatory medication
*EPO; CNK code = (07694141,0783951,0769489,0784033,0769422,0783696,0769497,0784041,0769430,0783977,0769448,0783985,0769505,0784058,0769455,0783993,0769513,0784009,0778100,0784066,0769463,0784017,0769471,0784025,0744532,0744565,0744540,0762161,0744557,0766865,0768812,0768820,0768846,0786996,0761874,0761916,0760157,0761882,0761924,0760165,0761890,0778266,0764969,0761908,0761866,0764977,0764985)
*Rénegel; CNK code = (0741603)
*Venofer; CNK code = (1785005,0773036,1770502,0773044)
*Forfait; RIZIV code = (756000)

KCE Report 124 Chronic Dialysis in Belgium 197
*Class A; RIZIV code = (750514,750514,750315)
*Class Magistral; RIZIV code = (750234,750256,750271,750293)
*Class B; RIZIV code = (750470,750536)
*Class C; RIZIV code = (750551,750455,754095,754736)
*Class Cs; RIZIV code = (750573)
*Class Cx; RIZIV code = (750595)
*Exception for independents, tritherapy, emergency; RIZIV code = (754913,754876,754854,754935,754891,754832,754073,754412)
SURVIVAL ANALYSIS
Overall survival

198 Chronic Dialysis in Belgium KCE Reports 124
Survival by gender
Survival by age category

KCE Report 124 Chronic Dialysis in Belgium 199
Survival by age and gender
Survival by group
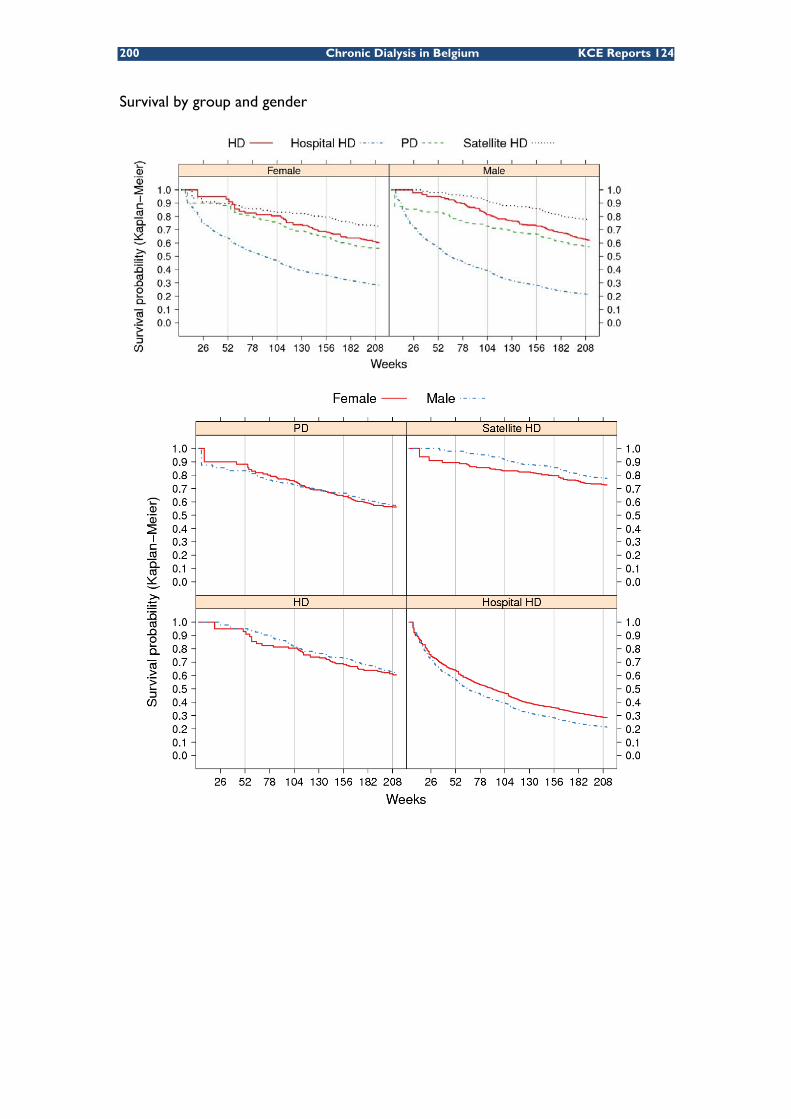
200 Chronic Dialysis in Belgium KCE Reports 124
Survival by group and gender

KCE Report 124 Chronic Dialysis in Belgium 201
Survival by group and age category

202 Chronic Dialysis in Belgium KCE Reports 124
Survival by group, age and gender

KCE Report 124 Chronic Dialysis in Belgium 203
APPENDIX TO CHAPTER 5 DIALYSIS COST SURVEY
The survey was provided to all dialysis centres in a print-friendly Microsoft Excell format. Each Excell sheet is presented here on a separate page, the title of the pages being the names of the respective Excell sheets.
204 Chronic Dialysis in Belgium KCE Reports 124
START - INFORMATION
PRIOR GENERAL INFORMATION
* In this file you find 7 sheets to be completed : Sheet "general questions" contains some general questions related to the dialysis programme in your hospitalSheet "Human Resources" relates to the human resources costs associated with the dialysis programme in your hospital Sheet "Consumables" relates to the costs of consumables associated with the dialysis programme in your hospitalSheet "Equipment" relates to the costs of equipment associated with the dialysis programme in your hospitalSheet "Overhead" relates to the overhead costs associated with hospital or satellite haemodialysisSheet "Other costs" relates to potential other costs associated with the dialysis programme in your hospital that were not yet included in one of the previous sheets.Sheet "Time Medical Staff" contains a questionnaire that should help you to define the figures needed to fill out the table "Medical Staff" in sheet "Human Resources".
* Cells to be filled in are in pink. If you are not able to fill in a pink cell, please comment why it was not possible.
* Data should be drawn from the annual accounts of 2006.
* For the equipment, please give the original purchase price (also if the equipment was not bought in 2006 but in some previous year)
* For consumables and overhead costs, items to be included are detailed to obtain consistent figures accross hospitals. It is not necessary however to give the precise cost for each of the individual items; they may be added up to obtain a total cost figure. If the totals do not include certain items mentioned in the list, please specify which ones were excluded.
Thank you very much for your collaboration.

KCE Report 124 Chronic Dialysis in Belgium 205
GENERAL QUESTIONS YESNO General questionsnot applicable
* Does your hospital have a satellite dialysis centre ?
* Which dialysis modalities does your hospital offer and how many sessions (for haemodialysis) or weeks (for peritoneal dialysis)?Some types of dialysis cannot be charged separately to the RIZIV/INAMI. These cells are made opaque and should not be filled in.
PresenceHigh care Haemodialysis in hospital sessions YesHigh care Haemodialysis in a satellite unit NoLow-care Haemodialysis in hospital sessionsLow-care Haemodialysis in a satellite unit sessions
or Total Low-care Haemodialysis sessions sessionsHome Haemodialysis with nursing support sessionsHome Haemodialysis without nursing support sessionsPeritoneal Dialysis with nursing support weeksPeritoneal Dialysis without nursing support weeksCCPD weeks
* Are medical doctors (nephrologists) in your hospital salaried ?
* Are medical doctors (nephrologists) working in the satellite centre shared with the hospital haemodialysis programme?
* Are nurses working in the satellite centre shared with the hospital haemodialysis programme?
* For high care haemodialysis, it is stipulated that 1 nephrologist is needed per 4000 high-care haemodialysis sessions. According to your experience, how many nephrologists are needed for the required support of low-care haemodialysis:
low-care haemodialysis sessions
According to your experience, how many nephrologists are needed for the required support of peritoneal dialysis patients:
peritoneal dialysis patients
* Is the dialysis equipment in your hospital leased or provided 'for free' from a company providing the dialysate?
Comment:
* Does your accounting system use specific allocation bases for overhead costs, such as m², number of full-time equivalents, other?
* If your answer to the previous question is "Yes", what are the (assumed) overhead costs per unit of the allocation base and for which cost item(s) are they used?(e.g. building space, cleaning, heating, lighting, laundry, mortuary, waste…)
Unit cost in €Allocation base
Overhead cost item(s) allocated using the allocation base
m²FTEkilogrammeals
Number of square meters (m²)of the hospital dialysis unit (excluding satellite unit) m²Number of square meters (m²)of the satellite dialysis unit, if available m²
m²
Number of sessions or weeks
1 nephrologist per
1 nephrologist per
If the number of m² is not separately available for the satellite and hospital dialysis unit, total number of square meters (m²) of the dialysis units

206 Chronic Dialysis in Belgium KCE Reports 124
HUMAN RESOURCES
HUMAN RESOURCES
Please fill out how many full-time equivalents of each personnel category is working for the dialysis programme in your hospital.For each category, estimate the % of total time devoted to the ambulatory dialysis programma and to each dialysis type.
Medical staff
The estimation of the % of total times devoted to the ambulatory dialysis programme and to each dialysis type by medical staff might require a short survey in the medical staff members.In Sheet "Time Medical staff" you will find a template that will help to complete the table.
Medical staff Total number of full-time equivalents of
medical staff involved in the ambulatory
dialysis programme
Total remuneration cost of all medical
staff involved in the dialysis programme
(euros)
Read comment (put cursor on this cell)
Average length of service
(anciënniteit / ancienneté)
Estimated % of total personnel time devoted to the ambulatory
dialysis programme
Estimated % of total personnel time devoted to
other patient care (unrelated to ambulatory
dialysis)
Estimated % of total personnel time devoted to other activities
(education, research,
management)
Estimated % of total personnel time devoted to
low-care haemodialysis
(expressed as a % of total time
devoted to the ambulatory
dialsyis programme)
Estimated % of total personnel time
devoted to high-care haemodialysis in
hospital unit (expressed as a % of total time devoted to
the ambulatory dialsyis programme)
Estimated % of total personnel time devoted
to peritoneal dialysis (expressed as a % of
total time devoted to the ambulatory dialsyis
programme)
Estimated % of total personnel time devoted to home haemodialysis
(expressed as a % of total time devoted to
the ambulatory dialsyis programme)
-. Permanent doctors. Physicians in training. Non-permanent doctors
Nursing, technical and other staff
Please provide the total number of full-time equivalents of nursing, technical, administrative, paramedical and other staff involved in the dialysis programme in your hospital in the first table below.If you can make a distinction between the staff costs for the different types of dialysis (e.g. if different cost places are used for different dialysis types), please provide separate figures for each of the relevant dialysis types (second and following tables).If no separate cost places are used for the different dialysis types, you only need to fill out table 1 but please make sure these figures encompass all ambulatory dialysis activities.
Total number of full-time equivalents of each staff category
involved in the ambulatory dialysis
programme
Total remuneration cost of all staff involved in the
dialysis programme (euros)
Average length of service
(anciënniteit / ancienneté)
% of total personnel time devoted to low-
care dialysis
% of total personnel time
devoted to haemodialysis in
hospital unit
% of total personnel time
devoted to peritoneal dialysis
% of total personnel time
devoted to home haemodialysis
Your comments
Nursing staff. A1 Nurses : graduated
* Nurse in chief* Nurse in chief assistant* Graduated
. Nurses A2 : brevet
. Nurse's aide
. Assistant (logistics…)
. Machine maintenance
. Machine reparation
. Equipment delivery
. Stock management
ParamedicsDieteticianOther (specify)
Medical staff
Technician staff
Administrative staff (secretariat dialysis unit)

KCE Report 124 Chronic Dialysis in Belgium 207
Nursing, technical and other staff for the hospital haemodialysis unit
Total number of full-time equivalents of staff working for the
hospital haemodialysis unit
Total remuneration cost of all staff involved in the
dialysis programme (euros)
Average length of service
(anciënniteit / ancienneté)
Your comments
Nursing staff. A1 Nurses : graduated
* Nurse in chief* Nurse in chief assistant* Graduated
. Nurses A2 : brevet
. Nurse's aide
. Assistant (logistics…)
. Machine maintenance
. Machine reparation
. Equipment delivery
. Stock management
ParamedicsDieteticianOther (specify)
Nursing, technical and other staff for the satellite haemodialysis unit
Total number of full-time equivalents of staff working for the
satellite haemodialysis unit
Total remuneration cost of all staff involved in the
dialysis programme (euros)
Average length of service
(anciënniteit / ancienneté)
Your comments
Nursing staff. A1 Nurses : graduated
* Nurse in chief* Nurse in chief assistant* Graduated
. Nurses A2 : brevet
. Nurse's aide
. Assistant (logistics…)
. Machine maintenance
. Machine reparation
. Equipment delivery
. Stock management
ParamedicsDieteticianOther (specify)
Nursing, technical and other staff for peritoneal dialysis
Total number of full-time equivalents of
staff working for peritoneal dialysis
Total remuneration cost of all staff involved in the
dialysis programme (euros)
Average length of service
(anciënniteit / ancienneté)
Your comments
Nursing staff. A1 Nurses : graduated
* Nurse in chief* Nurse in chief assistant* Graduated
. Nurses A2 : brevet
. Nurse's aide
. Assistant (logistics…)
. Machine maintenance
. Machine reparation
. Equipment delivery
. Stock management
ParamedicsDieteticianOther (specify)
Nursing, technical and other staff for home haemodialysis
Total number of full-time equivalents of staff involved for
home haemodialysis
Total remuneration cost of all staff involved in the
dialysis programme (euros)
Average length of service
(anciënniteit / ancienneté)
Your comments
Nursing staff. A1 Nurses : graduated
* Nurse in chief* Nurse in chief assistant* Graduated
. Nurses A2 : brevet
. Nurse's aide
. Assistant (logistics…)
. Machine maintenance
. Machine reparation
. Equipment delivery
. Stock management
ParamedicsDieteticianOther (specify)
Technician staff
Administrative staff (secretariat dialysis unit)
Technician staff
Administrative staff (secretariat dialysis unit)
Administrative staff (secretariat dialysis unit)
Technician staff
Administrative staff (secretariat dialysis unit)
Technician staff

208 Chronic Dialysis in Belgium KCE Reports 124
CONSUMABLES
Please give the total cost of consumables booked on cost places 560 to 569.In case you can make a distinction between the different types of dialysis (e.g if different cost places are used for different dialysis types), please provide total consumables costs for the relevant dialysis type.
Total costs in 2006 (euros) Your comments
Included Yes/NoTotal costs in 2006 (euros) Your comments
For haemodialysis in hospital Total consumables costincluding:- medication- artificiel kidney- blood lines- bicart- concentrat- heparine- saline solution- needles- connector/deconnector- desinfectant- dustbin- syringes- perfusion sets- other:-----
In case you provide a total cost for all consumables costs, please specify whether the individual consumables listed are included or not in the "included Yes/no" column for each dialysis type.
Total consumables costs
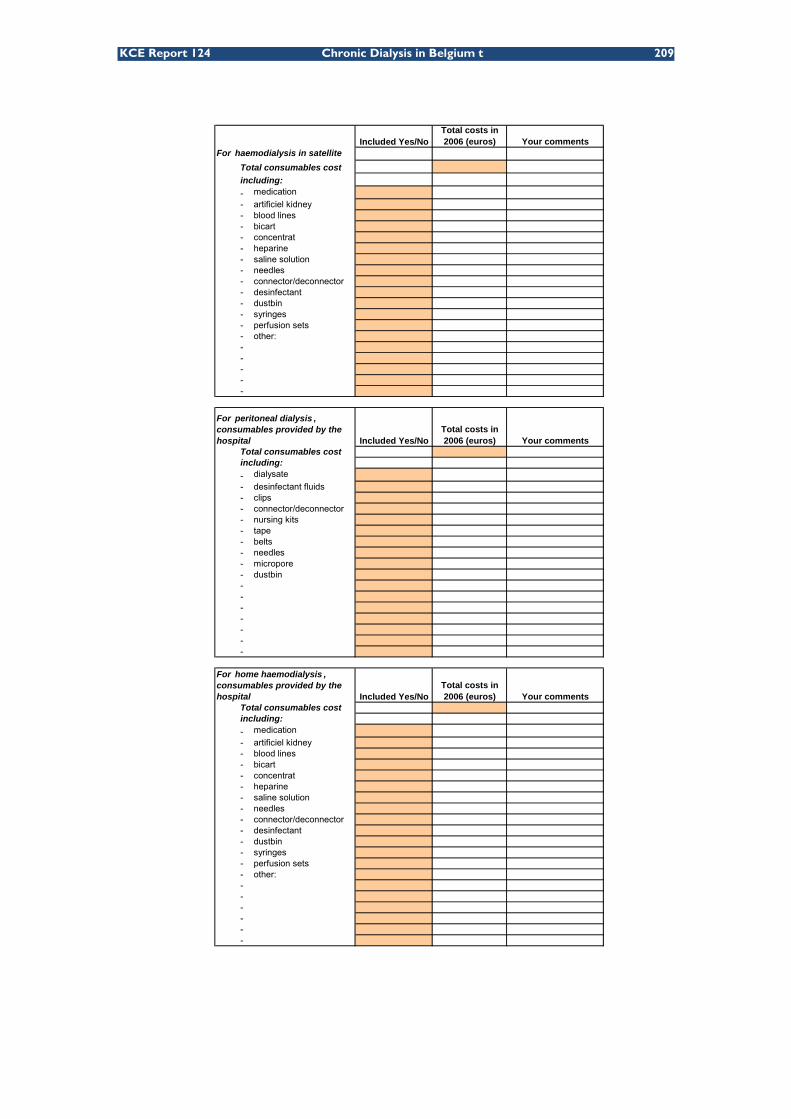
KCE Report 124 Chronic Dialysis in Belgium t 209
Included Yes/NoTotal costs in 2006 (euros) Your comments
For haemodialysis in satelliteTotal consumables costincluding:- medication- artificiel kidney- blood lines- bicart- concentrat- heparine- saline solution- needles- connector/deconnector- desinfectant- dustbin- syringes- perfusion sets- other:-----
Included Yes/NoTotal costs in 2006 (euros) Your comments
Total consumables costincluding:- dialysate- desinfectant fluids- clips- connector/deconnector- nursing kits- tape- belts- needles- micropore- dustbin-------
Included Yes/NoTotal costs in 2006 (euros) Your comments
Total consumables costincluding:- medication- artificiel kidney- blood lines- bicart- concentrat- heparine- saline solution- needles- connector/deconnector- desinfectant- dustbin- syringes- perfusion sets- other:------
For peritoneal dialysis , consumables provided by the hospital
For home haemodialysis , consumables provided by the hospital

210 Chronic Dialysis in Belgium KCE Reports 124
EQUIPMENT EQUIPMENT
Please fill out how many units of the specified equipment were available in your hospital in 2006 for each type of dialysis, their catalogue price per unit, the year of purchase and the estimated number of years of use.
Number of units (including reserves)
Catalogue price per unit (euros)
Year of purchase
Estimated number of
years of useYour comments
- Dialysis equipment. Dialysis machines. Seats. Weighing devices. Tensiometer
- Water purification machine
Number of units (including reserves)
Catalogue price per unit (euros)
Year of purchase
Estimated number of
years of useYour comments
- Dialysis equipment provided by hospital. Dialysis machine (in case of AP). Heating plate. Weighing devices. Tensiometer. serum standard. buckets...
Number of units (including reserves)
Catalogue price per unit (euros)
Year of purchase Estimated
number of years of use Your comments
- Dialysis equipment. Dialysis machines. Seats. Weighing devices. Tensiometer
- Water purification machine...
Equipment haemodialysis in hospital and satellite centre
Equipment peritoneal dialysis provided by the hospital
Equipment home haemodialysis provided by the hospital
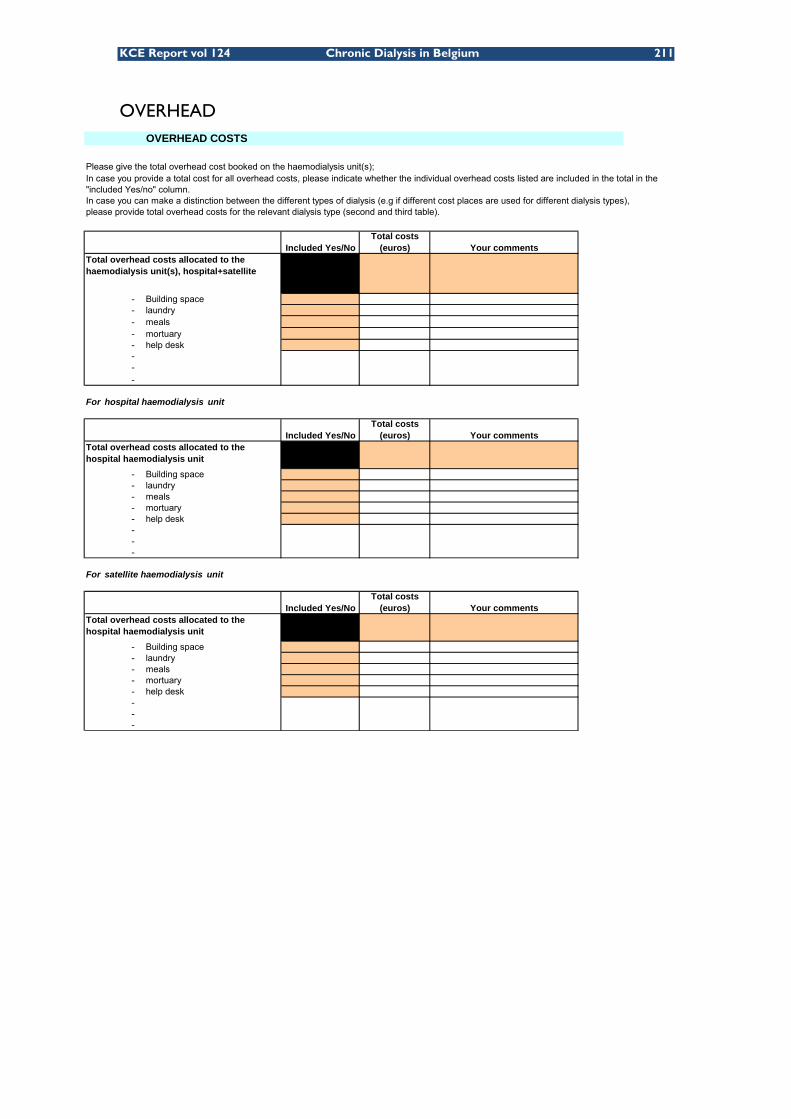
KCE Report vol 124 Chronic Dialysis in Belgium 211
OVERHEAD
OVERHEAD COSTS
Please give the total overhead cost booked on the haemodialysis unit(s);
In case you can make a distinction between the different types of dialysis (e.g if different cost places are used for different dialysis types),
Included Yes/NoTotal costs
(euros) Your comments
- Building space- laundry- meals- mortuary- help desk---
For hospital haemodialysis unit
Included Yes/NoTotal costs
(euros) Your comments
- Building space- laundry- meals- mortuary- help desk---
For satellite haemodialysis unit
Included Yes/NoTotal costs
(euros) Your comments
- Building space- laundry- meals- mortuary- help desk---
Total overhead costs allocated to the haemodialysis unit(s), hospital+satellite
In case you provide a total cost for all overhead costs, please indicate whether the individual overhead costs listed are included in the total in the "included Yes/no" column.
please provide total overhead costs for the relevant dialysis type (second and third table).
Total overhead costs allocated to the hospital haemodialysis unit
Total overhead costs allocated to the hospital haemodialysis unit

212 Chronic Dialysis in Belgium KCE Reports 124
OTHER COSTS
5
OTHER COSTS
Here you can specify other costs that can be attributed to the dialysis that have not yet been included in the previous tables. Please specify the cost item.
Total costs (euros)
--------
Total costs (euros)
--------
Total costs (euros)
--------
Total costs (euros)
--------
Haemodialysis in satellite unit Explanation
Haemodialysis in hospital Explanation
Home Haemodialysis Explanation
Peritoneal dialysis Explanation

KCE Report vol 124 Chronic Dialysis in Belgium 213
RESOURCE ITEMS WITH THEIR ASSUMED DISTRIBUTION USED IN THE COST SIMULATION
UNIT COSTSCost component Resource item Mean s.d. Distribution alpha beta nHuman resources, per year Medical staff 269.490 129.010 Gamma 4,36 61.759,42 8
Nursing staff 54.313 3.437 Gamma 249,75 217,47 6Technical staff 62.106 4.773 Gamma 169,30 366,83 6Administrative staff 49.603 8.527 Gamma 33,84 1.466,00 4Dietician 57.098 15.903 Gamma 12,89 4.429,49 3
Equipment, per year HaemodialysisDialysis machines 3.168,05 736,34 Gamma 18,51 171,14 6Seats 317,37 129,87 Gamma 5,97 53,14 6Weighing devices 631,43 616,56 Mean 3Tensiometer 195,34 264,15 Mean 2Water purification machine 20.519,06 16.048,50 Gamma 1,63 12.552 7Peritoneal dialysis Dialysis machine for AP no data available 0Heating plate 24,08 Mean 1Weighing devices 19,95 17,74 Mean 3Tensiometer 18,15 4,47 Mean 3
Consumables total of "all consumables"Hospital HD, per session 64,14 11,07 Gamma 33,59 1,91 6Satellite HD, per session 56,72 12,58 Gamma 20,33 2,79 7PD, per week 499,77 239,44 Gamma 4,36 114,72 6
Overheads m² 167,47 64,62 Mean 5FTE 10.766,02 3.759,62 Mean 5FTE nurse 1.404,19 309,07 Mean 5meal 19,20 4,16 Mean 2total of "all overheads"Hospital HD, per session 51,73 10,37 Gamma 24,89 2,08 5Satellite HD, per session 58,97 44,41 Gamma 1,76 33,44 4PD, per week 84,83 101,43 Mean 3
Other costs total of "all other costs" Hospital HD, per session 4,85 3,00 Mean 5Satellite HD, per session 2,72 1,61 Mean 4PD, per week 17,00 17,53 Mean 5
VOLUMES HOSPITAL HDCost component Resource item Mean s.d. Distribution alpha beta nHuman resources, per session Medical staff 0,000135 0,000050 Gamma 7,4389 0,00002 6
Nursing staff 0,00200 0,00060 parameter value 6Technical staff 0,00009 0,00004 Mean 5Administrative staff 0,00010 0,00010 Mean 4Dietician 0,00002 0,00000 Mean 3
Equipment Dialysis machines 0,00289 0,00078 Gamma 13,6049 0,0002 7Seats 0,00190 0,00115 Gamma 2,7210 0,0007 7Weighing devices 0,00072 0,00043 Gamma 2,7782 0,0003 5Tensiometer 0,00106 0,00017 Mean 3Water purification machine 0,00023 0,00020 Gamma 1,3202 0,0002 7
Overheads, per session m² 0,10480 0,03138 Gamma 11,1558 0,009394 5FTE 0,00251 0,00059 Gamma 17,7538 0,0001 6FTE nurse 0,002 Parameter valuemeal 1 Parameter value

214 Chronic Dialysis in Belgium KCE Reports 124
VOLUMES SATELLITE HDCost component Resource item Mean s.d. Distribution alpha beta nHuman resources, per session Medical staff 0,00012 0,0000 Gamma 7,8518 0,0000 7
Nursing staff 0,00110 0,00109 parameter value 6Technical staff 0,00009 0,00016 Mean 5Administrative staff 0,00010 0,00018 Mean 4Dietician 0,00002 0,00003 Mean 3
Equipment, per session Dialysis machines 0,00289 0,00078 Gamma 13,6049 0,0002 7Seats 0,00190 0,00115 Gamma 2,7210 0,0007 7Weighing devices 0,00072 0,00043 Gamma 2,7782 0,0003 5Tensiometer 0,00106 0,00017 Mean 3Water purification machine 0,00023 0,00020 Gamma 1,3202 0,0002 7
Overheads m² 0,10480 0,03138 Gamma 11,1558 0,009394 5FTE 0,00198 0,00104 Gamma 3,6512 0,0005 6FTE nurse 0,00110 parameter valuemeal 1 parameter value
VOLUMES PDCost component Resource item Mean s.d. Distribution alpha beta nHuman resources, per week Medical staff
0,00059 0,0003 Gamma 3,0506 0,0002 6Nursing staff 0,00150 0,0019 Parameter value 5Technical staff 0,00000 Parameter value 4Administrative staff 0,00010 0,0001 Mean 3Dietician 0,00002 0,0000 Mean 3
Equipment, per week Dialysis machine for AP 0,01411 0,0081 Mean 3Heating plate 0,02058 0,0103 Mean 3Weighing devices 0,01934 0,0037 Mean 3Tensiometer 0,01080 0,0111 Mean 3
Overheads FTE 0,00344 0,0016 Gamma 4,4325 0,0008 6FTE nurse 0,00150 Parameter value

KCE Report 124 Chronic Dialysis in Belgium 215
APPENDIX TO CHAPTER 7
QUESTIONNAIRE SENT TO REPRESENTATIVES OF THE PATIENT ORGANISATIONS FRENCH VERSION
Bruxelles, jeudi 3 septembre 2009
Sujet: Questionnaire dialyse – point de vue des patients
Chère Madame, Cher Monsieur,
Le présent questionnaire fait partie d'une étude du Centre Fédéral d'Expertise des Soins de Santé (KCE). Au moyen de cette étude, le KCE vise à analyser la situation en matière de dialyse chronique en Belgique. Un volet important de l'étude s'intéresse au point de vue du patient.
L'étude est centrée sur les patients souffrant d'une affection rénale chronique traitée au moyen d'une forme déterminée de dialyse. Tous les modes de dialyse chronique (hémodialyse en milieu hospitalier, hémodialyse dans un centre satellite, hémodialyse à domicile, hémodialyse de nuit et dialyse péritonéale) sont pris en compte. Nous souhaitons mieux connaître la perspective des patients qui viennent d'entamer un traitement par dialyse que de ceux qui s'y soumettent déjà depuis longtemps. En plus, nous sommes intéressés par la perspective des patients qui sont passés d'un mode de dialyse à une autre (par exemple de la dialyse péritonéale à l'hémodialyse).
Vous trouverez ci-dessous une liste de questions que nous souhaiterions vous soumettre.. Ce questionnaire est adressé à tous les membres du Conseil d'Administration de FENIER-BABIR. Ces questions seront examinées par Lors de la réunion du Conseil du 17 septembre 2009, vous aurez l’occasion de discuter ensemble ces questions. Nous vous faisons parvenir dès à présent ce questionnaire afin que vous puissiez préparer cette discussion. Nous vous serions très reconnaissants si vous pouviez communiquer vos réponses sous forme écrite mais de manière anonyme, à l’équipe de recherche du KCE.
Important! Nous vous saurions gré d'y répondre en qualité de représentant des membres de votre association, et non sur la base de votre perception personnelle. Nous vous serions très reconnaissants si vous pouviez contacter vos membres afin d’apporter à nos questions, une réponse la plus nuancée possible
Nous aimerions connaître le point de vue de différents groupes de patients, à savoir:
• Les patients qui viennent d'entamer une dialyse chronique
• Les patients qui se soumettent depuis longtemps à une dialyse
• Les patients jeunes et les patients âgés
• Les patients isolés, les patients vivant en couple, les patients vivant en famille
• Les patients qui ont changé de forme de dialyse et les patients qui n’en ont pas changé

216 Chronic Dialysis in Belgium KCE Reports 124
• …
Lorsque cela s’avère relevant, pouvons-nous vous demander de faire la distinction entre différents groupes de patients , en précisent par exemple "Pour les jeunes patients qui travaillent hors domicile…" ou "Pour les patients isolés qui bénéficient d'une dialyse péritonéale…"
Les informations quant aux divers modes de dialyse
1. Avant d'entamer une dialyse, le patient est-il informé de l'existence de l’existence de divers modes de dialyse?
a. De quelle manière cette information est-elle communiquée: oralement, par dépliant, DVD, contact avec d'autres dialysés, contact avec une association de patients…?
b. Quel est le moyen d'information préféré par les patients et pourquoi?
2. Les patients qui entament une dialyse considèrent-ils comme suffisantes les informations qui leur sont prodiguées quant aux divers modes de dialyse?
3. A posteriori, les patients considèrent-ils les informations relatives au mode de dialyse qu'ils ont choisi comme suffisante et correcte afin dese forger une bonne opinion de leur impact sur leur vie quotidienne?
Le choix du mode de dialyse
4. Avant d'entamer leur dialyse, les patients ont-ils l'occasion de choisir entre divers modes de dialyse?
Dans la négative, leur explique-t-on pourquoi ce choix ne peut leur être offert?
5. Les patients considèrent-ils qu'ils bénéficient d'un délai suffisant pour intégrer ces informations, pour évaluer les avantages et les inconvénients, et ensuite pour faire un choix éclairé?
6. Les patients estiment-ils qu’ils sont suffisamment accompagnés par les professionnels de santé afin d’effectuer un choix en faveur d’une forme de dialyse déterminée ?
7. Quels sont les éléments quidéterminent finalement le choix du patient pour un mode de dialyse déterminé (tels que davantage de flexibilité, plus de certitude que les complications seront prises en charge rapidement, le médecin est le facteur de choix le plus déterminant, …)
- Pour cette réponse, faites si nécessaire la distinction entre les différents groupes de patients (en fonction de l'âge, de l'activité professionnelle, de la situation familiale, etc.)
8. Quelles sont les raisons le plus souvent invoquées par le patient pour justifier un changement de mode de dialyse?
Cette question ne doit être posée qu'aux patients qui ont changé de mode de dialyse.
Les avantages et inconvénients des différent modes de dialyse
9. Quels sont respectivement les avantages et les inconvénients, pour le patient, des divers modes de dialyse (à titre d'exemple, les éléments que nous avons pu observer par nous-mêmes sont notamment la sensation de sécurité grâce à la surveillance, la flexibilité, l'investissement en temps, la mobilité, etc. D’autres facteurs pourraient être : la charge pour la famille, la compétence des soignants, la qualité des soins, le maintien de la vie sociale?
- Dans la réponse, faites la distinction entre les différents groupes de patients (en fonction de l'âge, de l'activité professionnelle, de la situation familiale, etc.)
- Apportez également vos considérations en ce qui concerne les différentes phases et différents évènements qui ont eu lieu au cours de tout le parcours du patient dialysé (par exemple : lors du commencement du traitement, lors de complications ou d’évènements imprévus…)
Veuillez également indiquer les sources sur lesquelles vous vous fondez pour répondre à cette question (telles que témoignages de patients lors d'un forum, contact direct avec des patients

KCE Report 124 Chronic Dialysis in Belgium 217
membres de votre association, etc.) Vous ne devez pas nécessairement fournir une réponse pour chaque mode de dialyse si vous ne disposez pas de sources pour le type de patients en question.
10. Du point de vue des différents groupes de patients, quel est l'ordre d'importance de chacun de ces éléments?
L'encadrement lors de la dialyse à domicile (dialyse péritonéale, hémodialyse à domicile)
11. Du point de vue des patients qui se soumettent à une dialyse à domicile, est-il indispensable de pouvoir compter d'un ’aidant naturel’ (à savoir un parent, conjoint ou connaissance qui prodigue une aide quelconque lors du traitement)?
– Le cas échéant, faites la distinction entre les différents groupes de patients (nouveaux dialysés, dialysés de longue date, jeunes, personnes âgées, etc.)
Les aspects financiers
12. La dialyse est-elle un traitement onéreux pour le patient?
• Quels sont les coûts directs ? Quels sont les coûts directement liés à la dialyse et que le patient doit supporter
• Quels sont les coûts indirects que les patients peuvent être amenés à supporter (p.ex. l’achat de nouveau mobilier, adaptation d'une pièce, changement de profession…)?
– Faites une distinction selon les modes de dialyse
Divers
13. En votre qualité de Président d'une association, existe-t-il d'autres éléments importants pour les patients dialysés, et dont vous désirez nous faire part?

218 Chronic Dialysis in Belgium KCE Reports 124
Dutch version
Brussel, donderdag 3 september 2009
Subject: Vragenlijst dialyse - patiëntenperspectief
Geachte
Deze vragenlijst kadert in een studie van het Federaal Kenniscentrum voor de Gezondheidszorg (KCE). Het KCE tracht in deze studie de situatie van chronische dialyse in België in kaart te brengen. Een belangrijk deel van de studie gaat over het perspectief van de patiënten.
Het onderzoek focust op patiënten met chronische nierziekte die worden behandeld met één of andere vorm van dialyse. Alle vormen van chronische dialyse (hemodialyse in het ziekenhuis, hemodialyse in een satellietcentrum, hemodialyse thuis, nachthemodialyse en peritoneale dialyse) worden in aanmerking genomen. Wij willen meer inzicht verwerven in het perspectief van zowel de patiënten bij wie de dialysebehandeling pas is opgestart als van de patiënten die reeds lang een dialysebehandeling volgen. Ook het perspectief van patiënten die zijn overgestapt van één vorm naar een andere vorm van dialyse (bijvoorbeeld van peritoneale dialyse naar hemodialyse) interesseert ons.
Hieronder vindt u een lijst van vragen die wij graag willen bespreken. Deze vragenlijst wordt naar alle leden van de Raad van Bestuur van FENIER-BABIR gestuurd. Op de Raad van Bestuur van 17 september 2009 zullen jullie deze vragen gezamenlijk bespreken. U ontvangt deze vragenlijst zodat u zich al wat kan voorbereiden. Wij zouden het zeer op prijs stellen als u uw voorbereide antwoorden ook in geschreven vorm, maar anoniem, doorgeeft aan het KCE onderzoeksteam.
Belangrijk! Gelieve de vragen te beantwoorden als vertegenwoordiger van de leden van uw vereniging en niet louter vanuit uw persoonlijke beleving. We zouden het zeer op prijs stellen indien u uw leden contacteert om een genuanceerd antwoord te kunnen formuleren op onze vragen.
Wij zijn geïnteresseerd in het standpunt van verschillende groepen van patiënten, bijvoorbeeld:
• beginnende patiënten in chronische dialyse
• patiënten die reeds lang een dialysebehandeling volgen
• jonge en oudere patiënten
• alleenstaande patiënten, patiënten met een partner, patiënten met een gezin
• patiënten die zijn veranderd van dialysevorm en mensen die niet zijn veranderd doorheen de jaren
• …
Maak in uw antwoord waar het relevant is het onderscheid tussen verschillende groepen. Bijvoorbeeld: “voor jongere patiënten die buitenshuis werken …” of “voor alleenstaanden die peritoneale dialyse volgen …”

KCE Report 124 Chronic Dialysis in Belgium 219
Informatie over dialysevormen
1. Wordt de patiënt, vooraleer er wordt gestart met dialyse, geïnformeerd over het feit dat er verschillende vormen van dialyse bestaan?
• In welke vorm wordt de informatie gegeven: folder, mondeling, dvd, contact met andere patiënten op dialyse, contacten met patiëntenverenigingen…?
• Welke vorm(en) van informatie verkiezen de patiënten en waarom?
2. Ervaren patiënten de informatie die hen wordt geboden over de verschillende dialysevormen bij de start van de dialysebehandeling als voldoende?
3. Was, achteraf beschouwd, volgens de patiënten, de informatie over de dialysevorm die de patiënt heeft gekozen, voldoende en correct om een goed idee te verwerven over de impact of hun leven?
Keuze van dialysevorm
4. Krijgen patiënten, vooraleer ze starten met dialyse, de mogelijkheid om te kiezen tussen verschillende vormen van dialyse?
Indien niet, wordt er dan uitgelegd waarom die keuze niet kan worden geboden?
5. Vinden patiënten dat zij voldoende tijd hebben om de informatie te verwerken, de voor- en nadelen af te wegen en vervolgens een bewuste keuze te maken?
6. Vinden patiënten dat ze degelijk begeleid worden door de zorgprofessionals voor het maken van de keuze voor de vorm van dialyse?
7. Welke elementen bepalen uiteindelijk de keuze van patiënten voor een bepaalde vorm van dialyse (bijv. meer flexibiliteit, meer zekerheid dat complicaties snel worden verholpen, de arts is het meest bepalend,…)
- maak zo nodig een onderscheid tussen verschillende groepen van patiënten (naar leeftijd, professionele activiteiten, familiesituatie, …)
8. Wat zijn redenen die patiënten vaak aanhalen om te veranderen van dialysevorm? - Deze vraag moet worden gesteld aan patiënten die van één dialysevorm naar een andere zijn overgeschakeld
Voor- en nadelen van verschillende dialysevormen
9. Wat zijn respectievelijk de voor- en nadelen van de verschillende vormen van dialyse voor de patiënten (bijv. elementen die wij zelf zijn tegengekomen zijn onder andere het gevoel van veiligheid door toezicht, de flexibiliteit, de tijdsinvestering, mobiliteit, … andere factoren zouden kunnen zijn: de belasting voor het gezin, de competentie van de verpleging, de kwaliteit van zorg, onderhouden sociaal leven, …
- maak bij deze vraag een onderscheid tussen verschillende groepen van patiënten (naar type dialyse, leeftijdcategorie, professionele activiteiten, familiesituatie, …).
- maak ook een reflectie over de verschillende fases en gebeurtenissen in het langdurig verloop van de dialyse (bijv. bij opstart van de behandeling, bij complicaties of onverwachte gebeurtenissen …)
Gelieve aan te geven op welke bronnen u zich baseert bij het beantwoorden van deze vraag (bijv. individuele getuigenissen op een forum, rechtstreekse contactname met patiënten uit de vereniging, …). U hoeft niet voor elk type dialyse een antwoord te formuleren indien u geen bronnen ter beschikking hebt.
10. Wat is de volgorde van belangrijkheid van elk van deze elementen voor de verschillende types van patiënten?
Ondersteuning bij thuisdialyse (peritoneale dialyse, thuis-hemodialyse)
11. Is het volgens patiënten die thuisdialyse krijgen noodzakelijk een mantelzorger te hebben (een mantelzorger is bijv. een familielid, partner, kennis, die op één of andere manier helpt bij de behandeling)?

220 Chronic Dialysis in Belgium KCE Reports 124
–maak zo nodig het onderscheid tussen verschillende groepen patiënten (beginnende patiënten, patiënten die reeds lang een dialysebehandeling krijgen, jongeren, ouderen,…)
Financiële aspecten
12. Is dialyse een dure behandeling voor de patiënten?
• Wat zijn de directe kosten? Welke kosten die direct verbonden zijn aan de dialyse moeten patiënten zelf betalen?
• Zijn er indirecte kosten (bijvoorbeeld aankoop van nieuwe meubels, aanpassing kamers, veranderen van werk …) die patiënten moeten dragen?
– maak een onderscheid tussen de verschillende vormen van dialyse
Andere …
13. Zijn er andere zaken waarvan u uit uw functie als voorzitter van de vereniging weet dat ze belangrijk zijn voor de patiënten die een dialysebehandeling volgen die u ons wenst mee te delen?
KCE Report 124 Chronic Dialysis in Belgium 221
10 REFERENCES 1. Elseviers MM, Verpooten GA, De Broe ME, De Backer GG. Interpretation of creatinine
clearance. Lancet. 1987;1(8530):457.
2. Greenberg A, Cheung A, Coffman T, Falk R, Jennette J. Primer On Kidney Diseases. National Kidney Foundation, editor.: W B Saunders Co; 2005.
3. Wolfe RA, Ashby VB, Milford EL, Ojo AO, Ettenger RE, Agodoa LY, et al. Comparison of mortality in all patients on dialysis, patients on dialysis awaiting transplantation, and recipients of a first cadaveric transplant. N.Engl.J.Med. 1999;341(23):1725-30.
4. Levey AS, Atkins R, Coresh J, Cohen EP, Collins AJ, Eckardt KU, et al. Chronic kidney disease as a global public health problem: approaches and initiatives - a position statement from Kidney Disease Improving Global Outcomes. Kidney Int. 2007;72(3):247-59.
5. Eckardt KU, Berns JS, Rocco MV, Kasiske BL. Definition and classification of CKD: the debate should be about patient prognosis--a position statement from KDOQI and KDIGO. Am J Kidney Dis. 2009;53(6):915-20.
6. Murtagh FEM, Marsh JE, Donohoe P, Ekbal NJ, Sheerin NS, Harris FE. Dialysis or not? A comparative survival study of patients over 75 years with chronic kidney disease stage 5. Nephrol Dial Transplant. 2007;22(7):1955-62.
7. Navaneethan SD, Viswanathan G, Strippoli GFM. Choice of extracorporeal dialysis modality: Can it be evidence based? Minerva Urol. Nefrol. 2007;59(3):261-7.
8. Varela Lema L, Ruano Ravina A. Effectiveness and safety of different hemodialysis modalities: a review. Journal of Nephrology. 2007;20(5):525-42.
9. Mowatt G, Vale L, Perez J, Wyness L, Fraser C, Macleod A, et al. Systematic review of the effectiveness and cost-effectiveness, and economic evaluation, of home versus hospital or satellite unit haemodialysis for people with end-stage renal failure. Health Technol.Assess. 2003;7(2):1-174.
10. Rabindranath KS, Adams J, Ali TZ, MacLeod AM, Vale L, Cody J, et al. Continuous ambulatory peritoneal dialysis versus automated peritoneal dialysis for end-stage renal disease. Cochrane Database Syst Rev. 2007(2):CD006515.
11. Vale L, Cody J, Wallace S, Daly C, Campbell M, Grant A, et al. Continuous ambulatory peritoneal dialysis (CAPD) versus hospital or home haemodialysis for end-stage renal disease in adults. Cochrane Database Syst Rev. 2004(4):CD003963.
12. Peeters P, Rublee D, Just PM, Joseph A. Analysis and interpretation of cost data in dialysis: review of Western European literature (Brief record). Health Policy. 2000;54:209-27.
13. Kirby L, Vale L. Dialysis for end-stage renal disease. Determining a cost-effective approach. Int.J.Technol.Assess.Health Care. 2001;17(2):181-9.
14. Winkelmayer WC, Weinstein MC, Mittleman MA, Glynn RJ, Pliskin JS. Health economic evaluations: the special case of end-stage renal disease treatment. Med.Decis.Making. 2002;22(5):417-30.
15. Just PM, Riella MC, Tschosik EA, Noe LL, Bhattacharyya SK, de Charro F. Economic evaluations of dialysis treatment modalities. Health Policy. 2008;86(2-3):163-80.
16. Agar JW, Knight RJ, Simmonds RE, Boddington JM, Waldron CM, Somerville CA. Nocturnal haemodialysis: an Australian cost comparison with conventional satellite haemodialysis. Nephrology.(Carlton.). 2005;10(6):557-70.
17. Benain JP, Faller B, Briat C, Jacquelinet C, Brami M, Aoustin M, et al. Cost of dialysis in France. Nephrologie et Therapeutique. 2007;3(3):96-106.
18. Kroeker A, Clark WF, Heidenheim AP, Kuenzig L, Leitch R, Meyette M, et al. An operating cost comparison between conventional and home quotidian hemodialysis. American Journal of Kidney Diseases. 2003;42(1 Suppl):49-55.
19. Lee H, Manns B, Taub K, Ghali WA, Dean S, Johnson D, et al. Cost analysis of ongoing care of patients with end-stage renal disease: the impact of dialysis modality and dialysis access. American Journal of Kidney Diseases. 2002;40(3):611-22.
20. McFarlane PA, Pierratos A, Redelmeier DA. Cost savings of home nocturnal versus conventional in-center hemodialysis. Kidney International. 2002;62(6):2216-22.

222 Chronic Dialysis in Belgium KCE Reports 124
21. Mohr PE, Neumann PJ, Franco SJ, Marainen J, Lockridge R, Ting G. The case for daily dialysis: its impact on costs and quality of life. American Journal of Kidney Diseases. 2001;37(4):777-89.
22. Gonzalez-Perez JG, Vale L, Stearns SC, Wordsworth S. Hemodialysis for end-stage renal disease: a cost-effectiveness analysis of treatment-options. Int.J.Technol.Assess.Health Care. 2005;21(1):32-9.
23. Kontodimopoulos N, Niakas D. An estimate of lifelong costs and QALYs in renal replacement therapy based on patients' life expectancy. Health Policy. 2008:85-96.
24. Malmstrom RK, Roine RP, Heikkila A, Rasanen P, Sintonen H, Muroma-Karttunen R, et al. Cost analysis and health-related quality of life of home and self-care satellite haemodialysis. Nephrology Dialysis Transplantation. 2008;23(6):1990-6.
25. McFarlane PA, Bayoumi AM, Pierratos A, Redelmeier DA. The quality of life and cost utility of home nocturnal and conventional in-center hemodialysis. Kidney International. 2003;64(3):1004-11.
26. McFarlane PA, Bayoumi AM, Pierratos A, Redelmeier DA. The impact of home nocturnal hemodialysis on end-stage renal disease therapies: a decision analysis. Kidney International. 2006;69(5):798-805.
27. Salonen T, Reina T, Oksa H, Rissanen P, Pasternack A. Alternative strategies to evaluate the cost-effectiveness of peritoneal dialysis and hemodialysis. International Urology and Nephrology. 2007;39(1):289-98.
28. Sennfalt K, Magnusson M, Carlsson P. Comparison of hemodialysis and peritoneal dialysis - A cost-utility analysis. Peritoneal Dialysis International. 2002;22(1):39-47.
29. Teerawattananon Y, Mugford M, Tangcharoensathien V. Economic evaluation of palliative management versus peritoneal dialysis and hemodialysis for end-stage renal disease: evidence for coverage decisions in Thailand. Value.Health. 2007;10(1):61-72.
30. Mode of dialysis at initiation. The CARI (Caring for Autstralians with Renal Impairment). 2005. CARI Guidelines Available from: http://www.cari.org.au/DIALYSIS_accept_published/mode_of_dialysis_at_initiation_Aug_2005.pdf
31. Haute Authorité de Santé. HAS. Recommandations professionnelles. Indications et non-indications de la dialyse péritonéale chronique chez l’adulte. Octobre 2008 : .
32. Durand PY, Rusterholz T, Supreme Healthcare Authority of F. French 2008 guidelines on peritoneal dialysis: indications and non-indications. Nephrol Ther. 2009;5 Suppl 4:S281-5.
33. Mowatt G, Vale L, MacLeod A. Systematic review of the effectiveness of home versus hospital or satellite unit hemodialysis for people with end-stage renal failure. Int J Technol Assess Health Care. 2004;20(3):258-68.
34. Price JD, Ashby KM, Reeve CE. Results of 12 years' treatment of chronic renal failure by dialysis and transplantation. Can Med Assoc J. 1978;118(3):263-6.
35. Rubin J, Hsu H, Bower J. Survival on dialysis therapy: one center's experience. Am J Med Sci. 1989;297(2):80-90.
36. Arkouche W, Traeger J, Delawari E, Sibai-Galland R, Abdullah E, Galland R, et al. Twenty-five years of experience with out-center hemodialysis. Kidney International. 1999;56(6):2269-75.
37. Bremer BA, McCauley CR, Wrona RM, Johnson JP. Quality of life in end-stage renal disease: a reexamination. American Journal of Kidney Diseases. 1989;13(3):200-9.
38. Rabindranath KS, Adams J, Ali TZ, Daly C, Vale L, Macleod AM. Automated vs continuous ambulatory peritoneal dialysis: a systematic review of randomized controlled trials. Nephrol Dial Transplant. 2007;22(10):2991-8.
39. de Fijter CW, Oe LP, Nauta JJ, van der Meulen J, Verbrugh HA, Verhoef J, et al. Clinical efficacy and morbidity associated with continuous cyclic compared with continuous ambulatory peritoneal dialysis. Ann Intern Med. 1994;120(4):264-71.
40. Korevaar JC, Boeschoten EW, Dekker FW, Krediet RT. What have we learned from NECOSAD? Practical implications for peritoneal dialysis patients. Perit Dial Int. 2007;27(1):11-5.
41. Korevaar JC, Feith GW, Dekker FW, van Manen JG, Boeschoten EW, Bossuyt PM, et al. Effect of starting with hemodialysis compared with peritoneal dialysis in patients new on dialysis treatment: a randomized controlled trial. Kidney International. 2003;64(6):2222-8.

KCE Report 124 Chronic Dialysis in Belgium 223
42. Vonesh EF, Snyder JJ, Foley RN, Collins AJ. The differential impact of risk factors on mortality in hemodialysis and peritoneal dialysis. Kidney Int. 2004;66(6):2389-401.
43. Stack AG, Molony DA, Rahman NS, Dosekun A, Murthy B. Impact of dialysis modality on survival of new ESRD patients with congestive heart failure in the United States. Kidney Int. 2003;64(3):1071-9.
44. Jaar BG, Coresh J, Plantinga LC, Fink NE, Klag MJ, Levey AS, et al. Comparing the risk for death with peritoneal dialysis and hemodialysis in a national cohort of patients with chronic kidney disease. Ann Intern Med. 2005;143(3):174-83.
45. Ganesh SK, Hulbert-Shearon T, Port FK, Eagle K, Stack AG. Mortality differences by dialysis modality among incident ESRD patients with and without coronary artery disease. J Am Soc Nephrol. 2003;14(2):415-24.
46. Termorshuizen F, Korevaar JC, Dekker FW, Van Manen JG, Boeschoten EW, Krediet RT, et al. Hemodialysis and peritoneal dialysis: comparison of adjusted mortality rates according to the duration of dialysis: analysis of The Netherlands Cooperative Study on the Adequacy of Dialysis 2. J Am Soc Nephrol. 2003;14(11):2851-60.
47. Inrig JK, Oddone EZ, Hasselblad V, Gillespie B, Patel UD, Reddan D, et al. Association of intradialytic blood pressure changes with hospitalization and mortality rates in prevalent ESRD patients. Kidney International. 2007;71(5):454-61.
48. Murphy SW, Foley RN, Barrett BJ, Kent GM, Morgan J, Barre P, et al. Comparative mortality of hemodialysis and peritoneal dialysis in Canada. Kidney Int. 2000;57(4):1720-6.
49. Heaf JG, Lokkegaard H, Madsen M. Initial survival advantage of peritoneal dialysis relative to haemodialysis. Nephrol Dial Transplant. 2002;17(1):112-7.
50. Liem YS, Wong JB, Hunink MGM, de Charro FT, Winkelmayer WC. Comparison of hemodialysis and peritoneal dialysis survival in The Netherlands. Kidney Int. 2007;71(2):153-8.
51. SF-36 Organisation. Available from: http://www.sf-36.org/
52. Lopes AA, Bragg-Gresham JL, Goodkin DA, Fukuhara S, Mapes DL, Young EW, et al. Factors associated with health-related quality of life among hemodialysis patients in the DOPPS. Qual Life Res. 2007;16(4):545-57.
53. Kimmel PL, Cohen SD, Weisbord SD. Quality of life in patients with end-stage renal disease treated with hemodialysis: survival is not enough! J Nephrol. 2008;21 Suppl 13:S54-8.
54. Liem YS, Bosch JL, Arends LR, Heijenbrok-Kal MH, Hunink MGM. Quality of life assessed with the Medical Outcomes Study Short Form 36-Item Health Survey of patients on renal replacement therapy: a systematic review and meta-analysis. Value Health. 2007;10(5):390-7.
55. Liem YS, Bosch JL, Myriam Hunink MG. Preference-based quality of life of patients on renal replacement therapy: A systematic review and meta-analysis. Value Health. 2008;11(4):733-41.
56. Lee A, Gudex C, Povlsen JV, Bonnevie B, Nielsen CP. Patients' views regarding choice of dialysis modality. Nephrol Dial Transplant. 2008;23(12):3953-9.
57. Tamura M, Covinsky K, Chertow G, Yaffe K, Landefeld S, McCulloch C. Functional Status of Elderly Adults before and after Initiation of Dialysis. N.Engl.J.Med. 2009;361(16):1539-47.
58. Shih YC, Guo A, Just PM, Mujais S. Impact of initial dialysis modality and modality switches on Medicare expenditures of end-stage renal disease patients. Kidney International. 2005;68(1):319-29.
59. Salonen T, Reina T, Oksa H, Sintonen H, Pasternack A. Cost analysis of renal replacement therapies in Finland. American Journal of Kidney Diseases. 2003;42(6):1228-38.
60. Macleod A, Grant A, Donaldson C, Khan I, Campbell M, Daly C, et al. Effectiveness and efficiency of methods of dialysis therapy for end-stage renal disease: systematic reviews (Structured abstract). Health Technology Assessment. 1998;2:1-166.
61. National Kidney Foundation KDOQI Guidelines. Available from: http://www.kidney.org/Professionals/Kdoqi/guidelines_ckd/toc.htm
62. European Best Practice Guidelines. Available from: http://www.ndt-educational.org/guidelines.asp
63. Jager KJ, Korevaar JC, Dekker FW, Krediet RT, Boeschoten EW, Netherlands Cooperative Study on the Adequacy of Dialysis Study G. The effect of contraindications and patient

224 Chronic Dialysis in Belgium KCE Reports 124
preference on dialysis modality selection in ESRD patients in The Netherlandsf. Am J Kidney Dis. 2004;43(5):891-9.
64. Mehrotra R, Kermah D, Fried L, Kalantar-Zadeh K, Khawar O, Norris K, et al. Chronic peritoneal dialysis in the United States: declining utilization despite improving outcomes. J Am Soc Nephrol. 2007;18(10):2781-8.
65. Viglino G, Neri L, Alloatti S, Cabiddu G, Cocchi R, Limido A, et al. Analysis of the factors conditioning the diffusion of peritoneal dialysis in Italy. Nephrol Dial Transplant. 2007;22(12):3601-5.
66. Murray MA, Brunier G, Chung JO, Craig LA, Mills C, Thomas A, et al. A systematic review of factors influencing decision-making in adults living with chronic kidney disease. Patient Educ. Couns. 2009;76(2):149-58.
67. Devins GM, Mendelssohn DC, Barre PE, Binik YM. Predialysis psychoeducational intervention and coping styles influence time to dialysis in chronic kidney disease. Am J Kidney Dis. 2003;42(4):693-703.
68. Manns BJ, Taub K, Vanderstraeten C, Jones H, Mills C, Visser M, et al. The impact of education on chronic kidney disease patients' plans to initiate dialysis with self-care dialysis: a randomized trial. Kidney Int. 2005;68(4):1777-83.
69. Goovaerts T, Jadoul M, Goffin E. Influence of a pre-dialysis education programme (PDEP) on the mode of renal replacement therapy. Nephrol Dial Transplant. 2005;20(9):1842-7.
70. Lameire N, Van Biesen W. The pattern of referral of patients with end-stage renal disease to the nephrologist--a European survey. Nephrol Dial Transplant. 1999;14 Suppl 6:16-23.
71. ERA-EDTA Registry. ERA-EDTA Registry 2007 Annual Report. Amsterdam, The Netherlands: Academic Medical Centre, Department of Medical Informatics; 2009.
72. Eurotransplant International Foundation. Annual Report 2007. Leiden, The Netherlands: Eurotransplant; 2008.
73. Eurotransplant International Foundation. Annual Report 2008. Leiden, The Netherlands: Eurotransplant; 2009.
74. Verstraete S, Debaillie R, Geys L. Dialyse in de thuiszorg. Wit-Gele Kruis Vlaanderen; 2006. Nota OW nr. 2006/36
75. Corens D. Health system review: Belgium. 2007. Health Systems in Transition
76. Dor A, Pauly MV, Eichleay MA, Held PJ. End-stage renal disease and economic incentives: the International Study of Health Care Organization and Financing (ISHCOF). Int J Health Care Finance Econ. 2007;7(2-3):73-111.
77. Wikstrom B, Fored M, Eichleay MA, Jacobson SH. The financing and organization of medical care for patients with end-stage renal disease in Sweden. Int J Health Care Finance Econ. 2007;7(4):269-81.
78. Kleophas W, Reichel H. International study of health care organization and financing: development of renal replacement therapy in Germany. Int J Health Care Finance Econ. 2007;7(2-3):185-200.
79. Pontoriero G, Pozzoni P, Vecchio LD, Locatelli F. International Study of Health Care Organization and Financing for renal replacement therapy in Italy: an evolving reality. Int J Health Care Finance Econ. 2007;7(2-3):201-15.
80. Hirth RA, Chernew ME, Turenne MN, Pauly MV, Orzol SM, Held PJ. Chronic illness, treatment choice and workforce participation. Int J Health Care Finance Econ. 2003;3(3):167-81.
81. Manns BJ, Mendelssohn DC, Taub KJ. The economics of end-stage renal disease care in Canada: incentives and impact on delivery of care. Int J Health Care Finance Econ. 2007;7(2-3):149-69.
82. Nicholson T, Roderick P. International Study of Health Care Organization and Financing of renal services in England and Wales. Int J Health Care Finance Econ. 2007;7(4):283-99.
83. Durand-Zaleski I, Combe C, Lang P. International Study of Health Care Organization and Financing for end-stage renal disease in France. Int J Health Care Finance Econ. 2007;7(2-3):171-83.
84. Ashton T, Marshall MR. The organization and financing of dialysis and kidney transplantation services in New Zealand. Int J Health Care Finance Econ. 2007;7(4):233-52.

KCE Report 124 Chronic Dialysis in Belgium 225
85. Luno J. The organization and financing of end-stage renal disease in Spain. Int J Health Care Finance Econ. 2007;7(4):253-67.
86. Fukuhara S, Yamazaki C, Hayashino Y, Higashi T, Eichleay MA, Akiba T, et al. The organization and financing of end-stage renal disease treatment in Japan. Int J Health Care Finance Econ. 2007;7(2-3):217-31.
87. Hirth RA. The organization and financing of kidney dialysis and transplant care in the United States of America. Int J Health Care Finance Econ. 2007;7(4):301-18.
88. Harris A. The organization and funding of the treatment of end-stage renal disease in Australia. Int J Health Care Finance Econ. 2007;7(2-3):113-32.
89. Van Biesen W, Lameire N, Peeters P, Vanholder R. Belgium's mixed private/public health care system and its impact on the cost of end-stage renal disease. Int J Health Care Finance Econ. 2007;7(2-3):133-48.
90. Rabindranath KS, Strippoli GF, Daly C, Roderick PJ, Wallace S, MacLeod AM. Haemodiafiltration, haemofiltration and haemodialysis for end-stage kidney disease. Cochrane Database Syst Rev. 2006(4):CD006258.
91. Kaitelidou D, Ziroyanis PN, Maniadakis N, Liaropoulos LL. Economic evaluation of hemodialysis: implications for technology assessment in Greece. Int.J.Technol.Assess.Health Care. 2005;21(1):40-6.
92. Ploth DW, Shepp PH, Counts C, Hutchison F. Prospective analysis of global costs for maintenance of patients with ESRD. American Journal of Kidney Diseases. 2003;42(1):12-21.
93. Soroka SD, Kiberd BA, Jacobs P. The marginal cost of satellite versus in-center hemodialysis. Hemodial.Int. 2005;9(2):196-201.
94. Valderrabano F, Berthoux FC, Jones EH, Mehls O. Report on management of renal failure in Europe, XXV, 1994 end stage renal disease and dialysis report. The EDTA-ERA Registry. European Dialysis and Transplant Association-European Renal Association. Nephrology Dialysis Transplantation. 1996;11 Suppl 1:2-21.
95. Westlie L, Umen A, Nestrud S, Kjellstrand CM. Mortality, morbidity, and life satisfaction in the very old dialysis patient. Trans.Am.Soc.Artif.Intern.Organs. 1984;30:21-30.
96. Mackenzie P, Mactier RA. Home haemodialysis in the 1990s. Nephrology Dialysis Transplantation. 1998;13(8):1944-8.
97. UK Renal Registry. 2001. Available from: http://www.renalreg.com
98. Hellerstedt WL, Johnson WJ, Ascher N, Kjellstrand CM, Knutson R, Shapiro FL, et al. Survival rates of 2,728 patients with end-stage renal disease. Mayo Clin.Proc. 1984;59(11):776-83.
99. de Wit GA, Ramsteijn PG, de Charro FT. Economic evaluation of end stage renal disease treatment (Structured abstract). Health Policy. 1998;44:215-32.
100. Churchill DN, Khana R. The effect of treatment modality on the quality. of life for patients with end-stage renal disease. In: Advances in CAPD. Toronto: Peritoneal Dialysis Bulletin Inc; 1988. p. 63-5.
101. Hooi LS, Lim TO, Goh A, Wong HS, Tan CC, Ahmad G, et al. Economic evaluation of centre haemodialysis and continuous ambulatory peritoneal dialysis in Ministry of Health hospitals, Malaysia. Nephrology.(Carlton.). 2005;10(1):25-32.
102. Abridged life tables 1981-1996. Malaysia, Kuala Lumpur: Department of Statistics; 1997.
103. British national formulary. London: British Medical Association and Royal Pharmaceutical Society of Great Britain; 1996. (32nd ed.)
104. Burton PR, Walls J. A selection adjusted comparison of hospitalization on continuous ambulatory peritoneal dialysis and haemodialysis. J.Clin.Epidemiol. 1989;42(6):531-9.
105. Charytan C, Spinowitz BS, Galler M. A comparative study of continuous ambulatory peritoneal dialysis and center hemodialysis. Efficacy, complications, and outcome in the treatment of end-stage renal disease. Arch.Intern.Med. 1986;146(6):1138-43.
106. Gokal R, Jakubowski C, King J, Hunt L, Bogle S, Baillod R, et al. Outcome in patients on continuous ambulatory peritoneal dialysis and haemodialysis: 4-year analysis of a prospective multicentre study. Lancet. 1987;2(8568):1105-9.
107. Laupacis A, Keown P, Pus N, Krueger H, Ferguson B, Wong C, et al. A study of the quality of life and cost-utility of renal transplantation. Kidney International. 1996;50(1):235-42.

226 Chronic Dialysis in Belgium KCE Reports 124
108. Redelmeier DA, Guyatt GH, Goldstein RS. Assessing the minimal important difference in symptoms: a comparison of two techniques. J.Clin.Epidemiol. 1996;49(11):1215-9.
109. Robers S. Cost of daily hemodialysis. ASAIO J. 2001;47(5):459-61.
110. Canadian organ replacement registry (CORR): 2001 annual report. Ottawa, ON, Canada: Canadian Institute for Health Information; 2001.
111. Coyte PC, Young LG, Tipper BL, Mitchell VM, Stoffman PR, Willumsen J, et al. An economic evaluation of hospital-based hemodialysis and home-based peritoneal dialysis for pediatric patients. American Journal of Kidney Diseases. 1996;27(4):557-65.
112. Levin LA, Jonsson B. Cost-effectiveness of thrombolysis--a randomized study of intravenous rt-PA in suspected myocardial infarction. Eur.Heart J. 1992;13(1):2-8.
113. Tisayathikom K, Patcharanalumol W, Mukem S. Cost and efficiency of public and private hemodialysis centers in 2001. Nonthaburi: International Health Policy Program; 2003.
114. Sriwajana P. Comparative survival of patients with chronic renal failure on hemodialysis and continuous ambulatory peritoneal dialysis. Pramongkutklao Hospital. Salaya: Mahidol; 1997.
115. Homvijitkul J. Health expenditure of patients with end stage renal disease on hemodialysis and continuous ambulatory peritoneal dialysis. Salaya: Mahidol; 1999.
116. Van Biesen W, Vanholder R, Debacquer D, De BG, Lameire N. Comparison of survival on CAPD and haemodialysis: statistical pitfalls. Nephrology Dialysis Transplantation. 2000;15(3):307-11.
117. Tangcharoensathien V, Teerawattananon Y, Kasamesup V, Mukem S. The policy analysis of renal replacement therapy for end stage renal disease patients in basic care package of universal health insurance in Thailand. Thai Med Council Bull. 2001;30:215-26.
118. Wongsiripisaan A, Dandecha P, Sangthawaan P. Peritoneal dialysis using double bags and Y-set: experience from Songkhlanakarin Hospital. Journal of Thai Kidney Foundation. 2003;9:241-50.
119. Maharatanavirosn W. Quality of life of patients with end stage renal disease on hemodialysis and continuous ambulatory peritoneal dialysis. Salaya: Mahidol; 1999.
120. Pukpobsuk N. Determination of quality of life in end-stage renal disease patients on hemodialysis and continuous ambulatory peritoneal dialysis. Salaya: Mahidol; 2001.
121. Kusoom V, Lapjaroengwong N. Quality of life of patients with end-stage renal disease and receiving renal replacement therapy. Vajira Medical Journal. 2004;48:107-15.

This page is left intentionally blank.

Legal depot : D/2010/10.273/13

KCE reports
33 Effects and costs of pneumococcal conjugate vaccination of Belgian children. D/2006/10.273/54. 34 Trastuzumab in Early Stage Breast Cancer. D/2006/10.273/25. 36 Pharmacological and surgical treatment of obesity. Residential care for severely obese children
in Belgium. D/2006/10.273/30. 37 Magnetic Resonance Imaging. D/2006/10.273/34. 38 Cervical Cancer Screening and Human Papillomavirus (HPV) Testing D/2006/10.273/37. 40 Functional status of the patient: a potential tool for the reimbursement of physiotherapy in
Belgium? D/2006/10.273/53. 47 Medication use in rest and nursing homes in Belgium. D/2006/10.273/70. 48 Chronic low back pain. D/2006/10.273.71. 49 Antiviral agents in seasonal and pandemic influenza. Literature study and development of
practice guidelines. D/2006/10.273/67. 54 Cost-effectiveness analysis of rotavirus vaccination of Belgian infants D/2007/10.273/11. 59 Laboratory tests in general practice D/2007/10.273/26. 60 Pulmonary Function Tests in Adults D/2007/10.273/29. 64 HPV Vaccination for the Prevention of Cervical Cancer in Belgium: Health Technology
Assessment. D/2007/10.273/43. 65 Organisation and financing of genetic testing in Belgium. D/2007/10.273/46. 66. Health Technology Assessment: Drug-Eluting Stents in Belgium. D/2007/10.273/49. 70. Comparative study of hospital accreditation programs in Europe. D/2008/10.273/03 71. Guidance for the use of ophthalmic tests in clinical practice. D/200810.273/06. 72. Physician workforce supply in Belgium. Current situation and challenges. D/2008/10.273/09. 74 Hyperbaric Oxygen Therapy: a Rapid Assessment. D/2008/10.273/15. 76. Quality improvement in general practice in Belgium: status quo or quo vadis?
D/2008/10.273/20 82. 64-Slice computed tomography imaging of coronary arteries in patients suspected for coronary
artery disease. D/2008/10.273/42 83. International comparison of reimbursement principles and legal aspects of plastic surgery.
D/200810.273/45 87. Consumption of physiotherapy and physical and rehabilitation medicine in Belgium.
D/2008/10.273/56 90. Making general practice attractive: encouraging GP attraction and retention D/2008/10.273/66. 91 Hearing aids in Belgium: health technology assessment. D/2008/10.273/69. 92. Nosocomial Infections in Belgium, part I: national prevalence study. D/2008/10.273/72. 93. Detection of adverse events in administrative databases. D/2008/10.273/75. 95. Percutaneous heart valve implantation in congenital and degenerative valve disease. A rapid
Health Technology Assessment. D/2008/10.273/81 100. Threshold values for cost-effectiveness in health care. D/2008/10.273/96 102. Nosocomial Infections in Belgium: Part II, Impact on Mortality and Costs. D/2009/10.273/03 103 Mental health care reforms: evaluation research of ‘therapeutic projects’ - first intermediate
report. D/2009/10.273/06. 104. Robot-assisted surgery: health technology assessment. D/2009/10.273/09 108. Tiotropium in the Treatment of Chronic Obstructive Pulmonary Disease: Health Technology
Assessment. D/2009/10.273/20 109. The value of EEG and evoked potentials in clinical practice. D/2009/10.273/23 111. Pharmaceutical and non-pharmaceutical interventions for Alzheimer’s Disease, a rapid
assessment. D/2009/10.273/29 112. Policies for Orphan Diseases and Orphan Drugs. D/2009/10.273/32. 113. The volume of surgical interventions and its impact on the outcome: feasibility study based on
Belgian data 114. Endobronchial valves in the treatment of severe pulmonary emphysema. A rapid Health
Technology Assessment. D/2009/10.273/39 115. Organisation of palliative care in Belgium. D/2009/10.273/42 116. Interspinous implants and pedicle screws for dynamic stabilization of lumbar spine: Rapid
assessment. D/2009/10.273/46

117. Use of point-of care devices in patients with oral anticoagulation: a Health Technology Assessment. D/2009/10.273/49.
118. Advantages, disadvantages and feasibility of the introduction of ‘Pay for Quality’ programmes in Belgium. D/2009/10.273/52.
119. Non-specific neck pain: diagnosis and treatment. D/2009/10.273/56. 121. Feasibility study of the introduction of an all-inclusive case-based hospital financing system in
Belgium. D/2010/10.273/03 122. Financing of home nursing in Belgium. D/2010/10.273/07 123. Mental health care reforms: evaluation research of ‘therapeutic projects’ - second intermediate
report. D/2010/10.273/10 124. Organisation and financing of chronic dialysis in Belgium. D/2010/10.273/13 This list only includes those KCE reports for which a full English version is available. However, all KCE reports are available with a French or Dutch executive summary and often contain a scientific summary in English.

